


9307
Table of contents
 Loading...
User Manual
PUBLICATION FTEM-UM002A-EN-P – JANUARY 2014
INTEGRATED PRODUCTION & PERFORMANCE SUITE
Asset Management

FactoryTalk EnergyMetrix Software
Contact Rockwell Customer Support Telephone — 1.440.646.3434
Online Support — http://www.rockwellautomation.com/support/
Copyright Notice © 2014 Rockwell Automation Technologies, Inc. All rights reserved. Printed in USA.
This document and any accompanying Rockwell Software products are copyrighted by Rockwell
Automation Technologies, Inc. Any reproduction and/or distribution without prior written consent from
Rockwell Automation Technologies, Inc. is stri ctly prohibited. Please refer to the license agreement for
details.
Trademark Notices Allen-Bradley, ControlLogix, eProcedure, FactoryTalk, Rockwell Automation, Rockwell Software,
RSLinx, RSView, RSLinx Classic, RSLogix 5, RSLogix 500, RSLogix 5000, RSNetworx for
ControlNet, RSNetworx for DeviceNet, RSPower32, RSSql, RSView32, INTERCHANGE, PLC, PLC-2,
PLC-3, PLC-5, Data Highway Plus, DH+, ControlLogix, MicroLogix, PLC-5/20E, PLC-5/40E, PLC-5/
80E, SLC, and SLC 500 are trademarks of Rockwell Automation, Inc.
Other Trademarks Trademarks not belonging to Rockwell Automation are property of their respective companies.
Warranty This product is warranted in accordance with the product license. The product’s performance may be
affected by system configuration, the application being performed, operator control, maintenance, and
other related factors. Rockwell Automation is not responsible for these intervening factors. The
instructions in this document do not cover all the details or variations in the equipment, procedure, or
process described, nor do they provide directions for meeting every possible contingency during
installation, operation, or maintenance. This product’s implementation may vary among users.
This document is current as of the time of release of the product; however, the accompanying software
may have changed since the release. Rockwell Automation, Inc. reserves the right to change any
information contained in this document or the software at anytime without prior noti ce. It is your
responsibility to obtain the most current information available from Rockwell when installing or using
this product.
Publication Number: FTEM-UM002A-EN-P January, 2014
2

CONTENTS
Chapter 1 Overview . . . . . . . . . . . . . . . . . . . . . . . . . . . . . . . . . . . . . . . . . . . . . . 7
Features and Benefits . . . . . . . . . . . . . . . . . . . . . . . . . . . . . . . . . . . . . . 7
FactoryTalk EnergyMetrix Software Components . . . . . . . . . . . . . . . . . . . . 9
Chapter 2 FactoryTalk EnergyMetrix Web Interface Tour . . . . . . . . . . . . . . . . . . . 15
System Tab. . . . . . . . . . . . . . . . . . . . . . . . . . . . . . . . . . . . . . . . . . . . 16
Meters Tab . . . . . . . . . . . . . . . . . . . . . . . . . . . . . . . . . . . . . . . . . . . . 25
Reports Tab . . . . . . . . . . . . . . . . . . . . . . . . . . . . . . . . . . . . . . . . . . . 29
Custom Tab. . . . . . . . . . . . . . . . . . . . . . . . . . . . . . . . . . . . . . . . . . . . 31
Chapter 3 Installation. . . . . . . . . . . . . . . . . . . . . . . . . . . . . . . . . . . . . . . . . . . . 33
Contents of Installation DVD. . . . . . . . . . . . . . . . . . . . . . . . . . . . . . . . . 33
Client Requirements. . . . . . . . . . . . . . . . . . . . . . . . . . . . . . . . . . . . . . 33
Server Requirements . . . . . . . . . . . . . . . . . . . . . . . . . . . . . . . . . . . . . 33
Client Requirements. . . . . . . . . . . . . . . . . . . . . . . . . . . . . . . . . . . . . . 36
Installation (64-bit) . . . . . . . . . . . . . . . . . . . . . . . . . . . . . . . . . . . . . . 37
Installation (32-bit) . . . . . . . . . . . . . . . . . . . . . . . . . . . . . . . . . . . . . . 44
Activate FactoryTalk EnergyMetrix Software . . . . . . . . . . . . . . . . . . . . . . 47
Chapter 4 Set up Your System Architecture. . . . . . . . . . . . . . . . . . . . . . . . . . . . . 49
Set up a New Group or Domain . . . . . . . . . . . . . . . . . . . . . . . . . . . . . . . 50
Roles and Users . . . . . . . . . . . . . . . . . . . . . . . . . . . . . . . . . . . . . . . . . 53
Overview of Privileges. . . . . . . . . . . . . . . . . . . . . . . . . . . . . . . . . . . . . 57
Set up Devices. . . . . . . . . . . . . . . . . . . . . . . . . . . . . . . . . . . . . . . . . . 58
Set up a Meter. . . . . . . . . . . . . . . . . . . . . . . . . . . . . . . . . . . . . . . . . . 72
Set up a Meter Tag. . . . . . . . . . . . . . . . . . . . . . . . . . . . . . . . . . . . . . . 82
Automatic Data Repopulation. . . . . . . . . . . . . . . . . . . . . . . . . . . . . . . . 98
Chapter 5 Visualize Energy Usage . . . . . . . . . . . . . . . . . . . . . . . . . . . . . . . . . . 105
View a Trend Chart . . . . . . . . . . . . . . . . . . . . . . . . . . . . . . . . . . . . . 106
View a Calendar trend . . . . . . . . . . . . . . . . . . . . . . . . . . . . . . . . . . . 106
3

FactoryTalk EnergyMetrix Software
Set up a Report . . . . . . . . . . . . . . . . . . . . . . . . . . . . . . . . . . . . . . . . 107
Run Reports Automatically. . . . . . . . . . . . . . . . . . . . . . . . . . . . . . . . . 109
Set up a Billing Rate Schedule . . . . . . . . . . . . . . . . . . . . . . . . . . . . . . 112
Set-up Alarming. . . . . . . . . . . . . . . . . . . . . . . . . . . . . . . . . . . . . . . . 146
Chapter 6 How to Set up a Personalized Start Page . . . . . . . . . . . . . . . . . . . . . . 151
Selections. . . . . . . . . . . . . . . . . . . . . . . . . . . . . . . . . . . . . . . . . . . . 151
My Start Page Custom Pages Tab. . . . . . . . . . . . . . . . . . . . . . . . . . . . . 152
My Start Page Meters Tab . . . . . . . . . . . . . . . . . . . . . . . . . . . . . . . . . 153
My Start Page Reports Tab. . . . . . . . . . . . . . . . . . . . . . . . . . . . . . . . . 154
Chapter 7 RT (Real Time) . . . . . . . . . . . . . . . . . . . . . . . . . . . . . . . . . . . . . . . . 155
Client Requirements. . . . . . . . . . . . . . . . . . . . . . . . . . . . . . . . . . . . . 155
Overview of the RT User Interface. . . . . . . . . . . . . . . . . . . . . . . . . . . . 156
PM5000 Device Viewer . . . . . . . . . . . . . . . . . . . . . . . . . . . . . . . . . . . 156
PM5000 Device Configuration . . . . . . . . . . . . . . . . . . . . . . . . . . . . . . . 167
Chapter 8 ChartsPlus . . . . . . . . . . . . . . . . . . . . . . . . . . . . . . . . . . . . . . . . . . . 187
ChartsPlus . . . . . . . . . . . . . . . . . . . . . . . . . . . . . . . . . . . . . . . . . . . 187
Client Requirements. . . . . . . . . . . . . . . . . . . . . . . . . . . . . . . . . . . . . 188
Start ChartsPlus. . . . . . . . . . . . . . . . . . . . . . . . . . . . . . . . . . . . . . . . 188
Create a New Chart . . . . . . . . . . . . . . . . . . . . . . . . . . . . . . . . . . . . . 189
Set up a ChartsPlus Trend Chart . . . . . . . . . . . . . . . . . . . . . . . . . . . . . 189
Set up an Overlay Chart . . . . . . . . . . . . . . . . . . . . . . . . . . . . . . . . . . 191
Change Appearance of Charts. . . . . . . . . . . . . . . . . . . . . . . . . . . . . . . 193
How to use X-Y Charting and Targeting . . . . . . . . . . . . . . . . . . . . . . . . 198
Chapter 9 ReportsPlus . . . . . . . . . . . . . . . . . . . . . . . . . . . . . . . . . . . . . . . . . . 205
Efficiency Report . . . . . . . . . . . . . . . . . . . . . . . . . . . . . . . . . . . . . . . 205
Electrical Summary Report. . . . . . . . . . . . . . . . . . . . . . . . . . . . . . . . . 207
Load Factor Report. . . . . . . . . . . . . . . . . . . . . . . . . . . . . . . . . . . . . . 208
Power Factor Report. . . . . . . . . . . . . . . . . . . . . . . . . . . . . . . . . . . . . 210
Multi-purpose Reports. . . . . . . . . . . . . . . . . . . . . . . . . . . . . . . . . . . . 212
Create an MPR Object. . . . . . . . . . . . . . . . . . . . . . . . . . . . . . . . . . . . 217
Configure an MPR Object. . . . . . . . . . . . . . . . . . . . . . . . . . . . . . . . . . 218
Populate the MPR with Data. . . . . . . . . . . . . . . . . . . . . . . . . . . . . . . . 219
4

Contents
Configure the Report Object . . . . . . . . . . . . . . . . . . . . . . . . . . . . . . . 221
Add a Report Object to the MPR . . . . . . . . . . . . . . . . . . . . . . . . . . . . . 222
Run the MPR . . . . . . . . . . . . . . . . . . . . . . . . . . . . . . . . . . . . . . . . . . 224
Selecting Groups and Meters in the MPR. . . . . . . . . . . . . . . . . . . . . . . . 226
Use the MPR for Cost Allocation . . . . . . . . . . . . . . . . . . . . . . . . . . . . . 228
The MPR Object Model . . . . . . . . . . . . . . . . . . . . . . . . . . . . . . . . . . . 232
Sample MPR Scripts . . . . . . . . . . . . . . . . . . . . . . . . . . . . . . . . . . . . . 280
Appendix . . . . . . . . . . . . . . . . . . . . . . . . . . . . . . . . . . . . . . . . . . . . . . . . . . 285
How to Administer FactoryTalk EnergyMetrix Software . . . . . . . . . . . . . . 285
Configure Program Options . . . . . . . . . . . . . . . . . . . . . . . . . . . . . . . . 290
Release Notes . . . . . . . . . . . . . . . . . . . . . . . . . . . . . . . . . . . . . . . . . 293
RSLinx Classic Software on 64-bit Server Tips . . . . . . . . . . . . . . . . . . . . 294
Fiscal Calendars. . . . . . . . . . . . . . . . . . . . . . . . . . . . . . . . . . . . . . . . 300
Troubleshooting. . . . . . . . . . . . . . . . . . . . . . . . . . . . . . . . . . . . . . . . 303
Contacting Rockwell Automation. . . . . . . . . . . . . . . . . . . . . . . . . . . . . 320
More Information . . . . . . . . . . . . . . . . . . . . . . . . . . . . . . . . . . . . . . . 321
Glossary . . . . . . . . . . . . . . . . . . . . . . . . . . . . . . . . . . . . . . . . . . . . . . . . . . 323
Index . . . . . . . . . . . . . . . . . . . . . . . . . . . . . . . . . . . . . . . . . . . . . . . . . . 329
5

FactoryTalk EnergyMetrix Software
Notes:
6

Overview
Features and Benefits
C
HAPTER
1
FactoryTalk® EnergyMetrix softwear is a modular, scalable, web-enabled, client/server
energy information, and management application. It connects energy-related data sources
to a Microsoft SQL database and presents energy information in ways that enable you to
monitor and manage your energy use to maximize the value of your enterprise.
TM
FactoryTalk EnergyMetrix is built by using Microsoft.NET
technology, ensuring the
highest level of quality, reliability and compatibility now and in the future.
FactoryT alk EnergyMetrix is sophisticated web-enabled ener gy management software that
puts critical energy information at your desktop. The FactoryTalk EnergyMetrix Software
Suite combines data communication, client-server applications, and Microsoft’ s
advanced.NET web technology to provide you with a complete energy manageme nt
solution. FactoryTalk EnergyMetrix captures, analyzes, stores, and shares energy data
across your entire enterprise. Using a simple web browser, your energy information can
now be available on your company’s LAN or WAN, presenting you with the knowledge
necessary to optimize your energy consumption. The net result- improved productivity
and lower energy costs.
FactoryTalk EnergyMetrix software helps managers and engineers solve the ever
growing energy related challenges. With FactoryTalk EnergyMetrix software, you can do
the following:
Correlate energy costs to production costs
Provide accurate cost accounting based on consumption
Generate energy reports and charts for a process, a department, a facility or an
enterprise
Optimize energy procurement and negotiate better rates
Make decisions on electrical capacity
Avoid unscheduled shutdowns
Procure and analyze energy information with minimum capital investment
Provide energy data into FactoryTalk VantagePoint for integrating with other
enterprise data sources
7

FactoryTalk EnergyMetrix Software
FactoryTalk EnergyMetrix software helps you connect to metering points right from
your desktop PC.
Connect to Allen-Bradley power monitors and other devices through RSLinx Classic
Lite: RS232, RS-485, Ethernet, DeviceNet, RIO pass-thru (RSLinx Classic Lite is
included).
Connects to FactoryTalk Live Data server on an Ethernet network.
Connect to third party meters and controllers through OPC; more than ten meters
requires the FTEMOPC option.
RSLinx Classic (OEM, Pro or Gateway) OPC supports native Logix tag addressing.
FactoryTalk EnergyMetrix software provides easy and flexible configuration.
Configure Electricity, gas, water, and steam meters or any energy or production
related inputs.
Configure Manual Meters for manual data entry.
Configure user defined data sources such as PLC-5, SLC 500 or OPC servers.
Set up a meaningful system architecture with the ability to do the following:
Name devices
Name groups and domains
Manage access by users through security
Create sub-groups
Share meters among multiple groups for cost allocation
Set-up and change meter configuration values remotely.
Multi-level password protection and privileges.
FactoryTalk EnergyMetrix software is a powerful load profiling, cost allocation, and
billing analysis tool.
Log usage, cost and power quality data
V iew any parameter in real time
Create historical trend reports and charts
View historical trending of individual meters and groups and save tabular data for
further processing and analysis
Establish consumption baseline
Create custom rate plans by using the rate plan menu and line item scripting with user
defined time of use periods
Assign rate plans to meters or groups of meters
Import and export rate schedules in XML format
8

1 • Overview
Create and print daily or monthly cost and billing reports by:
Meter
Business group
Department
Site
Create energy budgets and forecasts
Compare and contrast alternative utility rates; do ‘what-if’ for other rate structures
Print and store all reports and charts
FactoryTalk EnergyMetrix software is a sophisticated power quality analysis tool
Overlay waveforms to correlate phase to phase relationships
Plot Transients, Surges, and Sags on ITI (CBEMA Curves)
Display Harmonics. THD, K-factor, Crest Factor, and Vector Diagrams
Generate Power Quality charts and reports
PowerQuality data is automatically logged in FactoryT alk Ener gyMetrix software and
then it clears the queue
FactoryTalk EnergyMetrix software generates alarms
Triggered by
System anomalies
Power quality event
User predefined conditions
Workstation alarms
E-mail alarms
FactoryTalk EnergyMetrix Software Components
This section describes the components of the software.
License Options
FactoryTalk EnergyMetrix software is a scalable, modular software application. Its
components and capabilities are determined by the licenses purchased and installed by the
user. Licenses are installed by means of FactoryTalk Activation.
The table below shows the component type and, if applicable, the number of meters
supported. There is no limit on the number of users. It is the customer's responsibility to
observe the requirements of software licenses.
The Manager license is required for use of the software, and includes 10 meters which can
be any combination of RSLinx software and 3rd-party OPC meters. Additional meter
licenses can be purchased in 10-, 50, 100- and 500- meter sets. The FTEMOPC 3rd-party
OPC option enables 3rd-party OPC connectivity to all licensed meters.
9

FactoryTalk EnergyMetrix Software
If you are upgrading from an existing installation of RSEnergyMetrix software, your
existing licenses are supported, including existing meter counts.
FactoryTalk EnergyMetrix software only supports FactoryTalk Activation. If you plan
to upgrade from an installation of RSEnergyMetrix that uses EVRSI Master Disk
activation, please contact Rockwell Automation customer service to convert to FT
Activation.
Component Type Maximum Meter Count
FTEM Manager, includes 10 RSLinx or OPC meters 10
FTEM10 10-meter option, RSLinx 10
FTEM50 50-meter option, RSLinx 50
FTEM100 100-meter option, RSLinx 100
FTEM500 500-meter option, RSLinx 500
FTEMOPC 3rd-party OPC client for all licensed meters N/A
FTEMRT Real Time option N/A
FTEMRPT ReportsPlus option N/A
FTEMCHT ChartsPlus option N/A
Microsoft SQL Server bundle - 1 client license option N/A
Microsoft SQL Server bundle - processor license option N/A
Contact your Rockwell Automation representative for information on the meter and option
packages listed above.
Manager
Manager is the core data logging and reporting engine. Use Manager to organize your
enterprise's energy architecture, connect to up to ten Allen-Bradley or 3rd party power
monitors and programmable controllers, log energy data and view energy information.
Manager can report your energy usage by department or cost center, display load and
demand profiles, and correlate energy costs per unit of manufacturing out put. It includes a
flexible energy rate schedule that enables you to replicate utility bills or generate internal
energy billing.
Microsoft Internet Explorer browser is used to access and configure Manager. FactoryTalk
EnergyMetrix Manager is a required component.
RT (RealTime)
Use FactoryTalk EnergyMetrix RT (RealTime) to configure Allen-Bradley power
monitors and display their real-time data and power quality information. RT is a Click
Once software application installed with FactoryTalk EnergyMetrix software that requires
a separate activation. Once activated, RT device configuration and device viewer links
become operational from device setup pages and the RT device viewer links becomes
operational meter pages.
10

1 • Overview
Use Microsoft Internet Explorer to interact with RT.
R T complements Manager's data logging, cost allocation, profiling and reporting functions
by allowing you to configure power monitors and to vi ew, print, and save data from power
monitors. With RT, you can:
Download and upload power monitor configurations and save the configurations to
the database
V iew and print all of the real-time parameters in power monitor
Manually capture oscillographs and view, print and save automatically captured
oscillographs
View, save, and print all of the data logs in the power monitor
ChartsPlus
ChartsPlus is an optional package that offers extensive custom charting capabilities.
ChartsPlus is a Microsoft ClickOnce application that downloads and runs on the client
computer. Its look and feel is that of a traditional Windows application rather than a web
application. ChartsPlus is included in FactoryTalk EnergyMetrix software and requires a
separate activation.
ChartsPlus provides you with the ability to create customized graphical views of your
energy data. Some of the possibilities include:
Enhanced Trend
Plots up to 8 variables with a lot of flexibility. Different time ranges can be selected for
each variable and you can select various summary methods for each variable (for example,
you can plot the average Monday for one variable vs. a specific Monday for the same
variable or another variable). Also, the chart control itself has many built-in functions
such as zoom, scroll, print, export, and user customization.
X-Y Trend
Plots one dependent variable against up to 3 independent variables, plots a linear least
squares regression line along with targeting and CUSUM analysis.
Enhanced Calendar Trend
Same as standard Calendar Trend but can overlay different months and multiple variables.
Load Factor Chart
Plots a trend of load factor over a one-month period as well as daily min, max, and average
demand.
11
FactoryTalk EnergyMetrix Software
Overlay Chart
Graphically displays a tag value with user-definable overlays.
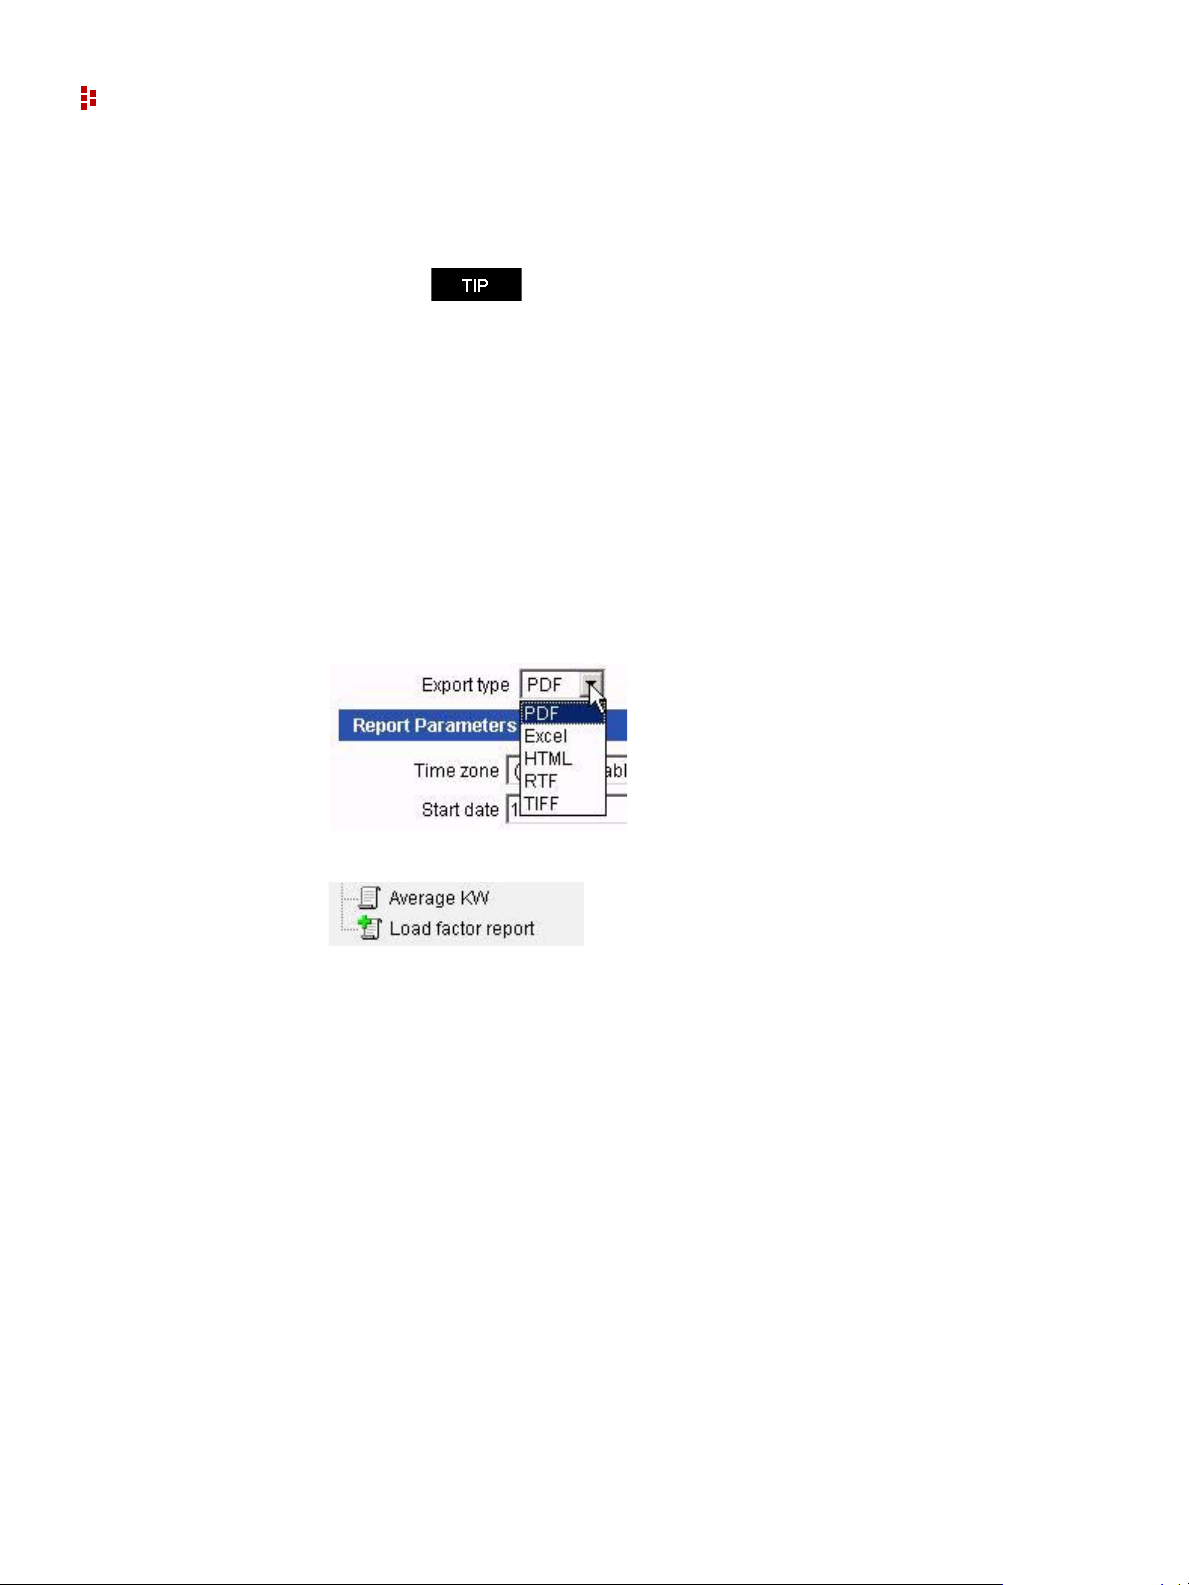
ReportsPlus
ReportsPlus provides you a package of enhanced reports in addition to the standard reports
included in Manager.
ReportsPlus reports are set up and viewed in the same way as standard Manager reports
and can be configured to automatically run on a schedule and optionally send the report
output to one or more email addresses.
ReportsPlus reports can be identified by their distinctive icon in the report list. You can
choose the report output type among PDF (the default), Microsoft Excel, HTML, Rich
Text Format (RTF), or Tagged Image File Format (TIFF).
ChartsPlus is best viewed with a Windows appearance scheme
with standard sized fonts. Windows appearance schemes wi th
large or extra large fonts may distort the appearance of
ChartsPlus.
12
The additional reports included in ReportsPlus include:
Multi-purpose Report
The Multi-purpose Report (MPR) supports a free-form type of report output that is driven
by script code stored in a Multi-Purpose Report Script.
Efficiency Report
The purpose of this report is to give you information on the ‘energy efficiency’ of part or
all of your process, plant or enterprise. You will be able to define an efficiency equation
and then execute the equation over a period of time and a group of meters. Examples of
how this report can be used are:
Calculating efficiency of a boiler system based on BTU of gas consumed versus steam
produced
Calculating production efficiency of a batch manufacturing line by calculating tons of
product versus energy consumed

1 • Overview
The efficiency report will calculate not only average efficiency over the selected time
range, but also snapshots of the efficiency during the range at user-specified intervals.
Report output will be graphical and tabular, with a graph of efficiency versus time. The
efficiency report is based on a simple Rate Schedule script.
Load Factor Report
The Load Factor report lists minimum, average and peak real power demand, load factor
and time of peak demand. You can select Meters to include in the report, as well as the
report date range and calculation intervals. The report output contains a tabular report and
a graphical chart.
Power Factor Report
The Power Factor report lists real energy net, reactive energy net, and power factor (which
is calculated from the real energy and reactive energy values) for selected meters for a
selected date range divided into specified calculation intervals (hours, days, or months).
Report output is tabular with a chart of power factor on the first page.
For this report to function, the selected meters or groups must be logging Real Energy Net
and Reactive Energy Net.
Electrical Summary Report
The Electrical Summary report lists various electrical summary values for selected meters
for the selected date and time period. These summaries are:
Total Energy kWh, kVARh and kVAh
Average Demand for kW, kVAR and kVA
Load Factor for kW and kVA
Min and Max values for kW, kVAR, kVA and Power Factor and the date/time they
occurred along with the coincident values for the other parameters.
The selected meters must be logging the relevant data in order for it to show up on the
report (for example, if Real Power Demand is not logged then there will be no kW figures
on the report). Power Factor is calculated from any two of the other three parameters (kW,
kVAR, kVA).
FTEMOPC 3rd party Connectivity Option
FactoryTalk EnergyMetrix OPC enables Manager to collect data from third-party energy
data sources through an OPC server that you provide. FTEMOPC enables OPC client
support for all licensed meters.
The FTEMOPC option alone does not enable operation of FactoryTalk EnergyMetrix
software. A Manager license must be installed. For more information about 3rd
party OPC drivers, follow the Rockwell Software Preferred Server Program
link.
Internet
13

FactoryTalk EnergyMetrix Software
Notes:
14
FactoryTalk EnergyMetrix Web Interface Tour
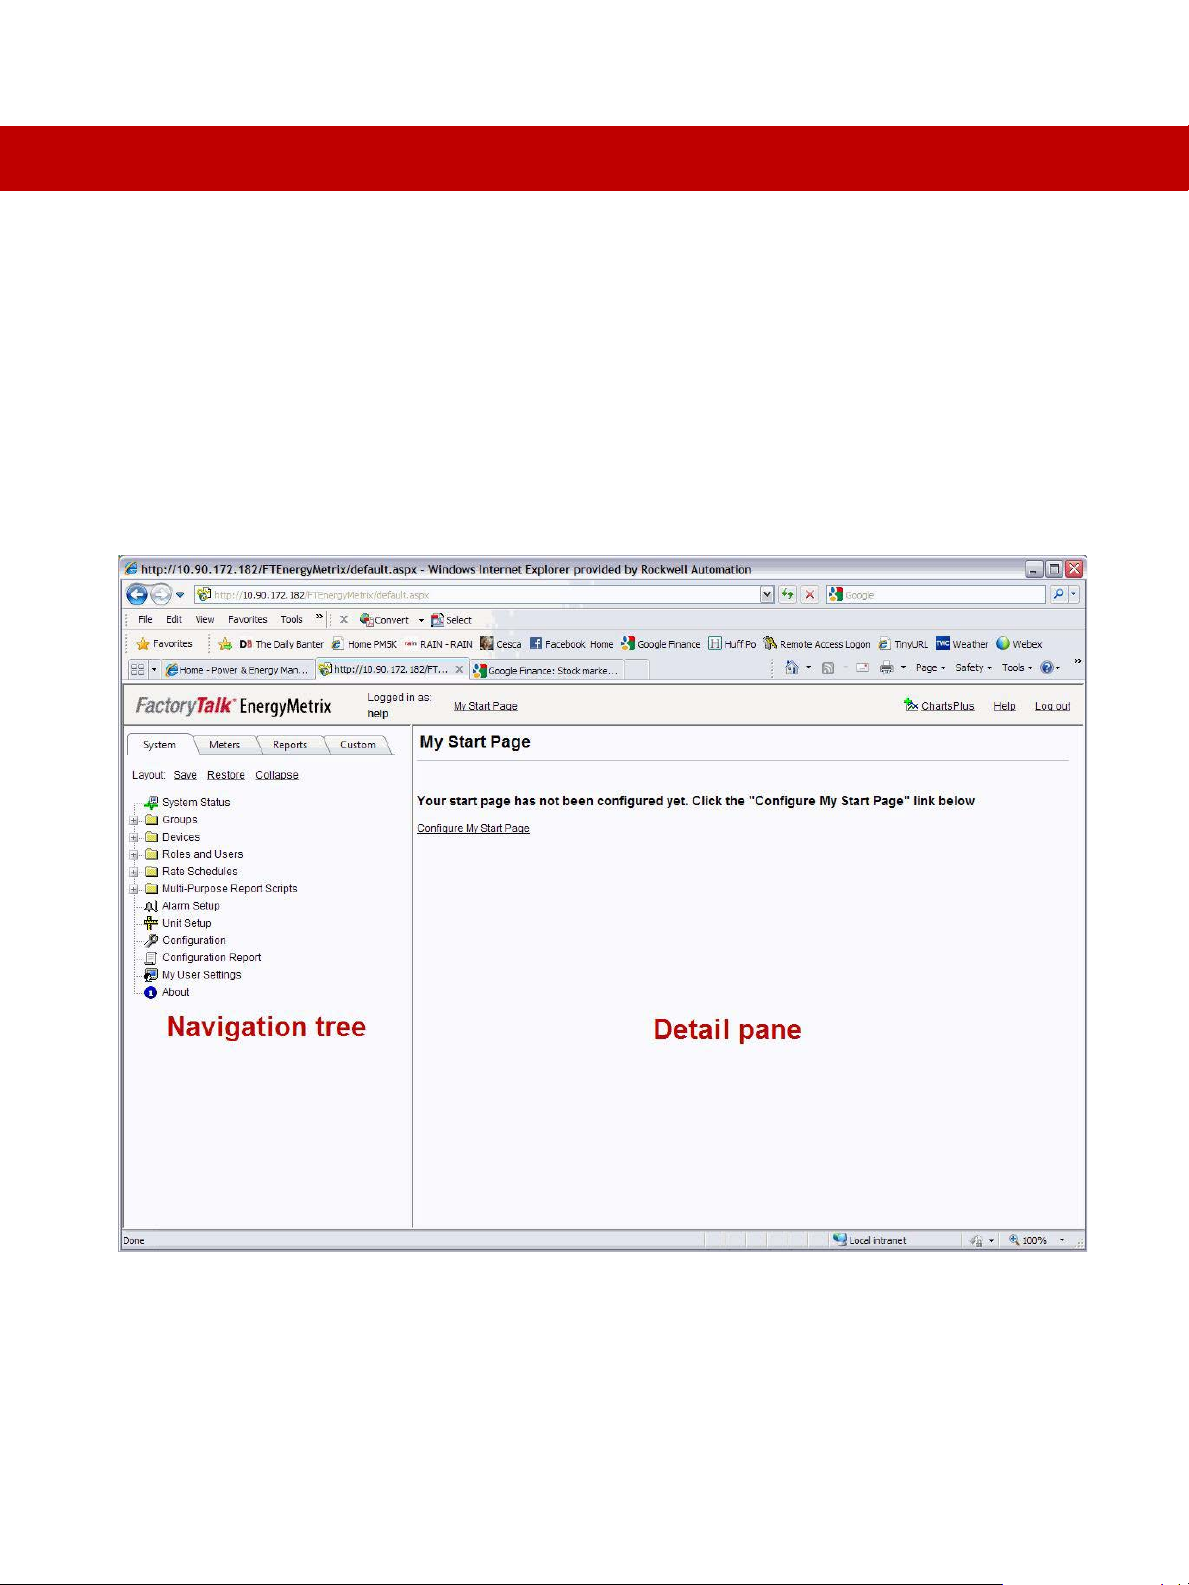
To access the FactoryTalk EnergyMetrix web page, browse to the following address:
http://<FactoryTalk EnergyMetrix server machine name or IP address>/
FTEnergyMetrix
After you log in, the client desktop appears. On the left is the navigation tree. On the right
is the detail pane.
C
HAPTER
2
15
FactoryTalk EnergyMetrix Software
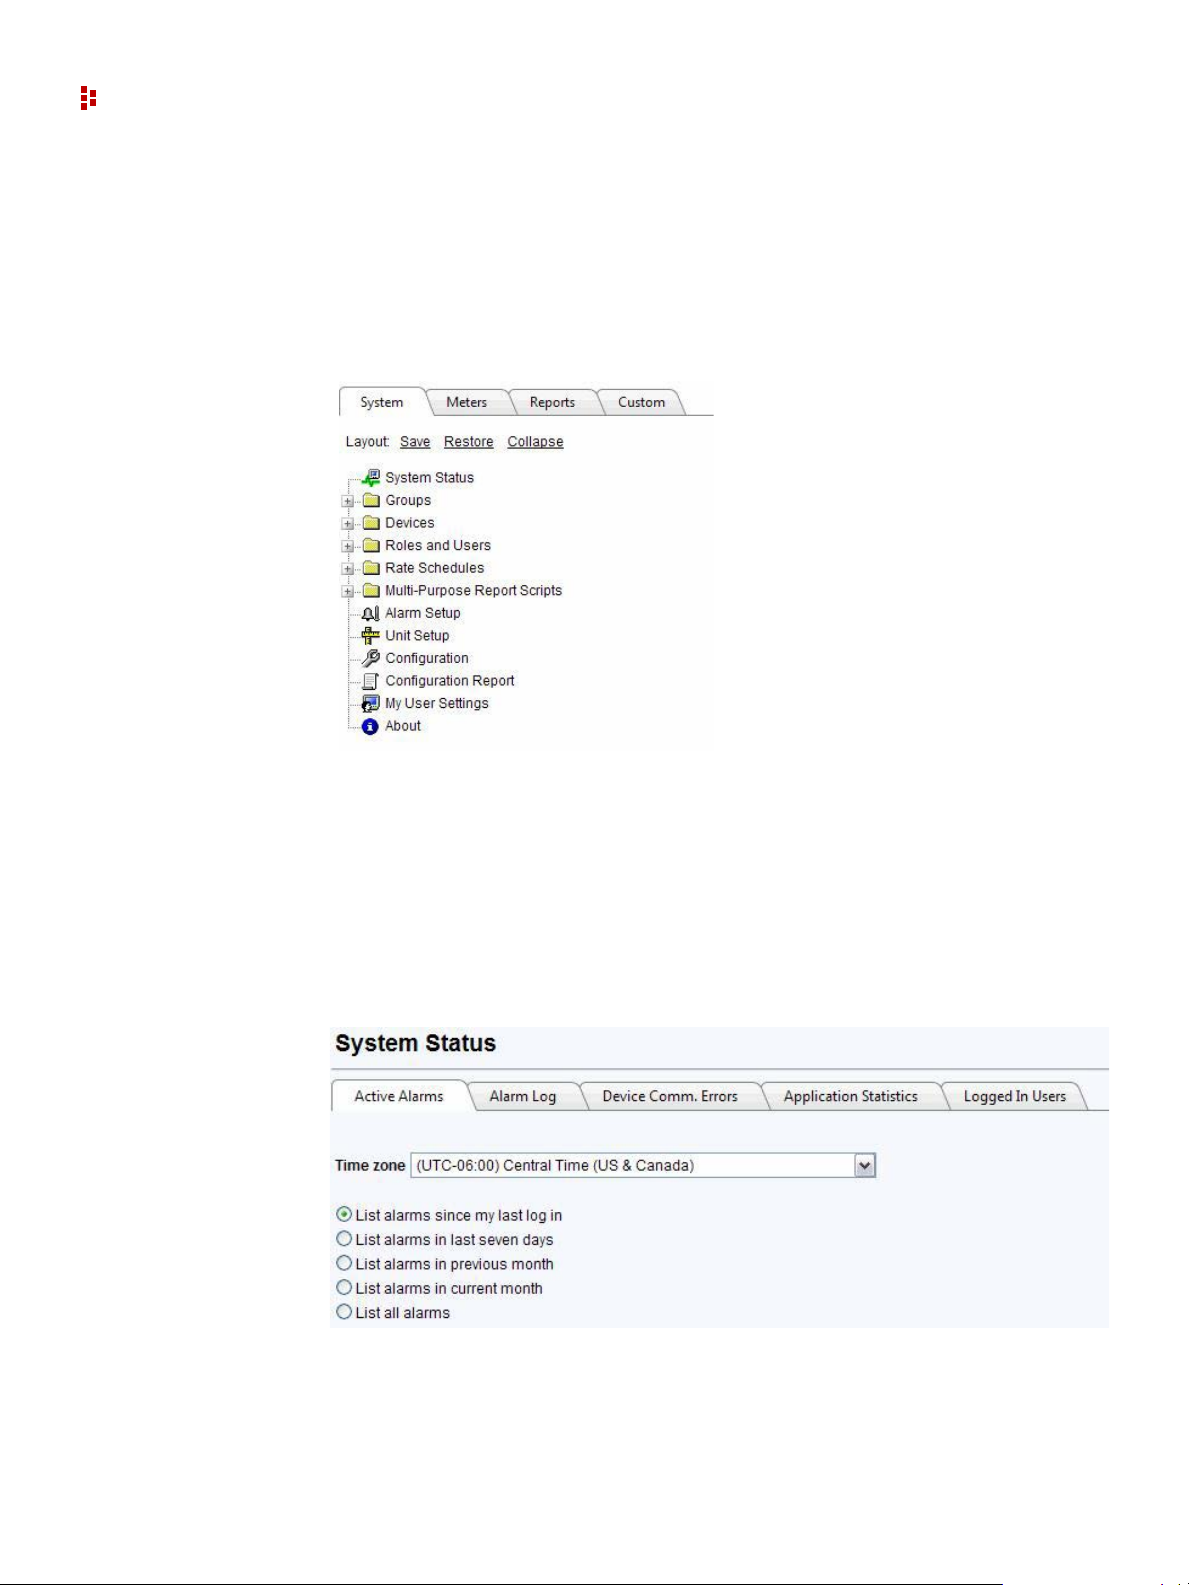
System Tab
The System tab in the navigation tree contains a number of folders and links that provide
access to setup items such as Devices, Groups, security settings (Roles and Users), Rate
Schedules, and Multi-Purpose Report Scripts, as well as links to the System Status, My
User Settings, Unit Setup, Configuration, System Configuration Report, and About pages.
System Status
Click the System Status link in the System tab to view alarms, device communication
status and other system-level information.
Alarms
The alarms tab provides a view of active and logged alarms. You can select the time range
of alarms to view by selecting a radio button.
16
2 • FactoryTalk EnergyMetrix Web Interface Tour
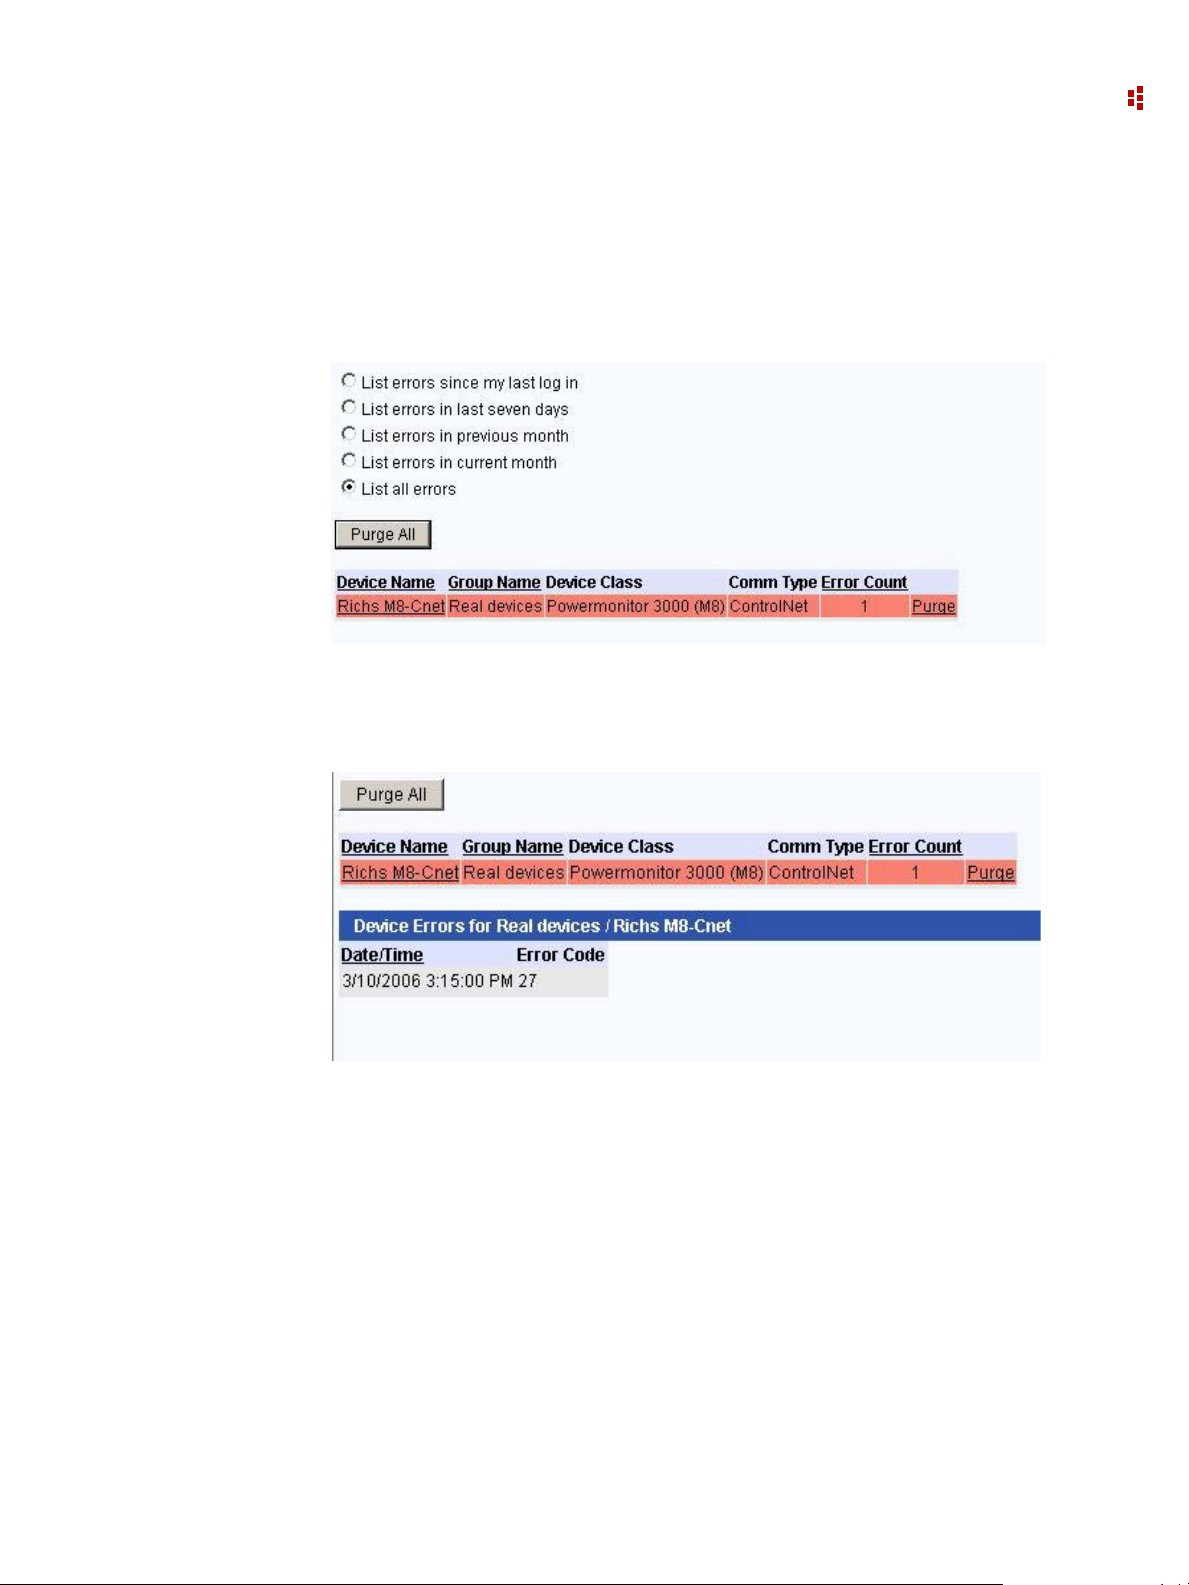
Device Communication Errors
This screen displays by default a list of device communication errors since your last login.
You can also select other error ranges.
For example, let's look at all errors:
Click on a Device Name link to expand to a detailed list of communication errors
associated with the Device.
You can purge errors for individual devices or click the Purge All button and confirm to
purge errors associated with all Devices.
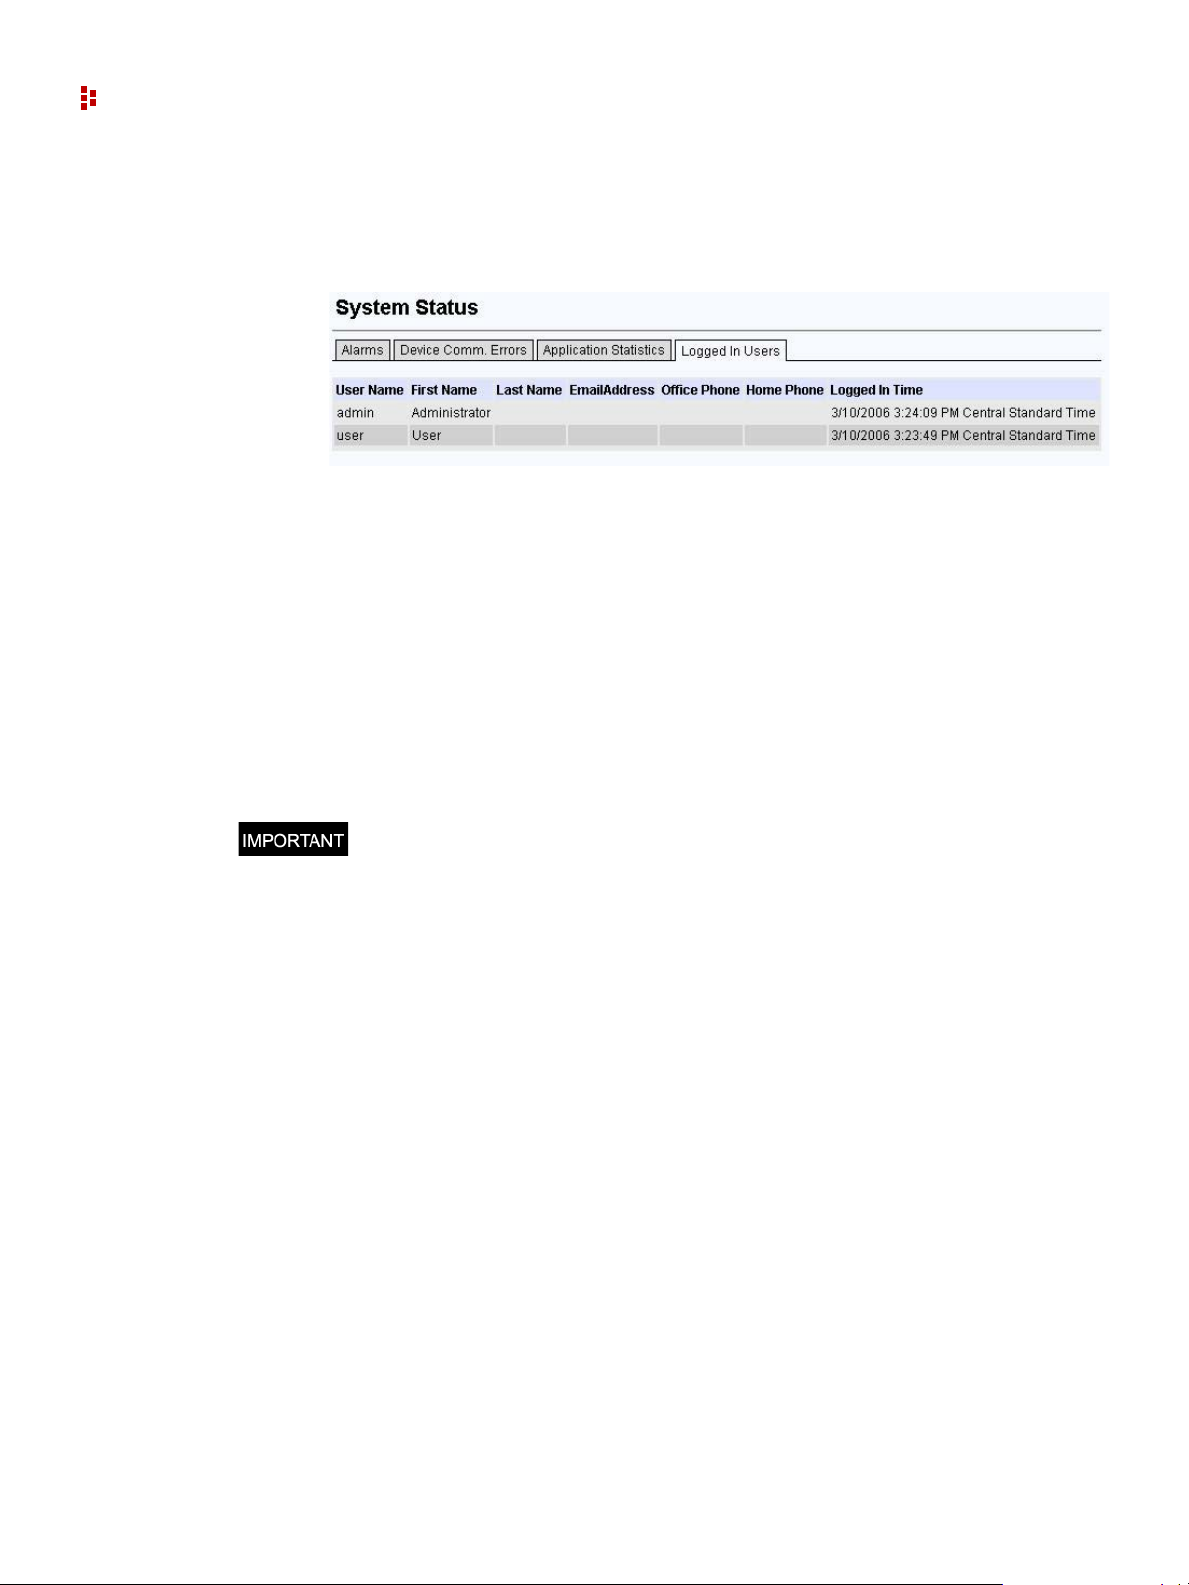
Application Statistics
This tab provides information on the current number of system users and when the system
was last restarted among other information.
17
FactoryTalk EnergyMetrix Software
User Monitor
This tab shows a list of users that are currently logged in to the system.
Groups
Click the Group link in the System tab to view the groups that have been set up. A Group
is a named collection of Devices and Meters that represents a subdivision of your
enterprise such as a department, division or process. Groups contain Meters, which can be
shared between Groups.
A Domain is a Group that is assigned Roles and Users. Rate Schedules and reports can
also be assigned to Domains. Users assigned to a Domain can only access objects assigned
to that specific Domain. This feature permits an administrator to allow certain users access
to only parts of the system he or she chooses.
Groups and Domains can be nested to any depth.
You must set up at least one Group or Domain before you can set-up Devices and
Meters.
Devices
Devices are physical entities that FactoryTalk EnergyMetrix software communicates with
over a network. Click the links listed below for information on specific device types.
Setting up a Device in FactoryT alk EnergyMetrix software establishes communication and
creates database definitions for the device, and enables device configuration and data
monitoring by using the optional FactoryTalk EnergyMetrix RT package.
Ethernet, ControlNet, serial, and DeviceNet devices can be directly connected provided
that the FactoryTalk EnergyMetrix server is also on the network through an appropriate
network interface and you have configured the appropriate RSLinx Classic direct device
drivers. Devices routed through a ControlLogix gateway or RSLinx Classic gateway are
also considered directly connected devices.
Devices can also be set up in a parent/child, or pass-thru configuration. Remote I/O
devices must be set up as children of a parent device such as a programmable controller.
DeviceNet devices can also be used as ‘Child’ devices.
18

2 • FactoryTalk EnergyMetrix Web Interface Tour
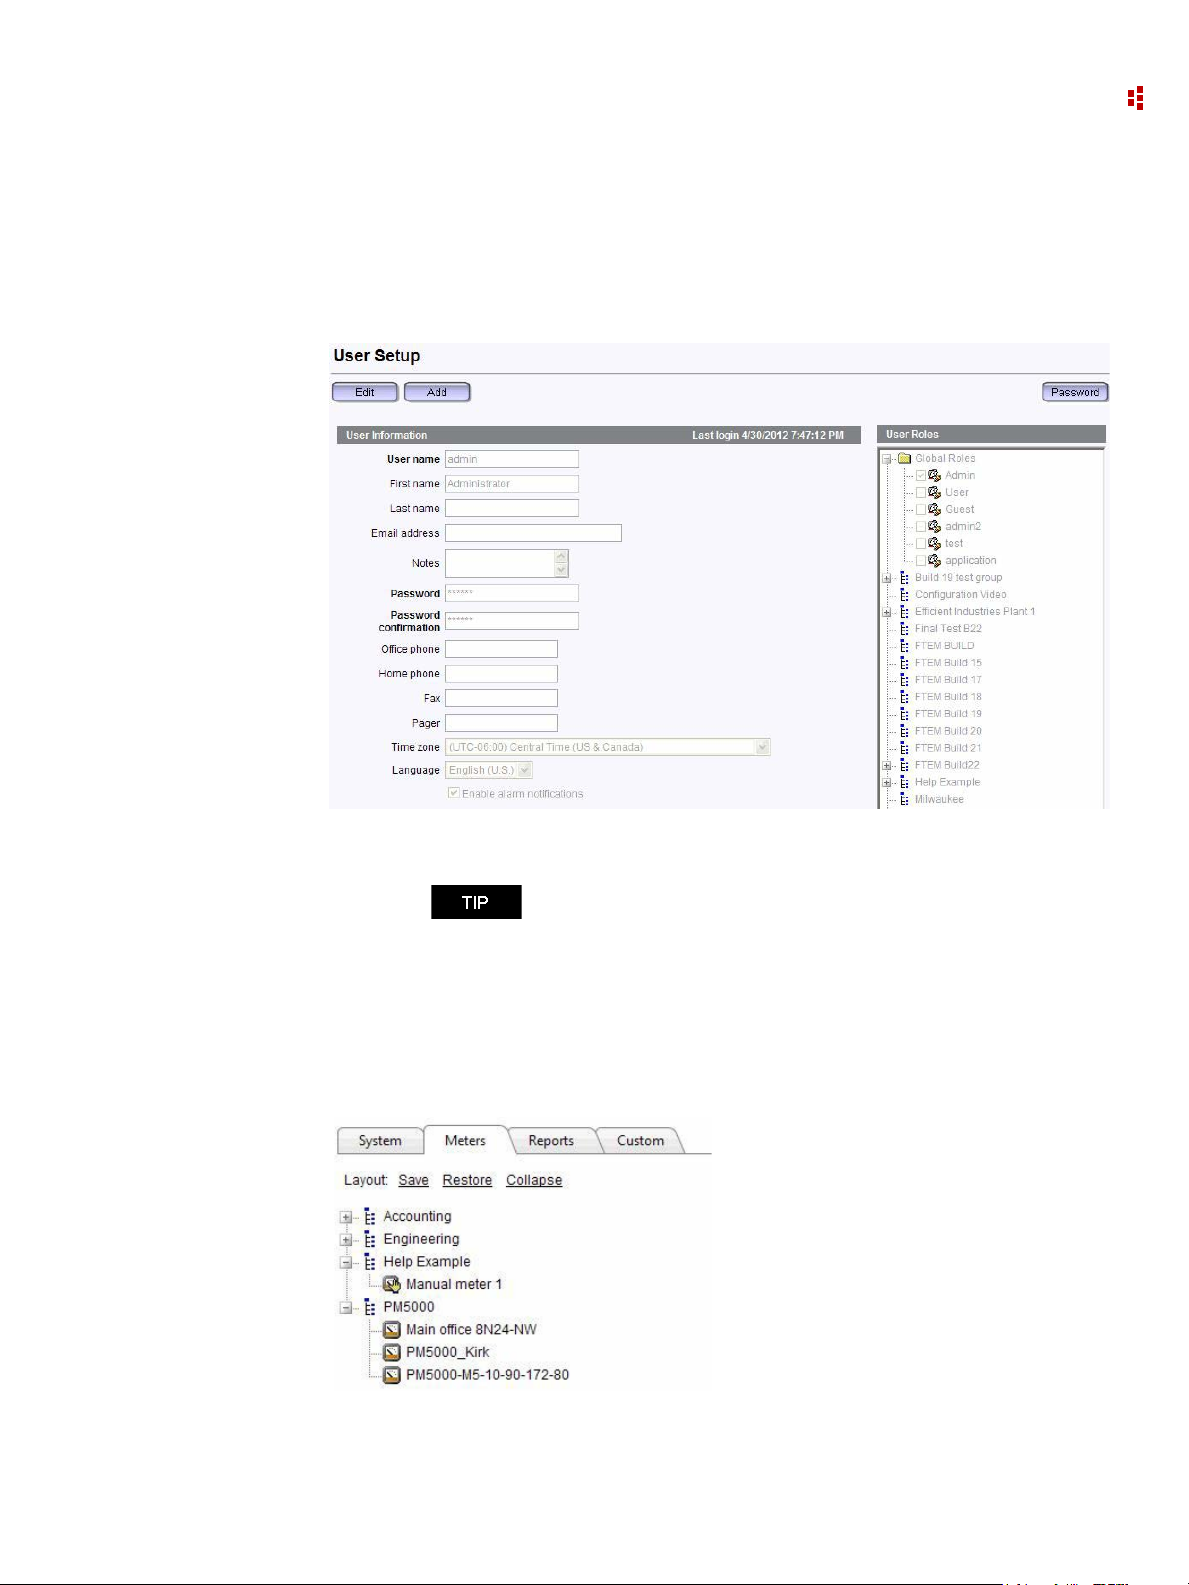
Roles and Users
Access to the application and its functions is controlled by means of Roles and Users.
A role is a named collection of privileges assigned to various users to manage security.
Roles can be global or domain specific.
A User is a named set of security credentials (user name and password) that permit an
individual to access the privileges defined in the Role assigned to the User. More than one
Role can be assigned to a User.
Roles and Users can be assigned Global scope where they are permitted access to all
domains, groups, devices, meters, reports and custom pages.
Alternately , Roles and Users can be assigned Domain-specific scope in which they permit
access to an individual domain and its sub-groups, devices, meters and reports, as well as
other Global objects such as reports, custom pages and rate schedules.
The default Roles are Admin, User, and Guest, with default user logins admin/admin,
user/user and guest/guest respectively.
Changing the default password on the Admin default user is
highly recommended to prevent inadvertent changes to the
database.
T o configure Roles and Users, navigate to the Roles and Users subfolder under the System
folder in the navigation tree.
To utilize Active Directory / LDAP (Lightweight Directory Access Protocol), simply
create a User name in the format DomainName\UserName used to log in to Windows.
The password fields and password button are displayed for Active Directory users,
however, the password entered into the user setup will only be used if the user cannot be
authenticated with the Active Directory server. When the user is authenticated against the
Active Directory server, the Windows password is stored in the database to keep the
passwords synchronized.
Rate Schedules
Rate schedules define the content and format of billing reports. You can use billing reports
for the following:
Shadow billing - replicating the monthly bill from your energy provider
Cost allocation - reporting the real cost of energy for each process or cost center in
your enterprise
Tenant billing - generating energy bills for use of your manufacturing or commercial
facilities by others
What-if analysis - Comparing costs of energy from different energy providers for the
same usage
Rate schedules can have global scope or be assigned to a domain. Global rate schedules
can be used in all domains. Domain rate schedules apply to only a single domain.
19

FactoryTalk EnergyMetrix Software
The rate schedule model is designed to be very flexible so you can accommodate a wide
variety of utility tariffs.
Multi-purpose Report Scripts
The Multi-purpose Report (MPR) is a free-form report driven by script code stored in a
Multi-purpose Report Script. The MPR is part of the ReportsPlus Reports
A MPR Script defines what a MPR contains and what it looks like. A MPR script is
conceptually similar to a rate schedule. Like a rate schedule, an MPR script is combined
with selected meters or groups to form a specific report instance. This allows a script to be
reused for different meters and groups.
MPR scripts are listed in a new sub-tree under the System tab and can be Global or
assigned to a domain.
MPR scripts contain Visual Basic for .NET scripting that utilizes the MPR object model to
select and format the content of the report.
MPR users are assumed to be familiar with FactoryTalk EnergyMetrix, in particular with
its reporting and rate schedule functionality, and the Visual Basic for .NET scripting
language.
option.
You can select one or more of the following elements, or objects, when configuring an
MPR. Each provides a different way to view your energy, cost and production data.
Grid
A Grid displays data in tabular format. The MPR script contains code that creates a Grid,
specifies the number, width and heading text of columns, and populates the rows of the
grid with data.
Bar Chart
A Bar Chart displays a bar graph of data. The MPR script contains code that creates a bar
chart, defines the x and y axes and selects the data to be displayed in one or more data
series.
Tre nd C ha r t
A Trend Chart displays a line graph of data. The MPR script contains code that creates a
trend chart, defines the x and y axes and selects the data to be displayed in one or more
data series.
Bar chart series can be mixed with trend chart series in the same
chart. Charts may have multiple Y axes.
Pie Chart
20
A Pie Chart displays a series of data as wedges of different sizes in a pie-shaped graphic.
The MPR script contains code that creates a Pie Chart and populates it with data.

2 • FactoryTalk EnergyMetrix Web Interface Tour
Rich Text Box
The Rich T ext Box provides a way to place text on a MPR. The MPR script contains code
that creates the Rich Text Box and controls its location, size, content and formatting.
Page Header and Footer
The page header contains identifying elements such as the report title, the report headings
from the Group setup, the report time range and time zone, and a user-selectable graphic
element.
The page footer contains the report page number and the date and time the report was
printed.
MPR script code controls the header graphic element selection and the visibility or the
header and footer.
Intervals
Intervals provide an easy way for MPR script code to process data in intervals specified by
the user when they run a Multi-Purpose Report. Interval types are Day, Week, Month.
Enable Intervals by selecting the Use Intervals checkbox on the MPR script setup screen.
Excel
The Excel report object moves the report output and formatting from the MPR script into
Excel. Since the report output is now Excel all of the functionality of Excel is now
available to the report.
21
FactoryTalk EnergyMetrix Software
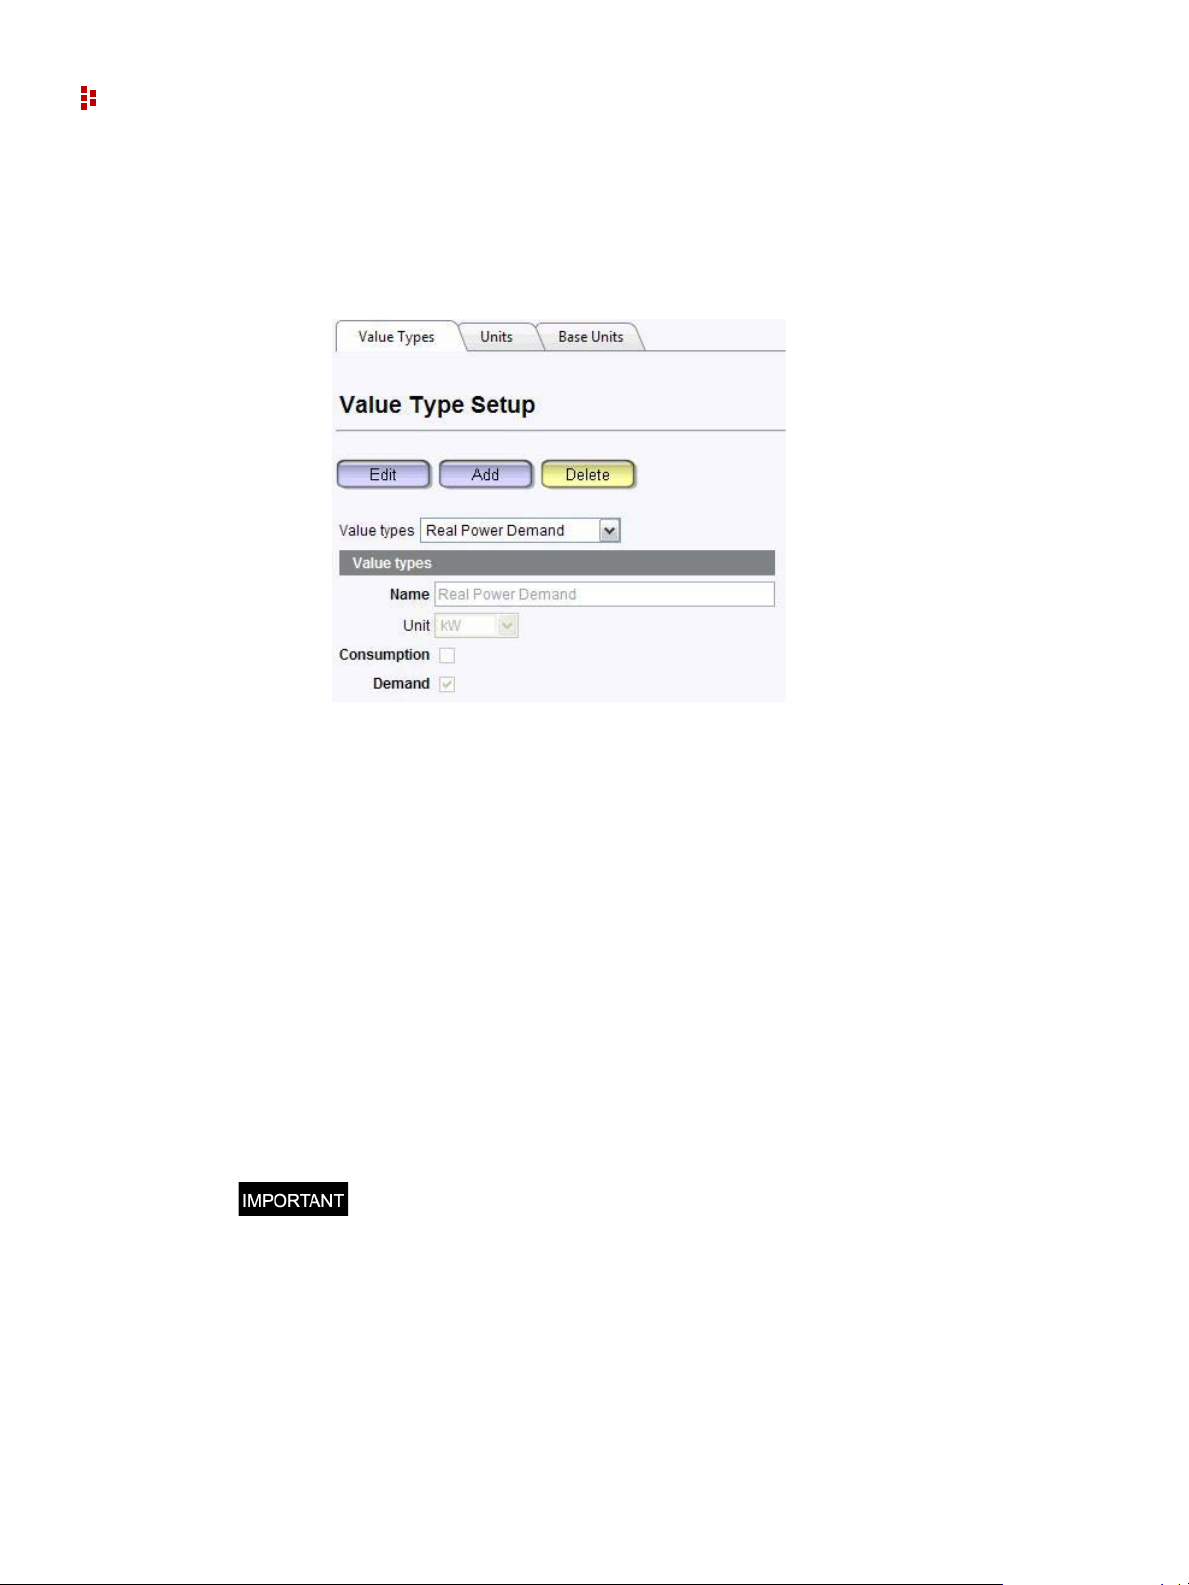
Unit Setup
The Unit Setup screen provides menus that let you add, delete, and edit Value Types, Base
Units, and Units.
The FactoryTalk EnergyMetrix collection of base units includes many that are commonly
uses in energy management applications. The default collection of units is based on the
base units and includes a scaling factor which relates it to the base unit. For example, VA
(volt-amperes) is a Base unit, and kVA (kilo-volt-amperes) is a Unit, with a scaling factor
of 0.001.
Value types are used by the reporting and billing functions to aggregate values of a
specific type in one or more meters or groups. The default collection of value types in
FactoryTalk EnergyMetrix software represents the most commonly used electrical energy
management parameters. Value types can be set up as Consumption or Demand.
Consumption value types are treated as accumulated values of energy or process output,
for example, real energy net. Demand value types are treated as 'rate' values such as real
power demand.
To add, edit or delete a Unit, Base Unit, or Value Type navigate to the System tab, Unit
Setup screen. Select the appropriate tab and enter the values you desire in the menu fields.
Exercise care not to delete a unit, base unit, or value type that is associated with
tags that exist in the database or unpredictable results may occur.
22
2 • FactoryTalk EnergyMetrix Web Interface Tour
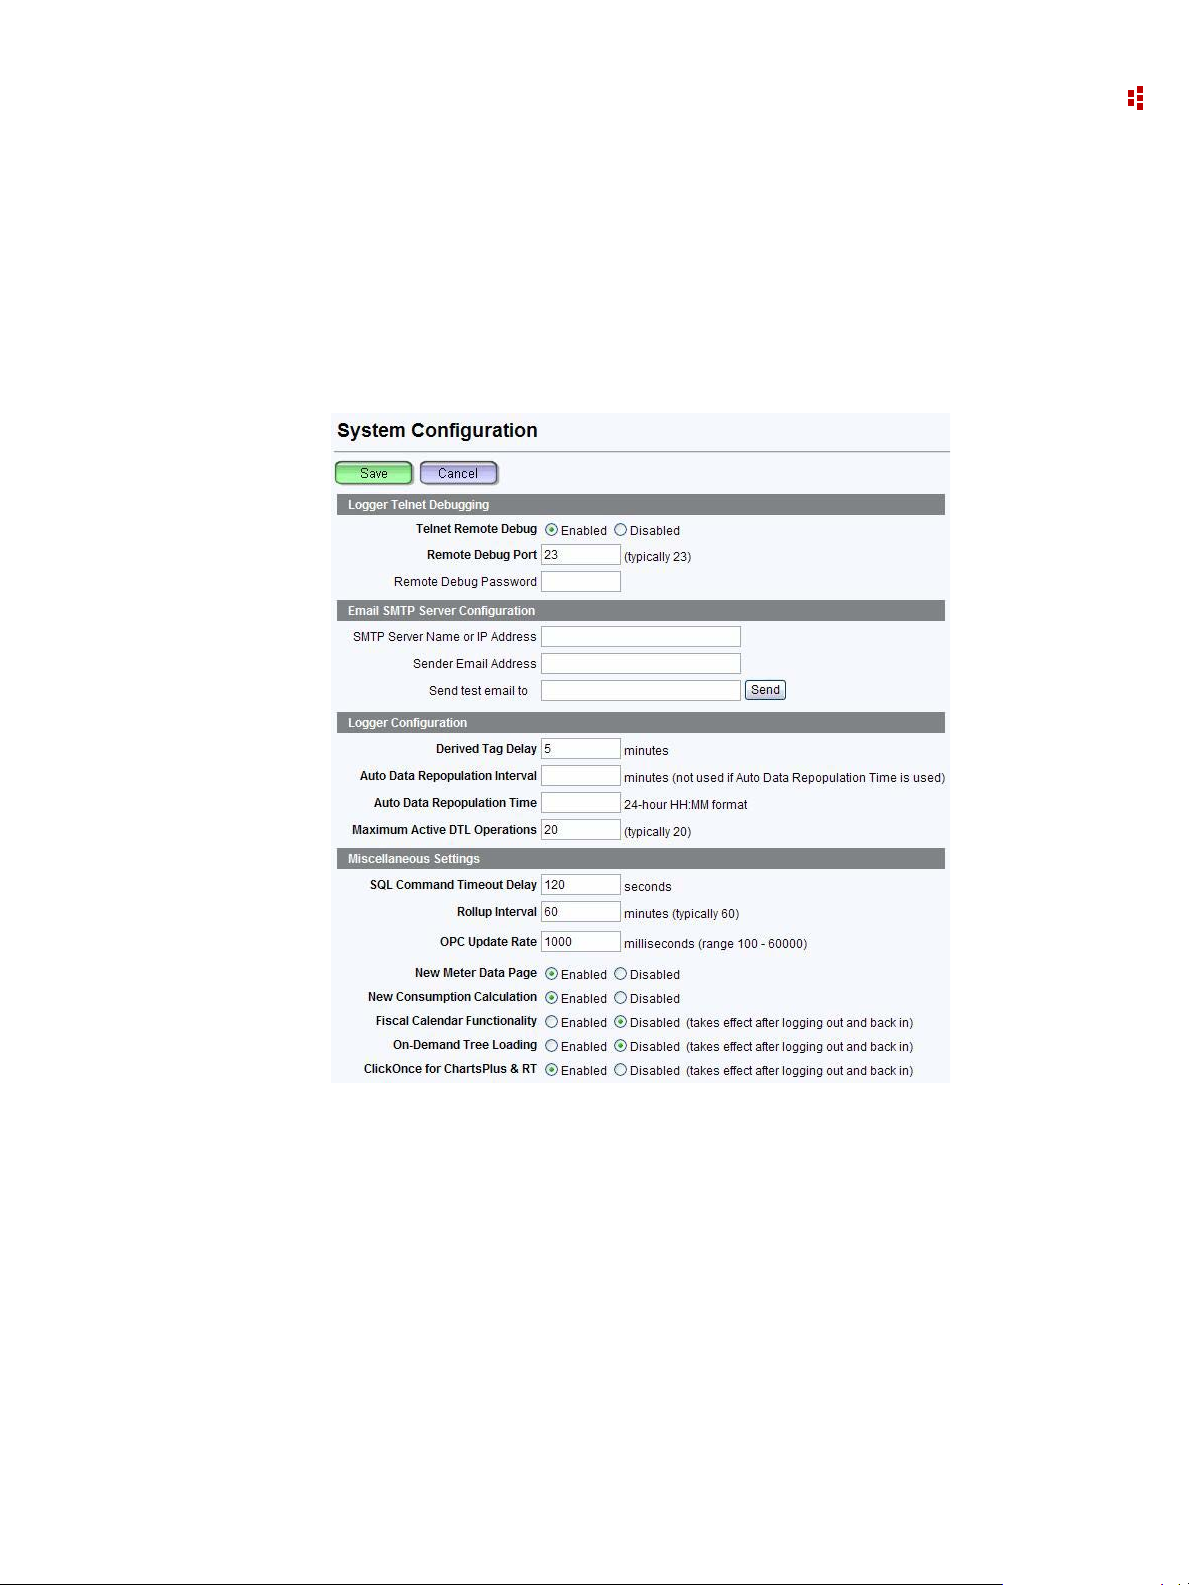
System Configuration
The Configuration page under the System tab provides a means for setting a variety of
program options.
To access the Configuration page, select the System tab and then select the Configuration
item in the navigation tree. Click the Edit button to change settings. You must have Edit
System Configurations privileges to make changes.
Logger Telnet Debugging
Telnet debugger, enabled or disabled (default)
Remote debug port, any unused port ID, default 23
Remote debug password, default "".
Email SMTP Server Configuration
FactoryTalk EnergyMetrix software sends email alarms and reports via a SMTP server
configured by using this page.
SMTP (Simple Mail Transport Protocol) server name or IP address
Sender email address (does not need to be an actual email address)
Test email button - sends a test message to the email address entered in the address
field when the Send button is clicked
23

FactoryTalk EnergyMetrix Software
Logger Configuration
Derived tag delay - specifies how long after meter data is polled that derived tags are
calculated. Default is 5 minutes
Maximum active DTL operations - specifies the maximum concurrent messages with
RSLinx Classic and hence devices. Range is 1 to 35. Default is 20. It is unlikely that
you will need to adjust this setting
Miscellaneous Settings
SQL command timeout delay - default 120 seconds.
Roll-up interval - specifies how often tags are refreshed from roll-up servers, default
60 minutes.
OPC update rate - specifies how often the connection to OPC servers is refreshed.
New meter data page - Enabled by default, selects the paged meter data display page
New consumption calculation - provides more accurate consumption reporting in the
case of data logging anomalies such as unexpected zero values and resets.Enabled by
default.
Fiscal Calendar Functionality - permits the creation and use of fiscal periods for
reporting. Disabled by default.
On-demand tree loading - If on-demand tree loading is enabled, nodes are loaded only
when a user expands them. If disabled, the entire tree refreshes at a time.
ClickOnce for ChartsPlus and RT - Enabled by default, sets up RT and ChartsPlus as
ClickOnce applications.
System Configuration Report
The system configuration report may be found on the System tab. This report can be
configured to document the configuration of any or all of the objects listed in the report
setup page. In addition, you may select all groups or an individual group / domain and its
subgroups. Groups are limited to those accessible to your login role.
24
2 • FactoryTalk EnergyMetrix Web Interface Tour
My User Settings
This screen shows the user settings of the currently logged-in user . A user can change their
personal password here. It also lets a user change other user settings, provided that the role
associated with the currently logged-in user has the privilege to edit users.
Meters Tab
The Meters tab in the navigation tree contains folders that organize the Meters into groups
and domains.
If you wish to receive alarm notifications by email, be sure to
check the Enable alarm notifications checkbox on this page.
25
FactoryTalk EnergyMetrix Software
Selecting the Meters tab does not change the detail pane content. Select a Group or
Domain to view aggregated information from the Meters the group contains.
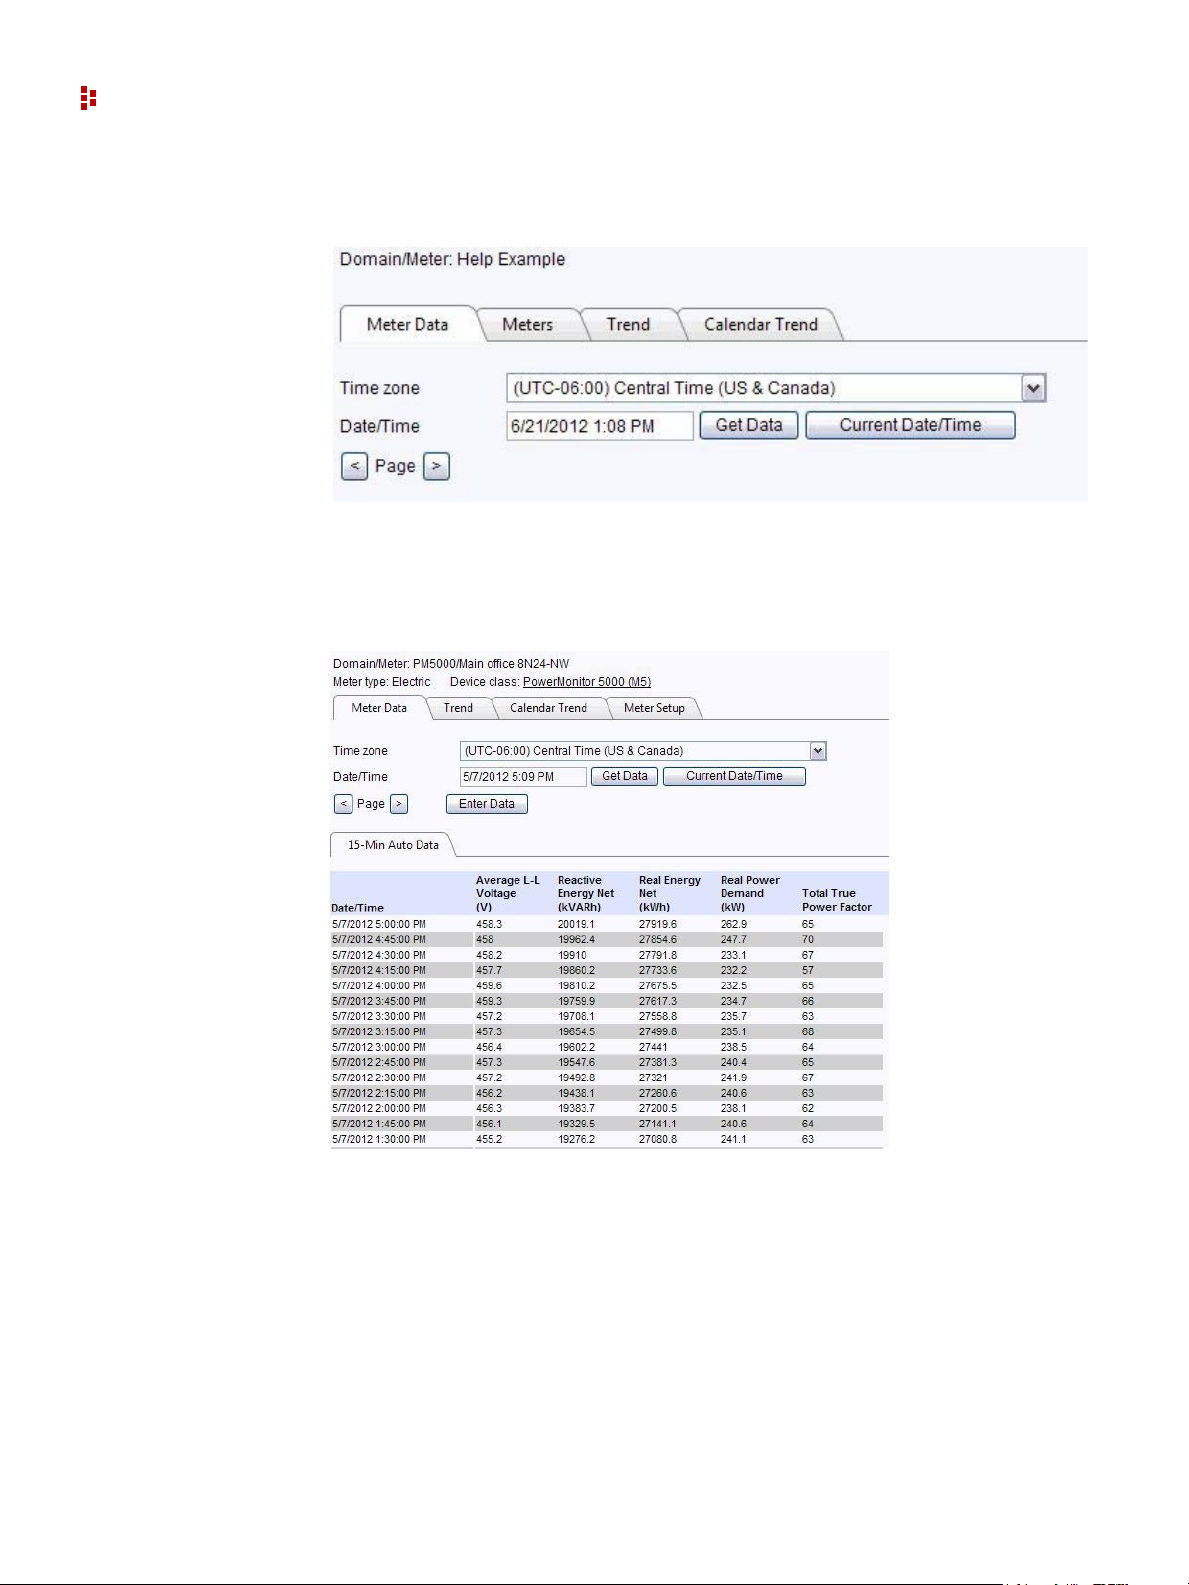
When you first select a Meter, the Meter Data ta b is selected. This screen lets you view the
logged meter data. The display is arranged by log rate. The user time zone is selected by
default. Controls allow you to select the desired date, scroll up and down through the data,
and page backward and forward through the meter data.
26
When you select a Group under the Meters tab, an aggregated view of the data of the
meters in the group is shown. Data is aggregated based on value type. If data is missing
from one or more meters for a particular time, no aggregated value appears in the Group
display.
The Get Data button refreshes the current page of meter data. The Current Date/Time
button selects the current time and refreshes the meter data display.
2 • FactoryTalk EnergyMetrix Web Interface Tour
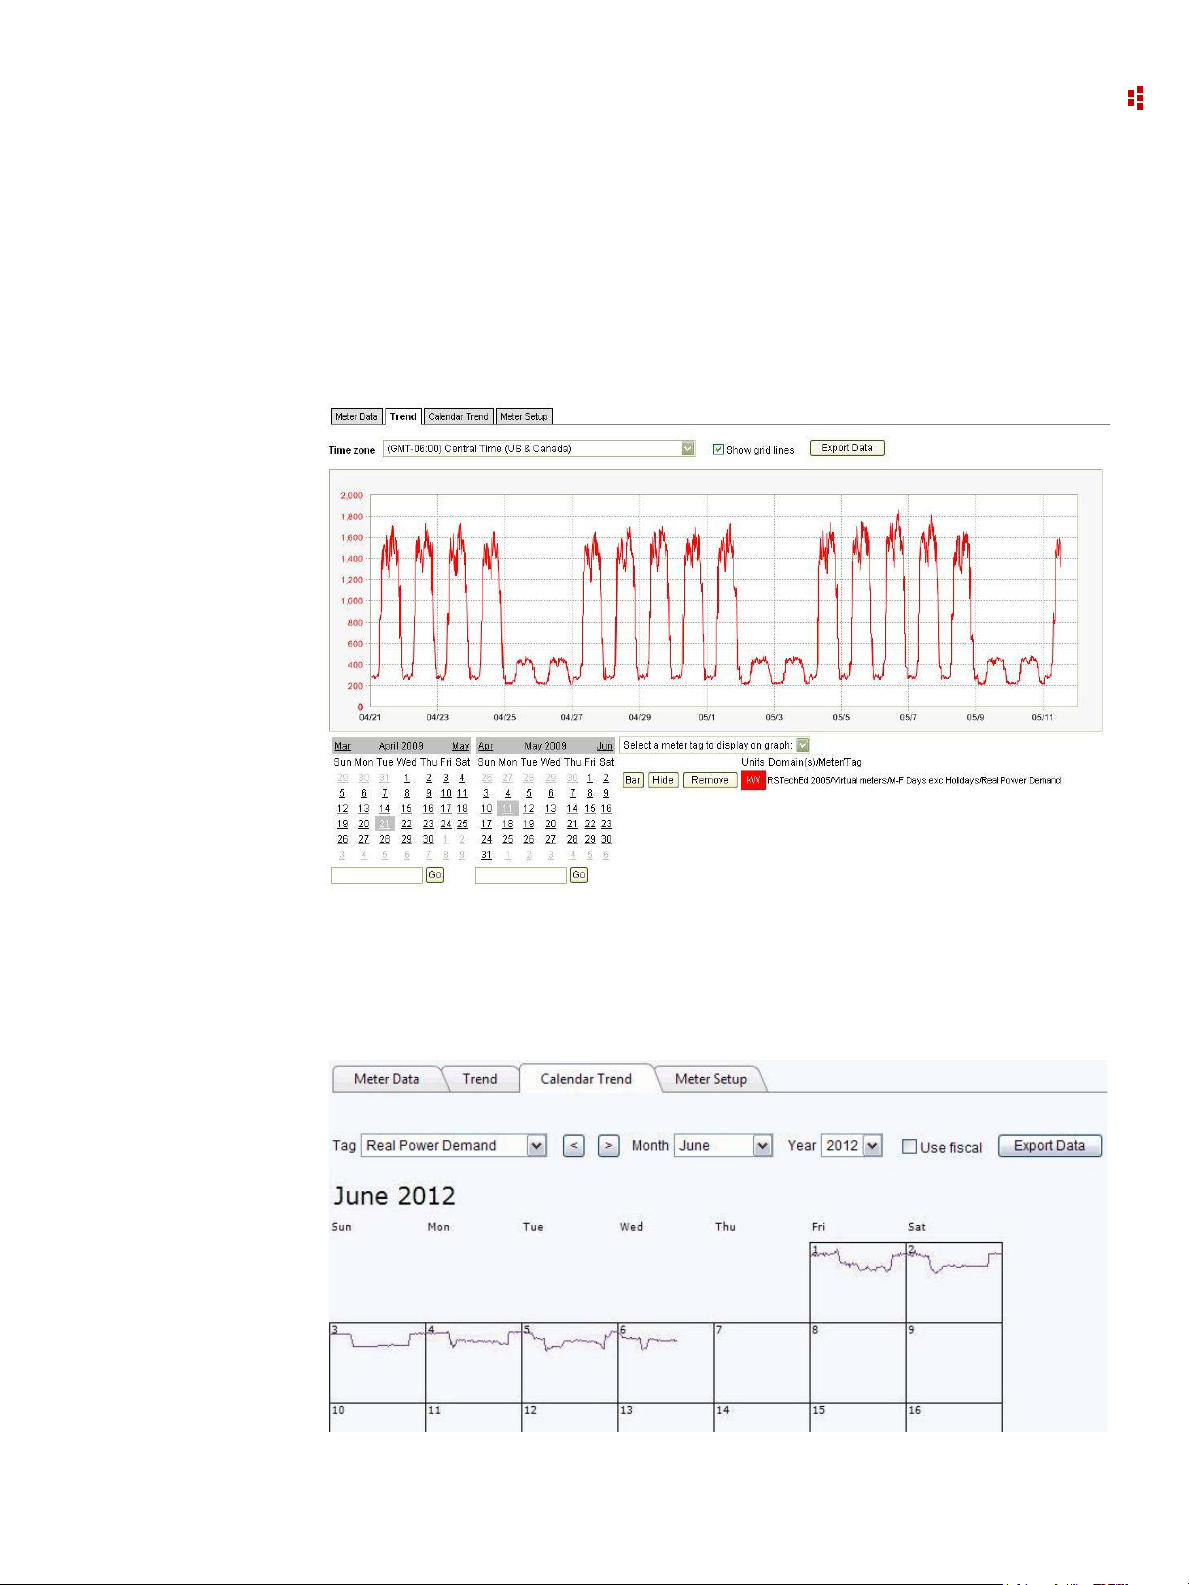
The Meter trend display lets you select and view tags as their values vary by time. You can
select up to five tags from one or more meters. Each pen can be individually selected to b e
displayed as a line chart or bar chart. The user time zone is selected by default. You can
select a different time zone for the trend and the start and end dates from the calendars. Or,
enter start and end dates into the date fields and click the Go button. One day is the
minimum trend period. If you select an end date earlier than the start date, the system will
adjust the start date, and vice versa.
The calendar trend display shows how the value of a meter tag or value type you select
varies over a full month. You can select the meter tag to display from the pull-down menu.
The calendar trend is available for individual meters and for groups by using aggregated
data.
27
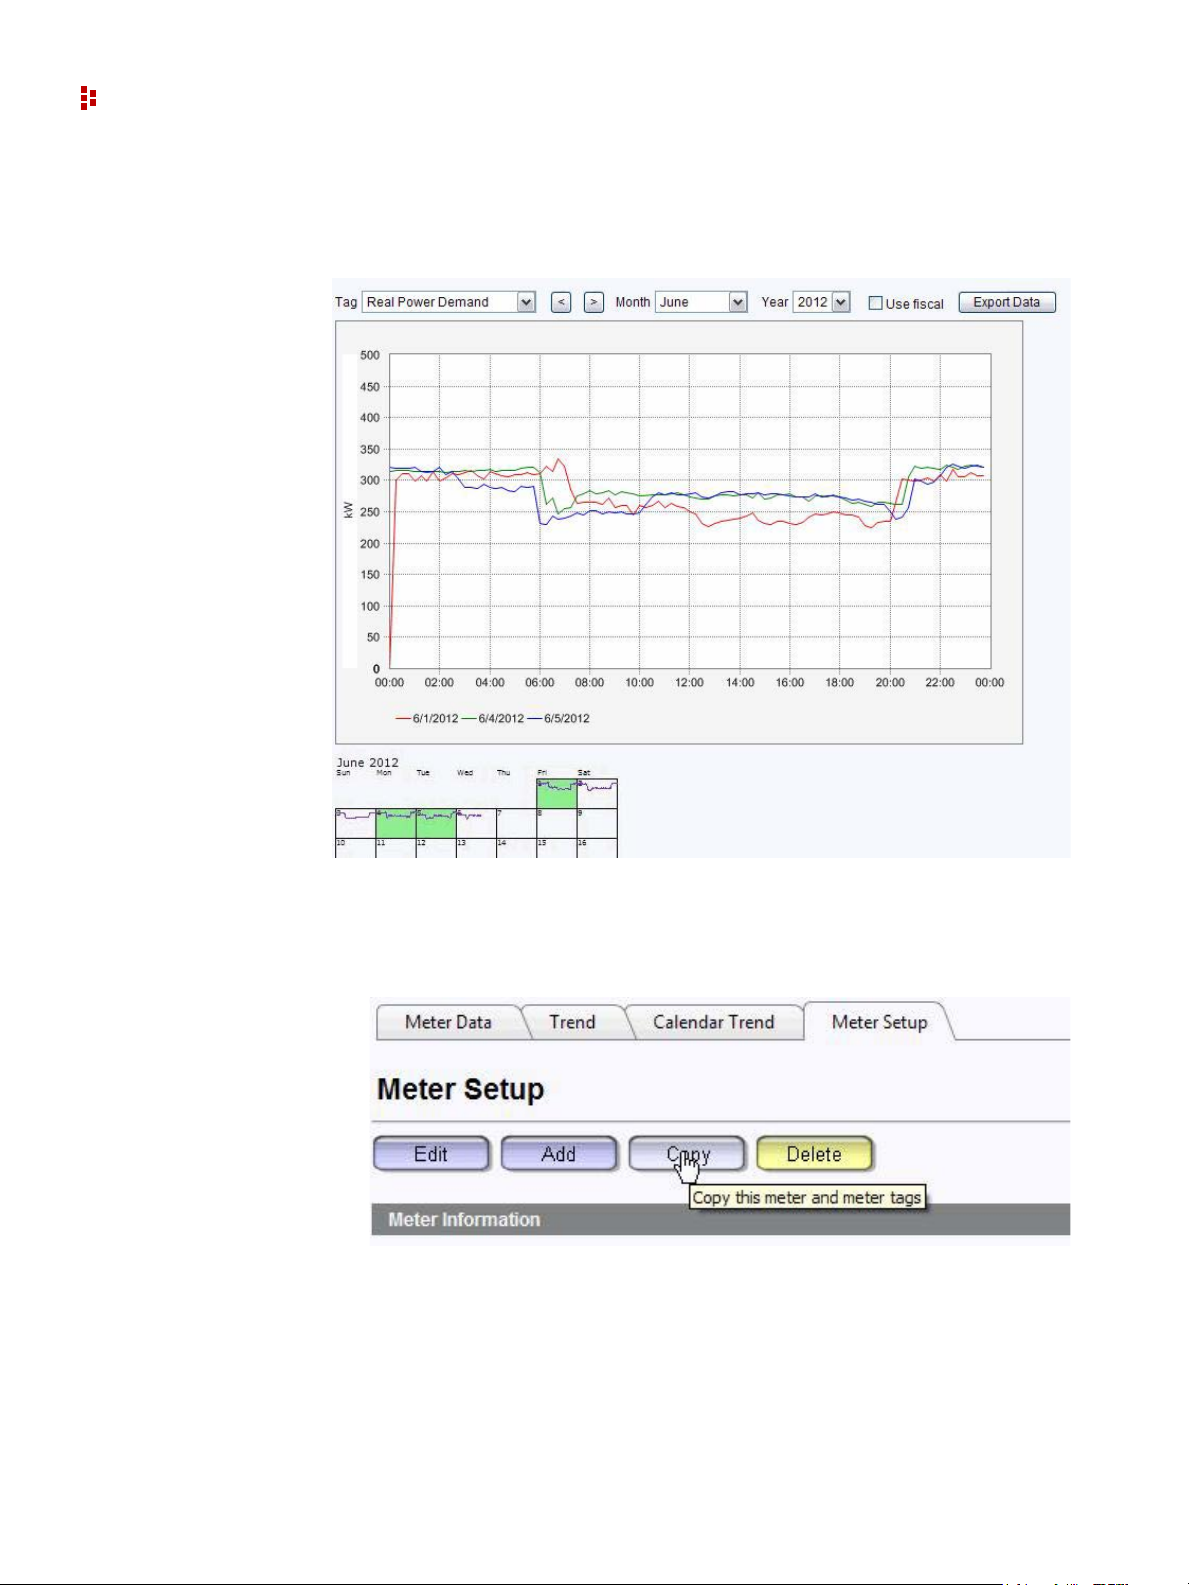
FactoryTalk EnergyMetrix Software
To zoom in to a day, click on the day in the calendar. You can overlay days by selecting
additional days from the small calendar under the zoomed display.
Meter Setup
The meter setup screen provides tools to allow you to create, modify, and delete Meters,
add and modify meter tags, and set up alarms.
28

Reports Tab
Standard reporting converts the energy and production data logged in the database into
information you can use to manage your business, improve efficiency and reduce costs.
Standard reports can be run on demand, automatically on a configurable schedule , or
event-driven in response to an alarm condition.
Consumption Reports
Reports consumption values (for example kWH and kVARh) for selected meters or groups
for a specified date/time range. The consumption report aggregates data from each
selected meter based on consumption value types, that is, value types with the
Consumption flag selected. The report comprises one line item per meter with totals by
group. The group and meter names are listed in the left hand column and a colum n i s
added for each consumption value type that exists in the selected meters. If more than
three consumption value types exist the line items may be truncated.
Demand Analysis Reports
Reports kW demand values for selected meters or groups for a specified date/time range.
Reports ‘worst case scenario’ peak demand that would have occurred if each meter or
group's peak demand had occurred in the same demand interval. The demand analysis
report selects from each selected group or meter value types with the Demand flag
selected. The report is organized in groups by value type, for example, kVA or kW.
2 • FactoryTalk EnergyMetrix Web Interface Tour
Billing Reports
Runs billing reports for selected groups or meters for a specified date/time range. The
report outputs a list of line items and a total charge amount. Each line item consists of a
description, quantity, rate and charge. Billing reports select value types and calculate the
report line items based on Rate Schedules
currency symbols and numeric formatting based on the Windows regional setting that is
selected in the rate schedule.
that you configure. The billing report displays
Cost Allocation Reports
Runs a report that lists each meter's contribution to the total energy cost, based on a Rate
Schedules that you configure. Cost Allocation reports are generated in Microsoft Excel
output format.
29

FactoryTalk EnergyMetrix Software
Power Quality Reports
Runs a report that combines a graph and a grid display of power quality (sag and swell)
events. The power quality report can only be used with Allen-Bradley PowerMonitor 3000
M6 and M8 models with their sag and swell setpoints configured. The Enable PQ events
logging flag must be selected in the Device setup page. With this flag set, FactoryTalk
EnergyMetrix periodically reads the power monitor event log and stores sag and swell
events in the database. Each sag and swell record lists the time, duration and maximum
deviation of the sag or swell. The power quality report displays the events logged during
the selected report interval on a ITI/CBEMA chart and in a grid (tabular) listing.
Pareto Chart Report
Runs a report on consumption values of a selection of meters or groups. The Pareto chart
displays each meter or group's consumption as a bar chart, with the bars arranged in order
of decreasing consumption. A line chart indicating the cumulative consumption of the
groups or meters, starting at zero and ending with 100%, is overlaid against the bar chart.
The Pareto chart report help identify the areas in your facility that use the most energy.
ReportsPlus Reports
ReportsPlus reports are available as part of the ReportsPlus option.
Automatically Run Reports
The reports listed above can be set up to run automatically, either on a schedule or in
response to an alarm.
System Configuration Report
This report can be configured to document the configuration of the FactoryTalk
EnergyMetrix project.
ReportsPlus Reports
ReportsPlus provides you a package of additional reports that are set up and viewed in the
same way as standard reports. Like standard reports, ReportsPlus reports can be
configured to automatically run on a schedule and optionally send the report output to one
or more email addresses. ReportsPlus reports can be identified by a distinctive icon in the
report list.
Multi-purpose Report
The Multi-purpose Report (MPR) supports a free-form type of report output that is driven
by script code stored in a Multi-purpose Report Script.
Efficiency Report
30
The purpose of this report is to give you information on the ‘energy efficiency’ of part or
all of your process, plant or enterprise. You will be able to define an efficiency equation
and then execute the equation over a period of time and a group of meters.
Loading...