


 Loading...
Arena® Contact Center
USER’S GUIDE
PUBLICATION ARENCC-UM001E-EN-P–November 2007
Supersedes Publication ARENCC-UM001D-EN-P
Contact Rockwell Customer Support Telephone — 1-440-646-3434
Online Support— http://www.rockwellautomation.com/support
Copyright Notice © 2007 Rockwell Automation Technologies, Inc. All rights reserved. Printed in USA.
This document and any accompanying Rockwell Software products are copyrighted by Rockwell Automation Technologies, Inc. Any reproduction and/or distribution without prior written consent from Rockwell Automation Technologies, Inc. is strictly prohibited. Please refer to the license agreement for details.
Trademark Notices Arena, Rockwell Automation, and SIMAN are registered trademarks of Rockwell Automation, Inc.
Other Trademarks ActiveX, Microsoft, Microsoft Access, SQL Server, Visual Basic, Visual C++, Visual SourceSafe, Windows, Windows ME, Windows NT, Windows 2000, Windows Server 2003, and Windows XP are either registered trademarks or trademarks of Microsoft Corporation in the United States and/or other countries.
Adobe, Acrobat, and Reader are either registered trademarks or trademarks of Adobe Systems Incorporated in the United States and/or other countries.
ControlNet is a registered trademark of ControlNet International.
DeviceNet is a trademark of the Open DeviceNet Vendor Association, Inc. (ODVA)
Ethernet is a registered trademark of Digital Equipment Corporation, Intel, and Xerox Corporation OLE for Process Control (OPC) is a registered trademark of the OPC Foundation.
Oracle, SQL*Net, and SQL*Plus are registered trademarks of Oracle Corporation.
All other trademarks are the property of their respective holders and are hereby acknowledged.
Warranty This product is warranted in accordance with the product license. The product’s performance may be affected by system configuration, the application being performed, operator control, maintenance and other related factors. Rockwell Automation is not responsible for these intervening factors. The instructions in this document do not cover all the details or variations in the equipment, procedure, or process described, nor do they provide directions for meeting every possible contingency during installation, operation, or maintenance. This product’s implementation may vary among users.
This document is current as of the time of release of the product; however, the accompanying software may have changed since the release. Rockwell Automation, Inc. reserves the right to change any information contained in this document or the software at anytime without prior notice. It is your responsibility to obtain the most current information available from Rockwell when installing or using this product.
Version: 12.00.00 (CPR9)
Modified: October 8, 2007 9:55 am
ii
Contents
1 • Welcome to Arena Contact Center Edition |
1 |
What is Arena Contact Center Edition? . . . . . . . . . . . . . . . . . . . . . . . . . . . . . . . . . . . . . 1 Intended audience. . . . . . . . . . . . . . . . . . . . . . . . . . . . . . . . . . . . . . . . . . . . . . . . . . . . . . 1 Simulation of contact centers . . . . . . . . . . . . . . . . . . . . . . . . . . . . . . . . . . . . . . . . . . . . . 1 Arena Contact Center Edition: A custom-designed simulation system for contact centers
3
Where can I go for help? . . . . . . . . . . . . . . . . . . . . . . . . . . . . . . . . . . . . . . . . . . . . . . . . 4 Reference the user’s guides . . . . . . . . . . . . . . . . . . . . . . . . . . . . . . . . . . . . . . . . . . 4 Explore our examples . . . . . . . . . . . . . . . . . . . . . . . . . . . . . . . . . . . . . . . . . . . . . . . 4 Get help. . . . . . . . . . . . . . . . . . . . . . . . . . . . . . . . . . . . . . . . . . . . . . . . . . . . . . . . . . 4 Use the SMARTs library . . . . . . . . . . . . . . . . . . . . . . . . . . . . . . . . . . . . . . . . . . . . 5 Access the Arena Symbol Factory . . . . . . . . . . . . . . . . . . . . . . . . . . . . . . . . . . . . . 5 Get phone support. . . . . . . . . . . . . . . . . . . . . . . . . . . . . . . . . . . . . . . . . . . . . . . . . . 5 Get Web support. . . . . . . . . . . . . . . . . . . . . . . . . . . . . . . . . . . . . . . . . . . . . . . . . . . 6 Get training . . . . . . . . . . . . . . . . . . . . . . . . . . . . . . . . . . . . . . . . . . . . . . . . . . . . . . . 6 Get consulting services. . . . . . . . . . . . . . . . . . . . . . . . . . . . . . . . . . . . . . . . . . . . . . 6 Contact us . . . . . . . . . . . . . . . . . . . . . . . . . . . . . . . . . . . . . . . . . . . . . . . . . . . . . . . . 6
2 • Introduction to Simulation |
7 |
Simulation defined . . . . . . . . . . . . . . . . . . . . . . . . . . . . . . . . . . . . . . . . . . . . . . . . . . . . . 7 Systems and models . . . . . . . . . . . . . . . . . . . . . . . . . . . . . . . . . . . . . . . . . . . . . . . . . . . . 7 Advantages of simulation. . . . . . . . . . . . . . . . . . . . . . . . . . . . . . . . . . . . . . . . . . . . . . . . 9 The simulation process. . . . . . . . . . . . . . . . . . . . . . . . . . . . . . . . . . . . . . . . . . . . . . . . . 10 Problem definition and project planning . . . . . . . . . . . . . . . . . . . . . . . . . . . . . . . . . . . 11 Style definition and model formulation . . . . . . . . . . . . . . . . . . . . . . . . . . . . . . . . . . . . 13 Experimental design. . . . . . . . . . . . . . . . . . . . . . . . . . . . . . . . . . . . . . . . . . . . . . . . . . . 14 Input data . . . . . . . . . . . . . . . . . . . . . . . . . . . . . . . . . . . . . . . . . . . . . . . . . . . . . . . . . . . 15 Verification and validation. . . . . . . . . . . . . . . . . . . . . . . . . . . . . . . . . . . . . . . . . . . . . . 16 Documentation and implementation . . . . . . . . . . . . . . . . . . . . . . . . . . . . . . . . . . . . . . 18 References . . . . . . . . . . . . . . . . . . . . . . . . . . . . . . . . . . . . . . . . . . . . . . . . . . . . . . . . . . 18
3 • General Concepts |
19 |
Overview . . . . . . . . . . . . . . . . . . . . . . . . . . . . . . . . . . . . . . . . . . . . . . . . . . . . . . . . . . . 19 Planning horizon . . . . . . . . . . . . . . . . . . . . . . . . . . . . . . . . . . . . . . . . . . . . . . . . . . . . . 20 Timeslots . . . . . . . . . . . . . . . . . . . . . . . . . . . . . . . . . . . . . . . . . . . . . . . . . . . . . . . . . . . 20 Contact types . . . . . . . . . . . . . . . . . . . . . . . . . . . . . . . . . . . . . . . . . . . . . . . . . . . . . . . . 21 Data sources . . . . . . . . . . . . . . . . . . . . . . . . . . . . . . . . . . . . . . . . . . . . . . . . . . . . . 21
iii
• • • • •
ARENA CONTACT CENTER EDITION USER’S GUIDE
Arrival pattern . . . . . . . . . . . . . . . . . . . . . . . . . . . . . . . . . . . . . . . . . . . . . . . . . . . . . . . 21 Data sources . . . . . . . . . . . . . . . . . . . . . . . . . . . . . . . . . . . . . . . . . . . . . . . . . . . . . 21 Trunk Groups . . . . . . . . . . . . . . . . . . . . . . . . . . . . . . . . . . . . . . . . . . . . . . . . . . . . . . . . 22 Data sources . . . . . . . . . . . . . . . . . . . . . . . . . . . . . . . . . . . . . . . . . . . . . . . . . . . . . 22 Routing Scripts. . . . . . . . . . . . . . . . . . . . . . . . . . . . . . . . . . . . . . . . . . . . . . . . . . . . . . . 22 Data sources . . . . . . . . . . . . . . . . . . . . . . . . . . . . . . . . . . . . . . . . . . . . . . . . . . . . . 22 Agent Skill Sets . . . . . . . . . . . . . . . . . . . . . . . . . . . . . . . . . . . . . . . . . . . . . . . . . . . . . . 23 Data sources . . . . . . . . . . . . . . . . . . . . . . . . . . . . . . . . . . . . . . . . . . . . . . . . . . . . . 23 Schedules . . . . . . . . . . . . . . . . . . . . . . . . . . . . . . . . . . . . . . . . . . . . . . . . . . . . . . . . . . . 23 Data sources . . . . . . . . . . . . . . . . . . . . . . . . . . . . . . . . . . . . . . . . . . . . . . . . . . . . . 23 Agent Groups . . . . . . . . . . . . . . . . . . . . . . . . . . . . . . . . . . . . . . . . . . . . . . . . . . . . . . . . 23 Data sources . . . . . . . . . . . . . . . . . . . . . . . . . . . . . . . . . . . . . . . . . . . . . . . . . . . . . 24 Parent Groups. . . . . . . . . . . . . . . . . . . . . . . . . . . . . . . . . . . . . . . . . . . . . . . . . . . . . . . . 24 Data sources . . . . . . . . . . . . . . . . . . . . . . . . . . . . . . . . . . . . . . . . . . . . . . . . . . . . . 24 Queues . . . . . . . . . . . . . . . . . . . . . . . . . . . . . . . . . . . . . . . . . . . . . . . . . . . . . . . . . . . . . 24 Animation. . . . . . . . . . . . . . . . . . . . . . . . . . . . . . . . . . . . . . . . . . . . . . . . . . . . . . . . . . . 24 Performance measures/reporting . . . . . . . . . . . . . . . . . . . . . . . . . . . . . . . . . . . . . . . . . 24
4 • Features |
27 |
Different stages in the contact life span . . . . . . . . . . . . . . . . . . . . . . . . . . . . . . . . . . . . 27 Contact arrival (required) . . . . . . . . . . . . . . . . . . . . . . . . . . . . . . . . . . . . . . . . . . . 28 Blocked contacts (required) . . . . . . . . . . . . . . . . . . . . . . . . . . . . . . . . . . . . . . . . . 28 Offered contacts (required). . . . . . . . . . . . . . . . . . . . . . . . . . . . . . . . . . . . . . . . . . 29 Abandoned contacts (optional). . . . . . . . . . . . . . . . . . . . . . . . . . . . . . . . . . . . . . . 29 Disconnected contacts (optional) . . . . . . . . . . . . . . . . . . . . . . . . . . . . . . . . . . . . . 29 Contacts leaving messages (optional). . . . . . . . . . . . . . . . . . . . . . . . . . . . . . . . . . 30 Handled contacts (required) . . . . . . . . . . . . . . . . . . . . . . . . . . . . . . . . . . . . . . . . . 30 Talk time (required) . . . . . . . . . . . . . . . . . . . . . . . . . . . . . . . . . . . . . . . . . . . . . . . 31 Conference (optional) . . . . . . . . . . . . . . . . . . . . . . . . . . . . . . . . . . . . . . . . . . . . . . 31 Transfer (optional) . . . . . . . . . . . . . . . . . . . . . . . . . . . . . . . . . . . . . . . . . . . . . . . . 32 After-contact work (optional). . . . . . . . . . . . . . . . . . . . . . . . . . . . . . . . . . . . . . . . 32 Contact back (optional) . . . . . . . . . . . . . . . . . . . . . . . . . . . . . . . . . . . . . . . . . . . . 33
Queue behavior . . . . . . . . . . . . . . . . . . . . . . . . . . . . . . . . . . . . . . . . . . . . . . . . . . . . . . 33 Queue construction . . . . . . . . . . . . . . . . . . . . . . . . . . . . . . . . . . . . . . . . . . . . . . . . 34 Queue ranking. . . . . . . . . . . . . . . . . . . . . . . . . . . . . . . . . . . . . . . . . . . . . . . . . . . . 34 Agent selection . . . . . . . . . . . . . . . . . . . . . . . . . . . . . . . . . . . . . . . . . . . . . . . . . . . 35 Skill-based routing . . . . . . . . . . . . . . . . . . . . . . . . . . . . . . . . . . . . . . . . . . . . . . . . 36
Routing script construction . . . . . . . . . . . . . . . . . . . . . . . . . . . . . . . . . . . . . . . . . . . . . 36 Begin Script . . . . . . . . . . . . . . . . . . . . . . . . . . . . . . . . . . . . . . . . . . . . . . . . . . . . . 36 Queue for Agent . . . . . . . . . . . . . . . . . . . . . . . . . . . . . . . . . . . . . . . . . . . . . . . . . . 36 Remove from Queue. . . . . . . . . . . . . . . . . . . . . . . . . . . . . . . . . . . . . . . . . . . . . . . 37
iv
CONTENTS
Wait . . . . . . . . . . . . . . . . . . . . . . . . . . . . . . . . . . . . . . . . . . . . . . . . . . . . . . . . . . . 37 Priority . . . . . . . . . . . . . . . . . . . . . . . . . . . . . . . . . . . . . . . . . . . . . . . . . . . . . . . . . 37 Message . . . . . . . . . . . . . . . . . . . . . . . . . . . . . . . . . . . . . . . . . . . . . . . . . . . . . . . . 37 Disconnect . . . . . . . . . . . . . . . . . . . . . . . . . . . . . . . . . . . . . . . . . . . . . . . . . . . . . . 37 Overflow. . . . . . . . . . . . . . . . . . . . . . . . . . . . . . . . . . . . . . . . . . . . . . . . . . . . . . . . 37 Transfer to Script . . . . . . . . . . . . . . . . . . . . . . . . . . . . . . . . . . . . . . . . . . . . . . . . . 37 Transfer to Agent . . . . . . . . . . . . . . . . . . . . . . . . . . . . . . . . . . . . . . . . . . . . . . . . . 38 Conference . . . . . . . . . . . . . . . . . . . . . . . . . . . . . . . . . . . . . . . . . . . . . . . . . . . . . . 38 Branch. . . . . . . . . . . . . . . . . . . . . . . . . . . . . . . . . . . . . . . . . . . . . . . . . . . . . . . . . . 38 Assignment . . . . . . . . . . . . . . . . . . . . . . . . . . . . . . . . . . . . . . . . . . . . . . . . . . . . . . 38 End Script . . . . . . . . . . . . . . . . . . . . . . . . . . . . . . . . . . . . . . . . . . . . . . . . . . . . . . . 38
Costing . . . . . . . . . . . . . . . . . . . . . . . . . . . . . . . . . . . . . . . . . . . . . . . . . . . . . . . . . . . . . 38 Agent costs . . . . . . . . . . . . . . . . . . . . . . . . . . . . . . . . . . . . . . . . . . . . . . . . . . . . . . 38 Trunk costs . . . . . . . . . . . . . . . . . . . . . . . . . . . . . . . . . . . . . . . . . . . . . . . . . . . . . . 39 Miscellaneous features . . . . . . . . . . . . . . . . . . . . . . . . . . . . . . . . . . . . . . . . . . . . . . . . . 39 Pattern entry . . . . . . . . . . . . . . . . . . . . . . . . . . . . . . . . . . . . . . . . . . . . . . . . . . . . . 39 Agent states. . . . . . . . . . . . . . . . . . . . . . . . . . . . . . . . . . . . . . . . . . . . . . . . . . . . . . 39 Individual agents. . . . . . . . . . . . . . . . . . . . . . . . . . . . . . . . . . . . . . . . . . . . . . . . . . 39 Advanced configuration agents . . . . . . . . . . . . . . . . . . . . . . . . . . . . . . . . . . . . . . 39
5 • Getting Started |
41 |
Introduction . . . . . . . . . . . . . . . . . . . . . . . . . . . . . . . . . . . . . . . . . . . . . . . . . . . . . . . . . 41 Loading and running an existing example . . . . . . . . . . . . . . . . . . . . . . . . . . . . . . . . . . 41 General modeling skills and concepts . . . . . . . . . . . . . . . . . . . . . . . . . . . . . . . . . . . . . 42 Panels and modules . . . . . . . . . . . . . . . . . . . . . . . . . . . . . . . . . . . . . . . . . . . . . . . 42 Names . . . . . . . . . . . . . . . . . . . . . . . . . . . . . . . . . . . . . . . . . . . . . . . . . . . . . . . . . . 42 Lists . . . . . . . . . . . . . . . . . . . . . . . . . . . . . . . . . . . . . . . . . . . . . . . . . . . . . . . . . . . 43 Module copy and paste . . . . . . . . . . . . . . . . . . . . . . . . . . . . . . . . . . . . . . . . . . . . . 43 Repeat group duplication . . . . . . . . . . . . . . . . . . . . . . . . . . . . . . . . . . . . . . . . . . . 43 Disable animation . . . . . . . . . . . . . . . . . . . . . . . . . . . . . . . . . . . . . . . . . . . . . . . . . 43 Building an Arena Contact Center Edition model . . . . . . . . . . . . . . . . . . . . . . . . . . . . 43 Defining the business application. . . . . . . . . . . . . . . . . . . . . . . . . . . . . . . . . . . . . 44 Model overview . . . . . . . . . . . . . . . . . . . . . . . . . . . . . . . . . . . . . . . . . . . . . . . . . . 44 Model construction . . . . . . . . . . . . . . . . . . . . . . . . . . . . . . . . . . . . . . . . . . . . . . . . 44 Running the model . . . . . . . . . . . . . . . . . . . . . . . . . . . . . . . . . . . . . . . . . . . . . . . . . . . . 56 Conclusions . . . . . . . . . . . . . . . . . . . . . . . . . . . . . . . . . . . . . . . . . . . . . . . . . . . . . . . . . 56
6 • The Contact Data Panel |
59 |
Configuration module . . . . . . . . . . . . . . . . . . . . . . . . . . . . . . . . . . . . . . . . . . . . . . . . . 60 Schedule module . . . . . . . . . . . . . . . . . . . . . . . . . . . . . . . . . . . . . . . . . . . . . . . . . . . . . 63 Pattern module . . . . . . . . . . . . . . . . . . . . . . . . . . . . . . . . . . . . . . . . . . . . . . . . . . . . . . . 68
• • • • •
v
• • • • •
ARENA CONTACT CENTER EDITION USER’S GUIDE
Agent module . . . . . . . . . . . . . . . . . . . . . . . . . . . . . . . . . . . . . . . . . . . . . . . . . . . . . . . . 71 Contact module . . . . . . . . . . . . . . . . . . . . . . . . . . . . . . . . . . . . . . . . . . . . . . . . . . . . . . 78 Animate module . . . . . . . . . . . . . . . . . . . . . . . . . . . . . . . . . . . . . . . . . . . . . . . . . . . . . . 86 Report module . . . . . . . . . . . . . . . . . . . . . . . . . . . . . . . . . . . . . . . . . . . . . . . . . . . . . . . 94
7 • The Script Panel |
99 |
Begin Script module. . . . . . . . . . . . . . . . . . . . . . . . . . . . . . . . . . . . . . . . . . . . . . . . . . . 99 Queue for Agent module . . . . . . . . . . . . . . . . . . . . . . . . . . . . . . . . . . . . . . . . . . . . . . 101 Remove from Queue module . . . . . . . . . . . . . . . . . . . . . . . . . . . . . . . . . . . . . . . . . . . 103 Wait module . . . . . . . . . . . . . . . . . . . . . . . . . . . . . . . . . . . . . . . . . . . . . . . . . . . . . . . . 104 Priority module. . . . . . . . . . . . . . . . . . . . . . . . . . . . . . . . . . . . . . . . . . . . . . . . . . . . . . 105 Message module. . . . . . . . . . . . . . . . . . . . . . . . . . . . . . . . . . . . . . . . . . . . . . . . . . . . . 106 Disconnect module. . . . . . . . . . . . . . . . . . . . . . . . . . . . . . . . . . . . . . . . . . . . . . . . . . . 108 Overflow module . . . . . . . . . . . . . . . . . . . . . . . . . . . . . . . . . . . . . . . . . . . . . . . . . . . . 109 Transfer to Script module. . . . . . . . . . . . . . . . . . . . . . . . . . . . . . . . . . . . . . . . . . . . . . 110 Transfer to Agent module . . . . . . . . . . . . . . . . . . . . . . . . . . . . . . . . . . . . . . . . . . . . . 111 Conference module . . . . . . . . . . . . . . . . . . . . . . . . . . . . . . . . . . . . . . . . . . . . . . . . . . 112 Branch module . . . . . . . . . . . . . . . . . . . . . . . . . . . . . . . . . . . . . . . . . . . . . . . . . . . . . . 114 Assignment module . . . . . . . . . . . . . . . . . . . . . . . . . . . . . . . . . . . . . . . . . . . . . . . . . . 118 End Script module . . . . . . . . . . . . . . . . . . . . . . . . . . . . . . . . . . . . . . . . . . . . . . . . . . . 119 Script restrictions . . . . . . . . . . . . . . . . . . . . . . . . . . . . . . . . . . . . . . . . . . . . . . . . . . . . 120 Arena Contact Center Edition script examples . . . . . . . . . . . . . . . . . . . . . . . . . . . . . 120
8 • Reports |
123 |
Agents and Trunks report. . . . . . . . . . . . . . . . . . . . . . . . . . . . . . . . . . . . . . . . . . . . . . 124 Trunk Summary . . . . . . . . . . . . . . . . . . . . . . . . . . . . . . . . . . . . . . . . . . . . . . . . . 124 Agent Summary . . . . . . . . . . . . . . . . . . . . . . . . . . . . . . . . . . . . . . . . . . . . . . . . . 124 Example . . . . . . . . . . . . . . . . . . . . . . . . . . . . . . . . . . . . . . . . . . . . . . . . . . . . . . . 125 Contact Times and Counts report. . . . . . . . . . . . . . . . . . . . . . . . . . . . . . . . . . . . . . . . 125 Contact Times. . . . . . . . . . . . . . . . . . . . . . . . . . . . . . . . . . . . . . . . . . . . . . . . . . . 125 Contact Counts . . . . . . . . . . . . . . . . . . . . . . . . . . . . . . . . . . . . . . . . . . . . . . . . . . 126 Other Contact Data . . . . . . . . . . . . . . . . . . . . . . . . . . . . . . . . . . . . . . . . . . . . . . . 127 Contact Count Statistics report. . . . . . . . . . . . . . . . . . . . . . . . . . . . . . . . . . . . . . . . . . 128 Contact Time Statistics report . . . . . . . . . . . . . . . . . . . . . . . . . . . . . . . . . . . . . . . . . . 129 Agent Group Utilization report . . . . . . . . . . . . . . . . . . . . . . . . . . . . . . . . . . . . . . . . . 131 Parent Group Utilization report . . . . . . . . . . . . . . . . . . . . . . . . . . . . . . . . . . . . . . . . . 132 Trunk Group Utilization report . . . . . . . . . . . . . . . . . . . . . . . . . . . . . . . . . . . . . . . . . 134 Overflow Count Statistics report . . . . . . . . . . . . . . . . . . . . . . . . . . . . . . . . . . . . . . . . 135
vi
CONTENTS
• • • • •
9 • Case Studies |
137 |
Purposes of cases and examples. . . . . . . . . . . . . . . . . . . . . . . . . . . . . . . . . . . . . . . . . 137 Example 1—Bilingual Contact Center model . . . . . . . . . . . . . . . . . . . . . . . . . . . . . . 137 Overview and business objective . . . . . . . . . . . . . . . . . . . . . . . . . . . . . . . . . . . . 137 Key modeling techniques illustrated in this example. . . . . . . . . . . . . . . . . . . . . 137 The data detail for the Bilingual Contact Center example . . . . . . . . . . . . . . . . . 139 Example 2—Bank model . . . . . . . . . . . . . . . . . . . . . . . . . . . . . . . . . . . . . . . . . . . . . . 144 Overview and business objective . . . . . . . . . . . . . . . . . . . . . . . . . . . . . . . . . . . . 144 Key modeling techniques illustrated in this example. . . . . . . . . . . . . . . . . . . . . 145 The data detail for the Bank example. . . . . . . . . . . . . . . . . . . . . . . . . . . . . . . . . 147 Example 3—Skill-based Routing model . . . . . . . . . . . . . . . . . . . . . . . . . . . . . . . . . . 153 Key modeling techniques illustrated in this example. . . . . . . . . . . . . . . . . . . . . 153 The data detail for the Skill-based Routing example . . . . . . . . . . . . . . . . . . . . . 154 Example 4—Premium Service model . . . . . . . . . . . . . . . . . . . . . . . . . . . . . . . . . . . . 159 Overview and business objective . . . . . . . . . . . . . . . . . . . . . . . . . . . . . . . . . . . . 159 Key modeling techniques illustrated in this example. . . . . . . . . . . . . . . . . . . . . 159 The data detail for the Premium Service example . . . . . . . . . . . . . . . . . . . . . . . 161 Example 5—Teamwork model . . . . . . . . . . . . . . . . . . . . . . . . . . . . . . . . . . . . . . . . . 167 The data detail for the Teamwork example . . . . . . . . . . . . . . . . . . . . . . . . . . . . 168 Example 6—Multi-site model . . . . . . . . . . . . . . . . . . . . . . . . . . . . . . . . . . . . . . . . . . 176 Overview and business objective . . . . . . . . . . . . . . . . . . . . . . . . . . . . . . . . . . . . 176 Key modeling techniques illustrated in this example. . . . . . . . . . . . . . . . . . . . . 177 The data detail for the Multi-site example . . . . . . . . . . . . . . . . . . . . . . . . . . . . . 177 Other examples. . . . . . . . . . . . . . . . . . . . . . . . . . . . . . . . . . . . . . . . . . . . . . . . . . . . . . 185 Outbound/blend examples . . . . . . . . . . . . . . . . . . . . . . . . . . . . . . . . . . . . . . . . . 185
A • Reserved Words |
187 |
B • Reports |
189 |
Index |
193 |
vii
• • • • •
ARENA CONTACT CENTER EDITION USER’S GUIDE
viii

1 Welcome to Arena Contact Center Edition
What is Arena Contact Center Edition?
Arena Contact Center Edition is a simulation system developed by Rockwell Automation, Inc. for the performance analysis of contact centers. It is built on Rockwell Automation’s Arena simulation system and has been customized to enable its users to build and run simulation models of contact center operations quickly and easily and to analyze the results that these models produce.
Intended audience
Arena Contact Center Edition is designed for contact center managers and analysts and industrial or systems engineers. It is typically deployed as an enterprise business analysis and productivity tool.
We assume that you are familiar with the basic concepts and terms used in these types of systems. You are interested in improving business productivity and are responsible for evaluating and predicting the impact of proposed strategic and tactical changes to help improve performance. A familiarity with computers and the Microsoft® Windows® operating system is assumed. A familiarity with the concepts and terms used in simulation is also helpful.
Simulation of contact centers
For contact center managers and analysts, their planning problems are far easier to describe than to model or to solve.
“I’ve got my staffing budget for the next fiscal year, but I don’t know how many people I need to make service levels, what shifts to hire for, or what skills to train my workers on.”
“Service levels look pretty good right now, but our peak season is coming up. What I don’t know is how badly our service levels and abandonment rates will suffer if our forecasts turn out to be too low.”
“Our service levels are in bad shape. We are considering either hiring an outsourcer to help share the handling load or extending our hours. I wish I knew where to get the most bang for the buck.”
“My telecomm guy has a new set of routing scripts to make use of some of our advanced phone switch capabilities. I wonder how this is going to impact our average speed of answer and our staff utilization.”
Welcome • 1
1
• • • • •
ARENA CONTACT CENTER EDITION USER’S GUIDE
“Marketing has come up with a new program giving our ‘preferred customers’ a special priority when they contact us with questions. What I’m worried about is how this new program will affect the waiting times that the rest of our customers experience.”
“We’ve been asked to provide telephone service and support for another business unit. They’re asking us how much staff we need to hire or cross-train in order to handle this increased load.”
Contact center managers have traditionally attacked these types of problems with several methods, including “gut feel” estimates, back-of-the-envelope calculations, elaborate spreadsheets, and analytical queueing formulas such as Erlang C. Each of these approaches, however, has significant limitations when applied to contact centers and contact center networks.
Simulation is the only analysis method that can effectively and accurately model a contact center (or a network of contact centers). Such models can be used to study the performance of the system. The simulation method is based on creating a computerized “copy” of the actual contact center system and running this system on the computer for a period of time representing a day, a week, or a month.
In particular, simulation explicitly models the interaction between contacts (e.g., calls or email), routes, and agents, as well as the randomness of individual contact arrivals and handle times.
By using simulation, managers and analysts translate contact center data (forecasts, contact-routing vectors, contact-handle time distributions, agent schedules, agent skills, etc.) into actionable information about service levels, customer abandonment, agent utilization, first-contact resolution, and other important contact center performance measures. These results are used to support key management decisions that drive contact center operations and expenditures.
2
1 • WELCOME TO ARENA CONTACT CENTER EDITION
• • • • •
Agent Population
Agent
(# of Agents, Skills, Priorities,
(# of Agents, Skills,
Shifts, Breaks )
Shifts, Breaks )
RoutingScripts
Scripts
(By ContactName)
(By Name)
Contact Center |
|
Contact Center |
Contact Center |
|
Contact Center |
Simulation |
|
Performance |
|
||
Model |
|
Statistics |
Model |
|
Call-Volume Forecasts
Call-Volume
(By Contact Name, Time Slots)
(By Contact Name, Time Slots)
Center |
Data |
CenterConfiguration Data |
|
(Hours of |
|
(Hours ofOperation, |
|
Trunk Line |
etc.) |
Trunk LineCapacity, etc.)
Welcome • 1
Arena Contact Center Edition: A custom-designed simulation system for contact centers
The successful use of simulation in many contact center environments led to the development of Arena Contact Center Edition. It was developed by Rockwell Automation in partnership with Onward, a management consulting firm based in Mountain View, California, specializing in contact center operations.
In conjunction with a team of contact center managers and analysts from many different types of business environments, Rockwell Automation and Onward have designed Arena Contact Center Edition to:
1.Make it easy for analysts to build accurate and detailed simulation models of contact centers, ranging from fairly simple to very complex, without extensive simulation or management science training.
2.Support a process of managing input data into these contact center simulation models that is as easy and sensible as possible.
3.Have the capacity to deliver real-time statistics, animation, and output statistics that provide insight into key contact center performance measures.
4.Use standard contact center terminology wherever possible to make the model building and usage process as intuitive as possible for contact center professionals.
3
• • • • •
ARENA CONTACT CENTER EDITION USER’S GUIDE
Arena Contact Center Edition is a Microsoft® Windows® operating system-based simulation system. It is one of a family of application solution templates (ASTs) built on top of the Arena simulation system, leveraging Arena’s development environment to create a focused and easy-to-use tool for contact center managers and analysts.
Where can I go for help?
Our commitment to your success starts with the suite of learning aids and assistance we provide for Arena. Whether you’re new to simulation or a seasoned veteran putting a new tool to use, you’ll quickly feel at home with the Arena Contact Center Edition.
Reference the user’s guides
The documentation set includes this manual, Arena Contact Center Edition User’s Guide, which cover the product basics; the Arena User’s Guide, which covers the standard product modules and offers an easy, “click-by-click” tutorial; and the Variables Guide, a separate reference booklet providing complete descriptions of Arena variables found in the Arena product templates.
DOCUMENT CONVENTIONS
Throughout the guides, a number of style conventions are used to help identify material. New terms and concepts may be emphasized by use of italics or bold; file menu paths are in bold with a (>) separating the entries (e.g., go to Help > Arena Help); text you are asked to type is shown in Courier Bold (e.g., in this field, type Work Week), and dialog and window button names are shown in bold (e.g., click OK).
Explore our examples
Arena is accompanied by a number of sample models that illustrate many of the commonly used approaches for capturing the essence of manufacturing processes. Examples are provided for both job shop and flow shop environments. For a description of and list of Arena’s examples, go to Help > Arena Help. On the Contents tab, choose
Model Building Basics, and then select Viewing Arena Example Models.
Get help
Online help is always at your fingertips! Arena incorporates the latest in help features, including What’s This? help that displays a brief description of fields in dialogs, contextsensitive help on menu and toolbar buttons, and a help button on each of Arena’s modules. Just refer to the Arena help table of contents and index for a list of all help topics.
4

|
• |
1 • WELCOME TO ARENA CONTACT CENTER EDITION |
• |
• |
|
|
• |
|
• |
Use the SMARTs library
As you craft models of your own manufacturing processes, use our SMARTs library to explore how to best use Arena. This suite of tutorial models covers topics ranging from modeling resources to animation techniques. The library is organized into categories to help you find the right model with ease. When you’re wondering how to take the next step in your model, browse the SMARTs library for a ready-made solution. For a list of categories and their related SMARTS, go to Help > Arena Help. On the Contents tab, first click Model Building Basics, and then Learning Arena with SMART Files.
Access the Arena Symbol Factory
Arena animations can be enhanced using Arena Symbol Factory’s extensive library of symbols. These symbols can be used for entity, resource, transporter or global pictures; or as graphic symbols within a model window. You can copy these symbols directly to the Arena model window, add them to your own libraries (.plb files), or add them to any of the Arena picture library files.
Get phone support
Rockwell Automation provides full support for the entire Arena family of products. Questions concerning installation, how modules work, the use of the model editor, and the use of the software are handled by technical support.
ARENA TECHNICAL SUPPORT INCLUDES:
(for users on active maintenance) a technical support hotline and e-mail address staffed by full-time, experienced professionals
help with installation problems or questions related to the software’s requirements
troubleshooting
limited support regarding the interaction of Arena with other programs
support of the Arena Object Model, which is used in Microsoft Visual Basic for Applications.
If you call the support line (1.440.646.3434), you should be at your computer and be prepared to give the following information:
the product serial number
the product version number
the operating system you are using
the exact wording of any messages that appeared on your screen
a description of what happened and what you were doing when the problem occurred
a description of how you tried to solve the problem.
Welcome • 1
5
• • • • •
ARENA CONTACT CENTER EDITION USER’S GUIDE
Get Web support
In addition to phone support, the Rockwell Automation Customer Support Center offers extensive online knowledgebases of tech notes and frequently asked questions for support of non-urgent issues. These databases are updated daily by our support specialists.
To receive regular e-mail messages with links to the latest tech notes, software updates, and firmware updates for the products that are of interest to you or to submit an online support request, register through http://support.rockwellautomation.com/.
And be sure to check the Arena User Zone section of our Web site at www.ArenaSimulation.com. The User Zone links to a peer-to-peer forum on Arena topics and has a link to a download page where you can check for possible software updates (patches). If you can’t find the answer you need, contact your local representative or Arena technical support.
Get training
Do you need training? Rockwell Automation offers a standard training course comprised of lecture and hands-on workshops designed to introduce you to the fundamental concepts of modeling with Arena.
We also offer customized training courses designed to meet your specific needs. These courses can be held in our offices or yours, and we can accommodate one person or twenty. You design the course that’s right for you! Simply contact our consulting services group to discuss how we can help you achieve success in your simulation efforts.
Get consulting services
Rockwell Automation provides expert consulting and turnkey implementation of the entire Arena product suite. Please contact your local representative for more information.
Contact us
We strive to help all of our customers become successful in their manufacturing improvement efforts. Toward this objective, we invite you to contact your local representative or Rockwell Automation at any time that we may be of service to you.
Support E-mail: Arena-Support@ra.rockwell.com
Corporate E-mail: Arena-Info@ra.rockwell.com
Support phone: 1.440.646.3434
URL: www.ArenaSimulation.com
URL: www.rockwellautomation.com
6

2 Introduction to Simulation
This chapter contains excerpts from the simulation textbook written by C. Dennis Pegden, Randall P. Sadowski, and Robert E. Shannon entitled Introduction to Simulation Using SIMAN, Second Edition (McGraw-Hill, 1995).
Simulation defined
Simulation is one of the most powerful analysis tools available to those responsible for the design, analysis, and operation of complex processes or systems. In an increasingly competitive world, simulation has become a very powerful tool for the planning, design, and control of systems. It is viewed today as an indispensable problem-solving methodology for engineers, designers, and managers.
To simulate, according to Webster’s Collegiate Dictionary, is “to feign, to obtain the essence of, without the reality.” According to Schriber [1987], “Simulation involves the modeling of a process or system in such a way that the model mimics the response of the actual system to events that take place over time.” We will define simulation as the process of designing a model of a real system and conducting experiments with this model for the purpose of understanding the behavior of the system and/or evaluating various strategies for the operation of the system. We consider simulation to include both the construction of the model and the experimental use of the model for studying a problem. Thus, you can think of simulation modeling as an experimental and applied methodology that seeks to accomplish the following:
describe the behavior of systems,
construct theories or hypotheses that account for the observed behavior, and
use the model to predict future behavior; i.e., the effects produced by changes in the system or in its method of operation.
The terms “model” and “system” are key components of our definition of simulation. By model, we mean a representation of a group of objects or ideas in some form other than that of the entity itself. By system, we mean a group or collection of interrelated elements that cooperate to accomplish some stated objective. We can simulate systems that already exist and those that can be brought into existence; i.e., those in the preliminary or planning stage of development.
Systems and models
The conceptualization and development of models have played a vital part in our intellectual activity ever since we began to try to understand and manipulate our environment. People have always used the idea of models to attempt to represent and
Simulation to Introduction • 2
7
• • • • •
ARENA CONTACT CENTER EDITION USER’S GUIDE
express ideas and objects. Historically, modeling has taken many forms: from communicating through wall paintings to writing complex systems of mathematical equations for the flight of a rocket through outer space. As a matter of fact, the progress and history of science and engineering are reflected most accurately in the progress of our ability to develop and use models.
One of the major elements required in attacking any problem is the construction and use of a model. We use models because we want to learn something about some real system that we cannot observe or experiment with directly—either because the system does not yet exist, or because it is too difficult to manipulate. A carefully conceived model can strip away the complexity, leaving only that which the analyst finds important. Such a model can take many forms, but one of the most useful—and certainly the most often used—is simulation.
Likewise, the concept of systems plays a critical role in our modern view of the world. The fundamental idea of thinking about the world in terms of systems and trying to take the systems approach to attacking problems has become so ingrained in contemporary practice that we tend to take it for granted. The systems approach tries to consider total system performance rather than simply concentrating on the parts [Weinberg, 1975]; it is based on our recognition that, even if each element or subsystem is optimized from a design or operational viewpoint, overall performance of the system may be suboptimal because of interactions among the parts. The increasing complexity of modern systems and the need to cope with this complexity underscore the need for engineers and managers to adopt a systems approach to thinking.
Although complex systems and their environments are objective (i.e., they exist), they are also subjective (i.e., the particular selection of included (and excluded) elements and their configuration is dictated by the problem solver). Different analyses of the same objective process or phenomenon can conceptualize it into very different systems and environments. For example, a telecommunications engineer may think of a contact center system as a collection of trunk lines and routing scripts. The contact center director, however, is more likely to view the system as the combination of phone lines, scripts, contacts, agents, and schedules. The vice president in charge of contact center operations may see the system as the collection of all the centers her company runs/along with all outsourcers under contract. Hence, several different conceptualizations of any particular real-world system— and thereby several different models—can simultaneously exist.
System elements are the components, parts, and subsystems that perform a function or process. The relationships among these elements and the manner in which they interact determine how the overall system behaves and how well it fulfills its overall purpose.
Therefore, the first step in creating any model is to specify its purpose. There is no such thing as the model of a system: we can model any system in numerous ways, depending on what we wish to accomplish. Both the elements and the relationships included must be
8

|
• |
2 • INTRODUCTION TO SIMULATION |
• |
• |
|
|
• |
|
• |
chosen to achieve a specific purpose. The model developed should be as simple as the stated purpose will allow.
The types of simulations of interest here are those used to develop an understanding of the performance of a system over time. We typically use simulation models to help us explain, understand, or improve a system. To be effective, simulation must concentrate on some previously defined problem (otherwise, we do not know what elements to include in the model or what information to generate and collect). We typically use models to predict and compare—that is, to provide a logical way of forecasting the outcomes that follow alternative actions or decisions and (we hope) to indicate a preference among them. Although this use of models is important, it is by no means its only purpose. Model building also provides a systematic, explicit, and efficient way to focus judgment and intuition. Furthermore, by introducing a precise framework, a simulation model can effectively communicate system configuration and assist the thought process.
Advantages of simulation
Because its basic concept is easy to comprehend, a simulation model is often easier to justify to management or customers than some of the analytical models. In addition, simulation might have more credibility because its behavior has been compared to that of the real system or because it has required fewer simplifying assumptions and thereby has captured more of the true characteristics of the real system.
Virtually all simulation models are so-called input-output models; that is, they yield the output of the system for a given input. Simulation models are therefore “run” rather than “solved.” They cannot generate an optimal solution on their own as analytical models can; they can only serve as tools for the analysis of system behavior under specified conditions. (The exception is a simulation model used to find the optimum values for a set of control variables under a given set of inputs.)
We have defined simulation as experimentation with a model of the real system. An experimental problem arises when a need develops for specific system information that isn’t available from known sources. The following list describes some of the benefits associated with simulation.
In a contact center, the impact of new types of contacts, new agent schedules, modified contact priorities, contact volumes, and other key inputs can be explored without disrupting ongoing operations.
New routing scripts or transfer logic can be tested before committing resources to implementation.
Hypotheses about how or why certain phenomena occur can be tested for feasibility.
Time can be controlled: it can be compressed, expanded, etc., allowing us to speed up or slow down a phenomenon for study.
Simulation to Introduction • 2
9
• • • • •
ARENA CONTACT CENTER EDITION USER’S GUIDE
Insight can be gained about which variables are most important to performance and how these variables interact.
A simulation study can prove invaluable to understanding how the system really operates as opposed to how everyone thinks it operates.
New situations, about which we have limited knowledge and experience, can be manipulated in order to prepare for theoretical future events. Simulation’s great strength lies in its ability to let us explore “what if” questions.
The simulation process
The essence or purpose of simulation modeling is to help the ultimate decision maker solve a problem. Therefore, to learn to be a good simulation modeler, you must merge good problem-solving techniques with good software engineering practice. The following steps should be taken in every simulation study.
1.Problem Definition. Defining the goals of the study clearly so that we know the purpose; i.e., why are we studying this problem and what questions do we hope to answer? What is the business impact of these answers?
2.Project Planning. Being sure that we have sufficient personnel, management support, computer hardware, and software resources to do the job with a relevant timetable.
3.System Definition. Determining the boundaries and restrictions to be used in defining the system (or process) and investigating how the system works.
4.Conceptual Model Formulation. Developing a preliminary model either graphically (e.g., block diagrams) or in pseudo-code to define the components, descriptive variables, and interactions (logic) that constitute the system.
5.Preliminary Experimental Design. Selecting the measures of effectiveness to be used, the factors to be varied, and the levels of those factors to be investigated; i.e., what data need to be gathered from the model, in what form, and to what extent.
6.Input Data Preparation. Identifying and collecting the input data needed by the model.
7.Model Translation. Formulating the model in an appropriate simulation language or software package such as Arena Contact Center Edition.
8.Verification and Validation. Confirming that the model operates the way the analyst intended (debugging) and that the output of the model is believable and representative of the output of the real system.
10

|
• |
2 • INTRODUCTION TO SIMULATION |
• |
• |
|
|
• |
|
• |
9.Final Experimental Design. Designing an experiment that will yield the desired information and determining how each of the test runs specified in the experimental design is to be executed.
10.Experimentation. Executing the simulation to generate the desired data and to perform a sensitivity analysis.
11.Analysis and Interpretation. Drawing inferences from the data generated by the simulation.
12.Implementation and Documentation. Putting the results to use, recording the findings, and documenting the model and its use.
Problem definition and project planning
It should be obvious that before you can solve a problem you must know what the problem is. (This is sometimes easier said than done.) Experience indicates that beginning a simulation project properly may well make the difference between success and failure. Simulation studies are initiated because a decision maker or group of decision makers face a problem and need a solution. Often the project is initiated by someone who can’t necessarily make the final decision, but who is responsible for making recommendations. In such a case, the results of the study may have to serve two purposes simultaneously: helping the sponsor to formulate the recommendations; and justifying, supporting, and helping to sell those recommendations.
We begin our analysis by collecting enough information and data to provide an adequate understanding of both the problem and the system to be studied. A typical project begins with the description of the situation to be modeled in a general and imprecise way, in terms such as service levels, agent utilization, abandonment rates, or other key system performance measures. We must view the problem description as a set of symptoms requiring diagnosis. We begin, therefore, by diagnosing the symptoms; then we define the problem; and, finally, we formulate a model.
To make that diagnosis, we must become thoroughly familiar with all relevant aspects of the organization’s operations, including influential forces (or factors) outside the organization and the subjective and objective aspects of the problem. Minimally, we should perform the following steps.
1.Identify the primary decision maker(s) and the decision-making process relative to the system being studied.
2.Determine the relevant objectives of each of those responsible for some aspect of the decision.
3.Identify other participants in the final decision (especially those likely to oppose changes in the system) and determine their objectives and vested interests.
Simulation to Introduction • 2
11
• • • • •
ARENA CONTACT CENTER EDITION USER’S GUIDE
4.Determine which aspects of the situation are subject to the control of the decision maker(s) and the range of control that can be exercised.
5.Identify those aspects of the environment or problem context that can affect the outcome of possible solutions but that are beyond the control of the decision maker(s).
An important aspect of the planning phase involves ensuring that we have considered certain factors critical to project success:
Clearly defined goals. Do we know the purpose of the study—i.e., why are we doing it and what do we expect to find?
Sufficient resource allocation. Are we sure that there is sufficient time, personnel, and computer hardware and software available to do the job?
Management support. Has management made its support for the project known to all concerned parties?
Project plans and schedules. Are there detailed plans for carrying out the project? What are the key dates?
Competent project manager and team members. Are we assured of having the necessary skills and knowledge available for successful completion of the project?
Responsiveness to the clients. Have all potential users of the results been consulted and regularly apprised of the project’s progress?
Adequate communication channels. Are we continually concerned that sufficient information is available on project objectives, status, changes, user or client needs, etc., to keep everyone (team members, management, and clients) fully informed as the project progresses?
The major thrust of the planning and orientation period is the determination of the explicit goals or purpose of the simulation project. Simulation experiments are conducted for a wide variety of purposes, including the following:
Evaluation: determining how well a proposed system design performs in an absolute sense when evaluated against specific criteria.
Comparison: comparing several proposed operating policies or procedures or other input scenarios.
Prediction: estimating the performance of the system under some projected set of conditions.
Sensitivity analysis: determining which of many factors affect overall system performance the most.
12
|
• |
2 • INTRODUCTION TO SIMULATION |
• |
• |
|
|
• |
|
• |
Optimization: determining exactly which combination of factor levels produces the best overall system response.
Functional relations: establishing the nature of the relationships among one or more significant factors and the system’s response.
Although not exhaustive, this list identifies the most common simulation goals or purposes. The explicit purpose of the model has significant implications for the entire model-building and experimentation process. For example, if a model’s goal is to evaluate a proposed (or existing) system in an absolute sense, then the model must be accurate; and there must be a high degree of correspondence between the model and the real system. On the other hand, if the goal for a model is the relative comparison of two or more systems or operating procedures, the model can be valid in a relative sense even though the absolute magnitude of responses varies widely from that which would be encountered in the real system. The entire process of designing the model, validating it, designing experiments, and drawing conclusions from the resulting experimentation must be closely tied to the specific purpose of the model. No one should build a model without having an explicit experimental goal in mind. Unfortunately, the analyst does not always understand the real-world problem well enough at first to ask the right questions. Therefore, the model should have an easily modified structure so that additional questions arising from early experimentation can be answered later.
Style definition and model formulation
The essence of the modeling art is abstraction and simplification. We try to identify that small subset of characteristics or features of the system that is sufficient to serve the specific objectives of the study. So, after we have specified the goal or purpose for which the model is to be constructed, we then begin to identify the pertinent components. This process entails itemizing all system components that contribute to the effectiveness or ineffectiveness of its operation. After we have specified a complete list, we determine whether each component should be included in our model; this determination may be difficult because, at this stage of model development, a component’s significance to the overall goal is not always clear. One of the key questions to be answered is whether a particular component should be considered part of the model or part of the outside environment, which is represented as inputs to the model.
In general, we have little difficulty deciding on the output variables. If we have done a good job specifying the goals or purposes of the study, the required output variables become apparent. The real difficulty arises when we try to determine which input and status variables produce the effects observed and which can be manipulated to produce the effects desired.
We also face conflicting objectives. On the one hand, we try to make the model as simple as possible for ease of understanding, ease of formulation, and computational efficiency.
Simulation to Introduction • 2
13
• • • • •
ARENA CONTACT CENTER EDITION USER’S GUIDE
On the other hand, we try to make the model as accurate as possible. Consequently, we must simplify reality—but only to the point where there is no significant loss of accuracy of outputs with respect to the study’s objectives.
We want to design a model of the real system that neither oversimplifies the system to the point where the model becomes trivial (or worse, misleading) nor carries so much detail that it becomes clumsy and prohibitively expensive. The most significant danger lies in having the models become too detailed and including elements that contribute little or nothing to understanding the problem. Frequently, the analyst includes too much detail, rather than too little. The inexperienced tend to try to transfer all the detailed difficulties in the real situation into the model, hoping that the computer will somehow solve the problem.
This approach is unsatisfactory: it increases programming complexity (and the associated costs for longer experimental runs), and it dilutes the truly significant aspects and relationships with trivial details. The definition of the model boundary is usually a tradeoff between accuracy and cost. The greater the degree of detail to be modeled, the more precise and expensive the required input data. Therefore, the model must include only those aspects of the system relevant to the study objectives.
One should always design the model to answer the relevant questions and not to imitate the real system precisely. According to Pareto’s law, in every group or collection of entities there exist a vital few and a trivial many. In fact, 80% of system behavior can be explained by the action of 20% of its components. Nothing really significant happens unless it happens to the significant few. Our problem in designing the simulation model is to ensure that we correctly identify those few vital components and include them in our model.
Once we have tentatively decided which components and variables to include in our model, we must then determine the functional relationships among them. At this point, we are trying to show the logic of the model; i.e., what happens. Usually we use a flowchart or pseudo-code to describe the system as a logical flow diagram.
Experimental design
We have defined simulation as being experimentation via a model to gain information about a real-world process or system. It then follows that we must concern ourselves with the strategic planning of how to design an experiment (or experiments) that will yield the desired information for the lowest cost. The next step, therefore, is to design an experiment that will yield the information needed to fulfill the study’s goal or purpose.
The design of experiments comes into play at two different stages of a simulation study. It first comes into play very early in the study, before the model design has been finalized. As early as possible, we want to select which measures of effectiveness we will use in the study, which factors we will vary, and how many levels of each of those factors we will investigate. By having this fairly detailed idea of the experimental plan at this early stage, we have a better basis for planning the model to generate the desired data efficiently.
14

|
• |
2 • INTRODUCTION TO SIMULATION |
• |
• |
|
|
• |
|
• |
Later, after we have developed the model, verified its correctness, and validated its adequacy, we again need to consider the final strategic and tactical plans for the execution of the experiment(s). We must update project constraints on time (schedule) and costs to reflect current conditions, and we must impose these constraints on the design. Even though we have exercised careful planning and budget control from the beginning of the study, we must now take a hard, realistic look at what resources remain and how best to use them. At this point, we adjust the experimental design to account for remaining resources and for information gained in the process of designing, building, verifying, and validating the model.
The design of a computer simulation experiment is essentially a plan for acquiring a quantity of information by running the simulation model under different sets of input conditions. Design profoundly affects the effective use of experimental resources for two reasons:
The design of the experiment largely determines the form of statistical analysis that can be applied to the results.
The success of the experiment in answering the questions of the experimenter (without excessive expenditure of time and resources) is largely a function of choosing the right design.
We conduct simulation studies primarily to learn the most about the behavior of the system for the lowest possible cost. We must carefully plan and design not only the model but also its use. Thus, experimental designs are economical because they reduce the number of experimental trials required and provide a structure for the investigator’s learning process.
Input data
Stochastic systems contain one or more sources of randomness. The analyst must be concerned about data related to the inputs for the model such as the contact-volume forecasts, contact-arrival patterns, and contact-handle times. Although data gathering is usually interpreted to mean gathering numbers, this interpretation addresses only one aspect of the problem. The analyst must also decide what data is needed, what data is available, whether the data is pertinent, whether existing data is valid for the required purpose, and how to gather the data.
The design of a stochastic simulation model always involves choosing whether to represent a particular aspect of the system as probabilistic or deterministic. If we opt for probabilistic and if empirical data exist, then we must make yet another decision. Will we sample directly from the empirical data, or will we try to fit the data to a theoretical distribution and, if successful, sample from the theoretical distribution? This choice is fundamentally important for several reasons.
Simulation to Introduction • 2
15
• • • • •
ARENA CONTACT CENTER EDITION USER’S GUIDE
First, using raw empirical data implies that we are only simulating the past; by using data from one year, we replicate the performance of that year but not necessarily of future years. When sampling directly from historical data, the only events possible are those that transpired during the period when the data was gathered. It is one thing to assume that the basic form of the distribution will remain unchanged with time; it is quite another to assume that the idiosyncrasies of a particular year will always be repeated.
Second, it is much easier to change certain aspects of the input if theoretical random variate generation is being used; i.e., there is greater flexibility. For example, if we want to determine what happens if inputs increase by 10% per week, we need only increase the mean arrival rate of the theoretical distribution by the required 10%. On the other hand, if we are sampling directly from the empirical data, it is not clear how we increase the contact arrival rate by the required amount.
Third, it is highly desirable to test the sensitivity of the system to changes in the parameters. For example, we may want to know how much the contact arrival rate can increase before system performance deteriorates to an unacceptable degree. Again, sensitivity analysis is easier with theoretical distributions than with sampling directly from empirical data.
The problem is exacerbated when no historical behavioral data exist (either because the system has not yet been built or because the data cannot be gathered). In these cases, we must estimate both the distribution and the parameters based on theoretical considerations.
Verification and validation
After the development of the model is functionally complete, we should ask ourselves a question: Does it work? There are two aspects to this question. First, does it do what the analyst expects it to do? Second, does it do what the user expects it to do? We find the answers to these questions through model verification and validation. Verification seeks to show that the computer program performs as expected and intended, thus providing a correct logical representation of the model. Validation, on the other hand, establishes that model behavior validly represents that of the real-world system being simulated. Both processes involve system testing that demonstrates different aspects of model accuracy.
Verification can be viewed as rigorous debugging with one eye on the model and the other eye on the model requirements. In addition to simply debugging any model development errors, it also examines whether the code reflects the description found in the conceptual model. One of the goals of verification is to show that all parts of the model work, both independently and together, and use the right data at the right time.
The greatest aid to program verification is correct program design, followed by clarity, style, and ease of understanding. Very often, simulation models are poorly documented, especially at the model statement level. Verification becomes much easier if the analyst comments the model liberally. This includes comments wherever Arena Contact Center
16

|
• |
2 • INTRODUCTION TO SIMULATION |
• |
• |
|
|
• |
|
• |
enables the modeler to enter them, as well as separate documentation of model assumptions, model inputs, and logical relationships.
Validation is the process of raising to an acceptable level the user’s confidence that any simulation-derived inference about the system is correct. Validation is concerned with three basic questions:
Does the model adequately represent the real-world system?
Are the model-generated behavioral data characteristic of the real system’s behavioral data?
Does the simulation model user have confidence in the model’s results?
Consequently, we are concerned with tests that fall into three groups: tests of model structure, tests of model behavior, and tests of the policy implications of the model.
Because a model is constructed for a specific purpose, its adequacy or validity can only be evaluated in terms of that purpose. We try to build a model that creates the same problems and behavioral characteristics as the process or system being studied. Validation occurs throughout model development, beginning with the start of the study and continuing as the model builder accumulates confidence that the model behaves plausibly and generates symptoms or modes of behavior seen in the real system. Validation then expands to include persons not directly involved in constructing the model.
Validation is a communication process requiring the model builder to communicate the basis for confidence in a model to a target audience. Unless that confidence can be transferred, the model’s usefulness will never be realized. Thus, through verification testing, we develop personal confidence in the model and, through validation measures, transfer that confidence to others.
We must realize that there are degrees of validation; it is not merely an either-or notion. Validation is not a binary decision variable indicating whether the model is valid or invalid. No one or two tests can validate a simulation model. Rather, confidence in the usefulness of a model must gradually accumulate as the model passes more tests and as new points of correspondence between model and reality are found. Validation testing occurs continually in the process of designing, constructing, and using the model.
We should also remember that verification and validation are never really finished. If the model is to be used for any period of time, the data and the model itself will need periodic review to ensure validity. Verification and validation are intertwined and proceed throughout the study. They are not tacked on toward the end of the study; rather, they are an integral process that starts at the beginning of the study and continues through model building and model use. It should also be pointed out that involving the ultimate user in the entire simulation process makes validation much easier.
Simulation to Introduction • 2
17
• • • • •
ARENA CONTACT CENTER EDITION USER’S GUIDE
Documentation and implementation
At this point, we have completed all the steps for the design, development, and running of the model and for analyzing the results; the final elements in the simulation effort are implementation and documentation. No simulation project can be considered successfully completed until its results have been understood, accepted, and used. Although documentation and implementation are obviously very important, many studies fall short in the reporting and explaining of study results.
Documentation and reporting are closely linked to implementation. Careful and complete documentation of model development and operation can lengthen the model’s useful life and greatly increase the chances that recommendations based on the model will be accepted. Good documentation facilitates modification and ensures that the model can be used—even if the services of the original developers are no longer available. In addition, careful documentation can help us to learn from previous mistakes; it may even provide a source of submodels that can be used again in future projects.
Amazingly, modelers often spend a great deal of time trying to find the most elegant and efficient ways to model a system, and then they throw together a report for the sponsor or user at the last minute. If the results are not clearly, concisely, and convincingly presented, they will not be used. If the results are not used, the project is a failure. Presenting results is as critical a part of the study as any other part, and it merits the same careful planning and design.
Several issues should be addressed in model and study documentation: appropriate vocabulary (i.e., suitable for the intended audience and devoid of jargon), concise written reports, and timely delivery. We must also ensure that all reports (both oral and written) are pertinent and address the issues that the sponsor or user considers important.
References
McKay, K. N., J. A. Buzacott, and C. J. Strang (1986), “Software Engineering Applied to Discrete Event Simulation,” in Proceedings of the 1986 Winter Simulation Conference, Washington, D.C., pp. 485-493.
Schriber, T. J.(1987), “The Nature and Role of Simulation in the Design of Manufacturing Systems,” in Simulation in CIM and Artificial Intelligence Techniques, J. Retti and K. E. Wichmann (eds.), Society for Computer Simulation, pp. 5-18.
Sheppard, S. (1983), “Applying Software Engineering to Simulation,” Simulation, vol. 10, no. 1, pp. 13-19.
Weinburg, G. M. (1975), An Introduction to General Systems Thinking, John Wiley & Sons, Inc., New York, NY.
18
3 General Concepts
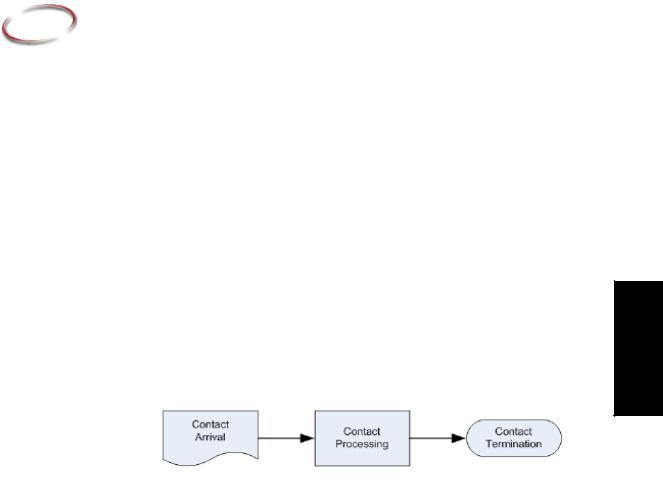
This chapter provides a high-level overview of the components of a model built using Arena Contact Center Edition. In particular, this chapter explains the terminology used within the software and the type of information that is needed to represent the way in which contacts arrive and are processed in a contact center system, which is referred to as the Contact Center Core Process. The major modeling elements are also described in some detail.
Once you have read this chapter, you will have a better understanding of the process of creating a model with Arena Contact Center Edition.
Overview
The basic process of contact center simulation is to generate a stream of arriving contacts, assign them to trunk lines, and route them through the center to an agent. To create a simulation model of a contact center or network of contact centers, you will describe the sequence of events that occur as contacts move through the system, from the arrival of the contacts at the contact center to successful resolution. You will also need to specify information about the contact center itself (trunk-line capacity, agent skills, agent schedules, etc.).
As you build your contact center models, it may be helpful to keep in mind the Contact Center Core Process, as illustrated below.
The basic components of this process are:
Contacts
Arrival Patterns
Trunk Groups
Routing Scripts
Schedules
Agents
Concepts General • 3
19
• • • • •
ARENA CONTACT CENTER EDITION USER’S GUIDE
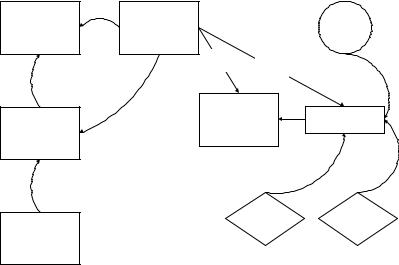
The relationships between these components are illustrated below.
Trunk Groups |
Routing Scripts |
|
Individual |
|
Agents |
||
|
|
|
|
|
Queueing to |
Queueing to |
|
|
Parent |
|
|
|
Groups |
Agent |
|
|
|
Groups |
|
|
Parent Groups |
|
|
|
(containing one or |
Agent Groups |
|
Contacts |
more Agent Groups) |
|
|
|
|
|
|
Agent |
Agent |
Skills |
Schedules |
Pattern
In addition, the length of the simulation run (see “Planning horizon”) and granularity of data specification and collection (see Timeslots) need to be specified. Animation and performance measure reporting are also important components of models.
Planning horizon
The planning horizon is defined as the time period that is being examined by a particular simulation model. The planning horizon is typically one day, one week, or one month.
Timeslots
The planning horizon is broken into specific timeslots for data specification and collection. These intervals are typically 30 minutes or one hour long.
With Arena Contact Center Edition, the basic unit of time is the minute. With the exception of the planning horizon, trunk costs, agent costs, and contact service level, all inputs are in terms of minutes or fractions of minutes.
20

|
• |
3 • GENERAL CONCEPTS |
• |
• |
|
|
• |
|
• |
Contact types
Describing the different types of contact is generally the starting point for contact center modeling and analysis. Each contact name represents a particular customer request for agent services. It is characterized by the expected talk time, as well as the associated arrival pattern and the trunk group on which the contacts enter the center.
The following more advanced aspects of contact behavior may also be modeled using Arena Contact Center Edition:
Abandonment
After-Contact Work
Prioritization
Contact Back
Data sources
Information about contact volumes is typically taken from forecasts while expected talk time is available either from contact center ACD databases or from a contact center’s contact-tracking system.
Arrival pattern
Contact patterns describe the arrival of contacts across the planning horizon by specifying the distribution of contacts across each timeslot. Within the Pattern module, this distribution is specified in terms of expected contact counts for each timeslot.
The arrival times of contacts within the timeslot are randomly generated according to a Poisson process with the defined rate. Therefore, the actual number of contacts arriving within the timeslot may differ from the expected number.
EXAMPLE
Suppose that the planning horizon is one day (24 hours), the timeslots are 60 minutes long. Then, if the arrival pattern specifies that 240 contacts are handled during the 10:00 AM- 11:00 AM timeslot, the simulation model would assume 240 expected contacts during the 10:00 AM-11:00 AM timeslot. The Poisson arrival rate for the timeslot is 0.25 (60/240) or, on average, one contact every 15 seconds.
Data sources
Arrival pattern data is available either from contact center ACD databases or from a contact center’s tracking system.
Concepts General • 3
21
• • • • •
ARENA CONTACT CENTER EDITION USER’S GUIDE
Trunk Groups
Trunk Groups represent groups of phone lines that are dedicated to a particular set of contact types. A single trunk group can serve multiple contact types and names, but only one trunk group may serve each contact name. Trunk groups have an associated capacity (# of lines), cost, and a default routing script and contact priority. Any incoming contact assumes the default priority and follows the default routing script unless these attributes are overridden at the contact level.
Note that trunk-line capacity determines the maximum number of contacts that the contact center can accommodate simultaneously. If a trunk line is not available when a contact attempts to enter the center, the contact is blocked and does not gain entry. Otherwise, the contact is attached to a trunk line and remains with that particular line until exiting the center or until transferring to another trunk line.
Data sources
Fundamental components of the contact center infrastructure, trunk-line organization, and capacity are typically specified in the phone-switching hardware.
Routing Scripts
Routing Scripts are sequences of actions that control the flow of contacts through the center’s system. This will result in contacts being connected with agents, leaving messages, being disconnected, or abandoning the center.
From a simulation modeling perspective, scripts allow contact flow logic to be categorized into six general areas:
1.Time delays (playing announcements, music, doing nothing—waiting)
2.Conditional route branching (caller-entered information, center dynamics)
3.Allocation of contacts into queues (single or simultaneous) or message ports
4.Contact prioritization within queues (ranking)
5.Contact flow between queues (movement of contacts out of and into queues, overflow from one queue into another)
6.Contact flow between scripts
Data sources
These command sequences are generally referred to as “scripts,” although each switch vendor has a different name for their particular variety (i.e., Vector, Telescript, Call
22
Loading...