


 Loading...
User’s
Manual
Models MV1004/MV1006/MV1008/MV1012/MV1024
MV2008/MV2010/MV2020/MV2030/MV2040/MV2048
MV1000/MV2000
IM MV1000-01E
2nd Edition

Thank you for purchasing the MV1000/MV2000 (hereafter referred to as the MV). This manual explains how to use the MV1000/MV2000 (except for communication features). Please read this manual thoroughly so that you can use the MV properly. The following MV1000/MV2000 manuals are available.
• Paper Manuals
Manual Title |
Manual No. |
Description |
MV1000 |
IM MV1000-02E Explains how to set up the MV1000 for making |
|
First Step Guide |
|
measurements using the quick settings function. |
|
|
Connection diagrams are also provided to help |
|
|
you with the setup. |
MV2000 |
IM MV2000-02E Explains how to set up the MV2000 for making |
|
First Step Guide |
|
measurements using the quick settings function. |
|
|
Connection diagrams are also provided to help |
|
|
you with the setup. |
Control of Pollution |
IM MV1000-91C Provides information about pollution control. |
|
Caused by the Product |
|
|
• Electronic Manuals Provided on the Accompanying CD-ROM
Manual Title |
Manual No. |
Description |
MV1000 |
IM MV1000-02E Same content as the paper manual. |
|
First Step Guide |
|
|
MV2000 |
IM MV2000-02E |
Same content as the paper manual. |
First Step Guide |
|
|
MV1000/MV2000 |
IM MV1000-01E |
Explains how to use all the MV1000 and |
User’s Manual |
|
MV2000 features (except for communication |
|
|
and network features). |
MV1000/MV2000 |
IM MV1000-17E |
Explains how to use the Ethernet and serial |
Communication Interface |
|
interface communication features. |
User’s Manual |
|
|
•DAQSTANDARD Manuals
All manuals other than IM 04L41B01-66EN are contained in the DAQSTANDARD CD.
Manual Title |
Manual No. |
DAQSTANDARD Data Viewer User’s Manual |
IM 04L41B01-63EN |
DAQSTANDARD Hardware Configurator User’s Manual |
IM 04L41B01-64EN |
DAQSTANDARD DX100P/DX200P Configurator User’s Manual |
IM 04L41B01-65EN |
Installing DAQSTANDARD |
IM 04L41B01-66EN |
Notes
•The contents of this manual are subject to change without prior notice as a result of continuing improvements to the instrument’s performance and functions.
•Every effort has been made in the preparation of this manual to ensure the accuracy of its contents. However, should you have any questions or find any errors, please contact your nearest YOKOGAWA dealer.
•Copying or reproducing all or any part of the contents of this manual without YOKOGAWA’s permission is strictly prohibited.
•The TCP/IP software of this product and the document concerning the TCP/IP software have been developed/created by YOKOGAWA based on the BSD Networking Software, Release 1 that has been licensed from the Regents of the University of California.
2nd Edition: August 2010 (YK)
All Rights Reserved, Copyright © 2007, Yokogawa Electric Corporation
IM MV1000-01E |
|

Trademarks
•MVAdvanced is a trademark of Yokogawa Electric Corporation.
•Microsoft and Windows are either registered trademarks or trademarks of Microsoft Corporation in the United States and/or other countries.
•Adobe and Acrobat are trademarks of Adobe Systems Incorporated.
•Company and product names that appear in this manual are registered trademarks or trademarks of their respective holders.
•In this manual, the ™ and ® symbols do not accompany trademarks or registered trademarks.
Revisions
1st Edition: December 2007 2nd Edition: August 2010
ii
IM MV1000-01E

MV’s Version and Functions Described in This Manual
MV’s Version and Functions
For the procedure to check the version, see section 9.3.
Edition |
MV |
Addition and change to functions |
Refer to |
1 |
Style number 1 |
New |
- |
2 |
Version number 1 |
Compatible with the |
page i and First Step Guide. |
|
|
DAQSTANDARD R8.21. |
|
|
|
Acquire the contents of the Notice |
Section 2.4 and First Step |
|
|
of Alterations (rechargable battery |
Guide. |
|
|
model, etc). |
|
IM MV1000-01E |
iii |

How to Use This Manual
Content Summary
This user’s manual consists of the chapters listed below. For information about the communication features and the accompanying software DAQSTANDARD, read the respective manual.
Chapter |
Title and Contents |
1Feature Overview
The MV features.
2Installation and Wiring
How to install the MV, how to wire input terminals, and how to connect the power cable.
3Measurement Channels and Alarms
How to set measurement conditions and how to set alarms.
4Measurement and Recording
How to record and store measured values and other values. This chapter also explains how to load measured data or setup data from a CF card or USB flash memory.
5Screen Operations
How to use the operation screen.
6Display Configuration
How to change the displayed information on the operation screen and how to write a message.
7Event Action
How to make the MV perform a specific action in response to an event, a remote control signal input, or a pressing of the USER key.
8Security Features
How to use the key lock feature and the feature that allows only registered users to operate the MV.
9Environment Settings
How to configure the time settings and how to operate the MV by using a keyboard.
10Computation and Report Functions (/M1 and /PM1 options)
How to use computation channels and how to create various reports, such as hourly, daily, weekly, and monthly reports.
11 |
External Input Channels (/MC1 option) |
|
How to use external input channels. |
12 |
Troubleshooting and Maintenance |
|
Explains error messages and troubleshooting measures. |
13 |
Specifications |
|
Lists the MV specifications. |
Appendix |
Describes measured data file sizes, text file formats, etc. |
Index |
|
Note
•This user’s manual covers information about MVs that have a suffix code for language “-2” (English).
•For language configuration instructions, see section 9.4, “Changing the Language.”
iv
IM MV1000-01E
How to Use This Manual
The following symbols are used in this manual.
Unit |
|
|
|
|
K |
|
Denotes 1024. Example: 768 KB (file size) |
|
k |
|
Denotes 1000. |
|
|
|
|
Markings |
|
|
|
|
|
|
Improper handling or use can lead to injury to the user or damage |
|
|
|
to the instrument. This symbol appears on the instrument to |
|
|
|
indicate that the user must refer to the user's manual for special |
|
|
|
instructions. The same symbol appears in the corresponding |
|
|
|
place in the user's manual to identify those instructions. In the |
|
|
|
manual, the symbol is used in conjunction with the word |
|
|
|
“WARNING” or “CAUTION.” |
|
|
|
Calls attention to actions or conditions that could cause serious |
|
WARNING |
||
|
|
|
or fatal injury to the user, and precautions that can be taken to |
|
|
|
prevent such occurrences. |
|
|
|
Calls attention to actions or conditions that could cause light |
|
CAUTION |
|
|
|
|
injury to the user or damage to the instrument or user’s data, and |
|
|
|
|
|
|
|
|
precautions that can be taken to prevent such occurrences. |
Note
Subheadings
Bold characters
A a # 1
Procedure
Explanation
Calls attention to information that is important for proper operation of the instrument.
This mark is used to indicate a reference to a related procedure or explanation.
Denotes key or character strings that appear on the screen. Example: Volt
Indicates character types that can be used.
A Uppercase alphabet, a lowercase alphabet, # symbols, 1 numbers.
Carry out the procedure according to the step numbers.
All procedures are written with inexperienced users in mind; depending on the operation, not all steps need to be taken. Explanation gives information such as limitations related the procedure.
|
Indicates the display and explains the settings. A detailed |
|
Display |
||
description of the function is not provided in this section. |
||
|
||
Settings |
||
For details on the function, see chapter 1. |
||
|
Procedural Explanations
This manual mainly describes the MV1000 procedures. Where procedures differ between the MV2000 and MV1000, the MV2000 procedures (menu operations) are also provided.
High-Speed and Medium-Speed Input Model Groupings
This manual uses high-speed input model and medium-speed input model to distinguish between MV models as follows:
|
Model type |
Model |
|
|
High-speed input model |
MV1004, MV1008, MV2008 |
|
|
Medium-speed input model |
MV1006, MV1012, MV1024, MV2010, MV2020, MV2030, |
|
|
|
MV2040, MV2048 |
|
|
|
|
|
IM MV1000-01E

Contents
MV’s Version and Functions Described in This Manual................................................................... |
iii |
How to Use This Manual.................................................................................................................. |
iv |
Chapter 1 Feature Overview
1.1 |
System Overview................................................................................................................. |
1-1 |
1.2 |
Input..................................................................................................................................... |
1-3 |
1.3 |
Alarms.................................................................................................................................. |
1-6 |
1.4 |
Display.................................................................................................................................. |
1-9 |
1.5 |
Data Storage Functions...................................................................................................... |
1-26 |
1.6 |
Batch Function................................................................................................................... |
1-35 |
1.7 |
Event Action Function......................................................................................................... |
1-36 |
1.8 |
Security Functions.............................................................................................................. |
1-40 |
1.9 |
Computation and Report Functions (/M1 and /PM1 options)............................................. |
1-42 |
1.10 |
FAIL/Status Output Function (/F1 Option).......................................................................... |
1-48 |
1.11 |
Other Functions.................................................................................................................. |
1-50 |
Chapter 2 Installation and Wiring
2.1 |
Where and How to Install..................................................................................................... |
2-1 |
2.2 |
Signal Input Terminal Wiring................................................................................................. |
2-4 |
2.3 |
Optional Terminal Wiring...................................................................................................... |
2-8 |
2.4 |
Connecting the Power Supply............................................................................................ |
2-15 |
Chapter 3 Measurement Channels and Alarms
3.1 |
Setting the Scan Interval and the A/D Converter Integration Time....................................... |
3-1 |
3.2 |
Setting Burnout and Reference Junction Compensation..................................................... |
3-2 |
3.3 |
Setting the Input Range........................................................................................................ |
3-3 |
3.4 |
Setting the Moving Average of the Input............................................................................... |
3-6 |
3.5 |
Setting the Auxiliary Alarm Function..................................................................................... |
3-7 |
3.6 |
Hiding the Alarm Indication................................................................................................. |
3-10 |
3.7 |
Setting Alarms on Channels................................................................................................ |
3-11 |
3.8 |
Releasing Alarm Output..................................................................................................... |
3-14 |
3.9 |
Calibrating Input Values (/CC1 option)............................................................................... |
3-15 |
3.10 |
Counting Pulses (/PM1 option)........................................................................................... |
3-17 |
3.11 |
Setting Range-Out Detection for Linearly Scaled Measurement Channels....................... |
3-20 |
Chapter 4 Measurement and Recording
4.1 |
Setting the Recording Conditions of Measured Data........................................................... |
4-1 |
4.2 |
Setting the Save Method for Measured Data....................................................................... |
4-4 |
4.3 |
Using the Batch Function..................................................................................................... |
4-7 |
4.4 |
Starting/Stopping Recording, and Saving Measured Data................................................. |
4-10 |
4.5 |
Saving Measured Data Manually....................................................................................... |
4-13 |
4.6 |
Saving Screen Image Data (Snapshot).............................................................................. |
4-15 |
4.7 |
Managing Stored Files....................................................................................................... |
4-16 |
4.8 |
Loading and Displaying Measured Data from External Storage Media.............................. |
4-18 |
4.9 |
Saving and Loading Setup Data......................................................................................... |
4-19 |
4.10 |
Using USB Flash Memory.................................................................................................. |
4-21 |
vi
IM MV1000-01E

Contents
Chapter 5 Screen Operations |
|
|
5.1 |
Switching Between Displays................................................................................................ |
5-1 |
5.2 |
Displaying Measured Data with Waveforms (trend), Numbers (digital), or Bar Graphs....... |
5-5 |
5.3 |
Displaying Previously Measured Data (TREND HISTORY)................................................. |
5-9 |
5.4 |
Viewing All Channels on One Display (OVERVIEW).......................................................... |
5-15 |
5.5 |
Displaying Various Information........................................................................................... |
5-16 |
5.6 |
Displaying Stacked Bar Graphs (COLUMN BAR).............................................................. |
5-19 |
5.7 |
Using the Alarm Summary.................................................................................................. |
5-22 |
5.8 |
Using the Message Summary............................................................................................ |
5-23 |
5.9 |
Using the Memory Summary.............................................................................................. |
5-24 |
5.10 |
Viewing Operation History Logs......................................................................................... |
5-27 |
5.11 |
Using the 4-Panel Display (MV2000 only).......................................................................... |
5-31 |
Chapter 6 Display Configuration
6.1 |
Setting a Display Group....................................................................................................... |
6-1 |
6.2 |
Displaying Tags or Channel Numbers.................................................................................. |
6-3 |
6.3 |
Setting the Secondary Trend Interval................................................................................... |
6-4 |
6.4 |
Writing a Message................................................................................................................ |
6-7 |
6.5 |
Changing Channel Display Colors...................................................................................... |
6-11 |
6.6 |
Using Display Zones.......................................................................................................... |
6-12 |
6.7 |
Displaying a Scale on the Trend Display............................................................................ |
6-13 |
6.8 |
Displaying Alarm Value Marks and Color Scale Bands...................................................... |
6-18 |
6.9 |
Partially Expanding a Waveform........................................................................................ |
6-20 |
6.10 |
Changing the Display Layout, Clearing of the Waveform at Start, Message Display Direction, |
|
|
Waveform Line Width, and Grid......................................................................................... |
6-22 |
6.11 |
Changing the Bar Graph Display Method........................................................................... |
6-24 |
6.12 |
Changing the Display Background Color........................................................................... |
6-28 |
6.13 |
Automatically Switching Display Groups............................................................................ |
6-29 |
6.14 |
Automatically Returning to a Specified Display.................................................................. |
6-30 |
6.15 |
Registering Favorite Displays............................................................................................. |
6-31 |
6.16 |
Writing a Message When the MV Recovers from a Power Failure.................................... |
6-33 |
6.17 |
Changing the Function Menu and the Display Selection Menu.......................................... |
6-34 |
Chapter 7 Event Action
7.1 |
Configuring the Event Action Function................................................................................. |
7-1 |
7.2 |
Setting Timers...................................................................................................................... |
7-3 |
7.3 |
Setting the Match Time Timer............................................................................................... |
7-5 |
7.4 |
Using the Remote Control Function (/R1 option) and the USER Key.................................. |
7-7 |
7.5 |
Using an Alarm, Output Relay, or Internal Switch................................................................. |
7-8 |
1
2
3
4
5
6
7
8
9
10
11
Chapter 8 Security Features |
12 |
|
8.1 |
Disabling the Keys (key lock function).................................................................................. |
8-1 |
8.2 |
Allowing Only Registered Users to Operate the MV (login function).................................... |
8-4 |
8.3 |
Logging in and Logging Out................................................................................................. |
8-8 |
|
|
13 |
|
|
App |
|
|
Index |
IM MV1000-01E |
vii |

Contents
Chapter 9 Environment Settings
9.1 |
Setting the Date and Time.................................................................................................... |
9-1 |
9.2 |
Setting the Temperature Unit and Decimal Point Type......................................................... |
9-4 |
9.3 |
Viewing MV Information........................................................................................................ |
9-5 |
9.4 |
Changing the Displayed Language...................................................................................... |
9-6 |
9.5 |
Initializing the MV................................................................................................................. |
9-7 |
9.6 |
Transmitting the MV Status via Relay Contact (/F1 option).................................................. |
9-8 |
9.7 |
Controlling the MV by Using a Keyboard............................................................................. |
9-9 |
9.8 |
Setting the LCD Brightness and Backlight Saver................................................................ |
9-11 |
Chapter 10 Computation and Report Functions (/M1 and /PM1 options)
10.1 |
Configuring Computation Channels |
................................................................................... 10-1 |
10.2 |
Writing Expressions............................................................................................................ |
10-6 |
10.3 |
Displaying Computation Channels................................................................................... |
10-12 |
10.4 |
Starting/Stopping Computation........................................................................................ |
10-15 |
10.5 |
Generating Reports.......................................................................................................... |
10-17 |
Chapter 11 External Input Channels (/MC1 option)
11.1 |
Configuring External Input Channels................................................................................... |
11-1 |
11.2 |
Displaying External Input Channels.................................................................................... |
11-4 |
Chapter 12 Troubleshooting and Maintenance
12.1 |
List of Messages................................................................................................................ |
12-1 |
12.2 |
Troubleshooting................................................................................................................ |
12-17 |
12.3 |
Periodic Inspection........................................................................................................... |
12-20 |
12.4 |
Calibrating the MV............................................................................................................ |
12-21 |
12.5 |
Recommended Replacement Periods for Worn Parts...................................................... |
12-23 |
Chapter 13 Specifications
13.1 |
Signal Input and Alarm....................................................................................................... |
13-1 |
13.2 |
Display Functions............................................................................................................... |
13-3 |
13.3 |
Storage Function................................................................................................................ |
13-6 |
13.4 |
Other Standard Functions.................................................................................................. |
13-8 |
13.5 |
Options............................................................................................................................. |
13-10 |
13.6 |
General Specifications..................................................................................................... |
13-14 |
13.7 |
External Dimensions........................................................................................................ |
13-20 |
Appendix
Appendix 1 |
Data File Size.................................................................................................... |
App-1 |
Appendix 2 |
Event Action Configuration Examples................................................................ |
App-4 |
Appendix 3 |
Text File Formats............................................................................................... |
App-7 |
Index |
|
|
viii
IM MV1000-01E
Chapter 1 Feature Overview
1.1System Overview
System Configuration
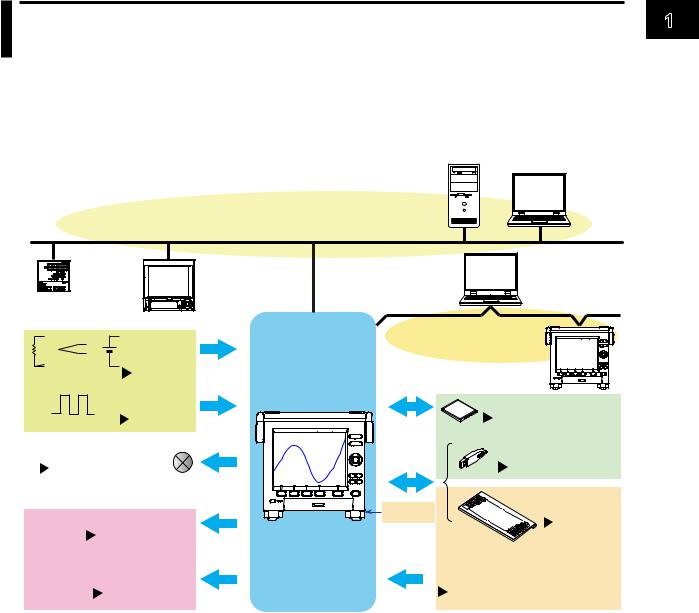
The MV can be used to construct a system like the one shown below. The MV can make voltage and temperature measurements by itself. It can also transfer data to other devices via Ethernet or a serial interface, and it can acquire data from multiple channels using the Modbus protocol.
|
|
PC |
|
Ethernet |
|
|
(Communication Interface User’s Manual) |
|
Temperature |
Recorder |
PC |
|
||
regulator |
|
|
|
Serial communication* |
|
Measurement |
(Communication Interface |
|
User’s Manual) |
||
input |
|
|
Section 3.3 |
|
|
Pulse input* |
MV |
CF card |
Section 3.10 |
|
First Step Guide |
Transmitter power supply* |
USB port |
USB flash memory |
Section 2.3 |
Section 4.10 |
|
Alarm output* |
Keys |
Keyboard |
|
Section 9.7 |
|
Sections 3.5 to 3.8 |
|
|
FAIL/status output |
|
Remote input* |
Section 9.6 |
|
Section 7.4 |
* Options
Terminology
•Memory sampling
Recording measured data.
•Memory start
A command to start memory sampling.
•Memory stop
A command to stop memory sampling.
•Display data
The waveform data displayed on the MV screen. It is essentially measured data that is recorded at the display data sampling rate.
•Event data
Measured data that is recorded at a set sampling rate that differs from that of the display data.
ewi 1 FeatureOverv
IM MV1000-01E |
1-1 |
1.1 System Overview
Modes
The MV has an Operation Mode, a Setting Mode, and a Basic Setting Mode.
Mode Transition Diagram |
Power ON |
Operation Mode
Operation screen
MENU or |
MENU |
ESC |
|
Setting Mode |
DISP/ENTER |
|
|
Settings menu |
Configuration |
screen |
|
|
MENU or ESC |
|
Select Basic setting mode from the menu, |
|
or hold down FUNC for three seconds. |
Basic Setting Mode |
DISP/ENTER |
|
|
Basic settings |
Configuration |
menu |
screen |
|
ESC |
Select End, or press ESC then DISP/ENTER.
Mode |
Description |
Operation Mode |
For performing measurements. |
Setting Mode |
For configuring settings, such as the input range and the |
|
measurement method. You can change most of the settings in this |
|
mode while the MV is engaged in memory sampling. |
Basic Setting Mode |
For configuring fundamental settings, such as the scan interval and |
|
the measured data save method. You cannot switch to this mode |
|
while the MV is engaged in memory sampling. |
*For a list of the contents of Setting Mode and Basic Setting Mode, see the First Step Guide.
1-2 |
IM MV1000-01E |
1.2Input
Measurement Channels
•Number of Channels vs. Scan Interval
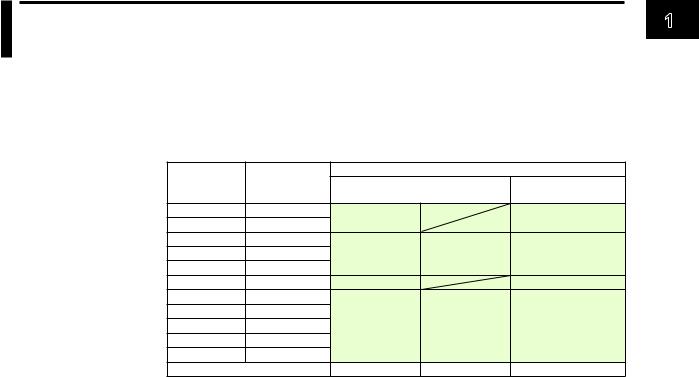
The MV acquires data by sampling measurement channel input signals at the set scan interval. The following is a list of the scan intervals available with different numbers of channels.
|
Number of |
|
Scan Interval |
|
Model |
Measurement |
Normal Mode |
Fast Sampling Mode |
|
|
Channels |
|
|
|
MV1004 |
4 |
125 ms, 250 ms |
|
25 ms |
MV1008 |
8 |
|
||
|
|
|
||
MV1006 |
6 |
|
|
|
MV1012 |
12 |
1 s, 2 s, 5 s |
2 s, 5 s |
125 ms |
MV1024 |
24 |
|
|
|
MV2008 |
8 |
125 ms, 250 ms |
|
25 ms |
MV2010 |
10 |
|
|
|
MV2020 |
20 |
|
|
|
MV2030 |
30 |
1 s, 2 s, 5 s |
2 s, 5 s |
125 ms |
MV2040 |
40 |
|
|
|
MV2048 |
48 |
|
|
|
A/D converter integration time |
60 Hz/50 Hz |
100 ms |
600 Hz (fixed) |
|
 For configuration instructions, see section 3.1.
•A/D Converter Integration Time
The MV uses an A/D converter to convert sampled analog signals to digital signals.
You can effectively eliminate the influence of power supply noise by setting the A/D converter’s integration time to the same length as or to an integral multiple of the power source period.
•Because 100 ms is an integral multiple of both 16.7 ms and 20 ms, you can effectively eliminate the influence of power supply noise from both 50and 60-Hz frequencies by setting the integration time to 100 ms.
•Power supply noise elimination is less effective in fast sampling mode than it is in normal mode. When measuring in an environment susceptible to power supply noise, we recommend that you measure in normal mode.
 For configuration instructions, see section 3.1.
Input Types and Computation Functions
You can measure the following types of input.
Input Type |
Description |
DC voltage |
You can measure DC voltages in the range of ±20 mV to ±50 V. |
DC current |
You can measure a DC current signal by converting it to a voltage signal using a shunt |
|
resistor attached to the input terminal.1 |
|
The converted signal can be measured within the DC voltage range (see above). |
Thermocouple |
You can measure temperatures using these thermocouple types: R, S, B, K, E, J, T, N, |
|
W, L, U, and WRe3-25. It is also possible to measure using other thermocouples, such as |
|
PR40-20 and PLATINEL.2 |
RTD |
You can measure temperatures using RTD types Pt100 and JPt100. It is also possible to |
|
measure using other RTD types such as Cu10 and Cu25,3 and Pt50 and Ni100.2 |
ON/OFF input |
You can display contact input or voltage input signals correlated to 0% or 100% of the |
|
display range. |
|
Contact input: A closed contact is ON (1). An open contact is OFF (0). |
|
Voltage input: Less than 2.4 V is OFF (0). 2.4 V or more is ON (1). |
Pulse input4 |
You can count pulses. |
1 Shunt resistor sold separately. For example, you can use a 250-Ω shunt resistor to convert a 4- to 20-mA signal to a 1- to 5-V signal.
2 /N3 option
3 /N1 option
4 /PM1 option
ewi 1 FeatureOverv
IM MV1000-01E |
1-3 |
1.2 Input
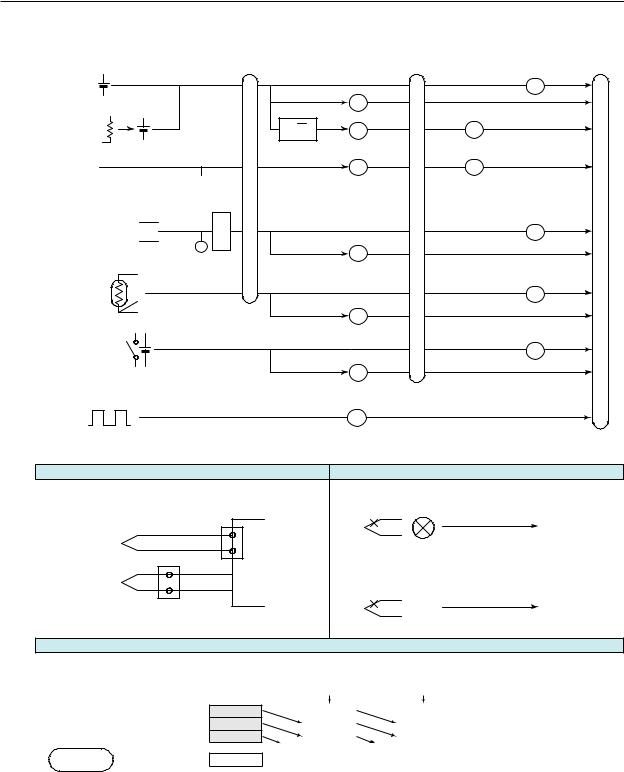
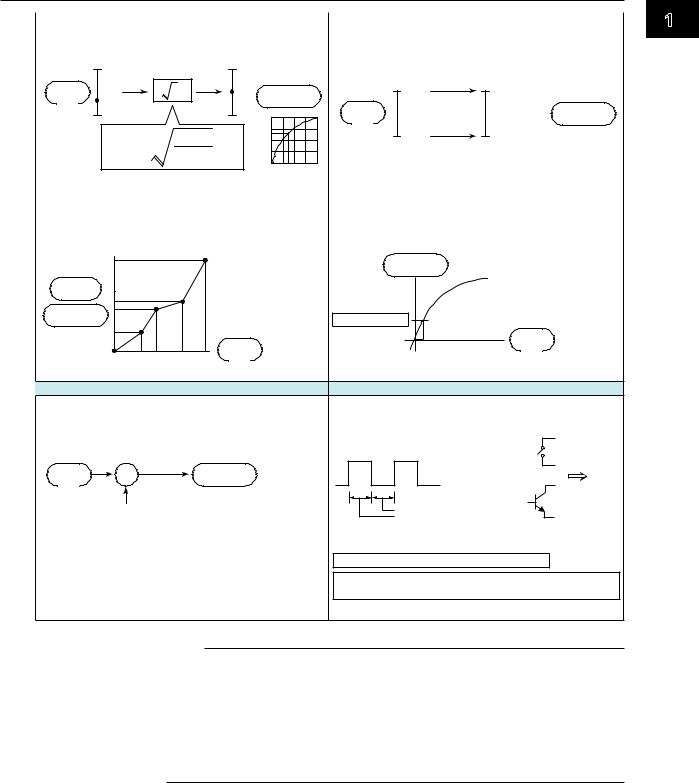
The following input processing and math operations are available.
|
Moving average |
Linear |
Calibration Low cut |
Difference |
Measured |
|
|
scaling |
correction |
computation |
value |
DC voltage |
|
|
(/CC1 option) |
|
|
|
|
|
|
|
|
Shunt resistor |
|
|
|
|
|
DC current |
√ |
|
|
|
|
|
|
|
|
|
|
|
Square root computation |
|
|
||
1 - 5 V
Burnout detection  RJC
RJC
Thermocouple 
Burnout detection
RTD
ON/OFF input |
|
|
|
|
|
Convert to number of pulses per second |
|
||
Pulse |
|
|
|
|
(/PM1 option) |
|
Dotted lines indicate that the function can be selected. |
||
Reference Junction Compensation |
|
Burnout Detection |
|
|
Performs reference junction compensation on |
Detects and indicates a sensor burnout. |
|
||
Burnout |
|
|
||
a thermocouple. |
MV |
1 - 5 V |
|
|
|
|
|
Indicated as |
|
Thermocouple |
|
|
Detected on the |
|
Internal |
|
Burnout. |
||
|
|
1-5 V value. |
||
|
reference |
|
|
|
|
|
|
|
|
Thermocouple |
junction |
|
|
|
|
|
Thermoelectromotive |
||
|
|
Burnout |
||
|
|
force |
Indicated as |
|
|
|
|
||
|
External reference junction |
|
|
|
|
|
|
Burnout. |
|
For configuration instructions, see section 3.2. |
For configuration instructions, see section 3.2. |
|||
|
Moving Average |
|
|
|
Eliminates noise. |
|
|
|
|
Operation example when the number of moving average data points is 3
Sampling data |
1 |
10.0 mV |
|
2 |
5.0 mV |
||
in the buffer |
3 |
0.0 mV |
|
|
|
||
Measured |
(Moving average) |
5.0 mV |
|
value |
Sampling |
|
nth time |
|
|
||
For configuration instructions, see section 3.4.
New sampled |
New sampled |
data |
data |
|
15.0 mV |
|
10.0 mV |
Number of moving |
|
10.0 mV |
|
15.0 mV |
average data points: 2 to 400 |
|
5.0 mV |
|
10.0 mV |
|
Clear |
|
Clear |
|
|
|
10.0 mV |
|
11.7 mV |
|
|
n + 1th time |
|
n + 2th time |
|
1-4 |
IM MV1000-01E |
1.2 Input
Square Root Computation |
Linear Scaling |
Takes the square root of the input value and converts |
Converts the unit to obtain the measured value. |
the unit to obtain the measured value. |
|
|
b |
|
B |
|
|
|
Input |
|
|
X |
Measured |
10 V |
300 °c |
value |
x |
|
||||
|
|
value |
Input |
Measured |
||
|
a |
|
A |
|
||
|
|
B |
value |
value |
||
|
X = (B – A) |
x – a |
+ A |
|
0 V |
–100 °c |
|
b – a |
A a |
b |
|
||
|
|
|
|
|
For configuration instructions, see section 3.3. |
For configuration instructions, see section 3.3. |
Calibration Correction (/CC1 Option) |
Low-cut |
|
Corrects the input value with the characteristics |
For square root computation, measured values below |
||
|
the specified value are cut. |
|||
|
specified by segments to obtain the measured value. |
|||
|
For 1-5 V input, values below 0 % are cut. |
|||
|
|
|
||
|
|
Number of break |
Measured |
|
|
|
value |
||
|
Output |
points: Up to 16 |
||
|
Result of square root |
|||
|
|
|||
|
value |
|
computation |
|
( |
valueMeasured |
) |
||
Low-cut value |
||||
|
|
Input |
Input |
|
|
|
value |
||
|
|
value |
|
|
For configuration instructions, see section 3.9. |
For configuration instructions, see section 3.3. |
|
||
|
Difference Computation |
Pulse Input (/PM1 Option) |
|
|
The measured value of the channel is set to the |
Counts pulses. |
Input to the MV |
|
|
difference with respect to the measured value of the |
Pulses of 100 Hz or less |
|
|
|
reference channel. |
can be counted |
|
|
|
|
|
|
Contact |
|
Input |
Measured |
|
or |
MV |
value |
value |
|
||
|
– |
|
Open |
|
|
|
|
|
|
Measured value on the reference channel |
5 ms or more |
collector |
|
|
|
|
Count on the MV |
|
|
|
|
The contact changes from open to closed. |
|
|
|
|
The signal level at the input terminal changes from high |
||
|
|
to low. |
|
|
For configuration instructions, see section 3.3. |
For configuration instructions, see section 3.10. |
|
||
Note
You can use difference computation even if the reference channel and difference computation channel’s input types and ranges are different. Difference computation takes place using the difference computation channel’s decimal place and unit.
Example 1: If the input value of the difference computation channel is 10.00 and the measured value of the reference channel is 100.0, the result is 10.00–100.0=–90.00.
Example 2: If the input value of the difference computation channel is 10.00 V and the measured value of the reference channel is 5.00 mV, the computed result is 10.00 V – 5.00 mV = 5.00 V.
ewi 1 FeatureOverv
IM MV1000-01E |
1-5 |
1.3Alarms
This function generates an alarm when the measured data meets a set condition. You can set a maximum of four different alarms on each channel.
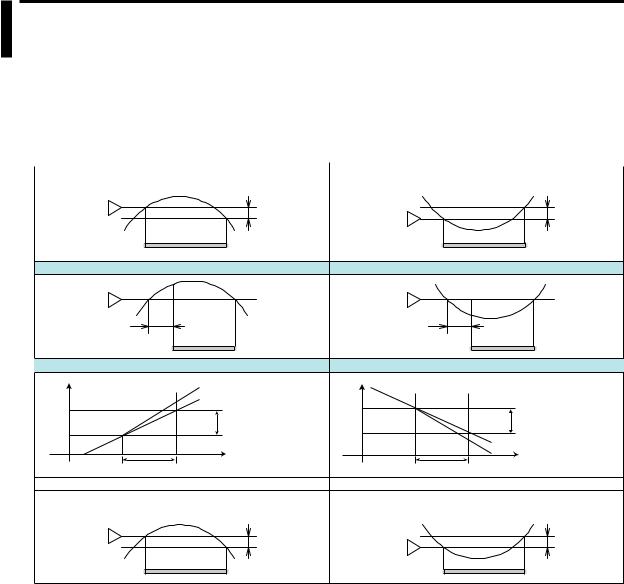
Alarm Types
You can use the types of alarms listed below. The letters contained in parentheses are used as abbreviations for the alarms.
 For alarm configuration instructions, see section 3.7.
High Limit Alarm (H) |
Low Limit Alarm (L) |
Measured value Hysteresis |
Measured value Hysteresis |
Alarm value |
Alarm value |
Alarm output ON |
Alarm output ON |
Delay High Limit Alarm (T) |
Delay Low Limit Alarm (t) |
Measured value |
Measured value |
Alarm value |
Alarm value |
Delay time |
Delay time |
Alarm output ON |
Alarm output ON |
High Limit on Rate-of-Change Alarm (R) |
Low Limit on Rate-of-Change Alarm (r) |
Measured value |
|
Change in the |
Measured value |
|
|
|
T2 |
|
measured value |
T2 |
|
Amount of change in |
|
|
Amount of change in |
|
||||
|
|
|
|
the setting |
||
T1 |
|
the setting |
T1 |
|
|T2-T1| |
|
|
|T2-T1| |
|
||||
t1 |
t2 |
t1 |
t2 |
Change in the measured value |
||
|
||||||
Time |
Time |
|||||
|
|
|
|
|||
Interval (t2-t1) |
|
Interval (t2-t1) |
|
|||
Difference High Limit Alarm (h) |
Difference Low Limit Alarm (l) |
Difference in the measured values of two channels |
Difference in the measured values of two channels |
Hysteresis |
Hysteresis |
Alarm value |
Alarm value |
|
|
Alarm output ON |
Alarm output ON |
•Hysteresis
You can set a difference between the value that activates an alarm and the value that deactivates it.
 For configuration instructions, see section 3.5.
•Delay High Limit Alarm and Delay Low Limit Alarm
If the measured value remains above or below the set alarm value for the set period of time (the delay time), an alarm is activated.
•High Limit on Rate-of-Change Alarm and Low Limit on Rate-of-Change
Alarm
The MV checks the rate-of-change of the measured values over a set period of time (the interval) and activates an alarm if the rate-of-change in the rising or falling direction is greater than or equal to the set value.
The alarm value of the rate-of-change alarm is set using an absolute value. The interval is derived from the sampling count using the following equation:
Interval = scan interval × sampling count
 For instructions on how to set the interval, see section 3.5.
•Difference High Limit Alarm and Difference Low Limit Alarm
The MV activates an alarm when the difference between the values of two channels goes above or below the set value. You can use this alarm on measurement channels set to difference computation.
1-6 |
IM MV1000-01E |
1.3 Alarms
Alarm display
Alarm conditions are indicated in operation windows (trend, digital, bar graph, overview, etc.) and by icons in the status display section. The alarm summary displays detailed alarm information.
•Hold/Nonhold of Indication
When alarm conditions cease, their indicators can be set to either:
•Stop as soon as the alarm condition ceases (Nonhold).
•Continue until the execution of an alarm output release (AlarmACK) operation (Hold). The default setting is Nonhold.
 For configuration instructions, see Section 3.5.
•Alarm Hide Function
If this function is enabled, the MV will not display alarm condition information or record it in the alarm summary. However, the MV will output alarm information to a relay (/A options) or internal switch. You can set this function for each channel and alarm.
 For configuration instructions, see Section 3.6.
Alarm Output Relay Operation
The MV can generate a contact signal from an alarm output relay (/A options) when an alarm occurs. The alarm output relay operation can be changed.
 For configuration instructions, see Section 3.5.
|
|
|
|
|
|
|
|
Reflash |
|
|
|
|
|
|
|
|
|
|
|
|
|
|
|
|
|
AND/OR |
|
|
|
|
|
||||||||||||
|
|
|
|
|
|
|
|
|
|
|
|
|
|
|
|
|
|
|
|
|
|
|
|
|
|
|
|
|
|
|
|
|
Channel 1 |
|
|
|
|
|
|
|
|
||
Alarm |
|
|
|
|
|
|
|
Channel 1 |
|
|
|
|
|
|
|
|
|
|
|
|
|
Alarm |
|
|
|
|
|
|
|
|
|
|
|
|
|
||||||||
|
|
|
|
|
|
|
|
|
|
|
|
|
|
|
|
|
|
|
|
|
|
|
|
|
|
|
|
|
|
|
|
|
|||||||||||
|
|
|
|
|
|
|
Channel 2 |
|
|
|
|
|
|
|
|
|
|
|
|
|
|
|
|
|
|
|
Channel 2 |
|
|
|
|
|
|
|
|
||||||||
|
|
|
|
|
|
|
|
|
|
|
|
|
|
|
|
|
|
|
|
|
|
|
|
|
|
|
|
|
|
|
|
|
|
||||||||||
|
|
|
|
|
|
|
|
|
|
|
|
|
|
|
|
|
|
|
|
|
|
|
|
|
|
|
|
|
|
|
|
|
|
|
|
||||||||
|
|
|
|
|
|
|
|
Channel 3 |
|
|
|
|
|
|
|
|
|
|
|
|
|
Alarm output relay |
|
|
|
|
|
|
|
|
|
|
|
|
|||||||||
|
|
|
|
|
|
|
|
|
|
|
|
|
|
|
|
|
|
|
|
|
|
|
|
|
|
|
|
|
|
||||||||||||||
|
|
|
|
|
|
|
|
|
|
|
|
|
|
|
|
|
|
|
|
|
|
|
|
|
|
|
|
AND |
|
|
|
|
|
|
|
|
|
||||||
|
|
|
|
|
|
|
|
|
|
|
|
|
|
|
|
|
|
|
|
|
|
|
|
|
|
|
|
|
|
|
|
|
|
||||||||||
Alarm output relay |
|
|
|
|
|
|
|
|
|
|
|
|
|
|
|
|
|
|
|
|
|
or |
|
|
|
|
|
|
|
|
|
|
|
|
|
|
|
|
|
||||
(reflash ON) |
|
|
|
|
|
|
|
|
|
|
|
|
|
|
|
|
|
|
|
|
|
Internal switch |
|
|
|
|
OR |
|
|
|
|
|
|
|
|
|
|||||||
|
|
|
|
|
|
|
|
|
|
|
|
|
|
|
|
|
|
|
|
|
|
|
|
|
|
|
|
|
|
|
|
|
|
|
|
|
|
|
|||||
|
|
|
|
|
|
|
|
|
|
|
|
|
|
|
|
|
|
|
|
|
|
|
|
|
|
|
|
|
|
|
|
|
|
|
|
|
|
|
|||||
|
|
|
|
|
|
|
|
|
|
|
|
|
|
|
|
|
|
|
|
|
|
|
|
|
|
|
|
|
|
|
|
|
|
|
|
|
|
|
|||||
|
|
|
|
|
|
|
|
|
|
|
|
|
Approx. |
|
Approx. |
|
(You can set the alarm output relay and internal |
|
|
||||||||||||||||||||||||
Alarm output relay |
|
|
|
|
|
|
|
|
500 ms |
|
500 ms |
|
switch. For details on the internal switch, see the |
|
|
||||||||||||||||||||||||||||
|
|
|
|
|
|
|
|
|
|
|
|
|
|
|
|
|
|
|
|
|
|
|
|||||||||||||||||||||
(reflash OFF) |
|
|
|
|
|
|
|
|
|
|
|
|
|
|
|
|
|
|
|
|
|
next page.) |
|
|
|
|
|
|
|
|
|
|
|
|
|
|
|||||||
|
|
|
(when a relay is set to “OR” logic) |
|
|
|
|
|
|
|
|
|
|
|
|
|
|
|
|||||||||||||||||||||||||
|
|
|
|
|
|
|
|
|
|
|
|
|
|
|
|
|
|
|
|
|
|
|
|
|
|
|
|
|
|
|
|
|
|
|
|
|
|
|
|
|
|
|
|
|
|
|
|
|
|
|
|
|
|
|
|
|
|
|
|
Energize or De-energize |
|
|
|
|
|
|
|
|
|
|
|
|
|
|
|
|
|
||||||||||
|
|
|
When power is shut down Normal operation |
When alarm is occurring |
|
|
|
|
|
||||||||||||||||||||||||||||||||||
Energize |
|
|
|
|
|
|
|
|
|
|
|
|
|
|
|
|
|
|
|
|
|
|
|
|
|
|
|
|
|
|
NO: Normally Opened |
|
|
||||||||||
|
|
|
|
|
|
|
|
|
|
|
|
|
|
|
|
|
|
|
|
|
|
|
|
|
|
|
|
|
|
|
|
||||||||||||
|
|
|
|
|
|
|
|
|
|
|
|
|
|
|
|
|
|
|
|
|
|
|
|
|
|
|
|
|
|
C: Common |
|
|
|
|
|
||||||||
|
|
|
|
|
|
NO C |
NC |
|
NO C |
|
NC |
|
NO C |
NC |
|
|
|
|
|
|
|
||||||||||||||||||||||
|
|
|
|
|
|
|
|
|
|
|
NC: Normally Closed |
|
|
||||||||||||||||||||||||||||||
De-energize |
|
|
|
|
|
|
|
|
|
|
|
|
|
|
|
|
|
|
|
|
|
|
|
|
|
|
|
|
|
|
|
|
|
|
|
|
|
|
|
||||
|
|
|
|
|
|
|
|
|
|
|
|
|
|
|
|
|
|
|
|
|
|
|
|
|
|
|
|
|
|
|
|
|
|
|
|
|
|
|
|||||
|
|
|
|
|
|
NO C |
NC |
|
NO C |
|
NC |
|
|
NO C |
NC |
|
|
|
|
|
|
|
|
|
|
|
|||||||||||||||||
|
|
|
|
|
|
|
|
|
|
|
|
|
|
|
|
|
|
|
|
|
|
|
|
|
|
|
|
|
|
|
|
|
|
|
|
|
|
|
|
|
|
||
|
|
|
Non-Hold |
|
|
|
|
|
|
|
|
|
|
|
|
|
|
|
|
|
|
|
|
Hold |
|
|
|
|
|
|
|
|
|
|
|
||||||||
|
|
|
Alarm occurrence |
|
|
|
|
|
|
|
|
|
|
|
|
AlarmACK |
|
|
AlarmACK |
|
|
|
|
|
|||||||||||||||||||
Alarm |
|
|
|
|
Alarm release |
|
|
|
|
|
|
|
|
|
|
or |
|
|
|
|
|
|
|
|
|
|
|
|
|
|
|
Relay |
|||||||||||
|
|
|
|
|
|
|
|
|
|
|
|
|
|
|
|
|
|
|
|
|
|
|
|
|
|
|
|
|
|
|
|
|
|
|
|
|
|
|
|
||||
|
|
Activated |
|
|
|
|
|
|
|
|
|
|
|
|
|
|
|
Activated |
|
Activated |
|
|
|
|
|
|
Normal |
||||||||||||||||
Alarm |
|
|
|
|
|
|
|
|
|
|
|
|
|
|
|
|
|
|
|
|
|
|
|
|
|||||||||||||||||||
|
|
|
|
|
|
|
|
|
|
|
|
|
|
|
|
|
|
|
|
|
|
|
|
|
|
|
|
|
|
|
|
|
Relay is activated |
onAction |
|||||||||
output |
|
|
|
|
|
|
|
|
|
|
|
|
|
|
|
|
|
|
|
|
|
|
|
|
|
|
|
|
|
|
|
|
|
|
|
|
|||||||
relay |
Deactivated |
|
|
|
|
|
|
|
|
|
|
|
|
Deactivated |
Deactivated |
|
|
|
|
at the next scan |
|
|
|
||||||||||||||||||||
|
|
|
|
|
|
|
|
|
|
|
|
|
|
|
|
interval |
|
|
|
|
|
||||||||||||||||||||||
|
|
|
|
|
|
|
|
|
|
|
|
|
|
|
|
|
|
|
|
|
|
|
|
|
|
|
|
|
|
|
|
|
|
|
|
|
|
|
|||||
|
|
|
|
|
|
|
|
|
|
|
|
|
|
|
|
|
|
|
|
|
|||||||||||||||||||||||
output |
|
|
Alarm occurrence |
|
|
AlarmACK |
|
|
|
|
|
AlarmACK |
|
|
AlarmACK |
|
|
|
AlarmACK |
||||||||||||||||||||||||
|
|
|
Alarm release |
|
|
|
|
|
|
|
|
|
|
|
|
|
|
|
|
|
|
|
|
|
|
Relay is activated |
|
|
|
||||||||||||||
Alarm |
|
|
|
|
|
|
|
or |
|
|
|
|
|
|
|
|
|
|
|
|
|
|
|
|
|
or |
|
Activated |
|
|
|
|
|
|
Reset |
|
|
||||||
Alarm |
|
|
Activated |
|
|
|
|
|
|
Activated |
|
|
|
|
Activated |
|
|
|
|
|
|
|
|
|
|||||||||||||||||||
|
|
|
|
|
|
|
|
|
|
|
|
|
|
|
|
|
|
|
|
|
|
|
|
|
|
Deactivated |
|
|
|
|
at the next alarm |
|
|
|
|
|
|||||||
relay |
Deactivated |
|
|
|
|
|
Deactivated |
|
Deactivated |
|
|
|
|
|
|
|
|
|
|||||||||||||||||||||||||
|
|
|
|
|
|
|
|
|
|
|
|
|
|
|
|
|
|
|
|
|
|
|
|
|
|
|
|
|
|
|
|
|
|
occurrence |
|
|
|
|
|
||||
|
|
|
|
|
|
|
|
|
|
|
|
|
|
|
|
|
|
|
|
|
|
|
|
|
|
|
|
|
|
|
|
|
|
|
|
|
|
|
|
|
|
|
|
ewi 1 FeatureOverv
IM MV1000-01E |
1-7 |

1.3 Alarms
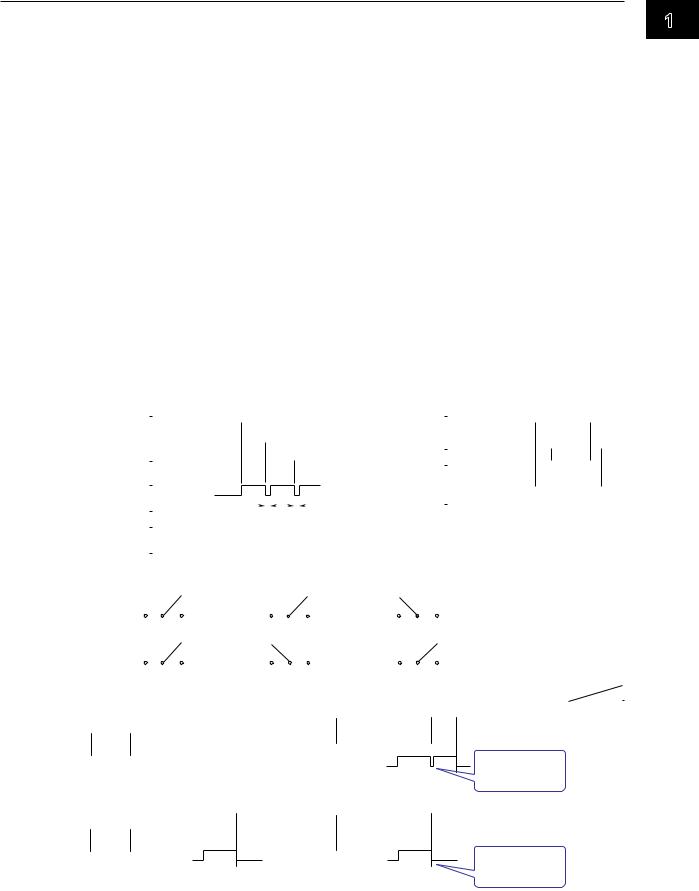
•Reflash
This function enables a single alarm output relay with multiple alarms assigned to it to indicate all alarm occurrences. After the first alarm, subsequent alarms are indicated by the brief release (approximately 500 ms) of the output relay.
The reflash function affects the first three output relays.*
*I01 to I03 or I11 to I13. With the /A1 option, I01 and I02.
Note
When reflash is enabled, the first three output relays are used exclusively as reflash relays.
The first three output relays are set to OR logic and to the Nonhold operation regardless of the
AND/OR or Nonhold/Hold settings explained below.
•AND/OR
When multiple alarms are assigned to one output relay, you can choose to activate the alarm in one of the following ways (you can also use AND/OR with internal switches):
•AND: Activate the relay when all of the alarms assigned to it occur simultaneously.
•OR: Activate the relay when any of the alarms assigned to it occur.
•Energize or De-energize Operation
You can choose whether to energize or de-energize alarm output relays when an alarm occurs. If you select de-energize, the alarm output relays will be in the same state when the power is shut off as they are when an alarm occurs. This setting applies to all alarm output relays.
•Nonhold/Hold
When an alarm condition is no longer met, alarm relays can be set to:
•Turn OFF immediately (Nonhold).
•Remain ON until the execution of an alarm output release (AlarmACK) operation (Hold). This setting applies to all alarm output relays.
•Alarm Output Release Operation
The alarm output release operation (AlarmACK) stops the display and the relay output of all alarms. For information about how alarm display and output relay operations respond to an AlarmACK operation, see the previous page.
Note
When you enter Basic Setting Mode, the alarm output relay remains at its current active/ released state. In Basic Setting Mode, alarms are not detected and the AlarmACK operation is invalid.
Internal Switch
The MV can transmit the alarm status to software switches (30 internal switches). Internal switch values are shown below. As with AlarmACK, you can apply an AND or OR operation (see the previous page).
|
Alarm occurrence |
|||
Alarm |
|
|
|
|
|
|
Alarm release |
||
|
|
|
||
|
1 |
|
|
|
Internal switch |
|
|
|
|
0 |
|
|
|
|
|
|
|
|
|
Internal switches can be used as events with the event action function (for details, see section 1.7). Internal switches can also be written into computation channel (/M1 and /PM1 options) expressions.
1-8 |
IM MV1000-01E |
1.4Display
Common Display functions
•LCD Display and Its Layout
The MV1000 has a 5.5-inch (240 × 320 dot resolution) TFT color LCD. The MV2000 has a 10.4-inch (480 × 640 dot resolution) TFT color LCD. The display consists of a status display section and a data display section.
The MV1000 Display
 Status display section
Data display section
•Status Display Section
The status display section indicates the display name, date/time, batch name (when using the batch function), user name (when using the login function), internal memory and CF card usage, alarm occurrence, computation status (/M1 or /PM1 option), key lock status, and e-mail transmission.
•Data Display Section
The data display section shows measured data using numbers, waveforms, and bar graphs. It displays a configuration screen when you are configuring a function.
•Group Display
On the trend, digital, and bar graph displays, channel data is displayed in preset groups. With the MV1000, you can register up to 10 groups, each with up to 6 channels. With the MV2000, you can register up to 36 groups, each with up to 10 channels. The same groups are used for the trend, digital, and bar graph displays.
Displayed groups can be switched automatically at specified intervals (5 s to 1 min).
 For configuration instructions, see section 6.1.
•Channel Number Display and Tag Name Display
You can choose to label displayed channels according to their tag names or according to their channel numbers. This setting applies to all channels.
 For configuration instructions, see section 6.2.
•Update Interval of Measured Values
Measured values are updated every second. However, if the scan interval is longer than 1 s, measured values are updated at the scan interval.
 For configuration instructions, see section 6.3.
•Alarm Indication
The MV regularly checks for the alarms set to each channel and indicates alarms with the following symbols:
Alarm Type |
Symbol |
Alarm Type |
Symbol |
High limit alarm |
H |
High limit on rate-of-change alarm |
R |
Low limit alarm |
L |
Low limit on rate-of-change alarm |
r |
Difference high limit alarm |
h |
Delay high limit alarm |
T |
Difference low limit alarm |
l |
Delay low limit alarm |
t |
ewi 1 FeatureOverv
IM MV1000-01E |
1-9 |

1.4 Display
Status Display Section
The status display section contains the following information when the MV is in Operation or Setting Mode.
Memory Sampling Status
Data type
DISP: Display data
EVENT: Event data
Memory sampling icon
No memory sampling
Memory sampling in progress
Display paused (memory sampling continues)
The green bar indicates the memory sampling progress.
The frame represents either the length of one file save interval (with display data) or the length of one data segment (with event data).
Internal memory error. Contact your nearest YOKOGAWA dealer for repairs.
 The remaining memory sampling time.
 Indicates that the MV is waiting for an event data trigger.
When an event data pre-trigger is set, the part of the bar that represents the length of the pre-trigger section will be displayed in orange.
Display or group name
If all channels are being displayed with trend display, the group name display shows “ALL”.
Date and time
If the function that gradually adjusts the time is enabled, the time is displayed in yellow.
When using the batch function
Batch name (displayed alternately with the display name)
Date/time*
If the batch and lot numbers exceed 20 characters, the date/time area will also be used to display the batch and lot.
When using the login function
Current user name
Date/time*
(displayed alternately with the display name)
When using the login and batch functions Current user name
Batch name (displayed alternately with the display name and date/time*)
*With the MV2000, the date/time and batch name are displayed on different lines.
The green bar indicates the amount of used CF card memory. If Media FIFO is switched off, the bar
color will change to red when the amount of available CF card memory falls below 10%.
Alarm Icons
At least one alarm condition has been met.
This icon blinks when an alarm condition is (Red) met and AlarmACK has not been executed.
After an alarm condition has been met, all alarms have been released, but there is still
(Green) at least one alarm for which an AlarmACK operation has not been performed.
Status Icon
(Displayed alternately on models with the /M1 or /PM1 option)
 Key lock is on.
E-mail notification has been activated.
The condition set to the status output relay (/F1 option) has been met.
Math icon (/M1 and /PM1 options)
White icon: Math in progress
Yellow icon: Math data dropout
CF Card Icons
Accessing the CF card.
 Waiting.
Light blue icon: There is a CF card in the slot, but it is not connected properly.
Remove the CF card, and then reinsert it. There is a CF card error. To return the CF card icon to normal, perform the following:
•Remove the CF card, and then reinsert it.
•Exchange it with a functional CF card.
•Use the MV to format the CF card
(the CF card data will be deleted).
1-10 |
IM MV1000-01E |

1.4 Display
Trend Display (T-Y)
Displays measured data using waveforms. (For operating instructions, see section 5.2.)
|
|
|
|
|
|
|
|
|
|
|
|
|
|
Waveform (displayed with the set channel color) |
|
|
|||||||||||||||||||
|
|
|
|
|
|
|
|
|
|
|
|
|
|
|
|
||||||||||||||||||||
|
|
|
|
|
|
|
|
|
|
|
|
|
|
|
|
To change channel colors, see section 6.5 |
|
|
|||||||||||||||||
|
|
|
|
|
|
|
|
|
|
|
|
|
|
|
|
To change waveform line width, see section 6.10 |
|
|
|||||||||||||||||
|
|
|
|
|
|
|
|
|
|
|
|
|
|
|
|
To display every channel's waveform, see section 5.2 |
|||||||||||||||||||
|
|
|
|
|
|
|
|
|
|
|
|
|
|
|
|
|
|
|
|
|
|
|
|
|
Grid |
|
|
||||||||
|
|
|
|
|
|
|
|
|
|
|
|
|
|
|
|
|
|
|
|
|
|
|
|
|
|
|
|||||||||
|
|
|
|
|
|
|
|
|
|
|
|
|
|
|
|
|
|
|
|
|
|
|
|
|
|
Section 6.10 |
|
|
|||||||
Trend interval*1 |
|
|
|
|
|
|
|
|
|
|
|
|
|
|
|
|
|
You can display a fine grid. |
|||||||||||||||||
|
|
|
|
|
|
|
|
|
|
|
|
|
|
|
|
|
|
|
|
|
|
|
|
|
Fine grid |
||||||||||
|
|
Sections 5.2 |
|
|
|
|
|
|
|
|
|
|
|
|
|
|
|
|
|
|
|
|
|
|
|
|
|||||||||
|
|
|
|
|
|
|
|
|
|
|
|
|
|
|
|
|
|
|
|
|
|
|
|
|
|
||||||||||
and 6.3 |
|
|
|
|
|
|
|
|
|
|
|
|
|
|
|
|
|
|
|
|
|
|
|
|
|
Section 5.2 |
|||||||||
|
|
|
|
|
|
|
|
|
|
|
|
|
|
|
|
|
|
|
|
|
|
|
|
|
Current value mark |
|
|
||||||||
|
|
|
|
|
|
|
|
|
|
|
|
|
|
|
|
|
|
|
|
|
|
|
|
|
|
||||||||||
Trip line |
|
|
|
|
1 |
division |
|
|
|
|
|
Trend space function |
|||||||||||||||||||||||
|
|
|
|
|
|
|
|
|
|
|
|
|
|
|
|||||||||||||||||||||
|
|
|
|
|
|
|
|
|
|||||||||||||||||||||||||||
(up to four lines) |
|
|
|
|
|
|
|
|
|
|
|
|
|
|
|
|
|
|
|
|
|
|
|
|
|
Inserts a division-wide |
|||||||||
|
|
|
|
|
|
|
|
|
|
|
|
|
|
|
|
|
|
|
|
|
|
|
|
|
|||||||||||
|
|
Section 6.1 |
|
|
|
|
|
|
|
|
|
|
|
|
|
|
|
|
|
|
|
|
|
|
|
|
|
space here. |
|||||||
|
|
|
|
|
|
|
|
|
|
|
|
|
|
|
|
|
|
|
|
|
|
|
|
|
|
Numeric display |
|
|
Section 5.2 |
||||||
|
|
|
|
|
|
|
|
|
|
|
|
|
|
|
|
|
|
|
|
|
|
|
|
|
|
|
|||||||||
|
|
|
|
|
|
|
|
|
|
|
|
|
|
|
|
|
|
|
|
|
|
|
|
|
|
|
|
|
|||||||
|
|
|
|
|
|
|
|
|
|
|
|
|
|
|
|
|
|
|
|
|
|
|
|
|
|
section |
|
|
|
||||||
|
|
|
|
|
|
|
|
|
|
|
|
|
|
|
|
|
|
|
|
|
|
|
|
|
|
Section 5.2 |
|
|
|
||||||
|
|
|
|
|
|
Maximum value |
|
|
|
|
|
|
|
|
|
|
|
|
|
|
|
|
|
|
|
|
|
|
|
|
|
||||
|
|
|
|
|
|
|
|
|
|
|
|
|
|
|
|
|
|
|
|
|
|
|
|
|
|
|
|
|
|
||||||
The tag name or channel number, |
Measured |
|
|
|
|
|
|||||||||||||||||||||||||||||
|
|
|
|
|
|
Minimum value |
|
|
|
|
|
|
|||||||||||||||||||||||
|
|
|
|
|
|
|
|
|
|
|
|||||||||||||||||||||||||
|
|
|
|
|
|
|
1 dot |
|
|
|
measured value, unit, and the set |
value scale |
|
|
|||||||||||||||||||||
|
|
|
|
|
|
|
|
|
|
alarm |
Section 6.7 |
|
|
||||||||||||||||||||||
|
|
|
|
|
|
|
|
|
|
|
|
|
|
||||||||||||||||||||||
|
|
|
|
|
|
|
|
|
|
|
|
|
|
|
|
|
|
|
|
|
|
|
|
|
|
|
|
|
|
|
|
|
|
|
|
Displays the maximum and |
|
|
|
|
|
|
|
|
Alarm mark |
|
|
|
|
|
|
|
|
|
Alarm value mark |
||||||||||||||||
|
|
|
|
|
|
|
|
|
|
|
|
|
|
|
|
||||||||||||||||||||
minimum values sampled |
|
|
|
|
|
|
|
|
|
|
|
|
|
|
|
|
|
||||||||||||||||||
|
|
|
|
|
|
Alarm type |
|
|
|
|
|
|
|
|
|
Section 6.8 |
|||||||||||||||||||
in the time corresponding |
|
|
|
|
|
|
|
|
|
|
|
|
|
|
|
||||||||||||||||||||
|
|
|
|
|
|
|
|
|
|
|
|
|
|
|
Color scale band |
||||||||||||||||||||
to one dot. |
|
|
|
Time at the grid location |
|
|
|
|
|
|
|
|
|
||||||||||||||||||||||
|
|
|
|
|
|
|
|
|
|
|
|
||||||||||||||||||||||||
|
|
|
|
|
|
|
|
|
|
|
|
|
|
|
|
|
|
|
|
|
Section 6.8 |
||||||||||||||
|
|
|
|
|
|
|
|
|
|
|
|
|
|
|
|
|
|
|
|
|
|||||||||||||||
|
|
|
|
|
|
|
|
|
|
|
|
Either displays the time, or |
|
|
|
|
|
|
|
|
|
|
|||||||||||||
|
|
|
|
|
|
|
|
|
|
|
|
the date and time. |
|
|
|
|
|
|
|
|
|
|
|||||||||||||
|
|
|
|
|
|
|
|
|
|
|
|
|
|
Sections 6.3 and 9.1 |
|
|
|
|
|
|
|
|
|
Current value |
|||||||||||
|
|
|
|
|
Display layout |
Section 6.10 |
|
|
|
|
|
|
|
|
|
||||||||||||||||||||
|
|
|
|
|
|
|
|
|
|
|
|
|
|
Section 6.7 |
|||||||||||||||||||||
Vertical display
ewi 1 FeatureOverv
Horizontal split display (displays two groups)
The waveforms of two consecutive groups are displayed. The numeric display sections
Horizontal display show the data for the first four channels in their groups.
*1 When the trend interval is changed, only the time axis display changes. The sampling interval when recording display data (section 1.5) is specified by the Trend/Storage interval (section 4.1).
IM MV1000-01E |
1-11 |
1.4 Display
•Waveform Updating
Every 30 dots makes up one division (also referred to as DIV) on the time axis. The waveform update interval is the time corresponding to one dot. The time
corresponding to one dot depends on the time set to one division (the trend interval). The relationship between the trend interval and the speed of waveform movement in the display is as follows:
Trend interval (per DIV) |
5 s1 |
10 s1 |
15 s2 |
30 s |
1 min |
Time corresponding to one dot (in seconds) |
0.125 |
0.25 |
0.5 |
1 |
2 |
Speed of waveform movement (approximation in mm/h) |
10000 |
5000 |
2500 |
1250 |
625 |
|
|
|
|
|
|
Trend interval (per DIV) |
2 min |
5 min |
10 min |
15 min |
20 min |
Time corresponding to one dot (in seconds) |
4 |
10 |
20 |
30 |
40 |
Speed of waveform movement (approximation in mm/h) |
312 |
156 |
78 |
42 |
31 |
|
|
|
|
|
|
Trend interval (per DIV) |
30 min |
1 h |
2 h |
4 h |
10 h |
Time corresponding to one dot (in seconds) |
60 |
120 |
240 |
480 |
1200 |
Speed of waveform movement (approximation in mm/h) |
21 |
10 |
5.2 |
2.6 |
1.0 |
140 dots per division. Available on high-speed input models of the MV.
2Available on medium-speed input models of the MV when in fast sampling mode .
Switching Trend Intervals (For instructions on how to set the second interval, see section 6.3.)
You can press T/DIV to change the trend interval. You can also switch from the ordinary trend interval to the secondary trend interval, and vice versa, while the MV is collecting data.
• Writing Messages
Preset messages Trend display
1Start
2Material 1
Free messages
You can enter non-preset messages.
Preset Messages (For configuration and operating instructions, see section 6.4.) You can choose preset messages to be written on the waveform.
Max. number of messages: 100 (Messages 1 through 10 are free messages.)
Free Messages (For configuration and operating instructions, see section 6.4.) You can enter non-preset messages.
Max. number of free messages: 10
Automatically written messages(For configuration instructions, see sections 6.3 and 6.17.)
•The MV will automatically write a message to indicate when the trend update rate has been switched during memory sampling.
•The MV will automatically write a message to indicate when power has been restored after a power failure that occurs during memory sampling.
Message Display Options
•When using horizontal or horizontal split display, messages can be displayed either vertically or horizontally. (For configuration instructions, see section 6.10.)
•Messages can be displayed as a group in the upper left corner of the screen (list display). (For operating instructions, see section 5.2.)
List display
Vertical display
1-12 |
IM MV1000-01E |

1.4 Display
•Zone Display
You can display channels in specified zones. This allows you to separate waveforms so that they don’t overlap.
In the following example, channel 1 is set to 0-30%, channel 2 is set to 30-60%, and channel 3 is set to 60-100%.
Without zone display |
With zone display |
|
100% |
|
CH3 |
|
CH2 |
|
CH1 |
Time axis |
0% |
Time axis |
 For configuration instructions, see section 6.6.
100%
Zone 3
 60% Zone 2
  30% Zone 1
0%
Auto Zone (For operating instructions, see section 5.2.)
You can divide the trend display area evenly between each channel in a group.
•Partial Expansion
This function enables you to compress part of the display and expand the rest of it. In the following example, the display below 0 V (the boundary value) is shifted to the bottom 30% of the screen. The bottom 30% of the screen displays –6 V to 0 V, while the top 70% displays 0 V to 6 V.
Without partial expansion |
With partial expansion |
|
|
Percentage of |
|
Percentage of |
|
Measured value |
display span % |
Measured value |
display span % |
||
6 V |
|
100 |
6 V |
100 |
|
Boundary |
|
|
|
Boundary Expanded |
|
|
|
|
value |
area |
|
value |
|
|
|
||
|
50 |
|
shifted |
|
|
0 |
|
|
|
||
|
|
|
|
location |
|
|
|
|
0 |
30 |
Compressed |
|
|
|
|
|
|
–6 V |
|
0 |
–6 V |
0 |
area |
Time axis |
|
||||
|
|
Time axis |
|
|
|
 For configuration instructions, see section 6.9.
•Alarm Display
The alarm mark, alarm type, and measured values are displayed in the following
ways, depending on the alarm condition.
|
|
|
Indicationnotheld |
|
|
|
|
Indicationheld |
|
|
|
|||||||||
|
|
|
|
|
|
|
|
|
|
|||||||||||
|
Occurrence |
|
|
|
|
|
|
|
AlarmACK |
|
|
AlarmACK |
|
|
||||||
Alarm |
|
|
|
|
|
|
|
|
|
|
|
|
|
|
|
|
||||
|
Release |
|
|
|
|
|
|
|
|
|
|
|
|
|
|
|
|
|
|
|
|
|
|
|
|
|
|
|
|
|
|
|
|
|
|
|
|
|
|
||
|
|
|
|
|
|
|
|
|
|
|
|
|
|
|
|
|
|
|||
|
|
|
|
|
|
|
|
|
|
|
|
|
|
|
|
|
|
|
||
Alarm mark |
Green |
|
Red |
Green |
Green |
Blinking |
Blinking Green |
Green |
Blinking |
Red |
Green |
|||||||||
|
|
|
|
|
|
|
|
|
|
|
red |
green |
|
|
|
|
red |
|
|
|
|
|
|
|
|
|
|
|
|
|
|
|
|
|
|
|
|
|
|
|
|
Alarm type |
None |
|
Red |
None |
None |
Red |
None |
None |
None |
Red |
Red |
None |
||||||||
|
|
|
|
|
|
|
|
|
|
|
|
|
|
|
|
|
|
|
|
|
|
|
|
|
|
|
|
|
|
|
|
|
|
|
|
|
|
|
|
|
|
Measured |
Blue |
|
|
Red |
Blue |
Blue |
Red |
Blue |
Blue |
|
Blue |
Red |
Red |
Blue |
||||||
value |
|
|
|
|||||||||||||||||
|
|
|
|
|
|
|
|
|
|
|
|
|
|
|
|
|
|
|
|
|
ewi 1 FeatureOverv
IM MV1000-01E |
1-13 |

1.4 Display
Digital Display
Displays measured data using large numeric symbols.
 For operating instructions, see section 5.2.
 Measured value
Unit
Alarm mark
Tag name or channel number
Note
•Measurement Channel Numeric Value Display
When the MV detects a range-out (see below), the display is either “+Over” or “-Over.” When the MV detects a burnout on a channel that has been set to be checked for burnouts, the display is “Burnout”. All other values are displayed numerically.
Range-outs are detected on measurement channels in the following circumstances.
•If the DC voltage input value goes above the measurable range ± 5%, a range-out is detected. For example, when the measurement range is 2 V, the measurable range is –2.000 to 2.000 V. If the voltage exceeds 2.200 V, a positive range-out is detected. If it goes below –2.200 V, a negative range-out is detected.
•If the input type is thermocouple or RTD, a range-out is detected when the temperature goes 10°C above or below the measurable range. For example, when the measurement range is set to R, the measurable range is 0.0 to 1760.0°C. If the temperature exceeds 1770.0°C, “+Over” will be displayed. If the temperature goes below -10.0°C, “-Over” will be displayed.
•On channels that use linear scaling, the range-out values, ignoring the decimal point, are above 30000 and below –30000. However, you can also set the range-out values to 105% or greater, and –5% or less of the scale width, as long as those values fall within ±30000.
 For configuration instructions, see section 3.11.
•Computation Channel Numeric Value Display
 See section 1.9.
•External Input Channel Numeric Value Display (/MC1 option)
The range of displayable values, ignoring the decimal point, is –30000 to 30000. The decimal place is determined by the location of the decimal point on the external input channel’s minimum span value. Regardless of maximum and minimum span value settings, all values within the range of –30000 to 30000 will be displayed. If the value exceeds 30000, “+Over” will be displayed. If the value goes below –30000, “-Over” will be displayed.
•Alarm Display
The alarm mark and measured values are displayed in the following ways depending on the alarm condition.
|
|
|
Indicationnotheld |
|
|
|
Indicationheld |
|
|
|
|||||||
|
|
|
|
|
|
|
|
|
|||||||||
|
Occurrence |
|
|
|
|
|
|
AlarmACK |
|
|
AlarmACK |
||||||
Alarm |
|
|
|
|
|
|
|
|
|
|
|
|
|
|
|||
|
Release |
|
|
|
|
|
|
|
|
|
|
|
|
|
|
|
|
|
|
|
|
|
|
|
|
|
|
|
|
|
|
|
|
|
|
|
|
|
|
|
|
|
|
|
|
|
|
|
|
|
|
|
|
|
|
|
|
|
|
|
|
|
|
|
|
|
|
|
|
||
Alarm mark Green |
Red |
Green |
Green |
Blinking |
Blinking Green |
Green |
Blinking |
Red |
Green |
||||||||
|
|
|
|
|
|
|
|
|
red |
green |
|
|
red |
|
|
|
|
|
|
|
|
|
|
|
|
|
|
|
|
|
|
|
|
|
|
Measured |
Blue |
Red |
Blue |
Blue |
Red |
Blue Blue |
|
Blue |
Red |
Red |
Blue |
||||||
value |
|
|
|||||||||||||||
|
|
|
|
|
|
|
|
|
|
|
|
|
|
|
|
|
|
1-14 |
IM MV1000-01E |
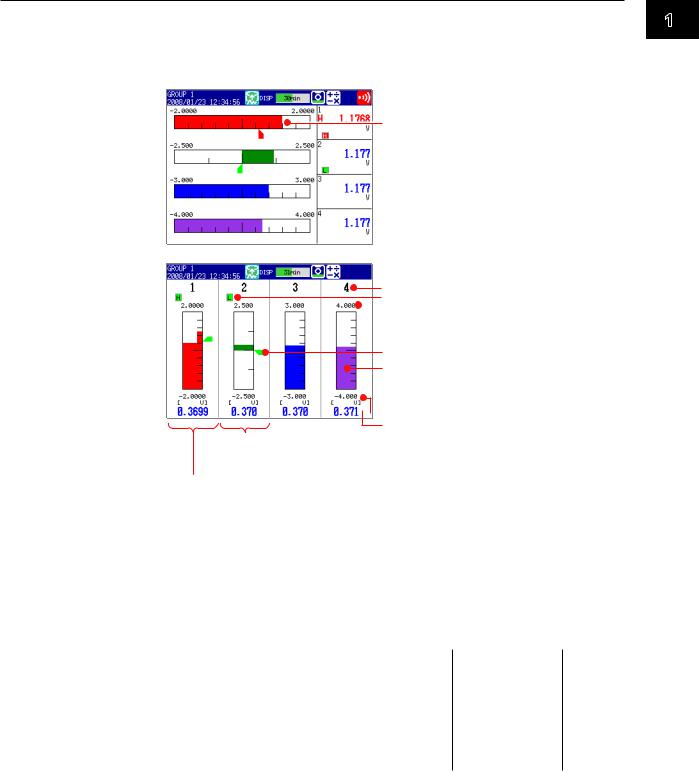
1.4 Display
Bar Graph Display
Displays measured data using bar graphs.
 For operating instructions, see section 5.2.
Horizontal
The bar graph base position is set to Normal,
Lower, or Upper.
 Section 6.11

 The bar graph base position is set to Center.
 Section 6.11
Vertical  Section 6.10
Tag name or channel number Alarm mark
 Maximum value
 Scale
Scale
 Section 6.7
Alarm value mark
Bar
(displayed with the set channel color)  Section 6.11

 Unit of measurement and minimum value
Measured value
The bar graph base position is set to Center.  Section 6.11
The bar graph base position is set to Normal, Lower, or Upper.
 Section 6.11
•Bar Graph Display Updating
The bar graph display is updated at the same rate as numeric values.
•Alarm Display
The alarm mark, alarm value mark, and measured values are displayed in the following ways, depending on the alarm condition.
|
|
|
Indicationnotheld |
|
|
|
|
Indicationheld |
|
|
|
|||||||||
|
|
|
|
|
|
|
|
|
|
|||||||||||
|
Occurrence |
|
|
|
|
|
|
|
AlarmACK |
|
|
AlarmACK |
|
|
||||||
Alarm |
|
|
|
|
|
|
|
|
|
|
|
|
|
|
|
|
||||
|
Release |
|
|
|
|
|
|
|
|
|
|
|
|
|
|
|
|
|
|
|
|
|
|
|
|
|
|
|
|
|
|
|
|
|
|
|
|
|
|
||
|
|
|
|
|
|
|
|
|
|
|
|
|
|
|
|
|
|
|||
|
|
|
|
|
|
|
|
|
|
|
|
|
|
|
|
|
|
|
||
Alarm mark |
Green |
|
Red |
Green |
Green |
Blinking |
Blinking Green |
Green |
Blinking |
Red |
Green |
|||||||||
|
|
|
|
|
|
|
|
|
|
|
red |
green |
|
|
|
|
red |
|
|
|
|
|
|
|
|
|
|
|
|
|
|
|
|
|
|
|
|
|
|
|
|
Value mark |
Green |
|
Red |
Green |
Green |
Red |
Green |
Green |
Green |
Red |
Red |
Green |
||||||||
|
|
|
|
|
|
|
|
|
|
|
|
|
|
|
|
|
|
|
|
|
|
|
|
|
|
|
|
|
|
|
|
|
|
|
|
|
|
|
|
|
|
Measured |
Blue |
|
|
Red |
Blue |
Blue |
Red |
Blue |
Blue |
Blue |
Red |
Red |
Blue |
|||||||
value |
|
|
||||||||||||||||||
|
|
|
|
|
|
|
|
|
|
|
|
|
|
|
|
|
|
|
|
|
1
Overview Feature
IM MV1000-01E |
1-15 |
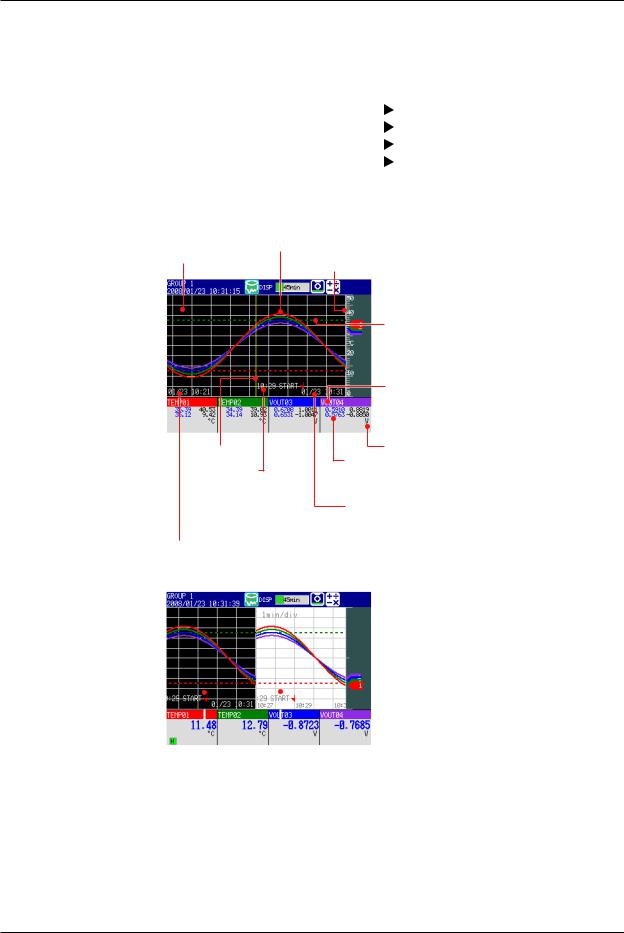
1.4 Display
Historical Trend
The MV can display the waveforms of past measured data (display or event data) stored in internal or external memory. This function is called historical trend.
•Historical Trend Display Options
There are five ways that you can display measured data stored in internal memory:
• |
From the alarm summary display. |
See section 5.7. |
• |
From the message summary display. |
See section 5.8. |
• |
From the memory summary display. |
See section 5.9. |
• |
From the display selection menu. |
See section 5.3. |
• |
By pressing HISTORY. |
|
You can also display measured data stored to external memory.  See section 4.8.
• Display Contents
Background color (Changeable)
Cursor
Message
Waveform (channel display color)
Location of the most recent data
Trip line
Tag name or channel number
(channel display color)
 Measured values (maximum and minimum
values for the entire display*)
Unit
Measured values (maximum and minimum values at the cursor position*)
* You can also just display the digital values at the cursor position.
Date and time at the right end of the time axis** or the time at the cursor position
(The time at the cursor position is surrounded by a yellow square.)
Date and time at the left end of the time axis**
** You can also set this area to display the time relative to the start of recording.
Half screen display
|
|
|
|
|
|
|
|
Present trend |
|
|
Historical trend |
|
|
|
|
|
|
|
|
|
Item |
|
Description |
|
|
Alarm summary |
|
Displays a summary of the displayed data’s alarms. |
|
|
Message summary |
|
Displays a summary of the displayed data’s messages. |
|
|
Memory summary |
|
Displays the properties (file name, sample start time, end time, |
|
|
|
|
|
etc.) of the displayed data. |
• Add Message |
|
|
||
You can enter added messages.
 For operating instructions, see section 6.4.
1-16
IM MV1000-01E

1.4 Display
•Auto Span
The MV can automatically adjust the display span of the selected channel.* It sets the span based on the maximum and minimum displayed historical data values. Auto span is deactivated when you switch to another group.
*Auto span affects channels that are in the same scale position as the selected channel.
When the maximum or minimum values are outside of the set display span
Measured value |
Measured value |
0
Auto span 0
Time axis |
Time axis |
When the maximum or minimum values are within the set display span
Measured value |
Measured value |
0 |
0 |
|
Auto span |
Time axis |
Time axis |
If the maximum or minimum data value falls outside the maximum selectable display span, the MV adjusts the display span to the maximum or minimum possible value.
The MV responds in the same way when it encounters overflow data.
•Top Channel
Displays the selected channel’s historical trend waveform in front of all of the others. This setting is deactivated when you switch to another group.
ewi 1 FeatureOverv
IM MV1000-01E |
1-17 |
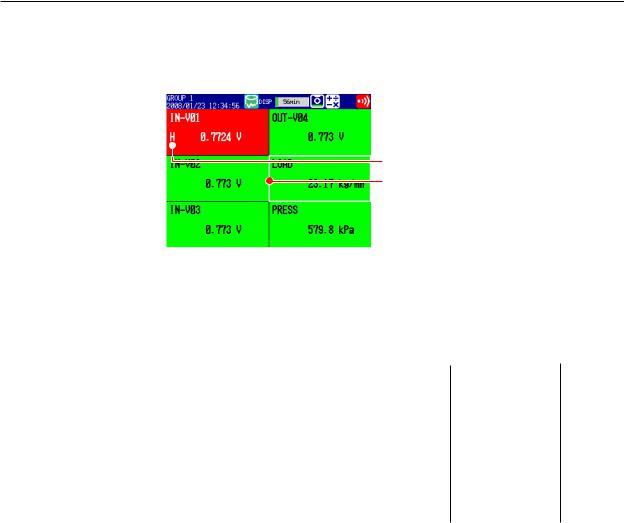
1.4 Display
Overview
Displays a list that shows the conditions of all channels.
You can select a channel to access the trend, digital, or bar graph display of its group.  For operating instructions, see section 5.4.

 Channels with active alarms are red.
Alarm type
Cursor
 Tag name or channel number
 Measured value and unit
•Alarm Indication
The channel display area, channel number, tag name, alarm type, and measured value all change in appearance based on alarm conditions in the following ways.
|
|
|
|
Whenindicationis |
|
|
|
|
Whenindicationis |
|
|
|
||||||||
|
|
|
|
|
|
|
|
|
|
|
||||||||||
|
|
|
|
settonon-hold |
|
|
|
|
settohold |
AlarmACK |
|
|
||||||||
|
|
Occurrence |
|
|
|
|
|
|
AlarmACK |
|
|
|
|
|||||||
Alarm |
|
|
|
|
|
|
|
|
|
|
|
|
|
|
|
|||||
|
|
Release |
|
|
|
|
|
|
|
|
|
|
|
|
|
|
|
|
|
|
|
|
|
|
|
|
|
|
|
|
|
|
|
|
|
|
|
|
|
||
|
|
|
|
|
|
|
|
|
|
|
|
|
|
|
|
|
|
|||
|
|
|
|
|
|
|
|
|
|
|
|
|
|
|
|
|
|
|||
|
Tag/Channel Black |
|
White |
Black |
Black |
Blinking |
Blinking |
Black |
Black |
Blinking |
White |
Black |
||||||||
|
|
|
|
|
|
|
|
|
|
|
white |
black |
|
|
|
|
white |
|
|
|
|
|
|
|
|
|
|
|
|
|
|
|
|
|
|
|
|
|
|
|
|
|
Channel |
Green |
|
Red |
Green |
Green |
Red |
Green |
Green |
Green |
Red |
Red |
Green |
|||||||
|
area |
|
|
|
|
|
|
|
|
|
|
|
|
|
|
|
|
|
|
|
|
|
|
|
|
|
|
|
|
|
|
|
|
|
|
|
|
|
|
||
|
Alarm type |
None |
|
White |
None |
None |
White |
None |
None |
None |
White |
White |
None |
|||||||
|
|
|
|
|
|
|
|
|
|
|
|
|
|
|
|
|
|
|
|
|
|
|
|
|
|
|
|
|
|
|
|
|
|
|
|
|
|
|
|
|
|
|
Measured |
Black |
|
White |
Black |
Black |
White |
Black |
Black |
Black |
White |
White |
Black |
|||||||
|
value |
|
|
|||||||||||||||||
|
|
|
|
|
|
|
|
|
|
|
|
|
|
|
|
|
|
|
|
|
1-18 |
IM MV1000-01E |
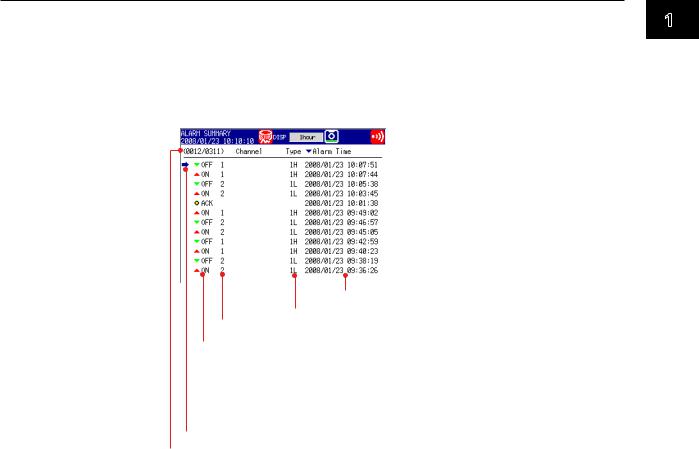
1.4 Display
Alarm Summary
You can list up-to-date alarm information.
•The data of up to 1000 alarms can be displayed.
•You can select alarm information to access the historical trend of the display data or
event data that contains the alarm.
 For operating instructions, see section 5.7.
 To the historical trend display
Date/time of alarm occurrence/release
Alarm number (1, 2, 3, 4) and type (H, L, h, l, R, r, T, t)
Channel
 : Alarm occurrence
( blinks until the AlarmACK operation is carried out if Indicator is set to Hold.)
 : Alarm release
 : Alarm output release (when blinking is cleared through the AlarmACK operation)
Cursor (selects an alarm)
The alarm information number of the alarm on the screen’s bottom line and the number of alarm entries in internal memory.
ewi 1 FeatureOverv
IM MV1000-01E |
1-19 |

1.4 Display
Message Summary
You can display a list of messages and when they were written.
•Up to 450 messages can be displayed.
•Up to 50 added messages can be displayed.
•You can select message information to access the historical trend of the display data
or event data that contains the message.  For operating instructions, see section 5.8.
Message
Added message (blue)
Cursor (used to select a message)
 To the historical trend display
The groups on which the message was written Displays a group number, or A for all groups
Date and time when the message was written
The message number displayed on the screen’s bottom line and the number of message entries in internal memory.
•Switching Displayed Items
You can switch between two sets of displayed items.
•Message, date and time, and group
•Message and the name of the user who wrote the message
1-20 |
IM MV1000-01E |
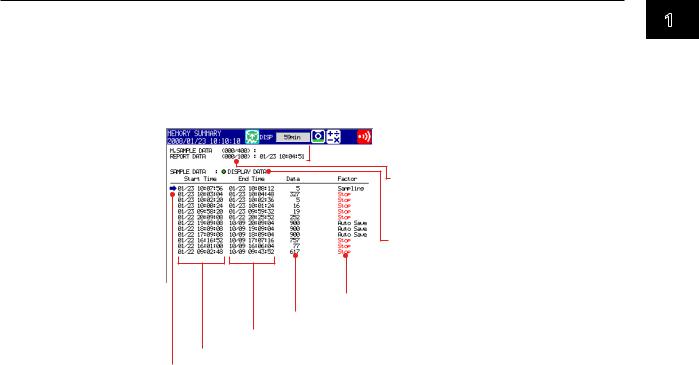
1.4 Display
Memory Summary
You can display a list of the display and event data that is stored in internal memory.
•You can select a display data or event data entry to access its historical trend display.
•The MV displays the number of manually sampled data and report data (/M1 and
/PM1 options) samples.
 For operating instructions, see section 5.9.
 Date and time of the most recently
recorded data
Internal memory data files/ maximum number of recordable files
 To the historical trend display
Data type
• Display data
• Event data
Status
Sampling count
Memory stop date and time
Memory start date and time
Cursor (selects a file)
•Switching Displayed Items
You can switch between two lists of information.
•Start and stop times
•File names
•Data Storage
You can save the data in the internal memory to a CF card or to USB flash memory.
ewi 1 FeatureOverv
IM MV1000-01E |
1-21 |
Loading...