


 Loading...
User’s
Manual
Model FX1002/FX1004/
FX1006/FX1008/FX1010/FX1012
FX1000
IM 04L21B01-01EN
3rd Edition

Thank you for purchasing the FX1000 (hereafter referred to as “FX”).
This User’s Manual explains how to use the FX. To ensure correct use, please read this manual thoroughly before operation.
The following manuals are provided for the FX:
• Paper Manual
Manual Title |
Manual No. |
Description |
FX1000 |
IM 04L21B01-03EN |
This guide is printed on A3-size paper and explains how |
Safety Precautions and Installation Guide |
to install and wire the FX |
|
How to Use the CD |
|
This guide is printed on A4-size paper and describes how |
Installing FXA120 DAQSTANDARD and |
IM 04L21B01-66EN to install DAQSTANDARD, how to open the electronic |
|
Opening FX1000 Manuals |
|
manuals, and the mode menu map of the FX. |
•Electronic Manuals Provided on the Accompanying CD-ROM
FX1000
Manual Title |
Manual No. |
Description |
|
FX1000 |
IM 04L21B01-02EN |
Explains the basic operations of the FX. |
|
First Step Guide |
|||
|
|
||
FX1000 |
|
This manual. Describes how to use the FX. The |
|
User’s Manual |
IM 04L21B01-01EN |
communication and network functions, custom display |
|
|
|
functions, and some of the options are excluded. |
|
FX1000 |
|
Describes how to use communication functions through |
|
Communication Interface |
IM 04L21B01-17EN |
||
an Ethernet or serial interface. |
|||
(/C2, /C3, and /C7) |
|
|
|
FX1000 |
IM 04L21B01-03EN |
This is the same as the printed copy. |
|
Safety Precautions and Installation Guide |
DAQSTANDARD for FX1000
Manual Title |
Manual No. |
Description |
|
FXA120 |
|
|
|
DAQSTANDARD for FX1000 |
IM 04L21B01-63EN |
Describes how to use the DAQSTANDARD viewer. |
|
Data Viewer |
|
|
|
FXA120 |
|
Describes how to use the DAQSTANDARD hardware |
|
DAQSTANDARD for FX1000 |
IM 04L21B01-64EN |
||
configurator. |
|||
Hardware Configurator |
|
|
|
How to Use the CD |
|
|
|
Installing FXA120 DAQSTANDARD and |
IM 04L21B01-66EN This is the same as the printed copy. |
||
Opening FX1000 Manuals |
|
|
|
Notes
•The contents of this manual are subject to change without prior notice as a result of continuing improvements to the instrument’s performance and functions.
•Every effort has been made in the preparation of this manual to ensure the accuracy of its contents. However, should you have any questions or find any errors, please contact your nearest YOKOGAWA dealer.
•Copying or reproducing all or any part of the contents of this manual without YOKOGAWA’s permission is strictly prohibited.
•The TCP/IP software of this product and the document concerning the TCP/IP software have been developed/created by YOKOGAWA based on the BSD Networking Software, Release 1 that has been licensed from the Regents of the University of California.
3rd Edition: January 2013 (YK)
All Right Reserved, Copyright © 2011, Yokogawa Electric Corporation
IM 04L21B01-01EN
i

Trademarks
•vigilantplant is a registered trademark of Yokogawa Electric Corporation.
•Microsoft and Windows are registered trademarks or trademarks of Microsoft Corporation in the United States and/or other countries.
•Adobe and Acrobat are registered trademarks or trademarks of Adobe Systems Incorporated.
•Company and product names that appear in this manual are registered trademarks or trademarks of their respective holders.
•The company and product names used in this manual are not accompanied by the registered trademark or trademark symbols (® and ™).
Revision History
1st Edition: |
November, 2011 |
|
2nd Edition: September, 2012 |
|
|
3rd Edition: |
January, 2013 |
|
|
|
|
Revision |
Product |
Added or Changed Features |
1 |
Firmware version 1.00 |
New edition |
2 |
Firmware version 1.1x |
Italian, Spanish, Portuguese, Russian, and Korean |
|
|
have been added to the available display languages. |
|
|
Log input option has been added. Improvements to |
|
|
descriptions. |
3 |
Ditto |
Revised for DAQSTANDARD 9.03 Release |
ii |
IM 04L21B01-01EN |

How to Use This Manual
Structure of the Manual
Before reading this manual, familiarize yourself with the basic operations of this instrument by reading the First Step Guide. For a description of the communication function and the accompanying software program, DAQSTANDARD for FX1000, read the respective manual.
This user’s manual consists of the following sections.
Chapter |
Title and Contents |
1Overview of Functions
Explains the features of the FX.
2Common Operations
Describes the procedure to set the time and the operating procedure using the keyboard (/USB1 option).
3Measurement Channels and Alarms
Describes how to set the measurement conditions and alarms.
4Switching Operation Screens
Describes the operations on the operation screen.
5Operations for Changing the Displayed Contents
Describes how to change the displayed contents on the operation screen and how to write messages.
6Saving and Loading Data
Describes how to acquire and store data. Also describes the procedure to load measured data/setup data on the CF card or the USB flash memory (/USB1 option).
7Customizing Actions Using the Event Action and Remote Control Functions (/R1 and /PM1 Options)
Describes how to carry out specific actions when a given event occurs, when a remote control signal is applied, and when the USER key is pressed.
8Using the Security Function
Describes how to use the key lock function and the function that allows only registered users to operate the FX.
9Computation and Report Functions (/M1, /PM1, and /PWR1 options)
Describes how to use computation channels and how to create reports such as hourly, daily, weekly, and monthly reports.
10Troubleshooting
Describes error messages and troubleshooting.
11Maintenance
Explains how to inspect and calibrate the FX.
12Installation and Wiring
Contains information about where to install the FX, how to install the FX, and how to wire the FX.
13Specifications
Contains the specifications of the FX.
14Setup Items
Contains the FX setting mode menu map, basic setting mode menu map, and setup items
Appendix Describes how to estimate the file size, the types of data that the FX can generated and how to use them, the data format of text files, etc.
Index
Note
•This user’s manual covers information regarding FX1000s that have a suffix code for language “-2” (English).
•For details on setting the display language, see section 2.6, “Changing the Displayed Language.”
IM 04L21B01-01EN |
iii |
How to Use This Manual
Conventions Used in This Manual
Unit
KDenotes 1024. Example: 768 KB (file size)
kDenotes 1000.
Markings
|
|
Improper handling or use can lead to injury to the user or |
|
|
damage to the instrument. This symbol appears on the |
|
|
instrument to indicate that the user must refer to the user’s |
|
|
manual for special instructions. The same symbol appears in |
|
|
the corresponding place in the user’s manual to identify those |
|
|
instructions. In the manual, the symbol is used in conjunction |
|
|
with the word “WARNING” or “CAUTION.” |
|
|
Calls attention to actions or conditions that could cause serious |
WARNING |
||
|
|
or fatal injury to the user, and precautions that can be taken to |
|
|
prevent such occurrences. |
|
|
Calls attentions to actions or conditions that could cause light |
CAUTION |
|
|
|
|
injury to the user or damage to the instrument or user’s data, and |
|
|
|
|
|
precautions that can be taken to prevent such occurrences. |
Note
Subheadings
Bold characters
A a # 1
Procedure
Explanation
Calls attention to information that is important for proper operation of the instrument.
Denotes key or character strings that appear on the screen. Example: Volt
Indicates character types that can be used.
A Uppercase alphabet, a lowercase alphabet, # symbols, 1 numbers.
Carry out the procedure according to the step numbers. All procedures are written with inexperienced users in mind; depending on the operation, not all steps need to be taken. Explanation gives information such as limitations related the procedure.
Setup Screen Indicates the setup screen and explains the settings. A
|
detailed description of the function is not provided in this |
|
Setup Items |
||
section. For details on the function, see chapter 1. |
||
|
iv |
IM 04L21B01-01EN |

Contents
How to Use This Manual..................................................................................................................iii
Chapter 1 Overview of Functions
1.1 |
Input Section........................................................................................................................ |
1-1 |
1.2 |
Alarms.................................................................................................................................. |
1-5 |
1.3 |
Display.................................................................................................................................. |
1-9 |
1.4 |
Data Storage Function....................................................................................................... |
1-23 |
1.5 |
Batch Function................................................................................................................... |
1-32 |
1.6 |
Event Action and Remote Control Functions (/R1 and /PM1 Options)............................... |
1-33 |
1.7 |
Security Function................................................................................................................ |
1-38 |
1.8 |
Computation and Report Functions (/M1, /PM1, and /PWR1 Options).............................. |
1-40 |
1.9 |
FAIL/Status Output Function (/F1 Option).......................................................................... |
1-47 |
1.10 |
Other Functions.................................................................................................................. |
1-49 |
Chapter 2 Common Operations
2.1 |
Setting the Date/Time........................................................................................................... |
2-1 |
2.2 |
Setting the Time Difference from GMT................................................................................. |
2-2 |
2.3 |
Setting the Time Correction Operation during Memory Sampling........................................ |
2-3 |
2.4 |
Setting the Date Format....................................................................................................... |
2-4 |
2.5 |
Viewing the FX Information.................................................................................................. |
2-5 |
2.6 |
Changing the Displayed Language...................................................................................... |
2-7 |
2.7 |
Setting the LCD Brightness and Backlight Saver................................................................. |
2-8 |
2.8 |
Initializing Settings and Clearing the Internal Memory......................................................... |
2-9 |
2.9 |
Using the Relay Contact to Output the FX Status (/F1 option)........................................... |
2-10 |
2.10 |
Controlling the FX with a Keyboard (/USB1 option)............................................................ |
2-11 |
2.11 |
Using USB Flash Memory (/USB1 option)......................................................................... |
2-13 |
2.12 |
Setting the Decimal Point Type.......................................................................................... |
2-14 |
Chapter 3 Measurement Channels and Alarms
3.1 |
Setting the Scan Interval and the Integration Time of the A/D Converter............................. |
3-1 |
3.2 |
Setting the Burnout Detection and the Reference Junction Compensation of the |
|
|
Thermocouple Input............................................................................................................. |
3-2 |
3.3 |
Setting the Input Range........................................................................................................ |
3-3 |
3.4 |
Setting the Moving Average of the Input............................................................................... |
3-7 |
3.5 |
Setting the Auxiliary Alarm Function..................................................................................... |
3-8 |
3.6 |
Hiding the Alarm Indication.................................................................................................. |
3-11 |
3.7 |
Setting Alarms on Channels............................................................................................... |
3-12 |
3.8 |
Releasing the Alarm Output (Alarm ACK Operation).......................................................... |
3-15 |
3.9 |
Performing Calibration Correction (/CC1 Option)............................................................... |
3-16 |
3.10 |
Counting Pulses (/PM1 Option).......................................................................................... |
3-17 |
3.11 |
Setting the Method of Detecting Over-Range Values of Linearly Scaled Measurement |
|
|
Channels............................................................................................................................ |
3-20 |
3.12 |
Measuring Power (/PWR1 Option)..................................................................................... |
3-21 |
3.13 |
Using the Log Scale to Perform Measurements (/LG1 Option).......................................... |
3-28 |
1
2
3
4
5
6
7
8
9
10
11
12
13
14
App
Index

IM 04L21B01-01EN |
v |
|
|
Contents |
Chapter 4 Switching Operation Screens |
|
|
4.1 |
Operations in Operation Mode............................................................................................. |
4-1 |
4.2 |
Displaying the Measured Data as Waveforms, Values, or Bar Graphs ............................... |
4-4 |
4.3 |
Displaying Past Measured Data (Historical Trend Display).................................................. |
4-8 |
4.4 |
Display the Statuses of All Channels on One Screen (Overview Display)......................... |
4-16 |
4.5 |
Displaying Various Information........................................................................................... |
4-17 |
4.6 |
Using the Alarm Summary.................................................................................................. |
4-19 |
4.7 |
Using the Message Summary............................................................................................ |
4-20 |
4.8 |
Using the Memory Summary.............................................................................................. |
4-22 |
4.9 |
Displaying a List of Operation Logs.................................................................................... |
4-25 |
4.10 |
Displaying Stacked Bar Graphs (/M1, /PM1, and /PWR1 Options).................................... |
4-29 |
Chapter 5 Operations for Changing the Displayed Contents |
|
|
5.1 |
Setting Display Groups......................................................................................................... |
5-1 |
5.2 |
Displaying Tags or Channel Numbers.................................................................................. |
5-3 |
5.3 |
Setting the Trend Interval and Switching to the Secondary Trend Interval........................... |
5-4 |
5.4 |
Writing Messages................................................................................................................. |
5-6 |
5.5 |
Changing the Channel Display Colors................................................................................. |
5-9 |
5.6 |
Displaying Channels in Display Zones............................................................................... |
5-10 |
5.7 |
Displaying a Scale on the Trend Display............................................................................. |
5-11 |
5.8 |
Displaying Alarm Point Marks and Color Scale Band on the Scale.................................... |
5-14 |
5.9 |
Partially Expanding the Waveform..................................................................................... |
5-16 |
5.10 |
Changing the Display Layout, Clearing of the Waveform at Start, Message Display Direction, |
|
|
Waveform Line Width, and Grid......................................................................................... |
5-18 |
5.11 |
Changing the Bar Graph Display Method........................................................................... |
5-19 |
5.12 |
Changing the Background Color of the Display................................................................. |
5-22 |
5.13 |
Automatically Switching Display Groups............................................................................ |
5-23 |
5.14 |
Automatically Switching Back to the Default Display......................................................... |
5-24 |
5.15 |
Writing a Message When the FX Recovers from a Power Failure..................................... |
5-25 |
5.16 |
Changing the Function menu and Display Selection Menu................................................ |
5-26 |
Chapter 6 Saving and Loading Data |
|
|
6.1 |
Setting the Recording Conditions of the Measured Data..................................................... |
6-1 |
6.2 |
Setting the Method for Saving the Data............................................................................... |
6-4 |
6.3 |
Using the Batch Function..................................................................................................... |
6-6 |
6.4 |
Starting and Stopping Recording and Saving Measured Data............................................. |
6-9 |
6.5 |
Manually Saving the Measured Data (Manual Sample)..................................................... |
6-13 |
6.6 |
Saving the Screen Image Data (Snapshot)........................................................................ |
6-14 |
6.7 |
Managing the Files on the External Storage Medium........................................................ |
6-15 |
6.8 |
Loading and Displaying Measured Data from External Storage Media.............................. |
6-17 |
6.9 |
Saving/Loading the Setup Data.......................................................................................... |
6-18 |
Chapter 7 Customizing Actions Using the Event Action and Remote Control
Functions
(/R1 and /PM1 Options)
7.1Setting the Event Action Function (Including the remote control function of the /R1 and /PM1
options and the USER key).................................................................................................. |
7-1 |
7.2 Setup Examples of Event Action.......................................................................................... |
7-5 |
vi |
IM 04L21B01-01EN |

Contents
Chapter 8 Using the Security Function
8.1 |
Disabling the Key Operation (Key Lock Function)................................................................ |
8-1 |
8.2 |
Enabling Only Registered Users to Operate the FX (Login Function).................................. |
8-3 |
8.3 |
Logging in and Logging Out................................................................................................. |
8-6 |
Chapter 9 Computation and Report Functions (/M1, /PM1, and /PWR1 Options)
9.1Setting the Expression, Measurement Range, Alarm, Tag, and Data Storage on Computation
|
Channels.............................................................................................................................. |
9-1 |
9.2 |
Writing Expressions.............................................................................................................. |
9-5 |
9.3 |
Displaying the Computation Channels............................................................................... |
9-12 |
9.4Starting/Stopping Computation, Resetting Computation, and Releasing Computation Data
|
|
Dropout Display.................................................................................................................. |
9-15 |
|
9.5 |
Creating Reports................................................................................................................ |
9-17 |
Chapter 10 |
Troubleshooting |
|
|
|
10.1 |
A List of Messages............................................................................................................. |
10-1 |
|
10.2 |
Troubleshooting................................................................................................................ |
10-17 |
Chapter 11 |
Maintenance |
|
|
|
11.1 |
Periodic Inspection.............................................................................................................. |
11-1 |
|
11.2 |
Calibrating the FX................................................................................................................ |
11-2 |
Chapter 12 |
Installation and Wiring |
|
|
|
12.1 |
Installation Location............................................................................................................ |
12-1 |
|
12.2 |
Installation Procedure......................................................................................................... |
12-2 |
|
12.3 |
External Dimensions and Panel Cut Dimensions............................................................... |
12-3 |
|
12.4 |
Input Signal Wiring............................................................................................................. |
12-4 |
|
12.5 |
Optional Terminal Wiring.................................................................................................... |
12-8 |
|
12.6 |
Wiring the Power Supply.................................................................................................. |
12-15 |
Chapter 13 |
Specifications |
|
|
|
13.1 |
Signal Input and Alarms..................................................................................................... |
13-1 |
|
13.2 |
Display................................................................................................................................ |
13-3 |
|
13.3 |
Data Saving Function......................................................................................................... |
13-6 |
|
13.4 |
Other Standard Functions.................................................................................................. |
13-8 |
|
13.5 |
Options............................................................................................................................. |
13-10 |
|
13.6 |
General Specifications..................................................................................................... |
13-17 |
|
13.7 |
External Dimensions........................................................................................................ |
13-21 |
Chapter 14 |
Setup Items |
|
|
|
14.1 |
Setting Mode Menu Map and Setup Items......................................................................... |
14-1 |
|
14.2 |
Basic Setting Mode Menu Map and Setup Items............................................................. |
14-12 |
1
2
3
4
5
6
7
8
9
10
11
12
13
Appendix |
|
|
14 |
Appendix 1 File Size of Display Data and Event Data.......................................................... |
App-1 |
|
|
Appendix 2 |
Types of Data Files That the FX Can Create and How They Can Be Used...... |
App-3 |
|
Appendix 3 |
Text File Data Format........................................................................................ |
App-4 |
App |
Index |
|
|
|
|
|
|
Index |
IM 04L21B01-01EN |
vii |

Blank Page

Chapter 1 Overview of Functions
1.1Input Section
Measurement Channel
•Number of Measurement Channels and Scan Interval
The FX acquires data by sampling measurement channel input signals at the set scan interval. The table below shows the relationship between the number of measurement channels and the scan interval
Model |
Number of Measurement |
Scan Interval |
A/D Converter |
|
Channels |
Integration Time |
|||
|
|
|||
FX1002 |
2 |
125ms, 250ms |
AUTO1/50Hz/60Hz |
|
FX1004 |
4 |
|||
|
|
|||
FX1006 |
6 |
|
|
|
FX1008 |
8 |
1s, 2s, 5s |
AUTO1/50Hz/60Hz/ |
|
FX1010 |
10 |
100ms2 |
||
|
||||
FX1012 |
12 |
|
|
1 AUTO: The FX automatically switches between 50 Hz and 60 Hz depending on the power supply frequency.
2You can only set the integration time to 100 ms on models FX1006 through FX1012.
If you set the integration time to 100 ms, you can only set the scan interval to 2 seconds or
5 seconds.
For the setting procedure, see section 3.1.
•Integration Time of the A/D Converter
The FX uses an A/D converter to convert sampled analog signals to digital signals. By setting the integration time of the A/D converter to match the time period corresponding to one cycle of the power supply or an integer multiple of one cycle, the power supply frequency noise can be effectively eliminated.
•Because 100 ms is an integer multiple of 16.7 ms and 20 ms, this setting can be used to eliminate the power frequency noise for both frequencies, 50 Hz and 60 Hz.
For the setting procedure, see section 3.1.
Input Type and Computation
You can make measurements using the following input types.
Input Type |
Description |
|
DC voltage |
You can measure DC voltages in the range of ±20 mV to ±50 V. |
|
|
|
|
DC current |
You can measure a DC current signal by converting it to a voltage signal using a shunt1 |
|
resistor attached to the input terminal. The converted signal can be measured within the DC |
||
|
voltage range (see above). |
|
|
You can measure temperatures corresponding to these thermocouple types: R, S, B, K, E, J, |
|
Thermocouple |
T, N, W, L, U, and WRe3-25. It is also possible to measure using other thermocouples, such |
|
|
as PR40-20 and PLATINEL.2 |
|
RTD |
You can measure temperatures using RTD types Pt100 and JPt100. |
|
It is also possible to measure using other RTD types such as Pt50 and Ni100.2 |
||
|
||
|
You can display contact input or voltage input signals correlated to 0% or 100% of the |
|
ON/OFF input |
display range. |
|
Contact input: A closed contact is on (1). An open contact is off (0). |
||
|
||
|
Voltage input: Less than 2.4 V is off (0). 2.4 V or more is on (1). |
|
Pulse input3 |
You can count pulses. Use the dedicated input terminal. |
|
AC voltage and current4 |
You can measure the power and electric energy. Use the dedicated input terminal. |
|
Logarithmic DC voltage5 |
Use the Log scale to display and record the physical quantity. |
|
1 Item sold separately. For example, you can use a 250 Ω shunt resistor to convert a 4 to |
||
|
20 mA signal to a 1 to 5 V signal. |
|
2 |
/N3F option |
|
3 |
/PM1 option |
|
4 |
/PWR1 option |
|
5 |
/LG1 option |
|
1
Functions of Overview
IM 04L21B01-01EN |
1-1 |
1.1 Input Section
The following input processing and computation are available.
Moving average |
Linear |
Calibration Low cut |
Difference Measured |
|
scaling |
correction |
computation value |
|
|
(/CC1 option) |
|
DC Voltage |
|
|
|
Shunt resistor |
|
|
|
DC current |
√ |
|
|
|
Square root computation |
|
|
1 - 5 V
Burnout detection  RJC
RJC
Thermocouple 
Burnout detection 

RTD
ON/OFF input
Pulse input (/PM1 option)
AC voltage and current (/PWR1 option)
Logarithmic DC voltage (/LG1 option)
Convert to number of pulses over 1 second
(for LogType1)
Dotted lines indicate that the function can be selected.
Reference Junction Compensation |
|
Burnout Detection |
|
|
Performs reference junction compensation on |
Detects and indicates a burnout in the sensor. |
|||
Burnout |
|
|
||
the thermocouple. |
FX |
1 - 5 V |
|
|
|
|
|
Indicated as |
|
Thermocouple |
|
|
Detected on the |
|
Internal |
|
Burnout. |
||
|
reference |
|
1-5 V value. |
|
|
|
|
|
|
Thermocouple |
junction |
|
|
|
|
|
Thermoelectromotive |
||
|
|
Burnout |
||
|
|
force |
Indicated as |
|
|
|
|
||
|
External reference junction |
|
|
|
|
|
|
Burnout. |
|
For the setting procedure, see section 3.2. |
For the setting procedure, see section 3.2. |
|
||
|
Moving Average |
|
|
|
Eliminates noise. |
|
|
|
|
Operation example when the number of moving average data points is 3
Sampling data |
1 |
10.0 mV |
|
2 |
5.0 mV |
||
in the buffer |
3 |
0.0 mV |
|
|
|
||
Measured |
(Moving average) |
5.0 mV |
|
value |
Sampling |
|
nth time |
|
|
||
For the setting procedure, see section 3.4.
New sampled |
New sampled |
data |
data |
|
15.0 mV |
|
10.0 mV |
Number of moving |
|
10.0 mV |
|
15.0 mV |
average data points: 2 to 400 |
|
5.0 mV |
|
10.0 mV |
|
Clear |
|
Clear |
|
|
|
10.0 mV |
|
11.7 mV |
|
|
n + 1th time |
|
n + 2th time |
|
1-2 |
IM 04L21B01-01EN |
|
|
1.1 Input Section |
|
|
|
|
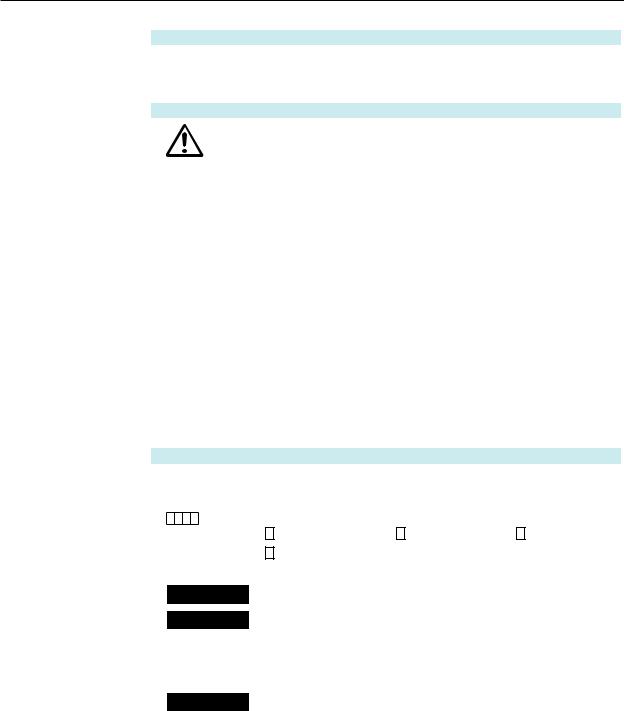
Square Root Computation |
Linear Scaling |
|
Takes the square root of the input value and converts |
Converts the unit to obtain the measured value. |
|
the unit to obtain the measured value. |
|
bB
|
Input |
|
|
X |
Measured |
|
10 V |
300 °c |
|
value |
x |
|
|
Input |
Measured |
||
|
|
|
value |
|
||||
|
|
|
a |
A |
B |
|
value |
value |
|
|
|
|
x – a + A |
|
|
0 V |
–100 °c |
|
|
|
X = (B – A) |
|
|
|
|
|
|
|
|
|
b – a |
Aa |
b |
|
|
|
|
|
|
|
|
|
||
|
|
|
For the setting procedure, see section 3.3. |
For the setting procedure, see section 3.3. |
||||
|
|
Calibration Correction (/CC1 Option) |
|
|
Low-cut |
|||
|
Corrects the input value with the characteristics |
|
For square root computation, measured values below |
|||||
|
specified by segments to obtain the measured value. |
the specified value are cut. |
||||||
|
|
|
|
|
|
|
For 1-5 V input, values below 0 % are cut. |
|
|
|
|
|
Number of break |
|
Measured |
|
|
|
Output |
|
points: Up to 16 |
|
value |
|
||
|
|
|
|
|
|
Result of square root |
||
|
value |
|
|
|
|
|
|
|
( |
Measured |
) |
|
|
|
|
computation |
|
|
value |
|
|
|
|
|
Low-cut value |
|
|
|
|
|
|
|
|
Input |
|
|
|
|
|
Input |
|
|
|
|
|
|
|
|
value |
|
|
|
value |
For the setting procedure, see section 3.9. |
For the setting procedure, see section 3.3. |
|||
Difference computation |
Pulse Input (/PM1 Option) |
|
||
The measured value of the channel is set to the |
Counts the pulses. Use the computation channels |
|
||
difference with respect to the measured value of the |
(/M1, /PM1, and /PWR1 options). |
|
||
reference channel |
|
Pulse that can be counted |
FX input |
|
Input |
Measured |
Pulse |
|
|
value |
value |
100 Hz or less |
Contact |
|
– |
|
|
||
|
|
|
|
|
Measured value on the reference channel |
|
or |
FX |
|
|
|
|
Open |
|
|
|
5 ms or more |
collector |
|
|
|
Counted on the FX |
|
|
|
|
The contact changes from open to close. |
|
|
|
|
The signal level at the input terminal changes from high |
||
|
|
to low. |
|
|
For the setting procedure, see section 3.3. |
For the setting procedure, see section 3.10. |
|||
AC Voltage and Current (/PWR1 option) |
Logarithmic DC Voltage (/LG1 option) |
|
||
Measure the measurement elements of electrical power. |
You can apply a logarithmic voltage that has been |
|
||
Use the computation channels (/M1, /PM1, and /PWR1 |
converted from a physical value to the FX, and then use |
|||
options). |
|
the FX’s Log scale (logarithmic scale) to display and |
||
Input |
Measured |
record the physical value. |
|
|
Measured |
|
|||
value |
value |
value |
|
|
AC (45 to 65 Hz) |
Electric power |
|
|
|
Voltage and current |
Electric energy |
|
|
|
Single-phase |
VT ratio |
|
|
|
CT ratio |
|
|
|
|
two-wire system |
|
|
|
|
Low-cut power |
|
|
|
|
Single-phase |
|
|
|
|
|
|
|
|
|
three-wire system |
|
Input |
DC voltage |
|
Three-phase |
|
|
||
|
value |
|
||
three-wire system |
|
|
|
|
For the setting procedure, see section 3.12. |
For the setting procedure, see section 3.13. |
|||
1
Functions of Overview
IM 04L21B01-01EN |
1-3 |

1.1 Input Section
Note
Difference computation is executed even if the input type or range is not the same between the difference computation channel and the reference channel. The difference is computed discarding the decimal place and unit, and the decimal place and unit of the difference computation channel are applied.
Example 1: If the input value of the difference computation channel is 10.00 and the measured value of the reference channel is 100.0, the computed result is
10.00 – 100.0 = –90.00.
Example 2: If the input value of the difference computation channel is 10.00 V and the measured value of the reference channel is 5.00 mV, the computed result is 10.00 V – 5.00 mV = 5.00 V.
1-4 |
IM 04L21B01-01EN |
1.2Alarms
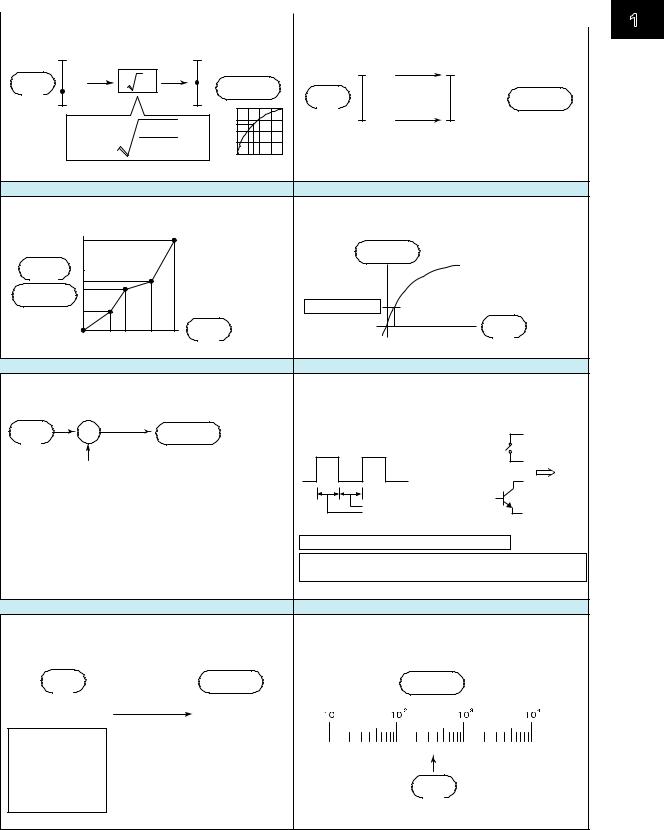
This function generates an alarm when the measured data meets a certain condition. Up to four alarms can be set for each channel.
Alarm Type
You can use the alarms shown below. The character inside the parentheses is the symbol denoting each alarm.
For the alarm setting procedure, see section 3.7.
High Limit Alarm (H) |
Low Limit Alarm (L) |
Measured value Hysteresis |
Measured value Hysteresis |
Alarm value |
Alarm value |
Alarm output ON |
Alarm output ON |
Delay High Limit Alarm (T) |
Delay Low Limit Alarm (t) |
Measured value |
Measured value |
Alarm value |
Alarm value |
Delay time |
Delay time |
Alarm output ON |
Alarm output ON |
High Limit on Rate-of-Change Alarm (R) |
Low Limit on Rate-of-Change Alarm (r) |
|||||
Measured value |
|
Change in the |
Measured value |
|
|
|
T2 |
|
measured value |
T2 |
|
Amount of change in |
|
|
Amount of change in |
|
||||
|
|
|
|
the setting |
||
T1 |
|
the setting |
T1 |
|
|T2-T1| |
|
|
T2-T1| |
|
||||
t1 |
t2 |
t1 |
t2 |
Change in the measured value |
||
|
||||||
Time |
Time |
|||||
|
|
|
|
|||
Interval (t2-t1) |
|
Interval (t2-t1) |
|
|||
Difference High Limit Alarm (h) |
Difference Low Limit Alarm (l) |
Difference in the measured values of two channels |
Difference in the measured values of two channels |
Hysteresis |
Hysteresis |
Alarm value |
Alarm value |
|
|
Alarm output ON |
Alarm output ON |
•Alarm Hysteresis
You can set a width (hysteresis) to the value used to activate and release alarms. For the setting procedure, see section 3.5.
•Delay High Limit Alarm and Delay Low Limit Alarm
An alarm occurs when the measured value remains above or below the alarm value for a specified time period (delay time).
•High Limit on Rate-of-Change Alarm and Low Limit on Rate-of-Change Alarm
The rate-of-change of the measured values is checked over a certain time (interval). An alarm occurs if the rate-of-change of the measured value in the rising/falling direction is greater than or equal to the specified value.
The alarm value of the rate-of-change alarm is set using an absolute value. The interval is derived using the following equation and set using the number of samples.
Interval = the scan interval × the number of samples
For the setting procedure, see section 3.5.
•Difference High Limit Alarm and Difference Low Limit Alarm
An alarm occurs when the difference in the measured values of two channels is greater/less than or equal to the specified value. These alarms can be specified on measurement channels set to difference computation.
IM 04L21B01-01EN |
1-5 |
1
Functions of Overview

1.2 Alarms
Alarm Indication
The alarm conditions are displayed as alarm icons in the status display section and on the operation screen such as the trend, digital, bar graph, overview displays. Detailed information about the alarms is displayed in the alarm summary.
•Hold/Non-hold of Indications
The alarm indication can be set to operate in the following fashion when the condition is no longer met.
•Clear the alarm indication (non-hold).
•Hold the alarm indication until the alarm ACK operation is executed (hold).
The default setting is non-hold.
For the setting procedure, see section 3.5.
•Alarm Hide Function
No indication is made when an alarm occurs. The alarm is also not recorded in the alarm summary. However, the FX will output alarm information to the relay (/A[ ] and /A4A options) or internal switch. This function can be set for each channel and each alarm.
For the setting procedure, see section 3.6.
1-6 |
IM 04L21B01-01EN |
1.2 Alarms
Alarm Output Relay Operation
The FX can generate a contact signal from an alarm output relay (/A[ ] and /A4A options) when an alarm occurs. The alarm output relay operation can be changed.
For the setting procedure, see section 3.5.
|
|
|
Reflash |
|
|
|
|
|
|
|
Non-hold/Hold |
|
Alarm |
|
|
Channel 1 |
|
|
|
Alarm |
|
|
|
Alarm ACK |
Alarm ACK |
|
|
Channel 2 |
|
|
|
Occurrence |
|
|
||||
|
|
|
|
|
|
|
|
|||||
|
|
|
|
|
|
|
|
|
|
|
|
|
|
|
|
Channel 3 |
|
|
|
|
Release |
|
|
||
Alarm output relay |
|
|
|
|
|
-hold |
|
Alarm |
|
|
||
|
|
|
|
|
|
|
|
|
||||
(Reflash on) |
|
|
|
500 ms |
|
|
|
Hold Non |
|
Normal |
|
|
(Reflash off) |
|
|
(when a relay is set to OR logic)Display |
|
Alarm |
|
|
|||||
Alarm output relay |
|
|
|
|
|
|
|
|
|
|||
|
|
|
AND/OR |
|
|
|
|
|
|
Normal |
|
|
|
|
|
|
|
|
|
Normal |
hold-Non |
|
|
|
|
Alarm |
|
|
Channel 1 |
|
|
|
|
Activated |
|
|
||
|
|
|
|
|
|
|
|
|
|
|||
|
|
Channel 2 |
|
|
|
|
|
|
Deactivated |
|
|
|
|
|
|
|
|
|
|
ACK |
|
|
|
||
Alarm output relay |
AND |
|
|
|
|
|
Activated |
or |
|
|||
|
|
|
|
|
|
|
||||||
or |
|
|
OR |
|
|
|
|
ResetRelay Action on |
hold-Non Hold |
|
|
|
internal switch |
|
|
|
|
outputAlarmrelay |
Deactivated |
|
|
||||
Energize |
|
|
|
|
|
|
|
|
Relay is activated |
|||
(You can set AND/OR for the alarm output relay and internal |
|
|
|
|
|
at the next scan |
||||||
switch. For details about the internal switch, see the next |
|
|
|
|
|
interval. |
||||||
page.) |
|
|
|
|
|
|
|
|
|
|
|
|
|
|
Energize or De-energize |
|
|
|
|
|
Activated |
|
|
||
When power |
Normal |
|
When an alarm |
|
|
|
|
|
||||
is shut down |
operation |
is occurring |
|
|
|
Deactivated |
|
|
||||
|
|
|
|
|
|
|
|
|
|
|
|
|
NO C |
NC |
NOC |
NC |
NO C |
NC |
|
ACK |
|
Activated |
or |
|
|
De-energize |
|
|
|
|
|
|
|
on |
|
|
|
|
|
|
|
|
|
|
|
Action |
Hold |
Deactivated |
|
|
|
NO C |
NC |
NO C |
NC |
NOC |
NC |
|
|
Relay is activated |
||||
|
|
|
||||||||||
|
|
|
|
|
|
|||||||
NO: Normally Opened |
|
|
|
|
Relay |
|
|
|
when the next |
|||
C: |
Common |
|
|
|
|
|
|
|
||||
|
|
|
|
|
|
|
alarm occurs. |
|||||
NC: |
Normally Closed |
|
|
|
|
|
|
|
|
|||
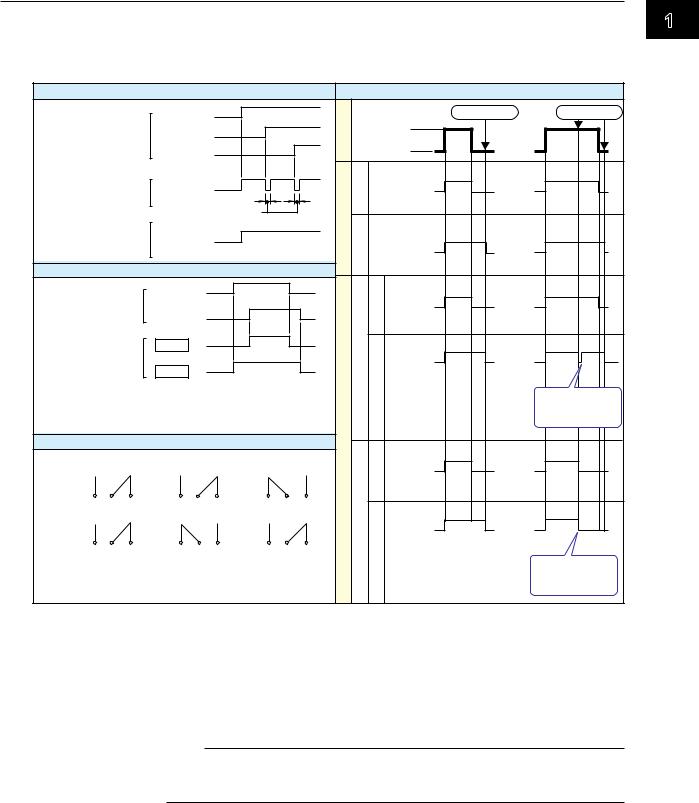
•Reflash
When multiple alarms are assigned to one alarm output relay, this function notifies the occurrence of subsequent alarms after the relay is activated by the first alarm. When subsequent alarms occur, the output relay is released temporarily. The relays are deactivated for 500 ms.
The reflash function is set on the first three output relays*.
* I01 to I03. I01 and I02 for the /A1 option.
Note
When reflash is enabled, the first three output relays are used exclusively as reflash relays. The first three output relays are set to OR logic and non-hold operation regardless of the AND/OR and non-hold/hold settings explained below.
•AND/OR
When multiple alarms are assigned to one alarm output relay, the condition for activating the output relay can be selected from the following: You can select AND operation also for the internal switch.
•AND: Activated when all assigned alarms are occurring simultaneously.
•OR: Activated when any of the specified alarms is occurring.
IM 04L21B01-01EN |
1-7 |
1
Functions of Overview

1.2 Alarms
•Energize or De-energize Operation
You can select whether the alarm output relay is energized or de-energized when an alarm occurs. If you select de-energize, the alarm output relays will be in the same state when the power is shut off as they are when an alarm occurs. The setting applies to all alarm output relays.
•Non-Hold/Hold
The alarm output relay can be set to operate in the following fashion when the alarm condition is no longer met.
•Turn OFF the relay output (non-hold).
•Hold the relay at ON until the alarm ACK operation is executed (hold).
The setting applies to all alarm output relays.
•Alarm ACK Operation
The alarm acknowledge (alarm ACK) operation releases all alarm indications and relay outputs. For the action of alarm indication and alarm output relay when you carried out the alarm ACK operation, see the previous page.
Note
When you enter the basic setting mode, the hold/non-hold condition of the alarm output relay immediately before is retained. In the basic setting mode, alarms are not detected, and you cannot acknowledge alarms.
Internal Switch
The alarm status can be output to software switches (30 internal switches). The values of the internal switch are shown below. Like the alarm output relay, you can specify AND/ OR operation (see the previous page). The internal switches cannot be operated other than for alarm output.
Alarm occurrence
Alarm
Alarm release
1
Internal switch 0
The internal switches can be used events of the event action function (see section 1.6). Internal switches can also be written into computation channel (/M1, /PM1, and /PWR1 options) equations.
1-8 |
IM 04L21B01-01EN |
1.3Display
This section will explain the FX display.
Common Items Related to the Display
•5.7-Inch Color LCD and Parts of the Display
The FX has a 5.7-inch TFT color LCD (240 × 320 dot resolution). The screen consists of the status display section and the data display section.
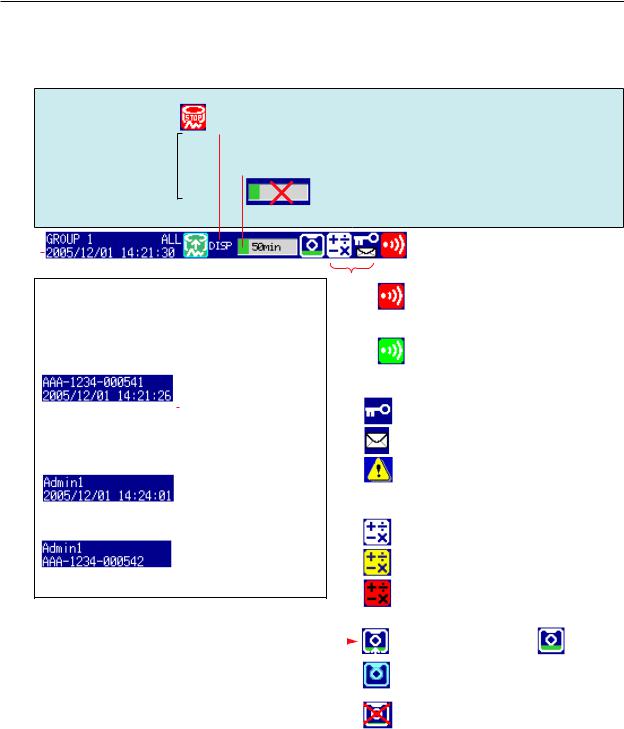
 Status display section
Data display section
Status Display Section
The status display section indicates the display name, date/time, batch name (when using the batch function), user name (when using the login function), internal memory and CF card (when the FX is equipped with a CF card slot) usage, alarm occurrence, computation status (/M1, /PM1, or /PWR1 option), key lock status, and e-mail transmission (/C7 option).
Data Display Section
The data display section shows the measured data using numeric values, waveforms, and bar graphs. It also shows the setup screen when setting functions.
•Group Display
On the trend, digital, and bar graph displays, the data of channels is displayed by groups that are set in advance. Up to 10 groups can be registered, and up to six channels can be assigned to each group. Groups are common to the trend, digital, and bar graph displays.
The displayed group can be switched automatically at a specified time interval (5 s to 1 min).
For the setting procedure, see section 5.1.
•Channel Number Display and Tag Display
You can choose to label displayed channels according to their tags or according to their channel numbers. This setting applies to all channels.
For the setting procedure, see section 5.2.
•Update Interval of Measured Values
The values are updated every second. However, if the scan interval is greater than 1 s, the values are updated at the scan interval.
For the setting procedure, see section 5.3.
•Alarm Indication
Alarms that are set for each channel are checked at all times and are indicated with the symbol representing the alarm type on each display.
Alarm Type |
Symbol |
Alarm Type |
Symbol |
High limit alarm |
H |
High limit on rate-of-change alarm |
R |
Low limit alarm |
L |
Low limit on rate-of-change alarm |
r |
Difference high limit alarm |
h |
Delay high limit alarm |
T |
Difference low limit alarm |
I |
Delay low limit alarm |
t |
1
Functions of Overview
IM 04L21B01-01EN |
1-9 |
1.3 Display
Status Display Section
The following information is displayed in the status display section during operation mode or setting mode.
Memory sampling status
Memory sampling stopped
Memory sampling  in progress
Memory sampling icon
Data type
DISP: Display data EVENT: Event data
Memory sampling progress
Displays the progress using a green bar graph. The frame indicates the file save interval (display data) or the data length (event data).
Error in internal memory.
Contact your nearest YOKOGAWA dealer.
Displays the remaining memory sampling time for the left bar graph.
|
|
|
|
|
|
|
|
|
|
|
|
|
|
|
|
|
|
|
|
|
|
|
|
|
|
|
|
|
|
|
|
|
|
|
|
|
|
|
|
|
|
|
|
|
|
|
|
|
|
|
|
|
|
|
|
|
|
|
|
|
|
|
|
|
|
|
|
|
|
|
|
|
|
|
|
|
|
|
|
|
|
|
|
|
|
|
|
|
|
|
|
|
|
|
|
|
|
|
|
|
|
|
|
|
|
|
|
|
|
|
|
|
|
|
|
|
|
|
|
|
|
|
|
|
|
|
|
|
|
|
|
|
|
Alarm icon |
|
||
|
|
|
|
|
|
|
|
|
|
|
|
|
|
|
|
|
|
|
|
|||
|
|
|
|
Display name or group name |
|
|
|
|
|
|
Displayed when any alarm is activated. |
|||||||||||
|
|
|
|
|
|
|
|
|
|
Blinks when there are alarms that are |
||||||||||||
|
|
|
|
For all channel display on the trend display, “All” is |
|
|
|
|
|
|
||||||||||||
|
|
|
|
|
|
|
|
|
|
occurring but have not been acknowledged. |
||||||||||||
|
|
|
|
displayed. |
|
|
|
|
(Red) |
|||||||||||||
|
|
|
|
Date and time |
|
|
|
|
|
|
||||||||||||
|
|
|
|
|
|
|
|
|
|
All alarms have been released after they |
||||||||||||
|
|
|
|
Displayed in yellow while the time is being corrected. |
|
|
|
|
|
|
||||||||||||
|
|
|
|
|
|
|
|
|
|
have occurred, but there are alarms that |
||||||||||||
|
|
|
When using the batch function |
|
|
|
|
|
|
|||||||||||||
|
|
|
|
|
|
|
(Green) have not been acknowledged. |
|
||||||||||||||
|
|
|
|
|
|
|
|
|
Batch name and the display |
|
|
|
|
|
||||||||
|
|
|
|
|
|
|
|
|
|
|
|
|
Status icon |
|
||||||||
|
|
|
|
|
|
|
|
|
name are shown alternately. |
|
|
|
|
|
||||||||
|
|
|
|
|
|
|
|
|
|
|
|
|
|
|||||||||
|
|
|
|
|
|
|
|
|
Date and time |
|
|
|
|
|
Keys are locked. |
|
||||||
|
|
|
|
|
|
|
|
|
|
|
|
|
|
|
|
|
||||||
|
|
|
If the “batch number-lot number” exceeds 20 characters, |
|
|
|
|
|
|
|
|
|||||||||||
|
|
|
the “date and time” position is used to display the “batch |
|
|
|
|
|
E-mail transmission (/C7 option) is enabled. |
|||||||||||||
|
|
|
number-lot number.” |
|
|
|
|
|
|
|
|
|||||||||||
|
|
When using the login function |
|
|
|
|
|
The status assigned to the status output |
||||||||||||||
|
|
|
|
|
|
|
|
|
Name of the user logged in |
|
|
|
|
|
(/F1 option) is occurring. |
|
||||||
|
|
|
|
|
|
|
|
|
|
|
|
|
|
|
||||||||
|
|
|
|
|
|
|
|
|
Date and time and the |
|
|
|
|
|
|
|
|
|||||
|
|
|
|
|
|
|
|
|
|
|
|
|
|
|
|
|
||||||
|
|
|
|
|
|
|
|
|
display name are shown |
|
|
|
|
Computation icon (/M1, /PM1, and /PWR1 options) |
||||||||
|
|
|
|
|
|
|
|
|
alternately. |
|
|
|
|
|
White icon: Computation started |
|
||||||
|
|
When using the login and batch functions |
|
|
|
|
|
|
||||||||||||||
|
|
|
|
|
|
|
|
|
Name of the user logged in |
|
|
|
|
|
Yellow icon: Computation data dropout occurred |
|||||||
|
|
|
|
|
|
|
|
|
|
|
|
|
|
|||||||||
|
|
|
|
|
|
|
|
|
Batch name, the display |
|
|
|
|
|
||||||||
|
|
|
|
|
|
|
|
|
|
|
|
|
|
|
|
|
||||||
|
|
|
|
|
|
|
|
|
name, and date and time are |
|
|
|
|
|
Red icon: Error in the power measurement |
|||||||
|
|
|
|
|
|
|
|
|
shown alternately. |
|
|
|
|
|
||||||||
|
|
|
|
|
|
|
|
|
|
|
|
|
|
|
|
|
|
|
|
section |
|
|
|
|
|
|
|
|
|
|
|
|
|
|
|
|
|
|
|
|
|
CF card icon (on FXs that have a CF card slot) |
|||
|
|
|
|
|
|
|
|
|
|
|
|
|
|
|
|
|
|
|
||||
|
|
|
|
The green level display indicates the amount of |
|
|
|
|
|
|
CF card is being accessed. |
Waiting. |
||||||||||
|
|
|
|
|
|
|
|
|
|
|||||||||||||
|
|
|
|
CF card used. If Media FIFO* is not enabled and |
|
|
|
|
|
Light blue icon: CF card in the slot is not |
||||||||||||
|
|
|
|
the free space on the CF card falls below 10%, |
|
|
|
|
|
|||||||||||||
|
|
|
|
the level indicator changes to red. |
|
|
|
|
|
recognized. Remove and reset it. |
|
|||||||||||
|
|
|
|
* See section 1.4 in the FX1000 User’s Manual. |
|
|
|
|
|
CF card error. |
|
|||||||||||
|
|
|
|
|
|
|
|
|
|
|
|
|
|
|
|
|
|
|
|
Carry out the procedure below to reset the CF |
||
|
|
|
|
|
|
|
|
|
|
|
|
|
|
|
|
|
|
|
|
card icon to normal. |
|
|
|
|
|
|
|
|
|
|
|
|
|
|
|
|
|
|
|
|
|
|
• Remove the CF card, and then reinsert it. |
||
|
|
|
|
|
|
|
|
|
|
|
|
|
|
|
|
|
|
|
|
• Replace the CF card with a normal one. |
||
|
|
|
|
|
|
|
|
|
|
|
|
|
|
|
|
|
|
|
|
• Use the FX to format the CF card (the CF |
||
|
|
|
|
|
|
|
|
|
|
|
|
|
|
|
|
|
|
|
|
|
card data will be deleted). |
|
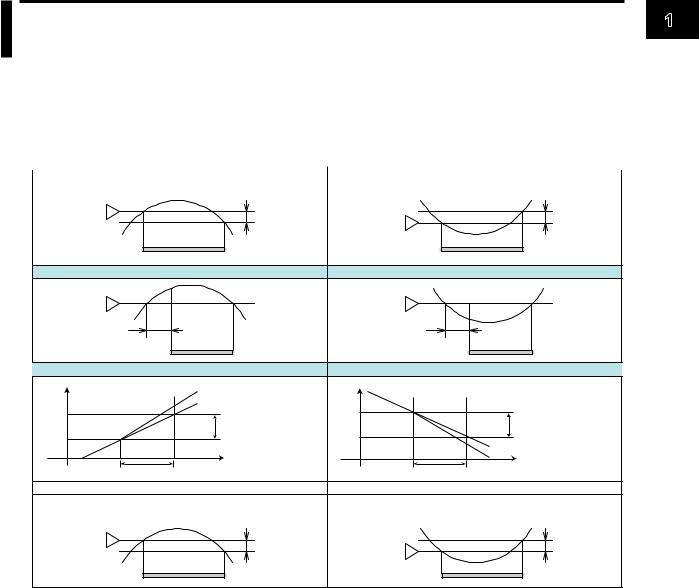
Bar Graph
When event data recording is set to pretrigger, the FX will start recording pretrigger data after you press the START key. “Waiting” appears in the bar graph. At this time, the progress bar will turn orange. After the pretrigger time elapses, the length of the bar fixed at that point. However, the relevant data is updated until the trigger condition is met. When the trigger condition is met, the bar turns green, and data is recorded after the data in the pretrigger section.
1-10 |
IM 04L21B01-01EN |

1.3 Display
Trend Display (T-Y)
Measured data is displayed in a waveform. For the operating procedure, see section 4.2.
Trend Space function Inserts a division-wide space here.
See section 4.2
1 division 
(30 dots) 
Time at the grid position Either displays the time, or the date and time.
See sections 2.4 and 5.3
Current value mark
Scale
See section 5.7
 Trend interval
See section 5.3  Grid
Grid
See section 5.10
 Trip line (up to four lines) See section 5.1
Numeric display section See section 4.2
Tag or channel number,
measured value, unit, and specified alarm
Waveform (displayed with the set channel color)
To change channel colors, see section 5.5.
To change waveform line width, see section 5.10.
To display every channel’s waveform, see section 4.2.
Minimum value 1 dot
Maximum value
Displays the maximum and minimum values sampled in the time corresponding to one dot.
Display layout |
See section 5.10 |
Horizontal display
 Color scale band See section 5.8
Current value indicated
by bar
See section 5.7 Alarm point mark
See section 5.8
 Alarm mark
Alarm type
Horizontal wide display
1
Functions of Overview
IM 04L21B01-01EN |
1-11 |
1.3 Display
•Updating of the Waveform
On the screen, 30 dots along the time axis is represented by a unit called division (see the figure on the previous page). The displayed waveform is updated at an interval corresponding to one dot. This interval is determined by the time corresponding to one division (referred to as the trend interval). The relationship between the trend interval
and the speed of movement of waveforms on the screen is as follows:
Trend interval (/DIV) |
15 s1 |
30 s |
1 min |
2 min |
5 min |
Time corresponding to one dot (in seconds) |
0.5 |
1 |
2 |
4 |
10 |
Speed of waveform movement (approximation in mm/h) |
2500 |
1250 |
625 |
312 |
156 |
|
|
|
|
|
|
Trend interval (/DIV) |
10 min |
15 min |
20 min |
30 min |
1 h |
Time corresponding to one dot (in seconds) |
20 |
30 |
40 |
60 |
120 |
Speed of waveform movement (approximation in mm/h) |
78 |
42 |
31 |
21 |
10 |
|
|
|
|
|
|
Trend interval (/DIV) |
2 h |
4 h |
10 h |
|
|
Time corresponding to one dot (in seconds) |
240 |
480 |
1200 |
|
|
Speed of waveform movement (approximation in mm/h) |
5.2 |
2.6 |
1.0 |
|
|
1 Selectable on the FX1002 and FX1004
Switching the Trend Interval
You can switch from the normal trend interval to the secondary trend interval during memory sampling and vice versa. For the operating procedure, see section 5.3.
• Writing Messages
Preset messages |
Trend display |
|
1Start
2 Material 1
3
4
Free message
Set the message when writing the message
Preset Messages
Preset messages are recalled and written.
The number of messages that you can use are 100 (message 1 to 10 are shared with free messages). For the operating procedure, see section 5.4.
Free Messages
Messages are entered when you need to enter them. The number of messages that you can use are 10. For the operating procedure, see section 5.4.
Automatic Message Writing
•A message is written when the trend interval is switched during memory sampling. For the setting procedure, see section 5.3.
•A message is written when the power recovers from a power failure during memory sampling. For the setting procedure, see sections 5.3 and 5.15.
1-12 |
IM 04L21B01-01EN |
1.3 Display
Message display method
•Except for the vertical display, you can set the direction in which messages are displayed to horizontal or vertical. For the setting procedure, see section 5.10.
•Messages can be displayed consolidated at the upper left of the screen (list display). For the operating procedure, see section 4.2.
List display
Vertical display
•Zone Display
You can display channels in specified zones. This function can be used to keep the waveforms from overlapping for easier view.
In the example below, channel 1 is displayed in the 0 to 30% zone, channel 2 in the 30 to 60% zone, and channel 3 in the 60 to 100% zone.
|
Zone 1 Zone 2 |
Zone 3 |
||
|
0% |
30% |
60% |
100% |
0% |
100% |
|
|
|
|
Enable the |
|
|
|
|
zone display. |
|
|
|
Channel1Channel2 Channel3
For the setting procedure, see section 5.6.
•Partial Expanded Display
By compressing a section of the waveform display range, the rest of the section is expanded.
In the example below, 0 V (boundary value) is moved to the 30% position of the display range (new boundary position). The 30% area below the boundary
corresponds to “– 6 V to 0 V” and 70% area above the boundary corresponds to “0 V to 6 V.”
|
|
|
|
|
|
|
|
|
|
|
|
Compressed |
|
|
||||||||||
|
|
|
|
|
|
|
|
|
|
|
Percentage |
|
portion |
|
|
Expanded portion |
|
Percentage |
||||||
|
|
|
|
|
|
|
|
|
|
|
|
|
|
|||||||||||
|
|
|
|
|
|
|
|
|
|
|
|
|
|
|
|
|
|
|
|
|
|
|||
0 |
|
|
|
50 |
|
|
|
100 of display span |
0 |
30 |
|
|
|
|
|
|
100 of display span |
|||||||
|
|
|
|
|
|
|
|
|
|
Enable the partially |
|
|
|
|
|
|
|
|
|
|
|
|
||
|
|
|
|
|
|
|
|
|
|
|
|
|
|
|
|
|
|
|
|
|
|
|||
|
|
|
|
|
|
|
|
|
|
|
|
|
|
|
|
|
|
|
|
|
|
|||
|
|
|
|
|
|
|
|
|
|
expanded display. |
|
|
|
|
|
|
|
|
|
|
|
|
||
|
|
|
|
|
|
|
|
|
|
|
|
|
|
|
|
|
|
|
|
|
|
|
|
|
|
|
|
|
|
|
|
|
|
|
|
|
|
|
|
|
|
|
|
|
|
|
|
|
|
|
|
|
|
|
|
|
|
|
|
|
|
|
|
|
|
|
|
|
|
|
|
|
|
|
|
|
|
|
|
|
|
|
|
|
|
|
|
|
|
|
|
|
|
|
|
|
|
|
|
–6V |
0 |
6V |
–6V |
0 |
6V |
|
Measured value |
|
|
Measured value |
|
For the setting procedure, see section 5.9.
1
Functions of Overview
IM 04L21B01-01EN |
1-13 |
1.3 Display
•Alarm Indication
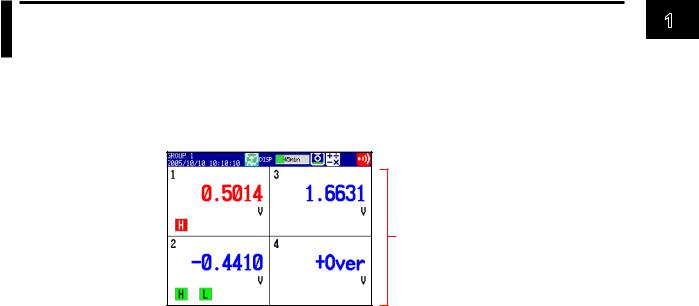
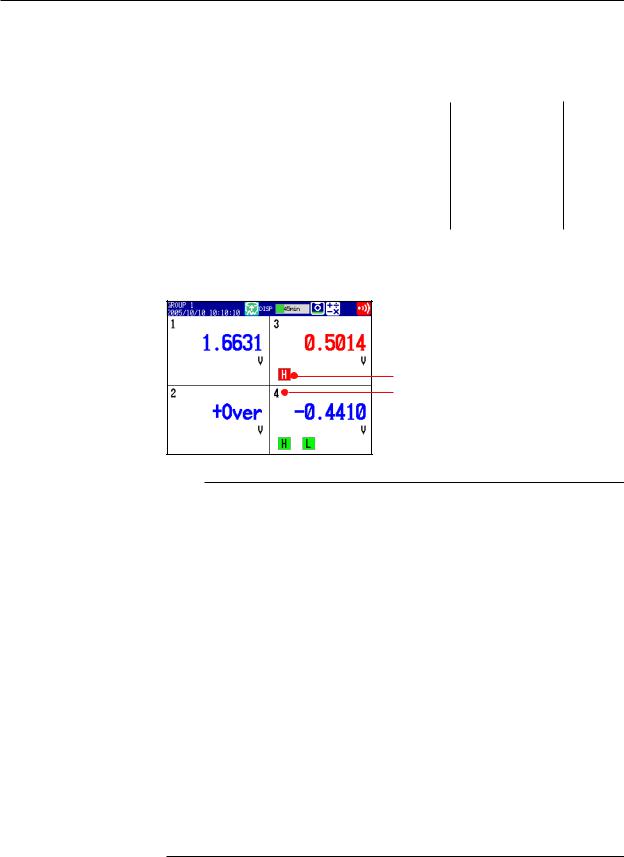
Alarm mark, alarm type, and measured value are displayed as follows according to the alarm status.
|
|
|
|
Whenindicationis |
|
|
|
|
Whenindicationis |
|
|
|
||||||||
|
|
|
|
|
|
|
|
|
|
|
||||||||||
|
|
|
|
settonon-hold |
|
|
|
|
settohold |
AlarmACK |
|
|
||||||||
|
|
Occurrence |
|
|
|
|
|
|
|
AlarmACK |
|
|
|
|||||||
Alarm |
|
|
|
|
|
|
|
|
|
|
|
|
|
|
|
|||||
|
|
Release |
|
|
|
|
|
|
|
|
|
|
|
|
|
|
|
|
|
|
|
|
|
|
|
|
|
|
|
|
|
|
|
|
|
|
|
|
|
||
|
|
|
|
|
|
|
|
|
|
|
|
|
|
|
|
|
|
|||
|
|
|
|
|
|
|
|
|
|
|
|
|
|
|
|
|
|
|||
|
Alarm mark |
Green |
|
Red |
Green |
Green |
Blinking |
Blinking Green |
Green |
Blinking |
Red |
Green |
||||||||
|
|
|
|
|
|
|
|
|
|
|
|
red |
green |
|
|
|
red |
|
|
|
|
|
|
|
|
|
|
|
|
|
|
|
|
|
|
|
|
|
|
|
|
|
Alarm type |
None |
|
Red |
None |
None |
Red |
None |
None |
None |
Red |
Red |
None |
|||||||
|
|
|
|
|
|
|
|
|
|
|
|
|
|
|
|
|
|
|
|
|
|
|
|
|
|
|
|
|
|
|
|
|
|
|
|
|
|
|
|
||
|
Measured |
Blue |
|
Red |
Blue |
Blue |
Red |
Blue |
Blue |
Blue |
Red |
Red |
Blue |
|||||||
|
value |
|
|
|
|
|
|
|
|
|
|
|
|
|
|
|
|
|
|
|
Digital Display
Displays the measured data numerically using large numbers. For the operating procedure, see section 4.2.
 Measured value
 Unit
Unit
Alarm mark
Tag or channel number
Note
•Numeric display of measurement channels
If a measured value of a measurement channel is over range (see below), the measured value is indicated as “+Over” or “–Over.” If a burnout is detected on a channel whose burnout detection function is enabled, the word “Burnout” is indicated. Otherwise, a numeric value is displayed.
Over range of measurement channels
•For DC voltage input, over range occurs when the measured value of the measurement channel exceeds ±5% of the measurable range. For example, the measurable range when the measurement range is 2 V is –2.000 to 2.000 V. If the measured value exceeds 2.200 V, + over range occurs; if the measured value falls below –2.200 V, – over range occurs.
•For thermocouple or RTD input, over range occurs when the measured value exceeds approximately ±10°C of the measurable range. For example, the measurable range when the measurement range is R is 0.0 to 1760.0°C. If the measured value exceeds approximately 1770.0°C, + over range occurs; if the measured value falls below approximately –10.0°C, – over range occurs.
•For channels that are linearly scaled, + over range occurs when the value exceeds 30000 excluding the decimal point; – over range occurs when the value falls below –30000. However, + over range can be changed to greater than or equal to 105% of the scale width and – over range to less than or equal to –5% of the scale width within ± 30000. For the setting procedure, see section 3.11.
•Numeric display of computation channels
See section 1.8, “Computation and Report Functions (/M1, /PM1, and /PWR1 options).”
1-14 |
IM 04L21B01-01EN |
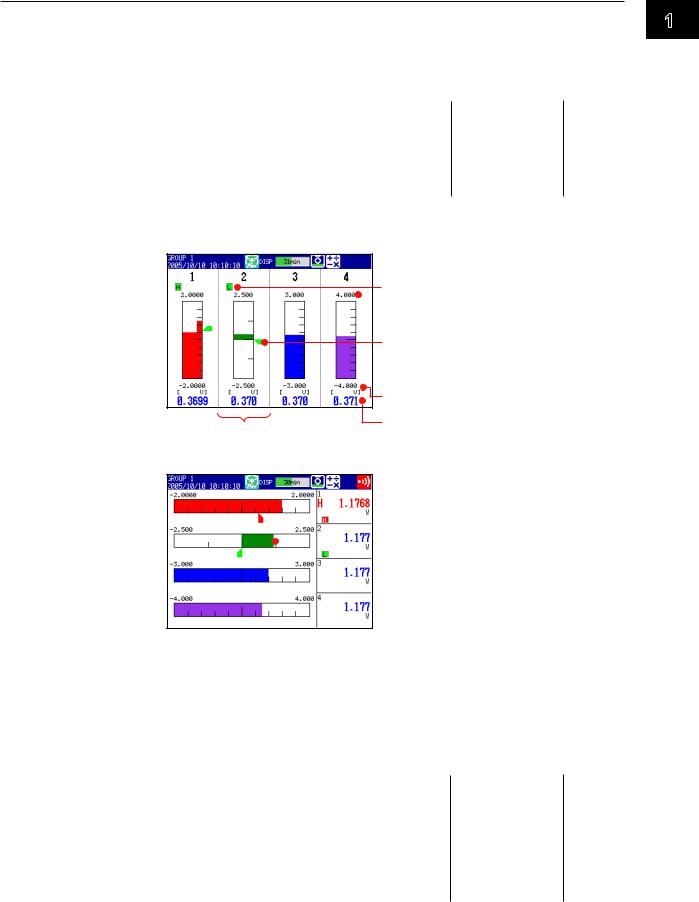
1.3 Display
•Alarm Indication
The alarm mark and measured values are displayed in the following ways depending on the alarm status.
|
|
|
|
Whenindicationis |
|
|
|
Whenindication |
|
|
|
|
|||||||
|
|
|
|
|
|
|
|
|
|
|
|||||||||
|
|
|
|
settonon-hold |
|
|
|
issettohold |
AlarmACK |
|
|
||||||||
|
|
Occurrence |
|
|
|
|
|
|
AlarmACK |
|
|
|
|||||||
Alarm |
|
|
|
|
|
|
|
|
|
|
|
|
|
|
|||||
|
|
Release |
|
|
|
|
|
|
|
|
|
|
|
|
|
|
|
|
|
|
|
|
|
|
|
|
|
|
|
|
|
|
|
|
|
|
|
||
|
|
|
|
|
|
|
|
|
|
|
|
|
|
|
|
|
|||
|
|
|
|
|
|
|
|
|
|
|
|
|
|
|
|
|
|
||
|
Alarm mark |
Green |
|
Red |
Green |
Green |
Blinking |
Blinking |
Green |
Green |
Blinking |
Red |
Green |
||||||
|
|
|
|
|
|
|
|
|
|
|
red |
green |
|
|
|
red |
|
|
|
|
|
|
|
|
|
|
|
|
|
|
|
|
|
|
|
|
|
||
|
Measured |
Blue |
|
Red |
Blue |
Blue |
Red |
Blue |
Blue |
Blue |
Red |
Red |
Blue |
||||||
|
value |
|
|
|
|
|
|
|
|
|
|
|
|
|
|
|
|
|
|
Bar Graph Display
Waveform data is displayed in a bar graph. For the operating procedure, see section 4.2.
Vertical
 Tag or channel number
Alarm mark
 Upper limit
 Scale marks
See section 5.7 Alarm point mark
 Bar (displayed with
the set channel color) See section 5.11
Unit of measurement and lower limit
Bar graph base position is set to Center. Measured value See section 5.11
Horizontal See section 5.10
 The bar graph base position is set
to Normal, Lower, or Upper. See section 5.11
 Bar graph base position is set to Center.
See section 5.11
•Updating of the Bar Graph
The bar graph is updated at the same interval as numeric values.
•Alarm Indication
The alarm mark, alarm point mark,1 and measured values are displayed in the following ways, depending on the alarm status.
|
|
|
|
Whenindicationis |
|
|
|
|
Whenindicationis |
|
|
|
|||||||||
|
|
|
|
|
|
|
|
|
|
|
|||||||||||
|
|
|
|
settonon-hold |
|
|
|
|
settohold |
AlarmACK |
|
|
|||||||||
|
|
Occurrence |
|
|
|
|
|
|
|
AlarmACK |
|
|
|
|
|||||||
Alarm |
|
|
|
|
|
|
|
|
|
|
|
|
|
|
|
|
|||||
|
|
Release |
|
|
|
|
|
|
|
|
|
|
|
|
|
|
|
|
|
|
|
|
|
|
|
|
|
|
|
|
|
|
|
|
|
|
|
|
|
|
|
||
|
|
|
|
|
|
|
|
|
|
|
|
|
|
|
|
|
|
|
|||
|
|
|
|
|
|
|
|
|
|
|
|
|
|
|
|
|
|
|
|
||
|
Alarm mark |
Green |
|
Red |
Green |
Green |
Blinking |
Blinking |
Green |
Green |
Blinking |
Red |
Green |
||||||||
|
|
|
|
|
|
|
|
|
|
|
|
red |
green |
|
|
|
|
red |
|
|
|
|
|
|
|
|
|
|
|
|
|
|
|
|
|
|
|
|
|
|
|
|
|
|
Point mark1 |
Green |
|
Red |
Green |
Green |
Red |
Green |
Green |
Green |
Red |
Red |
Green |
||||||||
|
|
|
|
|
|
|
|
|
|
|
|
|
|
|
|
|
|
|
|
||
|
Measured |
Blue |
|
Red |
Blue |
Blue |
Red |
Blue |
Blue |
Blue |
Red |
Red |
Blue |
||||||||
|
value |
|
|
|
|
|
|
|
|
|
|
|
|
|
|
|
|
|
|
|
|
1 Displayed when you are configuring alarms
1
Functions of Overview
IM 04L21B01-01EN |
1-15 |
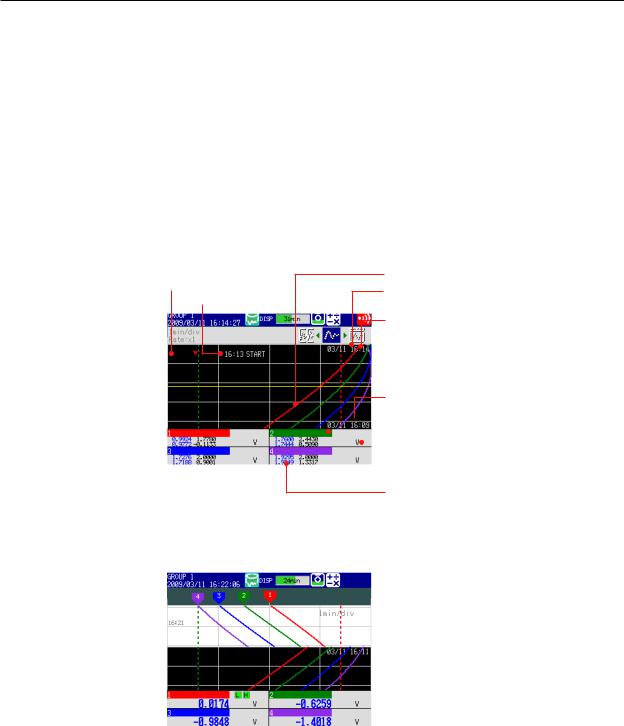
1.3 Display
Historical Trend Display
The waveform of the past measured data (display or event data) in the internal memory or external storage medium can be displayed. This function is called Historical trend.
•Methods of Displaying the Historical Trend
There are four methods to display the historical trend of the measured data in the internal memory.
•Display from the alarm summary. For the operating procedure, see section 4.6.
•Display from the message summary. For the operating procedure, see section 4.7.
•Display from the memory summary. For the operating procedure, see section 4.8.
•Recall from the display selection menu. For the operating procedure, see section 4.3. Measured data on an external storage medium can also be displayed as historical trend. For the operating procedure, see section 6.8.
•Displayed Contents
Background color
(changeable) Message
Waveform (channel display color)
Location of the most recent data
Date and time at the upper end of the tim axis, or the time at the cursor location
The time at the cursor location is surrounded by a yellow square.
 Trip line
 Cursor
Date and time at the lower end of the tim axis

 Tag or channel number
(channel display color)
 Unit
Unit
 Measured values (maximum and minimum values for the entire display)1
Measured values (maximum and minimum values at the cursor position)1
1You can also display only the digital value of the cursor position (the maximum value at the cursor position).
Half screen display
 Present trend
 Historical trend
Item |
Description |
Alarm summary |
Displays an alarm summary of the displayed data. |
Message summary |
Displays a message summary of the displayed data. |
Memory information |
Displays the properties (such as the file name, start time, and end time) |
|
of the displayed data. |
•Added Messages
Added messages can be written. For the operating procedure, see section 5.4.
1-16 |
IM 04L21B01-01EN |
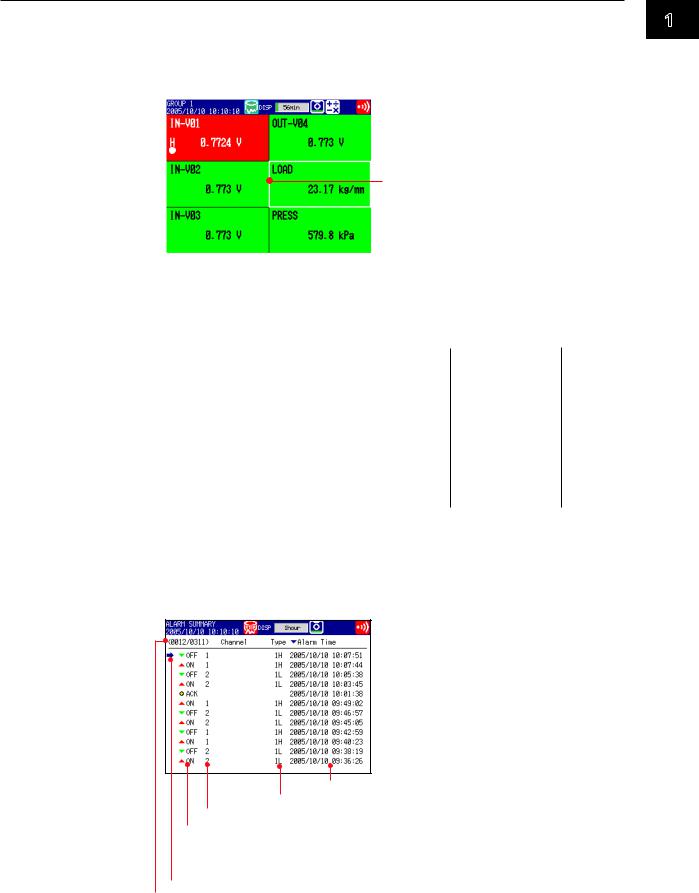
1.3 Display
Overview Display
Displays a list of the statuses of all channels.
You can move the cursor to select a channel and display the trend, digital, or bar graph of the group containing the selected channel.
For the operating procedure, see section 4.4.

 Channels on which an alarm is
occurring are indicated in red 
 Alarm type
Cursor
 Tag or channel number
 Measured value and unit
•Alarm Indication
The channel display area, channel number or tag name, alarm type, and measured value are displayed in the following ways, depending on the alarm status.
|
|
|
|
Whenindicationis |
|
|
|
|
Whenindicationis |
|
|
|
||||||||
|
|
|
|
|
|
|
|
|
|
|
||||||||||
|
|
|
|
settonon-hold |
|
|
|
|
settohold |
AlarmACK |
|
|
||||||||
|
|
Occurrence |
|
|
|
|
|
|
AlarmACK |
|
|
|
|
|||||||
Alarm |
|
|
|
|
|
|
|
|
|
|
|
|
|
|
|
|||||
|
|
Release |
|
|
|
|
|
|
|
|
|
|
|
|
|
|
|
|
|
|
|
|
|
|
|
|
|
|
|
|
|
|
|
|
|
|
|
|
|
||
|
|
|
|
|
|
|
|
|
|
|
|
|
|
|
|
|
|
|||
|
|
|
|
|
|
|
|
|
|
|
|
|
|
|
|
|
|
|||
|
Tag/Channel Black |
|
White |
Black |
Black |
Blinking |
Blinking |
Black |
Black |
Blinking |
White |
Black |
||||||||
|
|
|
|
|
|
|
|
|
|
|
white |
black |
|
|
|
|
white |
|
|
|
|
|
|
|
|
|
|
|
|
|
|
|
|
|
|
|
|
|
|
|
|
|
Channel |
Green |
|
Red |
Green |
Green |
Red |
Green |
Green |
Green |
Red |
Red |
Green |
|||||||
|
area |
|
|
|
|
|
|
|
|
|
|
|
|
|
|
|
|
|
|
|
|
|
|
|
|
|
|
|
|
|
|
|
|
|
|
|
|
|
|
||
|
Alarm type |
None |
|
White |
None |
None |
White |
None |
None |
None |
White |
White |
None |
|||||||
|
|
|
|
|
|
|
|
|
|
|
|
|
|
|
|
|
|
|
|
|
|
|
|
|
|
|
|
|
|
|
|
|
|
|
|
|
|
|
|
|
|
|
Measured |
Black |
|
White |
Black |
Black |
White |
Black |
Black |
Black |
White |
White |
Black |
|||||||
|
value |
|
|
|
|
|
|
|
|
|
|
|
|
|
|
|
|
|
|
|
Alarm Summary
Displays a list of the most recent alarms.
•Up to 1000 alarms can be displayed.
•You can select arbitrary alarm information and recall the historical trend of the display data or event data that contains the alarm information.
For the setting procedure, see section 4.6.
 To the historical trend display
Date and time of alarm occurrence/release
Alarm level number (1, 2, 3, or 4) and type (H, L, h, l, R, r, T, or t) Number or tag of the channel on which the alarm occurred
 : Alarm occurrence
( blinks until the AlarmACK operation is carried out if Indicator is set to Hold.)
 : Alarm release
 : Alarm output release (when blinking is cleared through the AlarmACK operation)
Cursor (selects an alarm)
The number of the alarm information entry displayed on the screen’s bottom line and the number of alarm information entries in internal memory
1
Functions of Overview
IM 04L21B01-01EN |
1-17 |
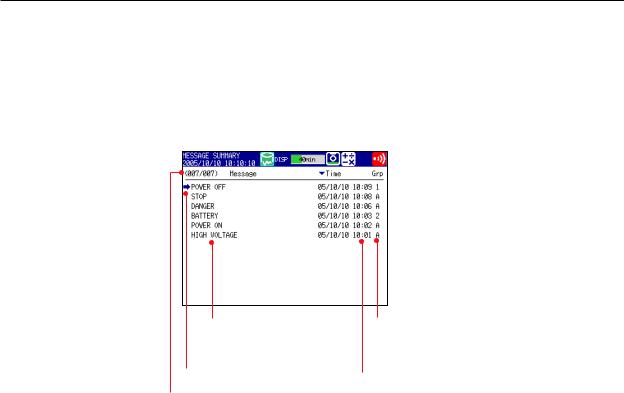
1.3 Display
Message Summary
Displays a list of written messages and the time the messages were written.
•Up to 450 messages can be displayed.
•Up to 50 messages that are added to the past data section (added messages) can be displayed.
•You can select arbitrary message information and recall the historical trend of the display data or event data that contains the message.
For the setting procedure, see section 4.7.
 To the historical trend display
Message Added message
(displayed in blue)
Cursor (selects the message)
Destination group to write the message All groups “A”or a group number, or the second of the date/time when the message was written.
Date/Time when the message was written
The number of the message data displayed on the screen’s bottom line and the number of messages in internal memory
•Switching of the Display Items
You can switch between two sets of display contents.
•Message, time when the message was written, and group to which the message was written or second of the time when the message was written
•Message, user name that wrote the message
1-18 |
IM 04L21B01-01EN |
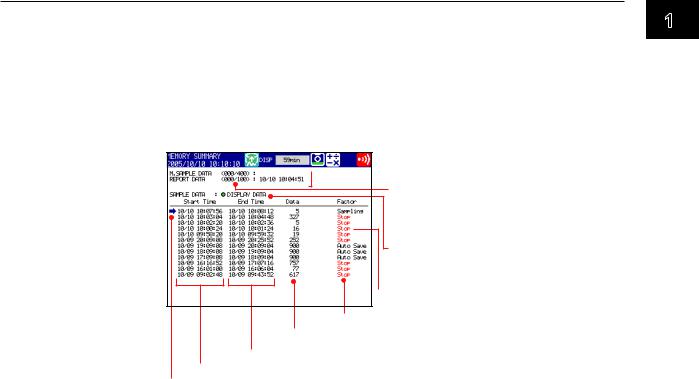
1.3 Display
Memory Summary
Displays the information pertaining to the display data and event data in the internal memory.
•By selecting the display data or event data, the historical trend display can be recalled.
•The FX displays the number of manually sampled data samples and report data samples (/M1, /PM1, and /PWR1 options) in internal memory.
For the operating procedure, see section 4.8.
 Date/Time of the most recent data
Number of data points in the internal memory/maximum number of data points that can be recorded in the internal memory
Data type
• Display data
• Event data
 To the historical trend display
Status
Sampling count
Date/Time of memory stop
Date/Time of memory start
Cursor (selects the file)
•Switching of the Display Items
You can switch between two sets of displayed items.
•Display the start and end times
•Display the file name
•Saving the Data
The data in the internal memory can be saved to a CF card or USB flash memory (/USB1 option).
1
Functions of Overview
IM 04L21B01-01EN |
1-19 |
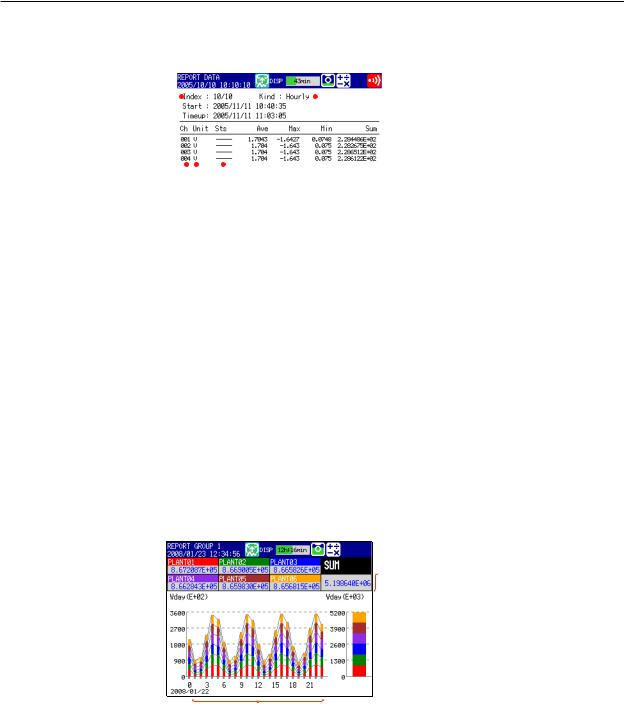
1.3 Display
Report Data (/M1, /PM1, and /PWR1 options)
Report data residing in the internal memory can be displayed.
For the operating procedure, see section 4.5.
|
|
|
|
|
|
|
|
|
|
|
|
|
|
|
|
Report type |
|
|
|
|
|
|
|
|
|
|
|
|
|
|
|
|
|
|
|
|
|
|
|
|
|
|
|
|
|
|
|
|
|
Start: Start date/time |
|
|
|
|
|
|
|
|
|
|
|
|
|
|
|
||
|
|
|
|
|
|
|
|
|
|
|
|
|
|
|
|
Timeup: Report date/time |
|
|
|
|
|
|
|
|
|
|
|
|
|
|
|
|
Report data status |
|
|
|
|
|
|
|
|
|
|
|
|
|
|
|
|
Indicates that the following occurred |
|
|
|
|
|
|
|
|
|
|
|
|
|
|
|
|
between the report interval. |
|
|
|
|
|
|
|
|
|
|
|
|
|
|
|
|
E: Error data |
|
|
|
|
|
|
|
|
|
|
|
|
|
|
|
|
|
|
|
|
|
|
|
|
|
|
|
|
|
|
|
|
|
O: Over data |
|
|
|
|
|
|
|
|
|
|
|
|
|
|
|
|
P: Power failure |
|
|
|
|
|
|
|
|
|
|
|
|
|
|
|
|
C: Time change |
|
|
|
|
|
|
|
|
|
|
|
|
|
|
|
|
B: Burnout |
|
|
|
Unit |
|
|
Average, maximum, minimum, sum, |
||||||||||
|
|
|
|
|
|
|
|
|
or instantaneous value |
|||||||
|
|
|
Channel number |
|
|
|
|
|
|
|
|
|
||||
|
|
|
|
|
|
|
|
|
|
|
|
|
|
|
|
|
Number of the displayed report data/number of report data in the internal memory
Stacked Bar Graph (/M1, /PM1, and /PWR1 options)
You can display the report data (that is stored in the internal memory) of each report group in a stacked bar graph.
For operating instructions, see section 4.10.
For information about report groups, see section 9.5.
•Types of Displayed Data
The type of displayed data is determined by the report kind, which is set using the report function.
Report Kind |
Displayed Report Data |
Hour, H + D |
Sums for each hour and sums for the day |
Day + Week |
Sums for each day and sums for the week |
Day, D + M |
Sums for each day and sums for the month |
Example: Hourly + daily display
 Daily sums of each channel and the daily sums of all channels of the report group
If you select a bar graph, the sum of the hour selected with the cursor is displayed.
 Sums for the day (bar graph) of a report group
Hourly report group sums (bar graph)
1-20 |
IM 04L21B01-01EN |
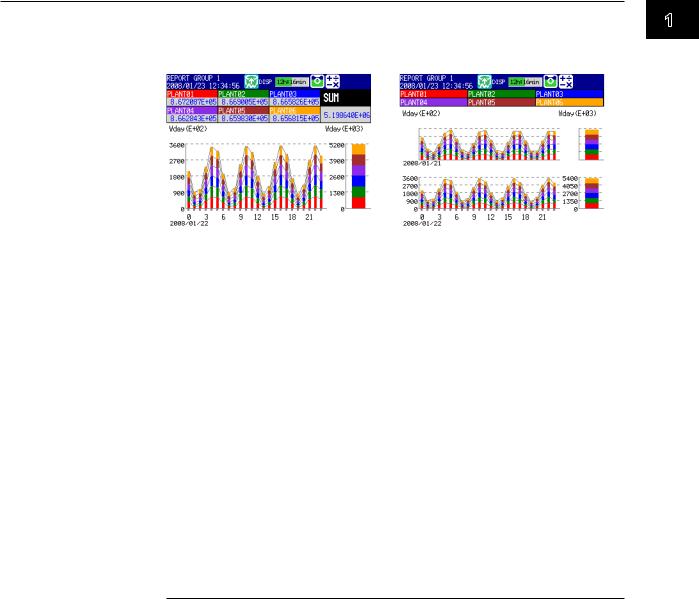
1.3 Display
•Display Modes
You can switch the bar graph between single graph and dual graph display.
Single graph display |
|
Dual graph display (Shows the data from |
|
two consecutive periods) |
|
|
|
|
Status Display
The following displays are available.
For the operating procedure, see section 4.5.
•Relay Status Display
Displays the status of the alarm output relay and internal switch.
•Modbus Client Status Display (/C7 option) and Modbus Master Status Display (/C2 and /C3 options)
Display the command status.
Log Display
Displays various logs (operation log).
For the operating procedure, see section 4.9.
Log Type |
Description |
Login |
Log of login/logout, log of time setting, and log of power failure |
Error |
Log of error messages |
Communication1 |
Log of communication commands |
FTP transfer2 |
Log of FTP transfers |
WEB2 |
Log of Web operations |
E-mail transmission2 |
Log of e-mail transmissions |
SNTP2 |
Log of accesses to the SNTP server |
DHCP2 |
Log of DHCP server access |
MODBUS1 |
Log of communications using Modbus client or Modbus master |
1 /C2, /C3, and /C7 options
2 /C7 option
Other Useful Functions
•Automatically Reverting to the Specified Display
Show a preset display when there is no operation for a specific time. For the setting procedure, see section 5.14.
•Customizing the Menus
You can change the contents of the Function menu, which is displayed when you press FUNC, and the display selection menu, which is displayed when you press DISP/ENTER.
For the setting procedure, see section 5.16.
1
Functions of Overview
IM 04L21B01-01EN |
1-21 |
Loading...