


 Loading...
User’s
Manual AQ1200 OTDR
Multi Field Tester
IM AQ1200-01EN
4th Edition

Thank you for purchasing the AQ1200 OTDR (Optical Time Domain Reflectometer) Multi Field Tester. This user’s manual explains the features, operating procedures, and handling precautions of the AQ1200. To ensure correct use, please read this manual thoroughly before operation. Keep this manual in a safe place for quick reference in the event that a question arises.
This manual is one of three AQ1200 manuals. Please read all the manuals.
Manual Title |
Manual No. |
Description |
AQ1200 OTDR Multi Field Tester |
IM AQ1200-02EN This guide focuses on the handling precautions, basic |
|
Operation Guide |
|
operations, and specifications of the AQ1200. |
AQ1200 OTDR Multi Field Tester |
IM AQ1200-01EN This manual. Explains all AQ1200 features, except for |
|
User’s Manual (included in CD) |
|
the communication features, and how to use them. |
AQ1200 OTDR Multi Field Tester |
IM AQ1200-17EN Explains the features related to using communication |
|
Communication Interface User’s |
|
commands to control the AQ1200. |
Manual (included in CD) |
|
|
Notes
•The contents of this manual are subject to change without prior notice as a result of continuing improvements to the instrument’s performance and functionality. The figures given in this manual may differ from those that actually appear on your screen.
•Every effort has been made in the preparation of this manual to ensure the accuracy of its contents. However, should you have any questions or find any errors, please contact your nearest YOKOGAWA dealer.
•Copying or reproducing all or any part of the content of this manual without the permission of YOKOGAWA is strictly prohibited.
Trademarks
•Microsoft, Windows, and Windows XP are either registered trademarks or trademarks of Microsoft Corporation in the United States and/or other countries.
•Adobe, Acrobat, and PostScript are trademarks of Adobe Systems Incorporated.
•In this manual, the TM and ® symbols do not accompany their respective registered trademark or trademark names.
•Other company and product names are registered trademarks or trademarks of their respective holders.
Revisions
1st Edition: February 2010 2nd Edition: February 2011 3rd Edition: July 2012
4th Edition: July 2013
4th Edition: July 2013 (YMI)
All Rights Reserved, Copyright © 2010, Yokogawa Electric Corporation
All Rights Reserved, Copyright © 2011, Yokogawa Meters & Instruments Corporation
IM AQ1200-01EN

Conventions Used in This Manual
Notes
The notes and cautions in this manual are categorized using the following symbols.
WARNING
CAUTION
Improper handling or use can lead to injury to the user or damage to the instrument. This symbol appears on the instrument to indicate that the user must refer to the user’s manual for special instructions. The same symbol appears
in the corresponding place in the user’s manual to identify those instructions. In the manual, the symbol is used in conjunction with the word “WARNING” or “CAUTION.”
Calls attention to actions or conditions that could cause serious or fatal injury to the user, and precautions that can be taken to prevent such occurrences.
Calls attention to actions or conditions that could cause light injury to the user or cause damage to the instrument or user’s data, and precautions that can be
taken to prevent such occurrences.
Note
Calls attention to information that is important for proper operation of the instrument.
Symbols and Conventions Used in Procedural Explanations
The contents of the procedural explanations are indicated using the following symbols.
Procedure
Explanation
Carry out the procedure according to the step numbers. All procedures are written under the assumption that you are starting operation at the beginning
of the procedure, so you may not need to carry out all the steps in a procedure when you are changing the settings.
This section describes the setup items and the limitations regarding the procedures. It may not give a detailed explanation of the feature. For a detailed
explanation of the feature, see chapter 2.
Character Notations
Hard Key Names and Soft Key Names in Bold Characters
Indicate panel keys that are used in the procedure and soft keys and menu items that appear on the screen.
Unit
k Denotes 1000. Example: 12 kg, 100 kHz
ii
IM AQ1200-01EN
Contents
Conventions Used in This Manual.....................................................................................................ii
Chapter 1 Features |
|
|
1.1 |
Overview........................................................................................................................... |
1-1 |
1.2 |
Optical Pulse Measurement.............................................................................................. |
1-3 |
1.3 |
Waveform Display............................................................................................................. |
1-5 |
1.4 |
Waveform and Event Analysis.......................................................................................... |
1-7 |
1.5 |
Light Source and Optical Power Meters (Options).......................................................... |
1-12 |
1.6 |
Loss Test (Option)........................................................................................................... |
1-14 |
1.7 |
Multi-Core Loss Test (Option)......................................................................................... |
1-15 |
1.8 |
Fault Locator................................................................................................................... |
1-16 |
1.9 |
Checking Fiber End Faces.............................................................................................. |
1-17 |
1.10 |
IP Test (Option)............................................................................................................... |
1-18 |
1.11 |
Multi-Core Fiber Measurement....................................................................................... |
1-19 |
1.12 |
Event Mapper.................................................................................................................. |
1-20 |
1.13 |
Other Features................................................................................................................ |
1-21 |
Chapter 2 Common Operations
2.1 |
Top Screen........................................................................................................................ |
2-1 |
2.2 |
Key, Rotary Knob, and Arrow Key Operations.................................................................. |
2-5 |
2.3 |
Shortcut Keys.................................................................................................................... |
2-8 |
2.4 |
Entering Strings.............................................................................................................. |
2-10 |
Chapter 3 Optical Pulse Measurement and Analysis Conditions
3.1 Selecting the Measurement Mode.................................................................................... 3-1
Simple (Full Auto) Mode
3.2 |
Selecting the Wavelength................................................................................................. |
3-3 |
3.3 |
Automatically Saving Measured Data............................................................................... |
3-4 |
3.4 |
Selecting the Approximation Method (Marker).................................................................. |
3-5 |
Detail Mode and Multi WL Mode
3.5 |
Setting Measurement Conditions...................................................................................... |
3-6 |
3.6 |
Setting Analysis Conditions............................................................................................. |
3-12 |
3.7 |
Setting the Pulse Light Output Level............................................................................... |
3-17 |
3.8 |
Giving Notifications When Installations Are Complete.................................................... |
3-18 |
Chapter 4 Measuring Optical Pulses
4.1 |
Performing Real-time Measurement................................................................................. |
4-1 |
4.2 |
Performing Averaged Measurements................................................................................ |
4-3 |
4.3 |
Displaying Snapshot Waveforms...................................................................................... |
4-5 |
Chapter 5 Waveform Display
5.1 |
Waveform Display Screen................................................................................................. |
5-1 |
5.2 |
Zooming the Waveform Display Scale.............................................................................. |
5-2 |
5.3 |
Moving the Waveform Display Position............................................................................. |
5-5 |
5.4 |
Initializing the Waveform Display Scale............................................................................ |
5-6 |
5.5 |
Setting the Waveform Information Display........................................................................ |
5-7 |
IM AQ1200-01EN |
iii |
1
2
3
4
5
6
7
8
9
10
11
12
13
14
15
16
17
18
19
20
App
Index

Contents
Chapter 6 Waveform Analysis |
|
|
6.1 |
How to Operate the Cursor and Markers.......................................................................... |
6-1 |
6.2 |
Measuring Distances........................................................................................................ |
6-8 |
6.3 |
Moving the Distance Measurement Reference Point........................................................ |
6-9 |
6.4 |
Measuring the Splice Loss.............................................................................................. |
6-10 |
6.5 |
Measuring the Return Loss.............................................................................................. |
6-11 |
6.6 |
Displaying Multiple Traces.............................................................................................. |
6-13 |
6.7 |
Combining Two Traces.................................................................................................... |
6-14 |
6.8 |
Displaying Differential Traces.......................................................................................... |
6-16 |
6.9 |
Analyzing Sections.......................................................................................................... |
6-18 |
Chapter 7 Event Analysis |
|
|
7.1 |
Displaying the Event Screen............................................................................................. |
7-1 |
7.2 |
Editing Events................................................................................................................... |
7-4 |
7.3 |
Editing the Event List........................................................................................................ |
7-8 |
Chapter 8 Light Source (Option)
8.1 |
Producing Measurement Light.......................................................................................... |
8-1 |
8.2 |
Turning On the Visible Light.............................................................................................. |
8-3 |
Chapter 9 Optical Power Meter (Option)
9.1 |
Making Preparations for Measurements........................................................................... |
9-1 |
9.2 |
Setting Optical Power Measurement Conditions and Holding the Display....................... |
9-2 |
9.3 |
Logging Measured Values and Saving Logged Results.................................................... |
9-5 |
9.4 |
Selecting and Saving Core and Tape Numbers.............................................................. |
9-10 |
Chapter 10 PON Power Meter (Option)
10.1 Making Preparations for Measurements......................................................................... |
10-1 |
10.2Setting PON System Optical Power Measurement Conditions and Holding the Display10-2
|
10.3 |
Selecting and Saving Core and Tape Numbers.............................................................. |
10-5 |
Chapter 11 Loss Testing (Option) |
|
||
|
11.1 |
Making Preparations and Adjustments for Loss Testing.................................................. |
11-1 |
|
11.2 |
Performing an Auto Loss Test.......................................................................................... |
11-3 |
|
11.3 |
Performing a Loop-Back Loss Test.................................................................................. |
11-8 |
Chapter 12 |
Multi-Core Loss Testing (Option) |
|
|
|
12.1 |
Creating New Projects.................................................................................................... |
12-1 |
|
12.2 |
Sharing Projects.............................................................................................................. |
12-3 |
|
12.3 |
Performing a Multi-Core Loss Test.................................................................................. |
12-6 |
|
12.4 |
Optical Power Adjustment............................................................................................... |
12-9 |
Chapter 13 |
Fault Locator |
|
|
|
13.1 |
Locating Breaks (Faults) in Optical Fibers...................................................................... |
13-1 |
Chapter 14 |
Checking Fiber End Faces |
|
|
|
14.1 |
Using Fiber Inspection Probes to View the Status of Optical Fiber End Faces.............. |
14-1 |
Chapter 15 |
IP Testing (Option) |
|
|
|
15.1 |
Performing an IP Test...................................................................................................... |
15-1 |
iv
IM AQ1200-01EN
|
|
Contents |
Chapter 16 Multi-Core Fiber Measurement |
|
|
16.1 |
Creating a New Project................................................................................................... |
16-1 |
16.2 |
Loading a Project............................................................................................................ |
16-8 |
16.3 |
Measuring Multi-Core Fibers........................................................................................... |
16-9 |
Chapter 17 Event Mapper |
|
|
17.1 |
Displaying Optical Fiber Events as Icons........................................................................ |
17-1 |
Chapter 18 File Operation and Printing |
|
|
18.1 |
Connecting a USB Storage Medium to the USB Port..................................................... |
18-1 |
18.2 |
Saving and Loading Data................................................................................................ |
18-2 |
18.3 |
Deleting and Copying Files............................................................................................. |
18-8 |
18.4 |
Changing File Names................................................................................................... |
18-10 |
18.5 |
Creating Folders........................................................................................................... |
18-12 |
18.6 |
Deleting and Copying Folders....................................................................................... |
18-13 |
18.7 |
Initializing the Internal Memory..................................................................................... |
18-15 |
18.8 |
Printing.......................................................................................................................... |
18-16 |
18.9 |
Specifying the Items That Are Displayed in the File List............................................... |
18-17 |
Chapter 19 Other Operations |
|
|
19.1 |
Configuring the Language, Beep, Start Menu, USB Function, and Screen Color.......... |
19-1 |
19.2 |
Configuring Power Save Settings................................................................................... |
19-2 |
19.3 |
Resetting the AQ1200 to Its Factory Default Settings..................................................... |
19-3 |
19.4 |
Setting Operation Restrictions........................................................................................ |
19-4 |
19.5 |
Assigning Menus Items That Are Displayed on the Top Menu........................................ |
19-6 |
19.6 |
Configuring Network Settings (Option)........................................................................... |
19-7 |
Chapter 20 Troubleshooting, Maintenance, and Inspection |
|
|
20.1 |
If a Problem Occurs........................................................................................................ |
19-1 |
20.2 |
Error Messages............................................................................................................... |
19-2 |
20.3 |
Viewing the Product Information..................................................................................... |
19-6 |
20.4 |
Performing a Self Test..................................................................................................... |
19-7 |
20.5 |
Updating the Firmware.................................................................................................... |
19-8 |
20.6Backing Up Necessary Files to a PC and Initializing the Internal Memory (Firmware
|
version 1.12 and later).................................................................................................... |
19-9 |
20.7 |
Performing a Mechanical Inspection and Checking Operations................................... |
19-10 |
20.8 |
Replacing the Battery Pack............................................................................................ |
19-11 |
20.9 |
Replacing an Optical Adapter....................................................................................... |
19-14 |
20.10 |
Routine Maintenance.................................................................................................... |
19-16 |
20.11 |
Storage Precautions..................................................................................................... |
19-17 |
20.12 |
Recommended Replacement Parts.............................................................................. |
19-18 |
20.13 |
Calibration..................................................................................................................... |
19-19 |
Appendix
Appendix 1 Data File Formats...............................................................................................App-1
Index
IM AQ1200-01EN
1
2
3
4
5
6
7
8
9
10
11
12
13
14
15
16
17
18
19
20
App
Index

Chapter 1 |
Features |
|
|
|
|
1.1Overview
This instrument is an OTDR (Optical Time Domain Reflectometer) with the features listed below. It is used in the optical fiber and line installation and maintenance servicing of access networks, which link telephone exchanges and service providers with subscribers, and user networks, which enable communication within a corporation or building.
AQ1200
Measurement  in cable installations
Optical fiber cable  Telephone exchanges
Corporate user
Consumer
OTDR Features
•Optical pulse measurement Real-time, averaged measurement
•Waveform display
Can be zoomed and moved
•Waveform analysis
•Cursor/marker, distance, splice-loss, return-loss measurement
•Multi trace analysis
•2 way trace analysis
•Differential trace
•Section analysis
•Event analysis
•Event editing
•Event list editing
Loss Testing (/SLT or /HLT option)
•Loss-measurement light source and visible light source
•Optical power meter
•Loss measurement (loss testing)
•Multi-core loss testing
Visible light source (/VLS option)
Generation of visible light
Fault Locator
Location of breaks (faults) in optical fibers
1
Features
IM AQ1200-01EN |
1-1 |

1.1 Overview
Checking Fiber End Faces
You can use a fiber inspection probe* to photograph a fiber end face and display its state on the screen.
*For information about compatible fiber inspection probes, contact your nearest YOKOGAWA dealer.
IP Testing (/LAN option)
Simple connection testing that uses PING
PON power meter (/PPM option)
Simultaneous measurement of the optical power of different signal wavelengths (1310 nm, 1490 nm, and 1550 nm) of a PON system
Multi-Core Fiber Measurement
Using screens and menus specific to multi-core fiber measurement, you can efficiently and completely measure multi-core fibers.
1-2 |
IM AQ1200-01EN |
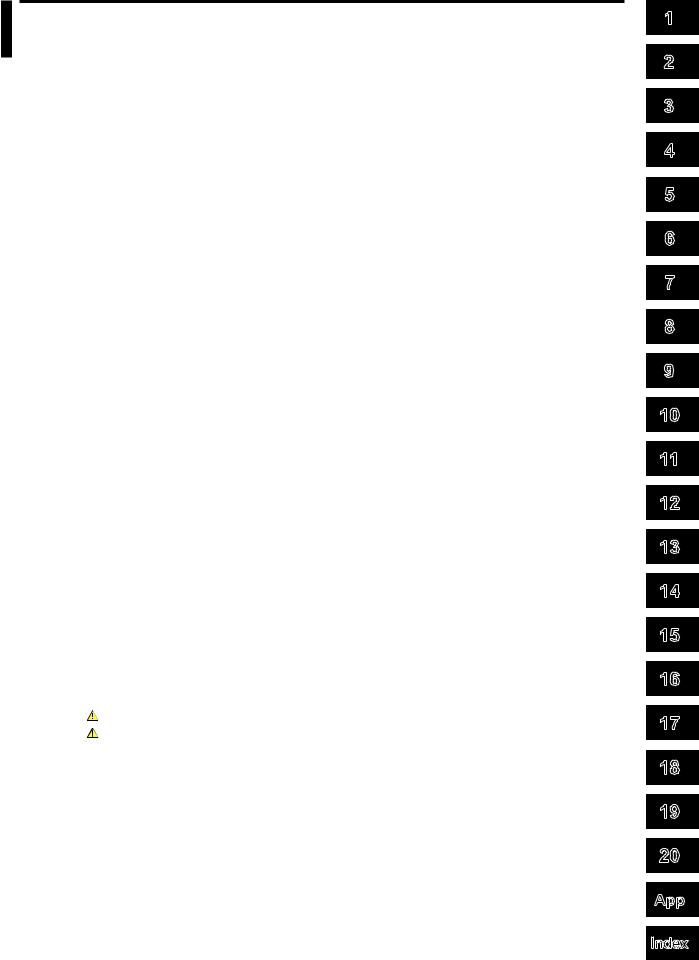
1.2Optical Pulse Measurement
The AQ1200 applies an incident optical pulse to the connected optical fiber and measures the power level of the reflected light from the different sections of the optical fiber such as its splices, bent sections, and the open end of the fiber. The AQ1200 uses the measured power level to determine the distance to the different points (splices, breaks, etc.) of the optical fiber and the loss and other phenomena that occur at those points.
OTDR/Optical port |
Optical pulse generation |
|
|
(Optical port 2) |
Optical fiber being measured |
or |
|
OTDR/Optical port |
Reflection |
(Optical port 3) |
point |
|
Reflected light |
AQ1200 |
Do not bend the optical fiber. |
|
Measurement Mode
The following three measurement modes are available depending on the items that you specify for measurement conditions.
Simple
In this mode, you can set the optical wavelength and turn the automatic saving of measured data on and off. All other measurement conditions are automatically configured or are fixed.
Detail
In this mode, you can set all measurement conditions.
Multi WL
In this mode, in addition to the settings that you can specify in Detail mode, you can select up to two optical wavelengths. The optical pulse whose wavelength you specified first is generated
and measured. Next, the optical pulse whose wavelength you specified second is generated and measured. This operation is then repeated.
Analysis Mode
The following three analysis modes are available depending on the items that you specify for analysis conditions.
Simple
In this mode, you can set the approximation method. All other analysis conditions are automatically configured or are fixed.
Detail
In this mode, you can specify all analysis conditions.
Multi WL
In addition to the conditions in Detail mode, you can specify the index of refraction and the backscattering light level for each of the two wavelengths that you specified in the measurement Multi WL mode. You can also turn the macro bending (bending loss) display on and off.
IM AQ1200-01EN |
1-3 |
1
Features

1.2 Optical Pulse Measurement
Real-time Measurement
In real-time measurement, you can change measurement conditions such as the wavelength, distance range, and pulse width while waveform changes are being measured in real time.*
*The measurement conditions that you can change vary depending on the measurement mode. For details about the measurement conditions, see the explanation of the measurement modes in chapter 3.
Averaged Measurement
When you want to detect reflections, splice loss, and other faint events that are generated from connections or splice points but are buried in noise, use averaged measurement. The AQ1200 derives the measured data by averaging the specified number of optical pulse measurements or by averaging optical pulse measurements over the specified duration. During averaged measurement, you cannot change the measurement conditions. You can stop the averaged measurement before it completes.
Multi-Core Fiber Measurement
Using screens and setup menus specific to multi-core fiber measurement, you can efficiently and completely measure multi-core fibers.
Fiber-in-Use
Some models in the AQ1200 Series use the same wavelength that is used in real communication to make measurements.
If communication light is present in the optical fiber that you want to measure (the fiber is in use), the communication will be affected. In this situation, the AQ1200 will not be able to perform measurements correctly either. Take appropriate precautions to avoid communication interference. Check that there is no communication light present in the optical fiber before you use the AQ1200.
The AQ1200 has a feature for checking whether there is communication light (fiber-in-use alarm; see section 3.5).
1-4 |
IM AQ1200-01EN |
1.3Waveform Display
You can display the measured result as a waveform on the screen. You can zoom the displayed waveform and move the position that is displayed.
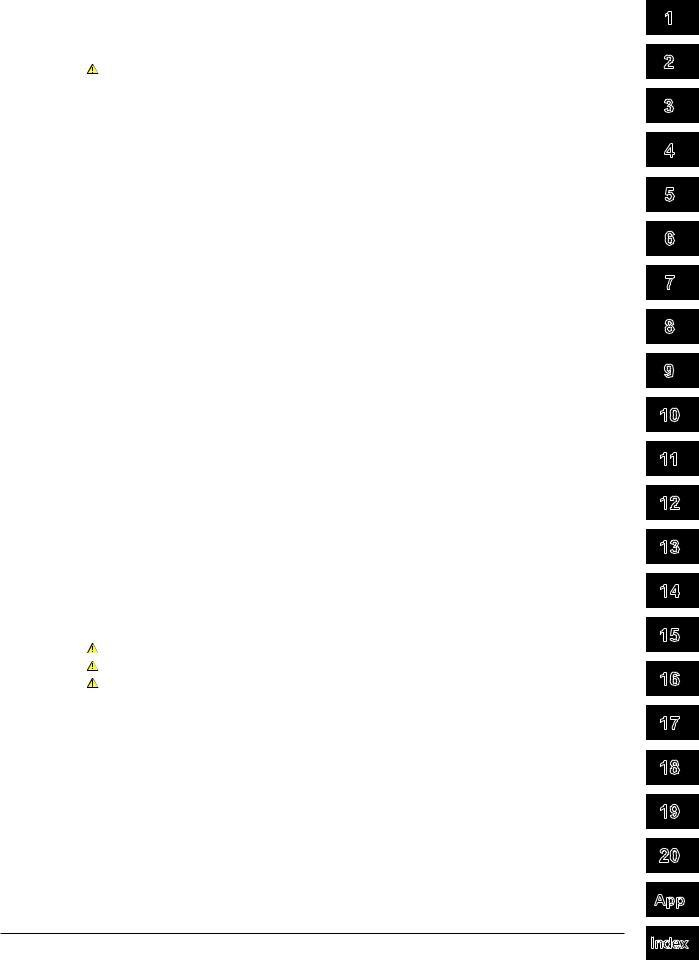
How to View Optical Pulse Waveforms
The optical pulse applied to the optical fiber is reflected at different points of the optical fiber such as its connections, bent sections, and the open end of the fiber. These sections generate loss. The measured result is displayed as a waveform that has distance represented in the horizontal direction and loss level represented in the vertical direction. On the waveform, detected points where loss or reflection occurs are known as events.
Incident ray |
Backscatter Splice |
Connector |
Bend |
Optical fiber
Open end of the fiber
Near-end reflection
Approximated
line
Splice loss Reflection caused by a connector
Loss caused by bending
Reflection at the open end
of the fiber (Fresnel reflection)
Dynamic range (SNR = 1) 
Near-end Reflection
This is the reflection that occurs at the point where the AQ1200 and the optical fiber are connected. This also includes the AQ1200’s internal reflection. In the section where this near-end reflection is detected, even if there are other connections, the loss and reflections that occur at these points cannot be detected. This section is the near-end dead zone.
When you are measuring a short distance, connect a dummy fiber to reduce the effect of the near-end reflection.
Backscatter
When light travels through an optical fiber, Rayleigh scattering caused by changes in the density of materials that are smaller than the light’s wavelength and inconsistencies in the fiber’s composition generates loss in the optical fiber itself. The portion of the scattered light that travels in the direction opposite to the direction of propagation is known as backscatter.
Optical fiber
Incident ray |
|
Small |
|
Backscatter |
material |
||
|
|||
|
|
1
Features
IM AQ1200-01EN |
1-5 |

1.3 Waveform Display
Splice Loss
Because spliced sections of optical fibers have a great number of changes in the material’s density and inconsistencies in the fiber’s composition, loss due to Rayleigh scattering becomes large, and splice loss occurs in these sections.
Reflection at the Connection Point of Connectors
Using a connector to connect two optical fibers is different from splicing them together in that a small gap remains between the two fibers. Because this gap has a different index of refraction, reflection occurs.
Connector
Gap
Optical fiber |
|
Optical fiber |
||
|
|
|
|
|
|
|
|
|
|
Fresnel Reflection at the Open End of the Fiber
This is the reflection that occurs at locations where the index of refraction changes (glass to air) such as where there are tears in the optical fiber or at the end of the optical fiber. When the optical fiber end face is vertical, approximately 3% of the incident optical power (–14.7 dB) is reflected.
Glass |
Air |
Incident ray (100%) |
|
|
Light |
|
(97%) |
Reflected light (3%) |
|
Dynamic Range
Dynamic range refers to the range of optical power levels that can be measured. The larger the dynamic range, the greater the distance that optical pulses can be measured over.
Measurement waveform |
Dynamic range |
(SNR = 1) |
Noise peak |
2.6 dB |
RMS level of the noise |
Zooming the Waveform Display Scale
You can zoom the displayed waveform in the direction of the optical power level (vertically) or in the direction of the distance (horizontally). A rectangular frame that shows the zoom position is displayed on the overview screen that appears in the bottom right of the screen.
Moving the Waveform Display Position
You can move the displayed waveform in the direction of the optical power level (vertically) or in the direction of the distance (horizontally). A rectangular frame that shows the display position is displayed on the overview screen that appears in the bottom right of the screen. This is the same rectangular frame that shows the zoom position.
1-6 |
IM AQ1200-01EN |

1.4Waveform and Event Analysis
Waveform Analysis
You can use the cursor and markers to measure values such as the distance, splice loss, return loss, or reflection level between two points.
Measuring Distance
The AQ1200 measures the time that it takes for an incident optical pulse to be reflected and return to the device. It uses this information and the following equation to calculate the distance (L).
L = C×T/(2N) [m]
C: The speed of light in a vacuum 2.99792 × 10⁸ [m/s]
T: The time measured from when the incident pulse was generated to when the reflected light was received [s]
N: Index of refraction
In the above equation, the division by two accounts for the fact that the measured time represents the total time taken by the optical pulse to reach the reflection point and to return from it.
If the correct index of refraction is not specified, there will be errors in the distance measurement.
Setting the Index of Refraction
The AQ1200 has preset indices of refraction that correspond to each wavelength. For details on the settings, see section 3.6. Contact the optical fiber manufacturer for the fiber’s correct index of refraction.
Distance Range
You must select a distance range that is longer than the cable length of the optical fiber that you want to measure. As the distance becomes greater, the measurement time also increases. For details on the setting range, see section 3.5.
Pulse Width
There are the following features depending on the length of the pulse width. The pulse width that you can select varies depending on the distance range that you have specified. For details on the settings, see section 3.5.
•Short pulse width
You can separate and measure adjacent events (reflection points and losses). However, you cannot measure long distances.
•Long pulse width
You can measure long distances. However, multiple adjacent events may be seen as one single event.
Pulse width
1
Features
IM AQ1200-01EN |
1-7 |

1.4 Waveform and Event Analysis
Dead Zone
An area where the influence of a large event such as a connector’s connection point makes it impossible to recognize other events that exist in that area is a dead zone. There are the following two types of dead zones.
•Event dead zone
An area where adjacent reflections cannot be separated. This is the area represented by the pulse width between the two points on the waveform at the level that is 1.5 dB below the peak value.
•Attenuation dead zone
An area where, because there is a large reflection, the surrounding splice losses cannot be measured.
1.5 dB
Event dead zone
Attenuation dead zone
Near-end Dead Zone Prevention
In sections where near-end reflection is detected, loss and reflections that occur at connections cannot be detected. If you are measuring a short distance, connect a dummy fiber to move events that are hidden in the near-end reflection the distance of the dummy fiber.
|
|
|
|
|
|
|
|
|
Optical fiber being |
|
|
|
|
|
|
|
|
|
Event generation measured |
||
Dummy fiber |
|
|
|
|
|
|
|
point |
||
|
|
|
|
|
|
|
|
|
|
|
Do not bend the optical fiber.


 AQ1200


Small reflection that was hidden within a large reflection
Splice Loss
The AQ1200 measures the distance and the loss between the specified points.
2 Point Markers
The AQ1200 measures the distance and the loss between two points. If reflection is detected between the two points, the return loss is also measured. The splice loss value changes depending on the approximation method that you have specified. This can be used when Marker Mode is set to Marker or Line.
1 (n when Marker Mode is set to Line)
Splice loss a (dB) |
|
(E when Marker Mode is set to Line) |
||||
(Total loss) |
|
|||||
2 |
||||||
|
||||||
|
|
|
|
|
|
|
|
|
|
|
|
|
|
|
|
|
|
|
|
|
|
|
d (km) |
|
|
||
|
|
|
||||
1-8 |
IM AQ1200-01EN |
1.4 Waveform and Event Analysis
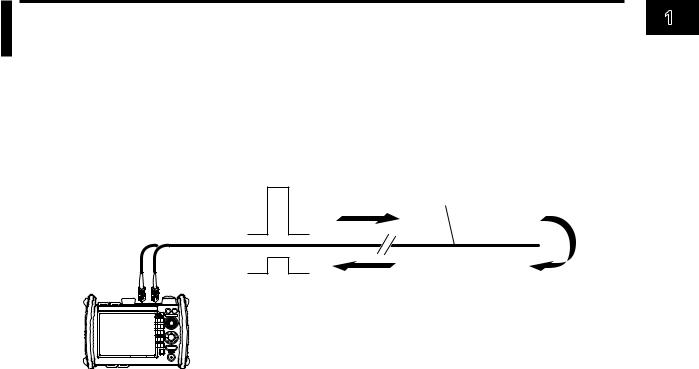
4 Point Markers
The AQ1200 uses the following four points to perform the measurement: the measurement start point 1 , the splice loss start point 2 , the splice loss end point Y2, and the measurement end point 3 . At position 2 , the level difference between the approximated line 2 – 1 and the approximated line Y2– 3 is calculated as the splice loss. The splice loss changes greatly depending on the position of 2 . Set the correct position for 2 . The splice loss value changes depending on the approximation method that you have specified. This can only be used when Marker Mode is set to Marker.
1
2
b(dB)
|
|
|
Y2 |
Approximated line Y2– |
3 |
e (dB) |
3 |
|
|||
|
|
|
|
|
c (km) |
f (km) |
|
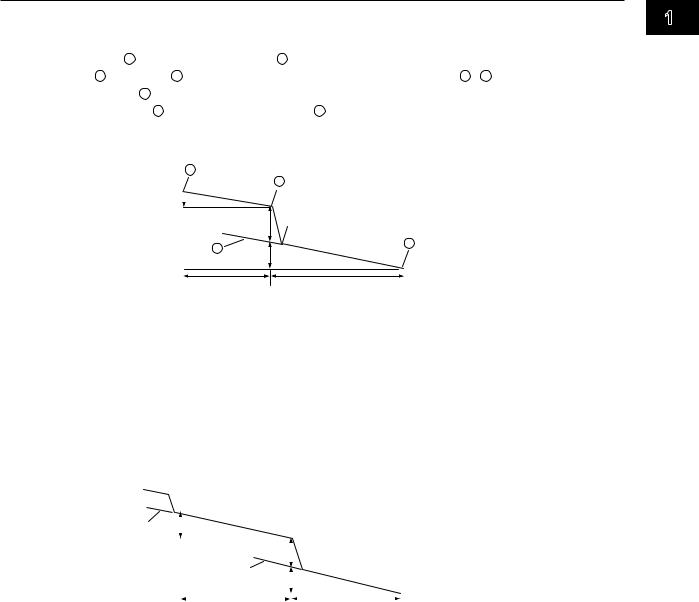
5 Point Markers
The AQ1200 uses the following five points to perform the measurement: the near-end point (n), a point (N) that is used to calculate the near-end side’s approximated line, a point (E) where splice loss is detected, a point (F) that is used to calculate the far-end side’s approximated line, and the far-end point (f). At position E, the level difference between the approximated line n–N and the approximated line F–f is calculated as the splice loss. The splice loss changes greatly depending on the position of E. Set the correct position for E. The splice loss value changes depending on the approximation method that you have specified. This can only be used when Marker Mode is set to Line.
|
n |
N E F |
|
f |
||||||||
Approximated |
|
b (dB) |
|
|
|
|
|
|
|
|
||
|
|
|
|
|
|
|
|
|
||||
|
|
|
|
|
|
|
|
|
||||
line n–N |
|
|
|
|
|
|
|
|
|
|
|
|
|
|
|
|
a (dB) |
|
|
|
|
|
|||
|
|
|
|
|
|
|
|
|
||||
|
|
|
|
|
|
|
|
|
|
|||
|
|
|
Approximated |
|
|
|
|
|
|
|
|
|
|
|
|
e (dB) |
|
|
|
|
|
||||
|
|
|
|
|
||||||||
|
|
|
line F–f |
|
|
|
|
|
|
|
|
|
|
|
|
|
|
|
|
|
|
|
|
|
|
|
|
|
|
c (km) |
|
|
|
|
|
|
f (km) |
|
Return Loss
Return loss RL is the ratio, in dB, of the reflected optical power level Pr to the incident optical power level Pi. It is calculated using the following equation. The larger the return loss, the smaller the reflected optical power. This implies that the performance of the measured optical line is good.
RL = –10log(Pr/Pi) [dB]
1
Features
IM AQ1200-01EN |
1-9 |

1.4 Waveform and Event Analysis
Multi Trace Analysis
You can load up to four traces that have been measured on the AQ1200 and display them simultaneously for comparison.
You can adjust the vertical display position of each loaded trace.
2 Way Trace Analysis
Trace events that have been measured from optical fiber cable end A to end B and those measured from end B to end A can be combined. This combination enables displaying of events that could not otherwise be measured because of dead zones.
In the figure below, the event that is in the near-end dead zone (point S) when measured from end A is detected as event number 5 when measured from end B. In the 2 way trace analysis display, it is displayed as event number 1.
|
|
End A |
|
|
|
|
End B |
|||
|
|
|
|
|
|
|
|
|
|
|
End A → End B |
AQ1200 |
|
|
|
|
|
|
|
|
|
▲ |
|
▲ |
▲ |
▲ |
▲ |
▲ |
|
|||
|
|
|
S |
|
1 |
2 |
3 |
4 |
E |
|
End A ← End B |
|
|
||||||||
|
|
|
|
|
|
|
|
|
||
|
|
|
|
|
|
|
|
AQ1200 |
||
|
▲ |
|
▲ |
▲ |
▲ |
▲ |
▲ |
|||
2 way trace analysis |
|
E |
5 |
4 |
3 |
2 |
1 |
S |
|
|
|
|
|||||||||
|
|
|
|
|
|
|
|
|||
|
▲ |
1 |
▲ |
▲ |
▲ |
▲ |
▲ |
|
||
|
|
|
S |
2 |
3 |
4 |
5 |
E |
||
An event of the other trace that exists within 6% of the position of an event of the current trace will be considered part of the current trace event.
If multiple events of the other trace that exists within 6% of the position of an event of the current trace, the closest event will be considered part of the current trace event.
Traces that meet the following conditions can be combined.
•Both have the same wavelength.
•Both have the same pulse width.
•Their end position offset is within 6%.
•Both have event lists.
Differential Trace
You can load two traces that have been measured on the AQ1200 and display their difference as a trace.
The screen can display the loaded traces and the differential trace simultaneously.
The differential trace is the result of subtracting the values of the current trace from those of the other trace.
You can use markers to read the following values of the differential trace.
•Loss between markers (dB)
•Distance between markers (km)
•Loss per unit distance between markers (dB/km)
•Distance to each marker
Section Analysis
You can set two markers, start point S and end point E, to measure the return loss and total loss in the section that you have specified. If you specify the reference point marker B for the return loss measurement, you can measure the return loss in the area between B and E.
S E
 B
B
E
1-10 |
IM AQ1200-01EN |
1.4 Waveform and Event Analysis
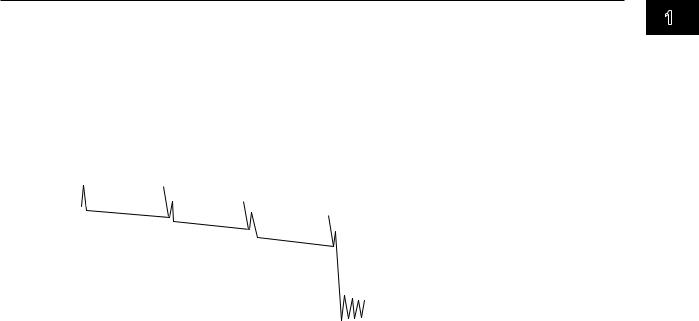
Event Analysis
You can search for events in the optical pulse measurement waveform and measure the splice loss and the return loss.
Event Editing
You can insert and delete events on the event screen. When you edit an event marker, the splice loss and the return loss can be recalculated.
Measurement reference point
|
|
Event number 1 |
Event number 2 |
|
|
|
|
Detected fiber-end event E |
|
▲ |
▲ |
|
||
|
|
|||
S |
|
|
||
|
|
1 |
▲ |
|
|
|
|
2 |
▲ |
|
|
|
|
E |
Event List Editing
You can set indices of refraction for each event period on the event list. Setting the indices of refraction in accordance with the connected fiber makes accurate distance measurements possible.
These indices only affect event analysis. The do not affect the waveform display.
You can also change event distances. However, the events shown on the screen will not change.
1
Features
IM AQ1200-01EN |
1-11 |

1.5Light Source and Optical Power Meters (Options)
The features listed for the loss-measurement light source and optical power meters are available on models with the /SLT, /HLT, or /PPM option. The features listed for the visible light source are available on models with the /VLS option.
Loss-Measurement Light Source
The following measurement light wavelengths can be generated.
Model |
Measurement Light Wavelength |
AQ1200A |
SM 1310 nm, SM 1550 nm |
AQ1200B |
SM 1625 nm |
AQ1200C |
SM 1650 nm |
AQ1200E |
SM 1310 nm, SM 1550 nm, SM 1625 nm |
AQ1205A |
SM 1310 nm, SM 1550 nm |
AQ1205E |
SM 1310 nm, SM 1550 nm, SM 1625 nm |
AQ1205F |
SM 1310 nm, SM 1550 nm, SM 1650 nm |
You can produce continuous light or light that has been modulated at the selected frequency (modulation mode).
Visible Light Source
You can produce visible light to visually identify breaks in the optical fiber under test. You can turn the visible light on and off independently of the measurement light source.
Optical Power Meter
The two instrument types listed below are available for measuring different types of optical power.
Item |
Models with /SLT or /HLT |
Models with /PPM Suffix Codes |
|
||
Normal power meter |
PON power meter |
||||
Suffix Codes |
|||||
|
selected |
selected |
|||
|
|
||||
Wavelength |
Yes |
Fixed10, 11 |
Fixed10, 11 |
|
|
Wavelength mode1 |
Yes |
— |
— |
|
|
Modulation mode2 |
Yes |
— |
— |
|
|
Unit |
Yes (dB, dBm, W) |
Yes (dB, dBm, W) |
Yes (dBm, W) |
||
Reference3 |
Yes |
Yes |
— |
|
|
Measured value display hold |
Yes |
Yes |
Yes |
|
|
Measured value logging |
Yes |
Yes |
— |
|
|
Zero set4 |
Yes |
Yes |
Yes |
|
|
Average count5 |
Yes |
Yes |
Yes |
|
|
Maximum and minimum value |
Yes |
Yes |
— |
|
|
display6 |
|||||
Interlocking of light source and |
Yes |
Yes |
— |
||
optical power meter settings7 |
|||||
|
|
|
|
||
Offset8 |
Yes |
Yes |
Yes |
|
|
Threshold9 |
Yes |
Yes |
Yes |
|
|
Measurement of the optical |
|
|
|
|
|
power from ONU to OLT for a |
— |
— |
Yes |
||
particular signal wavelength10 |
|
|
|
|
|
Measurement of the optical |
|
|
|
|
|
power from OLT to ONU for a |
— |
— |
Yes |
||
particular signal wavelength11 |
|
|
|
|
|
|
|
Yes: Can be set or executed, —: Not available |
|||
1Wavelengths can be set with the wavelength mode set to Simple, Detail, or CWDM.
•Simple: You can select from a list of preset wavelengths.
•Detail: You can set the wavelength to a value from 800 to 1700 nm in 1 nm steps.
•CWDM: You can set the wavelength to a value from 1270 to 1610 nm in 20 nm steps along the CWDM wavelength grid.
1-12 |
IM AQ1200-01EN |

1.5 Light Source and Optical Power Meters (Options)
2You can select the modulation frequency of the incident rays from a list of presets. You can also select CW (continuous).
3You can make the displayed measured value the reference and display subsequent measured values as relative values.
4You can adjust the internal deviation of the optical power measurement section and obtain more accurate absolute optical power values.
5You can display averaged measured values.
6You can display the maximum and minimum measured values.
7You can interlock the light source and optical power meter settings when you connect an optical fiber between the light source port of an AQ1200 and the optical power measurement port of another AQ1200.
8You can add a specified value (the offset value) to measured optical power values.
9You can set upper and lower threshold values and determine whether or not the measured values fall within them.
10You can measure the optical power of an upstream signal from the ONU (optical network unit: the user’s optical terminal) to the OLT (optical line termination: the telephone exchange’s optical terminal). The optical power of the 1310 nm (data wavelength) signal is measured.
11You can measure the optical power of downstream signals from the OLT to the ONU. The optical power of the 1490 nm (data wavelength) and 1550 nm (video wavelength) signals is measured.
Logging
You can measure short-term optical power stability. The optical power value during logging can be displayed on a graph, and you can calculate the maximum, minimum, and average. In addition, you can use cursors to calculate the optical power at a specified location or the maximum, minimum, and average within a specified area. The logging results can be saved to a file in CSV format.
1
Features
IM AQ1200-01EN |
1-13 |

1.6Loss Test (Option)
You can easily measure optical fiber and optical line degradation. This feature is available on models with the /SLT or /HLT option.
Auto Loss Test (Using one AQ1200 as the light source and another as the optical power meter)
Using the AQ1200 as a light source and optical power meter, you can easily measure optical fiber and line degradation. You can also use the AQ1100 multi-field tester series instead of the AQ1200 as the light source or optical power meter.
Light Source
You can set up to two measurement light wavelengths and produce them in order. You can produce a constant level of light if you use the optical power adjustment feature.
Optical Power Meter
The AQ1200 automatically identifies the measurement light from the AQ1200 that it is connected to and measures the optical power.
•The following items can be specified or executed. For details about these items, see section 1.5. The unit, reference, offset, and threshold values can be specified.
The zero set and measured value display hold operations can be executed.
•You can attach fiber information to the measured values and save them.*
*Because the AQ1200 is capable of identifying optical fiber and line cores, it is possible to number cores and tapes.
Light source (AQ1200) |
|
|
Optical power meter (AQ1200) |
||
|
|
|
Optical power |
|
|
Light source |
|
Fiber under |
|
|
|
|
loss test |
|
measurement |
|
|
port |
|
|
|
||
|
|
|
port |
|
|
|
|
|
|
|
|
|
|
|
|
|
|
Loop-Back Loss Test (Using one AQ1200)
You can use the light source and optical power meter features on a single AQ1200 to perform a loopback loss test on an optical fiber or line. To perform loss testing, connect one end of the fiber that you want to perform loss testing on to the AQ1200 light source port, and connect the other end to the optical power measurement port of the same AQ1200.
Light source and optical power meter
(AQ1200)
Light source |
|
|
port |
|
|
|
Fiber under |
|
Optical power |
|
loss test |
|
|
|
measurement |
|
|
port |
|
|
1-14 |
IM AQ1200-01EN |
1.7Multi-Core Loss Test (Option)
You can efficiently measure multi-core optical fiber and optical line degradation. This feature is available on models with the /SLT or /HLT option.
Master and Slave
Connect two AQ1200s and specify the optical power meter as the master and the light source as the slave. You can also use the AQ1100 multi-field tester series instead of the AQ1200 as the master or slave.
Specifying the Optical Communication Fiber
To transfer, between the master and slave, project setup information and information about the fiber under loss test, you must specify a fiber from the multi-core optical fiber to use for communication. Connect one end of the optical communication fiber to the master’s light source port (optical port 2), and connect the other end to the slave’s optical power measurement port (optical port 1).
Information That Is Transferred from Master to Slave
The following information can be transferred through the optical communication fiber from the master to the slave.
•Project information (see below for further details)
•Loss test results*
*Each time that the selected fiber’s loss test finishes, that fiber’s loss test result is automatically transferred.
Connecting the Optical Fiber under Loss Test
All fibers other than the optical communication fiber can be tested. For each optical fiber under loss test, connect one end to the master’s optical power measurement port, and connect the other end to the slave’s light source port. The core and tape numbers of the fibers under loss test are transferred from the master to the slave.
Master (AQ1200) |
|
|
|
|
|
|
|
|
Slave (AQ1200) |
|
|
|
|
|
|
|
|
|
|
|
Optical power |
Light source port |
|
|
|
Communication fiber |
|
|
|
|||
|
|
|
|
|
|
measurement port |
||||
|
|
|
|
|
||||||
(optical port 2) |
|
|
|
|
|
|
|
|
||
|
|
|
|
|
|
|
|
(optical port 1) |
||
Optical power |
|
|
|
|
|
|
|
|
Light source port |
|
|
|
|
Fiber under |
|
|
|
|
|||
measurement port |
|
|
|
|
|
|
||||
|
|
|
loss test |
|
|
|
|
|
||
|
|
|
|
|
|
|
|
|||
|
|
|
|
|
|
|
|
|
|
|
Executing a Loss Test
Transmit light from the slave. The master will automatically identify different wavelengths in the light from the slave and measure the optical power. Continue the loss test, switching the cores between the master and the slave in order.
Projects
You can create projects with the master. You can specify the following project information:
The project name, the number of the core to start loss testing at, the tape number type, the number of cores, and the transmitted or measured measurement light wavelengths (up to 2).
•You can transfer projects from the master to the slave and share information.
•When the master and the slave share a project and use that project to perform loss testing, if testing is stopped, the data up to the stop point is saved and you can begin testing again from the next core.
•You can save and load projects as CSV files.
1
Features
IM AQ1200-01EN |
1-15 |

1.8Fault Locator
This feature enables you to search for breaks (faults) in an optical fiber or line. If there are no faults in the middle of a fiber, the fiber end face is detected as a fault. You can specify the wavelength and the loss level that is used to determine if a fault is a fiber end face or not when the AQ1200 searches for faults. You can also zoom the display scale of the measured waveform and move the display position.
Break (fault)
Loss level that is used to determine whether this is the fiber end face or not
You can make measurements on the selected route.
The following five routes are available.
•Normal
Searches for faults in the fiber that connects the OLT1 and ONU2
•OLT -> Splitter
Searches the route from the OLT to the splitter
•OLT -> Splitter -> ONU
Searches the routes from the OLT through the splitter to each ONU
•ONU -> Splitter
Searches the route from an ONU to the splitter
•ONU -> Splitter -> OLT
Searches the route from an ONU through the splitter to the OLT
1OLT (optical line termination): the telephone exchange’s optical terminal
2ONU (optical network unit): the user’s optical terminal
1-16 |
IM AQ1200-01EN |

1.9Checking Fiber End Faces
You can use a fiber inspection probe* to take a photograph that shows the state of a fiber end face. You can display this photograph on the AQ1200 screen and save it.
*For information about compatible fiber inspection probes, contact your nearest YOKOGAWA dealer.
1
Features
IM AQ1200-01EN |
1-17 |

1.10 IP Test (Option)
You can check whether or not the network layer of an Ethernet LAN line is established. Before performing an IP test, make sure that the optical fiber or line is connected physically.
IP testing is available on models with the /LAN option.
Ping Test
To ping an address (perform a simple IP test), specify the address and configure the Tx frame settings listed below. The results of pinging the address appear on the screen.
The frame length, Tx mode (continuation, number of frames to send, and transmission time), and measurement interval
1-18 |
IM AQ1200-01EN |

1.11 Multi-Core Fiber Measurement
Multi-core fiber measurement takes time and effort. This feature makes it possible to efficiently measure multi-core fibers through a dedicated menu.
Projects
Items that you need to specify in order to make multi-core measurements such as measurement conditions, analysis conditions, and core information are managed in projects.
By creating a project before a measurement, you can measure cores under the same conditions.
You can save projects to files. You can load a previously saved project and make measurements under the same conditions.
List
Cores are listed. You can easily distinguish between cores that have been measured, cores that have not been measured, and cores that do not to be measured. This list prevents you from forgetting measurements and from making unnecessary measurements. (You can make measurements efficiently.)
Measurement Result Storage
Measurement results of each core are automatically saved to a folder that is automatically created in the folder that the project file is saved in. The folder will have the same name as the project file.
1
Features
IM AQ1200-01EN |
1-19 |

1.12 Event Mapper
You can display measured result events as icons on the screen. Detailed event analysis results are displayed along with the displayed icons. In addition, if fault events (see section 3.6) are specified, icons are displayed in different colors depending on the results of pass/fail judgments.
Each event is displayed as an icon. You can also switch to the waveform display using soft keys.
Near-end reflection
Splice loss
Reflection caused  by a connector Loss caused
by bending
Reflection caused by a splitter
Reflection at the open end
of the fiber (Fresnel reflection)
If an event is determined to be a fault event, the icon background is displayed in orange.
Detailed analysis results of the selected icon (event)
Distance between events
1-20 |
IM AQ1200-01EN |

1.13 Other Features
The AQ1200 also has the following features.
•Data saving and loading
•Language selection
•Beep on/off
•Startup menu selection
•USB function selection (storage/communication)
•Screen color selection
•Current date and time configuration (see the operation guide, IM AQ1200-02EN)
•Power save settings
•Network settings (on models with the /LAN option)
•Setup information initialization (to the factory default values)
•AQ1200 information display (model, serial no., suffix code, version, etc.)
•Self test execution
•Firmware version updating
1
Features
IM AQ1200-01EN |
1-21 |

Chapter 2 Common Operations
2.1Top Screen
When you turn the AQ1200 on and it starts, the top screen appears. First select a feature from this top screen, and then configure the feature or carry out the measurement that corresponds to the feature you have selected.
1.Turn on the AQ1200.
2.Use the rotary knob to select the feature.
An image that shows the selected feature is displayed, and the feature name is displayed in the upper left of the screen.
3.Press the center of the rotary knob or ENTER to confirm your selection.
The setup or measurement operation menu for the selected feature is displayed.
In this manual, steps 2 and 3 above are described as shown below. Example: To select the OTDR feature and confirm it:
“Using the rotary knob and ENTER, select OTDR.”
Displays an image that shows |
Top Menu |
the selected feature |
|
Displays a term that  represents the selected feature
•OTDR
•LS_OPM
•Auto Loss Test
•Multi-Core Loss Test
•IP Test
•Fiber Inspection Probe
•Fault Locator
•Visible Light Source
•PON_OPM
•Multi-Core Fiber Meas
•OTDR Event Mapper
Rotary knob
The center of the rotary knob
 ENTER key
Displays an explanation of the selected feature
Procedural Explanations of Features
For explanations of the procedures to perform after you have selected and confirmed a feature, see the chapters or sections that are listed in the following table.
Function |
Reference |
OTDR (optical pulse measurement) |
Chapters 3 to 7 |
LS_OPM (power meter and light source) |
Chapters 8 and 9 |
Auto loss test (auto loss test and loopback loss test) |
Chapter 11 |
Multi-core loss test |
Chapter 12 |
IP test |
Chapter 15 |
Fiber inspection probe (fiber end face check) |
Chapter 14 |
Fault locator |
Chapter 13 |
Visible light source |
Section 8.2 |
PON_OPM (PON power meter)1 |
Chapter 10 |
Multi-Core Fiber Meas (multi-core fiber measurement)2 |
Chapter 16 |
OTDR Event Mapper3 |
Chapter 17 |
1AQ1200 firmware versions 1.10 and later support this feature.
2AQ1200 firmware versions 2.01 and later support this feature.
3AQ1200 firmware versions 2.03 and later support this feature.
IM AQ1200-01EN |
2-1 |
2
Operations Common
2.1 Top Screen
Top Menu
•You can also use the soft keys (F1 to F5) on the right side of the top menu to select a feature and display its setup or measurement operation menu.
•The feature that you have used the rotary knob and ENTER to select is displayed in the top position (soft key F1) of the top menu.
•If you use the rotary knob and ENTER to select a feature that is already displayed in the top menu, the feature will move to the top position of the top menu. If you press a soft key (F1 to F5), the feature that you have selected will also be moved to the top position.
•Up to five features can be displayed. When you exceed this number, the feature that was displayed in the position by soft key F5 is deleted from the top menu.
•You can configure the top menu that is displayed when the AQ1200 starts. For details, see section 19.1.
OTDR Top Menu
If you select the OTDR feature from the top menu, the OTDR menu (OTDR top menu) will appear. On AQ1200s with firmware version 2.03 and later, the OTDR top menu varies depending on the suffix code.
If the Suffix Code Is Not -HE (-HJ for example)
The OTDR top menu is the same as that of the previous version.
•The OTDR top menu will contain waveform analysis commands.
•During real-time measurement, marker and measurement condition commands appear. The F4 soft key will show the attenuation command.
•When real-time measurement finishes, the menu will return to displaying waveform analysis commands.
• OTDR Top Menu (during real-time measurement)
When not |
During real-time |
After real-time |
measuring |
measurement |
measurement |
Attenuation command
Waveform |
Measurement |
Waveform |
Analysis |
Condition |
Analysis |
Command |
Command |
Command |
•During averaged measurement, the marker command appears.
•When averaged measurement finishes, the menu will return to displaying waveform analysis commands.
2-2 |
IM AQ1200-01EN |

2.1 Top Screen
• OTDR Top Menu (during averaged measurement) |
|
||||||
When not |
During averaged |
After averaged |
|
||||
measuring |
measurement |
measurement |
2 |
||||
|
|
|
|
|
|
||
|
|
|
|
|
Waveform Analysis |
Operations Common |
|
|
|
|
|
|
|||
Waveform Analysis |
Marker |
||||||
|
|||||||
Command |
Command |
Command |
|
||||
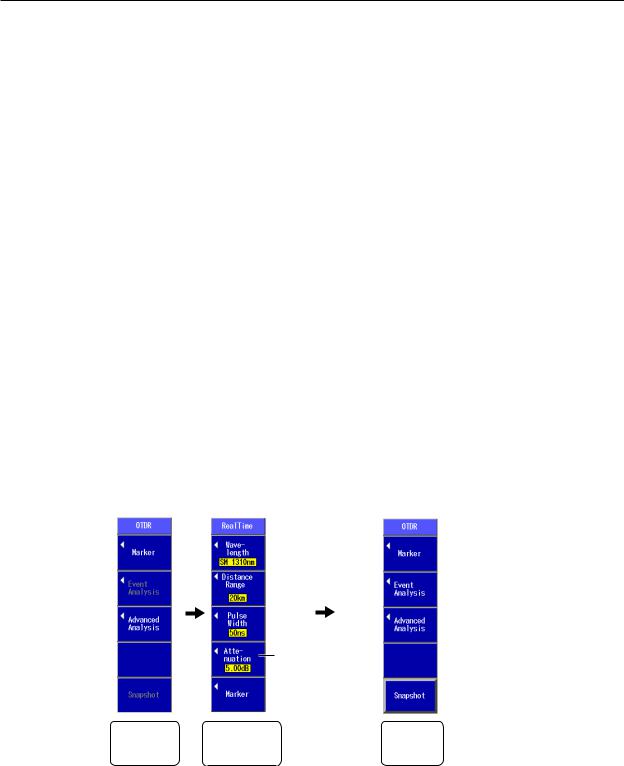
If the Suffix Code Is -HE
•The OTDR top menu will contain measurement condition setting commands. The F4 soft key will show the average duration command.
The F5 soft key will show a command for switching to waveform analysis commands.
•During real-time measurement, measurement condition setting commands appear.
•When real-time measurement finishes, the menu will change to displaying waveform analysis commands.
• OTDR Top Menu (during real-time measurement)
When not |
During real-time |
measuring |
measurement |
Average duration command
(see section 3.5)
|
|
Switches to |
|
|
Marker |
|
|
||||
|
|
|
|
||
|
|
waveform analysis |
|
|
command |
|
|
commands |
|
|
|
|
|
|
|
|
|
Measurement |
Measurement |
||||
Condition |
Condition |
||||
Command |
Command |
||||
After real-time measurement
[Detail mode]
Displays/clears snapshot waveforms
Switches to measurement condition setting commands
Multi WL mode
Switches the displayed waveform
Waveform Analysis
Command
IM AQ1200-01EN |
2-3 |
Loading...