


E7405A
Table of contents
 Loading...
Signal Analysis Measurement Gu ide
Agilent Technologies
EMC Series Analyzers
This guide documents firmware revision A.08.xx
This manual provides documentation for the following instruments:
E7401A (9 kHz- 1.5 GHz)
E7402A (9 kHz - 3.0 GHz)
E7403A (9 kHz - 6.7 GHz)
E7404A (9 kHz - 13.2 GHz)
E7405A (9 kHz - 26.5 GHz)
Manufa cturing Part Number: E7401-90049
Supersedes: E7401-90025
Printed in USA
December 2001
© Copy rig ht 2001 Agilent Technologies

Notice
The information contai ned in this document is subject to change
without notice.
Agilent Technologies makes no warranty of any kind with regard to this
material, including but not limited to, the implied w a rranties of
merchantability and fitness for a particular purpose. Agilent
Techn o logies sha ll not be liable for e rro rs contain e d herein or fo r
incidental or consequential damages in connecti on with the furnis hing,
performance, or use of this material.
Safety Information
The following safety symbols are used throughout this manual.
Familiarize yoursel f with the symbols and their meaning before
operating this instrument.
WARNING Warning denotes a hazard. It calls attention to a procedure
which, if not c orrectly performed or adhered to, could result in
injury or loss of life. Do not proceed beyond a warning note
until the indicated conditions are fully understood and met.
CAUTION Caution denotes a haza rd. It calls attention to a proc edure that, if not
correctly pe rfo rmed or ad h er e d to, co uld result in damage to or
destruction of the instrument. Do not proceed beyond a caution sign
until th e in d icated con ditions are fully u n d e rs t o o d an d met.
NOTE Note call s o ut specia l informa tion for th e u ser’s attentio n . I t p ro vides
operational inform ation or additional instructions of which the user
should be aware.
The instruction documentation symbol. The product is
marked with this symbol w hen it is necessary for the
user to re fe r t o the instructions in the documentat io n .
This sy m bol is used to mark the on position of the
power line switch.
This symbol is used to mark the s tandby pos it ion of the
power line switch.
This symbol indicates that the input power required is
AC.
2

WARNING This is a Safety Class 1 Product (provided with a protective
earth ground incorporated in the power cord). The mains plug
shall be inserted only in a socket outlet provided with a
protected earth contact. Any interruption of the protective
conductor inside or outside of t he product is likely to make the
product dangerous. Intentional interruption is prohibited.
WARNING No operator serviceable parts inside. Refer servicing to
qualified personnel. To prevent electrical shock do not remove
covers.
WARNING If this product is not used as specified, the protection provided
by the equipment could be impaired. This product must be used
in a normal condition (in which all means for protection are
intact) only.
CAUTION Always use the three-prong AC power cord supplied with this product.
Failure to ensure adequate grounding may cause product damage.
Warranty
This Agilent Technologies instrum ent product is warranted against
defects in material an d workman ship for a pe rio d o f t h re e ye ars from
date of shipment. During the warranty period, Agilent Technologies
will, at its option, either repair or replace products w hich prove to be
defective.
For warranty service or repair, this product must be returned to a
servi ce facility de s ignat e d by Agile n t Technologies. Buy e r s h all pre pay
shipping charges to Ag ilent Technologies and Ag ilent Technologies s hall
pay shipping charg e s to re t u rn t h e p ro du ct to Buyer. However, Buyer
shall pay all sh ipping charge s, du tie s, an d taxes for prod uct s re t u rn e d
to Agilent Technologies from another country.
Agilen t Technologie s warrants that its software and firmware
designated by Agilent Technologies for use with an instrument will
execute its programming instructions when properly installed on that
instrument. Agilent Technologies does not warrant that t he operat ion of
the instrument, or software, or firmware will be uninterrupted or
error-free.
3

LIMITATION OF WARRANTY
The foreg o in g warranty sh all not apply t o de fe ct s re su lting fro m
improper or inadequate m aintenance by Buyer, Buyer-supplied
software or interfacing, unauthorized modification or misuse, operation
outside of the environmenta l sp ec ifications for the product, or improper
site preparation or maintenance.
NO OTHER WARRANTY IS EXPRESSED OR IMPLIED. AGILENT
TECHNOLOGIES SPECIFICALLY DISCLAIMS THE IMPLIED
WARRANTIES OF MERCHANTABILITY AND FITNESS FOR A
PARTICULAR PURPOSE.
Should Agilent have a negotiated contract with the User and should
any of the con t ract terms conflict with these terms, the con t ract terms
shall cont ro l .
EXCLUSIVE REMEDIES
THE REMEDIES PROVIDED HEREIN ARE BUYER’S SOLE AND
EXCLUSIVE REMEDIES. AGILENT TECHNOLOGIES SHALL NOT
BE LIABLE FOR ANY DIRECT , INDIRECT, SPECIAL, INCIDENT AL,
OR CONSEQUENTIAL DAMAGES, WHETHER BASED ON
CONTRACT, TORT, OR ANY O THER LEGAL THEORY.
Where to Find the Latest Information
Documentation is updated periodically. For the latest information about
Agilent Technologies EMC Analyzers , including firmware upgrades a nd
application information, please visit the following Internet URL:
http://www.agilent.com/find/emc
Microsoft is a U.S. registered trademark of Microsoft Corporation.
4

Contents
1. Making Basic Measurements
What is in This Chapter . . . . . . . . . . . . . . . . . . . . . . . . . . . . . . . . . . . . . . . . . . . . . . . . . . . . . . . . . . . . 8
Test Equipment . . . . . . . . . . . . . . . . . . . . . . . . . . . . . . . . . . . . . . . . . . . . . . . . . . . . . . . . . . . . . . . . 9
Comparing Signals . . . . . . . . . . . . . . . . . . . . . . . . . . . . . . . . . . . . . . . . . . . . . . . . . . . . . . . . . . . . . . . 10
Signal Comparison Example 1: . . . . . . . . . . . . . . . . . . . . . . . . . . . . . . . . . . . . . . . . . . . . . . . . . . . 10
Signal Comparison Example 2: . . . . . . . . . . . . . . . . . . . . . . . . . . . . . . . . . . . . . . . . . . . . . . . . . . . 12
Resolving Signals of Equal Amplitude . . . . . . . . . . . . . . . . . . . . . . . . . . . . . . . . . . . . . . . . . . . . . . . 14
Resolving Signals Example: . . . . . . . . . . . . . . . . . . . . . . . . . . . . . . . . . . . . . . . . . . . . . . . . . . . . . 15
Resolving Small Signals Hidden by Large Signals . . . . . . . . . . . . . . . . . . . . . . . . . . . . . . . . . . . . . . 18
Resolving Signals Example: . . . . . . . . . . . . . . . . . . . . . . . . . . . . . . . . . . . . . . . . . . . . . . . . . . . . . 19
Making Better Frequency Measurements . . . . . . . . . . . . . . . . . . . . . . . . . . . . . . . . . . . . . . . . . . . . . 22
Better Frequency Measurement Example: . . . . . . . . . . . . . . . . . . . . . . . . . . . . . . . . . . . . . . . . . . . 22
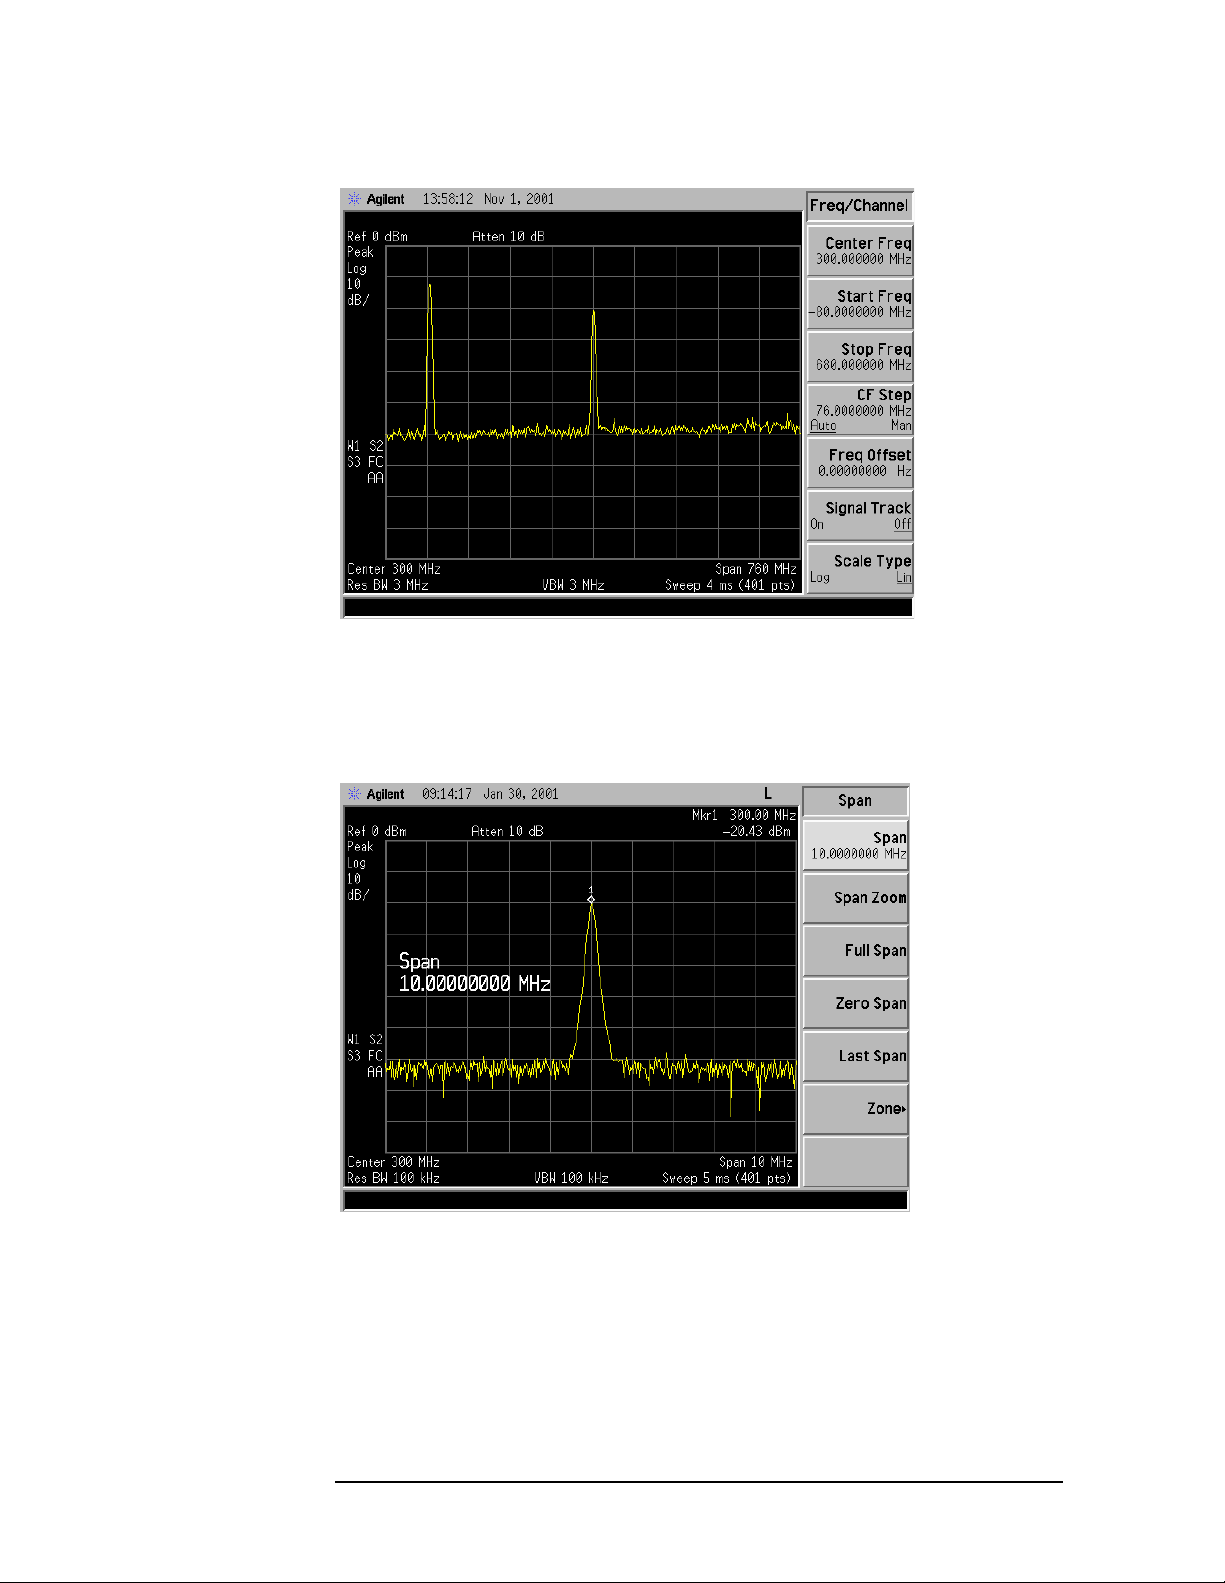
Decreasing the Frequency Span Around the Sig nal . . . . . . . . . . . . . . . . . . . . . . . . . . . . . . . . . . . . . . 24
Decreasing the Frequency Span Example: . . . . . . . . . . . . . . . . . . . . . . . . . . . . . . . . . . . . . . . . . . 24
Tracking Drifting Signals . . . . . . . . . . . . . . . . . . . . . . . . . . . . . . . . . . . . . . . . . . . . . . . . . . . . . . . . . . 27
Tracking Signal Drift Example 1: . . . . . . . . . . . . . . . . . . . . . . . . . . . . . . . . . . . . . . . . . . . . . . . . . 27
Tracking Signal Drift Example 2: . . . . . . . . . . . . . . . . . . . . . . . . . . . . . . . . . . . . . . . . . . . . . . . . . 30
Measuring Low Level Signals . . . . . . . . . . . . . . . . . . . . . . . . . . . . . . . . . . . . . . . . . . . . . . . . . . . . . . 34
Measuring Low Level Signals Example 1: . . . . . . . . . . . . . . . . . . . . . . . . . . . . . . . . . . . . . . . . . . 34
Measuring Low Level Signals Example 2: . . . . . . . . . . . . . . . . . . . . . . . . . . . . . . . . . . . . . . . . . . 36
Measuring Low Level Signals Example 3: . . . . . . . . . . . . . . . . . . . . . . . . . . . . . . . . . . . . . . . . . . 37
Measuring Low Level Signals Example 4: . . . . . . . . . . . . . . . . . . . . . . . . . . . . . . . . . . . . . . . . . . 39
Identifying Distort ion Products . . . . . . . . . . . . . . . . . . . . . . . . . . . . . . . . . . . . . . . . . . . . . . . . . . . . . 42
Distortion from the Analyzer . . . . . . . . . . . . . . . . . . . . . . . . . . . . . . . . . . . . . . . . . . . . . . . . . . . . . 42
Identifying Analyzer Generated Distortion Example: . . . . . . . . . . . . . . . . . . . . . . . . . . . . . . . . . . 42
Third-Order Intermodula tion Distortion . . . . . . . . . . . . . . . . . . . . . . . . . . . . . . . . . . . . . . . . . . . . 45
Identifying TOI Distortion Example: . . . . . . . . . . . . . . . . . . . . . . . . . . . . . . . . . . . . . . . . . . . . . . 45
Measuring Signal-to-Noise . . . . . . . . . . . . . . . . . . . . . . . . . . . . . . . . . . . . . . . . . . . . . . . . . . . . . . . . 49
Signal-to-Noise Measurement Example: . . . . . . . . . . . . . . . . . . . . . . . . . . . . . . . . . . . . . . . . . . . . 49
Making Noise Measurements . . . . . . . . . . . . . . . . . . . . . . . . . . . . . . . . . . . . . . . . . . . . . . . . . . . . . . . 51
Noise Measurement Example 1: . . . . . . . . . . . . . . . . . . . . . . . . . . . . . . . . . . . . . . . . . . . . . . . . . . 51
Noise Measurement Example 2: . . . . . . . . . . . . . . . . . . . . . . . . . . . . . . . . . . . . . . . . . . . . . . . . . . 56
Noise Measurement Example 3: . . . . . . . . . . . . . . . . . . . . . . . . . . . . . . . . . . . . . . . . . . . . . . . . . . 56
Demodulating AM Signals (Using the Analyzer As a Fixed Tuned Receiver) . . . . . . . . . . . . . . . . . 5 9
Demodulating an AM Signal Example 1: . . . . . . . . . . . . . . . . . . . . . . . . . . . . . . . . . . . . . . . . . . . 59
Demodulating FM Signals . . . . . . . . . . . . . . . . . . . . . . . . . . . . . . . . . . . . . . . . . . . . . . . . . . . . . . . . . 65
Demodulating a FM Signal Example: . . . . . . . . . . . . . . . . . . . . . . . . . . . . . . . . . . . . . . . . . . . . . . 65
2. Making Complex Measurements
What’s in This Chapter . . . . . . . . . . . . . . . . . . . . . . . . . . . . . . . . . . . . . . . . . . . . . . . . . . . . . . . . . . . 70
Required Test Equipment . . . . . . . . . . . . . . . . . . . . . . . . . . . . . . . . . . . . . . . . . . . . . . . . . . . . . . . 70
Making Stimulus Response Measurement s . . . . . . . . . . . . . . . . . . . . . . . . . . . . . . . . . . . . . . . . . . . . 71
What Are Stimulus Response Measurements? . . . . . . . . . . . . . . . . . . . . . . . . . . . . . . . . . . . . . . . 71
Using An Analyzer With A Tracking Generator . . . . . . . . . . . . . . . . . . . . . . . . . . . . . . . . . . . . . . 71
Stepping Through a Transmission Measure ment . . . . . . . . . . . . . . . . . . . . . . . . . . . . . . . . . . . . . 71
5

Contents
Tracking Generator Unleveled Condition . . . . . . . . . . . . . . . . . . . . . . . . . . . . . . . . . . . . . . . . . . . .76
Measuring Device Bandwidth . . . . . . . . . . . . . . . . . . . . . . . . . . . . . . . . . . . . . . . . . . . . . . . . . . . . .76
Measuring Stop Band Attenuation Using Log Sweep . . . . . . . . . . . . . . . . . . . . . . . . . . . . . . . . . .79
Making a Reflection Calibration Measurement . . . . . . . . . . . . . . . . . . . . . . . . . . . . . . . . . . . . . . . . .84
Example: . . . . . . . . . . . . . . . . . . . . . . . . . . . . . . . . . . . . . . . . . . . . . . . . . . . . . . . . . . . . . . . . . . . . .84
Reflection Calibration . . . . . . . . . . . . . . . . . . . . . . . . . . . . . . . . . . . . . . . . . . . . . . . . . . . . . . . . . . .85
Measuring the Return Loss . . . . . . . . . . . . . . . . . . . . . . . . . . . . . . . . . . . . . . . . . . . . . . . . . . . . . . . 86
Demodulating and Listening to an AM Signal . . . . . . . . . . . . . . . . . . . . . . . . . . . . . . . . . . . . . . . . . .88
Demodulating and Listening to a n AM Signal
Example 1: . . . . . . . . . . . . . . . . . . . . . . . . . . . . . . . . . . . . . . . . . . . . . . . . . . . . . . . . . . . . . . . . . . .88
Demodulating and Listening to a n AM Signal
Example 2: . . . . . . . . . . . . . . . . . . . . . . . . . . . . . . . . . . . . . . . . . . . . . . . . . . . . . . . . . . . . . . . . . . .89
6

1 Making Basic Measurements
7

Making Basic Measurements
What is in This Chapter
What is in This Chapter
This chap te r demonst rates bas ic analyzer measurements wi th
examples of typical measurements; each measurement focuses on
different functions. The measurement procedures covered in thi s
chapter are listed be lo w.
• “Comparing Signals” on page 10.
• “Resolving Sign a ls of Equal Amplitude” on p age 14.
• “Resolving Small Signals Hidden by Large Signals” on page 18.
• “Making Better Frequency Measurements” on p age 22.
• “Decreasing the Frequency Sp an Around the Signal” on page 24.
• “Tracking Drifting Signals” on page 27.
• “Meas u ring Low Le vel Signals” on page 34.
• “Identifying Distortion Products” on page 4 2 .
• “Measuring Signal-to-Noise” on page 49.
• “Making Noise Measurements” on page 51.
• “Demodulating AM Signals (Using the Analyzer As a Fixed Tuned
Receiver)” on page 59.
• “Demodulating FM Signals” on page 65.
To find descriptions of specific analyzer functions, refer to the Agilent
Technologies EMC Analyzers User’s Guide.
8 Chap ter 1

Making Basic Measurements
What is in This Chapter
Test Equipment
Test Equipment Specifications Recommended Model
Signal Sources
Signal Generator (2) 0.25MHz to 4.0GHz
Ext Ref Input
Adapters
E4433B or E443XB
series
Type-N (m) to BNC (f) (3) 1250-0780
Ter mination, 50 Ω
908A
Type-N (m)
Cables
(3) BNC, 122-cm (48-in) 10503A
Miscellaneous
Directional Br idge 86205A
Bandpass Filter Center Freq ue ncy:
200 MHz
Bandwidth: 10 MHz
Lowpass Filt er (2) Cutoff Frequency:
0955-0455
300 MHz
RF Antenna 08920-61060
Chapter 1 9

Making Basic Measurements
Comparing Signals
Comparing Signals
Using the analyzer, you can easily com pare frequency and amplitude
differences betw een signals, such as radio or television signal spectra.
The analyzer delta m arker function lets you compare tw o signals when
both appear on the sc reen at one time or when only one app ears on the
screen.
Signal Comparison Example 1:
Measure the differences between two signals on the same display
screen.
1. Perform a factory preset by pressing Preset, Factory Preset (if
present).
2. Connect the 10 MHz REF OUT from the rear panel to the
front- panel INPUT.
3. Set the center freq uency to 30 MHz by pressing FREQUENCY,
Center Freq, 30, MHz.
4. Set the span to 50 MHz by pressing SPAN, Span, 50, MHz.
5. Set the resolution band width to spectrum analyzer coupling by
pressing
6. Set the Y-Axis Units t o dB m by pres sing AMPLITUDE, More,
Y-Axis Units,
7. Set the reference level to 10 dBm by pressing AMPLITUDE, Ref Level,
10,
BW/Avg, Res BW (SA) .
dBm.
dBm.
The 10 MHz reference signal appears on the display.
8. Press Peak Search to place a marker at the highest peak on the
disp l ay. (The Next Pk Right and Next Pk Left softkey s are available to
move the marker from peak to peak.) The marker should be on the
10 MHz reference signal. See Figure 1-1.
10 Chap ter 1
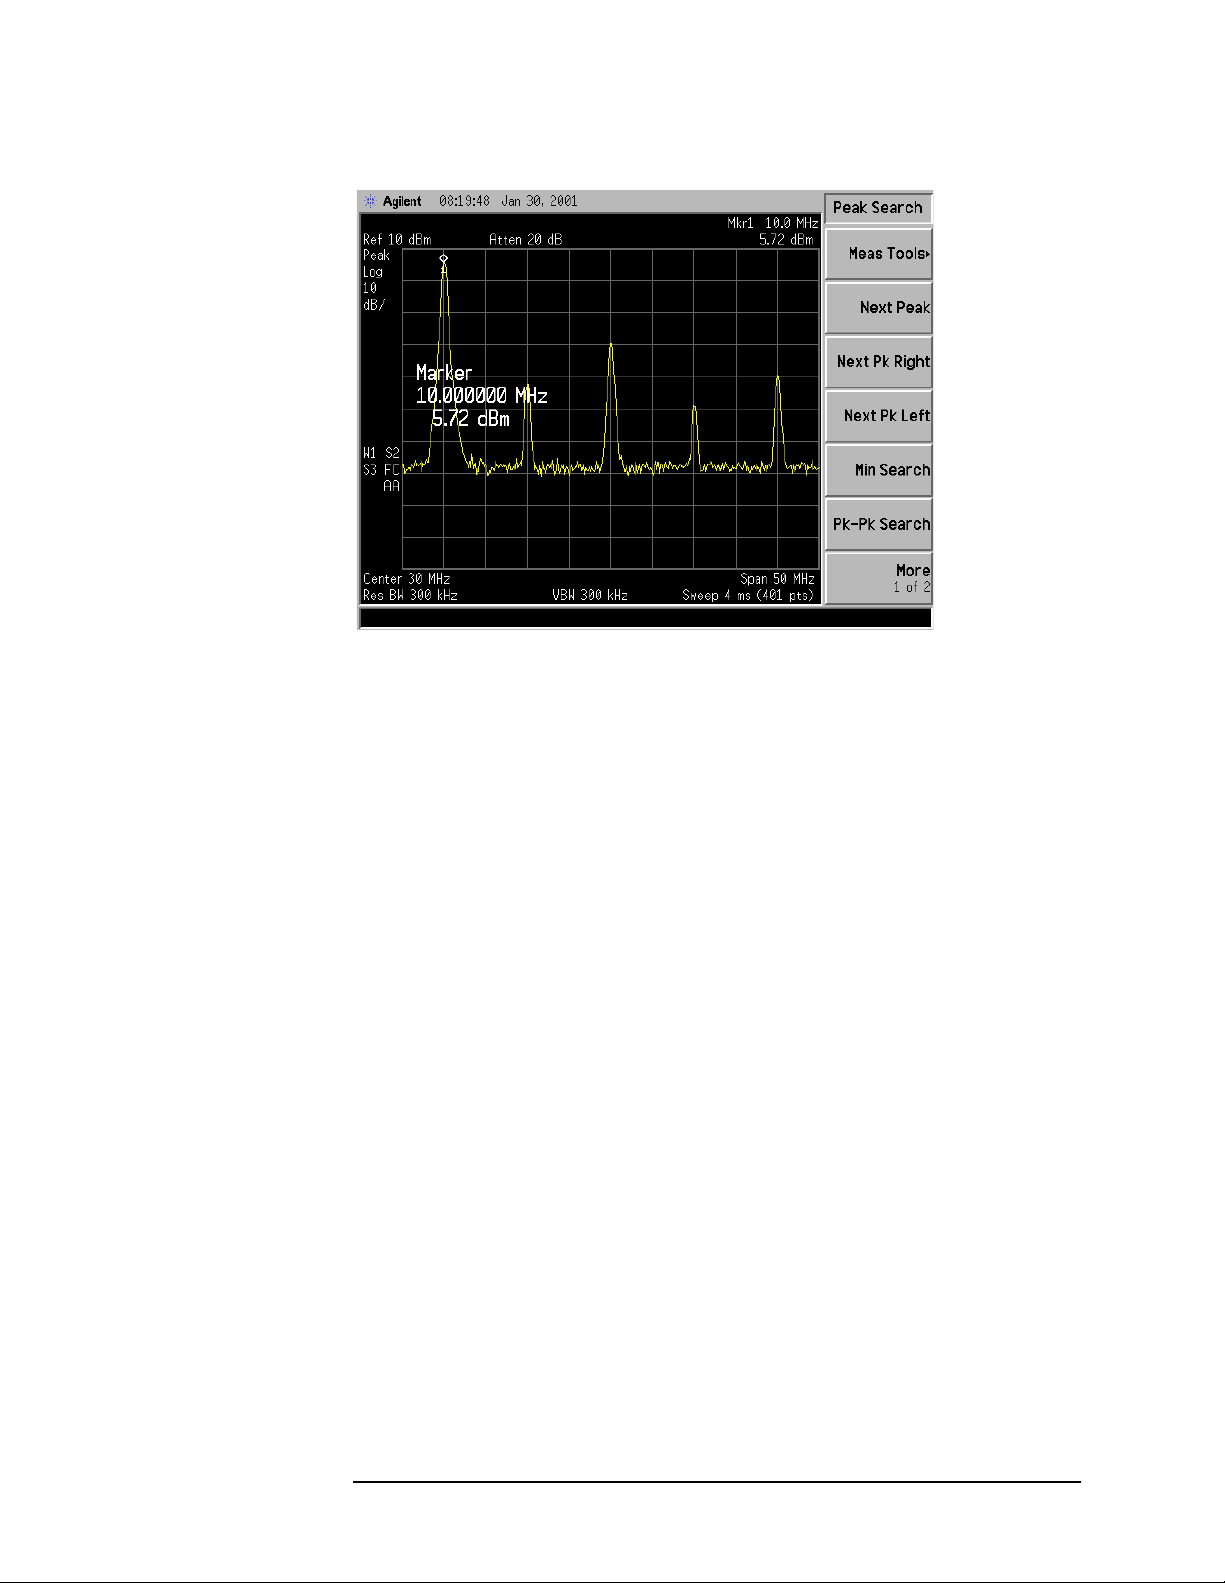
Figure 1-1 Placing a Marker on the 10 MHz Signal
Making Basic Measurements
Comparing Signals
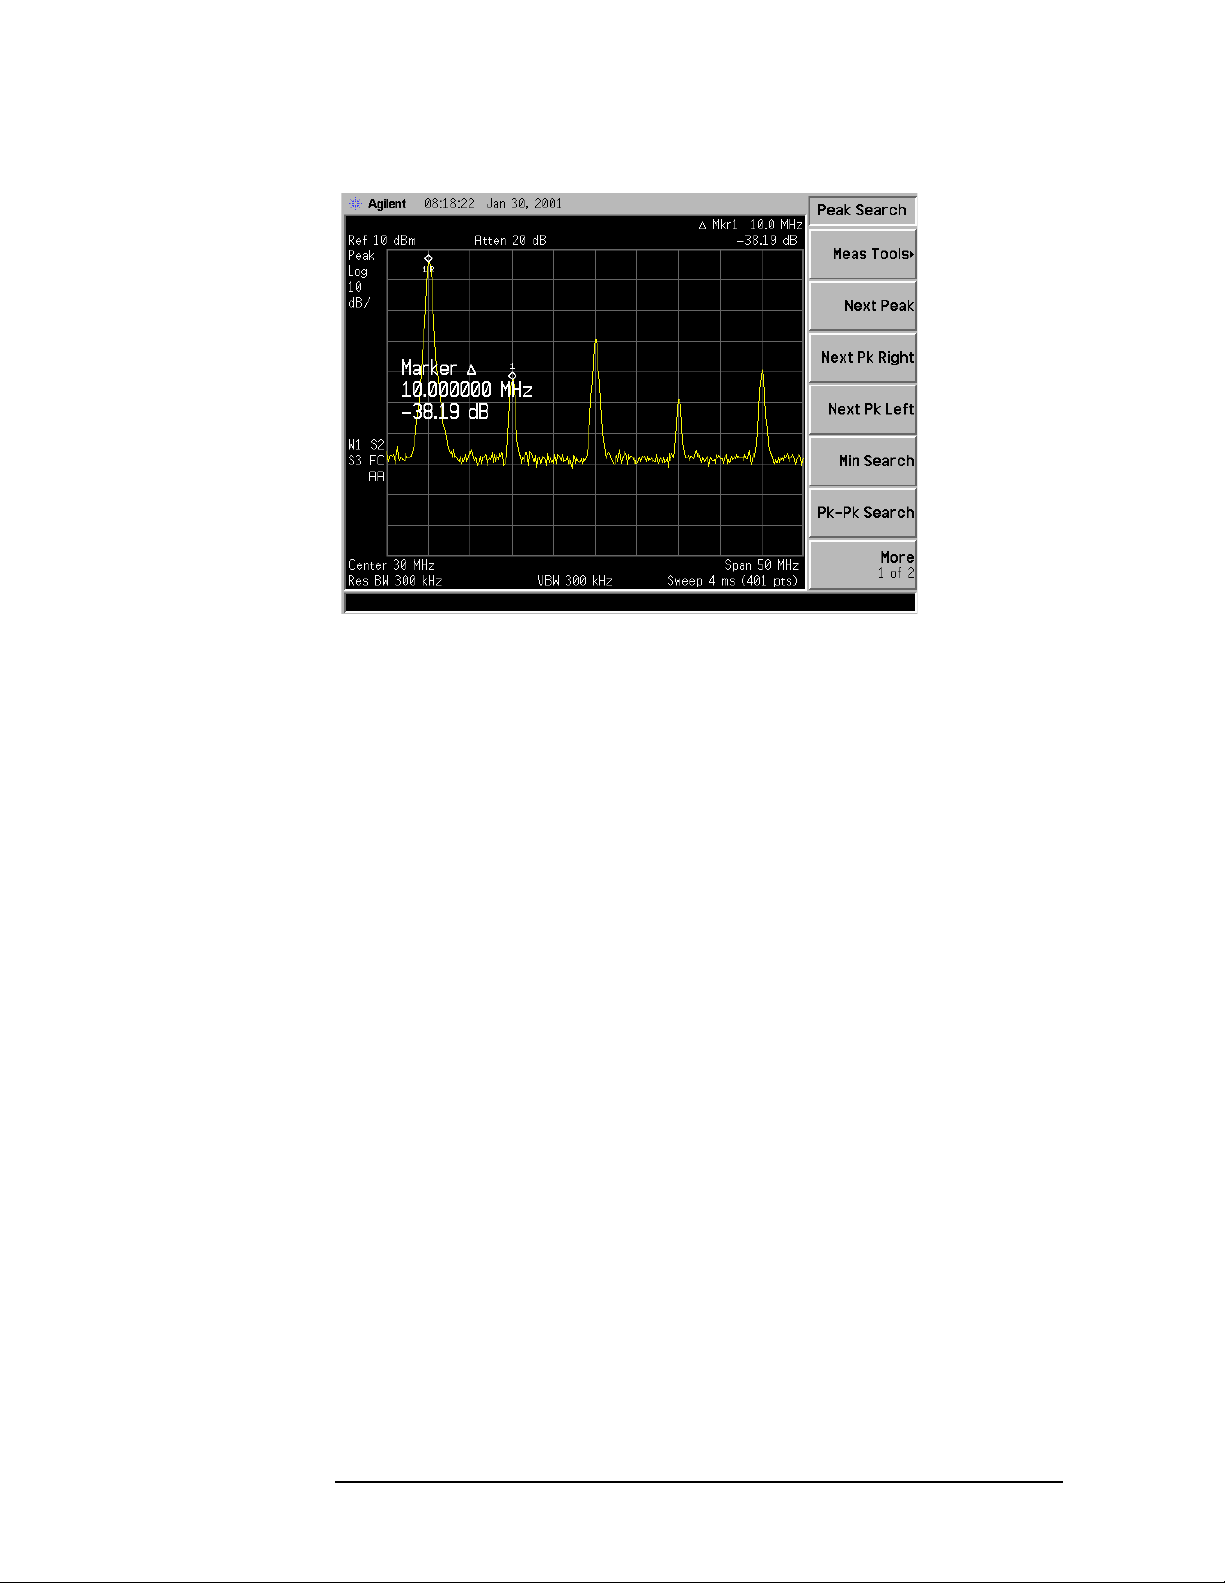
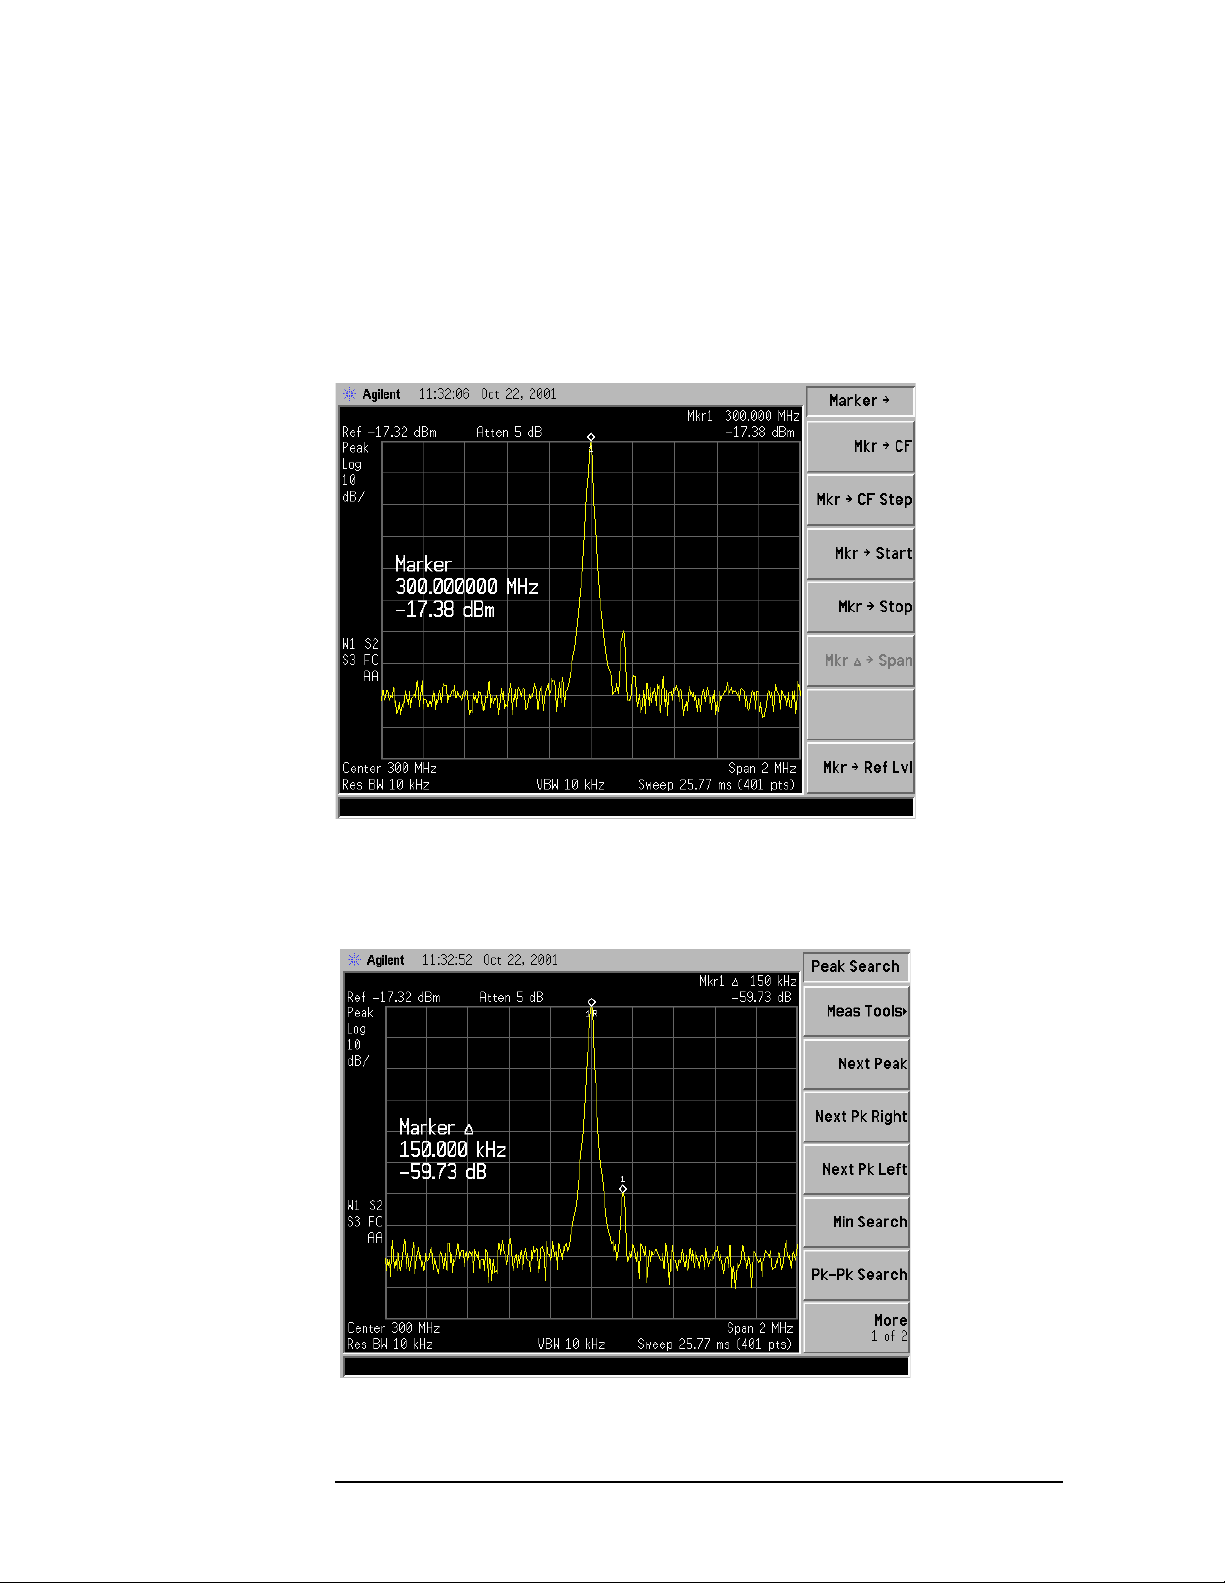
9. Press Marker, Delta, to activate a second marker at the position of the
first mark e r.
10.Move the second marker to another signal peak using the
front-panel knob, or by pressing
Next Pk Right or Next Pk Left. Next peak right is shown in Figure 1-2.
Peak Search and then either
The amplitude and frequency difference between the markers is
displayed in the ac tive function block and in the upp er right corner
of the screen. See Figure 1-2.
11. The resolution of the ma rker readings can be increased by turning
on the frequency count function. For more information refer to
“Making Better Frequency Measurements” on page 22.
12.Press Marker, Off to turn the markers off.
Chapter 1 11
Making Basic Measurements
Comparing Signals
Figure 1-2 Using the Marker Delta Function
Signal Comparison Example 2:
Measure the frequency a nd amplitude difference between two signa ls
that do not appear on the screen at one time. (This technique is useful
for harmonic distorti on tes ts when narrow span a nd narrow ba ndwi dth
are necessary to measure the lo w level ha rmonics.)
1. Perform a factory preset by pressing Preset, Factory Preset (if
present).
2. Connect the 10 MHz REF OUT from the rear panel to the
front- panel INPUT.
3. Set the center freq uency to 10 MHz by pressing FREQUENCY,
Center Freq, 10, MHz.
4. Set the span to 5 MHz by pressing SPAN, 5, MHz.
5. Set the resolution band width to spectrum analyzer coupling by
pressing BW/Avg, Res BW (SA).
6. Set the Y-Axis Units t o dB m by pres sing AMPLITUDE, More,
Y-Axis Units,
7. Set the reference level to 10 dBm by pressing AMPLITUDE, Ref Level,
10, dBm.
dBm.
The 10 MHz reference signal appears on the display.
8. Press Peak Search to place a marker on the peak.
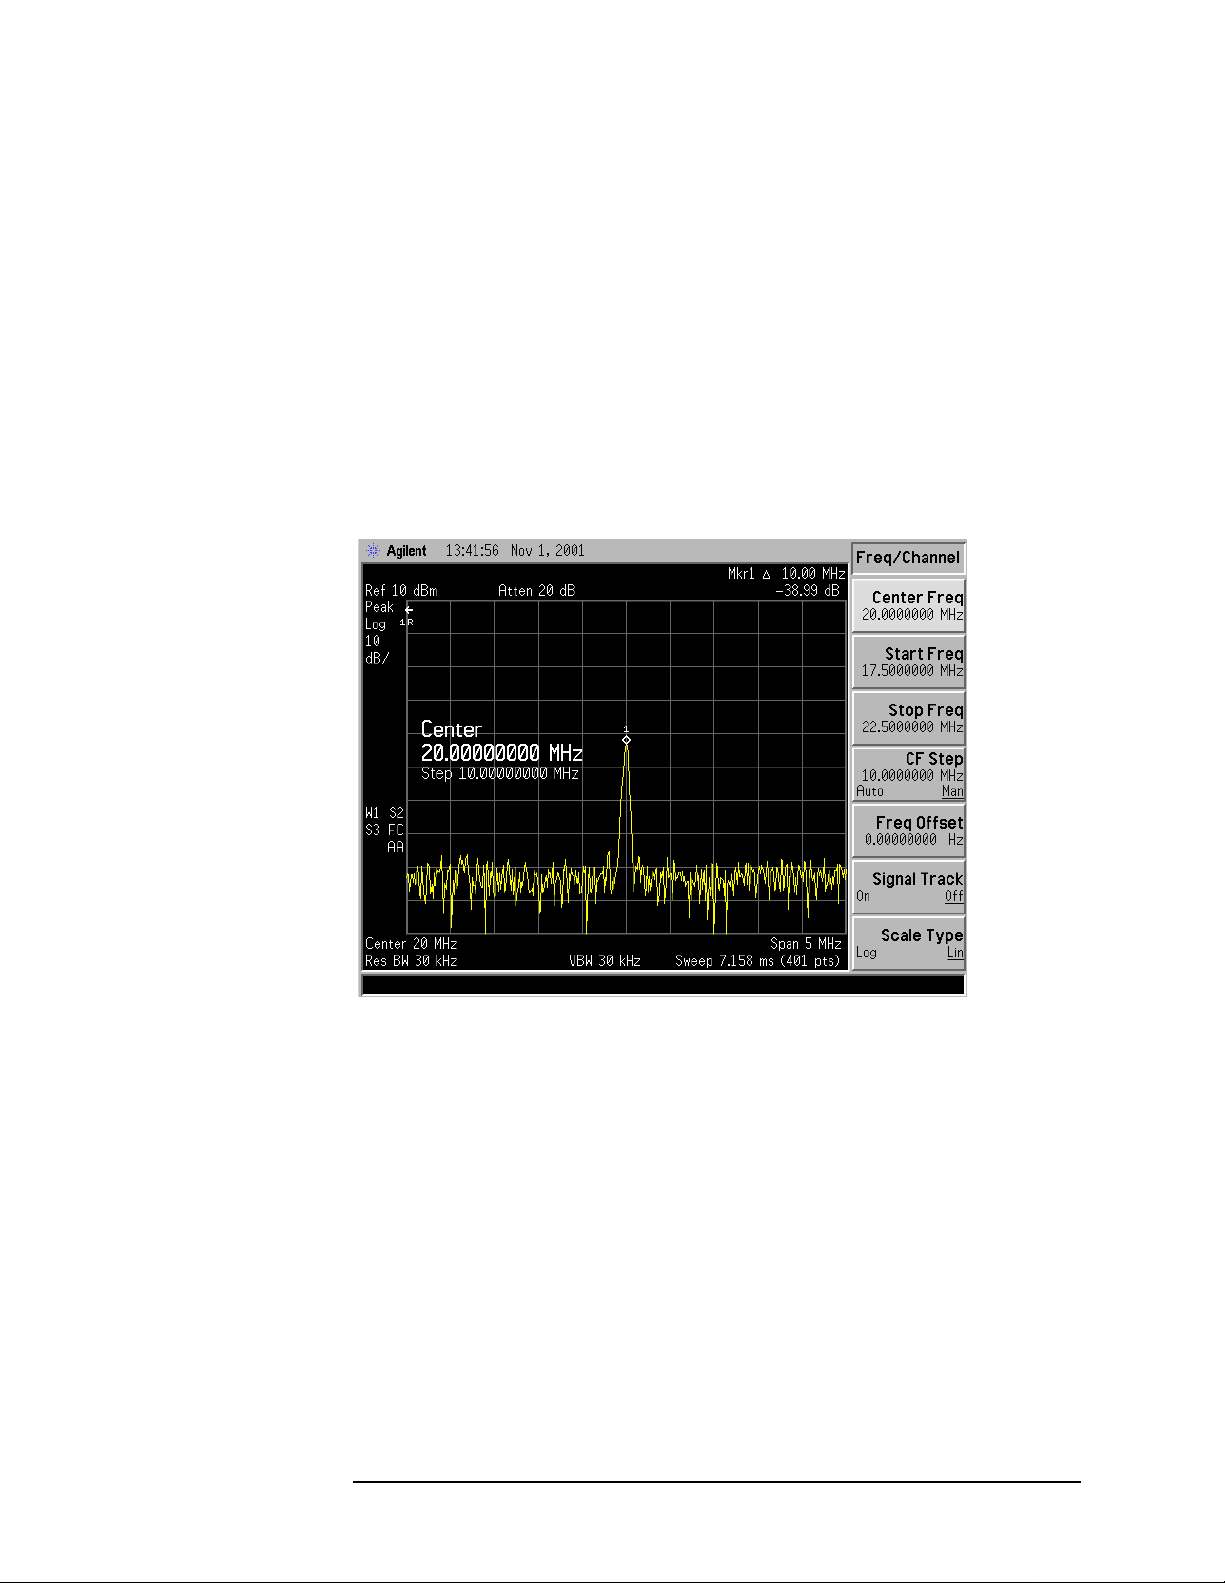
9. Press Marker→, Mkr→CF Step to set the center frequency step size
equal to the frequency of the fundamental signal.
12 Chap ter 1
Making Basic Measurements
Comparing Signals
10.Press Marker, Delta to anchor the position of the first marker and
activate a second marker.
11. Press FREQUENCY, Center Freq, and the (↑) key to increase the center
frequency by 10 MHz. The first marker moves to the left edge of the
screen, at the a mplitude of the first signal peak. See Figure 1-3.
12.Press Peak Search to place the second marker on the highest signal
with the new center frequency setting. See Figure 1-3.
The annotation in the upper right corner of the screen indicates the
amplitude and frequency difference between the two markers.
13.To turn the markers o ff, press Marker, Off.
Figure 1-3 Frequency and Amplitude Difference Between Signals
Chapter 1 13

Making Basic Measurements
Resolving Signals of Equal Amplitude
Resolving Signals of Equal Amplitude
Two equal-amplitude input signals that are close in frequency can
appear as a single signal trace on the analyzer display. Responding to a
single-frequency signal, a swept-tuned analyzer tra ces out the shape of
the selected internal IF (intermediate frequency) filter. As you change
the filter bandwidth, you change the width of the displayed response. If
a wide filter is used and two equal-amplitude input signa ls are close
enough in frequency, then the two signals will appear as one signal. If a
narrow enough filter is used, the two input sig nals can be disc riminated
and will appe ar as separate pe aks. Thus, signal re solution is
determined by the IF filters inside the analyzer.
The bandwidth of the IF filter tells us how close together equal
amplitude signals can be and still be distinguished from each other. The
resolution bandwid th function selects an IF filter setting for a
measurement. Typically, resolution bandwidth is defined as the 3 dB
bandwidth of the fi lter. However, resolution bandwidth may also be
defined as the 6 dB or impulse bandwidth of the filter.
Generally, to resol ve two signals of equal amplitude, the resolution
bandwidth must be less than or eq ual to the freq uency separat ion of the
two signals. If the bandwidth is equal to the separation and the video
bandwidth is less than the resolution bandwidth, a dip of
approximately 3 dB is seen between the peaks of the two equal signals,
and it is clear that more than one signal is present. See Figure 1-7.
In order to keep the analyzer measurement calibrated, sweep time is
automatically set to a val ue tha t is i nvers ely propor tion al to the squar e
of the resolut ion bandwidth (1/BW
2
for resolution bandwidths ≥ 1kHz).
So, if the resolution bandwidth is reduced by a factor of 10, the sweep
time is increased b y a factor of 100 when sweep time and bandwidth
settings are coupl ed. Sweep time is also a function of the type of
detection selected (peak detection is faster than sample or average
detection). For the shortest measurement times, use the widest
resolution bandwidth that stil l pe rm its discrimination of all desir e d
signals. Sweeptime is also a function of which Detector is in use, Peak
detector sweeps more quickly than Sample or Average detector. The
analyzer allows you to select from 10 Hz (or 1 Hz with Option 1D5) to
3 MHz resolution ban dwidths in a 1, 3, 10 se qu e n ce and sel e ct a 5 MHz
resolution bandwid th. In addition you can select the three CISPR
bandwidt h s (200 Hz, 9 kH z , an d 120 kHz) for max imum measu rement
flexibility.
14 Chap ter 1

Resolving Signals Example:
Resolve two signals of equal amplitude with a frequency separation of
100 kHz.
1. Connect two sources to the analyzer input as shown in Figure 1-4.
Figure 1-4 Setup for Obtaining Two Signals
Making Basic Measurements
Resolving Signals of Equal Amplitude
2. Set one source to 300 MHz. Set the frequency of the other source to
300.1 MHz. The amplitude o f bo t h signals sho u ld be approxim at e l y
−20 dBm at the output of the bridge.
3. Set the analyzer as follows:
a. Press Preset, Factory Preset (i f pre s e n t).
b. Set the Y-Axis Units t o dB m by pres sing AMPLITUDE, More,
Y-Axis Units,
c. Set the center freq uency to 300 MHz by pressing F REQUE NCY,
Center Freq, 300, MHz.
d. Set the span to 2 MHz by pressing SPAN, Span, 2, MHz.
e. Set the resolution bandwidth to 30 0 kHz by pressing BW/Avg,
Res BW, 300, kHz.
dBm.
A single signal peak is visible. See Figure 1-5
NOTE If the signal peak is not present on the display, do the following:
1. Increase the span to 20 MHz by pressing SPAN, Span, 20, MHz.
The signal sho u ld b e v isi bl e .
2. Press Peak Search, FREQUENCY, Signal Track (On)
3. Press SPAN, 2, MHz to bring the signa l to center screen.
4. Press FREQUENCY , Signal Track (O ff)
Chapter 1 15

Making Basic Measurements
Resolving Signals of Equal Amplitude
Figure 1-5 Unresolved Signals of Equal Amplitude
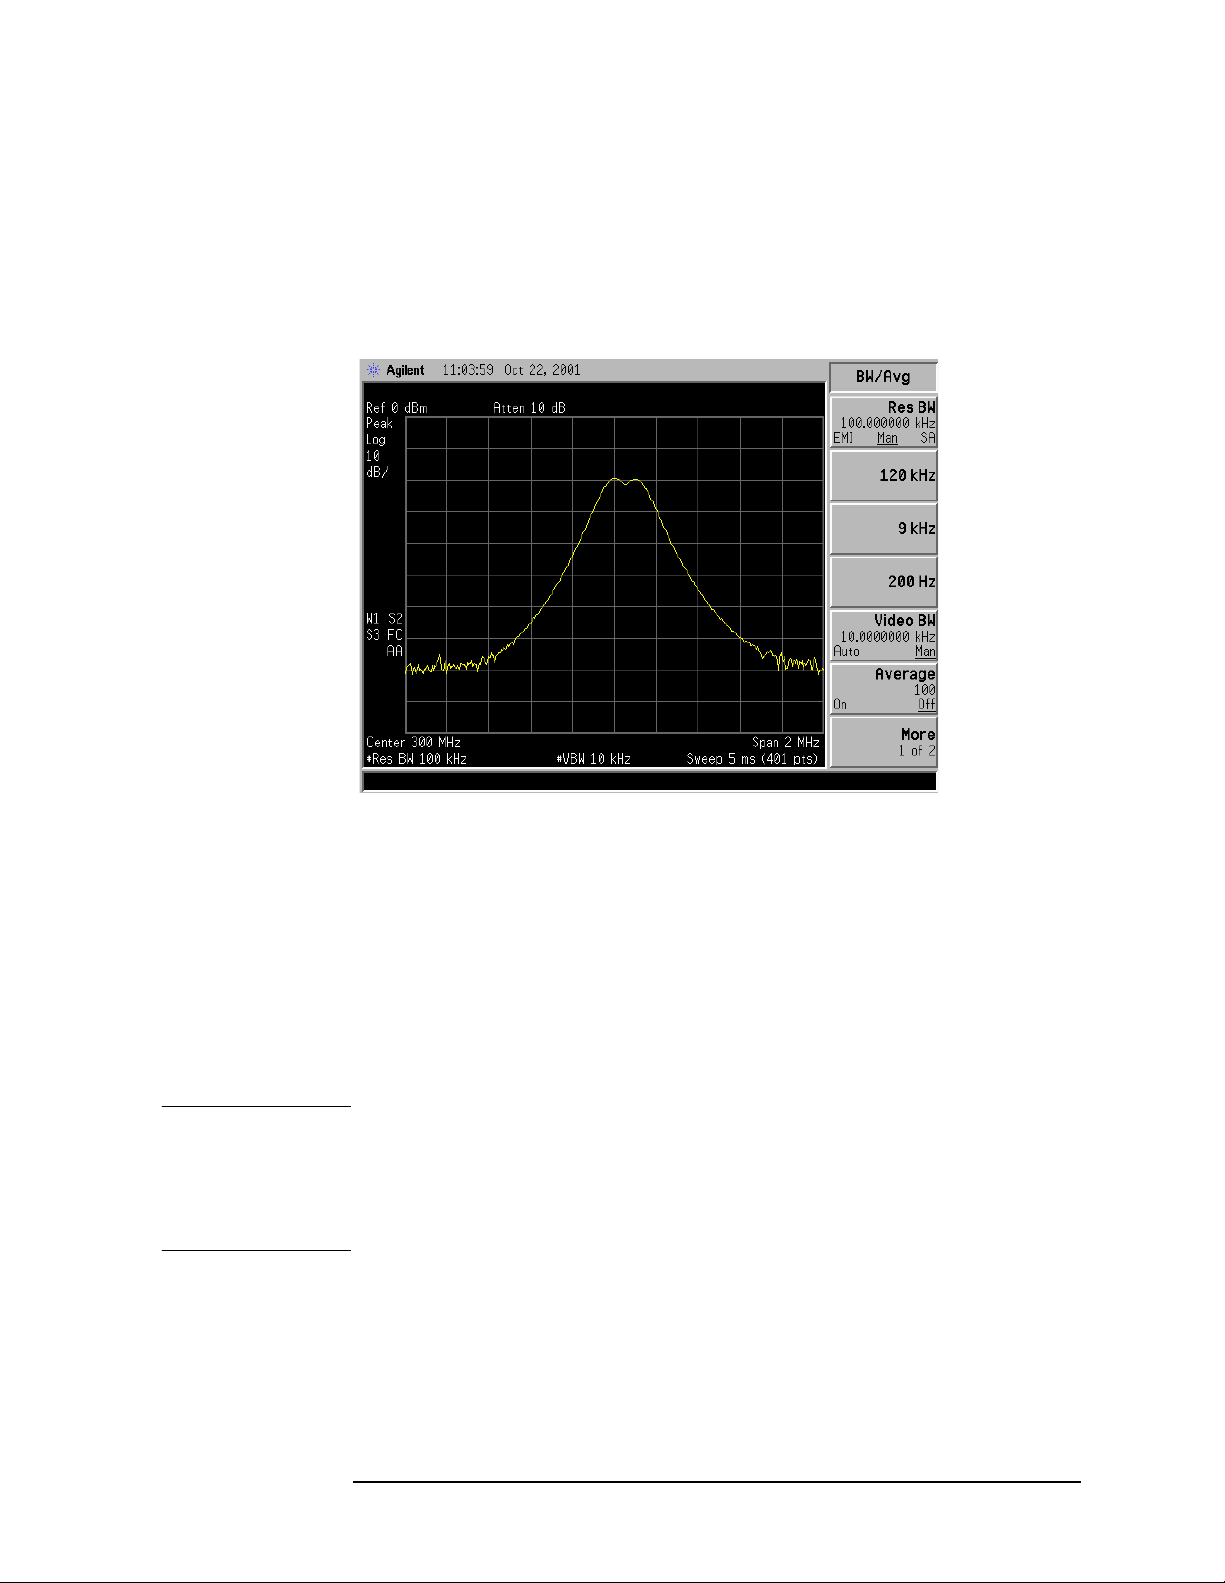
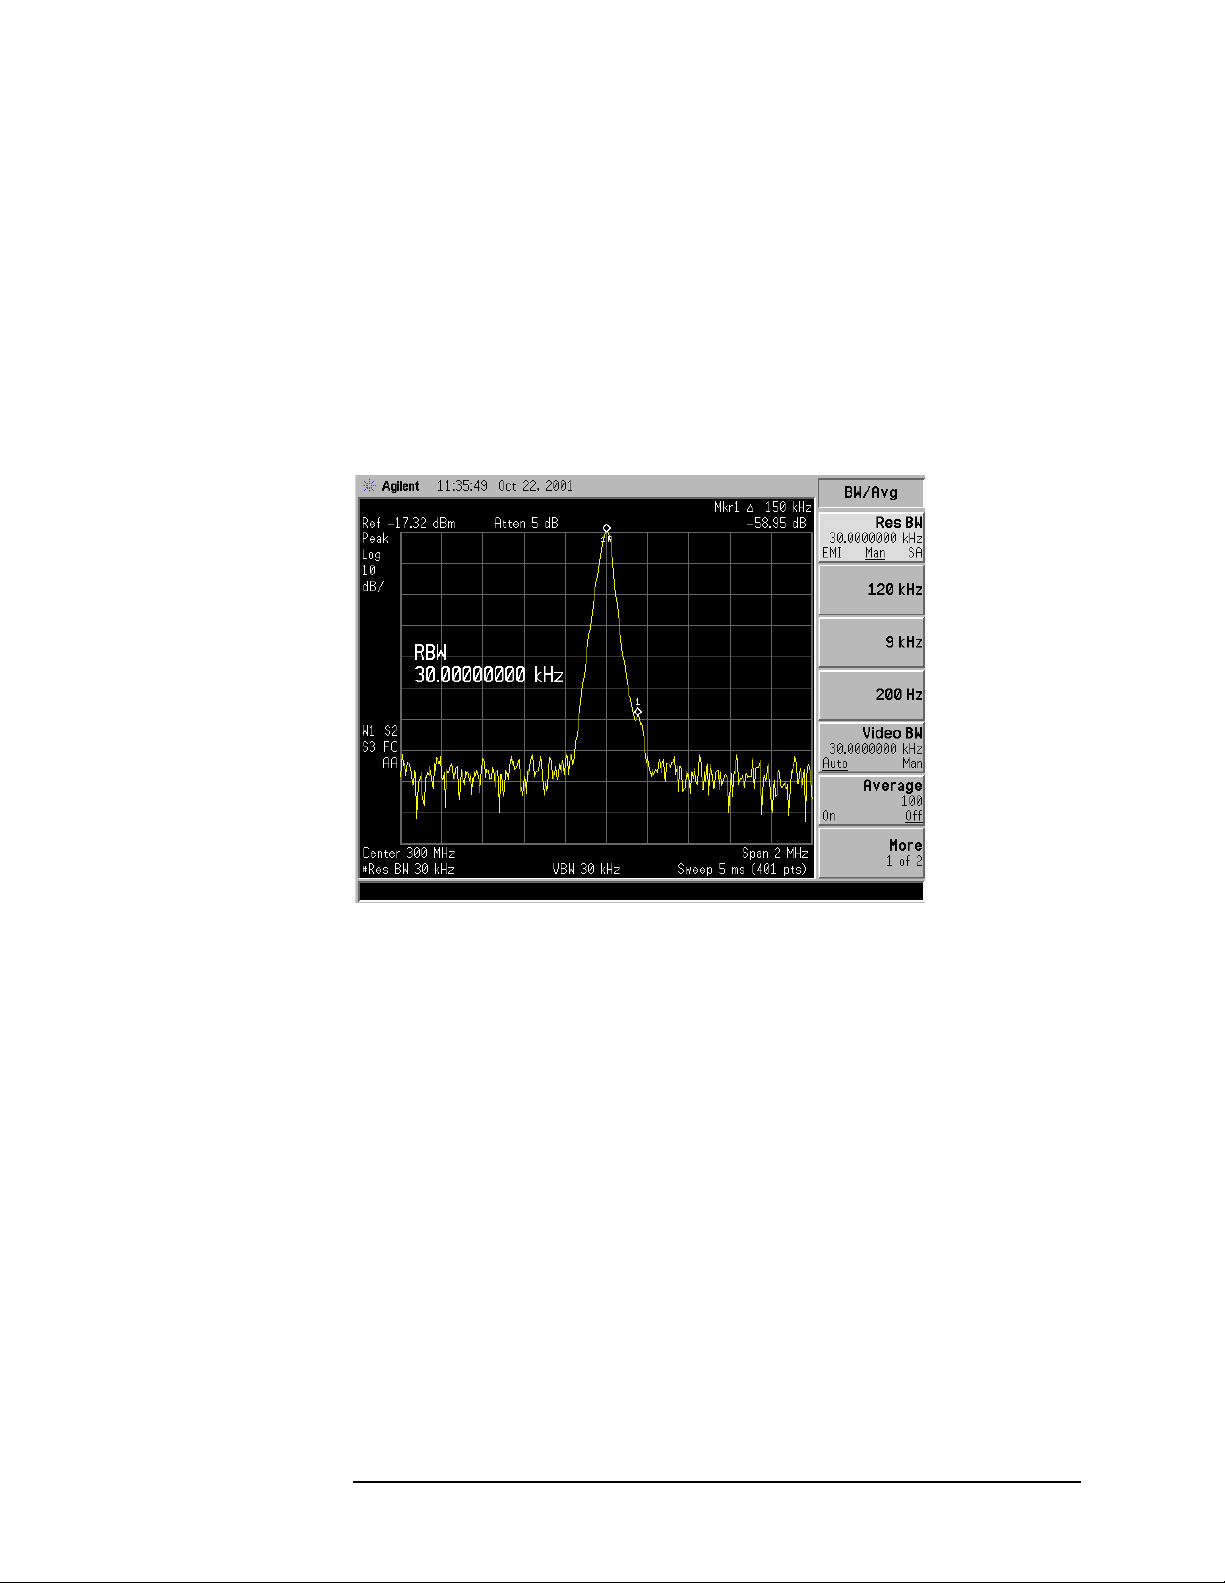
4. Since the resolution bandwidth must be less than or equal to the
frequency separation of the two signals, a resolution bandwi dth of
100 kHz must be used. Chan ge the resolution ban d width to 100 kHz
by pressing
BW/Avg, Res BW, 100, kHz. The peak of the si gnal has
become flattened indicating that two signals may be present as
shown in Figure 1-6. Use the knob or step keys to further reduce the
resolution bandwidth and b etter resolve the signals.
Figure 1-6 Resolving Signals of Equal Amplitude Before Reducing the
Video Bandwidth
16 Chap ter 1
Making Basic Measurements
Resolving Signals of Equal Amplitude
5. Decrease the video bandwidth to 10 kHz, by pressing Video BW, 10,
kHz. Two signals are now vis ibl e as sh o wn in Figure 1-7. Use the
front-panel knob or step keys to further reduce the resolution
bandwidth and better resolve the signals.
Figure 1-7 Resolving Signals of Equal Amplitude After Reducing the V ideo
Bandwidth
As the resolution bandw idth is decreased, resolution of the individual
signals is improved and the sweep time is increased. For fastest
measurement times, use the widest possible resolution bandwidth.
Under factory preset cond itions, the resolution bandwidth is “coupled”
(or linked) to the center frequency.
Since the resolution bandwidth has been changed from the coupled
value, a # mark appe ars next to Res BW in the lower-left corner of the
screen, indicating that the resolution bandwidth is uncoupled. (For
more information on coupling, refer to the Auto Couple key description
in the Agilent Technologies EMC Analyzers User’s Guide.)
NOTE T o resolve tw o signa ls of equal amplitud e with a frequency separat ion of
200 kHz, the resolution bandwidth m u st be less t han t h e signal
separation, and resolution of 100 kHz must be used. The next larger
filter, 300 kHz, would ex ceed the 200 kHz separation and would not
resolve the sign als.
Chapter 1 17

Making Basic Measurements
Resolving Small Signals Hi dden by Large Signals
Resolving Small Signals Hidde n by Lar ge
Signals
When dealing with the resolution of signals that are close together and
not equal in amplitud e, you must consider the shape of the IF filter of
the analy ze r, as well as its 3 dB bandwidth. (See “Resolving Signals of
Equal Amplitude” on page 14 for more information.) The shape of a
filter is defined by the selectivity, which is the ratio of the 60 dB
bandwidth to the 3 dB bandwidth. (Genera lly, the IF filters in this
analyzer have shape factors of 15:1 or less for resol ution bandwidths
≥1kHz and 5 :1 or less fo r reso lution band wi dt h s ≤ 300 Hz). If a small
signal is too close to a larger signal, the smaller signal can be hidden by
the skirt of the large r signal . To view the small er signal , you must s elect
a resolution bandwidth such that the separation between the two
signals (a) is greater than half the filter width of the larger signal (k)
measured at the amplitude level of the smaller signal. See Figure 1-8.
Figure 1-8 Resolution Bandwidth Requirements for Resolving Small
Signals
18 Chap ter 1

Resolving Small Sign als Hi dden by Large Signals
Resolving Signals Example:
Resolve two input signals w ith a frequency sep aration of 155 kHz and
an amplitude separation of 60 dB.
1. Connect two sources to the analyzer input as shown in Figure 1-9.
Figure 1-9 Setup for Obtaining Two Signals
Making Basic Measurements
2. Set one source to 300 MHz at −10 dBm.
3. Set the s e co n d so u rce t o 300.155 MHz, so that t h e s ig n al is 155 kHz
higher than the fi rst signal. Set the amplitude of the signal to
−70 dBm (60 dB below the first signal).
4. Set the analyzer as follows:
a. Press Preset, Factory Preset (i f pre s e n t).
b. Set the Y-Axis Units t o dB m by pres sing AMPLITUDE, More,
Y-Axis Units,
c. Set the center freq uency to 300 MHz by pressing F REQUE NCY,
Center Freq, 300, MHz.
d. Set the span to 2 MHz by pressing SPAN, Span, 2, MHz.
NOTE If the signal peak is not present on the display, do the following:
1. Increase the span to 20 MHz by pressing SPAN, Span, 20, MHz.
dBm.
The signal should now be visible.
2. Press Peak Search, FREQUENCY, Signal Track (On)
3. Press SPAN, 2, MHz to bring the signa l to center screen.
4. Press FREQUENCY , Signal Track (O ff)
e. Set the resolution bandwidth to spec trum analyzer coupling by
pressing BW/Avg, Resolution BW (SA).
Chapter 1 19
Making Basic Measurements
Resolving Small Signals Hi dden by Large Signals
5. Set the 300 MHz signal to the reference level by pressing Mkr → and
Mkr → Ref Lvl.
then
If a 10 kHz filter with a typical shape f actor of 1 5:1 i s us ed, the filter
will have a bandwidth o f 150 kHz at the 60 dB poin t . Th e
half-bandwidth (75 kHz) is narrower than the frequency separation,
so the input sig nals will be resolv ed . See Figure 1-10.
Figure 1-10 Signal Resolution with a 10 kHz Resolution Bandwidth
6. Place a marker on the smaller signal by pressing Marker, Delta,
Peak Search, Next Pk Right. Refer to Figure 1-11.
Figure 1-11 Signal Resolution with a 10 kHz Resolution Bandwidth
20 Chap ter 1
Making Basic Measurements
Resolving Small Sign als Hi dden by Large Signals
7. Set the resolution bandwidth to 30 kHz by pressing BW/Avg, Res BW,
30,
kHz.
When a 30 kHz filter is used, the 60 dB bandwidth could be as w ide
as 450 kHz. Since the half-bandwidth (225 kHz) is wider than the
frequency separation, the sig n als most likely wi ll no t be re solv e d.
See Figure 1-12. (In this example, we used the 60 dB bandwidth
value. To determine resolution capability for intermediate values of
amplitude level dif ferences, assume the filter ski rts between the
3 dB an d 60 dB po ints are ap proximately st raight.)
Figure 1-12 Signal Resolution with a 30 kHz Resolution Bandwidth
Chapter 1 21

Making Basic Measurements
Making Better Frequency Measurements
Making Better Fr equency Measurements
A built-in frequency co u n ter increas e s the re so lution and accuracy of
the frequency readout. W hen using this function, if the ratio of the
resolutio n ban dwidth to the span is too small (less than 0. 002), the
Marker Co unt: Wide n Res BW message appears on t h e displ ay. It
indicates that the resolution bandwidth is too narrow.
Better Frequency Measurement Example:
Increase the resolution and accuracy of the frequency read out on the
signal of intere st .
1. Perform a factory preset by pressing Preset, Factory Preset (if
present).
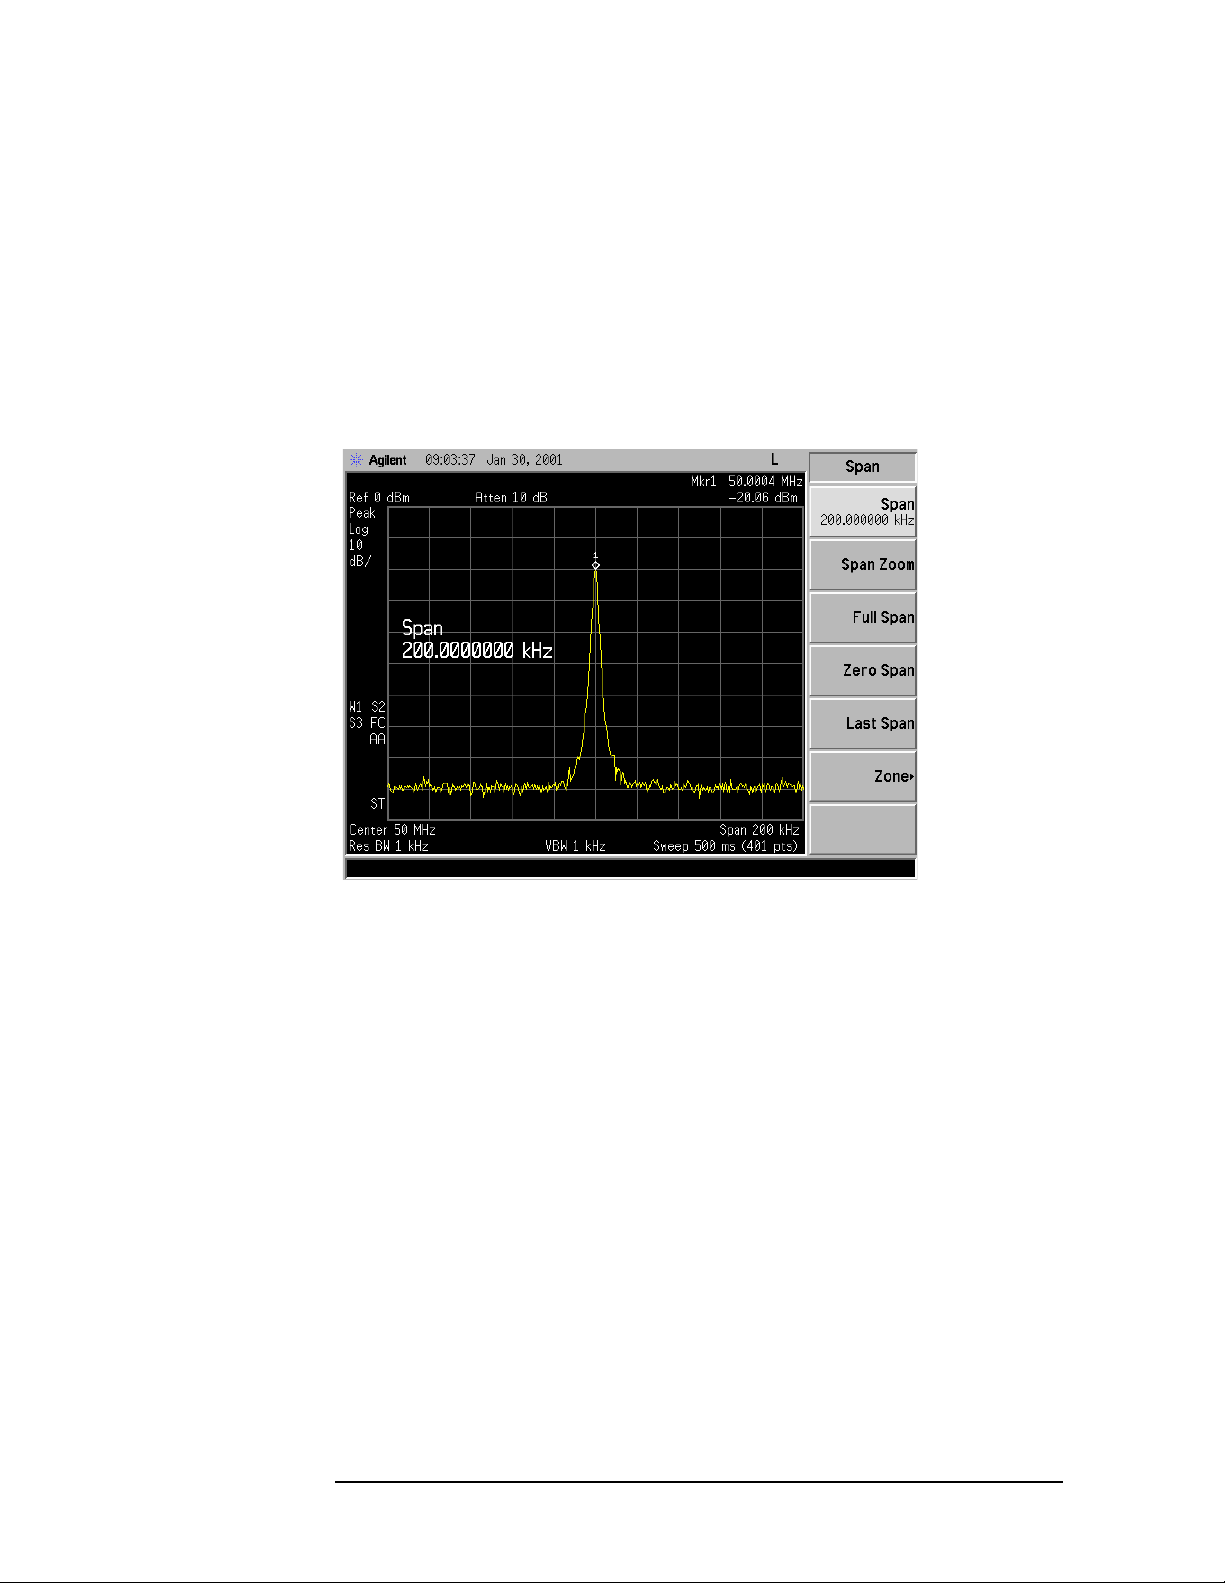
2. Turn on the internal 50 MHz amplitude reference signal of the
analyzer as follows:
• For the E7401A, use the inter nal 50 MHz amplitude reference
signal of the an alyzer as t h e signal bein g measur e d. P re ss
Input/Output, Amptd Ref (On).
• For all other models connect a cable between the front-panel
AMPTD REF OUT to the analyzer IN PUT, then press
Input/Output, Amptd Ref Out (On).
3. Set the center freq uency to 50 MHz by pressing FREQUENCY,
Center Freq, 50, MHz.
4. Set the span to 80 MHz by pressing SPAN, Span, 80, MHz.
5. Set the Y-Axis Units t o dB m by pres sing AMPLITUDE, More,
Y-Axis Units,
6. Set the resolution bandwidth to spectrum analyz er coupling pressing
BW/Avg, Resolution BW (SA).
7. Press Freq Count. (Note that Marker C oun t has On und erlined tur ning
dBm.
the frequency counter on.) The frequency and amplitude of the
marker and the word Marker will appear in th e active fun ct io n area
(this is not the counted result). The counted result appea rs in the
upper-right corner of the display.
8. Move the marker, with the front-panel knob, half-way down the ski rt
of the signal response. Notice that the readout in the ac tive
frequency function changes while the counted frequency result
(upper-right corner of display) does not. See Figure 1-13. To get an
accurate count, you do not need to place the marker at the exact
peak of the signal response.
22 Chap ter 1

Making Basic Measurements
Making Better Frequency Measurements
NOTE Marker count properly functions onl y on CW signals or discr ete spectr al
components. The marker mus t be >2 6 dB above the noise.
9. Increase the counter resolution by pressing Resolution and the n
entering the desired resolution using the step keys or the numbers
keypad. For example, press 10, Hz. The marker c ounter r ea dout is i n
the upper-right corner of the screen. The resolution can be set from
1Hz to 100kHz.
10.The marker counter remains on until turned off. Turn off the marker
counter by pressing
Freq Cou nt, then Marker Co unt (Off). Marker, Off
also turns the marker counter off.
Figure 1- 13 Using Marker Counter
Chapter 1 23

Making Basic Measurements
Decreasing the Frequency Span Around the Signal
Decreasing the Freq uency Span A round the
Signal
Using the analyzer signal track function, you can quickly decrease the
span while keeping the signal at center frequency. This is a fast way to
take a closer look at the area around the signal to identify signals that
would otherwise not be resolved.
Decreasing the Frequency Span Example:
Examin e a signal in a 200 kHz span.
1. Perform a factory preset by pressing Preset, Factory Preset (if
present).
2. Turn on the internal 50 MHz amplitude reference signal of the
analyzer as follows:
• For the E7401A, use the inter nal 50 MHz amplitude reference
signal of the an alyzer as t h e signal bein g measur e d. P re ss
Input/Output, Amptd Ref (On).
• For all other models connect a cable between the front-panel
AMPTD REF OUT to the analyzer IN PUT, then press
Input/Output, Amptd Ref Out (On).
3. Set the start fr equency to 20 MHz by pressing FREQUENCY,
Start Freq, 20, MHz.
4. Set the stop frequency to 1 GHz by pressing FREQUENCY, Stop Freq,
1, GHz.
5. Set the Y-Axis Units t o dB m by pres sing AMPLITUDE, More,
Y-Axis Units,
6. Set the resolution bandwidth to spectrum analyz er coupling pressing
BW/Avg, Resolution BW (SA).
7. Press Peak Search to place a marker at the peak. See Figure 1-14.
dBm.
24 Chap ter 1
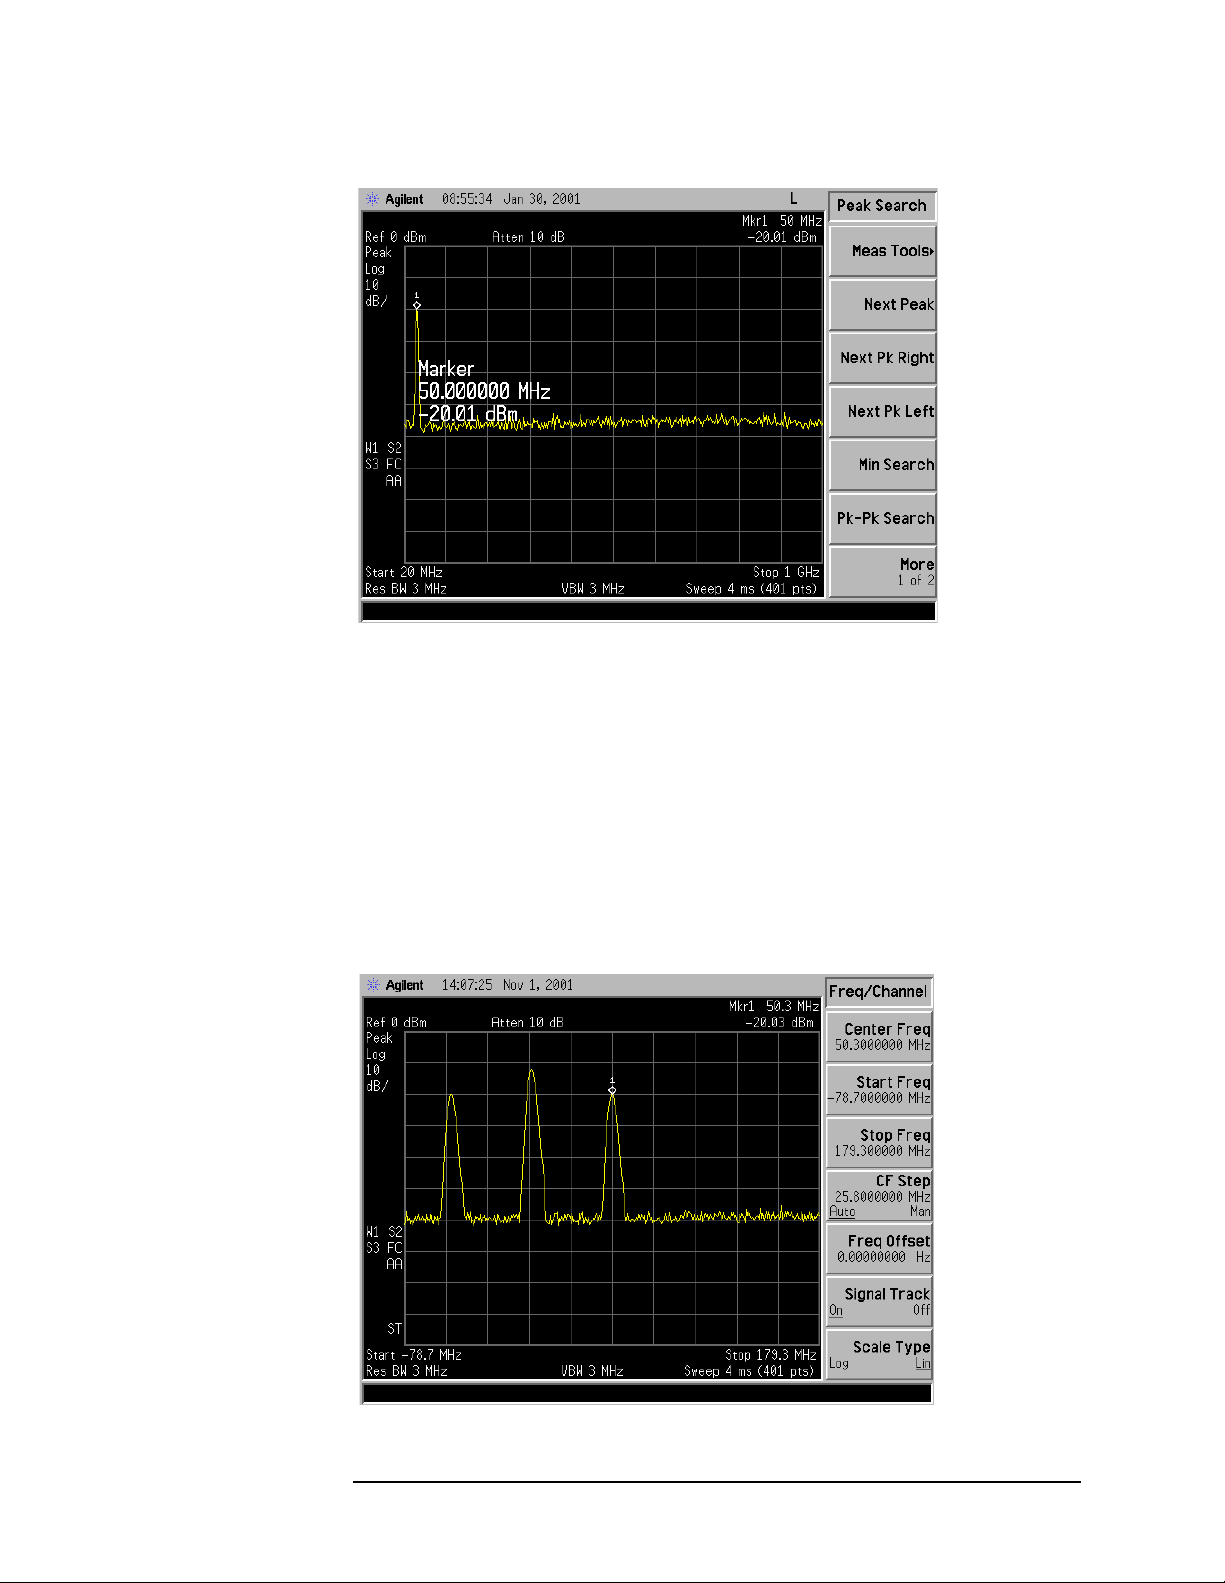
Figure 1-14 Detected Signal
Making Basic Measurements
Decreasing the Frequency Span Around the Signal
8. Turn on the frequency tracking function by press FREQ UENC Y an d
Signal Track and the signal w ill move to the center of the scr een, if it
is not already positioned there. See figure Figure 1-15. (Note that
the marker must be on the signal before turning signal track on.)
Because the signal track function automatically maintains the
signal at the center of the screen, you can reduce the span qui ckly for
a closer look. If the signal drifts off of the screen as you decrease the
span, use a wider f requency span. (You can also use
the
SPAN men u , as a qu i ck way to perfo rm the Peak Search,
FREQUENCY, Signal Track, SPAN key sequence.)
Figure 1-15 Signal with Signal Tracking On
Span Zoom, in
Chapter 1 25
Making Basic Measurements
Decreasing the Frequency Span Around the Signal
9. Reduce span and resolution bandwidth to zoom in on the marked
signal by pressing
SPAN, Span, 200, kHz.
If the span change is large enough, span will decrease in steps as
automatic zoom is completed. See Figure 1-16. You can also use the
front-panel knob or step keys to decrease the span and resolution
bandwidth values.
10.Press FREQUENCY , Signal Track (so that Off is underlined) to turn off
the signal track function.
Figure 1-16 After Zooming In on the Signal
26 Chap ter 1

Making Basic Measurements
T r acking Drifting Signals
T racking Drifting Signals
The signal track function is useful for tracking drifting sig nals that
drift relatively slowly. To place a marker on the signal you wish to
track, use
bring that signal to the center freq uency of the gratic ule a nd adjus t the
center frequency every sweep to bring the selected signal back to the
center. A quick way to perform the Peak Search, FREQUENCY,
Signal Track, SPAN key sequence is to use the Span Zoom key in the
SPAN menu.
Note that the primary functi on of the signal track function i s to track
unstable signals, not to track a signal as the center frequency of the
analyzer is changed. If you choose to use the signal track function when
changing center frequency, check to e nsure that the s i gnal f ound by the
tracking function is the correct signal.
T racking Signal Drift Example 1:
Peak Search. Pressing FREQUENCY, Signal Track (On) will
Use the signal track function to keep a drifting signal at the center of
the display and monitor its change.
This example requires a s ignal generator. The frequency of the signal
generator will be changed while you view the signal on the display of
the analyzer.
1. Conn e ct a signal gen e rat o r t o the an alyzer in put.
2. Set the signal generator frequency to 300 MHz with an amplitude of
−20 dBm.
3. Set the analyzer as follows:
a. Press Preset, Factory Preset (i f pre s e n t).
b. Set the Y-Axis Units t o dB m by pres sing AMPLITUDE, More,
Y-Axis Units,
c. Set the resolution bandwidth to the spectrum analyzer coupling
dBm.
by pressing BW/Avg, Resolution BW (SA). See Figure 1-17.
d. Set the center frequency to 300 MHz by pressing FREQUENCY,
Center Freq, 300, MHz.
Chapter 1 27
Making Basic Measurements
T r acking Drifting Signals
Figure 1-17 Signal With Default Span
4. Press Peak Search .
5. Set the span to 10 MHz by pressing SPAN, Span, 10, MHz.
See Figure 1-18.
Figure 1-18 Signal With 10 MHz Span
6. Press SPAN, Span Zoom, 500, kHz.
Notice that the sig nal has been held in the center of the display.
See Figure 1-19.
28 Chap ter 1
Loading...