


 Loading...
User’s Guide
Agilent Technologies 14761A
Harmonic and Flicker Emissions Tests
for
EN 61000-3-2, EN 61000-3-3,
and EN 60555 Part 2
Agilent Part No. 5962-0831
Microfiche Number 5962-0832
Printed in USA May, 2000

Notice
This document contains proprietary information protected by copyright. All rights are reserved. No part of this document may be photocopied, reproduced, or translated into another language without the prior consent of Agilent Technologies. The information contained in this document is subject to change without notice.
© Copyright 1995 -1998, 2000 Agilent Technologies, Inc.
Windows is a registered trademark of Microsoft Corporation.
Warranty
This Agilent Technologies software product is warranted against defects in materials and workmanship for a period of 90 days from date of delivery. During the warranty period, Agilent Technologies will, at its option either repair or replace parts which prove to be defective.
Agilent Technologies makes no express or implied warranty of any kind, including, but not limited to the implied warranties of merchantability or fitness for a particular purpose, with regard to the program material contained herein. Agilent Technologies shall not be liable for incidental or consequential damages in connection with or arising out of the furnishing, performance, or use of this software.
Use of the supplied manual and software is restricted to Agilent ac source products only. The software is copyrighted and may not be copied except for archival purposes, to replace a defective copy, or for program error verification. Agilent Technologies warrants that this software designed for use with a personal computer, will execute its programming instructions when properly installed on that personal computer. Agilent Technologies does not warrant that the operation of the personal computer , software, or ac source will be uninterrupted or error free.
Limitation of Warranty
The foregoing warranty shall not apply to defects resulting from: misuse, unauthorized modification, operation or storage outside the environmental specifications for the product, in-transit damage, improper maintenance, or defects resulting from use of non-Agilent software, accessories, media, or such items not designed for use with the product.
Revisions
Revision codes on the Agilent 14761A HFTS software indicate the current revision. Minor changes to the software such as bug fixes usually do not require a change to the manual. Therefore, the revision number of the software may be higher than the software revision number shown below, yet the information in the manual still applies.
Software changes that require a change to the manual will be accompanied either by a new edition of the manual or an update packet documenting the changes. In that case, the software revision number shown below will be updated to agree with the revision number of the software.
This manual applies to software revision... A.05.03
Printing History
The manual printing date indicates the current edition. The printing date changes with each new edition or update. Update packets or change sheets may be issued between editions to correct or add information. Minor corrections incorporated at reprint do not cause a new edition.
August, 1995......... |
First Edition |
October, 1995........ |
Update 1 |
February, 1997....... |
Second Edition |
June, 1997.............. |
Third Edition |
December, 1998...... |
Fourth Edition |
May, 2000............... |
Fifth Edition |
2

Table of Contents
Notice |
2 |
Warranty |
2 |
Limitation of Warranty |
2 |
Revisions |
2 |
Printing History |
2 |
Table of Contents |
3 |
1 INTRODUCTION |
7 |
How to Use this Manual |
7 |
The Agilent 6800-Series AC Power Source/Analyzer |
8 |
The Agilent 14761A Harmonic/Flicker Test System Software |
8 |
EN 61000-3-2 and EN 60555 Part 2 Regulations |
9 |
Compliance Testing Implementation |
9 |
EN 61000-3-3 Regulation |
10 |
Compliance Testing Implementation |
10 |
2 INSTALLATION |
11 |
Install the Software |
11 |
Connect the Equipment |
11 |
Installing Interface Card Drivers for Windows 3.1 or 3.11 Systems |
12 |
Installing Interface Card Drivers for Windows 95 Systems |
12 |
Installing Interface Card Drivers for Windows NT 4.0 Systems |
12 |
Verify the Configuration |
12 |
Default Settings |
14 |
Getting Around in the Application |
14 |
Drop-down Menu |
14 |
Menu Tabs |
16 |
3 SETTING UP THE TEST |
17 |
Select a Test Type |
17 |
Create a Template |
19 |
Select the Test Setup Options for Quasi-stationary or Fluctuating Harmonics |
20 |
Standard Test Options |
20 |
Advanced Test Options |
21 |
Test Termination Options |
23 |
Select the Test Options for Voltage Fluctuations |
24 |
Standard Test Options |
24 |
Advanced Test Options |
25 |
Test Termination Options |
26 |
4 RUNNING THE TEST |
27 |
To Run a Pre-test for Quasi-stationary or Fluctuating Harmonics |
27 |
Pre-Test Summary |
27 |
Pre-Test Power Statistics |
29 |
Pre-Test Source Harmonics |
30 |
To Run a Pre-test for Voltage Fluctuations |
31 |
Pre-Test Summary |
31 |
Pre-test Measurements |
32 |
To Run a Test |
33 |
Test Status Information |
35 |
Validation Mode |
36 |
3
5 VIEWING TEST DATA |
37 |
Navigator Toolbar |
37 |
Viewing Quasi-stationary and Fluctuating Harmonics |
38 |
Graph Display |
38 |
Table Display |
41 |
Time-Series Display |
42 |
Statistics Display |
45 |
Probability Display (for Quasi-stationary or Fluctuating harmonics) |
46 |
Viewing 2.5 Minute Window Failures |
47 |
Viewing Voltage Fluctuations |
49 |
Pst Display |
49 |
Probability Display (for Voltage Fluctuations and Flicker) |
50 |
Distribution Display |
52 |
RMS Display |
53 |
Flicker Display |
54 |
Editing the Graph Attributes |
56 |
Copying Graphs and Tables to the Clipboard |
57 |
Using the Print Screen keyboard key |
57 |
Using the Copy Commands |
57 |
Viewing Reports |
58 |
Causes for Non-compliant EN 61000-3-2 or EN 60555-2 Tests |
58 |
Causes for Non-compliant EN 61000-3-3 Tests |
58 |
Short Form Report |
59 |
Long Form Report |
60 |
Remarks Report |
63 |
6 SEARCHING FOR SPECIFIC TEST DATA |
65 |
Searching for Data While the Test is Running |
65 |
Searching for Data After the Test has Completed |
65 |
Using the Span Control |
66 |
Using the Zoom Control |
67 |
Obtaining Detailed Failure and Error Information |
68 |
7 PRINTING |
69 |
Printing Graphs and Tables |
69 |
Using the Print Pre-test command |
69 |
Using the Print Graph/Table command |
69 |
Printing Reports |
69 |
From the File menu |
69 |
From the Report window |
70 |
Printing Reports to a File |
70 |
A SPECIFICATIONS |
73 |
Supported or Referenced EN 61000-3-2 and EN 60555 Part 2 Standards |
73 |
Supported or Referenced EN 61000-3-3 Standards |
73 |
PC Requirements |
73 |
Supported GPIB Interfaces |
73 |
Supported Equipment |
73 |
Equipment Specifications (IEC Mode) |
74 |
B GLOSSARY |
77 |
4
C IEC MODE COMMAND SUMMARY |
81 |
Introduction |
81 |
Using the SENSe:CURRent:ACDC:RANGe command |
81 |
CALCulate:INTegral:TIME |
83 |
CALCulate:SMOothing |
83 |
CALCulate:LIMit:UPPer |
84 |
FORMat |
85 |
FORMat:BORDer |
86 |
MEASure:ARRay:CURRent:HARMonic? |
87 |
MEASure:ARRay:VOLTage:FLUCtuations:ALL? |
88 |
MEASure:ARRay:VOLTage:FLUCtuations:FLICker? |
90 |
MEASure:ARRay:VOLTage:FLUCtuations:PST? |
91 |
SENSe:CURRent:PREFerence |
92 |
SENSe:WINDow |
92 |
SYSTem:CONFigure |
93 |
D CLASS DETERMINATION |
95 |
Class A Device Selected |
96 |
Class B Device Selected |
97 |
Class C Device Selected |
98 |
Class D Device Selected |
99 |
EN 60555 Part 2 Regulation Selected |
100 |
INDEX |
101 |
5

1
Introduction
How to Use this Manual
This manual describes the operation of the Agilent 14761A Harmonic/Flicker Test System (HFTS) software when used in conjunction with the Agilent 6800-Series AC Power Source/Analyzers. Its primary function is as a reference manual. If you have a question about a specific screen or how to perform a certain task, simply turn to the appropriate section of the manual. The manual is organized according to the procedure that you would follow if you were to run a compliance test. This manual assumes that you are familiar with the EN 61000-3-2 and EN 61000-3-3 regulations and their requirements. It also assumes that you are familiar with operating a personal computer in a Microsoft Windows environment.
The manual is organized as follows:
Chapter 1 provides an overview of the regulations and how compliance testing to these regulations is implemented with the Agilent 14761A HFTS software.
Chapter 2 describes how to install the software and get it running. It describes some pitfalls to avoid so that operation of the software will be glitchless and error-free.
Chapter 3 describes what you need to do to before you can run a test. There is certain information that you need to provide about the Device Under Test as well as setting up the Agilent 6800-Series AC Power Source/Analyzer.
Chapter 4 explains what happens when the pre-test and the compliance test is run.
Chapter 5 describes how to view the test data both while the test is running and after the test completes.
Chapter 6 describes the software tools available to find and display specific test data.
Chapter 7 explains how to print graphs and test reports.
Appendix A lists the product specifications
Appendix B is a glossary of terms related to the EN 61000-3-2 and EN 61000-3-3 Regulations.
Appendix C is for programmers. It describes the SCPI programming commands that implement the harmonic/flicker tests.
Appendix D explains the class determination logic of the Agilent 14761A HFTS software, and how this logic is used to set test limits.
7
1 - Introduction
The Agilent 6800-Series AC Power Source/Analyzers
The Agilent 6800-Series AC Power Source/Analyzers are specifically designed for testing products compliant to the IEC low-frequency emissions regulations for quasi-stationary current harmonics, fluctuating current harmonics, and voltage fluctuations and flicker. The following models provide up to full power coverage of the single-phase regulatory requirements:
Model |
rms Voltage |
rms Current |
peak Current |
VA |
|
|
|
|
|
Agilent 6812B |
230 Vrms (compliance) |
3.3 Arms (compliance) |
40 A |
750 VA |
Agilent 6841A |
300 Vrms (maximum) |
6.5 Arms (maximum) |
|
|
|
|
|
|
|
Agilent 6813B |
230 Vrms (compliance) |
7.6 Arms (compliance) |
80 A |
1750 VA |
Agilent 6842A |
300 Vrms (maximum) |
13 Arms (maximum) |
|
|
Agilent 6843A |
230 Vrms (compliance) |
16 Arms (compliance) |
96 A (low range) |
4800 VA |
|
300 Vrms (maximum) |
32 Arms (maximum) |
48 A (high range) |
|
Each one-box test system contains the capabilities of a stand-alone ac source, power analyzer, flicker meter, and line impedance network. Unlike multiple-box ac source and measurement configurations, the power generation and measurement of the Agilent 6800-Series are controlled by a common internal timebase, and are truly synchronized. This allows precise measurement of harmonics.
In addition to compliance testing, you can also use the Agilent 6800-Series AC Power Source/Analyzers as standard ac sources. The units have a SYSTem:CONFigure command that that lets you switch between IEC mode and Normal mode (the default), where the units behave as standard ac sources. When you run the Agilent 14761A HFTS software, the units automatically switch from Normal to IEC mode.
The Agilent 14761A Harmonic/Flicker Test System Software
The Agilent 14761A Harmonic/Flicker Test System (HFTS) software application supports EN 61000-3- 2,
EN 61000-3-3, and EN 60555 Part 2 compliance testing requirements. The Agilent 14761A HFTS software provides an intuitive graphical user-interface from which you can:
Set up and run compliance-level tests. The setting up of many IEC details is facilitated through the use of embedded standards expertise.
Collect real-time test data from the Agilent 6800-Series AC Power Source/Analyzer.
Display and monitor ongoing test results.
Save test results.
Terminate tests based on user-defined criteria.
Analyze failures or marginal results using advanced test, display, and search options.
Evaluate the long-term test results compared to pass/fail criteria.
Print reports and graphs.‘
See Appendix A for a complete list of supported standards and regulations.
Note |
A selection in the Options/Default menu lets you compliance test to the older |
|
EN 60555 Part 2 (IEC 555-2) regulation. The EN 60555-3 (IEC 555-3) regulation is no |
|
longer a requirement and has officially been replaced by EN 61000-3-3. |
|
|
8

Introduction - 1
EN 61000-3-2 and EN 60555 Part 2 Regulations
EN 61000-3-2 and EN 60555 Part 2 regulate the magnitude of harmonic currents drawn by products from the ac line. For example, harmonic currents can occur as a result of high peak currents drawn by switch-mode power supplies. Power companies, particularly in Europe, have led a regulatory initiative to limit harmonic current generation at the product level because of a variety of undesirable effects on the mains environment such as: interference with other equipment, overheating of conductors and power factor correction networks, and power transmission losses. Personal computers, peripherals, and variable speed motor drives are examples of the types of products addressed by the regulations.
EN 61000-3-2 and EN 60555 Part 2 actually cover two categories of harmonic currents: quasi-stationary harmonics and fluctuating harmonics. Power supply manufacturers, for example, may be concerned primarily with the first category while product manufacturers may be concerned with both categories. Different measurement techniques are used for determining compliance for the two categories, with more stringent testing requirements applied to testing fluctuating harmonics. In particular, compliance testing for fluctuating harmonics requires non-stop harmonic analysis over extended periods of time. The EN 61000-3-2 regulation applies to class A, B, C, D, and motor-driven equipment.
The EN 60555 Part 2 regulation only applies to class A and class B equipment. This regulation is selected in the Options/Defaults menu. See appendix D for information about class determination.
Compliance Testing Implementation
The Agilent 14761A HFTS software compliance tests to EN 61000-3-2 / EN 60555 Part 2 as follows:
It initializes and programs the Agilent 6800-Series AC Power Source/Analyzer.
After the pre-test, the software displays one cycle of voltage and current, which represents the average of all half-cycle measurements made during the pre-test, with Class D envelope information superimposed over the waveshapes. Rms voltage, frequency, rms current, peak current, real power, apparent power, power factor, voltage distortion, current distortion, and percent in envelope are displayed as well. An additional display indicates if the harmonic-by- harmonic voltage distortion is either “IN SPEC” or ”OUT OF SPEC” as per the regulations for source distortion. This is based on the worst-case results obtained during the pre-test.
During the compliance test, the software produces a real-time bar graph that represents either the absolute magnitudes of 40 harmonics, or the magnitudes of 40 harmonics expressed as a percentage of the applicable limits. The graph display shows both the maximum measured value and the value of the present data record. The value of the present data record is continually updated while the test is running. A time-series graph is available to display test data for a specific harmonic.
The software also produces a table that displays either the absolute magnitudes of 40 harmonics, or the magnitudes of 40 harmonics expressed as a percentage of the applicable limits in real-time. The table shows both the peak data values and the present data values. Note that you can also display the data of any individual harmonic versus time, either as an absolute magnitude or as a percentage of the allowable limits.
When testing fluctuating harmonics, the software uses a 2.5 minute sliding window. Within this window harmonic peaks of up to 150% of the steady-state harmonic limits are allowed, provided that these samples do not total more than 10% of the total samples (or 15 seconds of time) within any 2.5 minute observation period. Samples that contribute to a 2.5 minute window failure must fall between 100% and up to 150% of the steady-state harmonic limits. Values greater than 150% of the limits are counted as individual failures.
9

1 - Introduction
EN 61000-3-3 Regulation
EN 61000-3-3 regulates the magnitude, rate, and time-duration of voltage fluctuations and flicker caused by products connected to the ac line. Voltage fluctuations are created by time-varying current drains working against branch circuit impedance that exists in all power distribution networks. Flicker occurs when an incandescent lamp changes in intensity due to the frequency and amplitude of voltage fluctuations in the same branch circuit.
Because flicker is annoying, and for certain individuals presents a health hazard, the regulation seeks to regulate flicker generation to an imperceptible level. A specialized instrument called a flickermeter, which is built into the Agilent 6800-Series AC Power Source/Analyzer, is used to measure flicker in terms of human perceptibility. A perceptibility level of 1 represents the threshold of perception for the average individual.
Note that the EN 60555-3 (IEC 555-3) regulation is no longer a requirement and has officially been replaced by EN 61000-3-3.
Compliance Testing Implementation
The Agilent 14761A HFTS software compliance tests to EN 61000-3-3 as follows:
It initializes and programs the Agilent 6800-Series AC Power Source/Analyzer.
After the pre-test, the software shows one cycle of voltage and current, which represents the average of all half-cycle measurements made during the pre-test, with Class D envelope information superimposed over the waveshapes. Note that the envelope waveshape is provided for information only, the regulation does not require Equipment Under Test (EUT) classification. Therefore, no Percent in Envelope information or Volt THD IN SPEC/OUT of SPEC information is provided. However, information about rms voltage, frequency, rms current, peak current, real power, apparent power, power factor, voltage distortion, and current distortion is provided.
When the compliance test is run, the software generates a bar graph which displays the shortterm flicker (Pst) compared to the predetermined test limits at the end of each integration period. The graph shows the maximum measured value and the present value .
During the compliance test, the software produces a bar graph that displays the selected time range of rms voltage values. This graph effectively shows the time-series of rms voltage variations produced by the varying load currents flowing through the reference impedance.
Probability and distribution graphs reflect a statistical view of the raw data used to generate the Pst graph at the end of each integration period. Note that long term flicker (Plt) data is generated during post processing after the test has completed . This information is included in the long form report.
Summary values for maximum rms voltage deviation (Dmax), steady-state voltage change (Dc), and the time interval during which the voltage deviation exceeds the prescribed limit (Dt), are displayed at the bottom of each display. These are the maximum values for each parameter within the presently displayed integration period.
The software also displays the time-series for instantaneous flicker, which can be useful for diagnosing faults in the equipment under test.
10
2
Installation
Install the Software
NOTE: A README.TXT file is included on the installation disks. It contains product updates or corrections that are not documented in this manual. Use any text editor to read this file.
The Agilent 14761A HFTS software (p/n 5063-2363) comes on two disks. When installed, it requires 5 Mbytes of hard disk space, 8 Mbytes of RAM, and 512 Kbytes of conventional memory. It also requires the correct interface card drivers to be installed on your PC. See “Installing Interface Card Drivers”.
1.Place Disk #1 in the A drive of your computer.
2.In the Windows Program Manager, run A:\SETUP
3.Follow the directions on your screen. During the installation procedure, you will be asked to specify an installation directory on your hard disk (the default is C:\HFTS5).
4.You will also be asked to select default voltage and frequency settings for the equipment that you will be testing (choose either 120 Vac/ 60 Hz or 230 Vac/ 50 Hz). This option may help in avoiding the accidental applications of damaging voltages to the equipment under test. This option may changed at any time in the Standard Test Options window.
NOTE: Before you run the Agilent 14761A HFTS software, make sure that:
No LAN software is running
No screen savers are running. Press Ctrl Esc to check the Windows Task List. Also check the Control Panel Desktop application.
If you have Power Management Software running on your PC, make sure that any power management modes such as Sleep or Standby are turned off while the tests are running.
Connect the Equipment
To use the Agilent 14761A HFTS software, install or connect the following equipment to your computer.
1.Make sure that an Agilent GPIB or a National GP-IB interface card with the appropriate drivers has been installed in your computer. See “Installing Interface Card Drivers”.
2 Install the Agilent 6800-Series AC Power Source/Analyzer and connect it to the computer.
3.Set up the AC Power Source/Analyzer for remote sensing at the input terminals of the equipment under test. Failure to do this will result in inaccurate output voltage programming.
4.Turn on your computer and Agilent 6800-Series AC Power Source/Analyzer. Setup is complete. However, in order for this software to operate, you must install a driver for your GPIB card.
11

2 - Installation
Installing Interface Card Drivers for Windows 3.1 or 3.11 Systems
If you are using an Agilent 82335 GPIB card, install the driver software from the I/O Libraries CD-ROM (E2094) that came with the card. Open the \win31\disk1 directory on the CD-ROM and run setup.exe. If you do not have this CD-ROM, you may purchase it through a local Agilent Sales and Support office.
If you are using an Agilent 82340, 82341, or 82350 GPIB card, the CD-ROM that came with the card (Agilent E2094F) may contain driver software only for Windows 95 and Windows NT. In that case you should obtain the latest version of this CD-ROM (Rev F.01.02 or later), which also contains drivers for Windows 3.1. Open the \win31\disk1 directory on the CD-ROM and run setup.exe.
If you are using a National Instruments GPIB card, install the associated Windows 3.x driver. You may have received a disk containing this driver when you purchased the card. Also, at the time this guide was written, the newest drivers were available from www.ni.com. Install the latest version of NI-488.2.
Installing Interface Card Drivers for Windows 95 Systems
If you are using an Agilent 82335, 82340, 82341, or 82350 GPIB card, install the driver software from the I/O Libraries CD-ROM that came with the card. If this CD-ROM is an E2094F or later, run setup.exe in the CD-ROM’s root directory. If the CD-ROM is an E2094E, open the \win95nt\disk1 directory on the CD-ROM and run setup.exe. If you do not have this CD-ROM, you may purchase it through a local Agilent Sales and Support office.
If you are using a National Instruments GPIB card, install the associated Windows 95/98 driver. You may have received a disk containing this driver when you purchased the card. Also, at the time this guide was written, the newest driver was available from www.ni.com. Install the latest version of NI-VISA or NI-488.2.
Installing Interface Card Drivers for Windows NT 4.0 Systems
If you have an Agilent 82335 GPIB card, this card will NOT operate under Windows NT. You should purchase an Agilent 82340, 82341, or 82350 GPIB card through a local Agilent Sales and Support office.
If you are using an Agilent 82340, 82341, or 82350 GPIB card, install the software from the I/O Libraries CD-ROM that came with the card. If this CD-ROM is an Agilent E2094F or later, run setup.exe in the CD-ROM’s root directory. If this CD-ROM is an E2094E, open the \win95nt\disk1 directory on the CD-ROM and run setup.exe. If you do not have this CD-ROM, you may purchase it through a local Agilent Sales and Support office.
If you are using a National Instruments GPIB card, install the associated Windows NT driver. You may have received a disk containing this driver when you purchased the card. Also, at the time this guide was written, the newest driver was available from www.ni.com. Install the latest version of NI-VISA or NI-488.2.
Verify the Configuration
Once your equipment and software are installed, click on the Start button and select Programs | Regulatory Test Solution | Harmonic and Flicker Emissions. (For Windows 3.1, click on the HFTS
12
Installation - 2
icon to run the software.) When the software is run, it automatically searches for an interface card and queries the Agilent 6800-Series AC Power Source/Analyzer for its model number. Verify that your configuration is correct as follows:
1.Select the New button in the Welcome Window
2.In the Options menu, select the Configure... command. This displays a Configuration dialog box on the screen. The Configuration Dialog box contains the following fields:
The Interface Name identifies the interface session when using an SICL interface. The application determines the default interface name by checking which interface driver is installed in your system. If “HP” is the interface type, the Interface Name list box displays all of the SICL names presently configured in the Windows 95 system. (SICL interface names are assigned to the ac source in the interface card’s configuration utility.) For Windows NT systems, the list box displays hpib7 as the default interface name. If “National” is the interface type, the Interface Name box displays the following pre-defined GPIB names: GPIB0, GPIB1, GPIB2,or GPIB3.
The I/O Address displays the address of the Agilent 6800-Series AC Power Source/Analyzer. The instrument address can be read or set using the front panel Address key.
The Interface Type is either HP, National, or File only.
The HFTS Model # is the instrument model that you are controlling.
The HFTS Serial # is where you enter the serial number of instrument that you are controlling.(this is optional)
Enter the date the instrument was last calibrated (this is optional)
Enter the calibration approvel name (this is optional)
Pressing the Discover button causes the software to search for an interface card and query the Agilent 6800-Series AC Power Source/Analyzer for its model number. Any equipment that is located is then displayed in the appropriate fields in the configuration dialog box.
Pressing Write as Defaults updates the HFTS.INI file with the information that has been entered in this dialog box either by the user or by the Discover feature. These default values are used during subsequent start-ups of the Agilent 14761A HFTS software to confirm system configuration.
Press OK to accept the changes, or Cancel to cancel the changes and exit the dialog box.
13

2 - Installation
Default Settings
In the Options menu, select Defaults to view the default settings. The following settings are configurable:
The line voltage and frequency that will be applied to the equipment under test.
The quasi-stationary/fluctuating harmonics regulations version that you will be testing to. Select either EN 61000-3-2 or the older EN 60555 Part 2 regulation.
Press OK to accept the defaults, or Cancel to cancel the changes and exit the dialog box.
Getting Around in the Application
There are two ways to access the various functions of this application:
1.From the drop-down menus at the top of the screen, or
2.From the menu tabs at the bottom of the screen.
The menu tabs at the bottom of the screen are the same as the View menu commands.
Drop-down Menu
The following commands are located in the drop-down menus at the top of the screen.
File |
|
New... |
Lets you select a new test |
New From Template... |
Lets you select a new test but applies an existing set-up template |
Open... |
Opens an existing test |
Save |
Saves the presently opened test |
Save As... |
Saves the present test under a new name |
Lock Test File |
Sets the attribute of a completed test file to read only |
Edit Template.. |
Lets you edit a template |
Save As Template... |
Saves only the template information of the presently opened test |
Print Pre-test |
Lets you print the currently displayed pre-test screen |
Print Report... |
Lets you print the currently displayed report |
Print Graph/Table... |
Lets you print the currently displayed graph or table |
Printer Setup... |
Lets you change the printer setup |
Exit |
Exits the application |
14

Edit
Copy Table
Copy Graph
View
Main
Test Setup >
Pre-test
Test
Display >
Report >
Options
Local Lockout
Validation Mode
Configure...
Defaults...
Mains
Auto On/Auto Off
Auto On/Manual Off
Manual On/Auto Off
Manual On/Manual Off
Help
Contents
Using Help
About
Mains ON/ Mains Off
Installation - 2
Copies highlighted information from the table to the Clipboard
Copies the presently displayed graph to the Clipboard
Lets you select the type of test to run
Lets you select the test set-up parameters
Lets you run the pre-test
Lets you run the test
Lets you view specific test results
Lets you view the test report
Lets you disable the front panel keys of the Agilent 6800-Series AC Power Source/Analyzer.
Lets you run a special mode used to validate current harmonics testing methodology.
Lets you specify the I/O slot address of the interface, the instrument address, the interface type, and the Agilent 6800-Series AC Power Source/Analyzer model number.
Lets you view and change the default values for line voltage, frequency, and test standards.
Automatically controls the output of the Agilent 6800-Series AC Power Source/Analyzer while the test is running.
Lets you manually turn off the output of the Agilent 6800-Series AC Power Source/Analyzer from the Test window. Provides automatic turn-on at the beginning of pretests and tests.
Lets you manually turn on the output of the Agilent 6800-Series AC Power Source/Analyzer from the Test window. Provides automatic turn-off at the completion of pretests and tests.
Lets you manually control the output of the Agilent 6800-Series AC Power Source/Analyzer from the Test window.
Accesses the Help contents.
Explains how to use the on-line help.
Displays the Agilent 14761A HFTS software revision.
Indicates the present state of the ac source output.
15

2 - Installation
Menu Tabs
The menu tabs that are located at the bottom of the screen let you easily access the primary functions of the Agilent 14761A HFTS software. These functions are also available from the file menus. Altogether, there are five groups of menu tabs:
The Main level group accesses the following functions:
The > symbol in the tab label indicates a lower-level of tabs, which access a number of additional screens. Once at the lower level, the /\ tab returns you to the Main Level. When active, the [last tab] in the series jumps to the last lower-level tabs that you had previously accessed.
The following tabs appear in the Test Setup> group. Each tab accesses its respective function.
The following tabs appear in the Pre-test> group. Each tab accesses its respective function.
The following tabs appear in the Display> group for Quasi-stationary or Fluctuating Harmonic testing. Each tab accesses its respective function.
The following tabs appear in the Display> group for Voltage Fluctuation testing. Each tab accesses its respective function.
The following tabs appear in the Report> group. Each tab accesses its respective function.
16
3
Setting Up the Test
If you have not already done so, click on the Agilent HFTS icon to run the software. Now you can set up your test. If the Agilent HFTS icon does not appear on your computer, go back to chapter 2 and install the Agilent 14761A HFTS software.
Select a Test Type
When you first run the Agilent 14761A HFTS software, the Welcome window appears.
Select a test type from the Welcome Window.
1.Click on either Quasi-stationary Harmonics, Fluctuating Harmonics, or Voltage Fluctuations
Note |
To select a different test after you get past the Welcome window, use the drop-down File |
|
menu commands |
|
|
2. Choose to configure a new test, run an existing test, or configure a new test based on an existing template. Note that these selections are also available in the File menu.
Selecting New opens the Main window, in which you start entering test setup information about the test that you will be running. If you want to run other tests of the same type using the same setup information, consider saving this information to a template file once the setup has been established.
17

3 - Setting Up the Test
Selecting New From Template opens a dialog box that lets you select a template file which contains previously-configured test setup information. This template information will be copied into your new data file. The template itself is not changed unless you make subsequent changes to your setup and save them into the template using “Save as Template.”. When you run the test, the test data will then be added to the information obtained from the template. You can modify the template defaults and set up data as required for the new test or use the values supplied by the template. The following file extensions are used to identify template files:
.stt template files for quasi-stationary harmonic tests
.flt template files for fluctuating harmonic tests
.fkt template files for voltage fluctuation tests
The default directory for template files is C:\hfts\template
Selecting Open Existing File opens a dialog box that lets you select a data file which contains setup information and may or may not contain pre-test as well as test data. This lets you examine previously run test data or replace old test data with data obtained from a new test run. The following file extensions are used to identify data files:
.sta data files for quasi-stationary harmonic tests
.flu data files for fluctuating harmonic tests
.flk data files for voltage fluctuation tests The default directory for data files is C:\hfts
Note |
Running a pre-test or a test after opening an existing file will cause all existing data to be |
|
overwritten with new data. You can prevent this from occurring by checking the Make |
|
test data read-only option in the Test window before running a test, or by using the |
|
Lock Test File command in the File menu. |
|
|
18

Setting Up the Test - 3
Create a Template
Template files contain setup information for the test that you will be running. Using templates can save valuable time by eliminating the need to enter repetitive data each time you set up a test.
Create a template by entering information into the Main and the Test Setup windows. Use the Tab key to move among the different fields.
1.Enter the following information into the text boxes of the Main window: your name
the company name
a brief description of the test procedure that you will be running a device ID such as a model number
a test ID such as a serial number or test number that uniquely identifies the test
2.Use the menu tabs on the bottom of the screen to access the Test Setup windows. Note that you can also access the Test Setup windows from the View Menu.
3.Starting with the Standard Test Setup window, select and configure each of the following Test Setup windows as needed: Standard, Advanced, and Termination
4.Select Save as Template in the File menu to create a template file. Once created, the template file may be used to quickly create new tests by adding or editing only the information that must be changed for each test. This is useful if you are conducting a series of tests or testing similar equipment that is subject to a standardized test.
19

3 - Setting Up the Test
Select the Test Setup Options for Quasi-stationary or Fluctuating Harmonics
Standard Test Options
Standard options specify the line voltage, line frequency, test time, and device class for compliance tests. They are selected in the Standard window.
Select the line voltage that will be applied to the equipment under test. Selecting Variable lets you enter a value other than 120 Vac or 230 Vac.
Select the line frequency (50 or 60 Hz) that will be applied to the equipment under test.
Select the test duration in seconds, minutes, hours, or days.
The # of Records field displays the number of data records that will be taken during the test time that you have specified. Note that the relationship between time and the number of records per second is a function of line frequency and measurement window type. The measurement window type is specified in the Advanced Test Setup window, and is set to a default of Rectangular.
Select from one of the following device classes for your equipment under test to which the EN 61000-3-2 regulation applies:
Class A: All equipment except that stated in one of the remaining three classes.
Class B: Portable electrical tools, which are hand held during normal operation and used for a short time (a few minutes) only.
Class C: Lighting equipment, including dimming devices.
20
Setting Up the Test - 3
|
Class D: Equipment having an input current with a "special wave shape" (e.g. equipment with |
|
off-line capacitor-rectifier ac input circuitry and switch-mode power supplies) and an active input |
|
power ≤ 600 W. The active power is defined as Watts. For the Class D mA/W limits to apply, the |
|
active power must also be greater than 75 W. |
|
Motor Driven Device: Check this box if the equipment you are testing is a motor-driven device. |
|
This will cause class A limits to be used in accordance with EN 61000-3-2 regardless of the input |
|
current waveshape. |
|
|
Note |
The EN 60555 Part 2 regulation only applies to Class A and Class B equipment. The |
|
Agilent 14761A HFTS software will reflect this based on the regulations selection made |
|
in the Options/Defaults menu. See appendix D for information about class |
|
determination. |
|
|
Advanced Test Options
The advanced test options may be used to modify test conditions outside the range permitted for compliance tests. They are selected in the Advanced window. Generally, you would not change the factory default settings if you are doing compliance testing because the changes may invalidate the test.
As an exception to the above statement, the Current Measurement Range setting and the Current Limit settings may be changed without invalidating the compliance test as long as the changed settings do not cause current limiting to occur during the test. Current limiting may occur during the time period when power is initially applied but before the test is run. This time delay may be specified in the Advanced Setup window for tests, and in the Pre-test window for pre-tests. Current limit errors are detected and displayed if they occur during the test. Note that you can also set test limit overrides < 100% without automatically flagging the test as non-compliant.
21

3 - Setting Up the Test
Select the rms and peak current limit of the Agilent 6800-Series AC Power Source/Analyzer that you will be applying to the equipment under test. (The Agilent Model 6843A only has rms current limit control, therefore, the peak current limit control does not appear.) Generally, it is best to leave these parameters set to their maximum default values. Although the function of the current limit is to protect the equipment under test, if the ac source goes into current limit during a normal test the test will be invalid. Default maximum current limit values are automatically established based on the model number that you entered into the Main window.
Note |
The Agilent 6800-Series AC Power Source/Analyzer can supply brief peak currents that |
|
exceed its current capability. If this occurs for an extended time with Agilent |
|
6812B/6841A and 6813B/6842A models, the units may activate an internal protection |
|
circuit (the SOA limit) to turn the output off. If the equipment that you are testing causes |
|
the Agilent 6800-Series AC Power Source/Analyzer to turn its output off, you may need |
|
to lower the peak current limit setting. This will clip the output current of the Agilent |
|
6800-Series AC Power Source/Analyzer during inrush but if properly set, will not |
|
interfere with the normal running of the pre-test and tests. |
|
|
Select the measurement window type (Rectangular or Hanning)
Select the peak current measurement range of the Agilent 6800-Series AC Power Source/Analyzer
|
6812B |
6813B |
6843A |
|
6841A |
6842A |
|
Low Range |
8 A peak |
8 A peak |
9.6 A peak |
High Range |
80 A peak |
80 A peak |
96 A peak |
Because of its better measurement resolution, use the low range when testing low power equipment. However, be careful that the equipment under test never exceeds the peak currents indicated in the above chart or the test results will be invalid.
Select a test limit override for the harmonic failure threshold. This is specified as a percent of the limit as defined by the applicable regulation. For Class C, test limits are also a function of the measured (or user-specified) power factor and the line current at the fundamental frequency. If necessary, you can override the power factor measured in the pre-test. For Class D, test limits are also a function of real power (or watts). If necessary you can also override the watts measured in the pre-test. Overrides are useful to prevent minor changes in measured values from changing the test limits each time the test is run.
Select a measurement delay from the time power is applied to the equipment under test until the time that the Agilent 6800-Series AC Power Source/Analyzer starts measuring data. According to EN 61000-3-2, this delay must be 10 seconds or less for compliance level fluctuating harmonic tests. Note that the measurement delay has no consequential impact on test results. This is because during the "delay to start of test" portion of both the pre-test and main test, test results are not recorded and current limiting events are ignored. However, once the actual acquisition of measurement data begins, current limit events are again treated as errors that invalidate the test. Since high inrush currents usually occur only during the first few mains cycles following application of mains voltage, a properly set current limit threshold will not be crossed once the "delay to start of test" period has ended.
22
Setting Up the Test - 3
Test Termination Options
Termination options let you select the conditions that will terminate the test. They are selected in the Termination window.
Note |
The following conditions terminate any test automatically if the Agilent 6800-Series AC |
|
Power Source/Analyzer operating limits are exceeded: Rail fault condition, |
|
Overtemperature, Overvoltage, and SOA. Refer to the applicable ac source User’s |
|
Guide for an explanation of these conditions. |
|
|
Select termination on errors. One error will terminate the test when this is selected: UNR - when the output becomes unregulated.
Select termination when the current limit is exceeded. The two current limit conditions that will terminate the test when this occurs are: CL - when the output goes into current limit mode, and CP - when the output current limit protection has tripped.
Select termination upon exceeding a specified number of failures. When testing fluctuating harmonics and this box is checked, you can specify failures:
of any type,
with a 2.5 minute window without a 2.5 minute window.
Select termination on exceeding a specified number of watch events. Each event that satisfies the selected criteria is counted as one event occurrence.
23
3 - Setting Up the Test
If termination On Watch Events is enabled, you can select the following Watch Items criteria:
All harmonics greater than the specified percent of threshold
Odd harmonics greater than the specified percent of threshold
Odd ≤ 19 harmonics greater than the specified percent of threshold
Even harmonics greater than the specified percent of threshold
Nth, a specific Harmonic Number that is greater than the specified percent of threshold
Select the Test Options for Voltage Fluctuations
Standard Test Options
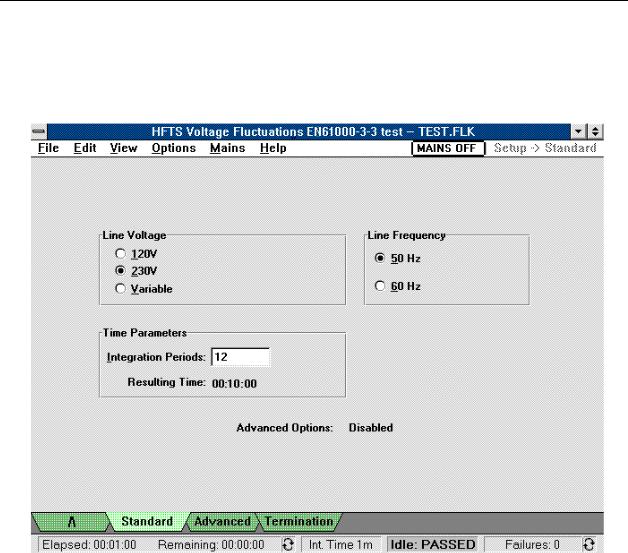
Standard options specify the line voltage, line frequency, and test time for compliance tests. They are selected in the Standard window.
Select the line voltage that you will be applying to the equipment under test. Selecting Variable lets you enter a value other than 120 Vac or 230 Vac.
Select the line frequency (50 or 60 Hz) that will be applied to the equipment under test.
24
Setting Up the Test - 3
Select the number of integration periods to be acquired during the test. The Resulting Time field displays the test duration based on the number of integration periods as well as the Pst integration time that you have specified in the Advanced window. The Pst integration time is set to a default of 10 minutes with the Advanced options disabled.
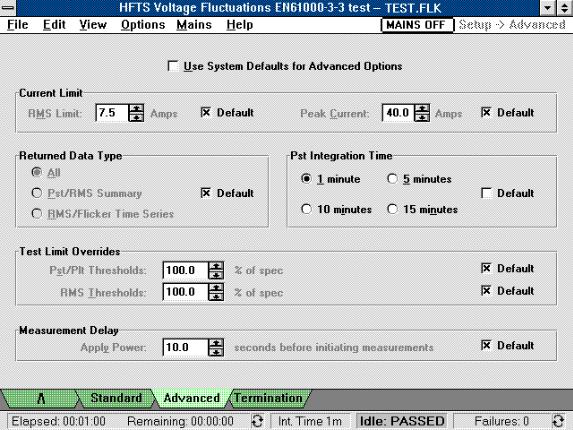
Advanced Test Options
Select the rms and peak current limit of the Agilent 6800-Series AC Power Source/Analyzer that you will be applying to the equipment under test. Generally, it is best to leave these parameters set to their maximum default values. Although the function of the current limit is to protect the equipment under test, if the unit does go into current limit during a normal test, the test will be invalid.
Select the returned data type (All, Pst/Rms Summary, or Rms/Flicker Time Series)
Select the Pst (or short-term) flicker integration time.
Select a test limit override for the Pst/Plt Thresholds (short-term/long-term flicker) and Rms Thresholds. This is specified as a percent of the specification in the applicable regulation.
Select a measurement delay from the time power is applied to the equipment under test until the time that the Agilent 6800-Series AC Power Source/Analyzer starts measuring data.
25

3 - Setting Up the Test
Test Termination Options
Note The following conditions terminate any test automatically if the Agilent 6800-Series AC Power Source/Analyzer operating limits are exceeded: Rail fault condition, Overtemperature, Overvoltage, and SOA. Refer to the ac source User’s Guide for more information.
Select termination on errors. One error will terminate the test when this is selected: UNR - when the output becomes unregulated.
Select termination when the current limit is exceeded. Two current limit conditions will terminate the test when this occurs: CL - when the output goes into current limit mode; CP - when the output current limit protection has tripped.
Select termination on exceeding a specified number of Pst failures
Select termination on exceeding a specified number of Rms voltage failures. You can specify Rms voltage failures: of any type
Dmax failures
Dc failures
Dt failures.
Select termination on exceeding a specified number of watch events. Each event that satisfies the selected criteria is counted as one event occurrence.
If termination On Watch Events is enabled, you can select the following Watch Items criteria:
Pst values greater than the specified perceptibility units
Instantaneous Flicker values greater than the specified perceptibility units
26

4
Running the Test
Before actual test data can be acquired, the pre-test must be run. This is accomplished in the Pre-Test window. As its name implies, the Pre-Test window centralizes functions that, following test setup, need to be performed prior to running an actual test. This includes running preliminary tests to measure quantities that are subsequently used to set test limits for Class C and Class D devices. Once the pre-test data is available, the main test can be started. This is accomplished in the Test window. Test status information is displayed in the Status bar on the bottom of the screen. Note that you must always have pre-test results present before running the main test.
To Run a Pre-test for Quasi-stationary or Fluctuating Harmonics
Pre-Test Summary
1.Select the Pre-test menu tab on the bottom of the screen to access the Pre-test Summary window. You can also access the Pre-test window from the View/Pre-test menu.
2.If desired, change the time delay from when power is applied until the pre-test is run. The default pre-test time is 10 seconds.
27

4 - Running the Test
3.It is also possible to increase the duration of the pre-test. One purpose of running a longer pretest is to obtain more data over which the test results are averaged. Additional data more accurately characterizes the worst-case operation of the equipment under test (see “Pre-test Measurements” for more information).
4.Press the Run Pre-test button to run the pre-test.
Note |
Running a pre-test from a file that already contains data will not only overwrite the pre- |
|
test data, but will also delete the existing test data. |
|
|
5. Use the Print Screen command located in the File menu to print the Pre-test window.
For Quasi-stationary and Fluctuating Harmonic tests, the pre-test checks if you have correctly classified your equipment as Class D versus any other class in the Standard Test Setup window. It displays the input-current waveshape of the equipment under test, which lets you examine the waveshape for “fit” into the Class D special waveshape window.
The Pre-test graph displays one cycle of voltage and current, superimposed on the Class D waveshape window. The current cycle that is superimposed in the Class D waveshape window is the half-cycle having the highest peak value within a single 16-cycle snapshot taken at the end of the pre-test interval (see “one-shot measurements” later in this chapter for more information). Press the Power Statistics tab if you need to configure the active power requirements for determining Class D limits, or if you need to display additional power measurement information.
The Class Indicator displays a green background if the data collected from the equipment under test matches the Class selection. If the data collected from the equipment under test does not match the Class selection, the Class indicator displays a red background. In this case you should return to the Standard Test Setup window, select the correct class, and rerun the pre-test. Refer to appendix D for information about the class determination logic of the Agilent 14761A HFTS software.
NOTE: Class D equipment must have input power > 75 W and ≤ 600 W, and 95% of its inputcurrent waveshape must fall within the Class D waveshape window. For EN 61000-3-2 testing, devices generating Class D waveforms but NOT meeting all Class D input power criteria will be tested using Class A limit values for odd harmonics. If testing against limits for even harmonics is also desired, select Class A. Testing a device that meets the Class D "special waveshape" with Class A selected, results in compliant test reports if the "Motor Driven Device" checkbox, available for EN 61000-3-2 testing, is also selected.
The Percent in Envelope indicator displays the percentage of waveform data within the Class D waveshape standard if Class A or Class D has been selected.
The Voltage THD “IN SPEC” or “OUT OF SPEC” indicator summarizes the results of testing to determine if the output voltage of the ac source is within the harmonic voltage limits as specified in EN 61000-3-2/EN 60555-2. The voltage THD results are based on measurements of individual voltage harmonics up to the 40th harmonic, and a comparison of these measurements to the limits specified in the regulations. Select the Source Harmonics tab to display the individual worst-case voltage harmonics that occurred during the pre-test.
The Measured Values area on the right side of the display summarizes nine of the most common mains input characteristics (see “Pre-test Measurements” for more information).
28

Running the Test - 4
Pre-Test Power Statistics
This screen provides additional information about the active input power of the device under test. It displays the following power measurements, which are calculated at the end of the pre-test:
-Maximum Power in watts (default selection for setting Class D limits)
-Mean Power in watts
-Standard Deviation in watts
-specified Percentile in watts
The Percentiles area displays the results of a statistical evaluation of the active input power during the pre-test. Percentile values are displayed according to the selected scale increment. Scale increments of 10, 5, or 1 may be specified. A scale increment of 1 displays all percentile values.
If you are testing Class D equipment, the Use to set limits area is active, letting you specify what type of Watts measurement will be used by the Agilent 14761A HFTS software as the basis for calculating Class D test limits. Select from: Maximum Power (the default), Mean Power, or specified Percentile. This provides you with greater flexibility for specifying Class D test limits.
Note: Based on your selection, you can see what the Class D test limits will be by acccessing the Display Table window. The Class D limits are shown in the Limits column.
You can also override the pre-test watts measurement later in the Advanced Test Setup window in the Test Limit Overrides section.
29
4 - Running the Test
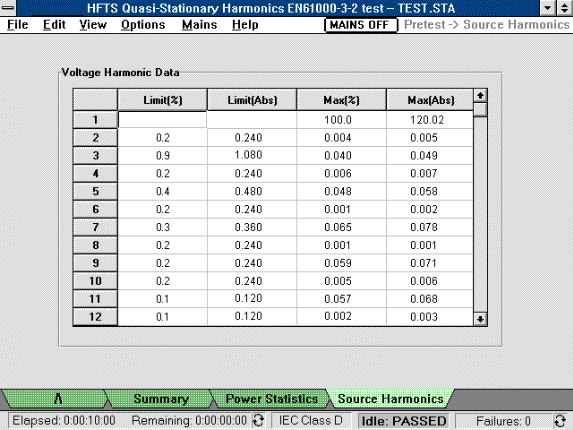
Pre-Test Source Harmonics
This screen displays the pre-test voltage data for harmonics 1-40 on a worst-case basis. The Limit(%) column indicates the permissible limits for each harmonic expressed as percentages of the fundamental voltage. For 230 V/50 Hz power distribution systems, these are:
-No limits for the 1st harmonic (the fundamental)
-0.9% of Vfundamental for 3rd harmonic
-0.4% of Vfundamental for 5th harmonic
-0.3% of Vfundamental for 7th harmonic
-0.2% of Vfundamental for 9th harmonic
-0.1% of Vfundamental for even harmonics from 2 to 10
-0.1% of Vfundamental for all harmonics from 11 to 40
The Limit(Abs) column indicates the permissible limits for each harmonic expressed as absolutes (in volts). These values are obtained by multiplying the %limits divided by 100 times the measured minimum value for the fundamental component. There are no limits for the fundamental.
The Max(%) column indicates the maximum pre-test values for harmonics 2 through 40 expressed as percentages. These values are obtained by dividing the maximum harmonic values by the minimum fundamental value and multiplying by 100. Failures are indicated in red.
The Max(Abs) column indicates the maximum pre-test values for harmonics 2 through 40 expressed as absolutes (in volts). These values are simply the maximum values of the voltage harmonic data returned during the pre-test. Failures are indicated in red.
30
Loading...