


PART B
TEXAS INSTRUMENTS TI-85/TI-86 GRAPHING
CALCULATORS
Setup
When using this Guide, you should always, unless instructed otherwise, use the calculator setup specified below for both the TI-85 and TI-86. Before you begin, check the basic setup with
2nd |
|
MORE |
(MODE) . Use the following instructions to choose the settings shown in Figure 1. Check |
the window format with GRAPH 
 MORE
MORE 
 F3 (FORMT) . Choose the settings shown in Figure 2.
•If you do not have the darkened choices shown in Figures 1 and 2 (below), use the arrow
keys to move the blinking cursor over the setting you want to choose and press ENTER .
• Press EXIT or 2nd 
 EXIT (QUIT) to return to the home screen.
|
|
TI-85, 86 Basic Setup |
|
|
|
|
|
|
|
TI-85, 86 Window Setup |
|
|
|
|
|
|
|
|
|
|
|
|||||||||||||||||||||||||||||
|
|
|
|
|
FIGURE 1 |
|
|
|
|
|
|
|
|
|
|
|
|
|
|
|
|
|
|
|
|
FIGURE 2 |
|
|
|
|
|
|
|
|
|
|
|
|
||||||||||||
For the TI-85 |
Return to the home screen with |
|
|
|
|
|
or |
|
|
|
|
|
|
|
|
|
(QUIT) . Specify the statistical |
|||||||||||||||||||||||||||||||||
|
EXIT |
2nd |
|
|
EXIT |
|||||||||||||||||||||||||||||||||||||||||||||
|
|
|
|
|
|
|
|
|
|
|
|
|
|
|
|
|
|
|
|
|
|
|
|
|
|
|
|
|
|
|
|
|
|
|
|
|
|
|
|
|
|
|
|
|
|
|
||||
|
setup as shown in Figure 3 |
by |
pressing |
|
|
2nd |
|
|
– |
|
|
(LIST) |
|
F1 |
({) |
0 |
|
|
|
|||||||||||||||||||||||||||||||
|
|
|
|
|
|
|
|
|
|
|
(L) |
|
|
|
|
1 |
|
|
|
|
|
|
|
|
|
|
|
|
|
(ENTRY) |
|
|
2 |
|
|
|
|
. (See |
||||||||||||
|
|
F2 |
(}) |
STO‹ |
|
|
|
7 |
|
ALPHA |
|
ENTER |
|
2nd |
|
ENTER |
|
|
|
|
|
ENTER |
||||||||||||||||||||||||||||
|
Figure 3.) Press |
|
|
|
|
|
|
|
|
|
|
(QUIT) to return to the home screen. |
|
|
|
|
|
|
||||||||||||||||||||||||||||||||
|
|
|
EXIT |
or |
2nd |
|
|
EXIT |
|
|
|
|
|
|
|
|||||||||||||||||||||||||||||||||||
For the TI-86 |
|
|
|
|
|
|
|
|
|
|
|
|
|
|
|
|
|
|
|
|
|
|
|
|
||||||||||||||||||||||||||
Return to the home screen with |
|
EXIT |
or |
2nd |
|
|
EXIT |
(QUIT) . Specify the statistical |
||||||||||||||||||||||||||||||||||||||||||
|
setup |
|
as |
|
|
shown |
|
in |
|
|
|
Figure |
6 |
|
by |
|
|
|
pressing |
|
|
|
||||||||||||||||||||||||||||
|
|
|
|
|
|
|
|
|
|
|
|
|
|
|
|
|
|
|
|
|
|
|
|
|
1 |
|
|
|||||||||||||||||||||||
|
|
2nd |
|
– |
(LIST) |
F5 |
(OPS) |
MORE |
|
|
|
|
MORE |
|
|
MORE |
|
F3 |
(SetLE) |
|
ALPHA |
|
|
7 |
(L) |
, |
|
|||||||||||||||||||||||
Copyright © Houghton Mifflin Company. All rights reserved. |
B-1 |

B-2 |
TI-85/TI-86 Graphing Calculators |
|
|
|
|
|
|
|
|
|
|
|
|
|
|
|
|
|
|
|
|
|
|
|
||||||
|
|
|
|
|
|
(L) 2 |
|
|
|
|
|
|
|
(L) |
3 |
|
|
|
|
|
|
|
|
(L) 4 |
|
|
|
|
|
(L) 5 |
|
|
|
ALPHA |
|
7 |
, |
|
ALPHA |
|
7 |
, |
|
|
ALPHA |
|
7 |
, |
|
ALPHA |
|
7 |
|||||||||
|
|
|
|
. (See Figure 4.) Press |
|
or |
|
|
|
(QUIT) to return to the home screen. |
||||||||||||||||||||
|
|
|
ENTER |
EXIT |
2nd |
|
EXIT |
|||||||||||||||||||||||
|
|
|
|
|
|
|
|
|
|
|
|
|
|
|
|
|
|
|
|
|
|
|
|
|
|
|
|
|
|
|
|
|
|
|
|
|
|
|
|
|
|
|
|
|
|
|
|
|
|
|
|
|
|
|
|
|
|
|
|
|
|
TI-85 Statistical Setup |
TI86 Statistical Setup |
FIGURE 3 |
FIGURE 4 |
TI-86 Note: Because appropriate TI-86 computer linking software had not yet been perfected at the time this material was written, TI-86 screens in this Guide appear smaller than the TI85 screens. Screens that appear the same on both calculators are shown for the TI-85.
Basic Operation
You should be familiar with the basic operation of your calculator. With calculator in hand, go through each of the following.
1. CALCULATING You can type in lengthy expressions; just make sure that you use parentheses when you are not sure of the calculator's order of operations. As a general rule, numerators and denominators of fractions and powers consisting of more than one term should be enclosed in parentheses.
|
|
|
1 |
|
|
(-3)4 − 5 |
||||
Evaluate |
|
. |
Evaluate |
|
|
|
. |
|||
4 * 15 + 8957 |
8 + 1. 456 |
|
||||||||
|
|
for the negative symbol and |
|
|
for the |
|||||
(Use |
(–) |
|
− |
|
||||||
subtraction sign.) |
|
|
|
|
|
|
||||
Evaluate e3*0.027 and e3*0.027.
The calculator will assume you mean the first expression unless you use parentheses around the two values in the exponent. (It is not necessary to type in the 0 before the decimal point.)
2. USING THE ANS MEMORY Instead of again typing an expression that was evaluated immediately prior, use the answer memory by pressing 2nd 
 (–) (ANS) .
Copyright © Houghton Mifflin Company. All rights reserved.

Chapter 1 |
B-3 |
æ |
|
|
|
ö |
−1 |
|
1 |
|
|
||
Calculate ç |
|
|
÷ using this nice shortcut. |
||
|
+ |
|
|||
ç |
4*15 |
895 ÷ |
|
||
è |
|
|
7 |
ø |
|
(If you wish to clear the home screen, press CLEAR .)
3. ANSWER DISPLAY When the denominator of a fraction has no more than three digits, your calculator can provide the answer in fraction form. When an answer is very large or very small, the calculator displays the result in scientific notation.
The “to a fraction” key is obtained by pressing
2nd 
 (MATH) F5 (MISC) MORE
 F1 (‹Frac) .
The calculator's symbol for “times 1012” is È12. Thus,
7.945È12 means 7,945,000,000,000.
The result 1.4675È–6 means 1.4675*10–6, the scientific notation expression for 0.0000014675.
4. STORING VALUES Sometimes it is beneficial to store numbers or expressions for later
recall. To store a number, type the number on the display and press STO‹ . (Note that the cursor automatically changes to alphabetic mode when you press STO‹ .) Next, press the key corresponding to the letter in which you wish to store the value, and then press ENTER . To join
several short commands together, use |
|
|
|
(:). |
|
2nd |
|
|
|
Store 5 in A and 3 in B, and then calculate 4 A – 2B.
To recall a value stored in a variable, use ALPHA
to type the letter in which the expression or value
is stored and then press ENTER . The value stays
stored until you change it.
5. ERROR MESSAGES When your input is incorrect, an error message is displayed.
If you have more than one command on a line without the commands separated by a colon (:), an error message
results when you press ENTER .
Copyright © Houghton Mifflin Company. All rights reserved.

B-4 TI-85/TI-86 Graphing Calculators
Choose F1 (Goto) to position the cursor to the place the error occurred so that you can correct the mistake or choose
F5 (Quit) to begin a new line on the home screen.
Copyright © Houghton Mifflin Company. All rights reserved.

Chapter 1 Ingredients of Change:
Functions and Linear Models
& 1.1 Fundamentals of Modeling
There are many uses for a function that is entered in the graphing list. Graphing the function in an appropriate viewing window is one of these. Because you must enter all functions on one line (that is, you cannot write fractions and exponents the same way you do on paper) it is very important to have a good understanding of the calculator’s order of operations and to use parentheses whenever they are needed.
1.1.1 ENTERING AN EQUATION IN THE GRAPHING LIST Press
GRAPH 
 F1 (y(x)=) to access the graphing list. Up to 99 equations can be entered in the
graphing list, and the output variables are called by the names y1, y2, etc. When you intend to graph an equation you enter in the list, you must use x as the input variable.
If there are any previously entered equations that you will |
Position the cursor on the line |
||||
no longer use, clear them out of the graphing list. |
containing the equation and |
||||
|
press |
|
|
(DELf) . |
|
|
CLEAR |
or |
F4 |
||
|
|
|
|
|
|
Suppose you want to graph A = 1000(1 + 0.05)t. Because we intend to graph this equation, the input must be called x. Type x by pressing x-VAR or F1 (x) , not the times sign .
TI 85 For convenience, we use the first, or y1, location in the graphing list. Enter the right hand side as
1000(1 + 0.05)^x
TI 86 For convenience, we use the first, or y1, location in the graphing list. Enter the right hand side as
1000(1 + 0.05)^x
Plot1, Plot2, and Plot3 at the top of the y(x)= list should not be darkened. If any of them are, use  until you
are on the darkened plot name. Press ENTER to make
the name(s) not dark.
1.1.2 DRAWING A GRAPH If you have not already done so, enter the equation in the y(x)= list using x as the input variable before drawing a graph. We now draw the graph of y = 1000(1 + 0.05)x.
B-5 |
Copyright © Houghton Mifflin Company. All rights reserved. |
B-6 TI-85/TI-86 Graphing Calculators
Remove the lower menu with EXIT , and press
F3 (ZOOM) MORE 
 F4 (ZDECM) .
Notice that the graphics screen is blank.
TI-85 Press EXIT 
 F2 (RANGE) to see the view set by ZDECM.
TI-86 Press EXIT 
 F2 (WIND) to see the view set by ZDECM.
• Both xMin and xMax are the settings of the left and right edges of the viewing screen, and yMin and yMax are the settings for the lower and upper edges of the viewing screen. xScl and yScl set the spacing between the tick marks on the x- and y-axes. The view you see is –6.3 ≤ x ≤ 6.3, –3.1 ≤ y ≤ 3.1.
Follow the procedures shown in either 1.1.3 or 1.1.4 to draw a graph with your calculator. Whenever you draw a graph, you have the option of manually changing the view or having the calculator automatically find a view of the graph.
1.1.3 MANUALLY CHANGING THE VIEW OF A GRAPH If you do not have a good view of the graph or if you do not see the graph, change the view with one of the ZOOM options or manually set the view. (We later discuss the ZOOM options.)
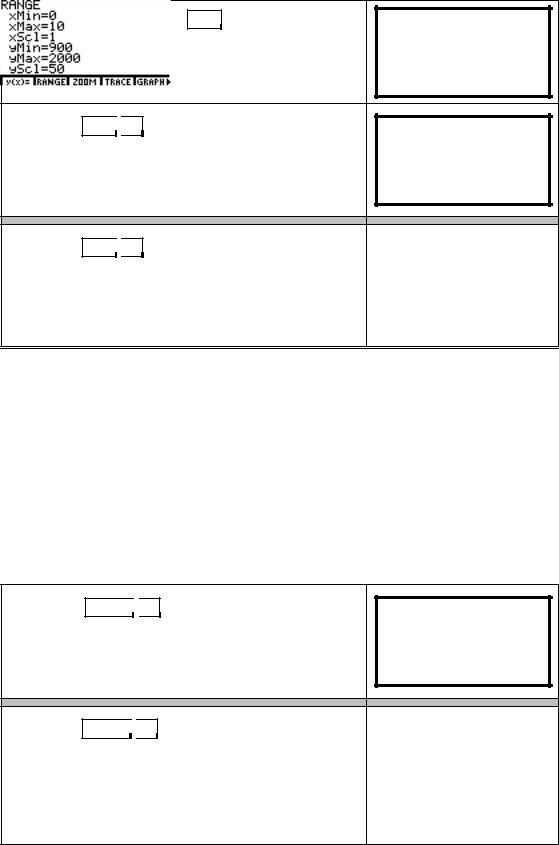
TI 85 Press GRAPH 
 F2 (RANGE) .
Set xMin to 0, xMax to 10, leave xScl at 1, set yMin to 900, yMax to 2000, and yScl to 50.
TI 86 Press GRAPH 
 F2 (WIND) .
Set xMin to 0, xMax to 10, leave xScl at 1, set yMin to 900, yMax to 2000, and yScl to 50.
Below yScl is a setting called xRes. For all applications in this Guide, have xRes set to 1.
Copyright © Houghton Mifflin Company. All rights reserved.

Chapter 1 |
B-7 |
Both Press F5 (GRAPH) to draw the graph of y1 = 1000(1 + 0.05^x)
in the new view. CLEAR removes the menu from the bottom of the screen if you wish to see more of the graph.
Copyright © Houghton Mifflin Company. All rights reserved.

B-8 TI-85/TI-86 Graphing Calculators
1.1.4 AUTOMATICALLY CHANGING THE VIEW OF THE GRAPH If your view of the graph is not good or if you do not see the graph, change the view using the built-in autoscaling feature of your calculator. This option will automatically find a view to see a l l the functions that you have turned on in the graphing list.
Be sure the function you are graphing, y = 1000(1 + 0.05)x, is entered in the y1 location of the y(x)= list. (Delete all other functions that may be entered in other locations.) Before doing
what follows, access the graphics menu with GRAPH .
To access the range on the TI-85 (called the window on
the TI-86), press F2 . Set xMin to 0 and xMax to 10. (It does
not matter what values are set in the yMin and
yMax positions.) Press F3 (ZOOM) MORE 
 F1 (ZFIT) .
Your calculator automatically sets a vertical view (based on the xMin and xMax you set) and draws a graph of the function.
1.1.5 TRACING You can display the coordinates of certain points on the graph by tracing. The x-values shown when you trace depend on the horizontal view that you choose, and the y-values are calculated by substituting the x-values into the equation that is being graphed.
With the graph on the screen, press F4 (TRACE)
and use 

 to move the trace cursor to the right and

 to move the trace cursor to the left.
The number 1 in the upper right hand corner of the screen tells you that you are tracing on the equation in y1.
Trace past the edge of the screen and notice that even though you cannot see the trace cursor, x and y values of points on the line are still displayed at the bottom of the screen. Also notice that the graph scrolls to the left or right as you move the cursor past the edge of the current viewing screen.
1.1.6 ESTIMATING OUTPUTS You can estimate outputs from the graph using TRACE. I t is important to realize that such outputs are never exact values unless the displayed x-value is identically the same as the value of the input variable.
Copyright © Houghton Mifflin Company. All rights reserved.

Chapter 1 |
B-9 |
Estimate the value of A where A = 1000(1 + 0.05)x when x = 5, x = 7, and x = 10.
Press |
EXIT |
|
F2 |
|
(RANGE) (or WINDOW) . If you do not |
|
|
|||||||||||
have the settings shown to the right, reset the values. |
|
|
||||||||||||||||
|
|
|
|
|
|
|
|
|
|
|
|
|
|
|
||||
Press |
|
|
|
(ZOOM) |
|
|
(ZOUT) . After the graph |
|
|
|||||||||
F3 |
|
|
F3 |
|
|
|||||||||||||
finishes drawing, press |
|
|
to once more |
|
|
|||||||||||||
ENTER |
|
|
||||||||||||||||
enlarge your view of the graph. |
|
|
|
|
||||||||||||||
(Press |
|
|
|
|
|
(RANGE) and observe the values |
|
|
||||||||||
EXIT |
|
F2 |
|
Note that (5, 1450) is a point |
|
|||||||||||||
now defining the graphics screen.) |
|
|||||||||||||||||
on the screen, not a point on the |
|
|||||||||||||||||
|
|
|
|
|
|
|
|
|
|
|
|
|
|
|
|
|
graph of the function. |
|
|
|
|
|
|
|
|
|
|||||||||||
Press |
|
|
(TRACE) and use |
|
to move as close as you |
|
|
|
||||||||||
F4 |
|
|
|
|
||||||||||||||
can to x = 5. (Your screen may look slightly different |
|
|
|
|||||||||||||||
than the one shown to the right.) |
|
|
|
|||||||||||||||
Continue pressing |
|
|
and notice that the values 7 and |
|
|
|
||||||||||||
|
|
|
|
|||||||||||||||
10 cannot be obtained by tracing in this view. Therefore, |
|
|
|
|||||||||||||||
|
Because the number 5, not a |
|
||||||||||||||||
choose values close to these numbers to obtain estimates |
|
|||||||||||||||||
such as A is approximately $1386.80 when x = 7 and A |
value close to 5 is shown, |
|
||||||||||||||||
A = $1276.28 when x = 5. |
|
|||||||||||||||||
is about $1637.37 when x = 10. |
|
|
|
|||||||||||||||
|
|
|
|
|||||||||||||||
•If you had used the original range (window) with xMax =10, and traced, you should obtain the exact value A = 1500 when x = 10 because 10, not a value close to 10, is shown when tracing.
•If you want “nice, friendly” values displayed for x when tracing, set xMin and xMax so that xMax−xMin is a multiple of 12.6, the width of the ZDECM viewing screen. For instance, if you set xMin = 0 and xMax = 12.6 in the example above, the exact values when x = 5, x = 7, and x = 10 are displayed when you trace. Another view that gives friendly values is xMin = –5 and xMax = 20.2 since 25.2 = 2(12.6). Try it!
1.1.7EVALUATING OUTPUTS The values obtained by this evaluation process are
actual output values of the equation, not estimated values such as those generally obtained by tracing.
Begin by entering the equation whose output you want to evaluate in the y(x)= list. Even though you can use any of the locations, let us say for this illustration you have y1 = 1000(1 + 0.05^x).
To evaluate an output while the graph is on the screen:
Draw the graph of y1 in a view containing the input you intend to use. (If the input value is not between xMin and xMax , an error message results when you evaluate.)
Press MORE 
 MORE
MORE 
 F1 (EVAL) , and type the input value.
Copyright © Houghton Mifflin Company. All rights reserved.
 Loading...