


 Loading...
HP P6000 Performance Advisor User Guide
Abstract
This document is intended for storage administrators and users involved in performance characterization of an HP P6000 Enterprise Virtual Array (EVA). You must have a basic understanding of storage performance concepts as well as the EVA architecture and management. You must be familiar with HP P6000 Command View, P6000 Performance Data Collector, and HP Management Integration Framework.
HP Part Number: T5494-96596
Published: September 2013
Edition: 5

© Copyright 2008, 2013 Hewlett-Packard Development Company, L.P.
Confidential computer software. Valid license from HP required for possession, use or copying. Consistent with FAR 12.211 and 12.212, Commercial Computer Software, Computer Software Documentation, and Technical Data for Commercial Items are licensed to the U.S. Government under vendor's standard commercial license.
The information contained herein is subject to change without notice. The only warranties for HP products and services are set forth in the express warranty statements accompanying such products and services. Nothing herein should be construed as constituting an additional warranty. HP shall not be liable for technical or editorial errors or omissions contained herein.
NOTE: IPv6 is supported on server-based management HP P6000 Command View Suite beginning with Version 8.0.2. IPv6 is supported on array-based management HP P6000 Command View Suite beginning with Version 9.2.
NOTE: USGv6 is supported on array-based management HP P6000 Command View Suite beginning with Version 10.1. Internet Protocol Security (IPsec) is not supported with HP P6000 Command View Suite array-based management.
See the HP P6000 Command View User Guide for information on Internal Protocol support.

Contents |
|
1 HP P6000 Performance Advisor overview...................................................... |
8 |
Features.................................................................................................................................. |
8 |
2 Getting started......................................................................................... |
10 |
Deploying and installing HP P6000 Performance Advisor............................................................. |
10 |
Configuring HP P6000 Performance Advisor.............................................................................. |
10 |
3 SPoG interface and common tasks.............................................................. |
13 |
Understanding the SPoG interface............................................................................................ |
13 |
HP P6000 Performance Advisor common tasks........................................................................... |
15 |
Using the Restore Defaults option......................................................................................... |
15 |
Using the Display option..................................................................................................... |
15 |
Using the Filter by list......................................................................................................... |
16 |
Additional tasks................................................................................................................. |
16 |
4 HP P6000 Performance Advisor concepts.................................................... |
18 |
Object type folders and Storage object nodes............................................................................ |
18 |
Dashboard............................................................................................................................ |
19 |
KPIs................................................................................................................................. |
20 |
Key Metrics............................................................................................................................ |
20 |
Charts................................................................................................................................... |
22 |
Reports.................................................................................................................................. |
23 |
Load Distribution.................................................................................................................... |
24 |
Load distribution across controllers....................................................................................... |
24 |
Live Data Metrics........................................................................................................... |
25 |
Historical Data Metrics................................................................................................... |
25 |
Load distribution across host ports........................................................................................ |
27 |
Performance and state data..................................................................................................... |
28 |
Statistical data....................................................................................................................... |
30 |
Database maintenance............................................................................................................ |
31 |
Host connections.................................................................................................................... |
32 |
Data replication tunnels........................................................................................................... |
33 |
Threshold monitoring............................................................................................................... |
34 |
Overview.......................................................................................................................... |
34 |
Threshold summary value.................................................................................................... |
35 |
Threshold monitoring methods............................................................................................. |
37 |
Factors for setting threshold levels......................................................................................... |
38 |
Threshold alarm email notifications....................................................................................... |
38 |
5 Quick tour of HP P6000 Performance Advisor pages..................................... |
42 |
Settings page......................................................................................................................... |
42 |
Settings – Configuration page............................................................................................. |
42 |
Settings – Database page................................................................................................... |
44 |
Settings – Events page........................................................................................................ |
45 |
Settings – Storage Systems page.......................................................................................... |
45 |
Storage Systems – <storage system> page........................................................................ |
46 |
<Storage system> – <performance object type> page........................................................ |
47 |
Storage Systems page............................................................................................................. |
47 |
Storage Systems – <object type> page................................................................................. |
49 |
<Object type> – <performance object> page........................................................................ |
50 |
6 Working with HP P6000 Performance Advisor.............................................. |
51 |
Configuring monitoring settings in HP P6000 Performance Advisor................................................ |
51 |
Using the Quick Setup........................................................................................................ |
51 |
Contents 3
Adding an HP P6000 Performance Data Collector instance..................................................... |
54 |
|
Adding performance objects for monitoring........................................................................... |
55 |
|
Adding storage systems................................................................................................. |
55 |
|
Adding other performance objects.................................................................................. |
58 |
|
Parameters in the Select <Performance Object> window..................................................... |
60 |
|
Adding threshold and dashboard profiles............................................................................. |
60 |
|
Adding threshold profiles............................................................................................... |
60 |
|
Adding dashboard profiles............................................................................................. |
61 |
|
Configuring dashboard settings........................................................................................... |
62 |
|
Configuring additional settings............................................................................................ |
63 |
|
Report |
settings.............................................................................................................. |
63 |
Chart |
settings............................................................................................................... |
64 |
Key Metric settings........................................................................................................ |
65 |
|
SMTP and SNMP notification settings.............................................................................. |
66 |
|
Configure email and SNMP settings............................................................................ |
66 |
|
Configure SNMP settings........................................................................................... |
67 |
|
Exporting MIB file..................................................................................................... |
69 |
|
Sample email notification.......................................................................................... |
69 |
|
Sample SNMP notifications........................................................................................ |
69 |
|
Managing configured settings in HP P6000 Performance Advisor................................................. |
71 |
|
Managing HP P6000 Performance Data Collector settings...................................................... |
71 |
|
Viewing configured HP P6000 Performance Data Collector instances................................... |
71 |
|
Editing the port number of HP P6000 Performance Data Collector instances......................... |
72 |
|
Removing configured HP P6000 Performance Data Collector instances................................. |
72 |
|
Viewing HP P6000 Command View instances....................................................................... |
73 |
|
Managing configured settings for performance objects........................................................... |
73 |
|
Viewing configured monitoring settings for storage systems................................................. |
73 |
|
Viewing configured monitoring settings for other performance objects.................................. |
74 |
|
Viewing configured monitoring settings for virtual disks.................................................. |
75 |
|
Viewing configured monitoring settings for hosts........................................................... |
75 |
|
Viewing configured monitoring settings for disk groups.................................................. |
75 |
|
Viewing configured monitoring settings for data replication groups................................. |
75 |
|
Viewing configured monitoring settings for controllers.................................................... |
75 |
|
Viewing configured monitoring settings for host ports.................................................... |
75 |
|
Viewing configured monitoring settings for physical disks............................................... |
76 |
|
Editing monitored settings for a storage system or performance object.................................. |
76 |
|
Removing storage system or performance object records..................................................... |
76 |
|
Starting or stopping data collection for a storage system.................................................... |
77 |
|
Updating the object state for a storage system................................................................... |
78 |
|
Viewing configured dashboard settings............................................................................ |
79 |
|
Managing configured threshold profiles................................................................................ |
79 |
|
Viewing configured threshold profiles............................................................................... |
79 |
|
Editing a configured threshold profile............................................................................... |
80 |
|
Removing threshold profiles............................................................................................ |
81 |
|
Removing custom threshold profiles.................................................................................. |
81 |
|
Managing configured dashboard profiles............................................................................. |
81 |
|
Viewing configured dashbaord profiles............................................................................ |
81 |
|
Editing a configured dashboard profile............................................................................ |
82 |
|
Removing dashboard profiles.......................................................................................... |
82 |
|
Managing additional settings.............................................................................................. |
83 |
|
Email and SNMP notification settings............................................................................... |
83 |
|
Viewing a summary of configured monitoring settings............................................................. |
83 |
|
Summary of configured monitoring settings for storage systems........................................... |
84 |
|
Summary of configured monitoring settings for virtual disks................................................. |
84 |
|
Summary of configured monitoring settings for hosts.......................................................... |
85 |
|
4Contents
Summary of configured monitoring settings for disk groups................................................. |
85 |
Summary of configured monitoring settings for data replication groups................................ |
86 |
Summary of configured monitoring settings for controllers and host ports.............................. |
86 |
Summary of configured monitoring settings for physical disks.............................................. |
87 |
Summary of configured monitoring settings for storage systems........................................... |
87 |
Viewing the HP P6000 Performance Advisor configuration summary......................................... |
88 |
Licensing behavior in HP P6000 Performance Advisor............................................................. |
88 |
Viewing performance metrics of storage systems......................................................................... |
90 |
Viewing the Dashboard Overview........................................................................................ |
90 |
Storage System – Live Host Port Throughput and Latency Values........................................... |
91 |
Correlation between color blocks and status icons – Live bar chart....................................... |
93 |
Understanding a live bar chart........................................................................................ |
94 |
Storage System level performance charts.......................................................................... |
94 |
Host Port IOPS Historical chart.................................................................................... |
95 |
Host Port IO Latencies chart....................................................................................... |
95 |
Threshold Summary chart.......................................................................................... |
95 |
Correlation between color blocks and status icons – Threshold Summary chart................. |
96 |
Understanding tool tip - Threshold Summary chart......................................................... |
96 |
Understanding the Threshold Summary chart................................................................ |
96 |
Key Performance Indicators – Dashboard......................................................................... |
97 |
Dashboard counters...................................................................................................... |
98 |
Viewing the Dashboard Host Port Performance....................................................................... |
98 |
Live Data...................................................................................................................... |
99 |
Historical Statistical Data.............................................................................................. |
100 |
Charts....................................................................................................................... |
100 |
Viewing and managing the Dashboard KPIs........................................................................ |
100 |
Adding KPI records..................................................................................................... |
100 |
Viewing KPI records..................................................................................................... |
101 |
Removing KPI records.................................................................................................. |
101 |
Viewing a threshold summary............................................................................................ |
101 |
Threshold summary for a storage system......................................................................... |
103 |
Threshold summary table......................................................................................... |
103 |
Understanding tool tip............................................................................................. |
104 |
Interpretation of the threshold summary – Storage system............................................. |
104 |
Threshold summary for an object type............................................................................ |
104 |
Viewing records for a state...................................................................................... |
105 |
Interpretation of the threshold summary – object type.................................................. |
106 |
Threshold summary for a performance object.................................................................. |
106 |
Using Edit threshold profile settings link..................................................................... |
107 |
Interpretation of the threshold summary – performance object....................................... |
107 |
Viewing a summary of key metrics...................................................................................... |
108 |
Key metric summary for storage systems......................................................................... |
109 |
Key metric summary for object types.............................................................................. |
110 |
Key metric summary for a performance object................................................................. |
112 |
Editing key metric chart settings..................................................................................... |
113 |
Viewing charts................................................................................................................. |
114 |
Chart views................................................................................................................ |
116 |
Opening a chart in a new window................................................................................ |
117 |
Printing charts............................................................................................................. |
118 |
Saving charts.............................................................................................................. |
118 |
Zooming in and out on charts....................................................................................... |
118 |
Managing charts............................................................................................................. |
119 |
Adding charts............................................................................................................. |
119 |
Editing chart settings.................................................................................................... |
121 |
Removing charts.......................................................................................................... |
121 |
Contents 5
Viewing and managing reports.......................................................................................... |
121 |
Reports history............................................................................................................ |
122 |
Report templates......................................................................................................... |
123 |
Creating a report template....................................................................................... |
123 |
Editing a report template......................................................................................... |
125 |
Executing a report template..................................................................................... |
126 |
Removing a report template..................................................................................... |
126 |
Predefined templates................................................................................................... |
127 |
7 Managing the event log.......................................................................... |
129 |
Viewing the event log............................................................................................................ |
129 |
Event categories................................................................................................................... |
130 |
Event severity levels............................................................................................................... |
131 |
Exporting events................................................................................................................... |
131 |
8 Maintaining database............................................................................. |
133 |
HP P6000 Performance Advisor database summary.................................................................. |
133 |
Exporting storage system data................................................................................................ |
133 |
Viewing export database records............................................................................................ |
134 |
Removing export records....................................................................................................... |
135 |
Purging data........................................................................................................................ |
135 |
Viewing purge history........................................................................................................... |
136 |
Re-purging data................................................................................................................... |
137 |
Cleaning purge history.......................................................................................................... |
137 |
Data backup and restore....................................................................................................... |
137 |
9 Troubleshooting HP P6000 Performance Advisor issues................................ |
140 |
Troubleshooting scenarios...................................................................................................... |
140 |
Error messages..................................................................................................................... |
146 |
Setup and configuration.................................................................................................... |
146 |
Database purge............................................................................................................... |
148 |
Database export.............................................................................................................. |
150 |
Key Metrics..................................................................................................................... |
150 |
Events............................................................................................................................ |
151 |
Threshold monitoring........................................................................................................ |
151 |
Reports........................................................................................................................... |
153 |
Management Integration Framework................................................................................... |
154 |
Dashboard and charts...................................................................................................... |
154 |
Contacting HP support...................................................................................................... |
156 |
10 Support and other resources................................................................... |
157 |
Release history..................................................................................................................... |
157 |
Contacting HP...................................................................................................................... |
157 |
HP Insight Remote Support..................................................................................................... |
157 |
Related information............................................................................................................... |
158 |
A Object types and properties.................................................................... |
159 |
B Use cases.............................................................................................. |
161 |
Setting up dashboard............................................................................................................ |
161 |
Determining threshold monitoring values.................................................................................. |
162 |
C Counters in HP P6000 Performance Advisor.............................................. |
164 |
Derived counters definitions................................................................................................... |
164 |
Supported counters............................................................................................................... |
167 |
6Contents
D Event codes........................................................................................... |
173 |
E Viewing CSV report using HP TLViz........................................................... |
174 |
F HP P6000 Performance Advisor deployment architecture.............................. |
175 |
Glossary.................................................................................................. |
180 |
Index....................................................................................................... |
183 |
Contents 7

1 HP P6000 Performance Advisor overview
HP P6000 Performance Advisor is server-based software that monitors the performance of HP P6000 EVA storage systems and provides metrics that help you analyze performance and troubleshoot performance issues. You can view metrics at the storage system and subsequent levels. HP P6000 Performance Advisor interacts with HP P6000 Performance Data Collector to gather performance data and HP P6000 Command View to gather state data of the monitored storage systems and corresponding performance objects. The performance data is collected for the set of counters that are also applicable in HP P6000 Performance Data Collector. HP P6000 Performance Advisor also provides performance data for additional counters that are based on the existing set of counters. For more information on derived counters, see “Derived counters definitions” (page 164).
HP P6000 Performance Advisor enables you to view performance metrics at the following levels:
•Storage system: View performance metrics of storage systems and high-level performance of monitored objects across different object types.
•Object type: View performance summary of all corresponding monitored objects. A hyperlink provided for each performance object allows you to further drill down to view the performance summary for that object.
•Performance object: View performance metrics for a specific monitored object.
NOTE:
•To deploy and use HP P6000 Performance Advisor, you must have sufficient knowledge of HP P6000 Command View, HP P6000 Performance Data Collector, Management Groups, and EVA storage systems.
•When using HP P6000 Performance Advisor, a minimum of Adobe Flash Player 10 is required on the browser you are using.
•Unless otherwise mentioned, the term storage systems refers to HP P6000 storage systems or EVA storage systems throughout the document.
•The term performance object in HP P6000 Performance Advisor refers to the supported object in HP P6000 EVA storage system that can also be viewed in HP P6000 Command View.
•The term object type refers to root node or folder node that encompasses performance objects in HP P6000 Command View. It does not include user defined folders.
Features
Following are the feature highlights:
Quick Setup: Quickly setup and start monitoring HP P6000 EVA storage systems and their performance objects.
Key Metrics: Key Metrics functionality helps you view statistical performance data of storage systems and objects for the most useful counters. Key Metrics charts can show live data samples or historical performance data for the duration selected.
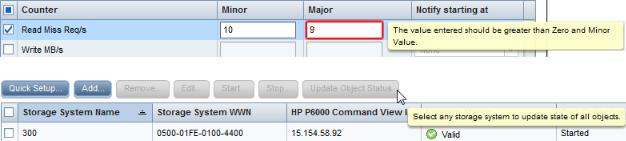
Threshold monitoring and notifications: You can set threshold levels (Minor and Major) for counters and monitor performance against the set threshold levels, and also receive notification when performance of an object crosses the dispatch at threshold level. You can also view threshold levels in charts for a performance object.
Dashboard: Dashboard functionality provides an overall view of the storage system and helps you quickly scan and identify if there are performance issues. It provides the drill down capability to further analyze performance at controller and host port levels. It also allows quick viewing of performance data for user-defined key performance indicators.
8HP P6000 Performance Advisor overview
Charts: Charts functionality allows you to view historical data or live performance data samples for a predefined interval or custom duration. You can also add multiple counters in to the same chart and view performance of the object for those counters. You can also use the zoom-in functionality.
Reports: Reporting functionality allows you to generate point-in-time performance reports in PDF and CSV formats for specific performance objects. You can specify durations, such as a day or month. Reports can be saved for future reference.
Load Balancing: Load distribution enables you to identify if the load across the host ports and controllers is well balanced.
Database: You can view a summary of the database, export the performance data, and maintain the database space by purging older data.
Features 9

2 Getting started
This chapter describes how to use HP P6000 Performance Advisor to monitor storage systems and corresponding performance objects.
Deploying and installing HP P6000 Performance Advisor
CAUTION: Ensure that the storage systems have a valid HP P6000 Performance Advisor license installed in HP P6000 Command View. Storage systems with an expired license or for which a license is not yet installed cannot be added for monitoring in HP P6000 Performance Advisor.
There are different deployment models for HP P6000 Performance Advisor. For more information on the preferred deployment model, see “HP P6000 Performance Advisor deployment architecture” (page 175).
HP P6000 Performance Advisor is available as part of the HP P6000 Command View suite of products. The HP P6000 Command View installation wizard helps you install HP P6000 Performance Advisor. For more information, see the HP P6000 Command View Installation Guide.
After installation, HP P6000 Performance Advisor appears in the SPoG interface along with the HP P6000 Command View instance, if both applications are installed on the same management server. If they belong to the same Management Group as other installed instances, the corresponding SPoG displays all installed instances of HP P6000 Performance Advisor and HP P6000 Command View in a single browser window. In either case, HP P6000 Performance Advisor can automatically discover the installed instances of HP P6000 Command View.
After you log in to the SPoG using your user name and password, you can view all installed instances of HP P6000 Command View and HP P6000 Performance Advisor under Settings in the Navigation pane. All storage systems managed by the discovered HP P6000 Command View instances are displayed in the SPoG, under Storage Systems in the Navigation pane. Add those storage systems and performance objects, and configure the monitoring settings. For more information, see “Configuring HP P6000 Performance Advisor” (page 10). To understand the different pages in HP P6000 Performance Advisor, see “Quick tour of HP P6000 Performance Advisor pages” (page 42).
If the installed instances do not belong to the same Management Group, import either of the servers in to the Management Group so that the instances appear in the same SPoG. For more information on importing servers into Management Groups, see the HP P6000 Management Integration Framework Administrator Guide.
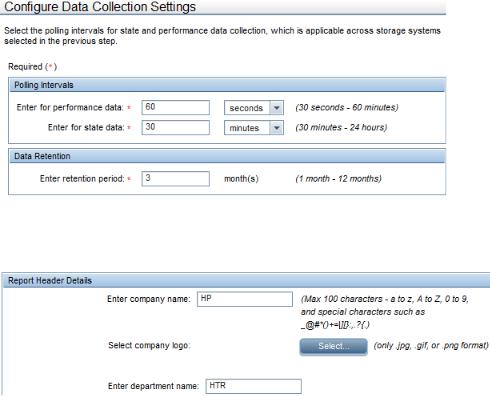
Configuring HP P6000 Performance Advisor
This section explains how to quickly configure an HP P6000 Performance Advisor instance to monitor storage systems and performance objects, and involves:
1.Selecting the HP P6000 Performance Advisor instance.
2.Adding the HP P6000 Performance Data Collector instance through which the storage systems are accessible. For example, assume that CV1 is managing SS1 and SS2, and CV2 is managing SS3 and SS4, and the four storage systems are visible to PA1. If the HP P6000 Performance Data Collector instance you add in PA1 is able to access only SS1 and SS2, you can add only those storage systems in PA1 through the HP P6000 Performance Data Collector instance. If you also want to add SS3 and SS4 visible through CV2, then add the corresponding HP P6000 Performance Data Collector in PA1.
3.Adding storage systems and corresponding performance objects, and configuring the monitoring settings.
10 Getting started
The HP P6000 Performance Advisor instance will collect performance data and display relevant metrics at the storage system, object type, and performance object levels. For more information, see “Viewing performance metrics of storage systems” (page 90).
NOTE:
•Two different HP P6000 Performance Advisor instances cannot simultaneously monitor a storage system in a management group.
•The list of metrics displayed under Controller and Storage System object types gets updated during state data collection cycle based on Storage System’s support for XCOPY and WSAME metrics.
•To effectively collect the performance data for XCOPY and WSAME metrics and Writes-in-Cache (Basic Async) and Not-Ack.Writes (Basic Async) metrics of Data Replication Group, all Performance Data Collector instances added in P6000 Performance Advisor must be upgraded to Performance Data Collector 10.1 or later.
Procedure
To quickly configure HP P6000 Performance Advisor to monitor and provide relevant metrics on storage systems and performance objects:
1.Use the Quick Setup wizard to:
a.Add the fully qualified server names or IP addresses (IPv4 or IPv6) of the HP P6000 Performance Data Collector instances, one after the other.
b.Add the storage systems. Only those storage systems visible through the discovered HP Command View and accessible through the HP P6000 Performance Data Collector instances (added in the previous step) are displayed. The storage systems with an invalid license state cannot be added. For more information on managing licenses, refer to the
HP P6000 Command View User Guide.
c.Add all performance objects in an object type. By default, storage systems, controllers and host ports are mandatorily added.
d.Configure the performance and state data collection polling intervals that are applicable across all the selected storage systems and corresponding objects.
e.Configure the dashboard profile.
For more information, see “Using the Quick Setup” (page 51).
To add storage systems and specific performance objects, see “Adding performance objects for monitoring” (page 55).
2.View key metric charts and statistical data of monitored storage systems and performance objects for the set of counters defined by HP P6000 Performance Advisor. For more information, see “Viewing a summary of key metrics” (page 108).
3.Plot charts to view live or historical performance data samples of storage systems and objects for a specified duration. For more information, see “Adding charts” (page 119).
To understand HP P6000 Performance Advisor functions, such as key metrics, KPIs, charts, and reports, see “HP P6000 Performance Advisor concepts” (page 18). See “Quick tour of HP P6000 Performance Advisor pages” (page 42) for a description of the pages in HP P6000 Performance Advisor.
For monitored storage systems and corresponding performance objects, you can:
•Configure minor and major threshold levels and view the threshold summary. For more information, see “Adding performance objects for monitoring” (page 55).
•Configure dashboard threshold settings for the storage system and view live performance data. Drill down to view performance of the corresponding controllers and host ports. For more information, see “Configuring dashboard settings” (page 62) and “Viewing the Dashboard Overview” (page 90).
Configuring HP P6000 Performance Advisor 11
•Add and monitor performance objects and counters that you consider as KPIs for a storage system. For more information, see “Adding KPI records” (page 100) and “Key Performance Indicators – Dashboard” (page 97).
•Add performance objects and counters and generate reports for a storage system. For more information, see , “Reports history” (page 122) and “Creating a report template” (page 123).
12 Getting started
3 SPoG interface and common tasks
This chapter describes the SPoG interface and common tasks you can perform using HP P6000 Performance Advisor.
Understanding the SPoG interface
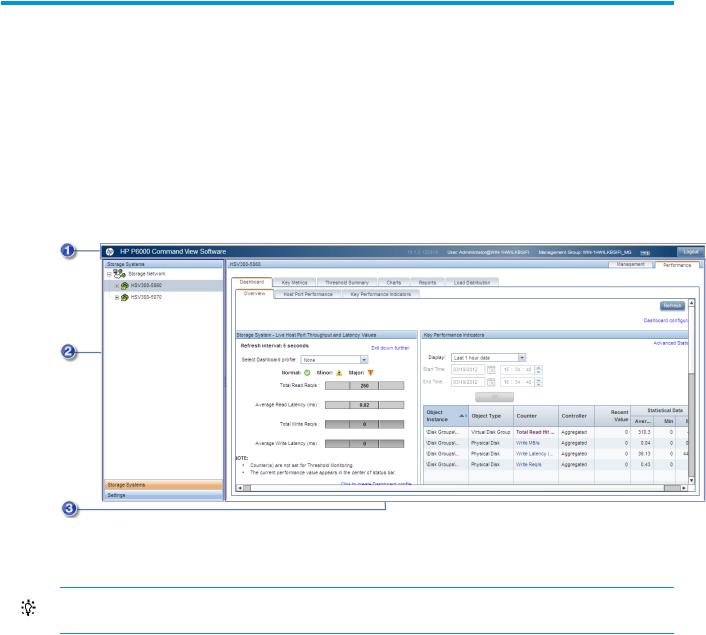
The SPoG interface includes three panes:
•Session pane
•Navigation pane
•Content pane
1. Session pane |
2. Navigation pane |
3. Content pane |
TIP: For best viewing of the HP P6000 Performance Advisor panes, set your monitor screen resolution to 1024 X 768 pixels (minimum) or higher.
Session pane
The Session pane displays:
•User (name@hostname). Logged-in user and the HP P6000 Performance Advisor server (hostname) that is being accessed.
Example: Administrator@serverhost
•Management Group (management group name). Management Group to which the HP P6000 Performance Advisor server belongs.
Example: MG_1
•Help. Displays the HP P6000 Command View online help suite, which includes the online help for HP P6000 Performance Advisor.
•Refresh. Click to view the latest data.
•Logout. Click to end the current session.
Understanding the SPoG interface 13
Navigation pane
The Navigation pane displays:
•Settings point of view. Displays all instances of HP P6000 Command View and HP P6000 Performance Advisor that belong to the same Management Group. You can configure monitoring, database, and event notification related settings for HP P6000 Performance Advisor.
•Storage Systems point of view. Displays the storage systems managed by all HP P6000 Command View instances in the Management Group. You can view the performance summary for storage systems monitored by HP P6000 Performance Advisor instances in the same Management Group. For each storage system, you can view a performance summary for an object type, which includes the summary of performance of all corresponding monitored objects. You can also view the performance summary of each supported object in a storage system.
Click the plus (+) or minus (–) sign for a storage system to expand or collapse its component tree. All performance objects in a storage system are displayed in the component tree and are grouped in folders according to object type.
Content pane
The Content pane displays information and actions that you can perform on the storage system or performance object selected in the Navigation pane. The displayed aspect tabs depend on your configuration. They display organized content based on your HP storage applications. For example, the Management aspect tab includes content from the HP P6000 Command View application and the Performance tab includes content from the HP P6000 Performance Advisor application. For more information about the Management tab, see the HP P6000 Command View User Guide.
To access help, click ? on a feature page on the Performance tab to open a corresponding help page.
HP P6000 Performance Advisor defined default value example
HP P6000 Performance Advisor provides default settings that you can use:
User defined value example
You can specify default configurations to be used by HP P6000 Performance Advisor:
14 SPoG interface and common tasks
Interactive assistance example
HP P6000 Performance Advisor provides appropriate assistance:
HP P6000 Performance Advisor common tasks
This section describes common tasks you can perform with HP P6000 Performance Advisor, such as restoring defaults and using the Display option and Filter by list to view data.
Using the Restore Defaults option
To restore factory-default settings for charts, key metrics, reports, and email and SNMP notifications:
1.Click Restore Defaults.
2.When prompted, click OK.
The default settings are restored.
3.Click Save Changes.
Using the Display option
You can view performance data collected over specified intervals based on the HP P6000 Performance Advisor management server date and time:
•Last 1 hour data (default)
•Last 6 hours data
•Last 12 hours data
•Last 24 hours data
•Data for Custom duration (specified date and time)
The polling interval to fetch data for the predefined or custom duration will be per the specified performance and state data collection frequency for a storage system.
Additionally, Live data is another option in the Display list when you view live performance data samples of storage systems and performance objects, such as key metric charts. You can view live data based on the polling interval and duration that you configure while plotting live data charts.
Predefined interval
Select the duration from the Display list. If you select the Data for Custom duration option, specify the start and end duration, and click OK. By default, the End Time shows the current server date and time, and the Start Time shows exactly 1 hour prior to the end time. An error occurs if the selected End Time is later than the deployment server date and time.
HP P6000 Performance Advisor common tasks 15

The Data for Custom duration option displays data for any 24-hour duration when plotting charts, generating reports, viewing key metrics summary and dashboard data, or exporting data for a storage system. However, only data for the last 24 hours is displayed when viewing threshold summary.
Live duration
To view live performance data, select the Live data option from the Display list.
Using the Filter by list
To shorten a long list of records in a table:
1.Select the option in the Filter by list and enter or choose the equals criterion based on your selection in the Filter by list.
2.Click Filter.
Example
In the following example, event records are filtered based on a Severity of Warning.
Click Reset to restore all the records and clear the filters selected.
Additional tasks
Sorting records
To sort records in a table, click a column title. In the following image, the records are sorted in descending order based on the State Monitoring Enabled column.
16 SPoG interface and common tasks

Records are sorted based on the type of information (alphabetical, numerical, or date). For example, the Physical Disk Name column sorts alphabetically first, then numerically.
Resizing column width
To resize the width of a column, use your pointing device to drag a column separator to the desired width.
Selecting all records in a table
To select all records in a table, select the check box adjacent to the first column title in the table.
Using the Refresh option
To manually refresh data, click Refresh in the top right corner of the Content pane.
The browser-level refresh function does not refresh the data. You must use the Refresh button on the HP P6000 Performance Advisor pages.
HP P6000 Performance Advisor common tasks 17

4 HP P6000 Performance Advisor concepts
This chapter explains HP P6000 Performance Advisor concepts, including key metrics, KPIs, charts, reports, database maintenance, and threshold monitoring.
Object type folders and Storage object nodes
HP P6000 Performance Advisor displays data at two levels:
•Object type (parent) folder node. Includes the corresponding storage object type nodes. At this level, you can view summary of data relevant to the corresponding storage objects. You can identify the storage object that has the highest or lowest performance data using the sorting functionality, click the hyperlink to navigate directly to the storage object page and view the detailed data. Only the monitored objects are listed. Storage System, Controller and Host Ports are added for monitoring by default.
Object type data is not available for storage systems and physical disks.
The following summaries are available for each object type in HP P6000 Performance Advisor:
◦Key metrics summary. Provides the historical statistical data of all storage objects for selected counters predefined by HP P6000 Performance Advisor.
A hyperlink for each storage object helps you navigate to its key metric page.
◦Threshold summary. Provides the threshold summary of all threshold enabled storage objects that are monitored. A hyperlink for each storage object helps you navigate to its threshold summary page.
◦Charts. Allows you to add charts to view the performance of all the corresponding storage objects for various counters. For example, at the Data Replication object type, you can only plot charts for data replication group or data replication tunnel storage objects.
•Storage (child) object node. View performance data for each storage object monitored in HP P6000 Performance Advisor. Each storage object belongs to a container object.
A storage system is considered an object node, not a container object. You can view dashboard data and generate reports in HP P6000 Performance Advisor. You can view data corresponding to all monitored storage objects in the storage system in various ways, such as charts, KPIs.
Storage objects can belong to different object type folder nodes.
◦Folders created under Virtual Disk and Hosts folder are user created folders and are not considered as an object type folder or a storage object node.
◦Data replication tunnel data is available at Data Replication folder node and storage system level only.
The object type folder node and storage object node are referred as object type and performance object respectively in HP P6000 Performance Advisor. In the Navigation pane, they are referred to as object type folders and object folders, respectively. Similarly, the term object type refers to root node or folder in HP P6000 Command View.
18 HP P6000 Performance Advisor concepts

1 Object type folder nodes |
2 Storage object nodes |
States for storage objects in HP P6000 Performance Advisor
The storage objects in HP P6000 Performance Advisor can belong to one of the following states:
•Monitored. Storage object is actively monitored by HP P6000 Performance Advisor and performance data for the object is available for you to view.
•Not Monitored. Storage object is not being monitored for performance data. In this case, the object must be added for monitoring in HP P6000 Performance Advisor.
•Cannot be Monitored. Storage object is not supported for monitoring in HP P6000 Performance Advisor. This state is valid for ungrouped disks and hardware objects, such as disk enclosures, disk drives, and racks.
Dashboard
Dashboard provides a quick view of the overall performance of a storage system and includes the live bar-chart and historical throughput and latency values of the storage system. The Major and Minor threshold vales are taken from the selected dashboard profile. If no dashboard profile is selected, the threshold values will not be displayed. These threshold values are the reference points for the live data samples and help you analyze the total I/Os processed in per unit time and duration taken to complete each request (latency). New dashboard profiles can be created by using the Click to create Dashboard profile. Dashboard configuration can also be changed by clicking the Dashboard configuration link.
In addition, the following data is also included as part of the dashboard data:
•Storage system related charts for the selected duration, includes the Threshold Summary chart, Host Port IOPS Historical chart, and Host Port IO Latencies chart.
The Threshold Summary chart provides the overall threshold summary of threshold monitored objects. It includes a summary of the current total threshold-monitored objects for every object type.
•Key Performance Indicators, includes historical performance chart along with statistical data.
The live bar-chart is constantly refreshed at five-second intervals in Dashboard. You can drill down to each controller and host port performance data to view live bar-chart and historical data for controllers and host ports associated with the storage system, and determine which component is under the maximum load. While displaying controller level data, minor and major throughput values are automatically considered half of what is set for the storage system. For more information, see “Viewing the Dashboard Overview” (page 90).
Dashboard 19
KPIs
The Key Performance Indicators (KPI) functionality helps you view historical data of performance objects for counters that you consider important. The KPI data is available as charts and statistical data, and always included in the dashboard summary displayed for a storage system. The statistical table displays basic statistics (Minimum, Maximum, Average) and the recent performance value. Also, advanced statistical data is available, which includes the Standard Deviation, 90th, 95th, and 99th percentile in addition to the basic statistics. It is required that you identify KPIs for your storage system if you regularly monitor the performance of corresponding sets of objects for specific counters. You can configure a KPI record for each combination of performance object and counter that you want to monitor. For example, if you have virtual disks, Data 1 and Data 2, configured for a critical application and you want to monitor their throughput along both the controllers CPU% in your storage system, you may like to configure them in Key Performance Indicator.
If a performance object configured as part of a KPI record is deleted in HP P6000 Command View, the performance data collected until the time of deletion is still displayed. The recent value in the statistical table still shows the most recent value available before the performance object was deleted.
On the Dashboard Overview page, click the Advanced link to go to the Key Performance Indicator tab and view additional statistical data like Standard Deviation, Percentiles values. For more information, see “Key Performance Indicators – Dashboard” (page 97).
Key Metrics
Key Metrics helps you view performance data for storage systems and objects for the supported counters (key counters) defined by HP P6000 Performance Advisor. To know the supported key metric counters, see “Supported counters” (page 167).
HP P6000 Performance Advisor provides key metric data for every monitored storage system and performance object in the form of:
•Key metric charts
•Key metric statistical table
You can also view key metrics summary of all monitored performance objects for an object type, where the historical statistical data of those objects is displayed for the key counters. At this level, you can sort performance objects based on their performance data to identify highest and least utilized objects. For example, you can sort key metrics summary for the Virtual Disks object type to view the top ten performing virtual disks. Additionally, you can filter records to view only the required performance objects. You can drill down from the object type to view key metric data for the specific performance objects in that object type. The key metric data acts as key indicator and enables you to take a quick look at performance data of objects, based on which you can plot charts and generate reports to view specific details of the object's performance.
20 HP P6000 Performance Advisor concepts
IMPORTANT: In addition to Key Metrics, the following is also applicable for KPI, charts, and reports:
•The throughput (Req/s) or data transfer rate (MB/s), queue depth, busies counters are considered as sum of both the controllers value, if the Aggregated option is selected for objects that provide performance data specific to a controller, such as the virtual disks, host connections, virtual disk groups, physical disk groups, data replication groups, and physical disks.
For example: Total Read Req/s at aggregated controller level = Read Hit Req/s of Controller A + Read Miss Req/s of Controller A + Read Hit Req/s of Controller B + Read Miss Req/s of Controller B.
•The latency counters are weighted average with number of I/O requests of the same counter.
For example: Average Read Latency at aggregated controller level = (Read Hit Requests of Controller A) * (Read Hit Latency of Controller A) + (Read Hit Requests of Controller B) * (Read Hit Latency of Controller B) + (Read Miss Requests of Controller A) * (Read Miss Latency of Controller A) + (Read Miss Requests of Controller B) * (Read Miss Latency of Controller B) / (Read Hit Requests of Controller A + Read Hit Requests of Controller B + Read Miss Requests of Controller A + Read Miss Requests of Controller B)
•Average IO Size is derived from the data rate divided by the number of I/O requests (considering that 1MB = 1,000,000 bytes).
•Read hit percent of virtual disks is calculated based on the total number of I/O requests (succeeded and missed).
Key metric charts
A key metric chart can display either:
•Historical performance data samples for a predefined or custom duration
•Live performance data samples for a specified polling interval and duration
By default, a key metric chart displays performance data samples for the duration (default - last hour data) that you initially configured under the Key Metrics tab (Settings > HP P6000 Performance Advisor Instance > Configuration). For more information, see “Key Metric settings” (page 65). You can configure key metric settings in a chart window to specifically view key metric data for another predefined interval, custom, or live duration. Additionally, you can:
•View data at a specific controller level for a performance object.
For a storage system, data is always considered at an aggregated level. Similarly, if a performance object is associated with both the controllers, the data aggregated across both the controllers is considered by default.
•View data for a specific key metric counter (if multiple counters are considered in a category).
•View minor and major threshold lines in both live and historical key metric charts.
•View moving average lines if you plot live data samples.
The threshold lines and moving average lines appear as specific color coded lines identified by appropriate legends in the chart window. They are supported for only one combination of performance object, controller, and key metric counter and not displayed by default. Click Edit in the key metric chart window to modify the key metric settings. For more information, “Editing key metric chart settings” (page 113).
If a storage system or performance object is deleted in HP P6000 Command View, the performance data collected until the time of deletion is still displayed in the historical charts and statistical table. The recent value in the statistical table still shows the most recent value available before the storage system or performance object was deleted. However, the live data samples are not available.
Key Metrics 21
Key metric statistical table
The key metric statistical table displays basic (default) and advanced performance statistics based on historical data. To view advanced statistics, select Advanced from the View type list. For more information about, see “Statistical data” (page 30).
The data is displayed for the predefined interval (default - last hour data) that you initially configured under the Key Metrics tab (Settings > HP P6000 Performance Advisor Instance > Configuration). You can choose to view data for a different predefined interval or custom duration by selecting the appropriate option from the Display list. The duration for viewing statistical data is always independent of the duration for plotting the key metric charts, and the vice versa is also applicable. For more information on viewing the key metric chart or statistical data for a different duration, see “Using the Display option” (page 15).
For more information on viewing key metrics, see “Viewing a summary of key metrics” (page 108).
Charts
The Charts functionality provides live and historical data for the performance objects and counters that you select. The following is a list of performance objects:
•Storage System
•Controller
•Data Replication Tunnel
•Host Connections
•Host Ports
•Data Replication Group
•Physical Disks
•Physical Disk Group
•Virtual Disks
•Virtual Disk Group
The counters can belong to one of the following categories:
•General: Corresponds to counters having value in numbers without units; for example, queue depth, number of retries, and so on.
•Percentage (%): Corresponds to counters having value in percentage; for example, CPU percentage and data percentage.
•Throughput (Req/s): Number of jobs (usually I/O requests) completed per unit time (usually per second).
•Data Transfer Rate (MB/s): Quantity of data being transferred between two systems per unit time; for example, KB/s, MB/s, and GB/h.
•Latencies (ms): Time required to complete a job (I/O request).
•Data Transfer Size (KB): Size of data being transferred between two systems per unit time; for example, KB, MB, and GB.
The following table lists the categories supported for the different object types:
22 HP P6000 Performance Advisor concepts

Table 1 Charts – Performance objects and categories
Performance |
|
|
|
|
|
|
objects |
|
|
|
Category |
|
|
|
General |
Percentage (%) |
Throughput |
Data Transfer |
Latencies (ms) |
Data Transfer |
|
|
|
(Req/s) |
Rate (MB/s) |
|
Size (KB) |
Storage System |
Yes |
No |
Yes |
Yes |
Yes |
No |
Controller |
Yes |
Yes |
Yes |
No |
Yes |
No |
Data |
Yes |
No |
Yes |
Yes |
Yes |
No |
Replication |
|
|
|
|
|
|
Tunnel |
|
|
|
|
|
|
Host |
Yes |
No |
No |
No |
No |
No |
Connection |
|
|
|
|
|
|
Host Port |
Yes |
Yes |
Yes |
Yes |
Yes |
Yes |
Data |
Yes |
Yes |
Yes |
Yes |
No |
No |
Replication |
|
|
|
|
|
|
Group |
|
|
|
|
|
|
Physical Disk |
Yes |
No |
Yes |
Yes |
Yes |
No |
Physical Disk |
Yes |
No |
Yes |
Yes |
Yes |
No |
Group |
|
|
|
|
|
|
Virtual Disk |
No |
Yes |
Yes |
Yes |
Yes |
Yes |
Virtual Disk |
No |
Yes |
Yes |
Yes |
Yes |
Yes |
Group |
|
|
|
|
|
|
You can view charts for a storage system, object type, and performance object, and for only one category at a time. The performance data in historical charts is displayed for the duration that you select (6 hours, 12 hours, 24 hours, or custom date and time). The performance data in live charts is based on the polling interval and duration that you select. The polling interval indicates the frequency at which HP P6000 Performance Advisor must retrieve performance data from the storage system. The duration indicates the time for which the performance data is displayed in a live chart at any given point of time. For example, if the duration is selected as 10 minutes, the data points are plotted and the chart is visible for the first 10 minutes of the time line. When a new data point is plotted beyond 10 minutes, the chart created during the first minute is dropped.
In addition, you can view the moving average lines for data points plotted in live charts. Also, you can view minor and major threshold levels for one combination of performance object and counter.
An additional legend for granularity that is provided in the panel indicates the type of data points plotted in the chart.
Polling Interval |
Indicates that the data points are the actual data collected. |
Hourly Average |
Indicates that the data points are average of that hour's data. |
Daily Average |
Indicates that the data points are average of that day's data. |
Live |
Indicates that the data points are collected in real time. |
For more information, see “Adding charts” (page 119) and “Viewing charts” (page 114).
If a performance object is deleted in HP P6000 Command View, the performance data collected up to the time of the deletion is still displayed in the historical charts. However, the live data samples are not available.
Reports
Reports provide a high-level performance summary of objects across various object types in a storage system. P6000 Performance Advisor enables you to create a report template and generate
Reports 23
a report using that template. These templates are termed as user-defined report templates. You can also generate a report using the predefined report templates that come bundled with the P6000 Performance Advisor.
•User-defined Reports. You can generate the report in PDF and CSV formats. The reports contain historical data for the selected performance objects. In CSV format, raw historical performance data is captured in the report. In PDF format, historical performance data is plotted as charts. Performance data in either format is based on the granularity selected (number of data points considered).
Optionally, you can have statistical data if PDF is chosen as the file format. The statistical data in a report contains minimum, maximum, average, standard deviation, 90th, 95th, and 99th percentile values. The statistical data is based on performance data collected at the specified polling interval.
•Predefined Reports. You can create predefined reports from a fixed report template that is bundled in the P6000 Performance Advisor application. These templates cannot be edited. Predefined report templates for commonly used reports enable you to create these reports with less effort and can be used for analyzing EVA Performance Metrics.
The granularity can be one of the following:
Daily Average |
Displays an aggregate of all data points collected during a day. |
Hourly Average |
Displays an aggregate of all data points collected during an hour. |
Polling Interval |
Displays the collected data points based on the frequency of collection, |
|
which is specified while configuring monitoring settings for the storage |
|
system. All data points plotted after the specified interval are displayed |
|
if polling interval is selected as the granularity type. For example, if you |
|
select a frequency of 30 seconds, data points collected after every 30 |
|
seconds are plotted and displayed in the report. |
Data points are based on the aggregate of performance data collected across controllers. To understand how the aggregated values are calculated, refer the first two list items in the important note provided for Key Metrics (see “Key Metrics” (page 20)). For polling interval granularity, the duration cannot be more than 24 hours for creating a report.
For more information, see “Viewing and managing reports” (page 121).
Load Distribution
Load distribution enables you to identify if the load across the host ports and controllers is well balanced.
Load distribution can be classified as follows:
•Load distribution across controllers
•Load distribution across host ports
Load distribution across controllers
Load distribution across controllers provide information about the resource usage of both controllers. It enables you to identify whether the load across both the controllers is well distributed. The load data comprises of the following type of metrics:
•“Live Data Metrics” (page 25)
•“Historical Data Metrics” (page 25)
24 HP P6000 Performance Advisor concepts

Live Data Metrics
The Live Data Metrics are taken from the latest sample and include the following:
•Online Virtual Disks Distribution
For a particular controller, this calculated metric records the number of virtual disks that satisfy the following criteria:
◦The virtual disk is owned by this controller
◦The virtual disk is presented to at least one host
◦The virtual disk is not presented to any host but part of a Data Replication Group
Figure 1 Online virtual disks distribution for storage system
Historical Data Metrics
The Historical Data Metrics enable you to select the time duration and view the performance data collected within that time duration. Apart from the default time duration of 1, 6, 12, or 24 hours, you can also retrieve information for any custom duration of 24 hours.
The historical data metrics include the following:
•Total Req/s
For each controller, this metric records the total I/O requests received by this controller during the current sample interval. It includes all read requests regardless of whether they resulted in a cache hit or a cache miss, and all write requests. It also includes data writes caused by transfers from a source DRM system to this system for data replication.
•Total MB/s
For each Controller, this calculated counter records the sum of total data rate on each virtual disk, owned by this controller during the current sample interval. This includes all the read requests (includes I/O from hosts and data reads caused by a DRM initial copy to a remote CA system regardless of whether they resulted in a cache-hit or a cache miss) and all the write
Load Distribution 25

requests (includes I/O from hosts and transfers from a source DRM system to this system for data replication).
•Read Req/s through Proxy Controller v/s Owning Controller
For each controller, the calculated metric Proxy Read Req/s records the total number of read requests it receives for all virtual disks owned by the other controller.
For each controller, the calculated metric Direct Read Req/s records the total number of read requests it receives for all virtual disks owned by the this controller.
•CPU %
The percentage of time that the central processing unit on the controller is active. A completely idle controller shows 0%. A controller saturated with activity shows 100%.
NOTE: If you hover the cursor over the pie, line, or bar charts, the corresponding data values will be displayed.
26 HP P6000 Performance Advisor concepts

Load distribution across host ports
Load distribution across host ports provide information about the usage of all the host ports belonging to both controllers. It enables you to identify whether the I/O load across all the host ports are well distributed.
You can select either Controller 1, Controller 2, or Controller 1 and Controller 2 and the time duration for which you want to view the load distribution. Each controller can have a maximum of four host ports and the load distribution data displayed is based on the selected option. The default option is Controller 1. Apart from the default time duration of 1, 6, 12, or 24 hours, you can also retrieve information for any custom duration within 24 hours.
The host port metrics includes the following:
•Total Req/s
For each host port on each controller, this calculated metric records the total number of requests (Read and Write) received during the selected sample interval.
•Total MB/s
For each host port on each controller, this calculated metric records the total data rate (read data rate and write data rate) during the selected sample interval.
NOTE: The data displayed for both the metrics is historical.
Based on the number of host ports present in a controller, the line and pie charts are displayed.
•Line Chart: Displays the trend of the data within the selected time interval.
•Pie Chart: Displays a comparative view of the load across all host ports for the same time interval.
Load Distribution 27

NOTE:
•If you hover the cursor over the line or pie charts, the corresponding data values will be displayed.
•An additional legend for granularity that is provided in the panel indicates the type of data points plotted in the chart.
Polling Interval |
Indicates that the data points are the actual data collected. |
Hourly Average |
Indicates that the data points are average of that hour's data. |
Daily Average |
Indicates that the data points are average of that day's data. |
Live |
Indicates that the data points are collected in real time. |
Performance and state data
HP P6000 Performance Advisor collects performance and state data for all storage systems and corresponding performance objects that it monitors. When adding a storage system for monitoring, you configure the performance and state data collection polling intervals which determine the data collected for the storage system and corresponding performance objects. The performance data is provided by the HP P6000 Performance Data Collector instance, and state data is provided by the HP P6000 Command View instance, which collects performance information and manages the storage system respectively.
Performance data
The performance data collected for storage systems and objects for various supported counters, is maintained as historical data in HP P6000 Performance Advisor. You can view this data in chart and statistical table format. The statistical data comprises the basic and advanced statistics. You can also generate reports, set threshold levels (minor and major) for storage systems and performance objects for supported counters, and view their threshold summary. For more information, see “Statistical data” (page 30).
In addition to historical data, you can view the live performance data samples for all storage systems and corresponding performance objects that HP P6000 Performance Advisor monitors. The live data is directly collected and displayed in charts for the selected storage system or performance object. The live data collection is based on the polling interval and duration that you configure. The polling interval signifies the duration after which a new data point must be plotted in the chart. The duration signifies the period for which the live data points should be visible in the chart.
When a storage system or performance object is deleted in HP P6000 Command View, the live data sample is not displayed. However, you can still view the corresponding historical performance data collected up to the date for that storage system or performance object. The historical data is retained until the configured retention period (default 3 months) is complete, after which the data is permanently deleted.
Data retention period
Data retention period constitutes the duration for which performance data for a storage system and its objects is retained in HP P6000 Performance Advisor. You provide the data retention period when configuring performance and state data collection intervals for a storage system. Once the data retention period is reached, HP P6000 Performance Advisor triggers an auto purge for that storage system and data is permanently purged. The retention period is based on the HP P6000 Performance Advisor management station date and time.
IMPORTANT: The performance data purge is scheduled for the 1st, 8th, 15th, and 22nd of each month at 3:30 am.
28 HP P6000 Performance Advisor concepts
For example, if you entered the data retention period as one month on March 31, the data for March 31 is available only till May 1. On May 1 at 3:30 am, the data for March 31 is automatically purged. A maximum of 12 months and a minimum of 1 month can be configured. 3 months is the default retention time in HP P6000 Performance Advisor.
State data
State data refers to the management information about an object collected from HP P6000 Command View for the current operational state of the object. For example, virtual disk state data includes write mode of the virtual disk. Monitoring the state data of an object allows HP P6000 Performance Advisor to track changes to the object state that can impact performance of the object. By monitoring state data, you can correlate changes in performance of the object with its corresponding state changes. It will additionally ensure that information about the object state available in HP P6000 Performance Advisor is synchronized with the actual state in HP P6000 Command View.
If state data monitoring is enabled for an object, HP P6000 Performance Advisor periodically updates the object state using the latest information from HP P6000 Command View. It is based on the frequency you configure while adding a storage system for monitoring or editing the configured settings of an existing storage system. By default, state data collection is enabled for all performance objects that you add for monitoring. Unlike performance data, state data collection requires that the HP P6000 Command View instance managing the storage system be part of the same Management Group where HP P6000 Performance Advisor resides.
You have the option of disabling state data collection for performance objects with the exception of storage system, controller, and host ports, for which state data collection cannot be disabled. You can update the state data manually for all performance objects using the Update Object Status option (Settings→HP P6000 Performance Advisor instance→Configuration). This action updates the state of all the performance objects for the selected storage system, irrespective of whether they are enabled for state data collection. During the process, the state of all the performance objects is synchronized with their current state in HP P6000 Command View. This is particularly useful when you have made configuration changes to a storage system or enabled a performance object for state data monitoring, and want those changes to reflect in HP P6000 Performance Advisor immediately rather than the next polling cycle. For example, if the state data collection polling interval is configured as 30 minutes and you cannot wait for that duration, manually update the state data. For more information on the Update Object Status option, see “Updating the object state for a storage system” (page 78).
Historical state data is not maintained in HP P6000 Performance Advisor. Only the latest state data is available. State changes to a performance object in HP P6000 Performance Advisor are not notified through SMTP or SNMP notifications, they are only logged in the Event Log page. The duration required to complete the synchronization depends on the number of performance objects monitored in the selected storage system. It also depends on the current host workload. During the state data synchronization, the existing performance data collection is not paused or impacted.
Polling intervals
HP recommends to choose longer performance data collection polling interval for large configuration storage systems. It ensures better response from the storage system and also less database growth rate in HP P6000 Performance Advisor. However, choosing longer polling intervals can result in loss of granularity of performance data.
Performance and state data 29

Following is an approximate database growth rate for different polling intervals and number of performance objects based on the tests conducted in the HP lab environment:
Polling interval |
Number of objects |
Approx database growth rate |
30 Seconds |
200 |
6 GB/month |
45 Seconds |
2000 |
40 GB/month |
90 Seconds |
4096 |
41 GB /month |
For more information on configuring performance and state data collection polling intervals, see “Adding performance objects for monitoring” (page 55).
Statistical data
The statistical data shown in HP P6000 Performance Advisor is based on historical data and includes the basic and advanced statistics. You can view statistical data for storage systems and performance objects for a predefined or custom duration. By default, the basic statistical data is displayed based on data collected in the last hour.
IMPORTANT:
•When performance data is viewed as an aggregate of both controllers, the statistical values (Standard Deviation, minimum, maximum, average, and percentile) are based on the same aggregate. It means that both the controllers data is aggregated and then the statistical values are derived from those aggregated values.
•Average of a counter (example, percentage or transfer size) for a duration is derived from all the values. For example: Average of Read Percent is calculated based on the (sum of Read IOPS of all the performance samples) * 100/(sum of read and write of all the performance samples) for a specified duration.
Basic statistics
Basic statistical data includes the following:
•The minimum value sample collected during the selected duration
•The maximum value sample collected during the selected duration
•The average value sample collected during the selected duration
Advanced statistics
Advanced statistical data includes the basic statistical data and also the following:
•Standard Deviation.
Standard deviation is a statistical measure of variability and considered as the root mean square deviation of the values from their arithmetic mean. A low standard deviation indicates that the data points are closer to the mean value. A high standard deviation indicates that the data points are spread over a large range of values. For example, high standard deviation for any Throughput (Req/s) counter indicates that the host did not receive uniform I/O requests for the selected duration.
•90th, 95th, and 99th percentile value samples for the selected duration.
A percentile is a value on a scale of 100 that indicates the percent of distribution equal to the percentile value. For each data series, the 90th, 95th, and 99th percentile are computed to ignore the data points in top 10%, 5% or 1% of the utilization peaks. Then, the value is rounded off to the nearest data sample, so that infrequent peaks are ignored. Such estimates can help maximize utilization of your systems to ensure only the required storage performance capacity.
30 HP P6000 Performance Advisor concepts
Loading...