


Distributed by
Any reference to Raytheon or RTN in this manual should be interpreted as Raymarine. The names Raytheon and RTN are owned by the
Raytheon Company.

RayChart 620 and 630
Owner’s
Handbook
Document number: 81155_1
Date: XX Month 1999
155_CVR_1.p65 |
1 |
10/12/98, 11:31 |
RayChart 620 and 630
Electronic Charting Systems
Owner’s Handbook
SAFETY NOTICES
1. HIGH VOLTAGE.
The display unit contains high voltages. Adjustments require specialised service procedures and tools only available to qualified service technicians
– there are no user serviceable parts or adjustments. The operator should never remove the display unit cover or attempt to service the equipment.
2. NAVIGATION AID.
This device is only an aid to navigation. Its accuracy can be affected by many factors, including equipment failure or defects, environmental conditions and improper handling or use.
It is the user’s responsibility to exercise common prudence and navigational judgement, and this device should not be relied upon as a substitute for such prudence and judgement.
155_TL_1.p65 |
1 |
10/12/98, 11:31 |
RayChart 620 and 630
RAYTHEON MARINE products are supported by a network of Authorized Service Representatives. For information on Raytheon products and services, contact either of the following:
UNITED STATES |
Raytheon Marine Company |
|
676 Island Pond Road |
|
Manchester, NH 03109-5420 |
|
Telephone: (603) 647-7530 |
|
800 539-5539 |
|
Fax: (603) 634-4756 |
EUROPE |
Raytheon Marine |
|
Anchorage Park |
|
Portsmouth |
|
Hampshire PO3 5TD |
|
England |
|
Telephone: 01705 693611 |
|
Fax: 01705 694642 |
Copyright © Raytheon Marine Company 1998
The technical and graphical information contained in this handbook, to the best of our knowledge, was correct as it went to press. However, the Raytheon policy of continuous improvement and updating may change product specifications without prior notice. Therefore, unavoidable differences between the product and handbook may occur from time to time, for which liability cannot be accepted by Raytheon.
Raytheon is a registered trademark of Raytheon Company
SeaTalk is a registered trademark of Raytheon Marine Europe Limited RayChart is a trademark of Raytheon Marine Company
C-MAP is a registered trademark.
155_TL_1.p65 |
2 |
10/12/98, 11:31 |

Preface |
i |
|
|
Preface
This handbook covers the following electronic charting system from Raytheon Marine Company:
•RayChart 620 monochrome chartplotter
•RayChart 630 colour chartplotter
It contains very important information on the installation and operation of your new equipment. In order to obtain the best results in operation and performance, please read this handbook thoroughly.
Raytheon Product Support or your local dealer will be available to answer any questions you may have.
How this Handbook is Organized
This handbook is divided into the following chapters:
Chapter 1: Introduces the chartplotter’s features and concepts.
Chapter 2: Explains how to start using the chartplotter, including instructions for turning it on, using the controls, changing the lighting, and using chart cards. This chapter also describes how to display navigational data. Simple exercises are included.
Chapter 3: Provides instructions for using the default soft keys to set up and use on-screen routes.
Chapter 4: Explains how to use additional basic functions, such as track histories, marks and events. It also explains how to use the MOB function.
Chapter 5: Provides information on the stored data, such as waypoints, routes and events, and how you can review, edit and use them.
Chapter 6: Provides instructions for customizing the chartplotter defaults, such as the numerical units used, the equipment connected and the alarm settings, to suit your preferences. It also explains how to customize the screen display.
Chapter 7: Provides instructions for installing the chartplotter.
Chapter 8: Provides information on maintenance, and what to do if you experience problems with your chartplotter.
Appendix A: Lists the system specifications.
A glossary, index and warranty information are included at the end of the handbook.
155_Pr_1.p65 |
1 |
10/12/98, 11:31 |

ii |
RayChart 620 and 630 |
|
|
How to Use this Handbook
This handbook is organized with the information about operating the chartplotter at the front, since you will probably use these chapters most often.
When you first receive your chartplotter, you should read Chapter 7, and install the equipment. Then read Chapters 1 and 2 to familiarize yourself with the controls of the chartplotter. You may also wish to read Chapters 3, 4 and 5.
When you are happy with the basics of using the chartplotter, read Chapter 6, decide how you wish to set up your defaults, alarms and the screen, and follow the instructions to make your changes.
Once you are on the water, you can follow the instructions in Chapters 3 and 4 to perform all your routine tasks, and refer to Chapter 5 for information about more advanced features.
If you experience any difficulties with your chartplotter, refer to
Chapter 8.
Note: The Quick Reference Card, included with your system, provides a useful summary of the chartplotter controls.
Warranty
To register your chartplotter ownership, please take a few minutes to fill out the warranty registration card found at the end of this handbook. It is very important that you complete the owner information and return the card to the factory in order to receive full warranty benefits.
EMC Conformance
All Raytheon equipment and accessories are designed to the best industry standards for use in the leisure marine environment.
Their design and manufacture conforms to the appropriate Electromagnetic Compatibility (EMC) standards, but correct installation configuration is essential to ensure that performance is not compromised.
155_Pr_1.p65 |
2 |
10/12/98, 11:31 |

Chapter 1: Introduction |
1 |
|
|
Chapter 1: Introduction
1.1 Overview
The chartplotter is a sophisticated electronic charting system, which uses GPS, dGPS or Loran-C technology to make navigation as simple and accurate as possible.
The chartplotter displays chart information from the C-MAP NT® range of electronic chart cards (C-Cards), and position information from satellites or land-based radio beacons. It can also display virtually any data available from other compatible instruments in your system.
The chartplotter is designed to be extremely easy to use, while providing powerful options for handling data and customizing the system to match your requirements. Everyday functions are available at the touch of a button, with as much or as little help as you need. The on-screen prompt and menu system, from which you can select the functions and options you require, simplifies even complex tasks such as editing stored route data.
The monochrome display unit can be installed either above or below deck; the color display must be mounted below. The display can be illuminated for nighttime use.
Features
•Chart display with zoom and pan control; a background world map is included, and there are two slots for inserting C-MAP NT C-Cards for largescale cartography.
•Vessel’s position displayed, with optional heading, course, tide and wind vectors, and optional track history display.
•Display options to control cartographic data displayed and windows for displaying navigational data, including Course Deviation Indicator (CDI) and Bearing Deviation Indicator (BDI), from other instruments.
•Plotter mode which allows the use of the chartplotter at ranges for which no chart information is available.
•8 languages.
•Memory C-cards can be used to store and transfer route, waypoint, event and track history data.
•If two chartplotters are installed on the system, each can be operated independently, but the active route is displayed on both units.
Introduction
155_C1_1.p65 |
1 |
10/12/98, 11:31 |

Introduction
2 |
RayChart 620 and 630 |
|
|
Functions
•Quick and easy on-screen route setup and control.
•GOTO function navigating immediately to a waypoint.
•Event and mark recording.
•Edit and review functions for stored route, waypoint and event data.
•Setup options to customize the chartplotter according to your own system preferences, such as chart orientation (north up, course up or head up), display windows, and alarm setup.
•Ruler function for measuring chart distances.
•Centre options for centering the chart on the ship, cursor, or a specified position, and a Home Mode for displaying the vessels current position and tracking information.
•Alarm reporting and control, and a range of timers including countdown and elapsed timers.
•Log record.
•Print option.
Navigational Displays
The chartplotter is compatible with the SeaTalk® and NMEA 0183 standards. Full functionality of the chartplotter is achieved when it is part of an integrated system, with other equipment connected via Seatalk or NMEA 0183. Data from this equipment including position, waypoints and routes, is displayed on the chartplotter and is used in calculations. Details on connecting other equipment are given in Chapter Seven.
155_C1_1.p65 |
2 |
10/12/98, 11:31 |
Chapter 1: Introduction |
3 |
|
|
1.2 The Chart Display
The chartplotter includes a small-scale world map that can be used for route planning. Detailed navigation information is displayed when a chart card is installed.
Once the position fix has been established, the screen shows the chart area and associated data that were displayed when the chartplotter was last used.
The chartplotter screen includes a cursor data box which normally provides the following information:
•The cursor position, in either latitude and longitude or TDs, depending on your setup
•The vessel’s Course Over Ground (COG) and Speed Over Ground (SOG)
•A mileage scale ruler in nautical miles
•The units in which depth data is displayed
•The cursor’s bearing (BRG) and range (RNG) from your vessel’s current position
The cursor data box is also used to display the vessel’s position and the range and bearing to the active waypoint, when the chartplotter is in Home Mode (see
Section 3.2).
An example chartplotter chart display, in its default configuration with a chart card installed, is shown in the top illustration overleaf.
The chart display can show additional information, depending on the current data and on your setup selections, as shown in the example chartplotter display in the bottom illustration opposite. You can also display the cursor position from other compatible displays (see Chapter 6).
Note: If required, you can use the setup options to change the units in which information is displayed, turn off the cursor data box and soft key labels, and change the chart orientation (see Chapter 6).
Chart Display
The
155_C1_1.p65 |
3 |
10/12/98, 11:31 |

4 |
RayChart 620 and 630 |
|
|
DisplayChart |
The |
Cursor data box |
|
|
|
|
|
|
|
Shows the current |
|
|
|
cursor position as |
|
|
|
either Lat/Long |
|
|
|
or TDs |
|
|
|
Scale rule, |
|
|
|
in nautical miles |
|
|
|
Chart boundary |
|
|
|
Lat/Long grid |
|
|
|
Vessel's heading |
|
|
|
vector |
|
|
|
Vessel's current |
|
|
|
position |
|
|
|
Cursor position, |
|
|
|
|
|
|
|
controlled by the |
|
|
|
trackpad |
|
Default soft key labels
These can be turned off. To redisplay them, press any soft key.
Object data box
Route leg |
|
Active waypoint |
Track history |
Mark |
Event |
Customizable Window,  showing navigation data
and CDI
D3819-1
155_C1_1.p65 |
4 |
10/12/98, 11:31 |
Chapter 1: Introduction |
5 |
|
|
1.3 Operating Controls
You operate the chartplotter in a variety of ways; the control keys on the display unit are used with on-screen facilities such as pop-up menus. These include:
•A trackpad providing up, down, left, right and diagonal control of an onscreen cursor.
•Eight dedicated (labelled) keys.
•Four soft keys with labels displayed on the screen.
•Pop-up menus, displayed on-screen, from which you select options.
•Database lists, displayed on-screen, which enable you to edit items.
Note: The cursor is the cross-hair symbol ( ) visible on the display. You move the cursor with the trackpad and use it to select a position or item on the chart.
The controls are shown on the following illustration. They are back-lit for night-time use. When you use a control, a help message is displayed at the top of the screen. You can switch help off as described in Chapter 6.
The Trackpad and Cursor
The trackpad and has several functions:
•To move the cursor around the chart screen
•To select an item from a pop-up menu or database list
•To adjust a variable soft key control
•To enter names in database lists
You can press on any of the four sections of the trackpad to move the cursor in that direction (up, down, left or right), or press two sections at the same time to
Controls
Operating
155_C1_1.p65 |
5 |
10/12/98, 11:31 |

Operating
Controls
6 |
RayChart 620 and 630 |
|
|
move diagonally. The cursor moves faster as you continue to press the trackpad. The current cursor position is shown in the cursor data box.
The cursor is displayed as a cross symbol ( ) on the chart. It is used to:
•Select a position on the chart.
•Select an item e.g. waypoint, on the chart.
•Pan the chart display.
Try using the trackpad now to move the cursor around the chart. You can use short presses on the trackpad to move the cursor small distances, or press and hold to move the cursor quickly.
As you move the cursor to the edge of the display, the display pans across the chart so that the area you have moved to remains in view. If you continue to scroll, the chart is redrawn on the screen at intervals.
If you move the cursor over an object for which there is information available, an Object Data Box appears at the top of the screen (see Chapter 2).
Dedicated Keys
These keys have fixed functions. Some keys can be used in two ways:
•Press: Press the key momentarily and then release it. This method is used for most key operations.
•Press and hold: Press the key and hold it down for the length of time stated (for example, 3 seconds), and then release it.
When you press a dedicated key, one of the following happens:
a)The associated operation is actioned, e.g. change chart scale (RANGE).
b)A pop-up menu is displayed, providing further options.
c)A set of soft keys is displayed, providing further functions.
As you press a key, a single audio beep confirms the key action. If the key-press is not valid for the current screen or mode, three rapid beeps sound to indicate that no response is available. If required, you can turn the key beeps off as part of your set up procedure (see Chapter 6).
The dedicated keys are defined in the illustration on page 9.
155_C1_1.p65 |
6 |
10/12/98, 11:31 |
Chapter 1: Introduction |
7 |
|
|
The Soft Keys
The four keys below the screen are called soft keys because their functions change according to the operation. The soft keys are grouped into related sets and subsets providing access to the various functions. The soft key labels are displayed on the screen just above the keys. The default soft keys are displayed until you press a key, or select an item on the screen; the soft keys associated with the action are then displayed.
You can control whether or not the soft key labels are displayed all the time, using the system set up as described in Chapter 6. If no labels are displayed, press one of the soft keys to make them appear. The labels disappear again if you do not press a key for 7 seconds.
Similarly to the dedicated keys, when you press a soft key one of the following happens:
a)The associated operation is actioned, e.g. GOTO.
b)A sub-set of soft keys is displayed, providing further functions.
c)A pop-up menu is displayed, providing further options.
d)The appropriate database list (route, waypoint or track) is displayed.
As with dedicated keys, when you press a key, a single audio beep confirms the key action. If the key-press is not valid for the current screen or mode, three rapid beeps sound to indicate that no response is available. If required, you can turn the key beeps off as part of your set up procedure (see Chapter 6).
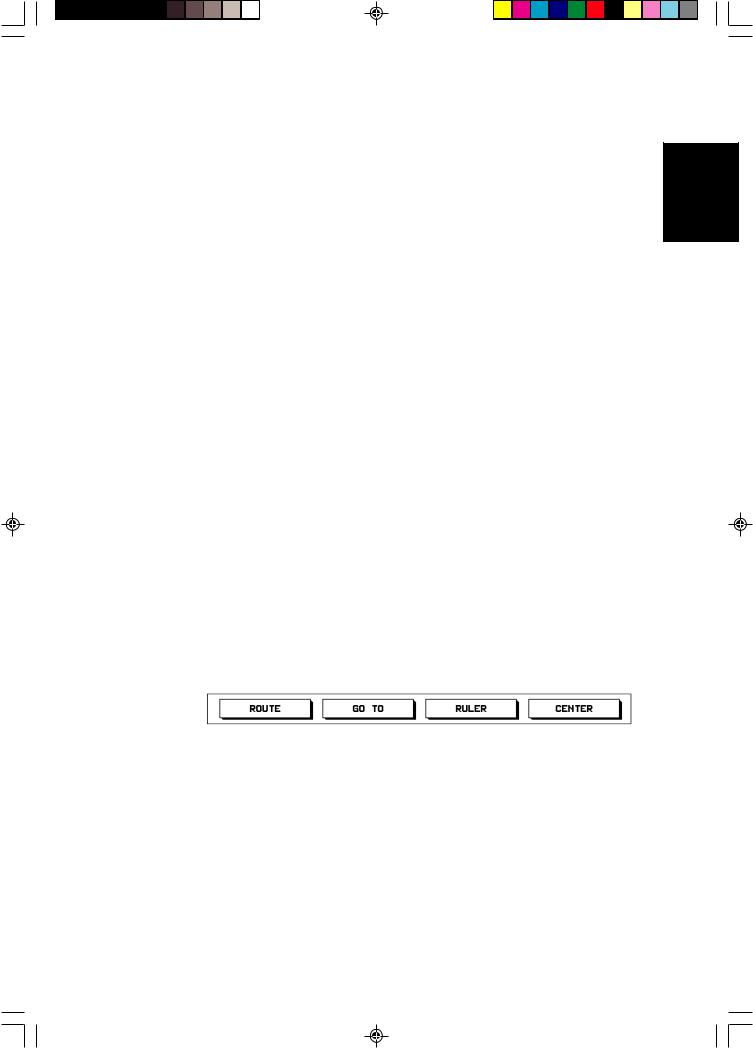
Soft Key Default Functions
In default mode, the soft keys provide a quick method of performing the tasks you will probably use most often, and which are described in detail in Chapter 3.
|
D3352-2 |
You use the soft keys to access the following functions: |
|
ROUTE |
Set up or edit an on-screen route of waypoints, and navigate |
|
towards them in turn |
GO TO |
Navigate towards a location you have indicated with the |
|
cursor |
RULER |
Measure distances and bearings on the chart |
CENTER |
Center the chart on the cursor, vessel or a specified position, |
|
or select Home Mode |
155_C1_1.p65 |
7 |
10/12/98, 11:31 |

8 |
RayChart 620 and 630 |
|
|
If different ssoft keys are displayed, press the CLEAR key to select the default functions.
Try using the CENTER key to center the chart on the cursor position:
1.Move the cursor to one side of the chart.
2.Press the CENTER soft key.
New soft key labels appear above the keys.
D3351-1
3.Press the CENTER CURSOR soft key.
The cursor and its current chart location both move to the center of the screen.
4.Press CLEAR to leave the option and return to the default screen, with the new chart position.
Other Soft Key Functions
In addition to the default softkeys, the dedicated keys MENU, EVENT, MARK, DISPLAY or POWER provide access to different functions; these functions have associated soft keys as shown in the illustration on page 9.
Press CLEAR to return to the default display.
Pop-Up Menus
Pop-up menus usually provide set up options. You use the trackpad to select an option from the menu, then use the appropriate dedicated key to set the option. An on-screen prompt tells you which dedicated key to use.
Database Lists
The waypoints, routes and tracks that you create on the chartplotter are stored in database lists. You can view these lists and select items for editing.
When a database list is on-screen, a set of associated soft keys is also displayed; you use the trackpad to select an item from the list, then use the appropriate soft key to edit the item. For example, you can delete a waypoint or a route.
155_C1_1.p65 |
8 |
10/12/98, 11:31 |

Chapter 2: Getting Started and Controlling the Chart Display |
11 |
|
|
Chapter 2: Getting Started and Controlling
the Chart Display
2.1 Introduction
This chapter provides information, instructions and simple exercises to get you started using the chartplotter. It will help you to become familiar with the chart display and the functions of the controls before you start using the chartplotter for routine navigation. It also explains how to change the lighting, how to use chart cards and how to control the chart display.
More detailed information on operating the chartplotter is given in Chapters 3, 4 and 5.
Text Conventions
Throughout this handbook, the dedicated (labelled) keys are shown in bold capitals; for example, MENU. The soft (unlabelled) key functions, menus and options are shown in normal capitals; for example, ROUTE.
Operating procedures, which may consist of a single key-press or a sequence of numbered steps, are indicated by the symbol in the margin.
The short exercises in this chapter are shown in italic type, like this paragraph.
Terms included in the glossary are shown in bold type.
2.2Turning the Chartplotter On and Off
To turn the chartplotter on and start operation: 1. Press and release the red POWER key.
The keys light up, and the display shows the last-used chart. Over this is the chartplotter status screen, which includes:
-Software version number
-Database version number
-Card number and description for each of the two card slots, if in use. After 10 seconds, the following caution is displayed:
CAUTION
The charts displayed on your Chartplotter are based on geographical data that C-MAP Believes to be accurate. However you should not rely on these displays as your primary source of navigation, rather your Chartplotter should be used only as a backup to official government charts and traditional methods of navigation.
Started
Getting
155_C2_1.p65 |
11 |
10/12/98, 11:31 |
12 |
RayChart 620 and 630 |
|
|
Note: You can now turn on and adjust the display backlighting and contrast, if required, as described later in Section 2.3.
2.When you have read the notice, press the CONTINUE soft key to clear the caution.
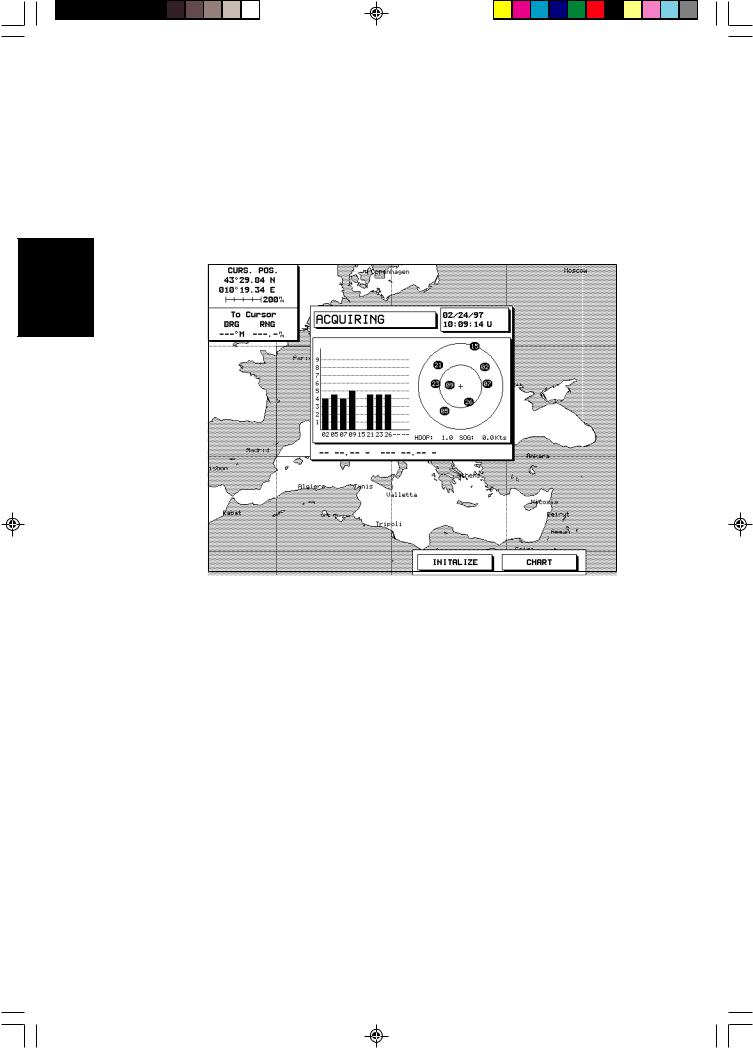
The Fix Status window, providing GPS status information as shown in the following example, is displayed.
the Turning
Chartplotter
Off and On
D3838-1
The right side of the window shows a representation of the satellite positions, with each satellite identified by a number. The bargraphs on the left indicate the signal strength for each of the currently located satellites. Initially, the chartplotter uses the predicted satellite positions, and the bargraphs are blank until the satellites are located.
The GPS searches for the strongest signals: at least four are required for an accurate position fix. If the signals from the currently located satellites are not strong enough, the GPS searches for other satellites and these are displayed in turn.
3.To clear the Fix Status window and display the chart, press the CHART soft key. (You can redisplay the Fix Status window later if required, as described in Chapter 6.)
If a position fix has not been established, a “Fix Alarm” message is displayed. You can clear the alarm by pressing any key. The unit will beep every few seconds to indicate there is no position fix, until the position has been established.
The soft keys INITIALIZE and BEACON can be used to initialize the GPS and to manually set up a differential beacon. These functions are described in
Chapter 6.
155_C2_1.p65 |
12 |
10/12/98, 11:31 |
Chapter 2: Getting Started and Controlling the Chart Display |
13 |
|
|
To turn the chartplotter off, press and hold the POWER key for three seconds. A countdown timer is displayed, and if you release the key before the timer reaches zero the chartplotter will remain on. Otherwise, when the timer reaches zero the chartplotter display is cleared and the key lights go off.
2.3Adjusting the Lighting and Contrast
You can change the level of screen backlighting and monochrome screen contrast.
•A 620 Chartplotter with a monochrome display has six brightness levels and 40 contrast levels.
•A 630 Chartplotter with colour display has six brightness levels and a day/ night view setting.
Note: The colour display lighting can be dimmed but cannot be turned off.
The control key lighting is bright when the screen backlighting is on.When the screen lighting is off, the keys are lit at a low level so you can always find the keys.
To change the backlighting and contrast:
1.Press the POWER key. (Do not press and hold the key, or the power-off message will be displayed.)
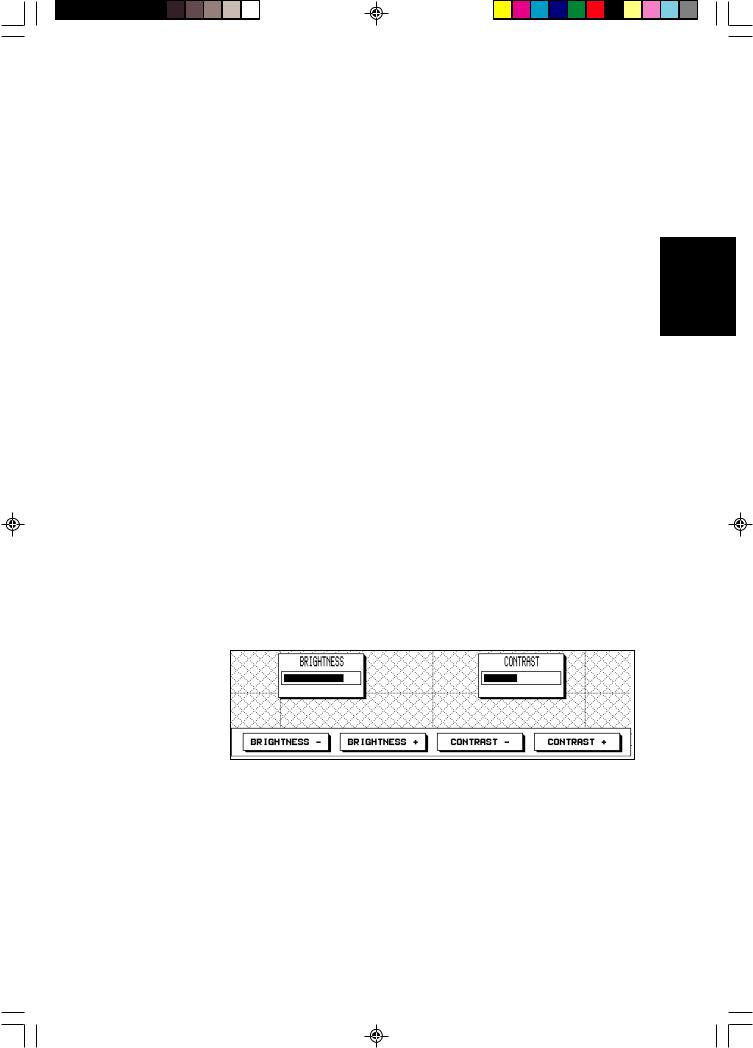
Two sliders appear on the monochrome screen, showing the current settings for brightness and contrast; the soft keys provide control of the sliders.
The brightness slider is displayed on the colour screen; the soft keys provide control of the slider and the night /day setting.
Contrast
Lighting and
Adjusting the
D3820-1
2.Press the appropriate soft key, to adjust the backlight brightness or the contrast to the required level. The brightness and contrast change as you adjust the sliders.
On the colour display, press the NIGHT VIEW/DAY VIEW soft key to toggle between the night and day setting.
3.Press ENTER to store the new settings and return to the standard display with default soft keys.
Alternatively, after several the seconds the lighting controls are removed and the screen returns to the standard display.
155_C2_1.p65 |
13 |
10/12/98, 11:31 |
14 |
RayChart 620 and 630 |
|
|
Using
Cards Chart
The new lighting and contrast levels are retained until you reset them or turn off the chartplotter.
At power-on, the monochrome screen lighting is always off, but the last-used contrast setting is retained.
The colour screen powers-on at the last used settings for brightness and night/ day view.
2.4 Using Chart Cards
The chartplotter has a built-in world map that can be used for route planning. Most areas are covered on a scale of about 500nm per inch on the screen (200nm per cm), although some populated areas have details down to 300nm per inch on the screen. The chartplotter displays a scale indicator on the screen for all chart displays.
To use the chatplotter as a navigation aid, charts with detailed information for the area you wish to navigate are required. These are available on C-MAP NT electronic chart cards (C-Cards), each of which can store as many as 20 charts in an electronic format. A single C-MAP chart normally provides as much information as is available in paper charts for that geographic area, with detail up to 0.05nm per inch.
The chartplotter allows you to install two chart cards at the same time. You can also use the slots for C-MAP Memory C-Cards, which allow you to store and retrieve data such as waypoints and routes.
Note: You can insert and remove cards while a chart is displayed. The chart information is retained until the chartplotter redraws the screen: for example, when you pan outside the current area, or use the RANGE key to change the chart scale.
Inserting a Chart Card
To insert a chart card:
1.Check that the card is the correct format (C-MAP NT C-Card), with the required chart stored on it.
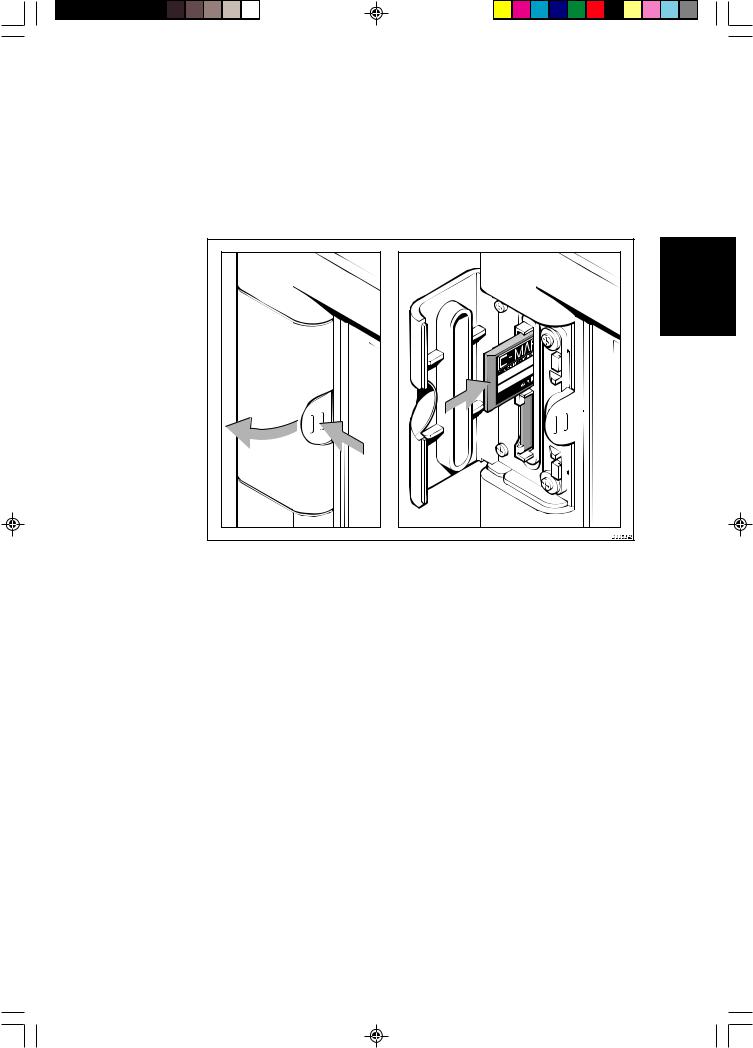
2.Open the card cover, at the top left of the chartplotter front panel, by pushing the latch to the left and then opening the cover as shown in the illustration on the following page.
3.Hold the card with the printed text pointing towards the right and the correct way up, as shown in the illustration.
4.Gently push the card into one of the two sockets. It will only go in if it is the right way round.
155_C2_1.p65 |
14 |
10/12/98, 11:31 |
Chapter 2: Getting Started and Controlling the Chart Display |
15 |
|
|
Push the card in as far as it will go, then move it to the left so that the top is under the retaining pegs. Release the card so that it is held in place by the pegs.
5.Close the card cover so that is clicks shut, to stop water splashing into the chartplotter.
Chart Cards
Using
Removing a Chart Card
To remove a chart card:
1.Open the card cover, at the top left of the chartplotter front panel, by pushing the latch to the left (see above).
2.Press down the card you wish to remove, and move the top of the card to the right to clear the retaining pegs.
3.Pull out the card.
Displaying the Chart Data
The new chart information will be displayed when you move the cursor into an area covered by the new chart or, if it is already in the area, change the range scale.
The boundary of each chart digitized in the current card is shown as a box or rectangle. (You can switch off the chart boundaries display if you wish, as part of the chartplotter setup described in Chapter 6.)
155_C2_1.p65 |
15 |
10/12/98, 11:31 |
Using
Cards Chart
16 |
RayChart 620 and 630 |
|
|
To zoom in:
1.Use the trackpad to move the cursor inside one of the chart boxes, and press the lower part of the RANGE key.
That area is expanded so that you can see more detail. Note that the smaller the chart box is on the screen, the greater the amount of detail that is available when you zoom in.
Unless you have turned on the Plotter Mode, you cannot zoom in further than the most detailed chart, and you cannot zoom out further than the world map.
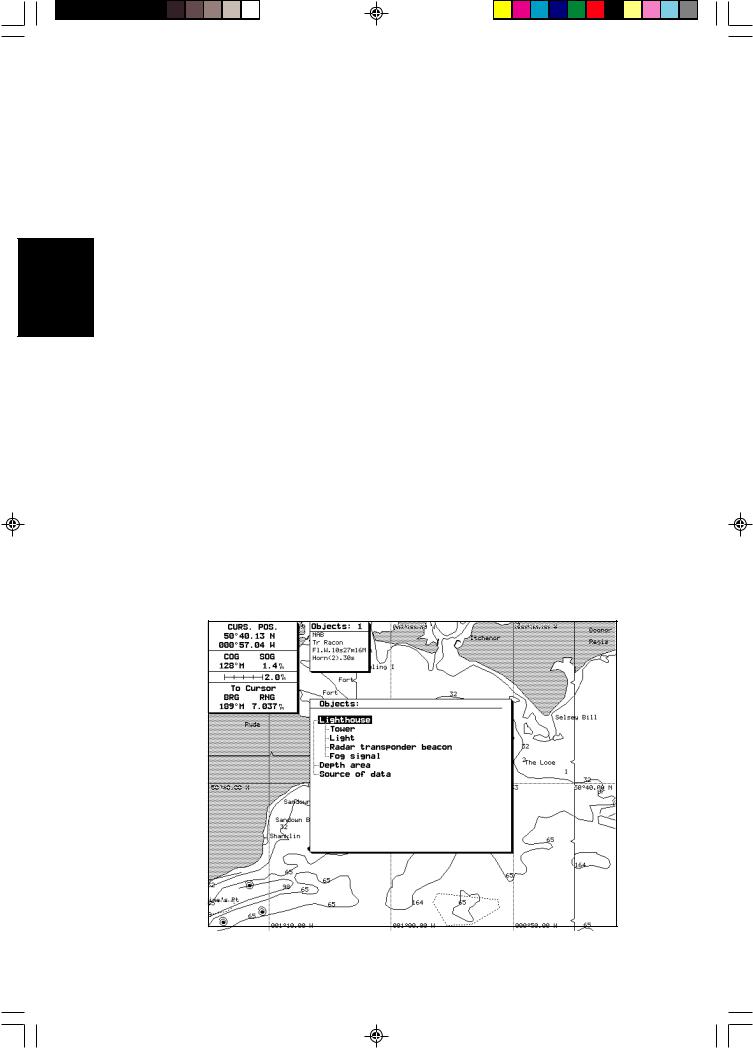
Displaying Information About Objects
Chart cards include a number of displayed objects for which information is available, such as lights and buoys. Chart source data is also available and, if your chart includes port and tide data, this can be displayed. You can use the cursor to identify the object and display detailed information. In addition, position information is available for waypoints and events added using the chartplotter functions.
To obtain the chart object information:
1.Move the cursor over the symbol for which you require the information. After a moment, an Object data box appears at the top of the screen, as shown at the top of the example below.
If the cursor is over more than one object for which information is available, the number of objects is shown and their descriptions are listed.
D3822-1
155_C2_1.p65 |
16 |
10/12/98, 11:31 |
Chapter 2: Getting Started and Controlling the Chart Display |
17 |
|
|
2.To view further details, press ENTER. The soft keys EXPAND, ALLINFO and NEAREST are displayed.
3.To obtain expanded information about the object(s):
a.Press the EXPAND soft key. The objects and any sub-objects are listed in a window in the center of the screen.
b.Use the trackpad to scroll up and down the list, and highlight the required object or sub-object.
c.Press ENTER. Any available information is displayed.
If there is more than one page of information for the object, you can page through it using the PAGE DN soft key, and go back to the beginning using the RESTART soft key.
d.Press CLEAR to return to the expanded list, and select another object if required.
e.Press CLEAR to clear the expanded information display, and return to the EXPAND and ALLINFO soft key display.
4.To obtain all the information available at this location:
a.Press the ALLINFO soft key.
The information is displayed in the same way as the expanded data, but includes additional information such as the depth range and the source of the data.
b. Press CLEAR to clear the detailed information display, and return to the EXPAND and ALLINFO soft key display.
5.To obtain port information for the nearest ports:
a.Press the NEAREST soft key. The port facility symbols are displayed.
b.Use the trackpad to highlight the facility for which you require information, then press ENTER.
c.The nearest ports providing that facility are listed, with distance and bearing to the port. If you highlight a port name, then press ENTER the cursor moves to that port (redrawing the chart) and the details for that facility are displayed.
d.Press CLEAR, the facility symbols for the selected port are displayed as described below.
6.Press CLEAR to return to the default display.
Chart Cards
Using
155_C2_1.p65 |
17 |
10/12/98, 11:31 |
Using
Cards Chart
18 |
RayChart 620 and 630 |
|
|
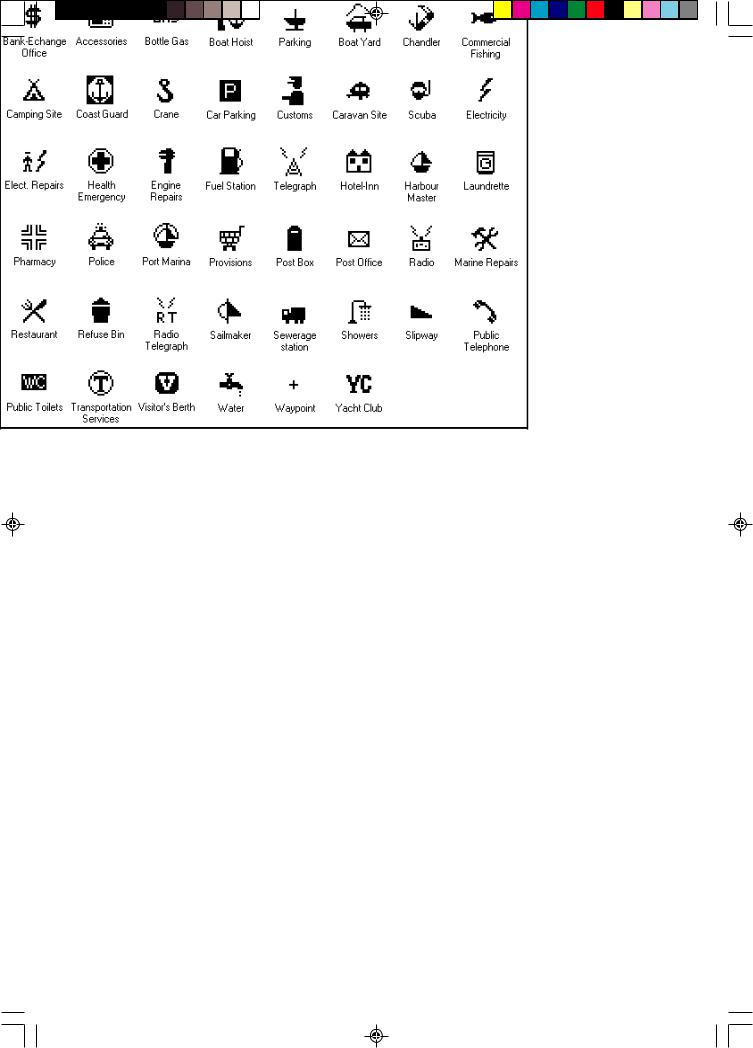
Port Area
At large chart scales port area information is indicated by the symbol  . Where available, details for each facility can be displayed. In some areas the chart shows symbols for individual facilities. The facilities and their associated symbols are defined below.
To obtain port facility details
1.Place the cursor over the port symbol  . The port facility symbols are displayed
2.Press ENTER to display the soft keys EXPAND, ALL INFO and NEAREST.
3.Press EXPAND or ALL INFO to list the port facilities in the object information pop-up.
4.Use the trackpad to highlight the required facility then press ENTER. The details for that facility are displayed.
5.Press CLEAR three times to return to the default display.
155_C2_1.p65 |
18 |
10/12/98, 11:31 |
Chapter 2: Getting Started and Controlling the Chart Display |
19 |
|
|
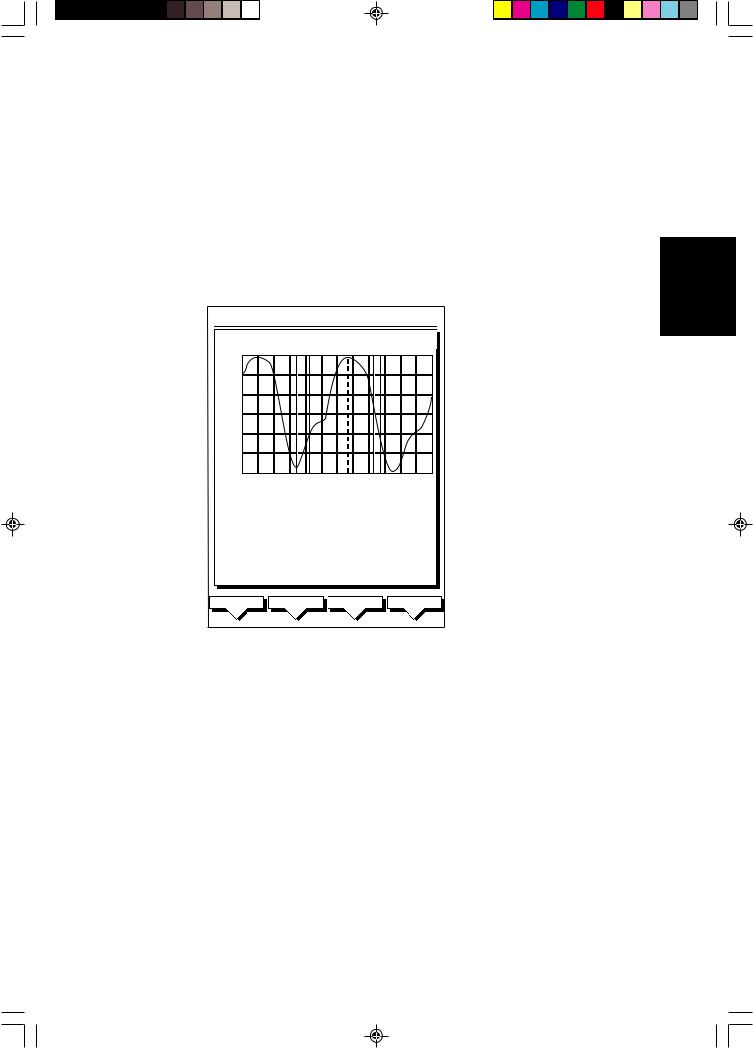
Tide Data
The symbol  indicates tide height data is available for that position on the chart.
To obtain tide height data:
1.Place the cursor over the tide symbol  . The tide height object data box and the soft keys EXPAND, ALL INFO and NEAREST are displayed.
2.Press EXPAND. The data is displayed as illustrated below.
CSR 50°49^05W BRG 304°T 6nm POS 001°18^00W RNG 27.70nm
CALSHOT CASTLE
4.61
3.96
3.31
2.66
2.01
1.36
0.710 2 4 6 8 10 12 14 16 18 20 22 24
|
CURSOR |
|
SELECTED DATE |
|
||||
|
TIME |
13:30 |
|
|
2/01/1998 |
|
||
|
HEIGHT |
|
4.06m |
|
|
|
||
|
|
|
|
|
|
|
||
|
|
|
|
|
||||
|
|
|
|
|
|
|
|
|
|
SUNRISE/SUNSET |
|
HIGH/LOW WATER |
|
||||
|
TWILIGHT |
0646 |
|
HIGH 0220 |
4.22m |
|
||
|
SUNRISE |
|
0807 |
|
LOW |
0640 |
0.88m |
|
|
SUNSET |
|
1611 |
|
HIGH 1400 |
4.10m |
|
|
|
TWILIGHT |
1732 |
|
LOW |
1900 |
0.76m |
|
|
|
|
|
|
|
|
|
||
|
|
|
|
|
|
|
|
|
SET DATE |
PREV. DAY |
|
TODAY |
NEXT DAY |
||||
|
|
|
|
|
|
|
|
|
D4270-1
The time and draught are represented by a dotted vertical and horizontal line on the graph. You can use the trackpad to move the lines; you move the vertical line to select a time for which the tide height is displayed.
You can use the soft keys and trackpad to change the date for which tide information is shown.
To select a time, press the left or right side of the trackpad to move the cursor to the required time.
To change the day press PREV. DAY, DAY or TODAY, as required. Alternatively, press SET DAY; to change date, use the trackpad to move the cursor left/right to select the digit and up/down to increase/decrease the digit. The graph and tide data are updated.
Chart Cards
Using
155_C2_1.p65 |
19 |
10/12/98, 11:32 |

the Controlling
Chart
20 |
RayChart 620 and 630 |
|
|
2.5 Controlling the Chart
You control the chart display using the cursor and control keys. You start all operations with the default soft keys displayed (this is referred to as the default screen in the following sections).
When you have completed an action using the soft keys sub-sets, to return to the default screen, press CLEAR; you may need to press CLEAR several times to back-track through the sub-set hierarchy.
Note: If you have set up your system so that the default soft keys are not displayed all the time, press any soft key to display the labels.
Although you can use your chartplotter with the whole screen devoted to the chart, you can also display navigation data in one or two windows, with the chart displayed in the rest of the screen. Navigation data windows are controlled using the DISPLAY key.
This section describes how to:
•Move around the chart by panning the display, changing the chart scale and changing the chart centre.
•Display navigation data.
Note: The orientation of your chart (North Up, Course Up or Head Up) depends on your choice when you set up the chartplotter, as described in Chapter 6.
The chart controls are summarised in the illustration on the page 9.
Moving the Chart
You will normally operate the chartplotter with the chart showing your vessel’s current location. In the default North-Up orientation, the display is in True Motion mode, in which the vessel moves across the screen. You will need to move the chart if your vessel moves out of the area currently displayed, or if you wish to examine or place marks/waypoints in another area.
There are three ways in which you can move the chart:
•Use the trackpad to move the cursor to the edge of the chart. The chart will pan across (see Section 1.3). This method is useful if the area you wish to see is only just off the screen.
•Use the RANGE key to zoom out to a small scale chart, move the cursor to the centre of the required area, then zoom in on the new area . This method is useful if the area you wish to see is a long way away.
•Use the CENTER soft key to center the chart on one of a choice of positions: the vessel’s position, the cursor position or a specified position .
•Automatically re-center the chart using the HOME option.
155_C2_1.p65 |
20 |
10/12/98, 11:32 |

Chapter 2: Getting Started and Controlling the Chart Display |
21 |
|
|
Note: If you have selected a chart display with one or two data windows, the chartplotter will treat the start of the data window as the edge of the chart.
Changing the Chart Scale
The RANGE key allows you to change the cartography scale so that you can see a smaller or larger area on the screen. Plotter mode is available to allow you to zoom into a smaller area, even when no chart data is available for that scale. Chapter 6 describes how to set plotter mode on/off.
You can change the chart scale for two purposes:
•To see either more detail (a smaller area) or a larger area on the screen
•To move the display to another area of the chart, by zooming out to a small scale chart, then zooming in on another area
Small scale charts give you the wider view, but without the level of detail that you may need in order to navigate safely. The amount of detail that is visible depends on the amount available for that chart, and also on how you have specified the cartographic detail when you set up your chartplotter (see Chapter 6).
To zoom in to a larger scale chart:
1.Use the trackpad to position the cursor in the area you wish to see in more detail.
2.Press the lower part of the RANGE key.
The section of the chart around the cursor is enlarged to fill the screen with a larger-scale chart showing more detail. The cursor is now positioned in the center of the screen.
The range scale indicated at the top left of the screen is updated.
Note: If you hold down the RANGE key, the range scale display is updated quickly without the chart being redrawn. Simply release the key when the required scale is shown, and the chart will then be updated.
3.If further chart enlargement is available using the current chart card you can press the bottom of the RANGE key to zoom in again, repositioning the cursor first if required.
An area of further chart detail is indicated by a box around the area.
4.When no further chart detail is available, as you press the bottom of the RANGE key, the effect depends on whether you have set Plotter Mode on or off as follows:
-If Plotter Mode is off (the default setting), the chartplotter beeps three times and the range scale remains unchanged.
-If Plotter Mode is on, the range scale is increased and the display shows grid lines and no cartography. The letter “P” is displayed after the scale rule
Controlling the Chart
155_C2_1.p65 |
21 |
10/12/98, 11:32 |
the Controlling
Chart
22 |
RayChart 620 and 630 |
|
|
to indicate that the chartplotter is in Plotter Mode.
The cartographic information is restored when you return to a chart scale for which the information is available.
To zoom out to a smaller scale chart, simply press the upper part of the RANGE key as many times as required. If no smaller scale chart is available, then the chartplotter beeps three times when you press the upper part of the
RANGE key.
Changing the Chart Center
You can move a chosen point to the center of the chart, using the CENTER soft key. The chosen point can be the vessel’s position, the cursor position or a specified position.
You can also select Home Mode, which centers the vessel, homes the cursor and changes the cursor data box to provide information about your vessel’s position.
Note: Changing the range scale always centers the chart on the cursor.
Centering the Chart
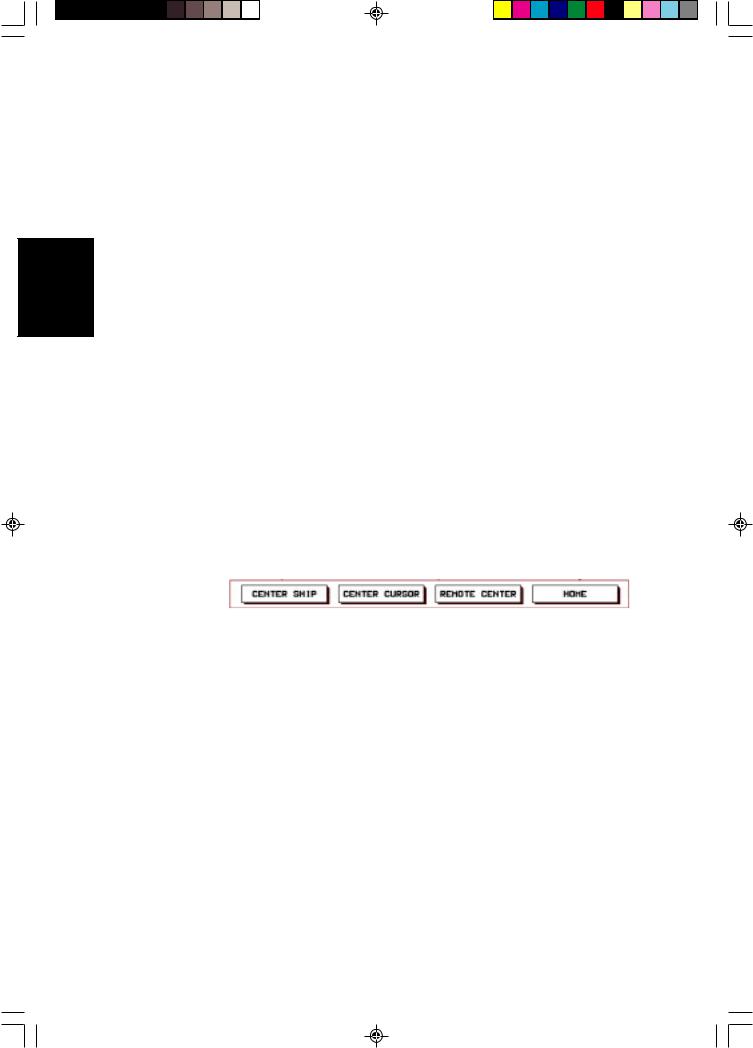
To center the chart using the CENTER options:
1.From the default soft key display, press the CENTER soft key. The following soft keys are displayed:
D3351-1
2.Press the soft key for the center option you require (or CLEAR to return to the default screen without change):
-CENTER SHIP moves the chart so that your vessel’s position is at the centre of the chart, and repositions the cursor so that it is over the vessel
-CENTER CURSOR moves the chart so that the point you selected with the cursor is at the centre of the chart
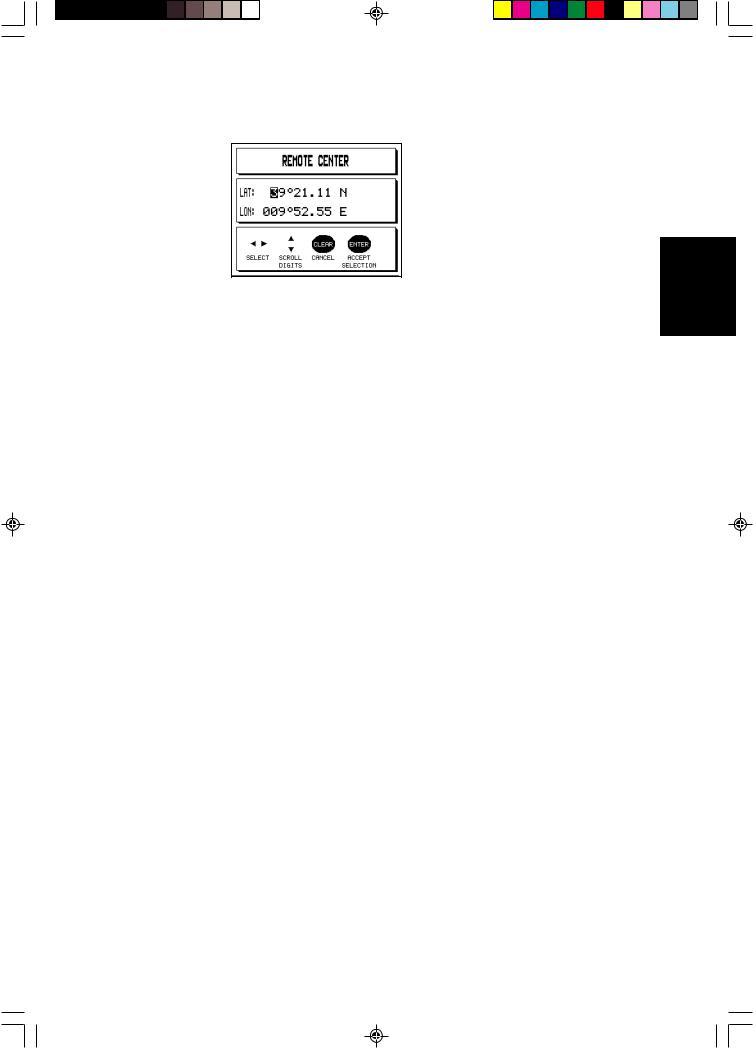
-REMOTE CENTER provides a box for you to enter the position for the new center
-HOME moves the chart so that your vessel’s position is at the centre of the chart, and enters Home Mode (see below)
3.If you pressed REMOTE CENTER, the box displays the current cursor position, as latitude and longitude or TDs depending on your system.
155_C2_1.p65 |
22 |
10/12/98, 11:32 |
Chapter 2: Getting Started and Controlling the Chart Display |
23 |
|
|
D3821-1
Change the values to the required position, as follows:
a.Move the cursor to the first digit you wish to change, using the left or right trackpad controls. When you move right from the latitude direction, the cursor moves to the first longitude digit.
b.Increase or decrease the number, using the up or down trackpad controls.
c.Repeat steps a and b until all the digits are set to the required values.
d.Press ENTER to set the position.
4.The display returns to the CENTER soft keys display, with the new chart position. Press CLEAR to return to the default display.
Using Home Mode
When you select the HOME option, the chartplotter centres the vessel and changes to Home Mode. In this mode:
•The cursor is not displayed, and is fixed to the vessel’s position
•The cursor data box displays the vessel’s current position; if you are tracking to a waypoint, it also displays the waypoint name, bearing and range
•In Head Up or Course Up modes (see Chapter 6), the display changes to Relative Motion, in which the chart moves to keep the vessel in the centre of the display.
To return to the standard cursor and motion mode, press the trackpad. The cursor re-appears and the cursor data box displays the cursor position data.
Controlling the Chart
155_C2_1.p65 |
23 |
10/12/98, 11:32 |

the Controlling
Chart
24 |
RayChart 620 and 630 |
|
|
Displaying Navigation Information
Although you can use your chartplotter with the whole screen devoted to the chart, you also have the option of displaying a wide range of navigational data.
This information is normally presented in one or two windows, with the chart displayed in the rest of the screen. Three options are available for displaying navigatinal data:
•Chart displayed Full Screen, with no additional data.
•Chart displayed with pre-defined navigational data in one or two Windows.
•Chart with Navigation insert displaying Bearing Deviation Indicator (BDI) or Coarse Deviation Indicator (CDI).
The navigational data windows are controlled using the DISPLAY key. When you press the DISPLAY key, the following prompt is displayed, with the lastused option highlighted:
|
D3839-1 |
Press DISPLAY to toggle between the two settings: |
|
CHART |
Displays the last used option used last – Full Screen chart, or chart |
|
with window. |
|
The soft keys let you toselect a FULL screen chart,or a chart with the |
|
current WINDOW(s) configuration. If Windows are selected, you |
|
can change the window configuration. |
NAV |
Displays the chart and inserts the last-used navigation indicator at the |
|
bottom right of the screen. You can use the soft keys to select a BDI |
|
or CDI display. |
The soft key labels disappear after 7 seconds if you do not make a selection.
The display options are described in more detail in the following sections.
Chart
The Chart soft keys let you select either a Full Screen chart or a chart with data window(s). When you press the DISPLAY key to select the CHART option, the last used configuration is displayed.
Ten navigational data windows are available for display; six are pre-defined and supplied with the chartplotter, in addition four can be customized as part of your set up procedure, described in Section 6.3. You can display one or two data windows and select the window position.
155_C2_1.p65 |
24 |
10/12/98, 11:32 |
Chapter 2: Getting Started and Controlling the Chart Display |
25 |
|
|
The windows soft keys disappear after seven seconds if you do not make a selection.
If you wish to change the display again, press DISPLAY. The soft keys are redisplayed.
Changing between Full Screen and Windows
You can change between the full screen display and windows display using the soft keys as follows:
FULL |
Clears any data windows . |
WINDOW |
Displays the chart with navigational data, in the |
|
current default windows configuration. |
Press CLEAR to return to the default soft key display (if selected in your setup selection, see Chapter 6).
Changing the Window Setup
The WINDOW SET UP soft key lets you change the window configuration. You can select:
•The number of windows (1 or 2)
•The position of the windows on the screen
•The contents of the windows, by selecting from the list of predefined or customized windows available
Note: If the help level is set to Level 1 (the factory setting), the windows are moved up the screen so that they do not overlap the default soft keys. This means that you cannot select two windows in a full-height column: if you wish to do so, you must change the help setting to Level 0, as described in Chapter 6.
To change the default window configuration:
1.Press DISPLAY to display the Chart soft keys (see above).
2.If a window is not already displayed, press the WINDOW soft key.
3.Press the WINDOW SET UP soft key to display the selection keys and current settings, as shown in the following example.
Controlling the Chart
155_C2_1.p65 |
25 |
10/12/98, 11:32 |

26 |
RayChart 620 and 630 |
|
|
the Controlling
Chart
D3833-1
4.Use the two left-hand soft keys to select the number and location of the windows. You can select:
-One window at the bottom left of the chart display
-One window at the bottom right of the chart display
-Two windows, one above the other, in a full-height column at the right of the chart display
The display changes as you highlight the different settings.
5.Use the SELECT LEFT WINDOW or SELECT RIGHT WINDOW soft key to scroll through the available data sets for the window.
Each time you press SELECT WINDOW, the next available set of data is displayed in the current window. These sets include the six default windows supplied with your chartplotter, plus the four custom windows you can set up as part of your display setup procedure (see Chapter 6).
6.When you are happy with your selections, press ENTER to return to the Display Selection screen.
Alternatively, press CLEAR to cancel your selections and retain the previous default configuration.
7.Press ENTER, or wait 7 seconds, to return to the defaults display.
Navigation
The NAVigation display soft keys let you to select a chart display with either of the following:
•CDI, the Course Deviation Indicator, which shows off-course error as the distance your vessel is from the current track
•BDI, the Bearing Deviation Indicator, which shows off-course error as the difference between your vessel’s heading and the bearing to waypoint
When you press the DISPLAY key to select the NAV option, the indicator you
155_C2_1.p65 |
26 |
10/12/98, 11:32 |
 Loading...