


Garmin GPSMAP 557xs, GPSMAP 557, GPSMAP 556s, GPSMAP 556, GPSMAP 551 Manual
...
GPSMAP® 400/500 Series
Weather and XM Satellite Radio
supplement
© 2011 Garmin Ltd. or its subsidiaries
All rights reserved. Under the copyright laws, this manual may not be copied, in whole or in part, without the written consent of Garmin. Garmin reserves the right to change or improve its products and to make changes in the content of this manual without obligation to notify any person or organization of such changes or improvements. Go to www.garmin.com for current updates and supplemental information concerning the use of this product.
Garmin®, the Gamin logo, GPSMAP®, BlueChart®, GDL®, and g2 Vision® are trademarks of Garmin Ltd. or its subsidiaries, registered in the USAand other countries. These trademarks may not be used without the express permission of Garmin. DAFIF™ is a trademark of the National Geospatial-IntelligenceAgency. XM® and XM WX Satellite Weather® are registered trademarks of XM Satellite Radio Inc.

Introduction
‹ WARNING
See the Important Safety and Product Information guide in the product box for product warnings and other important information.
This manual includes XM WX Satellite Weather®, cellular Global System for Mobile communication (GSM) weather, and XM® satellite radio information for the following products:
GPSMAP® 431 |
GPSMAP 431s |
GPSMAP 441 |
GPSMAP 441s |
GPSMAP 531 |
GPSMAP 531s |
GPSMAP 536 |
GPSMAP 536s |
GPSMAP 541 |
GPSMAP 541s |
GPSMAP 546 |
GPSMAP 546s |
Cellular Equipment Requirements
To use cellular weather, you must have a cellular GSM antenna such as the Garmin GDL 40. To connect your chartplotter to a cellular antenna, refer to the installation instructions for the antenna.
XM Equipment Requirements
To use XM WX Satellite Weather, you must have a Garmin XM satellite weather receiver. To use XM Satellite Radio, you must have a Garmin XM satellite radio receiver. Go to www.garmin.com/xm for more information. To connect the XM antenna and receiver and for subscription instructions, refer to the instructions for your XM equipment.
Introduction
Contacting Garmin Product Support
Contact Garmin Product Support if you have any questions about this product.
•In the USA, go to www.garmin.com/support, or contact Garmin USAby phone at (913) 397.8200 or (800) 800.1020.
•In the UK, contact Garmin (Europe) Ltd. by phone at 0808 2380000.
•In Europe, go to www.garmin.com/support and click Contact Support for in-country support.
Simulator Mode
Simulator mode provides simulated weather data.
GPSMAP 400/500 Series Weather Supplement |
i |

Table of Contents |
|
Table of Contents |
|
Introduction.......................... |
i |
Cellular Equipment |
|
Requirements............................ |
i |
XM Equipment Requirements...... |
i |
Contacting Garmin Product |
|
Support...................................... |
i |
Simulator Mode............................ |
i |
XM WX Satellite Weather |
|
and Cellular Weather.......... |
1 |
Cellular Weather........................ |
1 |
XM WX Satellite Weather........... |
1 |
Weather Features...................... |
1 |
Weather Data Broadcasts.......... |
2 |
Status Messages........................ |
2 |
Viewing Precipitation |
|
Information............................... |
2 |
Switching Weather Charts.......... |
3 |
Storm Cell and Lightning |
|
Information............................... |
3 |
Hurricane Information................. |
4 |
XM Satellite Radio............. |
15 |
Weather Warnings and Weather |
Using XM Radio....................... |
15 |
|
Bulletins................................... |
4 |
XM Radio Bar........................... |
16 |
Forecast Information.................. |
5 |
Appendix............................ |
17 |
Viewing Sea Conditions............. |
6 |
Weather Data Warranty............ |
17 |
Viewing Fishing Information....... |
8 |
Software License Agreement... |
18 |
Visibility Information................... |
9 |
Weather Warnings and Weather |
|
Viewing Buoy Reports.............. |
10 |
Bulletin Color Shading |
19 |
Viewing Local Weather |
|
||
|
XM Satellite Radio Service |
|
|
Information near a Buoy........ |
10 |
20 |
|
Creating a Waypoint on the |
|
Agreement............................. |
|
|
Index |
21 |
|
Forecast Chart....................... |
10 |
||
About the Weather Overlay....... |
11 |
|
|
Weather Alarms........................ |
13 |
|
|
Selecting a Cellular or XM |
|
|
|
Antenna................................. |
14 |
|
|
Selecting an External Cellular |
|
|
|
Antenna................................. |
14 |
|
|
Viewing Weather Subscription |
|
|
|
Information............................. |
14 |
|
|
ii |
GPSMAP 400/500 Series Weather Supplement |

XM WX Satellite Weather and Cellular
Weather
‹ Warning
The weather information provided through this product is subject to service interruptions and may contain errors, inaccuracies, or outdated information, and consequently should not be relied upon exclusively.Always use common sense while driving or navigating, and check alternate weather information sources prior to making safety-related decisions. You acknowledge and agree that you shall be solely responsible for use of the weather information and all decisions taken with respect to driving or navigating in weather. Garmin will not be responsible for any consequences of using the weather data.
Cellular Weather
Cellular weather provides data through wireless service providers.An antenna, such as the Garmin GDL® 40, communicates with nearby cellular towers to receive the weather data. The weather data for each feature comes from reputable weather data centers such as the National Oceanic andAtmosphericAdministration (NOAA) National Weather Service, Environment Canada, and Météo-France.
To view cellular weather, you must initially select an annual subscription service online at http://my.garmin.com. You may purchase a day pass directly from the chartplotter.Aday pass provides 24 hours of continuous weather data. Refer to the antenna installation instructions or the instructions at http://my.garmin.com to activate this service.
XM WX Satellite Weather and Cellular Weather
XM WX Satellite Weather
AGarmin XM satellite weather receiver and antenna receives XM WX Satellite Weather data and shows it on various Garmin devices, including the Navigation chart on a chartplotter. The weather data for each feature comes from reputable weather data centers such as the National Weather Service and the Hydrometeorological Prediction Center. For more information, go to the XM WX Satellite Weather Web site at www.xmwxweather.com.
To view XM WX Satellite Weather information, you must have a subscription to XM WX Satellite Weather, and you must have a Garmin XM satellite weather receiver connected to a chartplotter.
Weather Features
Feature |
XM WX |
Cellular |
|
Satellite |
Weather |
|
Weather |
|
Type of Precipitation (page 2) |
X |
X |
Satellite Cloud Cover (page 3) |
X |
X |
European, Canadian, and USARadar (page 3) |
X |
X |
Lightning (page 3) |
X |
X |
Severe Storm Tracks (page 4) |
X |
|
Canada and USAWarnings (page 4) |
X |
X |
Hurricane Track (page 4) |
X |
X |
Surface WXAnalysis (page 5) |
X |
|
Sea Surface Pressure Forecast (page 8) |
X |
X |
GPSMAP 400/500 Series Weather Supplement |
1 |

XM WX Satellite Weather and Cellular Weather
Feature |
XM WX |
Cellular |
|
Satellite |
Weather |
|
Weather |
|
City Forecasts (page 6) |
X |
X |
Surface Wind Vectors (page 7) |
X |
X |
Wave Direction and Wave Direction Forecast |
X |
X |
(page 7) |
|
|
Wave Height and Wave Height Forecast (page 7) |
X |
X |
Wave Period and Wave Period Forecast (page 7) |
X |
X |
Forecasting Fish Locations (page 9) |
X |
|
Visibility (page 9) and Visibility Forecast (page 10) |
X |
|
National Weather Station Marine Local Forecast |
X |
X |
(page 10) |
|
|
Buoy Data (page 10) |
X |
X |
Sea Surface Temperature and Sea Surface Pressure |
X |
X |
(page 10) |
|
|
Weather Data Broadcasts
Satellite weather data is broadcast at set intervals. For example, XM weather radar data is broadcast at five-minute intervals. Cellular weather data is broadcast at fifteen-minute intervals. When the Garmin receiver is turned on, or when a different weather feature is selected, the receiver has to receive new data before it can be shown. You might experience a delay before weather data or a different feature appears on the chart.
Note:Any weather feature can change in appearance if the source that provides the information changes.
When you purchase cellular weather data or when the chartplotter automatically requests a cellular weather update, the current boat position is transmitted, and your chartplotter then receives weather data for your area centered around your current location.
Status Messages
When viewing a weather chart, a status message, such as one of the following, may be displayed in the upper-left corner.
Buy WX—you must purchase a day pass or a subscription to view weather data.
Register—you must register your cellular antenna before you can purchase and view cellular weather data. If you see this message after registering your antenna, shut down your system and then turn it back on.
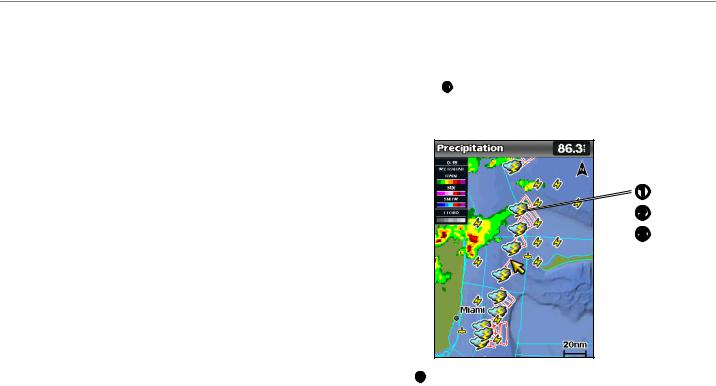
Viewing Precipitation Information
Precipitation ranging from very light rain and snow, up to strong thunderstorms, is indicated in varying shades and colors. Precipitation is shown either independently or with other weather information.
From the Home screen, select Information > Weather > Precipitation.
The time stamp in the upper-left corner of the screen indicates the elapsed time since the weather data provider last updated the information.
2 |
GPSMAP 400/500 Series Weather Supplement |
Showing an Animated Radar Loop
You can view precipitation information as an image of the latest update or as an animated loop of the latest updates.
From the Home screen, select Information > Weather > Precipitation > MENU > NEXRAD Loop > On.
The time stamp in the upper-left corner of the screen indicates the elapsed time since the service provider generated the weather radar frame currently displayed on the screen.
Showing Cloud Cover
Cloud cover can be shown or hidden. XM weather data provides the height of the cloud tops.
Cellular weather displays clouds based on cloud-top temperatures as detected by infrared satellites. Deeper shades of gray represent colder clouds often found with cirrus or thunderstorm clouds. Lighter shades or lack of shading indicate warmer clouds usually associated with stratus or fog.
From the Home screen, select Information > Weather > Precipitation > MENU > Cloud Cover > Show.
Switching Weather Charts
You can change from one type of weather chart to a different chart.
1.From the Home screen, select Information > Weather.
2.Select a weather chart.
3.Select MENU > Change Weather.
4.Select a different weather chart.
XM WX Satellite Weather and Cellular Weather
Storm Cell and Lightning Information
NOTE: Storm cell information is available only if you are receiving XM WX Satellite Weather data. It is not available if you are receiving only cellular weather data.
Storm cell icons on the weather Precipitation chart indicate both the present position of a storm and the projected path of that storm in the immediate future.


Red cones appear with a storm cell icon, and the widest part of each cone points in the direction of the projected path of the storm cell. The red lines in each cone indicate where the storm will most likely be in the near future. Each line represents 15 minutes.
GPSMAP 400/500 Series Weather Supplement |
3 |
XM WX Satellite Weather and Cellular Weather
Lightning strikes are represented by lightning bolt icons . Lightning appears on the weather Precipitation chart if strikes were detected within the last seven minutes. The ground-based lightning detection network detects cloud-to-ground lightning only.
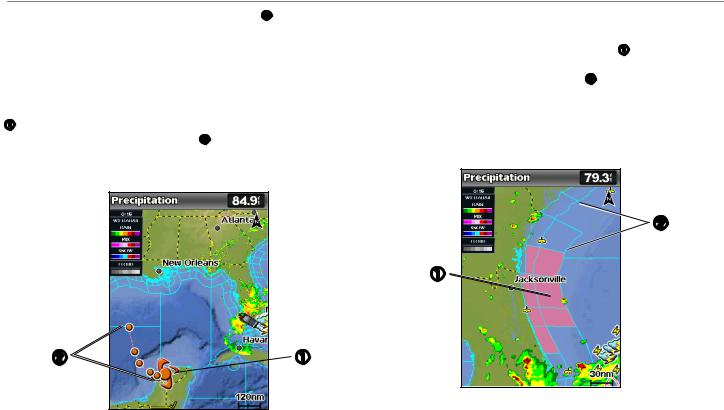
Hurricane Information
The weather Precipitation chart can show the present position of a hurricane, a tropical storm, or a tropical depression.Ared line stemming from a hurricane icon indicates the projected path of the hurricane. Darkened dots on the red line indicate the projected locations through which the hurricane will pass, as received from the weather data provider.
Weather Warnings and Weather Bulletins
When a marine weather warning, weather watch, weather advisory, weather bulletin, or other weather statement is issued, shading indicates the area to which the information applies. To view information about the warning or bulletin, select the shaded area. The aqua lines on the chart indicate the boundaries of marine forecasts, coastal forecasts, and offshore forecasts.
Weather bulletins may consist of either weather watches or weather advisories.
See theAppendix (page 19) to view a list of color shading descriptions.

4 |
GPSMAP 400/500 Series Weather Supplement |
Forecast Information
The Forecast chart shows city forecasts, marine forecasts, warnings, hurricane warnings, METARS, county warnings, weather fronts and pressure centers (XM data only), surface pressure, and WX buoys.
Viewing Present Forecast Information
From the Home screen, select Information > Weather > Forecast.
Viewing Forecast Information for Another Time Period
NOTE: This feature is available only if you are receiving XM WX Satellite Weather data. It is not available if you are receiving only cellular weather data.
1.From the Home screen, select Information > Weather > Forecast.
2.Complete an action:
•To view the weather forecast for the next 12 hours, select right on the Rocker, and to view forecasts up to 48 hours, in 12-hour increments, select right on the Rocker again.
•To view the weather forecast for the previous 12 hours, select left on the Rocker, and to view previous forecasts, up to 48 hours ago, in 12hour increments, select left on the Rocker again.
Viewing a Marine Forecast or an Offshore Forecast
1.From the Home screen, select Information > Weather > Forecast.
2.Select MENU > Start Panning.
3.Pan the chart to an offshore location.
The Marine Forecast or Offshore Forecast options appear when forecast information is available.
4.Select Marine Forecast or Offshore Forecast.
XM WX Satellite Weather and Cellular Weather
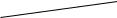
Weather Fronts and Pressure Centers:
NOTE: This feature is available only if you are receiving XM WX Satellite Weather data. It is not available if you are receiving only cellular weather data.
Weather fronts appear as lines that indicate the leading edge of an air mass.
Front Symbol |
Description |
|
Cold front |
|
Warm front |
|
Stationary front |
|
Occluded front |
|
Trough |
Pressure-center symbols often appear near weather fronts.
PressureDescription Center
Symbol
Indicates a low-pressure center, which is a region of relatively lower pressure. Moving away from a low-pressure center results in increased pressure. Winds flow counterclockwise around lowpressure centers in the northern hemispheres.
Indicates a high-pressure center, which is a region of relatively higher pressure. Moving away from a high-pressure center results in decreased pressure. Winds flow clockwise around high-pressure centers in the northern hemispheres.
GPSMAP 400/500 Series Weather Supplement |
5 |
 Loading...