


Ingersoll Rand
System Automation
VX Accessory Box
Visualization Software Manual
Before installing or starting this unit for the first time, this manual should be studied carefully to obtain a working knowledge of the unit and or the duties to be performed while operating and maintaining the unit.
RETAIN THIS MANUAL WITH UNIT. This Technical manual contains IMPORTANT SAFETY DATA and should be kept with the unit at all times.
More Than Air. Answers.
Online answers: http://air.ingersollrand.com
C.C.N. |
: 80445091 |
REV. |
: A |
DATE |
: APRIL 2009 |

Section 1 - Table of contents
Section 1 - Table of contents.............................. |
2 |
||
SECTION 2 - INTRODUCTION....................................... |
3 |
||
SECTION 3 - GETTING STARTED.................................. |
4 |
||
3.1 |
Commissioning Procedures.......................... |
4 |
|
3.2 |
Connecting to a VX Box via PC..................... |
4 |
|
SECTION 4 - LOGIN......................................................... |
8 |
||
4.1 |
Login Process.......................................................... |
8 |
|
4.2 |
Default Accounts................................................. |
9 |
|
SECTION 5 - NAVIGATION........................................... |
10 |
||
5.1 |
Title Bar..................................................................... |
10 |
|
5.2 |
Tab Navigation...................................................... |
10 |
|
SECTION 6 - SYSTEM OVERVIEW............................... |
12 |
||
6.1 |
The System Overview Screen....................... |
12 |
|
|
6.1.1 Title Bar - The Event Log................................ |
12 |
|
|
6.1.2 |
Title Bar - The Service Utility..................... |
14 |
6.2 |
The Dashboard..................................................... |
16 |
|
6.3 |
Configurable I/O................................................. |
17 |
|
6.4 |
System Efficiency Gauge................................ |
17 |
|
6.5 |
X8I/X12I Interface................................................. |
18 |
|
|
6.5.1 |
X8I/X12I Controls............................................... |
18 |
|
6.5.2 |
Table Configuration and Control....... |
18 |
|
6.5.3 |
Pressure Schedule Control...................... |
20 |
6.6 |
Compressor Status Overview..................... |
20 |
|
6.7 |
System Detail View.............................................. |
21 |
|
|
6.7.1 |
Performance Report Utility..................... |
21 |
|
6.7.2 |
Pressure Schedule........................................... |
22 |
|
6.7.3 |
Graphing Utility................................................ |
23 |
|
6.7.4 |
Archiving Historical Data.......................... |
25 |
SECTION 7 - EQUIPMENT OVERVIEW....................... |
29 |
||
7.1 |
Equipment Overview......................................... |
29 |
|
7.2 |
Compressor Detail View................................. |
30 |
|
|
7.2.1 |
Compressor Status.......................................... |
30 |
|
7.2.2 |
Compressor Nameplate Data.................... |
31 |
7.2.3User Configurable Compressor Data..32
7.2.4 |
Manual Start/Stop Control..................... |
32 |
7.3 |
Equipment Detail View - I/O Box.................. |
33 |
|
7.4 |
Equipment Detail View - Intelliflow....... |
34 |
|
SECTION 8 - CONFIGURATION OVERVIEW.............. |
36 |
||
8.1 |
Configuration Overview................................ |
36 |
|
8.2 |
X8I/X12I System Setup......................................... |
36 |
|
|
8.2.1 |
System Configuration................................... |
37 |
|
8.2.2 |
User Configurable Data Items................. |
38 |
8.3 |
Compressor Setup.............................................. |
39 |
|
|
8.3.1 |
Compressor Configuration....................... |
39 |
|
8.3.1.1 |
Compressor Model Information................... |
40 |
|
8.3.1.2 |
Compressor Nameplate Data........................... |
41 |
|
8.3.1.3 |
Additional Data Items.......................................... |
41 |
8.4 |
I/O Box and Intelliflow Setup................... |
46 |
|
8.4.1I/O Box and Intelliflow IX
|
|
Configuration..................................................... |
46 |
|
8.4.1.1 |
Analog Input Configuration.......................... |
47 |
|
8.4.1.2 |
Relay Output Configuration........................... |
48 |
|
8.4.1.3 |
Digital Input Configuration............................ |
48 |
8.5 |
Account Management.................................... |
48 |
|
8.6 |
Diagnostics............................................................ |
51 |
|
8.6.1Serial Communications Diagnostics..52
|
8.6.2 |
Software Versions........................................... |
53 |
|
8.6.3 |
VX Box Connectivity........................................ |
53 |
|
8.6.4 |
Ethernet Configuration.............................. |
53 |
8.7 |
VX Options Screen............................................... |
54 |
|
|
8.7.1 |
Graph Scaling – Defined Variables....... |
54 |
8.7.2Graph Scaling – Selectable Variables55
8.7.3 |
Language................................................................ |
55 |
8.7.4 |
Date and Time....................................................... |
55 |
SECTION 2 - INTRODUCTION
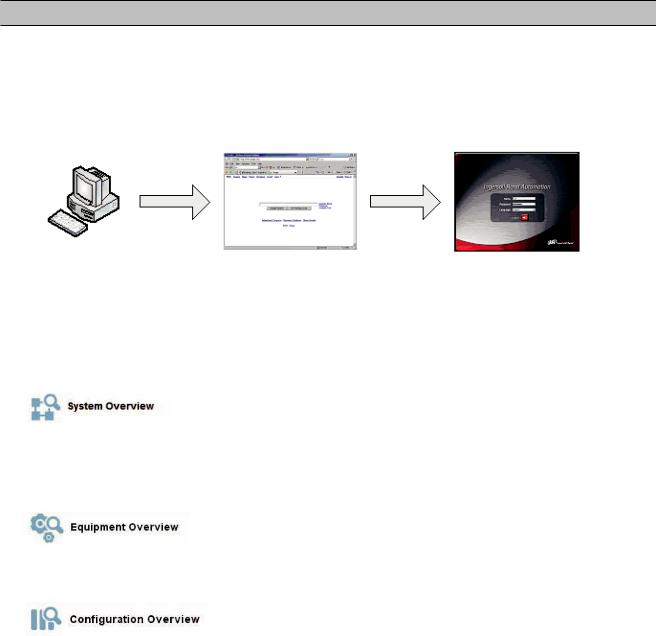
Ingersoll Rand System Visualization offers a window into a compressed air system by adding a VX Module to an X8I or X12I control network and using only a web browser on your PC. The VX Box incorporates hardware and software to allow monitoring of the X8I and X12I Automation system as well as all connected equipment. The software allows you to monitor your air system at a glance or take a more detailed look into system operation, equipment status and setup through an intuitive web-page based user interface. To access the application running on the VX Box, simply connect via a Web Browser from any PC using an Ethernet connection.
The VX Box connects to the X8I or X12I controller via the two-wire RS485 network. The VX Box is suitable for wall mounting and can be located up to 4,000 ft. (1,219 m) from the X8I or X12I unit. The VX Box connects to the customer’s PC or LAN via Ethernet, using a RJ45 connector, Cat5e 10/100Base T cable.
The PC can be local “stand alone” or part of a LAN. The VX Box is fully field configurable using standard screen templates.
The visualization interface is broken down into three major segments:
Monitor and adjust important air system data such as air system pressure and efficiency, air system set points, status of each compressor, and X8I/X12I status in an easy to read dashboard style interface. The system overview screen is also the launching point for performance reports and historical trending. See section 5 – System Overview.
Monitor more detailed compressor information such as the model and manufacturer of the compressor, capacity and power data, and configurable data points. See section 7 – Equipment Overview.
View and change air system configurations such as adding or removing a compressor, I/O box, or Intelliflow valve. Manage user accounts and network configuration and view diagnostic information. See Section 8 – Configuration Overview.
The system administrator can assign a user one of three levels of access (view only, user, and administrator) which will determine which functions will be available to that user. For example, only users with administrator access will be able to view or modify the configuration overview parameters. See section 8.5 – Account Management.
Please note that this software manual assumes that the Ingersoll Rand Automation VX Box has been installed and connected to your company’s network. If this is not the case please refer to the Ingersoll Rand Automation VX Box installation manual CCN 80445083.
SECTION 3 - GETTING STARTED
3.1Commissioning Procedures
There are certain parameters that must be configured in order for the VX box to properly communicate to the LAN and to the X8I/X12I control network. Outlined below is a list of steps that must be completed before the visualization software can be fully utilized.
Most of the setup is conducted using the configuration overview screen described in detail in section 7. Please be sure that you have ADMIN rights before attempting to configure the VX box.
1.Install the VX box according to the Installation Manual
2.Connect to the VX box using a PC – Follow the procedure outlined in section 3.2.
3.Login to the Visualization Software – Follow the procedures in section 4.1
If you will only be connecting to the VX box using a single PC, go to step 5. If you will be using a static IP or DHCP assigned IP address on your company’s LAN please continue.
4.Configure the VX box Ethernet settings – Obtain a static IP address from your IT department or have an assigned domain name for DHCP access. Follow the procedures in section 8.6.4.
5.Synchronize VX Box time to PC time – Follow the procedures in section 8.7.4
6.Configure the X8I/X12I information - Follow the procedures in section 8.2
7.Configure compressor information – Follow the procedures in section 8.3. Make sure you have the compressor nameplate data available.
8.Configure any I/O boxes or Intelliflow Valves – Follow the procedures in section 8.4. Make sure you have I/O configuration information for any I/O boxes on the network. Please refer to the I/O Box operator’s manual.
9.Set up User accounts – Follow the procedures in section 8.5 if not using default accounts.
10.Select units on Dashboard – Follow the procedures in section 6.2
3.2 Connecting to a VX Box via PC
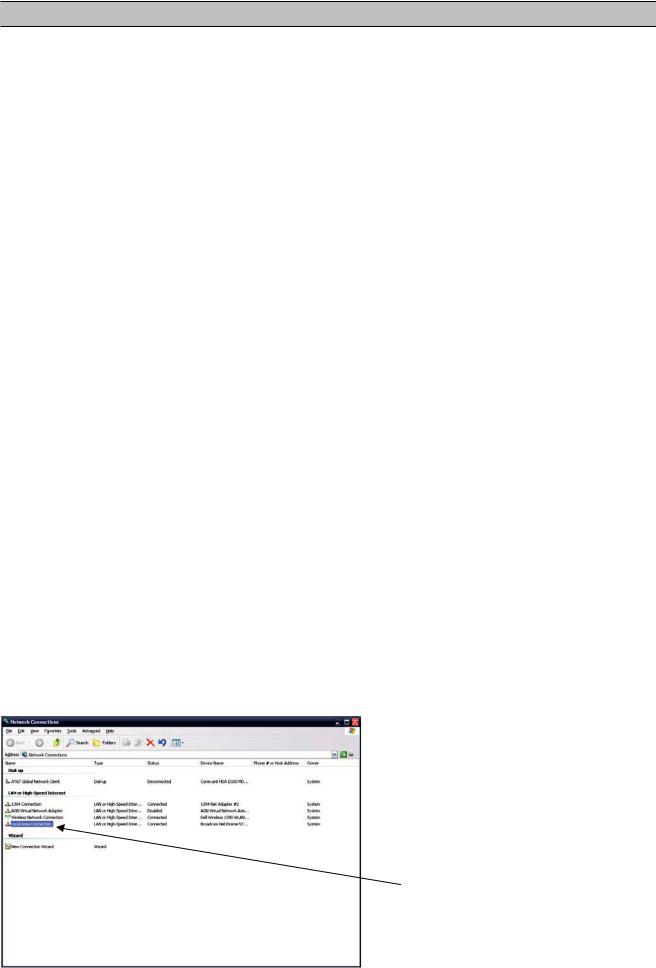
In order to configure your computer to communicate point-to-point with the VX Box, you must first set the IP address range of your computer to the default IP address range of the Visualization box. To do this, please follow the instructions listed below to configure the Computer IP address. These settings are accessible using Windows XP by selecting:
Please note that the VX Box ships with a default IP address of 192.168.1.1. Using Classic View:
Select Start
Select Settings
Select Network Connections
Using XP Start View:
Select Start
Select Control Panel
Select Network Connections
Select Local Area Connection
Right Click on the Local Area Connection
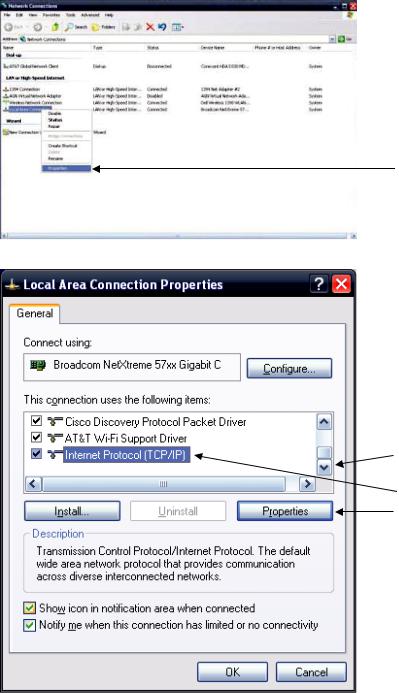
Select Properties
Scroll down the Connection List to find Internet Protocol (TCP/IP)
Select Internet Protocol (TCP/IP) Click on Properties
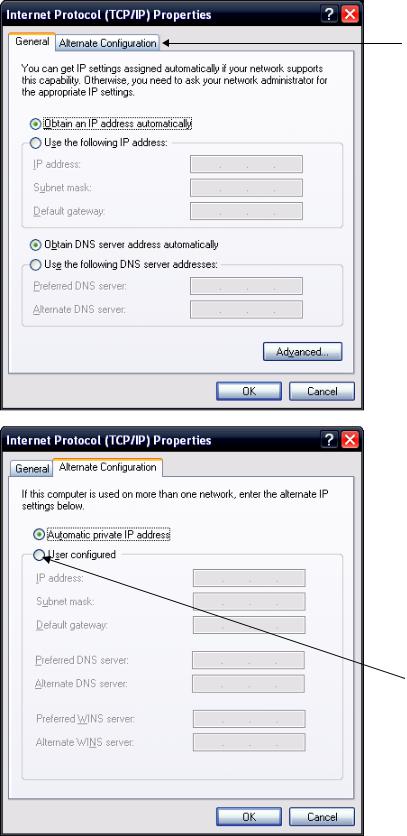
Click on the Alternate Configuration Tab
Click on User Configured Button
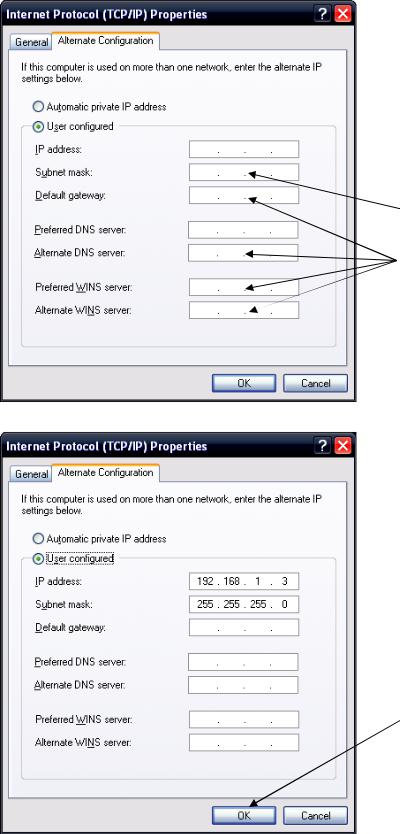
Enter IP address for the Computer
 192.168.1.3
Enter the Subnet Mask for the Computer 255.255.255.0
 Leave all other Fields blank
When complete, Click OK
Connect an Ethernet cable to your Computer and to the Visualization Box. Within a minute, the Computer will make a connection to the Visualization Box. Once connected, you will be able to log into and configure the Visualization Box.
SECTION 4 - LOGIN
4.1Login Process
During the installation and commissioning process a network address was assigned to the VX Box by your IT department. This address may be a static IP (e.g. http://192.168.1.1, recommended) or a DHCP assigned domain name address (e.g. http://myairsystem.com). A domain name address is a web page address chosen by the user to represent the VX box. The domain name must be approved by your IT department but can generally be any text label you wish. You must have this address before you can log in to the visualization software. See section 8.6.4 – Ethernet Configuration.
Please note that Ingersoll Rand Automation Visualization requires Internet Explorer 7 ( or newer) or Mozilla Firefox 2 (or newer). Certain functions may not behave correctly when using older browser software.
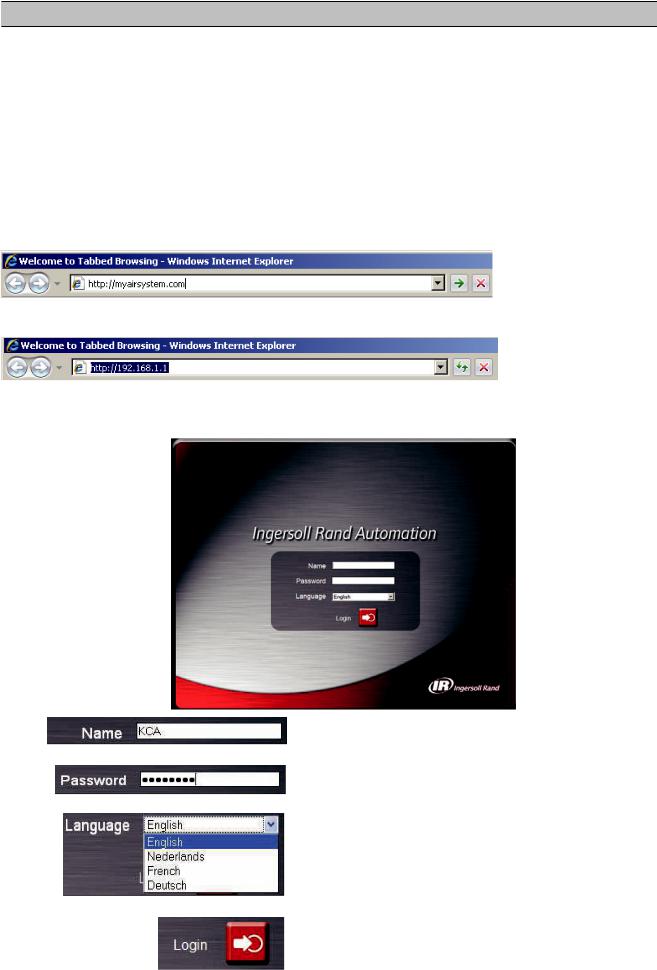
To log in to the visualization program you must first type the address into your browser and then press the enter button.
For example, with a DHCP enabled VX box you might type this:
While with a static IP address you might type this:
If the VX box is configured correctly you will then see the Ingersoll Rand Automation splash screen in your browser. This may take a few seconds depending on our network connection speed.
Type in your user name (case sensitive)
Type in your password (case sensitive)
Select your language from the dropdown list
Click the Login button or press enter
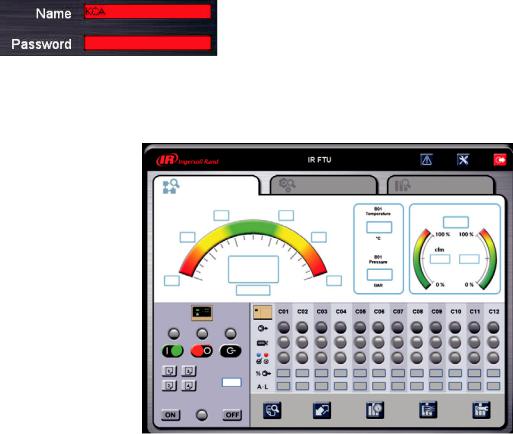
If the user name or password are incorrect the background of the field will turn red.
Please see section 4.2 for default account information, and section 8.5 for more detailed information about the account management process.
Upon successfully logging in you will see the system overview screen shown below:
4.2Default Accounts
The Visualization software comes preconfigured with three default user accounts. The system administrator can assign users one of three levels of access (view only, user, and administrator) which will determine which functions will be available. For example, only users with administrator access will be able to view or modify the configuration overview parameters. It is highly advised that the administrator change these accounts as soon as feasible to prevent unauthorized access to the Visualization software. The three level of access rights are as follows:
1.VIEW – The user is able to view all information on the SOV and EOV screens and their detail view screens. The user is unable to change any set points or access the Configuration Overview (COV) screens.
2.2. USER – The user has all rights available to the VIEW access level as well as being able to change set points on the table configuration screens, pressure schedule screens, and is able to manually start and stop compressors, as well as start and stop the X8I/X12I.
3.3. ADMIN – The user has all rights of the VIEW, and USER access levels as well as full access to the Configuration Overview (COV) screens, the account management utility, and the diagnostics screen.
Please note that there can be as many as five (5) maximum users logged into the system at one time, and only one administrator logged in at one time.
The three default accounts are:
1.Login: view Password: pwview Rights: VIEW
2.Login: user Password: pwuser Rights: USER
3.Login: admin Password: pwadmin Rights: ADMIN
Only a user with ADMIN rights will be able to modify these default accounts.
SECTION 5 - NAVIGATION
5.1Title Bar
Visualization navigation uses a simple point and click interface. A title bar will be present at the top of every screen and will display information about system name, alarms, and will provide access to event and service logs.
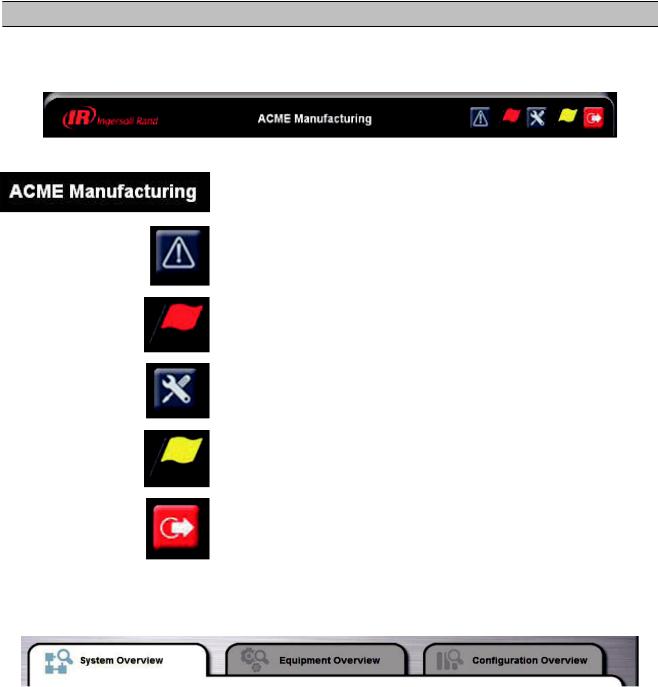
The components of the title bar are as follows:
Installation Name – This is configured by the system administrators and is a name that is used to identify the compressed air system.
Event Log Button – Clicking this button will bring the user to the visualization event log. See section 6.1.1 – Event Log
General Alarm Flag – This flag will appear if there is an alarm condition present on the X8I/X12I or any of the compressors in the system. If there is no alarm present or the alarm has been resolved this flag will disappear.
Service Maintenance Button – Clicking this button will bring the user to the maintenance reminder utility. See section 6.1.2 – Service Reminder utility.
Service Reminder Flag – This flag will appear if a service reminder has been set up for a compressor and service is now due. Once the service reminder has been updated this flag will disappear.
Log Out Button – Clicking this button will log out the current user and return to the visualization login screen.
5.2Tab Navigation
Each of the three main segments: System Overview, Equipment Overview, and Configuration Overview, is represented by a tab below the title bar.
Clicking on the tab will bring you to the overview screen for that particular segment.
Clicking on the system overview tab will bring the user to the System Overview page. From here the user can monitor and adjust (with the correct security) important air system data such as air system pressure and efficiency, status of each compressor, and X8I and X12I status in an easy to read dashboard style interface. The system overview screen is also the launching point for set point and scheduling screens plus performance reports and historical graphing and trending tools. See section 6 – System Overview.
10
Clicking on the equipment overview tab will bring the user to the Equipment Overview page. From here the user can monitor more detailed compressor information such as the model and manufacturer of the compressor, capacity and power data, and configurable data points. See section 7 – Equipment Overview.
Clicking on the configuration overview tab will bring the user to the Configuration Overview page. From here the system administrator(s) can view and change air system configurations such as adding or removing a compressor, I/O box, or Intelliflow valve. Manage user accounts and network configuration and view diagnostic information. The configuration overview page is only accessible by users with ADMIN rights. See section 8 – Configuration Overview.
Navigation between tabs is instant; there is no need to save data before moving to another tab. From the overview tabs the user can navigate to the various associated detail view pages.
11
SECTION 6 - SYSTEM OVERVIEW
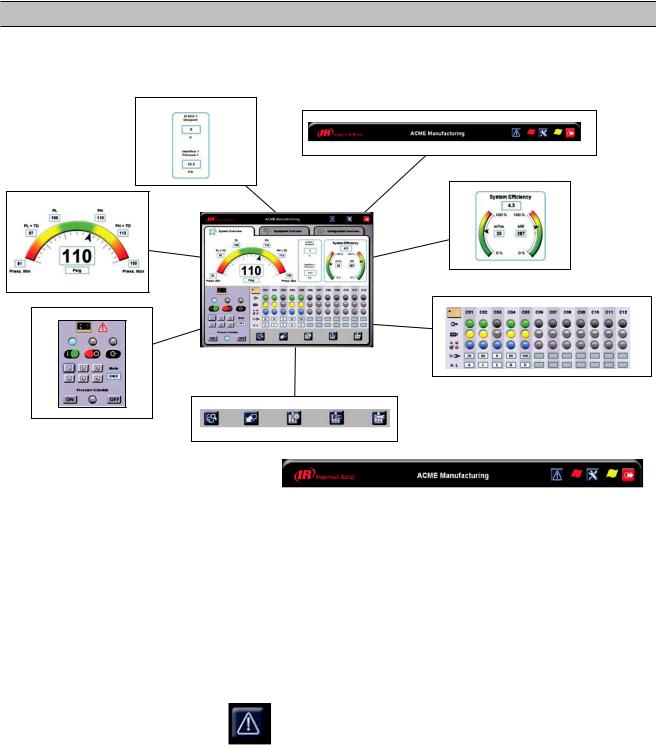
6.1The System Overview Screen
The system overview screen presents an overall view of your compressed air system and is broken down into functional sections.
Configurable I / O– Section 6.3
Title Bar – Section 5.1 and6.1
Efficiency Gauge –Section 6.4
Dashboard – Section 6.2
Compressor Status – Section 6.6
X8I/X12I Interface – Section 6.5
System Detailed View – Section 6.7
6.1.1 Title Bar - The Event Log
The Visualization Event Log records certain events that occur in your air system or in the visualization software itself. The events recorded and placed into one of three categories:
1.Alarms – Alarms are events that indicate that an abnormal situation has occurred on a compressor, X8I/X12I, I/O Box, or Intelliflow valve but the piece of equipment is still functioning normally.
2.Trips/Shutdowns – Trips/Shutdowns are events that indicate that an abnormal situation has occurred on a compressor, X8I/X12I, I/O Box, or Intelliflow valve and the piece of equipment has been stopped.
3.System Information – System information events record user logins and logouts.
The event log will record the last 500 events. Once this 500 event limit has been reached the oldest events will be cleared and the newest events will appear at the top of the event log.
The event log is accessible from all overview screens using the following procedure:
Click the event log button
12

The event log will then appear as shown below
Information in the event log is presented in five columns. The columns represent, from left to right:
1.Date of the event (in DD/MM/YY format).
2.Time of the event (in a 24 hour clock format).
3.Equipment reporting the event (C01 through C12 for compressors, B01 through B12 for I/O boxes and Intelliflow valves, SYS for the X8I or X12I, and VX for the VX box itself.
4.Type of event. A(Alarm), T(Trip), or S(Shutdown).
5.Details of the event.
The event log filters allow you to control which events are displayed on the event log. A check mark appearing next to the event type means all events of that type will appear in the log. Uncheck the box to hide all events of that type.
Clicking the print button will print the event log.
When you are finished with the event log, clicking the exit button will exit back to the overview screen last viewed.
13
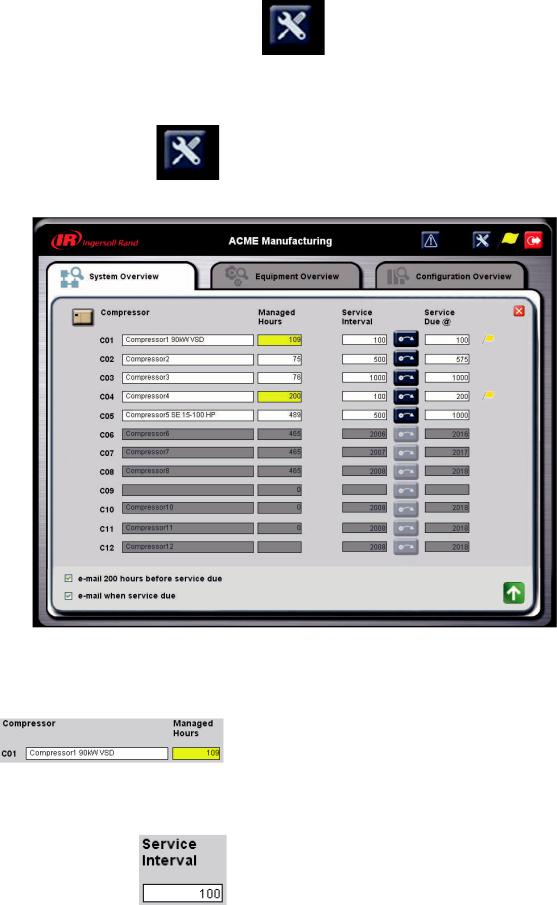
6.1.2Title Bar - The Service Utility
The Service Utility is used to set up maintenance reminders for compressors in the system. The user enters a specified maintenance interval based on the compressor’s factory recommendations and the Visualization software will provide a visual cue on the title bar as well as optional email reminders that are sent to selected users.
The service utility will appear as shown below:
The service utility has the following data:
The service utility is accessed by clicking the service utility button on the title bar.
Compressor address on the system controller (C01 through C12) and the compressor name as configured by the system administrator.
Managed Hours – The number of hours that the X8I/X12I has been monitoring the compressor. Please note that this value is initially entered into the X8I/X12I based on the compressor’s local running hour indicator. This value must periodically be compared to the actual compressor running hours to maintain consistency. This value will turn yellow when maintenance is due and the yellow flag will appear on the title bar.
This value is entered based on the compressor’s maintenance interval according to OEM recommendations.
User or Administrator access is required to change this value.
14

Pressing this button adds the service interval to the managed hours. This adds the service interval value to the service due field and removes the yellow maintenance due flag for the compressor. This should be done after maintenance is performed on the compressor. This button is only available to users with User or Administrator rights.
When the managed hours reach the service due hours the yellow maintenance reminder flag will be activated.
The maintenance reminder flag appears when the managed hours reach the service due hours. There is a flag for each compressor and a master flag that will appear on the title bar if any compressor has a maintenance reminder flag active.
The service utility also has the capability of emailing users that service is due.
Checking off this option will instruct the visualization software to send out emails to any users who have been selected by the administrator when a compressor is due for service in 200 hours.
Checking off this option will instruct the visualization software to send out emails to any users to have been selected by the administrator when a compressor is due for service.
Please see section 6.5 for information on setting up users to receive service due reminder emails. When you are finished viewing and/or changing the settings in the service utility:
Click the exit button to leave the service utility without saving any changes. You will be returned to the last overview page viewed.
Click the Save and Exit button to save your changes and return to the last viewed overview page.
15
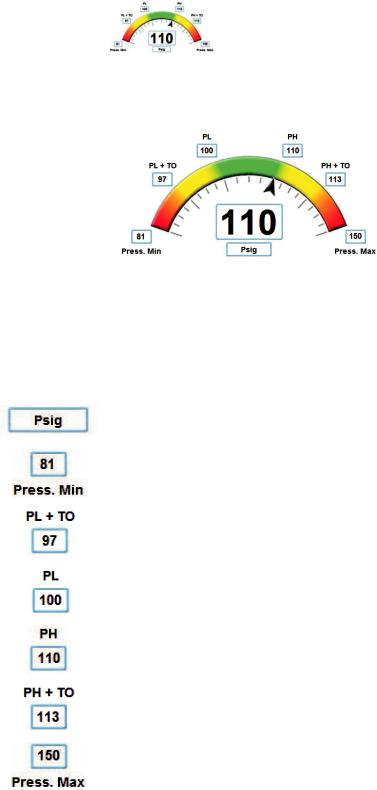
6.2The Dashboard
The dashboard area of the System Overview page (SOV) is where system pressure information is displayed in an easy to read gauge interface. The dashboard prominently displays system pressure as well as setpoints from the X8I or X12I system controller.
The arrow on the pressure gauge represents where the system pressure is in relation to the system controller’s setpoints. If the arrow is in the green zone system pressure is currently optimal and the system controller will take no action. If the arrow reaches the yellow zone the system controller will consider actions to load or unload a compressor to return system pressure to the green zone. In the red zone the system controller is taking increasingly urgent action to return the system pressure to the green zone. Please see the X8I or X12I operator’s manual for more detailed information on pressure control.
The other data points shown are (please note that the values below are examples only):
System pressure display units. Clicking on the units will switch between bar and psig units of measure.
Minimum pressure alarm setting.
Low pressure setpoint minus the tolerance setting.
Low pressure setpoint. This is the pressure setpoint where the X8I or X12I will load a compressor. This is based on the active table.
High pressure setpoint. This is the pressure setpoint where the X8I or X12I will unload a compressor. This is based on the active table.
High pressure setpoint plus the tolerance setting.
Maximum pressure alarm setting.
Please refer to the X8I or X12I operator’s manual for further information on the system pressure setpoints.
16
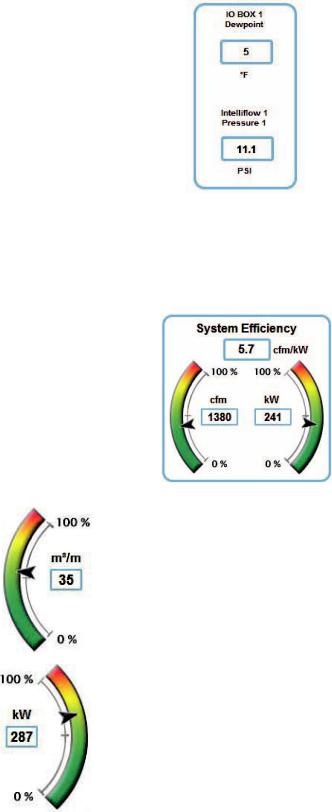
6.3Configurable I/O
The configurable I/O section of the SOV screen allows the user to select two data points to display on the SOV. The user configurable I/O may be from the X8I or X12I, an Intelliflow valve, or an I/O box. The configurable I/O may only be configured by a user with administrator rights, see section 8.2.2 – User Configurable Data Items.
6.4System Efficiency Gauge
The system efficiency gage calculates and displays an overview of air system energy efficiency. This is intended to be a guide only and is based on user input, monitored status, and in some cases, measured data. The system efficiency units are configurable by a user with administrator rights. System efficiency can be displayed in units of cfm/kW, kW/cfm, or kW/m3/min.
The system output gauge uses the name plate capacity of the compressors in the air system as well as monitoring compressor load states to determine how much compressed air is being placed into the system.
The gauge shows how much capacity is being utilized in relation to the capacity of all compressors in the system. A flow meter can also be used for this value. Units and data source can only be changed by a user with administrator rights, see section 8.2 – System Setup.
The system power consumption gauge uses the name plate power consumption of the compressors in the air system as well as monitoring compressor load states to determine the current power draw of the compressors. The gauge shows how much power is being consumed in comparison to the power consumed when all compressors are at maximum load. Units are always kW.
The system efficiency reading is only a guideline and should be used for monitoring day to day changes in compressed air system efficiency. True system efficiency can only be determined with accurate flow and power meters and detailed calculations.
17
 Loading...