


 Loading...
Service Guide
IntelliVue Patient Monitor
MX400/MX450/MX500/MX550
Release K.2x.xx
Patient Monitoring

Table of Contents
|
1 Introduction |
5 |
Who Should Use This Guide |
5 |
|
How to Use This Guide |
5 |
|
Abbreviations |
5 |
|
Responsibility of the Manufacturer |
6 |
|
Passwords |
6 |
|
Safety Information |
7 |
|
|
2 Theory of Operation |
11 |
Integrated Monitor Theory of Operation |
11 |
|
|
3 Testing and Maintenance |
31 |
Introduction |
31 |
|
Terminology and Definitions |
31 |
|
Recommended Frequency |
32 |
|
When to Perform Tests |
33 |
|
Testing Sequence |
36 |
|
Visual Inspection |
36 |
|
Safety Tests |
37 |
|
System Test |
52 |
|
Preventive Maintenance Procedures |
63 |
|
Performance Assurance Tests |
63 |
|
Reporting of Test Results |
90 |
|
Other Regular Tests |
93 |
|
Touchscreen Calibration |
93 |
|
Disabling/Enabling Touch Operation |
94 |
|
Printer Test Report |
94 |
|
Battery Handling, Maintenance and Good Practices |
95 |
|
After Installation, Testing or Repair |
102 |
|
|
4 Troubleshooting |
103 |
Introduction |
103 |
|
How To Use This Section |
103 |
|
Who Should Perform Repairs |
103 |
|
Replacement Level Supported |
103 |
|
Software Revision Check |
104 |
|
Software Compatibility Matrix |
104 |
|
Obtaining Replacement Parts |
104 |
|
Troubleshooting Guide |
104 |
|
3

|
5 Repair and Disassembly |
|
139 |
Tools Required |
139 |
||
Monitor Disassembly |
139 |
||
Plug-in Modules |
182 |
||
Multi-Measurement Module (MMS) Disassembly |
186 |
||
MMS Extensions - Exchanging the Top Cover, MSL Flex Cable and the Dual Link Bar |
203 |
||
|
6 Parts |
|
217 |
MX400/450/500/550 Parts |
218 |
||
Remote Control Parts |
225 |
||
Multi-Measurement Module (MMS) Parts |
225 |
||
MMS Extension Parts (M3012A, M3014A, M3015A/B) |
233 |
||
IntelliVue X2 Part Numbers |
235 |
||
Plug-in Modules Part Numbers |
235 |
||
Smart Battery Charger Part Numbers |
241 |
||
External Display Part Numbers |
241 |
||
Test and Service Tools |
242 |
||
|
7 Installation Instructions |
245 |
|
Electromagnetic Emissions |
245 |
||
Installation Checklist |
246 |
||
Unpacking the Equipment |
246 |
||
Initial Inspection |
247 |
||
Installing the MX400/450/500/550 Monitor |
247 |
||
Connecting the Monitor to AC Mains |
259 |
||
|
8 Site Preparation |
|
289 |
Introduction |
289 |
||
Monitor MX400/450/500/550 Site Requirements |
292 |
||
Electrical and Safety Requirements (Customer or Philips) |
293 |
||
Remote Device Site Requirements |
293 |
||
RS232/MIB/LAN Interface |
300 |
||
Nurse Call Paging Cable |
301 |
||
ECG Out Interface |
302 |
||
|
9 Gas Analyzers |
|
303 |
10 Specifications |
305 |
||
|
|
|
|
Essential Performance Characteristics |
305 |
||
MDD Classification |
308 |
||
Safety and Regulatory Information |
308 |
||
11 IntelliVue MX400-550 Product Structure |
309 |
||
|
|
|
|
4

1
Introduction
This Service Guide contains technical details for the IntelliVue MX400/450/500/550 Patient Monitor, the measurement modules, the Multi-Measurement Module (MMS), the IntelliVue X2, and the Measurement Server Extensions.
This guide provides a technical foundation to support installation, effective troubleshooting and repair. It is not a comprehensive, in-depth explanation of the product architecture or technical implementation. It offers enough information on the functions and operations of the monitoring systems so that engineers who install or repair them are better able to understand how they work.
It covers the physiological measurements that the products provide, the Measurement Server that acquires those measurements, and the monitoring system that displays them.
Who Should Use This Guide
This guide is for biomedical engineers or technicians responsible for installing, troubleshooting, repairing, and maintaining Philips’ patient monitoring systems.
How to Use This Guide
Navigate through the table of contents at the left of the screen to select the desired topic. Links to other relevant sections are also provided within the individual topics. You can also scroll through the topics using the page up and page down keys.
Abbreviations
Abbreviations used throughout this guide are: |
|
Name |
Abbreviation |
IntelliVue MX400/450/500/550 Patient Monitor |
the monitor |
Multi-Measurement Module |
MMS |
Measurement Link |
MSL |
Medical Information Bus |
MIB |
IntelliVue G1/G5 Gas Analyzers |
G1/G5, the gas analyzer |
5

1 Introduction
Responsibility of the Manufacturer
Philips only considers itself responsible for any effects on safety, EMC, reliability and performance of the equipment if:
•assembly operations, extensions, re-adjustments, modifications or repairs are carried out by persons authorized by Philips, and
•the electrical installation of the relevant room complies with national standards, and
•the instrument is used in accordance with the instructions for use.
To ensure safety and EMC, use only those Philips parts and accessories specified for use with the monitor. If non-Philips parts are used, Philips is not liable for any damage that these parts may cause to the equipment.
This document contains proprietary information which is protected by copyright. All Rights Reserved. Reproduction, adaptation, or translation without prior written permission is prohibited, except as allowed under the copyright laws.
Philips Medizin Systeme Böblingen GmbH Hewlett-Packard Str. 2
71034 Böblingen, Germany
The information contained in this document is subject to change without notice.
Philips makes no warranty of any kind with regard to this material, including, but not limited to, the implied warranties or merchantability and fitness for a particular purpose.
Philips shall not be liable for errors contained herein or for incidental or consequential damages in connection with the furnishing, performance, or use of this material.
Passwords
In order to access different modes within the monitor a password may be required. The passwords are listed below.
CAUTION
Your hospital/organization is responsible that the passwords listed below are revealed to authorized personnel only.
Monitoring Mode: No password required Configuration Mode: 71034
Demo Mode: 14432
Service Mode: 1345
Consult the configuration guide before making any changes to the monitor configuration.
6

1 Introduction
Safety Information
Warnings and Cautions
In this guide:
•A warning alerts you to a potential serious outcome, adverse event or safety hazard. Failure to observe a warning may result in death or serious injury to the user or patient.
•A caution alerts you where special care is necessary for the safe and effective use of the product. Failure to observe a caution may result in minor or moderate personal injury or damage to the product or other property, and possibly in a remote risk of more serious injury.
Electrical Hazards and Interference
WARNING
Grounding: To avoid the risk of electric shock, the monitor must be grounded during operation. If a three-wire receptacle is not available, consult the hospital electrician. Never use a three-wire to twowire adapter.
Electrical shock hazard: Do not open the monitor or measurement device. Contact with exposed electrical components may cause electrical shock. Refer servicing to qualified service personnel.
Leakage currents: If multiple instruments are connected to a patient, the sum of the leakage currents may exceed the limits given in IEC/EN 60601-1, IEC 60601-1-1, UL 60601-1. Consult your service personnel.
Radio frequency interference: The monitor generates, uses and radiates radio-frequency energy, and if it is not installed and used in accordance with its accompanying documentation, may cause interference to radio communications.
Use Environment
WARNING
Explosion Hazard: Do not use in the presence of flammable anesthetics or gases, such as a flammable anesthetic mixture with air, oxygen or nitrous oxide. Use of the devices in such an environment may present an explosion hazard.
Positioning Equipment: The monitor should not be used next to or stacked with other equipment. If you must stack the monitor, check that normal operation is possible in the necessary configuration before you start monitoring patients.
Environmental Specifications: The performance specifications for the monitors, measurements and accessories apply only for use within the temperature, humidity and altitude ranges specified in .
Liquid Ingress: If you spill liquid on the equipment, battery, or accessories, or they are accidentally immersed in liquid, contact your service personnel or Philips service engineer. Do not operate the equipment before it has been tested and approved for further use.
7

1 Introduction
Prohibited Environments: The monitors are not intended for use in an MRI environment or in an oxygen-enriched environment (for example, hyperbaric chambers).
Alarms
WARNING
•Do not rely exclusively on the audible alarm system for patient monitoring. Adjustment of alarm volume to a low level or off during patient monitoring may result in patient danger. Remember that the most reliable method of patient monitoring combines close personal surveillance with correct operation of monitoring equipment.
•Be aware that the monitors in your care area may each have different alarm settings, to suit different patients. Always check that the alarm settings are appropriate for your patient before you start monitoring.
Accessories
WARNING
Philips' approval: Use only Philips-approved accessories. Using other accessories may compromise device functionality and system performance and cause a potential hazard.
Reuse: Never reuse disposable transducers, sensors, accessories and so forth that are intended for single use, or single patient use only. Reuse may compromise device functionality and system performance and cause a potential hazard.
Electromagnetic compatibility: Using accessories other than those specified may result in increased electromagnetic emission or decreased electromagnetic immunity of the monitoring equipment.
Damage: Do not use a damaged sensor or one with exposed electrical contacts.
Cables and tubing: Always position cables and tubing carefully to avoid entanglement or potential strangulation.
MR Imaging: During MR imaging, remove all transducers, sensors and cables from the patient. Induced currents could cause burns.
8

1 Introduction
Maintenance, Repair and Care
WARNING
Maintenance and Repair:
•Do not maintain or repair the device in patient vicinity.
•Failure on the part of the responsible individual hospital or institution using this equipment to implement a satisfactory maintenance schedule may cause undue equipment failure and possible health hazards.
•Performance verification: do not place the system into operation after repair or maintenance has been performed, until all performance tests and safety tests listed in Testing and Maintenance of this service manual have been performed. Failure to perform all tests could result in erroneous parameter readings, or patient/operator injury.
Care and Disinfection:
•To avoid contaminating or infecting personnel, the environment or other equipment, make sure you disinfect and decontaminate the monitor appropriately before disposing of it in accordance with your country's laws for equipment containing electrical and electronic parts.
•For disposal of parts and accessories such as thermometers, where not otherwise specified, follow local regulations regarding disposal of hospital waste.
9

1 Introduction
10
2
Theory of Operation
Integrated Monitor Theory of Operation
The IntelliVue MX400/450/500/550 Patient Monitor:
•displays real-time data
•controls the attached multi-measurement modules
•alarms in the case of patient or equipment problems
•offers limited data storage and retrieval (trending)
•interfaces to the Philips Clinical Network and other equipment
A monitor with just a single integrated measurement module can be connected to additional building blocks to form a monitoring system with a large number of measurements and additional interface capabilities and multiple slave displays. These elements cooperate as one single integrated real-time measurement system.
11

2 Theory of Operation
System Boundaries
The following diagram discusses specific boundaries within the overall system with respect to their openness and real-time requirements:
System Boundaries
Measurement connections
Built-in measurement block
Philips Clinical Network (wired LAN)
connects multiple patient monitors, information centers, application servers; closed system, only Philips qualified products (tested and with regulatory approval) are connected, Philips is responsible for guaranteed real-time functionality and performance
Philips Clinical Network (wireless)
like Philips Clinical Network (wired) LAN, however due to current wireless technologies available it has reduced bandwidth, longer latencies, reduced functionality
Hospital LAN, Internet
Standard Network, not under Philips control, no guaranteed service, no real-time requirements
12

2 Theory of Operation
Hardware Building Blocks
The following hardware building blocks make up the monitoring system:
IntelliVue MX400/450/500/550
The IntelliVue MX400/450/500/550 Monitor:
•integrates the display and processing unit into a single package
•uses a 9" TFT WVGA Color display (MX400)
•uses a 12" TFT WXGA Color display (MX450/500)
•uses a 15" TFT WXGA Color Display (MX550)
•uses the touch screen as primary input device; a remote control and computer devices such as mice, trackball, and keyboard can be added optionally.
•has an optional built-in recorder (MX400/450 only)
•has an integrated 3-slot rack (MX500/550 only)
NOTE
The 802.11 Bedside Adapter (WLAN) and IIT are mutually exclusive.
13

2 Theory of Operation
MX400 Hardware Building Blocks
14
2 Theory of Operation
MX450 Hardware Building Blocks
15

2 Theory of Operation
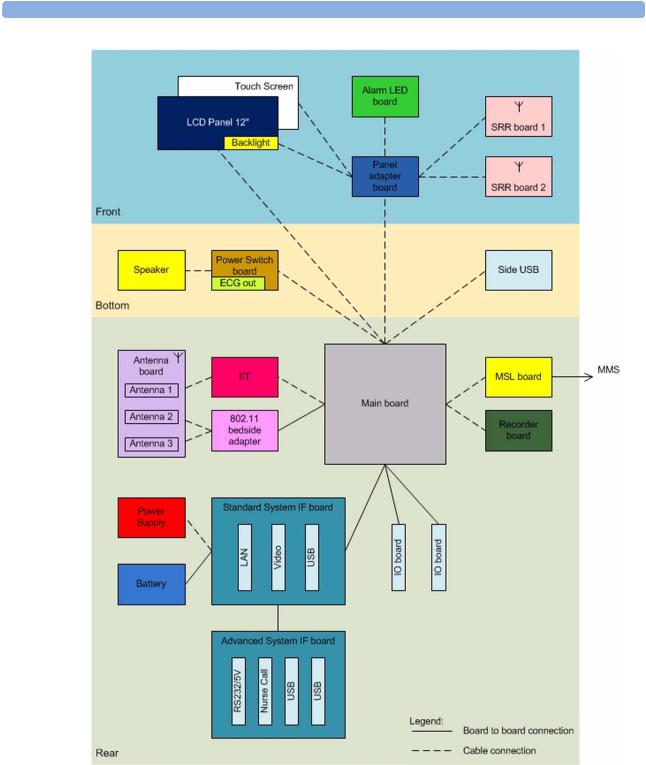
MX500/MX550 Hardware Building Blocks
16

2 Theory of Operation
Compatible Devices
M3001A Multi-Measurement
Module (MMS)
M3002A IntelliVue X2
M3012A MMS Extension
M3014A MMS Extension
17

2 Theory of Operation
M3015A/B MMS Extension
865244 Remote Control
18

2 Theory of Operation
Power Supply
The AC/DC converter transforms the AC power coming from the plug into 15V/ 70W DC source and isolates the monitoring system from the AC power mains. The 15V is distributed via power bus either directly or over additional converters to all components of the system:
The battery charger is supplied with 15V and switches between AC/DC supply and battery depending on whether AC power cord is plugged or unplugged.
The 48V DC power needed for the MSL is created by an isolating DC/DC converter.
The LED backlight converter located on the panel adapter board is supplied with 9V - 12.6V / 15V.
The isolated interfaces are supplied with 2.5V AC. The main board is supplied with 5V, 3.3V, 1.5V, 1.4V and 1.2V.
Additionally, for some infrastructural functions 3.6V is provided to the main board.
Main Board
The main board contains the CPU which includes the graphic processing unit and USB controller. The main memory, a system FPGA, a system controller including watchdogs and various power supplies are located on this board. Additionally, this board contains the MSL interface, the recorder interface, the ECG Out hardware and various other interfaces.
System information is stored in serial EEPROMs to support the automatic configuration of the operating system at boot time.
I/O Boards
A dual MIB/RS232 board, a Flexible Nurse Call Relay board or an IntelliBridge board can be added optionally.
19

2 Theory of Operation
Data Flow
The following diagram shows how data is passed through the monitoring system. The individual stages of data flow are explained below.
Data Flow
Data Acquisition
Monitoring data (for example patient measurement data in the form of waves, numerics and alerts) is acquired from a variety of sources:
•Measurement Servers
The Measurement Servers connected to the internal LAN convert patient signals to digital data and apply measurement algorithms to analyze the signals.
•External measurement devices
Data can be also acquired from devices connected to interface boards of the monitor. Software modules dedicated to such specific devices convert the data received from an external device to the format used internally. This applies to parameter modules and the Anesthetic Gas Module.
•Server systems on the Philips Clinical Network
To enable networked applications such as the other bed overview, data can be acquired from server systems attached to the Philips Clinical Network, for example a Philips Information Center
Data Provider System Service
All data that is acquired from measurement servers or external measurement devices is temporarily stored by a dedicated data provider system service. All monitor applications use this central service to access the data in a consistent and synchronized way rather than talking to the interfaces directly.
This service makes the applications independent of the actual type of data acquisition device.
The amount of data stored in the data provider system service varies for the different data types. For example several seconds of wave forms and the full set of current numerical values are temorarily stored in RAM.
20
2 Theory of Operation
Persistent Data Storage System Service
Some applications require storage of data over longer periods of time. They can use the persistent data storage system service. Dependent on the application requirements, this service can store data either in battery backed-up (buffered) memory or in flash memory. The buffered memory will lose its contents if the monitor is without power (not connected to mains) for an extended period of time. The flash memory does not lose its contents.
The trend application for example stores vital signs data in a combination of flash memory and buffered memory, while the system configuration information (profiles) is kept purely in flash memory.
Display and User Interface Service
Applications can use high level commands to display monitoring data or status and command windows on the internal LCD panel. These commands are interpreted by the display manager application. This application controls the dedicated video hardware.
User input is acquired from a variety of input devices, for example the touchscreen or other standard input devices (keyboard, mouse). The system software makes sure that the user input is directed to the application which has the operating focus.
Data Output
The monitoring system is very flexible and customizable regarding its data output devices. Built-in devices (for example LAN, video) provide the basic output capabilities.
These capabilities can be enhanced by adding additional I/O boards, as required in the specific enduser setup. The additional I/O boards typically provide data to externally attached devices, for example to RS232 based data collection devices.
The monitor can identify I/O boards by means of a serial EEPROM device that stores type and version information. The operating system detects the I/O boards and automatically connects them with the associated (interface driver) application. For some multi-purpose boards it is necessary to configure the board for a particular purpose first (for example the MIB/RS232 board can support external touch display , data import, data export).
Monitor Applications
The monitor applications provide additional system functionality over the basic measurement and monitoring capabilities. This includes for example trending, report generating, event storage or derived measurements.
In general, the monitor applications use the data provider system service to access the measurement data. Application interfaces to the other system services allow the application to visualize data, to store data over extended periods of time or to output data to other devices.
Internal LAN (Measurement Link)
The monitor and multi-measurement modules communicate using an IEEE802.3/ Ethernet LAN in the Measurement Link (MSL). This network is used to distribute data between the components, for example:
•Digitized patient signals including wave data, numerical data and status information (typically from the measurement server to a display unit)
21

2Theory of Operation
•Control data representing user interactions (typically from the display unit to a measurement server)
•Shared data structures, for example representing patient demographical data and global configuration items
The internal LAN allows plug and play configuration of the monitoring system. The system automatically detects plugging or unplugging of measurement servers and configures the system accordingly.
The components on the internal LAN are time-synchronized to keep signal data consistent in the system. Dedicated hardware support for synchronization eliminates any latency of the network driver software.
The integrated LAN provides deterministic bandwidth allocation/reservation mechanisms so that the real-time characteristic of signal data and control data exchange is guaranteed. This applies to the data flow from the measurement server to the monitor (for example measurement signal data) and the data flow from the monitor to a measurement server (for example to feed data to a recorder module).
Philips Clinical Network
The monitoring system may be connected to the Philips Clinical Network, for example to provide central monitoring capabilities or other network services. This connection may be through a normal wired connection or through a wireless connection.
The monitor supports the connection of an internal wireless adapter (#J35). Switching between wired and wireless networks is automatically triggered by the plugging or unplugging of the network cable.
The Philips Clinical Network protocols function very similarly to the protocols used on the internal LAN.
After configuration, the monitoring system sends the digitized patient signals including wave data, numerical data and status information onto the network. Control data representing user interactions can be exchanged between the monitoring system and a central station bi-directionally.
Additional protocols are supported for networked applications, for example for the other bed overview function, which allows viewing of monitoring data from other patients on the network.
For plug and play operation, the monitoring system uses the standard BootP protocol to automatically acquire a network address.
Ambient Light Sensor
The monitor adjusts its display brightness depending on the ambient light level. Therefore an Ambient Light Sensor is integrated in the front bezel of the display.
22

2 Theory of Operation
Although there is an automatic brightness adjustment, it is still possible for the user to change the brightness. As shown in the figure above, the user can select between different brightness level curves.
If a constant brightness is desired, it is possible to deactivate the automatic brightness control via the Config mode of the monitor. Without automatic brightness control, the user can select between different constant brightness levels as shown below.
Microstream CO2
CO2 sample rate: 20 samples/second
Calculation of end tidial CO2 (etCO2)
The M3015A/B MMS Extensions use Microstream® non–dispersive infrared (NDIR) spectroscopy to continuously measure the amount of CO2 during every breath, the amount of CO2 present at the end of exhalation (etCO2), the amount of CO2 present during inhalation (imCO2), and the respiratory rate. The displayed etCO2 is the maximum etCO2 over the previous peak-picking interval as defined by the Max Hold setting (configuration mode). It can be set to no peak picking (off), 10 seconds and 20 seconds.
Test method for respiration rate range
A breath simulator system combined with CO2 and N2 gases was used to simulate respiration rates covering the specified range. The resulting end tidal CO2 values were compared to the expected value. Differences between actual and expected end tidal CO2 values were within the limits of the specified accuracy for the respective respiration rate, i.e. there was no effect of the respiration rate on the end tidal CO2 values beyond those limits.
How does the Support Tool Work with the Monitor
The Support Tool Mark2 is a Windows application typically installed on the laptop of a customer engineer or a biomedical engineer working in the customer’s own service department.
The purpose of the Support Tool Mark2 is to upgrade, configure and diagnose all monitoring components (modules, measurement servers, and monitors) in the system over the network.
The tool allows access to internal service information and to serial numbers. It can be remotecontrolled, for example via a dial-up connection from a response center, provided the proper infrastructure is in place.
For details see the Instructions for Use for the Support Tool Mark2.
23

2 Theory of Operation
Monitor Software Block Diagram
Block Diagram Legend
Functional Block |
Description |
|
|
Services |
|
Operating System |
The Operating System (OS) provides a layer of isolation between |
|
the specific hardware implementation and the application |
|
software. The OS performs system checks and allocates resources |
|
to ensure safe operation when the system is first started. This |
|
includes internal self-tests on several hardware modules and |
|
configuration checks for validity of configuration with the |
|
operating software. During normal operation, the OS continues to |
|
run checks on system integrity. If error conditions are detected the |
|
OS will halt monitoring operations and inform the operator about |
|
the error condition. |
|
|
24

2 Theory of Operation
Functional Block |
Description |
|
|
|
|
System Services |
The System Services provide generic common system services. |
|
|
In particular: |
|
|
They use a real-time clock component to track time. They |
|
|
synchronize to network time sources and verify the accuracy of the |
|
|
system time information. They are also responsible for managing |
|
|
persistent user configuration data for all Measurement Servers and |
|
|
IntelliVue Patient Monitoring System software modules. User |
|
|
configuration data is stored in a non-volatile read/write storage |
|
|
device |
|
Applications |
|
|
Reports |
The Reports Service retrieves current and stored physiological |
|
|
data and status data to format reports for printing paper |
|
|
documentation. The following reports are supported: |
|
|
• |
Vital Signs Report |
|
• |
Graphical Trend Report |
|
• |
Event Review Report |
|
• |
Event Episode Report |
|
• ECG Report (12 Lead/Multi-Lead) |
|
|
• |
Cardiac Output Report |
|
• |
Calculations Report (Hemodynamic/Oxygenation/ |
|
|
Ventilation) |
|
• |
Calculations Review Report |
|
• |
Wedge Report |
|
• |
Test Report |
|
• Other reports (e.g. Loops, Review Applications, Drug report) |
|
|
The Reports service generates report data which can be printed on |
|
|
a local or a central printer. |
|
Record |
The Record Service retrieves current and stored physiological data |
|
|
and status data to format a continuous strip recording. A recording |
|
|
can be triggered manually by the operator or automatically by an |
|
|
alarm condition. The Record Service can also send data to a |
|
|
recorder. |
|
|
|
|
25

2 Theory of Operation
Functional Block |
Description |
|
|
Alarm |
The Alarm Service contains logic that prioritizes alarm conditions |
|
that are generated either by the Measurement Servers or by |
|
IntelliVue Patient Monitoring System software modules. Visual |
|
alarm signals (messages) are displayed at the top of the IntelliVue |
|
Patient Monitoring System display and alarm sounds are generated |
|
by a loudspeaker. Alarm conditions may be generated when a |
|
physiological parameter exceeds preselected alarm limits or when a |
|
physiological parameter or any other software module reports an |
|
inoperative status (technical alarm, for example, the ECG leads |
|
may have fallen off the patient). The Alarm service manages the |
|
alarm inactivation states, for example suspension of alarms, |
|
silencing of alarms, and alarm reminder. Alarm signals may also be |
|
configured as latching (alarm signals are issued until they are |
|
acknowledged by the operator, even when the alarm condition is |
|
no longer true). The Alarm service controls the visual alarm |
|
signals (alarm lamps). |
Trend |
The Trend service stores the sample values of physiological data |
|
and status data with a resolution of 12 seconds, 1 minute or 5 |
|
minutes for a period of up to 48 hours. The data is kept in battery |
|
buffered read/write storage and flash memory devices to be |
|
preserved across power failures. The stored data is protected via |
|
consistency checks and checksums. When a new patient is |
|
admitted, the trend database erases all data of the previous patient. |
OxyCRG |
The OxyCRG (Oxygen CardioRespiroGram) service derives a |
|
high-resolution trend graph from the Beat-to-Beat Heart Rate, |
|
SpO2 or tcpO2, and Respiration physiological data. The OxyCRG |
|
is specialized for neonatal applications, allowing the operator to |
|
identify sudden drops in Heart Rate (Bradycardia) and SpO2 or |
|
tcpO2 (Desaturations), and supporting the operator in visualizing |
|
Apnea situations. |
ADT |
The ADT (Admit/Discharge/Transmit) service maintains the |
|
patient demographics information. The operator may admit a new |
|
patient, discharge the old patient and enter or modify the patient |
|
demographics. The ADT service also supports the transport of a |
|
patient (trend database) with the M3001A Multi-Measurement |
|
Module. The ADT service controls the deletion of old patient |
|
data, the upload of trend data from the M3001A and the switching |
|
back of all settings to user defaults. It also synchronizes patient |
|
information with a central station on the network. |
Events |
The Events Application captures physiological data from episodes |
|
for later review and documentation purposes. Events can be |
|
triggered automatically by an alarm condition, by user-defined |
|
conditions or manually by the operator. |
|
|
26

2 Theory of Operation
Functional Block |
Description |
|
|
Protocol Watch |
ProtocolWatch allows the execution of pre-defined clinical |
|
protocols in the IntelliVue patient monitor by combining events |
|
such as automatically triggered events, time and manually triggered |
|
events with textbook knowledge thus aiding the operator to follow |
|
clinical guidelines. ProtocolWatch notifies the operator when |
|
certain combinations of clinical conditions occur and it documents |
|
the developments and clinician actions in a log which can be |
|
reviewed on the monitor and documented on a printer. |
Calc Param |
The Calc Param (Calculated Parameters) service accesses current, |
|
stored and manually entered physiological data as input to |
|
calculation formulas. With these formulas, derived hemodynamic, |
|
oxygenation and ventilation variables are computed. The |
|
calculation results, including the input parameters, are stored for |
|
later review using the Trend service. |
Heart Mgr. |
The Heart Manager Application allows the selection of the |
|
alarming source to be either heart rate (from ECG) or the system |
|
pulse rate. The system pulse rate can be chosen from any of the |
|
possible pulse rate sources (e.g., SpO2 and invasive pres-sures). |
|
The module implements automatic fall-backs when selected signal |
|
sources are not available. |
Drug Calc |
The Drug Calc application aids in calculating drug dosages for |
|
patients. |
EGM |
EGM (extensible Gas Module) interface aneasthesia gas |
|
measurement devices. The EGM Module interfaces the M1013A |
|
or M1019A Gas Analyzer devices. The EGM Module retrieves the |
|
measurement data and controls the external device. It provides |
|
numerical data, wave form data and alarm data for the gas |
|
parameters measured by the attached analyzers. |
PV Loops |
The PV Loops application compares graphic representations of |
|
airway waves to help detect changes in the patient airway |
|
condition. |
Interface Managers |
|
MDSE |
The MDSE (Medical Data Service Element) Interface Manager is |
|
responsible for the exchange of real-time data between the |
|
IntelliVue Patient Monitoring System display unit and the |
|
Measurement Servers as well as between the IntelliVue Patient |
|
Monitoring System display unit and other devices attached to the |
|
network. MDSE establishes and maintains a data communication |
|
link between the devices. It provides configuration information |
|
about the remote device to applications in the local device and it |
|
allows the exchange of measurement data and status information |
|
between the devices. |
|
|
27

2 Theory of Operation
Functional Block |
Description |
|
|
Printer |
The Printer Interface Manager provides a high level interface to a |
|
printer. It provides means to: |
|
• establish a connection to the printer |
|
• transfer data to the printer |
|
• get status of the printer |
|
• close connection to the printer |
|
The Printer Interface Manager also supervises the connection to |
|
the printer and whether the printer accepts data (for example |
|
paper out). The Printer Interface Manager notifies the operator in |
|
such cases. |
Display & Operator Interface |
The Display and Operator Interface Manager performs the |
|
following tasks: |
|
• Screen presentation of real-time and stored physiological |
|
measurement data, alarm condition data and status |
|
information received from the MDSE interface manager, the |
|
Alarm service or other IntelliVue Patient Monitoring System |
|
modules |
|
• Screen presentation of operating controls (control windows) |
|
• Processing of operating control commands received from |
|
HIF Control interface. The module verifies and interprets the |
|
received commands and forwards them to other software |
|
modules of the IntelliVue Patient Monitoring System display |
|
unit or Measurement Servers |
|
• Sound generation (issues audible alarm signals and generates |
|
audible information signals, for example QRS and SpO2 |
|
tones, operator audible feedback) |
LabData/Manual Data |
The Laboratory Data/ Manual Data Entry Interface Manager |
|
allows acquisition of laboratory data (e.g. acquired by the central |
|
station from a laboratory information system). It also allows to |
|
manually enter measurement data to make additional, manually |
|
acquired measurements available to internal applications and to |
|
the system. |
Wireless Measurement |
The WMM Interface Manager provides connectivity to the SRR |
Manager (WMM) |
interface. It establishes communication between SRR enabled |
|
devices and the ASW module that manages the data provided by |
|
the device |
Interfaces |
|
LAN |
The LAN interface implements the physical layer of IEEE 802.3, |
|
electrical isolation, and ESD protection. Electronically separated |
|
interfaces are used for communication to the Measurement |
|
Servers and to the network. |
WLAN |
The WLAN Interface is a network interface that provides access |
|
to an IEEE 802.11 wireless Local Area Network. The |
|
configuration of this interface is done by an OS Service. |
|
|
28

2 Theory of Operation
Functional Block |
Description |
|
|
Display Controller |
The display controller is integrated into the CPU. The video RAM |
|
is shared with the main memory. The display controller processes |
|
the high level display commands (character and graphic |
|
generation, wave drawing) and translates them into pixels, which |
|
are written into the video RAM, where the display controller |
|
generates the video synchronization signals and the pixel stream |
|
for the internal and external display. |
HIF Control |
The HIF (Human Interface Control) interface scans the Human |
|
Interface devices for operator controls (Touch Screen, and USB |
|
devices), formats the collected data and sends it to the display and |
|
Operating Interface. |
ECG-Out |
The ECG Out interface receives the ECG waveform directly from |
|
the ECG/Resp Arrhythmia ST-Segment physiological algorithm |
|
via an RS-422 serial interface and converts the digital ECG signal |
|
to an analog ECG signal. |
Sync Out (ECG) |
A pulse signal is provided on the Sync Out connector to allow |
|
synchronization with other medical devices. |
RS-232 |
The RS-232 component represents a generic serial communication |
|
interface to connect external devices as shown in the diagram, also |
|
providing power in MP5, MX400/450/500/550. |
RS-422 |
The serial link RS-422 interface communicates the ECG signal to |
|
the ECG Output of the IntelliVue Patient Monitoring System |
|
display unit. The interface is a serial, differential, full-duplex link. |
|
The interface is ESD protected. |
Nurse Call |
The Nurse Call has a modular jack 6P6C connector. The |
|
connector has an open and close contact on alarm. |
MIB |
The MIB interface allows full-duplex, short-haul asynchronous |
|
binary communication between the monitor and an arbitrary |
|
(medical/non-medical) device using an eight-pin RJ45 modular |
|
connector. Switching between MIB and RS232 protocol is |
|
possible. |
IIT Interface |
The IIT Interface allows operation of the monitors with IntelliVue |
|
Instrument Telemetry |
SRR |
The SRR interface allows operation of the monitor with an |
|
IntelliVue Remote Control. |
USB Interface |
The USB interface allows connection of USB devices (Mouse, |
|
Keyboard, Barcode Scanner, Printer) to the monitor. |
Remote Control |
The remote control allows remote operation of the monitor via a |
|
USB cable or SRR connection. |
|
|
29

2 Theory of Operation
30
Loading...