


 Loading...
IntelliVue MP20/30
Service Guide
IntelliVue Patient Monitor
MP20/MP20Junior/MP30
Patient Monitoring

Part Number M8001-9301F 453564112561
*M8001-9301F*

|
|
Contents |
|
|
1 Introduction |
9 |
|
Who Should Use This Guide |
9 |
|
|
How to Use This Guide |
9 |
|
|
Abbreviations |
9 |
|
|
Responsibility of the Manufacturer |
10 |
|
|
Passwords |
11 |
|
|
Warnings and Cautions |
11 |
|
|
|
2 Theory of Operation |
13 |
|
Monitor Theory of Operation |
13 |
|
|
|
System Boundaries |
14 |
|
|
Hardware Building Blocks |
15 |
|
|
Data Flow |
21 |
|
|
How does the Support Tool Work with the Monitor |
24 |
|
|
Monitor Software Block Diagram |
25 |
|
|
Block Diagram Legend |
26 |
|
|
3 Testing and Maintenance |
31 |
|
Introduction |
31 |
|
|
Terminology and Definitions |
32 |
|
|
Recommended Frequency |
33 |
|
|
When to Perform Tests |
34 |
|
|
Testing Sequence |
37 |
|
|
Visual Inspection |
38 |
|
|
|
Before Each Use |
38 |
|
|
After Each Service, Maintenance or Repair Event |
38 |
|
|
Power On Test |
38 |
|
Safety Tests |
39 |
|
|
|
Warnings, Cautions, and Safety Precautions |
40 |
|
|
Safety Test Procedures |
41 |
|
System Test |
66 |
|
|
|
What is a Medical Electrical System? |
66 |
|
|
General Requirements for a System |
67 |
|
|
System Example |
67 |
|
|
System Installation Requirements |
69 |
|
|
Required Protective Measures at System Installation |
70 |
|
|
System Test Procedure |
80 |
|
Preventive Maintenance Procedures |
81 |
|
|
|
Noninvasive Blood Pressure Measurement Calibration |
81 |
|
|
Microstream CO2 Calibration |
81 |
|
3

Performance Assurance Tests |
81 |
Basic Performance Assurance Test |
82 |
Full Performance Assurance Test |
82 |
ECG/Resp Performance Test |
82 |
ECG Sync Performance Test |
83 |
SpO2 Performance Test |
83 |
NBP PerformanceTest |
84 |
Invasive Pressure Performance Test |
86 |
Temperature Performance Test |
87 |
M3014A Capnography Extension Performance Tests |
87 |
Microstream CO2 Performance Test |
90 |
BIS Performance Test |
95 |
Nurse Call Relay Performance Test |
96 |
Power Loss Alarm Buzzer Performance Test (only if Multi-Port Nurse Call Connector Board is installed) |
98 |
Docking Station Performance Test |
98 |
IIT Communication Test |
98 |
IntelliVue 802.11 Bedside Adapter Communication Test |
99 |
Reporting of Test Results |
101 |
Carrying Out and Reporting Tests |
101 |
Evaluation of Test Results |
104 |
Other Regular Tests |
105 |
Touchscreen Calibration |
105 |
Disabling/Enabling Touch Operation |
106 |
Printer Test Report |
107 |
Battery Handling, Maintenance and Good Practices |
107 |
About the Battery |
108 |
Checking the Battery Status |
109 |
Battery Status on the Main Screen |
110 |
Battery Status Window |
112 |
Conditioning a Battery |
114 |
Conditioning Batteries |
115 |
After Installation, Testing or Repair |
116 |
|
4 Troubleshooting |
119 |
Introduction |
119 |
|
How To Use This Section |
119 |
|
Who Should Perform Repairs |
119 |
|
Replacement Level Supported |
120 |
|
Software Revision Check |
120 |
|
Obtaining Replacement Parts |
120 |
|
Troubleshooting Guide |
120 |
|
|
Checks for Obvious Problems |
121 |
|
Checks Before Opening the Instrument |
121 |
|
Troubleshooting Tables |
123 |
4 |
|
|

Status Log |
153 |
List of Error Codes |
154 |
Troubleshooting with the Support Tool |
155 |
Troubleshooting the Individual Measurements or Applications |
155 |
|
5 Repair and Disassembly |
157 |
|
Tools required |
157 |
||
How to find the Correct Procedure |
158 |
||
Removing Directly Accessible Parts |
159 |
||
1.1 |
Removing the Handle |
160 |
|
1.2 |
Removing the Measurement Server Holder |
160 |
|
1.3 |
Removing the I/O Boards and Interface Board |
162 |
|
1.4 |
Removing the Recorder |
163 |
|
1.5 |
Removing the Navigation Point Knob |
164 |
|
1.6 |
Removing the Quick Release Mount and Knob |
164 |
|
1.7 |
Removing the Fix Mount |
164 |
|
2.0 Opening the Front of the Monitor |
166 |
||
2.1 |
Removing the Backlight Tubes |
167 |
|
2.2 |
Removing the Backlight Inverter Board |
168 |
|
2.3 |
Removing Power On LED board and Silicon Pad |
169 |
|
2.4 |
Removing the HIF Board, Silicon Pad and Spacer |
170 |
|
2.5 |
Removing the Flex Adapter Cable |
171 |
|
2.6 |
Removing the Battery Board |
172 |
|
2.7 |
Removing Recorder Board Assembly |
173 |
|
2.8 |
Removing the Loudspeaker |
174 |
|
2.9 |
Removing the Branding Cover |
175 |
|
3.0 |
Separating the Front and Back Half of the Monitor |
175 |
|
3.1 |
Removing the LCD Flat Panel Display, Touch Panel and Front Housing |
176 |
|
3.2 |
Removing the Main Board |
177 |
|
|
3.3 Removing the MSL Assembly |
179 |
|
3.4 |
Removing the Power Supply |
180 |
|
3.5 |
Removing the Frame Housing and Serial Number Plate |
180 |
|
Multi-Measurement Module (MMS) Disassembly |
181 |
||
|
Tools required |
181 |
|
|
Removing the Front Cover |
181 |
|
|
Removing the Mounting Pin |
181 |
|
|
Removing the Top Cover |
182 |
|
|
Removing the DC/DC Board |
183 |
|
|
Removing the MSL Flex Assembly |
183 |
|
|
Reassembling the MSL Flex Assembly |
184 |
|
|
Removing the NBP pump |
186 |
|
|
Refitting the new NBP Pump |
186 |
|
|
Refitting the DC/DC board |
188 |
|
|
Refitting the Cover |
188 |
|
|
Refitting the Front Cover |
189 |
|
5

Final Inspection |
190 |
MMS Extensions - Exchanging the Top Cover, MSL Flex Cable and the Dual Link Bar |
190 |
Exchange Procedures |
191 |
Disassembly Procedures for the M3015A MMS Extension (HW Rev. A) |
202 |
Removing the Front Cover |
202 |
Refit Procedures for the MMS Extension |
206 |
Smart Battery Charger LG1480 (M8043A) |
207 |
Cleaning the Air Filter Mats |
208 |
Replacing the Fan |
208 |
IntelliVue Instrument Telemetry (IIT) |
210 |
Docking Station |
211 |
Exchanging the Main Board |
211 |
Exchanging the Flex Cable |
214 |
|
6 Parts |
217 |
MP20/MP30 Parts |
218 |
|
Multi-Measurement Module (MMS) Parts |
223 |
|
|
MMS Part Number Overview and Identification |
223 |
|
MMS Firmware Overview |
225 |
|
MMS Part Numbers - Front Bezel for M3001 #A01 & #A03 |
226 |
|
MMS Part Numbers - Front Bezel for M3001 #A02 |
226 |
|
MMS Part Numbers - Top Cover and MSL Assembly |
227 |
|
MMS Exchange Part Numbers |
228 |
|
MMS Part Numbers - Label Kits |
230 |
|
MMS Part Numbers - NBP Assembly |
230 |
MMS Extension Parts (M3012A, M3014A, M3015A and M3016A) |
230 |
|
|
MMS Extension Part Numbers - Release Mechanisms |
231 |
|
MMS Extension Part Numbers - Top Cover, Flex Cable and Link Bar |
231 |
|
MMS Extension Part Numbers - Front Bezels |
231 |
|
Exchange Parts List |
233 |
IntelliVue X2 Part Numbers |
234 |
|
|
BISx Solution Replacable Parts |
234 |
Smart Battery Charger Part Numbers |
235 |
|
IntelliVue Instrument Telemetry Part Numbers |
236 |
|
IntelliVue 802.11 Bedside Adapter Part Numbers |
236 |
|
Docking Station Part Numbers |
237 |
|
External Display Part Numbers |
237 |
|
Remote Alarm Device Part Numbers |
239 |
|
Remote Extension Device Part Numbers |
240 |
|
|
7 Installation Instructions |
241 |
Installation Checklist |
241 |
|
Unpacking the Equipment |
242 |
|
Initial Inspection |
242 |
|
6 |
|
|

Mechanical Inspection |
242 |
Electrical Inspection |
242 |
Claims For Damage and Repackaging |
243 |
Mounting Instructions |
243 |
Connecting the Monitor to AC Mains |
245 |
Connections |
246 |
Installing Interface Boards |
247 |
Connection of Devices via the MIB/RS232 Interface |
250 |
Connection of USB Devices |
250 |
Installing the Docking Station |
254 |
Installing Remote Devices |
254 |
Mounting the 15” Remote Display (M8031A) |
254 |
Mounting the 15” Remote Display (M8031B) |
255 |
Mounting the 17” Remote Display (M8033A/B/C) |
255 |
Multi-Measurement Module |
257 |
PS/2 Keyboard/Mouse |
266 |
Philips Clinical Network (Wired) |
266 |
Philips Clinical Network (Wireless) |
266 |
Nurse Call Relay |
267 |
Connections |
267 |
ECG Out Functionality |
267 |
Connections |
267 |
Configuration Tasks |
268 |
Checking Country-Specific Default Settings |
268 |
Setting Altitude, Line Frequency, ECG Cable Colors and Height & Weight Units |
269 |
Setting Altitude and Line Frequency |
269 |
Configuring the Equipment Label |
269 |
Configuring the printer |
270 |
Configuring IP Address, Subnet Mask and Default Gateway |
270 |
Configuration Settings for CSCN Routed Bedside Monitors (RBM) |
271 |
Configuring Routed Bedside Monitors Support |
271 |
Handing Over the Monitor |
272 |
|
8 Site Preparation |
275 |
Introduction |
275 |
|
|
Site Planning |
275 |
|
Roles & Responsibilities |
276 |
Monitor M8001A and M8002A Site Requirements |
278 |
|
|
Space Requirements |
278 |
|
Environmental Requirements |
278 |
|
Electrical and Safety Requirements (Customer or Philips) |
279 |
Remote Device Site Requirements |
280 |
|
|
Connecting Non-Medical Devices |
281 |
|
Multi-Measurement Module (MMS) M3001A and IntelliVue X2 M3002A |
281 |
7

|
Remote Displays (M8031A) |
284 |
|
Remote Displays (M8031B) |
285 |
|
Remote Displays - M8033A |
286 |
|
Remote Displays - M8033B |
287 |
|
Remote Displays - M8033C |
288 |
|
Remote Alarm Devices |
290 |
|
Remote Extension Device |
291 |
|
Local Printer |
292 |
Philips Medical LAN |
293 |
|
RS232/MIB/LAN Interface |
293 |
|
Nurse Call Relay Interface |
294 |
|
ECG Out Interface |
294 |
|
|
9 Gas Analyzers |
297 |
|
10 Index |
299 |
8

1
Introduction
This Service Guide contains technical details for the IntelliVue MP20, MP20 Junior and MP30 Patient Monitor, the Multi-Measurement Module (MMS), the IntelliVue X2, and the Measurement Server Extensions.
This guide provides a technical foundation to support effective troubleshooting and repair. It is not a comprehensive, in-depth explanation of the product architecture or technical implementation. It offers enough information on the functions and operations of the monitoring systems so that engineers who repair them are better able to understand how they work.
It covers the physiological measurements that the products provide, the Measurement Server that acquires those measurements, and the monitoring system that displays them.
Who Should Use This Guide
This guide is for biomedical engineers or technicians responsible for troubleshooting, repairing, and maintaining Philips’ patient monitoring systems.
How to Use This Guide
This guide is divided into eight sections. Navigate through the table of contents at the left of the screen to select the desired topic. Links to other relevant sections are also provided within the individual topics. In addition, scrolling through the topics with the page up and page down keys is also possible.
Abbreviations
Abbreviations used throughout this guide are:
Name |
Abbreviation |
IntelliVue MP20/MP30 Patient Monitor |
the monitor |
Multi-Measurement Module |
MMS |
9

1 Introduction |
Responsibility of the Manufacturer |
Name |
Abbreviation |
Measurement Link |
MSL |
Medical Information Bus |
MIB |
Anesthetic Gas Module |
AGM |
Responsibility of the Manufacturer
Philips only considers itself responsible for any effects on safety, EMC, reliability and performance of the equipment if:
-assembly operations, extensions, re-adjustments, modifications or repairs are carried out by persons authorized by Philips, and
-the electrical installation of the relevant room complies with national standards, and
-the instrument is used in accordance with the instructions for use.
To ensure safety and EMC, use only those Philips parts and accessories specified for use with the monitor. If non-Philips parts are used, Philips is not liable for any damage that these parts may cause to the equipment.
This document contains proprietary information which is protected by copyright. All Rights Reserved. Reproduction, adaptation, or translation without prior written permission is prohibited, except as allowed under the copyright laws.
Philips Medizin Systeme Böblingen GmbH
Hewlett-Packard Str. 2
71034 Böblingen, Germany
The information contained in this document is subject to change without notice.
Philips makes no warranty of any kind with regard to this material, including, but not limited to, the implied warranties or merchantability and fitness for a particular purpose.
Philips shall not be liable for errors contained herein or for incidental or consequential damages in connection with the furnishing, performance, or use of this material.
10
Passwords |
1 Introduction |
Passwords
In order to access different modes within the monitor a password may be required. The passwords are listed below.
Monitoring Mode: No password required
Configuration Mode: 71034
Demo Mode: 14432
Service Mode: 1345
Consult the configuration guide before making any changes to the monitor configuration.
Warnings and Cautions
In this guide:
-A warning alerts you to a potential serious outcome, adverse event or safety hazard. Failure to observe a warning may result in death or serious injury to the user or patient.
-A caution alerts you where special care is necessary for the safe and effective use of the product. Failure to observe a caution may result in minor or moderate personal injury or damage to the product or other property, and possibly in a remote risk of more serious injury.
11

1 Introduction |
Warnings and Cautions |
12

2
Theory of Operation
Monitor Theory of Operation
The IntelliVue MP20/MP20Junior/MP30 Patient Monitor:
-displays real-time data
-controls the attached measurement server
-alarms in the case of patient or equipment problems
-offers limited data storage and retrieval (trending)
-interfaces to the Philips Clinical Network and other equipment
A monitor with just a single integrated measurement server can be connected to additional building blocks to form a monitoring system with a large number of measurements, additional interface capabilities and slave display. These elements cooperate as one single integrated real-time measurement system.
NOTE
The following descriptions may vary depending on the monitor option purchased.
13

2 Theory of Operation |
Monitor Theory of Operation |
System Boundaries
The following diagram discusses specific boundaries within the overall system with respect to their openness and real-time requirements:
Measurement LAN
combines components of one patient monitor; real time requirements across all interconnected elements
Philips Clinical Network (wired LAN)
connects multiple patient monitors, information centers, application servers; closed system, only Philips qualified products (tested and with regulatory approval) are connected, Philips is responsible for guaranteed real-time functionality and performance
Philips Clinical Network (wireless)
like Philips Clinical Network (wired) LAN, however due to current wireless technologies available it has reduced bandwidth, longer latencies, reduced functionality
Hospital LAN, Internet
Standard Network, not under Philips control, no guaranteed service, no real-time requirements
14
Monitor Theory of Operation |
2 Theory of Operation |
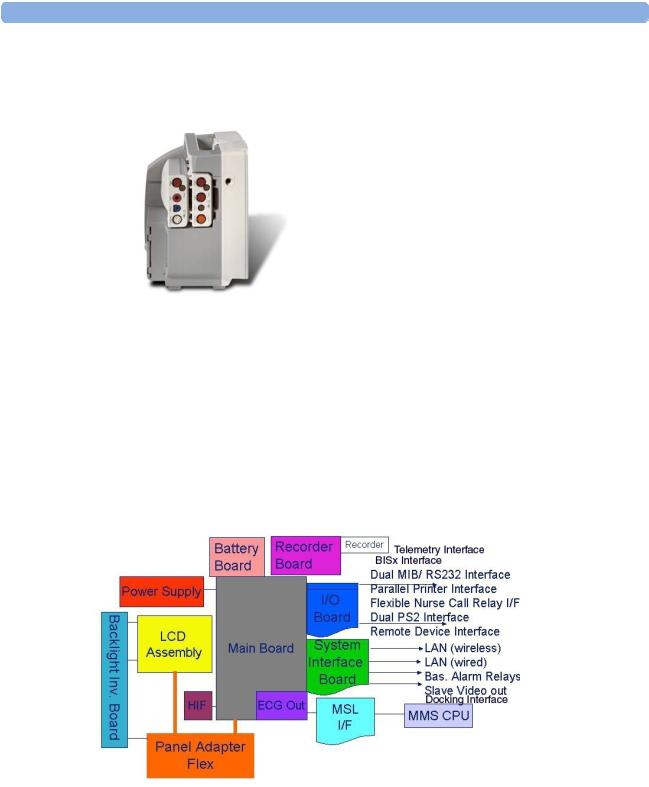
Hardware Building Blocks
The following hardware building blocks make up the monitoring system:
IntelliVue MP20
The MP20 monitor:
-integrates the display and processing unit into a single package
-uses a 10.4” TFT SVGA color display
-uses the Philips Navigation Point as primary input device; computer devices such as mice, trackball, and keyboard can be added optionally
-supports the MMS and MMS extensions.
Building Blocks:
15

2 Theory of Operation |
Monitor Theory of Operation |
IntelliVue MP30
The MP30 monitor:
-integrates the display and processing unit into a single package
-uses a 10.4” TFT XGA color display
-uses the Touchscreen and Philips Navigation Point as primary input devices. Computer devices such as mice, trackball, and keyboard can be added optionally.
-supports the MMS and MMS extensions
Building Blocks:
Optional Hardware
One slot is provided for one of three available system interface boards. If the monitor is ordered with the wireless LAN option a wireless transmitter is required. For further details regarding the wireless network please refer to the M3185A Philips Clinical Network documentation.
16

Monitor Theory of Operation |
2 Theory of Operation |
Compatible Devices
M8045A Docking Station
M3001A Multi-Measurement Module (MMS)
M3002A IntelliVue X2
17

2 Theory of Operation |
Monitor Theory of Operation |
M3012A, M3014A, M3015A, M3016A MMS Extensions
Power Supply
Power Supply Architecture
18

Monitor Theory of Operation |
2 Theory of Operation |
The AC/DC converter transforms the AC power coming from the power plug into 14 V/80W DC source and isolates the monitoring system from the AC power mains.The 14V is distributed via power bus and supplies power to all the components of the system: The 48V DC power needed for the MMS and MMS Extension is created by an isolating DC/DC converter. The power needed for the backlights is converted to 12V DC by the backlight DC/DC converter. The CPU and the non-isolated I/O boards are supplied with 3.3 V and 5 V DC power. Isolated interface boards require a power of 10V AC. The remote HIF board and the LEDs are supplied with 12V DC power.
CPU Boards
The CPU boards have an MPC852/50 MHz processor in the patient monitor and an MPC860/50MHz in the MMS that provides a number of on-chip, configurable interfaces. An array of fast UARTS with configurable protocol options are implemented in an ASIC (along with other system functions such as independent watchdogs etc.), providing interfacing capabilities to measurement modules and System Interface and I/O boards. The serial interfaces can easily be electrically isolated. The main board contains additional video hardware.
The CPUs provide two LAN interfaces to interconnect CPUs (via the MSL) and to connect to the Philips Clinical Network.
The CPU capabilities are identical. Different loading options are coded on serial EEPROMs to support the automatic configuration of the operating system at boot time.
19

2 Theory of Operation |
Monitor Theory of Operation |
System Interface and I/O Boards
Interfaces to the monitor are implemented via I/O boards. The location of these boards is restricted by general rules. The I/O slot designations diagram and the I/O matrix which outline the I/O board placement rules can be found in the Installation Instructions section.
The following is a list of Interface (I/O) boards which may be present in your monitor, depending on your purchased configuration:
System Interface boards:
-Video for slave display
-Philips Clinical Network (LAN wired or wireless)
-Basic Alarm Relay (Nurse Call)
-Docking Interface
I/O boards:
-PS/2
-MIB/RS232
-Flexible Nurse Call
-Parallel printer
-USB
-Remote devices (Remote Alarm Device, Remote Extension Device)
-BISx Interface
-IntelliVue 802.11 Bedside Adapter
The specifications for the above listed interfaces can be found in the technical data sheet for the monitor and in the Installation and Specifications chapter of the Instructions for Use.
20
Monitor Theory of Operation |
2 Theory of Operation |
Data Flow
The following diagram shows how data is passed through the monitoring system. The individual stages of data flow are explained below.
Data Acquisition
Monitoring data (for example patient measurement data in the form of waves, numerics and alerts) is acquired from a variety of sources:
-Measurement Server
The Measurement Server connected to the internal LAN convert patient signals to digital data and applies measurement algorithms to analyze the signals.
-External measurement devices
Data can be also acquired from devices connected to interface boards of the monitor. Software modules dedicated to such specific devices convert the data received from an external device to the format used internally. This applies to the Anesthetic Gas Module.
-Server systems on the Philips Clinical Network
To enable networked applications such as the other bed overview, data can be acquired from server systems attached to the Philips Clinical Network, for example a Philips Information Center
21

2 Theory of Operation |
Monitor Theory of Operation |
Data Provider System Service
All data that is acquired from measurement servers or external measurement devices is temporarily stored by a dedicated data provider system service. All monitor applications use this central service to access the data in a consistent and synchronized way rather than talking to the interfaces directly.
This service makes the applications independent of the actual type of data acquisition device.
The amount of data stored in the data provider system service varies for the different data types. For example several seconds of wave forms and the full set of current numerical values are temorarily stored in RAM.
Persistent Data Storage System Service
Some applications require storage of data over longer periods of time. They can use the persistent data storage system service. Dependent on the application requirements, this service can store data either in battery backed-up (buffered) memory or in flash memory. The buffered memory will lose its contents if the monitor is without power (not connected to mains) for an extended period of time. The flash memory does not lose its contents.
The trend application for example stores vital signs data in a combination of flash memory and buffered memory, while the system configuration information (profiles) is kept purely in flash memory.
Display and User Interface Service
Applications can use high level commands to display monitoring data or status and command windows on the internal LCD panel. These commands are interpreted by the display manager application. This application controls the dedicated video hardware which includes video memory and a special ASIC.
User input is acquired from a variety of input devices, for example the Navigation Point, the touchscreen or other standard input devices (keyboard, mouse) which may be attached to I/O boards. The system software makes sure that the user input is directed to the application which has the operating focus.
Data Output
The monitoring system is very flexible and customizable regarding its data output devices. Built-in devices (for example LAN, alarm lamps, speaker, video) provide the basic output capabilities.
These capabilities can be enhanced by adding additional I/O boards, as required in the specific end-user setup. The additional I/O boards typically provide data to externally attached devices, for example to printers, RS232 based data collection devices, nurse call systems etc.
The monitor can identify I/O boards by means of a serial EEPROM device that stores type and version information. The operating system detects the I/O boards and automatically connects them with the associated (interface driver) application. For some multi-purpose cards it is necessary to configure the card for a particular purpose first (for example the dual MIB/RS232 card can support external touch display, data import, data export).
22
Monitor Theory of Operation |
2 Theory of Operation |
Monitor Applications
The monitor applications provide additional system functionality over the basic measurement and monitoring capabilities. This includes for example trending, report generating, event storage or derived measurements.
In general, the monitor applications use the data provider system service to access the measurement data. Application interfaces to the other system services allow the application to visualize data, to store data over extended periods of time or to output data to other devices.
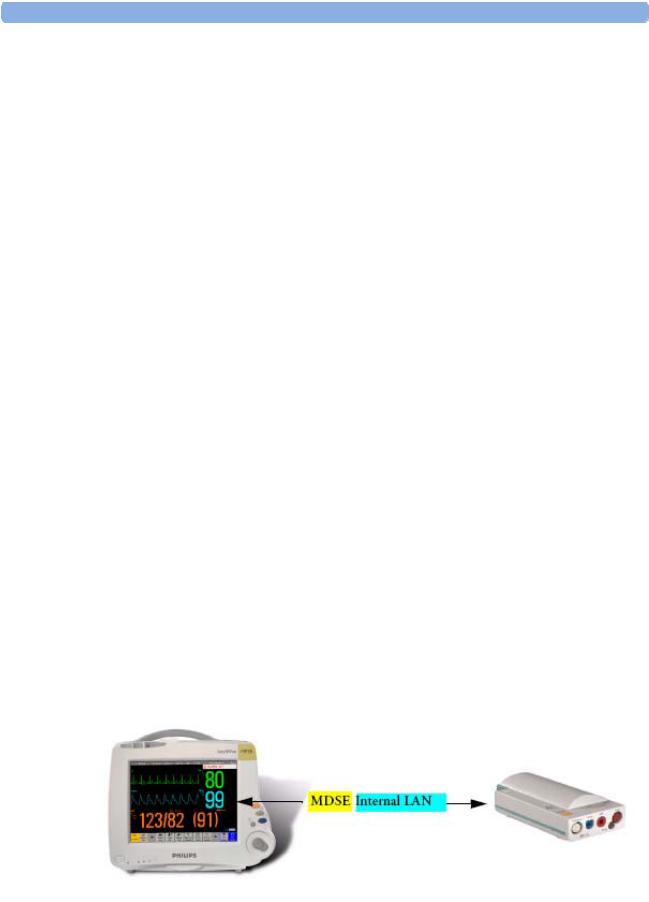
Internal LAN (Measurement Link)
All components of the monitoring system (including measurement servers and CPUs in the monitor) communicate using an IEEE802.3/ Ethernet LAN in the Measurement Link (MSL). This network is used to distribute data between the components, for example:
-Digitized patient signals including wave data, numerical data and status information (typically from the measurement server to a display unit)
-Control data representing user interactions (typically from the display unit to a measurement server)
-Shared data structures, for example representing patient demographical data and global configuration items
The internal LAN allows plug and play configuration of the monitoring system. The system automatically detects plugging or unplugging of measurement servers and configures the system accordingly.
The components on the internal LAN are time-synchronized to keep signal data consistent in the system. Dedicated hardware support for synchronization eliminates any latency of the network driver software.
The integrated LAN provides deterministic bandwidth allocation/reservation mechanisms so that the real-time characteristic of signal data and control data exchange is guaranteed. This applies to the data flow from the measurement server to the monitor (for example measurement signal data) and the data flow from the monitor to a measurement server (for example to feed data to a recorder module).
Integrated communication hubs in the monitor allow flexible cabling options (star topology, daisy chaining of servers).
23

2 Theory of Operation |
Monitor Theory of Operation |
Philips Clinical Network
The monitoring system may be connected to the Philips Clinical Network, for example to provide central monitoring capabilities or other network services. This connection may be through a normal wired connection or through a wireless connection.
The monitor supports the connection of an external wireless adapter or an internal wireless adapter (#J35). Switching between wired and wireless networks is automatically triggered by the plugging or unplugging of the network cable.
The Philips Clinical Network protocols function very similarly to the protocols used on the internal LAN.
After configuration, the monitoring system sends the digitized patient signals including wave data, numerical data and status information onto the network. Control data representing user interactions can be exchanged between the monitoring system and a central station bi-directionally.
Additional protocols are supported for networked applications, for example for the other bed overview function, which allows viewing of monitoring data from other patients on the network.
For plug and play operation, the monitoring system uses the standard BootP protocol to automatically acquire a network address.
How does the Support Tool Work with the Monitor
The support tool is a Windows application typically installed on the laptop of a customer engineer or a biomedical engineer working in the customer’s own service department.
The purpose of the support tool is to upgrade, configure and diagnose all monitoring components (modules, measurement servers, and monitors) in the system over the network.
The service protocol developed for this purpose uses a raw access to the devices without the need for IP addresses etc. over a standard customer network installation, so that even defective devices can be upgraded as long as the few kBytes of initial boot code are working. The boot code itself can also be upgraded using the same protocol.
The tool allows access to internal service information and to serial numbers. It can be remotecontrolled, for example via a dial-up connection from a response center, provided the proper infrastructure is in place.
For details see the Instructions for Use for the Support Tool.
24

Monitor Theory of Operation |
2 Theory of Operation |
Monitor Software Block Diagram
shows the functional block diagram for the monitoring system. A legend explaining terms and diagram elements follows. The information below varies depending on the purchased monitor options.
IntelliVue Patient Monitoring System Functional Block Diagram
25

2 Theory of Operation |
Monitor Theory of Operation |
Block Diagram Legend
Functional Block
Services
Operating System
System Services
Description
The Operating System (OS) provides a layer of isolation between the specific hardware implementation and the application software. The OS performs system checks and allocates resources to ensure safe operation when the system is first started. This includes internal self-tests on several hardware modules and configuration checks for validity of configuration with the operating software. During normal operation, the OS continues to run checks on system integrity. If error conditions are detected the OS will halt monitoring operations and inform the operator about the error condition.
The System Services provide generic common system services. In particular:
They use a real-time clock component to track time. They synchronize to network time sources and verify the accuracy of the system time information. They are also responsible for managing persistent user configuration data for all Measurement Servers and IntelliVue Patient Monitoring System software modules. User configuration data is stored in a non-volatile read/write storage device
Applications
Reports
The Reports Service retrieves current and stored physiological data and status data to format reports for printing paper documentation. The following reports are supported:
-Vital Signs Report
-Graphical Trend Report
-Event Review Report
-Event Episode Report
-ECG Report (12 Lead/Multi-Lead)
-Cardiac Output Report
-Calculations Report (Hemodynamic/Oxygenation/Ventilation)
-Calculations Review Report
-Wedge Report
-Test Report
The Reports service generates report data which can be printed on a local or a central printer.
26

Monitor Theory of Operation |
2 Theory of Operation |
|
|
|
|
Functional Block |
|
Description |
Record |
|
The Record Service retrieves current and stored physiological data and status data |
|
|
to format a continuous strip recording. A recording can be triggered manually by |
|
|
the operator or automatically by an alarm condition. The Record Service uses the |
|
|
services of the Recorder Interface to control an M1116B Recorder. The Record |
|
|
Service can also send data to a central recorder. |
Alarm |
|
The Alarm Service contains logic that prioritizes alarm conditions that are |
|
|
generated either by the Measurement Servers or by IntelliVue Patient Monitoring |
|
|
System software modules. Visual alarm signals (messages) are displayed at the top |
|
|
of the IntelliVue Patient Monitoring System display and alarm sounds are |
|
|
generated by a loudspeaker. Alarm conditions may be generated when a |
|
|
physiological parameter exceeds preselected alarm limits or when a physiological |
|
|
parameter or any other software module reports an inoperative status (technical |
|
|
alarm, for example, the ECG leads may have fallen off the patient). The Alarm |
|
|
service manages the alarm inactivation states, for example suspension of alarms, |
|
|
silencing of alarms, and alarm reminder. Alarm signals may also be configured as |
|
|
latching (alarm signals are issued until they are acknowledged by the operator, |
|
|
even when the alarm condition is no longer true). The Alarm service controls the |
|
|
visual alarm signals (alarm lamps). |
Trend |
|
The Trend service stores the sample values of physiological data and status data |
|
|
with a resolution of 12 seconds, 1 minute or 5 minutes for a period of up to 48 |
|
|
hours. The data is kept in battery buffered read/write storage and flash memory |
|
|
devices to be preserved across power failures. The stored data is protected via |
|
|
consistency checks and checksums. When a new patient is admitted, the trend |
|
|
database erases all data of the previous patient. |
HiRes |
|
The OxyCRG (Oxygen CardioRespiroGram) service derives a high-resolution |
|
|
trend graph from the Beat-to-Beat Heart Rate, SpO2 or tcpO2, and Respiration |
|
|
physiological data. The OxyCRG is specialized for neonatal applications, allowing |
|
|
the operator to identify sudden drops in Heart Rate (Bradycardia) and SpO2 |
|
|
(Desaturation), and supporting the operator in visualizing Apnea situations. |
ADT |
|
The ADT (Admit/Discharge/Transmit) service maintains the patient demographics |
|
|
information. The operator may admit a new patient, discharge the old patient and |
|
|
enter or modify the patient demographics. The ADT service also supports the |
|
|
transport of a patient (trend database) with the M3001A Multi-Measurement |
|
|
Module. The ADT service controls the deletion of old patient data, the upload of |
|
|
trend data from the M3001A and the switching back of all settings to user |
|
|
defaults. It also synchronizes patient information with a central station on the |
|
|
network. |
Calc Param |
|
The Calc Param (Calculated Parameters) service accesses current, stored and |
|
|
manually entered physiological data as input to calculation formulas. With these |
|
|
formulas, derived hemodynamic, oxygenation and ventilation variables are |
|
|
computed. The calculation results, including the input parameters, are stored for |
|
|
later review using the Trend service. |
|
|
|
27

2 Theory of Operation
Functional Block
Interface Managers
MDSE
Printer
Display & Operator
Interface
Interfaces
LAN
Centronics
Monitor Theory of Operation
Description
The MDSE (Medical Data Service Element) Interface Manager is responsible for the exchange of real-time data between the IntelliVue Patient Monitoring System display unit and the Measurement Servers and Flexible Module Rack as well as between the IntelliVue Patient Monitoring System display unit and other devices attached to the network. MDSE establishes and maintains a data communication link between the devices. It provides configuration information about the remote device to applications in the local device and it allows the exchange of measurement data and status information between the devices.
The Printer Interface Manager provides a high level interface to a printer. It provides means to:
-establish a connection to the printer
-transfer data to the printer
-get status of the printer
-close connection to the printer
The Printer Interface Manager also supervises the connection to the printer and whether the printer accepts data (for example paper out). The Printer Interface Manager notifies the operator in such cases.
The Display and Operator Interface Manager performs the following tasks:
-Screen presentation of real-time and stored physiological measurement data, alarm condition data and status information received from the MDSE interface manager, the Alarm service or other IntelliVue Patient Monitoring System modules
-Screen presentation of operating controls (control windows)
-Processing of operating control commands received from HIF Control interface. The module verifies and interprets the received commands and forwards them to other software modules of the IntelliVue Patient Monitoring System display unit, Measurement Servers or Flexible Module Rack
-Sound generation (issues audible alarm signals and generates audible information signals, for example QRS and SpO2 tones, operator audible feedback)
The LAN interface implements the physical layer of IEEE 802.3. The LAN interface performs Manchester encoding/decoding, receive clock recovery, transmit pulse shaping, jabber, link integrity testing, reverse polarity detection/correction, electrical isolation, and ESD protection. Electronically separated interfaces are used for communication to the Measurement Servers or Flexible Module Rack and to the network.
The Centronics interface implements the standard signaling method for bi-directional parallel peripheral devices according to IEEE 1284-I. The interface is used as a parallel interface to a standard printer with electrical isolation and ESD protection.
28

Monitor Theory of Operation |
2 Theory of Operation |
|
|
|
|
Functional Block |
|
Description |
Display Controller |
|
The Display Controller Interface consists of a video controller chip, video RAM |
|
|
and the controlling software. The Display Controller interface processes the high |
|
|
level display commands (character and graphic generation, wave drawing) and |
|
|
translates them into pixels, which are written into the video RAM where the video |
|
|
controller chip generates the video synchronization signals and the pixel stream |
|
|
for the Color LCD Display. |
HIF Control |
|
The HIF (Human Interface Control) interface scans the Human Interface devices |
|
|
for operator controls (Touch Screen, Speed Point, USB and PS/2 devices), formats |
|
|
the collected data and sends it to the display and Operating Interface. |
ECG-Out Marker-In |
|
The ECG Out/Marker In interface receives the ECG waveform directly from the |
|
|
ECG/Resp Arrhythmia ST-Segment physiological algorithm via an RS-422 serial |
|
|
interface and converts the digital ECG signal to an analog ECG signal. In addition, |
|
|
the ECG Out controller receives from a connected device the marker information |
|
|
and forwards this data to the ECG/Resp Arrhythmia ST-Segment physiological |
|
|
algorithm. The converted analog signal is used to synchronize a connected device |
|
|
to the patient’s ECG |
RS-422 |
|
The serial link RS-422 interface communicates the ECG signal to the ECG |
|
|
Output/Marker In of the IntelliVue Patient Monitoring System display unit. The |
|
|
interface is a serial, differential, full-duplex link. The interface is ESD protected. |
PS/2 |
|
The PS/2 interface supports the serial protocol of standard PS/2 devices (mouse). |
|
|
The PS/2 serial protocol is interpreted by the HIF Control interface. |
Nurse Call |
|
The Nurse Call board contains 2 connectors. A phone jack type connector and a |
|
|
multi-port connector. The phone jack type connector has a single close-on-alarm |
|
|
relay. The multi-port connector has three alarm relays which are configurable to |
|
|
be open or closed on alarm. In addition, this interface has an audible alert |
|
|
capability for loss of AC power. |
MIB |
|
The MIB interface allows full-duplex, short-haul asynchronous binary |
|
|
communication between the monitor and an arbitrary (medical/non-medical) |
|
|
device using an eight-pin RJ45 modular connector. Switching between MIB and |
|
|
RS232 protocol is possible. |
Docking Interface |
|
The docking interface provides necessary connections for docking an MP20/30 or |
|
|
MP40/50 monitor onto the docking station. |
BISx Interface |
|
The BISx interface allows the usage of Aspect’s BISx solution with an MP20/30 |
|
|
monitor. |
IIT Interface |
|
The IIT interface allows operation of the MP2/X2/MP5/MP20/MP30/MP40/MP50 |
|
|
monitors with IntelliVue Instrument Telemetry. |
|
|
|
29
Loading...