


Sample Prep + 2-D Electrophoresis + Imaging
2-D
18002 |
70994625354 |
2-D Electrophoresis Workflow
How-To Guide
Fourth Edition
|
|
|
2 1 |
|
|
|
|
8 7 |
6 5 |
|
|
10 |
9 |
|
|
|
|
|
|
|
|
||
|
|
|
1 11 |
10 |
9 |
|
|
|
|
|
|

2-D Electrophoresis Guide
About This Guide
This guide describes the experimental methods and tools used in 2-D electrophoresis and proteomics research. It provides background information about technologies common to all proteomics studies as well as protocols and advice you can use as a starting point for your studies. This guide also explains how experimental conditions can be varied and interpreted to optimize your results and provides an extensive set of references that you can consult for more information. Since each sample, experimental approach, and objective
is different, this guide offers ideas for developing customized protocols suitable for the analysis of your samples.
Bio-Rad’s Proteomics Program
From sample preparation to protein analysis, Bio-Rad’s tools provide
you with choices in methodology, protocols, and products. Our informative 2-D Electrophoresis and Analysis Applications and Technologies web pages are a valuable resource with video tutorials, protocols, troubleshooting tips, and much more. To learn more, visit www.bio-rad.com/2DElectroAnalysis.
Table of Contents
Part I: Theory and Product Selection
Chapter 1 Overview of Two-Dimensional Electrophoresis
The Context of Proteomics
Overview of Experimental Design
Sample Preparation First-Dimension Separation: IEF
Second-Dimension Separation: SDS-PAGE Detection
Image Acquisition, Analysis, and Spot Cutting
Protein Digestion and Identification by Mass Spectrometry
Chapter 2 Sample Preparation
The Importance of Sample Preparation General Considerations
Cell Lysis
Protein Solubilization
Chaotropic Agents Detergents Reducing Agents
Ampholytes, Buffers, and Other Additives
Removal of Interfering Substances
General Considerations Nucleic acids (DNA and RNA) Polysaccharides
Phenolic Compounds Lipids
Salts and Other Small Ionic Compounds Prevention of Keratin Contamination
Prefractionation
Fractionation by Subcellular Location
Fractionation by Solubility/Hydrophobicity
Fractionation by Protein Charge
Fractionation by pI
Fractionation by Size (MW)
Depletion and Dynamic Range Reduction
Depletion
Dynamic Range Reduction
ProteoMiner Technology
Sample Quantitation (Protein Assays)
5 |
Chapter 3 The First Dimension: |
|
|
|
Isoelectric Focusing (IEF) |
33 |
|
5 |
Protein Separation by Isoelectric Point (pI) |
34 |
|
|
|
||
6 |
IEF Media: IPG Strips vs. Carrier Ampholytes |
35 |
|
|
|
||
6 |
Selection of IPG Strips |
36 |
|
Choice of pH Gradient |
36 |
||
8 |
|||
Choice of IPG Strip Length |
36 |
||
8 |
|||
|
|
||
8 |
Estimation of pl |
37 |
|
9 |
Sample Application |
|
|
9 |
38 |
||
9 |
Sample Application during Rehydration |
38 |
|
|
Sample Application by Cup Loading |
39 |
|
11 |
Setup for IEF |
39 |
|
|
|||
12 |
Power Conditions for IEF |
40 |
|
|
|||
12 |
Chapter 4 The Second Dimension: |
|
|
12 |
|
||
SDS-PAGE |
43 |
||
15 |
|||
Protein Separation by Size |
44 |
||
15 |
|||
15 |
Selection of Polyacrylamide Gels |
44 |
|
16 |
|||
Choice of Gel Percentage (Composition) |
45 |
||
17 |
|||
Choice of Gel Size |
47 |
||
|
|||
19 |
Choice of Buffer System |
47 |
|
19 |
Transition from First to Second Dimension |
52 |
|
19 |
|||
|
|
||
20 |
Power Conditions and Reagents for SDS-PAGE |
52 |
|
20 |
|||
|
|
||
20 |
Molecular Weight Estimation |
53 |
|
20 |
Chapter 5 Detection |
55 |
|
21 |
|||
|
|
||
22 |
Detection of Proteins in Gels |
56 |
|
22 |
|||
Coomassie Stains |
56 |
||
24 |
|||
Silver Stains |
57 |
||
24 |
|||
Fluorescent Stains |
57 |
||
25 |
|||
Negative Stains |
57 |
||
26 |
|||
Stain-Free Technology |
57 |
||
|
|||
27 |
Detection of Proteins on Western Blots |
61 |
|
27 |
|||
|
|
||
28 |
|
|
29
30
1

2-D Electrophoresis Guide |
Table of Contents |
|
|
Chapter 6 Image Acquisition, Analysis, |
|
and Spot Cutting |
63 |
Finding Protein Spots of Interest |
64 |
Image Acquisition |
64 |
Image Analysis |
65 |
Image Optimization, Spot Detection, and Quantitation |
66 |
Gel Comparison |
66 |
Data Normalization |
66 |
Data Analysis and Reporting |
67 |
Spot Cutting from 2-D Gels |
67 |
Chapter 7 Identification and |
|
Characterization of 2-D Protein Spots |
69 |
Beyond Excision |
70 |
Proteolytic Digestion |
70 |
Washing |
70 |
Reduction and Alkylation |
70 |
In-Gel Proteolytic Digestion |
70 |
Identification by Mass Spectrometry |
71 |
Peptide Mass Fingerprinting |
72 |
Tandem Mass Spectrometry (MS/MS) |
73 |
Establishment of 2-D Databases |
73 |
Part II: Methods |
75 |
Chapter 8 Sample Preparation |
75 |
Tips for Sample Preparation |
76 |
Lysis (Cell Disruption) |
76 |
Protein Solubilization |
76 |
Buffers and Solutions |
77 |
Cell Lysis and Protein Extraction Procedures |
78 |
Suspension Cultured Human Cells |
78 |
Monolayer Cultured Human Cells |
78 |
Mammalian Tissue |
79 |
Microbial Cultures |
79 |
Plant Leaves |
80 |
Sample Cleanup |
81 |
Buffer Exchange (Desalting) |
81 |
Sample Quantitation (RC DC Protein Assay) |
82 |
Microfuge Tube Assay Protocol (1.5 ml) |
82 |
Chapter 9 First-Dimension IEF |
|
Part III: Troubleshooting |
111 |
with IPG Strips |
85 |
Isoelectric Focusing |
112 |
Tips for IEF |
86 |
SDS-PAGE |
113 |
|
|
||
IPG Strip Rehydration and Sample Loading |
86 |
Total Protein Staining |
114 |
|
|
||
Performing IEF |
87 |
2-D Gel Evaluation |
115 |
IPG Strip Rehydration in Rehydration/Equilibration Trays |
|
||
|
|
|
|
Followed by IEF |
87 |
Part IV: Appendices |
|
IEF with Gel-Side Up |
87 |
125 |
|
IEF with Gel-Side Down |
88 |
Appendix A |
|
Cup Loading (IEF with Gel-Side Up) |
88 |
126 |
|
IPG Strip Rehydration in the Focusing Tray Followed by IEF |
89 |
Glossary |
126 |
IEF Programming Recommendations |
90 |
Appendix B |
130 |
Chapter 10 Second-Dimension SDS-PAGE |
|
References |
130 |
95 |
Related Bio-Rad Literature |
132 |
|
Tips for SDS-PAGE |
96 |
Appendix C |
133 |
IPG Strip Equilibration |
|
Ordering Information |
133 |
97 |
|
|
|
Sealing IPG Strips onto SDS-PAGE Gels |
98 |
|
|
SDS-PAGE |
99 |
|
|
Chapter 11 Protein Detection |
101 |
|
|
Tips for Total Protein Staining |
102 |
|
|
Long-Term Storage of Stained Gels |
102 |
|
|
Total Protein Staining |
103 |
|
|
Bio-Safe Coomassie Stain |
103 |
|
|
Flamingo Fluorescent Gel Stain |
103 |
|
|
Oriole Fluorescent Gel Stain |
104 |
|
|
SYPRO Ruby Protein Gel Stain |
104 |
|
|
Silver Stain Plus Kit |
105 |
|
|
Chapter 12 In-Gel Trypsin Digestion |
107 |
|
|
Tryptic Digestion Protocol |
108 |
|
|
Reagents and Solutions |
108 |
|
|
Destaining Gel Plugs from Silver-Stained Gels |
108 |
|
|
(Pre-Treatment) |
|
|
|
General Destaining Protocol |
109 |
|
|
Reduction and Alkylation Protocol |
109 |
|
|
Digestion Protocol |
109 |
|
|
Extraction Protocol |
109 |
|
|
2 |
3 |
|
|

2-D Electrophoresis Guide |
Theory and Product Selection |
PART I
Theory and
Product Selection
CHAPTER 1
Overview of
Two-Dimensional
Electrophoresis
4 |
5 |
|
|

2-D Electrophoresis Guide
The Context of Proteomics
Proteome analysis (proteomics) is the comprehensive analysis of proteins present in a sample and representing a particular physiological state at a particular point in time. The aim of proteomics is to determine the presence, relative abundance, and posttranslational modification state of a large fraction of the proteins in a sample (Wilkins et al. 1996).
Since proteins are directly involved in cellular structure, regulation, and metabolism, proteomics can often yield a more informative and accurate picture of the state of a living cell than can analysis of the genome or mRNA.
One of the greatest challenges of proteome analysis is the reproducible separation of complex protein mixtures while retaining both qualitative and quantitative relationships. Many combinations of techniques can be used to separate and analyze proteins, but two-dimensional (2-D) electrophoresis is uniquely powerful in its ability to separate hundreds to thousands of products simultaneously (Choe and Lee 2000). This technique uses two different electrophoretic separations, isoelectric focusing (IEF) and SDS-PAGE, to separate proteins according to their isoelectric point (pI) and molecular weight.
The identities of individual protein spots from the gel can then be identified by mass spectrometry (MS) of their tryptic peptides. Together with computer-
assisted image evaluation systems for comprehensive qualitative and quantitative examination of proteomes, proteome analysis also allows cataloguing and comparison of data among groups of researchers.
Other common methods of proteome analysis involve the proteolytic digestion of sample proteins and the chromatographic separation of the resulting peptides coupled directly to mass spectrometric analysis. Peptides are identified by referencing a database, and their proteins of origin are inferred. While these methods are largely automatable and provide an impressive depth of proteome coverage, some information is lost when analyzing protein fragments instead of intact proteins. The 2-D electrophoresis approach maintains proteins in their intact states and enables the study of isoform distribution, which is not possible if the sample is proteolytically digested prior to separation. Since proteins can be selected through image analysis, mass spectrometry need be applied only to the proteins of interest. This is an important consideration when access to instrumentation or the expense of mass spectrometric analysis is a limitation.
The suitability of 2-D electrophoresis to proteome analysis is clear, but its applications also extend to biomarker detection, development of drug and other therapies, and optimization and development of protein purification strategies.
Overview of Experimental Design
The general workflow in a 2-D electrophoresis experiment (Figure 1.1) and some of the factors affecting the way the experiment is performed are outlined next.
Chapter 1: Overview of Two-Dimensional Electrophoresis |
Theory and Product Selection |
2-D Electrophoresis Workflow
Sample Preparation
Prepare the protein at a concentration and in a solution suitable for IEF. Choose a method that maintains the native charge, solubility, and relative abundance of proteins of interest.
First-Dimension Separation: IEF
Separate proteins according to pI by IEF. Select the appropriate IPG strip length and pH gradient for the desired resolution and sample load. Select appropriate sample loading and separation conditions.
Second-Dimension Separation: SDS-PAGE
Separate proteins according to size by SDS-PAGE. Select the appropriate gel size and composition and separation conditions.
Detection
Visualize proteins using either a total protein stain or fluorescent protein tags. Select a staining technique that matches sensitivity requirements and available imaging equipment.
Image Acquisition and Analysis
Capture digital images of the 2-D protein patterns using appropriate imaging equipment and software. Then analyze the patterns using 2-D analysis software.
Protein Excision, Digestion, and Identification
Excise protein spots of interest from the gel, digest the proteins, and analyze the digests by MS.
Fig. 1.1. General workflow for a 2-D experiment.
6 |
7 |

2-D Electrophoresis Guide |
Chapter 1: Overview of Two-Dimensional Electrophoresis |
Theory and Product Selection |
|
|
|
Sample Preparation
Effective sample preparation is key for the success of the experiment. The sample dictates the type of extraction technique used, and the solubility, charge, and pI of the proteins of interest affect the method of solubilization. The protein fraction used for 2-D electrophoresis must be solubilized in a denaturing solution of low ionic strength; this solution cannot contain components that alter protein size or charge. Sample preparation also involves optional steps to deplete abundant proteins, reduce the complexity
of the protein mixture, or select a subproteome of interest. Details and recommendations for sample preparation can be found in Chapter 2.
First-Dimension Separation: IEF
In 2-D electrophoresis, the first-dimension separation step is IEF. Proteins are separated electrophoretically on the basis of their pI, the pH at which a protein carries no net charge. For general proteome analysis, IEF is best performed in an immobilized pH gradient
Sample Preparation
First Dimension
Isoelectric focusing (IEF), separation by pl
Low pH
Second Dimension
SDS-PAGE, separation by MW
(IPG) strip and under conditions aimed at completely denaturing and solubilizing all the proteins in the sample (as opposed to native IEF, which aims to preserve native structures and activities). Chapter 3 discusses IEF.
Second-Dimension Separation: SDS-PAGE
The second-dimension separation step is SDS-PAGE, where the proteins already separated by IEF are further separated by their size. Prior to second-dimension separation, an equilibration step is applied to
the IPG strip containing the separated proteins. This process reduces any disulfide bonds that may
have re-formed during the first dimension and alkylates the resultant sulfhydryl groups. Concurrently, the proteins are complexed with SDS for separation on the basis of size. Following electrophoretic separation on a slab gel, the result is a two-dimensional array
of separated protein “spots” (Figure 1.2). Seconddimension SDS-PAGE is discussed in Chapter 4.
High pH
High MW
Detection
Proteins separated in gels are usually not visible to the naked eye and must, therefore, be either stained or labeled for visualization. Several factors determine the best choice of staining method, including desired sensitivity, linear range, ease of use, expense, and the type of imaging equipment available. There is no ideal universal stain. Sometimes proteins are detected after transfer to a membrane support by western blotting. These topics are discussed in Chapters 5 and 6.
Image Acquisition, Analysis, and Spot Cutting
The ability to collect data in digital form is one of the major factors that make 2-D gels a practical means of collecting proteome information. It allows the unbiased comparison of samples and gels, transfer of information among research groups, and cataloguing of data. Many types of imaging devices interface with software designed specifically to collect, interpret, and compare proteomics data.
Once interesting proteins are selected by differential analysis or other criteria, the proteins can be excised from gels and identified by mass spectrometry.
The ExQuest™ spot cutter, which can be operated independently or programmed to run from PDQuest™ software, automatically cuts selected protein spots from gels with precision and deposits them into the wells of microplates.
Imaging equipment, software, and the ExQuest spot cutter are discussed in Chapter 6.
Protein Digestion and Identification by Mass Spectrometry
The excised gel plugs are destained and enzymatically digested (usually with trypsin) in preparation for identification by mass spectrometry. The use of mass spectrometry for precise mass and partial sequence determination, coupled with the availability of protein sequence databases, has made high-throughput protein identification possible. An overview of this process is provided in Chapter 7.
Low MW
Fig. 1.2. 2-D electrophoresis. Protein spots result from two separations: first by pI (IEF) and then by size (SDS-PAGE).
8 |
9 |

2-D Electrophoresis Guide |
Theory and Product Selection |
|
|
CHAPTER 2
Sample Preparation
10 |
11 |
|
|

2-D Electrophoresis Guide |
Chapter 2: Sample Preparation |
Theory and Product Selection |
|
|
|
The Importance of Sample Preparation
Sample preparation contributes significantly to the overall reproducibility and accuracy of protein expression analysis (Link 1999, Rabilloud 1999, Molloy 2000). Without proper sample preparation,
proteins may not separate from one another or may not be represented in the 2-D pattern.
A successful sample preparation strategy enhances separation quality by:
■■Effectively and reproducibly solubilizing proteins of interest
■■Preventing protein aggregation and loss of solubility during IEF
■■Preventing proteolysis or other chemical or enzymatic protein modifications
■■Removing or minimizing the effect of contaminants such as salts, detergents, nucleic acids, and other interfering molecules
■■Yielding proteins of interest at detectable levels, which may require fractionation to reduce protein sample complexity or removal of interfering abundant or irrelevant proteins
This chapter provides an overview of the principles and recent developments in sample preparation strategies prior to first-dimension IEF.
General Considerations
Since protein types and sample origins show great diversity, there is no universal sample preparation method. In addition, some proteins simply cannot be solubilized under conditions compatible with IEF. Sample preparation procedures must be optimized empirically and tailored to each sample type and experimental goal. The following general sample preparation guidelines should be kept in mind:
■■Keep the sample preparation workflow as simple as possible; increasing the number of sample handling steps may increase variability and the risk of sample loss
■■With cell or tissue lysates, include protease inhibitors to minimize artifacts generated by proteolysis; protease inhibitors are generally not required for samples like serum or plasma
■■Solubilize proteins in a solution that is compatible with IEF. Incubate proteins in 2-D lysis solution for at least 30 min at room temperature (denaturation, solubilization, and disaggregation are timedependent processes)
■■Determine the amount of total protein in each sample using a protein assay that is compatible with chemicals in your samples
■■Avoid freeze-thaw cycles; use protein extracts immediately or aliquot them into appropriately sized batches and store them at –70°C
Cell Lysis
The effectiveness of a cell lysis method determines the accessibility of intracellular proteins for extraction and solubilization. Different biological materials require different lysis strategies, which can be divided into two main categories: gentle methods and harsher methods (Table 2.1).
■■Use gentle cell disruption protocols with cells that lyse easily, such as blood cells and tissue culture cells
■■Use harsher methods, which are based mainly on mechanical rupture (Goldberg 2008), with biological materials that have tough cell walls (for example, plant cells and tissues, and some microbes)
■■When working with a new sample, compare at least two different cell disruption protocols with respect to yield (by protein assay) and qualitative protein content (by one-dimensional SDS-PAGE)
■■Optimize the power settings of mechanical rupture systems and the incubation times of lysis approaches
■■Mechanical cell lysis usually generates heat; use cooling where required to avoid overheating the sample
A number of other components are often added to disruption protocols. Sand, resin, or glass beads facilitate the disruption of tissues and of plant and yeast cell walls when added to manual grinding procedures. Hypotonic buffers cause cells to burst more readily under physical shearing, and enzymes such as cellulase, pectinase, lyticase, and lysozyme are added to break down plant, yeast, and bacterial cell walls. Nucleases can be added to remove nucleic acids, which can increase sample viscosity and interfere with subsequent separation (see the Removal of Interfering Substances section).
Table 2.1. Suitability of cell disruption methods for various sample types.
|
|
|
|
Yeast, |
|
Green |
|
Mammalian |
|
|
|
|
Algae, |
|
Plant |
Soft |
Cell |
Technique |
Description |
Bacteria |
Fungi |
Seeds |
Material |
Tissues |
Culture |
|
|
|
|
|
|
|
|
|
|
Gentle Methods |
|
|
|
|
|
|
|
|
|
|
|
|
|
|
|
|
|
Osmotic lysis |
Suspension of cells in hypotonic solution; |
|
— |
— |
— |
— |
— |
• |
|
cells swell and burst, releasing cellular contents |
|
|
|
|
|
|
|
Freeze-thaw lysis |
Freezing of cells in liquid nitrogen |
|
— |
— |
— |
— |
— |
• |
|
and subsequent thawing |
|
|
|
|
|
|
|
|
|
|
|
|
|
|
|
|
Detergent lysis |
Suspension of cells in detergent-containing |
|
— |
— |
— |
— |
— |
• |
|
solution to solubilize the cell membrane; |
|
|
|
|
|
|
|
|
this method is usually followed by another |
|
|
|
|
|
|
|
|
disruption method, such as sonication |
|
|
|
|
|
|
|
Enzymatic lysis |
Suspension of cells in iso-osmotic solutions |
|
• |
• |
— |
• |
— |
— |
|
containing enzymes that digest the cell wall |
|
|
|
|
|
|
|
|
(for example, cellulase and pectinase for plant |
|
|
|
|
|
|
|
|
cells, lyticase for yeast cells, and lysozyme for |
|
|
|
|
|
|
|
|
bacterial cells); this method is usually followed by |
|
|
|
|
|
|
|
|
another disruption method, such as sonication |
|
|
|
|
|
|
|
|
|
|
|
|
|
|
|
|
Harsher Methods |
|
|
|
|
|
|
|
|
|
|
|
|
|
|
|
|
|
Sonication |
Disruption of a cell suspension, cooled on ice |
|
• |
• |
— |
— |
— |
• |
|
to avoid heating and subjected to short bursts |
|
|
|
|
|
|
|
|
of ultrasonic waves |
|
|
|
|
|
|
|
French press |
Application of shear forces by forcing a cell |
|
• |
• |
— |
• |
— |
• |
|
suspension through a small orifice at high pressure |
|
|
|
|
|
|
|
|
|
|
|
|
|
|
|
|
Grinding |
Breaking cells of solid tissues and microorganisms |
• |
• |
• |
• |
• |
— |
|
|
with a mortar and pestle; usually, the mortar is |
|
|
|
|
|
|
|
|
chilled with liquid nitrogen and the tissue or cells |
|
|
|
|
|
|
|
|
are ground to a fine powder |
|
|
|
|
|
|
|
Mechanical |
Homogenization with either a handheld device |
|
— |
— |
— |
• |
• |
— |
homogenization |
(for example, Dounce and Potter-Elvehjem |
|
|
|
|
|
|
|
|
homogenizers), blenders, or other motorized |
|
|
|
|
|
|
|
|
devices; this approach is best suited for soft, |
|
|
|
|
|
|
|
|
solid tissues |
|
|
|
|
|
|
|
|
|
|
|
|
|
|
|
|
Glass-bead |
Application of gentle abrasion by vortexing |
|
• |
• |
— |
— |
— |
• |
homogenization |
cells with glass beads |
|
|
|
|
|
|
|
|
|
|
|
|
|
|
|
|
All but the most gentle cell disruption methods destroy the compartmentalization of a cell, causing the release of hydrolases (phosphatases, glycosidases, and proteases). These enzymes modify proteins in
the lysate, which complicates differential analysis. The data generated by 2-D electrophoresis are only meaningful when the integrity of the sample proteins reflects the state in which they are found in the living organism. Avoid enzymatic degradation by using one or a combination of the following techniques:
■■Disrupt the sample or place freshly lysed samples in solutions containing strong denaturing agents such as 7–9 M urea, 2 M thiourea, or 2% SDS. In this environment, enzymatic activity is often negligible
■■Perform cell lysis at low temperatures to diminish enzymatic activity
■■Lyse samples at pH >9 by adding a base such as sodium carbonate or Tris(hydroxymethyl)- aminomethane (Tris) to the lysis solution (proteases are often least active at basic pH)
■■Add protease inhibitors to the lysis solution. Examples include either small molecules, such as phenylmethylsulfonyl fluoride (PMSF),
aminoethyl-benzene sulphonyl fluoride (AEBSF), tosyl lysine chloromethyl ketone (TLCK),
tosyl phenyl chloromethyl ketone (TPCK), ethylenediaminetetraacetic acid (EDTA), and benzamidine, or peptide protease inhibitors such as leupeptin, pepstatin, aprotinin, and bestatin. For best results, use a combination of inhibitors in a protease inhibitor cocktail
■■If protein phosphorylation is to be studied, include phosphatase inhibitors such as fluoride or vanadate
Following cell disruption:
■■Check the efficacy of cell disruption by light microscopy (if the sample is a cell suspension)
■■Centrifuge all extracts extensively (20,000 × g for 15 min at 15°C) to remove any insoluble material; solid particles may block the pores of the IPG strip
12 |
13 |
2-D Electrophoresis Guide |
Chapter 2: Sample Preparation |
Theory and Product Selection |
|
|
|
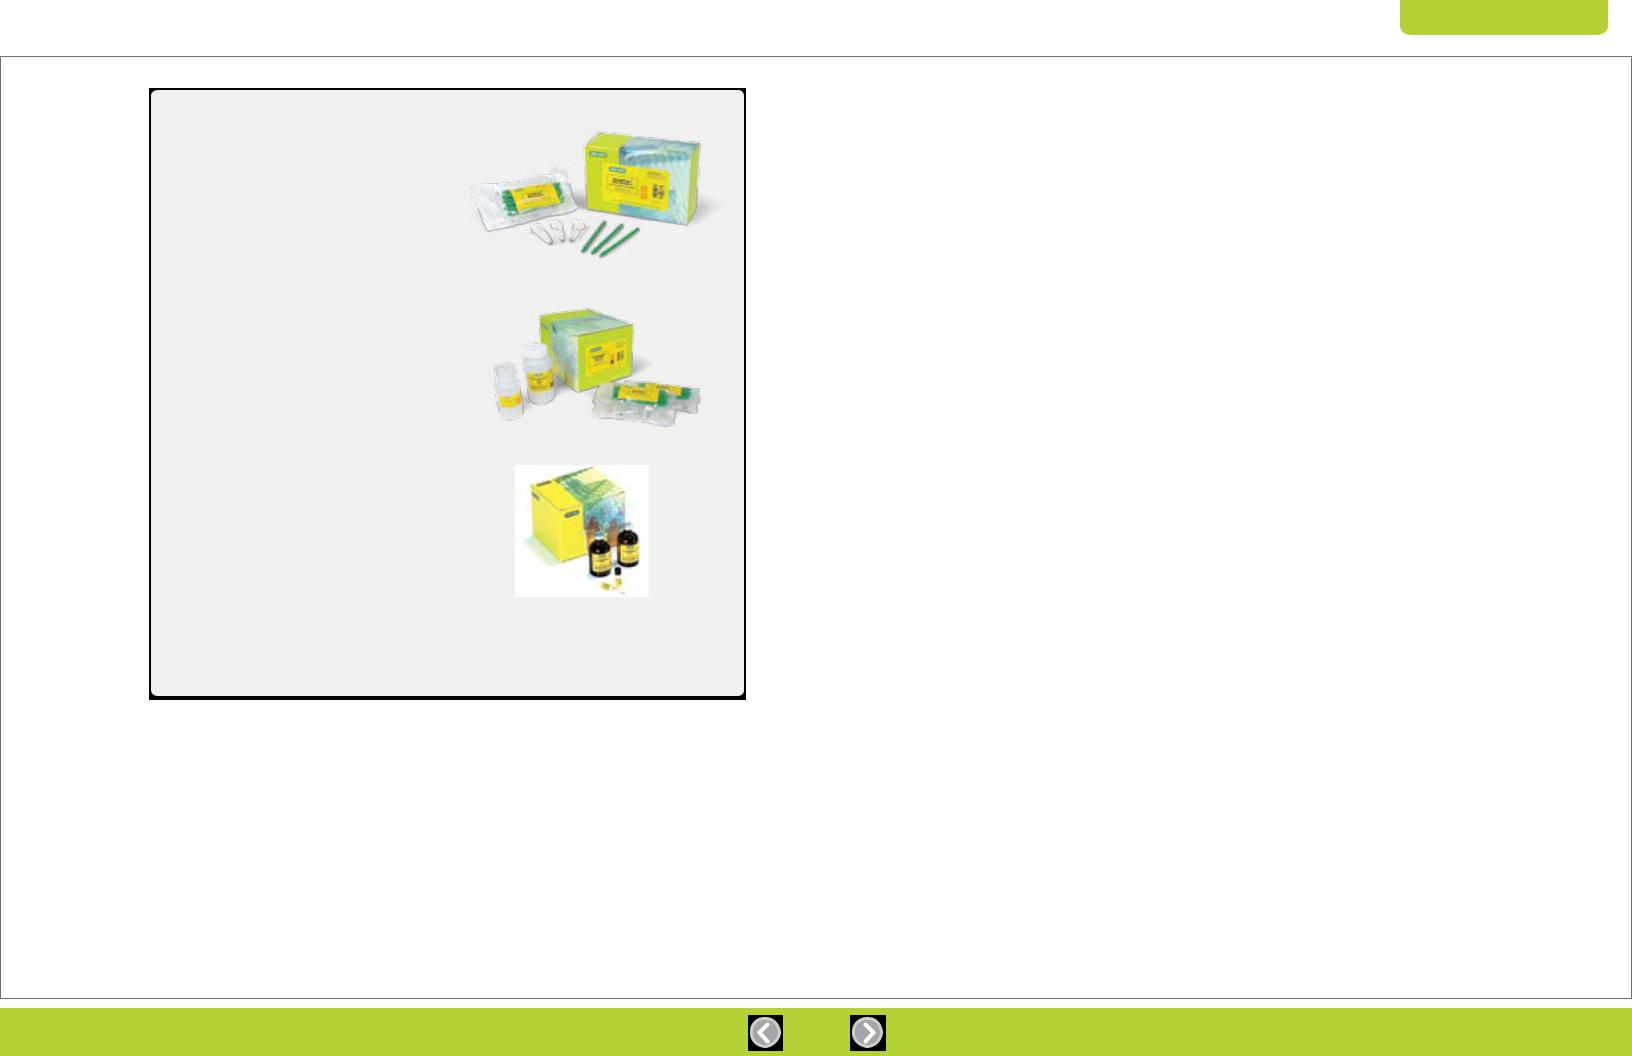
Products for Cell Lysis and Protein Extraction
ReadyPrep™ mini grinders contain a grinding tube, grinding resin, and fitted pestle and offer an easy, efficient mechanism for manually grinding small biological samples. The grinding resin is a neutral abrasive material made of a high-tensile microparticle that does not bind protein or nucleic acids. The combination of the pestle and resin
effectively disrupts animal or plant tissues and cells. ReadyPrep mini grinders are available for purchase separately or as components of the MicroRotofor™ cell lysis kits.
Bio-Rad also offers a range of kits for cell disruption and protein extraction:
■■MicroRotofor lysis kits1 provide convenient, effective methods optimized for the preparation of protein samples from mammalian, plant, yeast, and bacterial sources. Depending on the sample type, these kits employ tissue maceration using ReadyPrep mini grinders and/or solubilization into a chaotropic extraction buffer
■■The ReadyPrep protein extraction kit (total protein) uses the powerful zwitterionic detergent ASB-14 in a strongly chaotropic solubilization buffer to prepare total cellular protein extracts suitable for 2-D electrophoresis (depending on sample type, additional cell lysis protocols may be needed when using this kit)
■■Other ReadyPrep protein extraction kits facilitate extraction of specific classes of proteins and are discussed later in this chapter
Such standardized lysis and extraction protocols are often useful for initial proteomic analyses and for consistent sample preparation.
ReadyPrep Mini Grinder
MicroRotofor Lysis Kit
ReadyPrep Protein Extraction Kit
Products for cell lysis and protein extraction. A number of other ReadyPrep protein extraction kits facilitate disruption and extraction of specific classes of proteins.
1For added convenience, the extraction buffer included with these kits can also be used as the sample solution for IEF with the MicroRotofor cell or with IPG strips.
Protein Solubilization
Proteins in a biological sample are often associated with other proteins, integrated into membranes, or parts of large complexes. Protein solubilization is the process of breaking interactions involved in protein aggregation (Rabilloud 1996), which include disulfide and hydrogen bonds, van der Waals forces, and ionic and hydrophobic interactions. If these interactions are not disrupted, proteins can aggregate or precipitate, resulting in artifacts or sample loss. For successful 2-D electrophoresis, proteins must be well solubilized.
Sample lysis solutions typically contain a number of compounds that meet the requirements, both electrically and chemically, for compatibility with IEF.
To allow high voltages to be applied during IEF without producing high currents, the compounds must not increase the ionic strength of the solution. In some cases, it may be necessary to prepare samples using additives that facilitate protein solubilization but that have limited compatibility with IEF (for example, salts and SDS). In these cases, the potentially interfering substance must be removed prior to sample application, or actions must be taken to mitigate its effect (see the Removal of Interfering Substances section). See Chapter 9 for sample preparation procedures and solutions; for a thorough discussion of solubilization methods, refer to Rabilloud (2000).
Chaotropic Agents
These compounds disrupt hydrogen bonds and hydrophobic interactions both between and within proteins. When used at high concentrations, chaotropic agents disrupt secondary protein structure and bring into solution proteins that are otherwise insoluble. The neutral chaotropic agent urea is used at 5–9 M, often with up to 2 M thiourea, which can dramatically increase the number of proteins solubilized (Rabilloud et al. 1997). Thiourea is weakly soluble in water but more soluble in high concentrations of urea; therefore, a mixture of 2 M thiourea and 5–8 M urea is used when strongly chaotropic conditions are required. Charged chaotropic agents such as guanidine hydrochloride are incompatible with IEF.
If using thiourea during sample preparation, also add it to the first-dimension rehydration solution; otherwise, the proteins that require thiourea for solubility will come out of solution during IEF.
Urea and thiourea can hydrolyze to cyanate and thiocyanate, respectively; these products modify amino groups on proteins (carbamylation) and give rise to artifactual charge heterogeneity. Since heat promotes this hydrolytic reaction, never heat ureaor thiourea-containing solutions above 37°C in the presence of protein (McCarthy et al. 2003).
Detergents
Detergents disrupt hydrophobic interactions between and within proteins and are classified as neutral, zwitterionic, anionic, and cationic (Luche et al. 2003). Some proteins, especially membrane proteins, require detergents for solubilization during isolation and for maintaining solubility during IEF.
Sample preparation for 2-D electrophoresis commonly uses neutral or zwitterionic (having both positive and negative charges resulting in a neutral net charge) detergents at concentrations of 1–4%, since these detergents do not introduce a net charge and therefore allow proteins to migrate at their own charges during IEF. Examples of neutral detergents include Tween, octylglucoside, dodecyl maltoside, Triton X-100, and Triton X-114. Examples of zwitterionic detergents include CHAPS, CHAPSO, ASB-14, and SB 3-10.
In practice, only a few detergents are used in IEF (Table 2.2). With few exceptions, only a single detergent should be used because the effects of detergents are not additive and can be unpredictable in combination. Anionic and cationic detergents
are generally not suitable for IEF.
SDS is unparalleled in its ability to efficiently and rapidly solubilize proteins. Although SDS is
incompatible with IEF as an anionic detergent, it can be used in the initial preparation of concentrated protein samples. In these cases, another IEFcompatible detergent must be used in excess to disrupt the binding of SDS to protein (Ames and Nikaido 1976). Also to be considered is how the detergent interacts with high concentrations of urea. When using SB 3-10, for example, the urea concentration is limited to 5 M, but ASB-14 can be used with 9 M urea (Chevallet et al. 1998).
14 |
15 |
2-D Electrophoresis Guide
Reducing Agents
Reducing agents cleave disulfide bond crosslinks within and between protein subunits, thereby
promoting protein unfolding and maintaining proteins in their fully reduced states. The compounds used for 2-D sample preparation are either sulfhydryl or phosphine reducing agents. Examples of sulfhydryl reductants include dithiothreitol (DTT), dithioerythritol (DTE), and β-mercaptoethanol (BME). DTT and
DTE can be used at lower concentrations than
β-mercaptoethanol and are more commonly used, but high concentrations of DTT can affect the pH gradient since its pKa is around 8. Examples of phosphine reductants include tributylphosphine (TBP) and Triscarboxyethylphosphine (TCEP). These reducing agents can be used at lower concentrations and over a wider pH range than the sulfhydryl reductants; however, their use is limited by low solubility and instability (TBP) or a highly charged characteristic (TCEP).
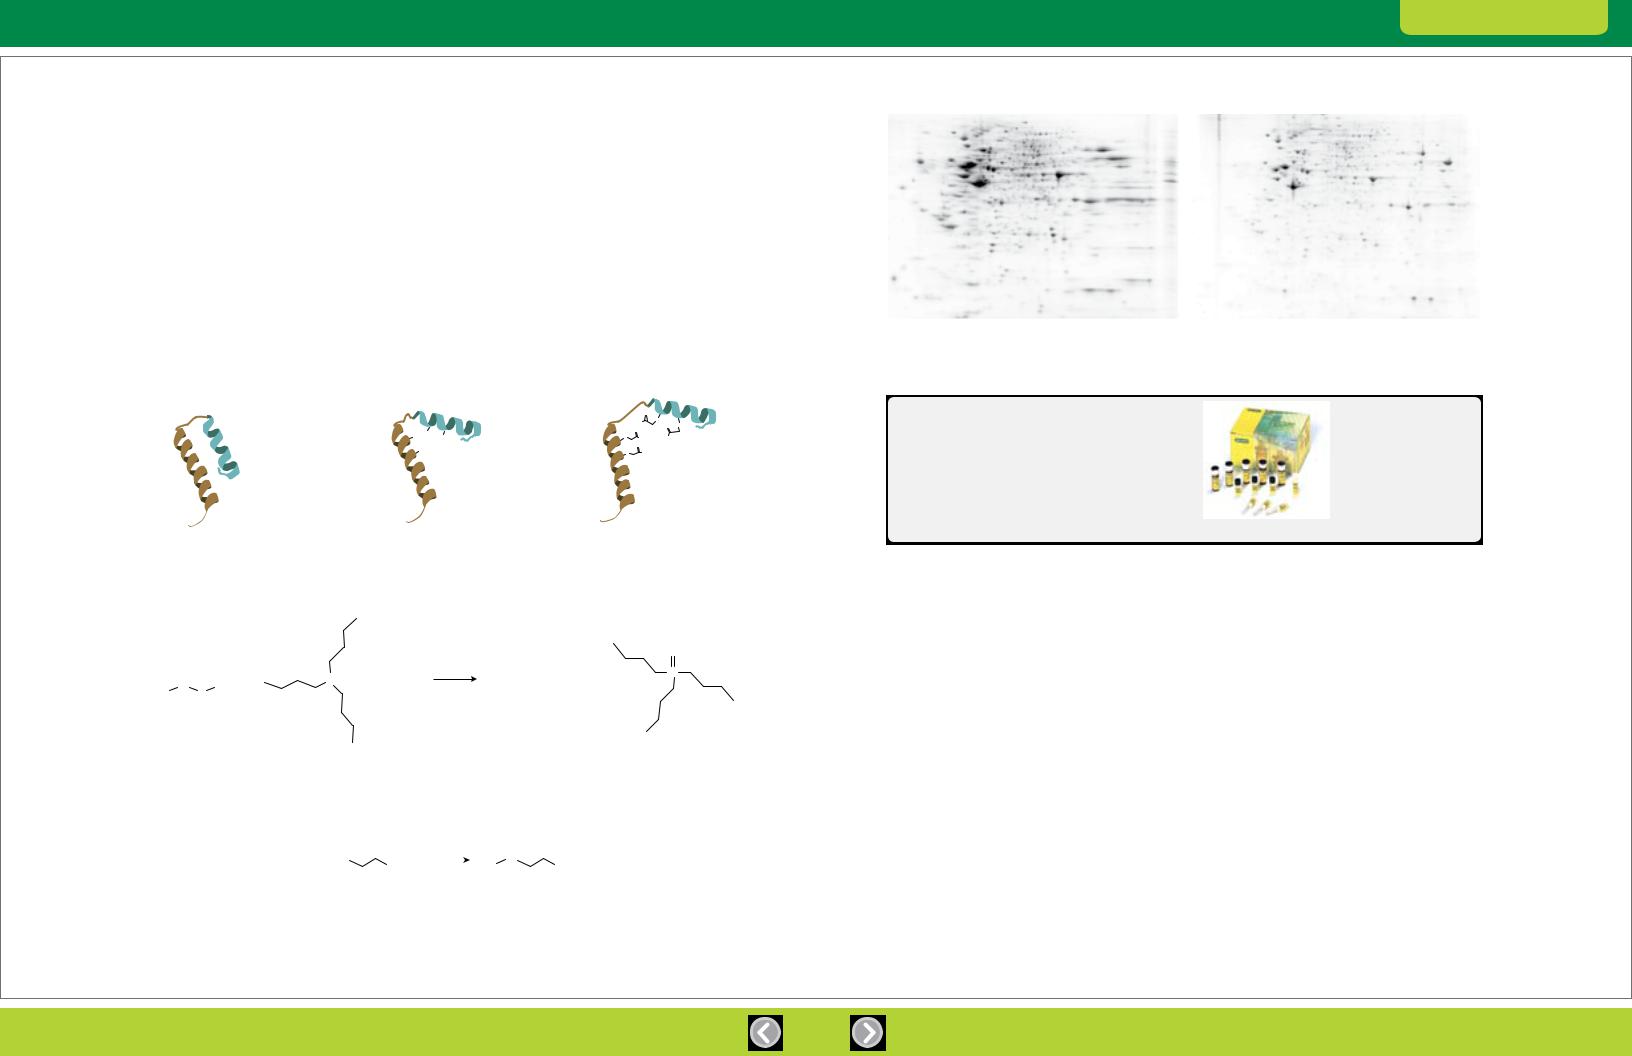
Reducing agents added during protein extraction help to solubilize proteins; during IEF, however, reducing agents such as DTT become depleted from the basic end of pH gradients extending above pH 8, which can cause proteins to aggregate and precipitate (Hoving et al. 2002). The result is streaking and other random spot patterns, particularly in the alkaline regions of the IPG strip (Herbert et al. 2001). To address this problem, proteins can be reduced with TBP and then irreversibly alkylated with iodoacetamide (Figure 2.1). This treatment blocks protein sulfhydryls and prevents proteins from aggregating and precipitating due to oxidative cross-linking, ensuring that proteins remain soluble throughout electrophoresis (Figure 2.2).
|
|
|
|
|
|
O |
|
|
|
|
|
|
|
|
H2N |
|
S |
|
|
|
|
|
|
O |
O |
|
– |
|
|
HS |
|
|
H |
|
|
|
|
HS |
|
NH2 |
|
|||
|
|
SH |
|
S |
|
N |
|
|
|
|
|
|
2 |
|
|||
|
|
|
|
|
|
|||
|
|
|
|
|
|
O |
|
|
|
– |
SH |
|
|
NH2 |
|
|
|
Protein with disulfide bridges |
Reduction cleaves disulfide bridges |
Alkylation with iodoacetamide prevents |
|
and allows unfolding |
disulfide bridges from reforming |
||
|
|
|
|
|
|
O |
S |
R2 + |
P + H2O |
R1—SH + |
R2—HS + |
P |
|
|||||
R1 |
S |
|
|
|
|
Disulfide |
Tributylphosphine |
Thiols |
Tributylphosphine oxide |
|
|
Reduction |
|
|
O |
|
O |
|
||||
R—SH + |
I |
|
NH2 |
|
S |
|
|
+ HI |
|
|
|
|
|||||
|
|
|
|
R |
NH2 |
|||
Thiol |
Iodoacetamide |
|
Alkylated thiol |
|
||||
Alkylation
Fig. 2.1. Reduction and alkylation.
Chapter 2: Sample Preparation |
Theory and Product Selection |
Untreated |
|
ReadyPrep reduction-alkylation kit |
pH 3 |
pH 10 pH 3 |
pH 10 |
Fig. 2.2. Effect of treatment with the ReadyPrep reduction-alkylation kit. Human HeLa cell extract (100 µg) separated by 2-D electrophoresis (first dimension on 11 cm ReadyStrip™ IPG strips pH 3–10, second dimension using 12% Criterion™ gels) and stained with Flamingo™ protein gel stain. The sample treated with the ReadyPrep reduction alkylation kit (right) and shows much better spot resolution than the untreated sample (left), especially in the basic range of the gel.
ReadyPrep Reduction-Alkylation Kit
Bio-Rad’s ReadyPrep reduction-alkylation kit provides the reagents for reduction and alkylation of sample proteins prior to IEF. Its use produces a 2-D pattern with more spots, fewer streaks, and greater reproducibility.
ReadyPrep Reduction-Alkylation Kit
Ampholytes, Buffers, and Other Additives
Sample solution components that modify pH or impart ionic strength affect the solubilization of proteins during sample preparation and strongly influence 2-D electrophoresis.
Carrier ampholyte mixtures increase both buffering power and ionic strength. Unlike non-ampholytic ions, they do not interfere with IEF and can, in fact, improve protein solubility by “salting in” proteins that are otherwise insoluble under IEF conditions. In addition, carrier ampholytes can diminish proteinmatrix interactions, which tend to occur at the basic end of an IPG strip and lead to streaking caused
by precipitation (Righetti and Gianazza 1987). Carrier ampholytes are routinely added to solutions used during IEF with IPG strips and can be of value during protein extraction as well.
Since proteins are often more soluble and proteases are less active at higher pH, a base such as Tris may be included in a lysis solution to elevate pH.
Many proteins also require ions in solution for optimum solubility. Normally, this is achieved by adding salt
to the sample solution; however, adding salt prior to IEF increases conductivity and consequently limits the voltage at which IEF can be performed until the salt is eventually removed from the system. Ions also leave the IPG strip during IEF, causing any protein requiring ions for solubility to precipitate. Proteins also become less soluble as they approach their pI; they may precipitate at their pI in a phenomenon known as isoelectric precipitation or pI fallout.
16 |
17 |
2-D Electrophoresis Guide |
Chapter 2: Sample Preparation |
Theory and Product Selection |
|
|
|
Table 2.2. Summary of compounds used in 2-D electrophoresis sample solutions. Refer to Ordering Information (Appendix C) for catalog numbers and details of options available for purchase.
|
Role in |
Concentration |
|
Compound or product |
Solution |
Range |
Comments |
|
|
|
|
Urea |
Chaotrope |
5–9.5 M |
Present during first-dimension IEF |
Thiourea |
Chaotrope |
2 M |
Used with urea, usually in the combination 7 M urea, 2 M thiourea; |
|
|
|
more effective than urea alone for solubilizing hydrophobic or high |
|
|
|
molecular weight proteins |
|
|
|
|
CHAPS |
Detergent |
1–4% (w/v) |
Zwitterionic detergent that may enhance protein solubility with minimal |
|
|
|
disruptive effect on 2-D electrophoresis (Perdew et al. 1983) |
CHAPSO |
Detergent |
1–4% (w/v) |
Zwitterionic detergent similar to CHAPS |
|
|
|
|
NP-40 |
Detergent |
0.5–1% (w/v) |
Neutral detergent originally used in 2-D electrophoresis (O’Farrell 1975, |
|
|
|
Görg et al. 1988); its use has been largely superseded by CHAPS |
|
|
|
(Görg et al. 2004) |
Triton X-100 |
Detergent |
0.5–1% (w/v) |
Neutral detergent similar to NP-40 also used for 2-D sample |
|
|
|
preparation (Kawaguchi and Kuramitsu 1995) |
|
|
|
|
SB 3-10 |
Detergent |
1–2% (w/v) |
Zwitterionic detergent shown in some cases to give better solubilization |
|
|
|
than CHAPS; insoluble in higher concentrations of urea and generally |
|
|
|
used with 5 M urea, 2 M thiourea (Rabilloud et al. 1997) |
ASB-14 |
Detergent |
1–2% (w/v) |
Zwitterionic detergent developed for solubilization of membrane |
|
|
|
proteins to be analyzed by 2-D electrophoresis (Chevallet et al. 1998) |
|
|
|
|
ASB-C8Ø |
Detergent |
1–2% (w/v) |
Zwitterionic detergent developed for solubilization of membrane |
|
|
|
proteins to be analyzed by 2-D electrophoresis (Chevallet et al. 1998) |
Sodium dodecyl sulfate |
Detergent |
Up to 2% (w/v) |
Anionic detergent widely used in sample preparation for |
(SDS) |
|
during sample |
electrophoresis and unparalleled in its ability to solubilize protein; |
|
|
preparation, no more |
also effective at inactivating proteases and other undesirable |
|
|
than 0.2% (w/v) |
enzymatic activities. It is, however, incompatible with IEF unless |
|
|
during IEF |
diluted to 0.2% or less and used with at least an eightfold excess of |
|
|
|
an IEF-compatible detergent such as CHAPS |
|
|
|
|
Dithiothreitol (DTT) |
Reductant |
20–60 mM |
Most commonly used sulfhydryl reductant for 2-D electrophoresis |
β-Mercaptoethanol |
Reductant |
1–5% (v/v) |
Sulfhydryl reductant originally used for 2-D electrophoresis (O’Farrell |
|
|
|
1975); must be used at a relatively high concentration and can cause |
|
|
|
disturbances to IEF, so is rarely used |
|
|
|
|
Tributylphosphine (TBP) |
Reductant |
2 mM |
Phosphine reductant effective at low concentrations and reported |
|
|
|
to enhance solubilization of recalcitrant samples (Herbert et al. |
|
|
|
1998). It has low water solubility and is unstable and therefore not |
|
|
|
recommended as the sole reductant for first-dimension IEF |
Tris-carboxyethylphosphine |
Reductant |
2–40 mM |
Phosphine reductant that may be useful during sample preparation; |
(TCEP) |
|
|
it is highly charged and so is not recommended as the sole reductant |
|
|
|
present during first-dimension IEF |
|
|
|
|
Tris |
Base |
10–40 mM |
(Unbuffered) free base often added to sample preparation solutions to |
|
|
|
raise the pH to a range where proteolysis is minimal and proteins are |
|
|
|
optimally soluble. Other bases (for example, potassium carbonate or |
|
|
|
spermine) are occasionally used as well (Rabilloud 1999). If Tris is used |
|
|
|
during sample preparation, it should be diluted to 20 mM or less for |
|
|
|
first-dimension IEF, as it may cause disturbances in the basic pH range |
Bio-Lyte® ampholytes |
Carrier |
0.2–1.0% (w/v) |
Carrier ampholytes may be used during sample preparation to |
|
ampholyte |
|
enhance protein solubility. Although IEF with IPG strips does not |
|
|
|
require carrier ampholytes for pH gradient generation, the presence |
|
|
|
of a relatively low (0.2% [w/v]) concentration of carrier ampholyte |
|
|
|
is essential for optimum resolution. Use pH 3–10 ampholytes |
|
|
|
or ampholytes appropriate to the IPG strip pH range |
|
|
|
|
Removal of Interfering Substances
Impurities such as ionic detergents, lipids, nucleic acids, salts and other ionic compounds, and even high-abundance proteins can impact a 2-D
electrophoresis experiment by interfering with protein separation or by obscuring proteins of interest. These interfering substances can be endogenous (for example, phenolics, lipids, and nucleic acids) or exogenous (added during sample preparation; for example, salts and detergents). Either way, removing these impurities prior to analysis or mitigating their effect is often essential for good results.
General Considerations
Though removal or mitigation of interfering substances often yields clearer 2-D patterns and improves resolution of protein spots, any treatment of the sample can reduce yield and alter the relative abundance of sample proteins. Procedures for
the removal of interfering substances represent a compromise between removal of non-protein contaminants and minimal interference with the integrity and relative abundance of the sample proteins. Since proteomics aims to study the
relationship among proteins in their natural state, it is important to remove an interfering substance only
when necessary and by using techniques appropriate for the sample.
Protein precipitation is a common general method for contaminant removal. Conditions are chosen under which sample proteins are selectively precipitated while leaving soluble the major nonprotein contaminants. Following centrifugation, the precipitated proteins are resuspended in a solution suitable for IEF. Methods used in sample preparation for 2-D electrophoresis include precipitation with TCA and acetone (Damerval et al. 1986, Görg et al. 1988) and precipitation with methanol and chloroform (Wessel and Flügge 1984). Precipitation procedures also have the benefit of concentrating sample protein, which is often necessary for effective sample application.
Individual types of interfering contaminants cause specific problems and can be removed or mitigated in different ways. The most prevalent interfering contaminants and their removal methods are discussed next.
Nucleic Acids (DNA and RNA)
Nucleic acids, particularly DNA, can interfere with IEF (for example by clogging gel pores) and increase sample viscosity, thus limiting the effectiveness of cell lysis and sample application. Because smaller nucleic acids are generally tolerated better, strategies to reduce nucleic acid interference involve either shearing or enzymatic digestion: sonication shears DNA and renders the sample less viscous, and addition of nuclease digests nucleic acids to
oligoor mononucleotides.
Nucleases are often employed during sample preparation, particularly with bacterial lysates in which nucleic acid:protein ratios are high. Successful application of nuclease treatment requires attention to three factors:
■■Nucleases may be inactive under the strongly denaturing conditions often used to prepare protein samples for 2-D electrophoresis
■■DNase requires magnesium ions for activity
■■Nucleases are proteins and can appear in the 2-D pattern as extra spots
Benzonase is a nuclease with properties that make it particularly useful in sample preparation for 2-D electrophoresis (Chan et al. 2002). It is active in the presence of urea, and the amount required for treatment is usually not visible in a 2-D gel. It is applied in the presence of 1 mM MgSO4 or MgCl2.
The magnesium ions are subsequently sequestered with EDTA in order to inhibit proteases that may require metal ions for activity.
18 |
19 |

2-D Electrophoresis Guide |
Chapter 2: Sample Preparation |
Theory and Product Selection |
|
|
|
Polysaccharides
Polysaccharides can interfere with electrophoresis by clogging gel pores and by forming complexes with proteins. Like nucleic acids, they can also cause a sample to be viscous, making it difficult to work with. Polysaccharides are a particularly prominent problem with plant-derived samples.
Centrifugation may be used to remove high molecular weight polysaccharides. Phenol extraction, followed by precipitation with ammonium acetate in methanol, is a commonly used method that is very effective
at removing polysaccharides in plant samples (Hurkman and Tanaka 1986, Wang et al. 2008).
Phenolic Compounds
Phenolic compounds are found in all plants and in some microorganisms and they can modify
proteins in an enzyme-catalyzed oxidative reaction. The modification can cross-link proteins together or render them insoluble. The reaction can be prevented with reductants such as DTT, β-mercaptoethanol,
or ascorbic acid, and the enzyme is inactivated by thiourea. Phenolic compounds may also be removed from the extract using the ReadyPrep 2-D cleanup kit (see the Products for Contaminant
Removal sidebar) or by including polyvinylpyrrolidone (PVP) or polyvinylpolypyrrolidone (PVPP) in the extraction solution. These compounds bind phenolic compounds, and the precipitated complex can
be removed from the extract by centrifugation (Toth and Pavia 2001). The phenol extraction procedure described above (see Polysaccharides) is also effective at removing phenolic contaminants (Hurkman and Tanaka 1986, Wang et al. 2008).
Lipids
Lipids can form insoluble complexes with proteins, but lipids can also complex with detergents, thereby reducing the detergents’ effectiveness at solublilizing protein. The effect of lipids can be minimized by using excess detergent (for example, 4% CHAPS in the lysis solution when preparing lipid-rich tissues such as brain). Precipitation methods that employ organic solvents (Damerval et al. 1986, Görg et al. 1988, Wessel and Flügge 1984) or the ReadyPrep 2-D cleanup kit can also be used to remove lipids.
Salts and Other Small Ionic Compounds
IEF requires samples that are free of salts and other small ionic compounds that may interfere with pH gradient formation. Salts formed from strong acids and strong bases (for example, NaCl) dissociate into their component base and acid, which is eventually drawn to either end of the IPG strip. Until this occurs, the conductivity of the IPG strip remains high and the voltage attained is low. The flow of ions from the IPG strip is accompanied by water flow, and one end of the strip may dry out, breaking electrical contact. Weak acids and weak bases (for example, acetate, Tris, or ammonium ions) may not completely leave the IPG strip during focusing. These compounds interfere with the pH gradient, resulting in streaking and loss of resolution at one end of the pH range or the other (Figure 2.3). Amphoteric buffers such as HEPES can focus within the pH gradient, resulting in a portion of the pH gradient where proteins focus poorly.
Before |
|
After |
|
|
|
|
|
|
Fig. 2.3. Effect of salt removal. E. coli extracts containing 1 M NaCl were separated by 2-D electrophoresis before and after treatment with the ReadyPrep 2-D cleanup kit. The samples were focused using 11 cm ReadyStrip pH 3–10 IPG strips and then separated on Criterion 8–16% Tris-HCl precast gels.
Samples of low ionic strength are desired, yet many samples contain salts and small ionic compounds that are either intrinsic to the sample type or have been introduced during sample preparation. Precipitation and dialysis methods are very effective at removing ionic contaminants, as is treatment with a desalting column (Chan et al. 2002).
Prevention of Keratin Contamination
Skin keratin is a common contaminant of 2-D gels and mass spectra. It may appear in silver-stained and fluorescently stained 2-D gels as an artifact focusing near pH 5 in the 50–70 kD region, or as an irregular but distinctive vertical streaking parallel to the SDS-PAGE direction of migration. The best remedy for this keratin artifact is to avoid introducing it into the sample in the first place. Filter all monomer solutions, stock sample buffers, gel buffers, and electrode buffers through nitrocellulose and store them in sealed containers; then, clean the electrophoresis cell thoroughly with detergent. Above all, careful sample handling is important when sensitive detection methods are used, and gloves should be worn while handling samples, solution, or equipment.
Products for Contaminant Removal
For quick and effective contaminant removal, Bio-Rad offers:
■■ReadyPrep 2-D cleanup kit, which uses an optimized version of a TCA-sodium deoxycholate coprecipitation procedure (Arnold and UlbrichHoffmann 1999) to quantitatively precipitate proteins while removing most interfering substances. The protein precipitation process also enables concentration of proteins from samples that are too dilute, allowing for higher protein loads that can improve spot detection
■■Bio-Spin® 6 and Micro Bio-Spin™ 6 columns are ready to use and are filled with Bio-Gel® P-6 support for the quick desalting and buffer exchange of protein samples
ReadyPrep 2-D Cleanup Kit
|
|
|
|
|
|
|
End cap |
|
|
|
|
|
|
|
|
|
|
|
End cap |
|
|
|
|
|
|
|
Reservoir |
|
|
|
|
|
|
|
|
|
|
|
Reservoir |
|
|
|
|
|
|
|
|
|
|
|
|
|
|
|
|
|
|
||
|
|
|
|
|
|
|
|
|
|
|
|
|
|
|
|
|
|
|
|
|
|
|
|
|
|
|
|
|
|
|
|
|
|
|
|
|
|
||
|
|
|
|
|
|
|
|
3 cm |
|
|
|
|
|
|
|
|
|||
|
|
|
|
|
|
|
|
|
|
|
|
|
|
2 cm working bed height |
|||||
|
|
|
|
|
|
|
|
|
|
|
|
|
|
|
|
|
|
|
|
5 cm |
|
|
|
|
|
|
|
|
|
|
|
|
|
|
|
|
0.8 ml bed volume |
||
|
|
|
|
|
|
|
|
|
|
|
|
|
|
|
|
|
|
|
|
|
|
|
|
3.7 cm working bed height |
|
|
|
|
|
|
|
|
|
|
|
|
|||
|
|
|
|
|
|
|
|
|
|
|
|
||||||||
|
|
|
|
|
|
|
1.2 ml bed volume |
|
|
|
|
|
|
|
|
|
|
|
Luer end fitting |
|
|
|
|
|
|
|
|
|
|
|
|
|
|
|
|
|
|
||
|
|
|
|
|
|
|
|
|
|
|
|
|
|
|
|
|
|
|
with snap-off tip |
Porous 30 µm
polyethylene bed Micro Bio-Spin Column support retains
fine particles
Luer end fitting with snap-off tip
Bio-Spin Column
20 |
21 |

2-D Electrophoresis Guide |
Chapter 2: Sample Preparation |
Theory and Product Selection |
|
|
|
Prefractionation
Proteomic analysis is often applied to samples that have undergone prior fractionation (prefractionation), and the reasons for this are varied. In cases where only a defined subset of the proteome is under study, prefractionation can increase the chances
of meaningful discovery by removing proteins not likely to be of interest from the sample. For example, in studies of mitochondrial processes, it is sensible to perform the proteomic analysis on a subcellular fraction enriched in mitochondria. In other cases, specific proteins of interest may be enriched through fractionation and analyzed by 2-D electrophoresis
in the absence of potentially interfering proteins. Prefractionation can also be used to separate a sample into multiple fractions of lower complexity that can then be analyzed separately; this can enable identification of lower-abundance proteins that might otherwise be undetectable in the unfractionated sample.
Prefractionation increases the depth of proteome analysis, but it does so at the expense of a greater workload and reduced throughput. Try to use a fractionation method that generates minimal protein overlap between fractions.
Proteins can be fractionated by a number of different techniques. The choice of method depends on
the sample, experimental goals, and available instrumentation:
■■Chemical and centrifugal methods —
use of selective precipitation or selective extraction or centrifugation steps to separate proteins or partition different subcellular compartments.
In many instances, protein extraction protocols can incorporate fractionation steps through the selective use of certain chemical reagents
■■Electrophoretic methods — application of liquid-phase IEF or preparative SDS-PAGE with the goal of protein enrichment. Though neither of these techniques is orthogonal to either of the two dimensions employed in 2-D electrophoresis and neither offers additional resolving power to the analysis, electrophoresis has proven useful in
allowing the enrichment of low-abundance proteins. A protein in a sizeor pI-enriched fraction can be subjected to 2-D electrophoresis at a higher amount relative to the unfractionated sample, allowing the analysis of proteins present below detection levels (Zuo and Speicher 2000, Fountoulakis and Juranville 2003)
■■Chromatographic methods — use of chromatographic separation principles to enrich low-abundance proteins or generate fractions of reduced complexity (Fountoulakis et al. 1997, Badock et al. 2001, Butt et al. 2001, Smith et al. 2004, Qin et al. 2005, Yuan and Desiderio 2005). Virtually any chromatographic procedure can be used as a prefractionation step; examples include size exclusion, affinity, ion exchange, and reversephase resins
Using these methods alone or in combination, proteins can be separated upstream of 2-D electrophoresis (prefractionated) by their physical or chemical properties, as described below. Some of these methods, however, may introduce ionic or other contaminants that must be removed before IEF.
Also, increasing the number of sample handling steps may increase variability and the risk of sample loss.
Fractionation by Subcellular Location
There are many techniques for preparing fractions enriched in subcellular organelles or membrane types, and there are several examples in which these techniques have been used to prepare samples for 2-D electrophoresis and other proteomic analyses (Huber et al. 2003). Methods for organellar fractionation generally involve differential and density gradient centrifugation (Stasyk et al. 2007, Fialka et al. 1997). However, fractionation schemes involving aqueous polymer phase separation (Tang et al. 2008) and free-flow electrophoresis (Zischka et al. 2003, Eubel et al. 2008) have been described for this purpose as well. These methods are usually specific
for the source material (cells or tissue). In some cases, fractions representing different subcellular sites can be generated on the basis of solubility under different conditions (see the Fractionation by Solubility/ Hydrophobicity section). These methods are
more general in application.
Bio-Rad offers several ReadyPrep protein extraction kits for the isolation of fractions enriched in integral membrane and transmembrane proteins (Figure 2.4), as well as nuclear and cytoplasmic proteins (see the Products for Fractionation by Subcellular Location sidebar).
Products for Fractionation by Subcellular Location
Each of the following kits produces a fraction with a distinct protein composition:
■■ReadyPrep protein extraction kit (signal) takes advantage of the limited solubility of plasma membrane microdomain structures (for example, lipid rafts and caveolae) in nonionic detergents at 4°C to yield a protein pellet that is enriched
in membrane-associated signalling proteins, including glycophosphatidylinositol (GPI)-anchored proteins, caveolin and associated proteins, acetylated tyrosine kinases, and G proteins (Simons and Ikonen 1997)
■■ReadyPrep protein extraction kits (membrane I and membrane II) use different techniques to isolate integral membrane and membrane-associated proteins without the need for density gradients. The membrane I kit is based on temperaturedependent partitioning of hydrophobic proteins into the detergent-rich phase of a Triton X-114/ water two-phase system (Bordier 1981, Prime
et al. 2000, Santoni et al. 2000). It is a quick and effective protocol for enriching membrane proteins without the need for ultracentrifugation. More complex membrane proteins (those with
larger numbers of transmembrane domains) are better isolated using the membrane II kit, which enriches integral membrane proteins by treating a membrane preparation with sodium carbonate (Fujiki et al. 1982, Molloy et al. 2000); this protocol requires ultracentrifugation
■■ReadyPrep protein extraction kit (cytoplasmic/ nuclear) uses a proprietary buffer and differential centrifugation to isolate intact nuclei and a strongly chaotropic extraction buffer to quickly prepare highly enriched fractions of cytoplasmic and nuclear proteins from eukaryotic samples
ReadyPrep Protein Extraction Kit
A B C
Fig. 2.4. Differences in 2-D patterns obtained using ReadyPrep protein extraction kits: signal (A), membrane I (B), and membrane II (C) kits. Mouse liver samples were extracted using each kit, and purified proteins were separated using 17 cm ReadyStrip pH 3–10 NL IPG strips and 8–16% gels. Overall spot patterns differ for A, B, and C even though all three kits isolate membrane proteins, indicating that each kit isolates different sets of proteins.
22 |
23 |

2-D Electrophoresis Guide |
Chapter 2: Sample Preparation |
Theory and Product Selection |
|
|
|
Products for Fractionation by
Solubility/Hydrophobicity
■■ReadyPrep sequential extraction kit is based on a published method (Molloy et al. 1998) that uses sequentially more highly solubilizing chaotrope and detergent mixtures. Applying each extracted fraction to a separate gel allows the resolution of more protein spots
■■ReadyPrep protein extraction kit (soluble/insoluble) uses a different set of detergents to fractionate proteins on the basis of their solubility in detergents
The ReadyPrep sequential extraction kit and the ReadyPrep protein extraction kit (soluble/insoluble)
can be used either independently or sequentially for ReadyPrep Sequential Extraction Kit even greater depth of coverage.
ReadyPrep |
Step 1 |
ReadyPrep |
Step 2 |
ReadyPrep |
Step 3 |
reagent 1 |
Insoluble pellet |
reagent 2 |
Insoluble pellet |
reagent 3 |
Insoluble pellet |
|
|
|
|||
Protein |
from reagent 1 |
|
from reagent 2 |
|
from reagent 3 |
|
|
|
|
|
|
sample |
|
|
|
|
|
Collect supernatant 1 |
Collect supernatant 2 |
Collect supernatant 3 |
|||
Reagent 2 |
|
|
|
|
|
Products for Fractionation by Protein Charge
For prefractionation in a convenient kit format, Aurum™ AEX (anion exchange) and CEX (cation exchange) mini kits and columns employ ion exchange chromatography in an easy-to-use spin column format for fractionating and concentrating acidic and basic proteins from small sample volumes (<1 ml). Micro Bio-Spin 6 columns are included for salt removal from the fractionated samples. Requiring only 15–20 min operating time, Aurum
ion exchange mini spin columns provide a quick, convenient, and reproducible sample preparation tool for 2-D electrophoresis, and their use can improve detection of low-abundance proteins (Liu and Paulus 2008).
Total Protein |
|
AEX bound fraction |
pH 3 |
pH 10 pH 3 |
|
|
|
|
|
|
|
Aurum Ion Exchange Kit
|
|
AEX unbound fraction |
pH 10 pH 3 |
pH 10 |
|
|
|
|
|
|
|
Fig. 2.5. Distribution of proteins based on differential solubility using the ReadyPrep sequential extraction kit. The generation of three fractions provides increased resolution of proteins on 2-D gels.
Fractionation by Solubility/Hydrophobicity
Proteins can be separated according to their solubility in different reagents using either chemical or chromatographic methods. Sequential extraction under different solvent conditions can be used to fractionate a protein sample based on solubility, and this strategy has also been used to prepare discrete fractions for analysis by 2-D electrophoresis (Lenstra and Bloemendal 1983, Weiss et al. 1992). Extraction using different detergents can also
yield different protein fractions (Figure 2.5), and chromatographic methods that can be used include reverse-phase (Van den bergh and Arckens 2008) and hydrophobic interaction chromatography (McNulty and Annan 2009).
Fractionation by Protein Charge
Ion exchange chromatography has been used to reduce proteome complexity, enrich low-abundance proteins, and improve peptide mass fingerprints (Butt et al. 2001). This technique separates proteins according to their charge at various pHs. It is based on the reversible adsorption of proteins to a solid phase containing charged chemical groups. Cationic (+) or anionic (-) resins (Figure 2.6) attract
molecules of opposite charge in the solvent. A variety of systems and media are available for ion exchange chromatography, but because elution involves gradient elution by washing the column with buffers of gradually increasing ionic strength or pH, a subsequent
cleanup step must be included.
Fig. 2.6. Fractionation of rat brain tissue using Aurum ion exchange mini columns. Rat brain total protein extracts (3 ml) were loaded onto an Aurum AEX column and eluted. The unfractionated and fractionated samples were then treated with the ReadyPrep reduction alkylation and 2-D cleanup kits and separated by 2-D electrophoresis. Red circles indicate a group of protein spots with increased intensities after fractionation. Blue arrows show two representative spots detected only in the gels of the AEX bound fraction.
Fractionation by pI
Fractionation by pI, for example by liquid-phase IEF, may seem counterintuitive as a fractionation technique upstream of the first-dimension IEF separation. It can, however, improve downstream sample loading and separation on narrowand micro-range IPG strips by eliminating proteins outside the pH region of interest (Figure 2.7). This unique separation method can also be coupled to analytical or preparative SDS-PAGE for a powerful, complementary first-dimension separation and enrichment strategy for high molecular weight, membrane, hydrophobic, or other proteins that
are often underrepresented in IPG-based 2-D gels (Davidsson 2002, Hansson et al. 2004, Brobey and Soong 2007)2.
2Liquid IEF introduces ampholytes that must be removed, for example with the ReadyPrep 2-D cleanup kit, before IEF in IPG strips.
24 |
25 |

2-D Electrophoresis Guide |
Chapter 2: Sample Preparation |
Theory and Product Selection |
|
|
|
Products for Fractionation by pI
The Rotofor®, Mini Rotofor, and MicroRotofor cells separate and concentrate proteins into discrete fractions by liquid-phase IEF. Following ampholyte removal and sample concentration with the ReadyPrep 2-D cleanup kit, each of the resulting liquid fractions can then be separated on narrowor micro-range IPG strips.
Rotofor Family of Liquid-Phase IEF Cells
Unfractionated
pH 3 |
|
10 |
|
|
|
Fraction 3, pH 6.04
pH 3 |
|
10 |
|
|
|
|
Fraction 3, pH 6.04 |
|
pH 4.7 |
|
5.9 |
|
||
Fractionation by Size (MW)
Size-dependent separation is a powerful fractionation strategy in studies focused on a particular protein or protein family and their posttranslational modifications because these proteins tend to be of similar size (Fountoulakis and Juranville 2003). Proteins can
be separated into size-dependent fractions by polyacrylamide gel electrophoresis (PAGE), particularly continuous-elution electrophoresis.
Products for Fractionation by Size (MW)
The Model 491 prep cell and mini prep cell perform size-dependent high-resolution fractionation of proteins by continuous-elution gel electrophoresis (using native PAGE or SDS-PAGE). The large sample capacity (50 µl–15 ml, and 0.5–500 mg protein) of these cells makes them particularly effective tools for the enrichment of low-abundance proteins (Zerefos et al. 2006,
Xixi et al. 2006, Fountoulakis et al. 2004).
Model 491 Prep Cell and Mini Prep Cell
Depletion and Dynamic Range Reduction
One of the major difficulties facing proteomics is the issue of dynamic range, or the variation in abundance among sample proteins that typically spans several orders of magnitude. This range typically exceeds that over which proteins can be effectively detected and quantified. Various strategies have been developed for the reduction of sample dynamic range, and
they have proven beneficial for the study of lowabundance proteins.
Depletion
Samples may be dominated by a few abundant proteins whose presence can obscure less abundant proteins and limit the capacity and resolution of the separation technique employed. This is particularly apparent for serum and plasma; the study of lowerabundance proteins from serum or plasma is
often complicated by the presence of albumin and immunoglobulin G (IgG), which together contribute up to 90% of the total protein in a serum sample.
These proteins obscure comigrating proteins and limit the amount of total serum protein that can be loaded on 2-D gels. To obtain meaningful results from serum samples, these proteins must be removed (Figure 2.8).
A strategy for specific depletion of abundant proteins by immunoaffinity chromatography has been widely used (Pieper et al. 2003, Roche et al. 2009, Tu et al. 2010, Ichibangase et al. 2008). Though this method is effective, the need for antibodies renders it expensive and limits its applicability to the specific sample type for which the antibodies were developed.
Before
Albumin
Heavy-chain IgG
Light-chain IgG
After
Albumin
Fig. 2.8. Albumin and IgG removal from serum using the Aurum serum protein mini kit. Serum proteins were separated by 2-D electrophoresis before and after treatment with an Aurum serum protein mini column. Albumin and IgG are removed following treatment with the column, improving resolution of other protein species. Samples (100 µg) were focused on 11 cm ReadyStrip pH 5–8 IPG strips, then run on 8–16% gels.
Products for Depletion
Bio-Rad’s Aurum Affi-Gel® Blue and Aurum serum protein mini kits represent a simple, low-cost alternative to immunodepletion. These kits use affinity chromatography to easily and effectively remove albumin (Affi-Gel Blue) or albumin and IgG (serum protein kit) in a single spin column.
Aurum Ion Exchange Kit
Fig. 2.7. Clean fractionation by pI. Mouse liver extract was fractionated using the MicroRotofor cell. 2-D separations of the unfractionated sample (120 µg) and fractions (30 µg) are shown. Prior to 2-D separation, samples were treated with the ReadyPrep 2-D cleanup kit to remove extra ampholytes. Note the clean pH boundaries of fraction 3 and the enrichment of proteins in the pH region it covers.
26 |
27 |

2-D Electrophoresis Guide
Dynamic Range Reduction
ProteoMiner™ protein enrichment technology uses a bead-based library of combinatorial peptide ligands that act as unique binders for proteins (Thalusiraman et al. 2005, Guerrier et al. 2006). When a complex sample is applied to the beads, abundant proteins saturate their specific ligands while the remaining proteins can be washed away. Low-abundance proteins are concentrated on their specific ligands and will be enriched relative to the abundant proteins following elution. In contrast to immunodepletion, ProteoMiner has no intrinsic specificity for any particular sample type and can be used to decrease high-abundance proteins in any sample that could benefit from such a treatment. The technology has been most widely applied to serum and plasma (Sennels et al. 2007); however, several examples
of successful application of ProteoMiner to other samples have also been reported (Castagna et al. 2005, Guerrier et al. 2007, D’Ambrosio et al. 2008, Bandhakavi et al. 2009).
ProteoMiner protein enrichment kits:
■■Decrease the amount of high-abundance proteins without immunodepletion, preventing the loss of proteins bound to high-abundance proteins
■■Enrich mediumand low-abundance proteins that cannot be detected through traditional methods (Figure 2.9)
■■Do not rely on a predefined set of antibodies, unlike immunodepletion products
■■Are compatible with a variety of sample types
■■Offer a convenient, easy-to-use format
■■Can be used for differential expression analysis
Untreated
Treated
Fig. 2.9. The ProteoMiner protein enrichment kit improves resolution and spot counts in 2-D gels. In an untreated sample, albumin and other high-abundance proteins dominate the gel and obscure signals from less abundant proteins. On a gel generated using an equal amount of total protein from a treated serum sample, however, resolution is dramatically improved and a greater number of protein spots is visualized.
Chapter 2: Sample Preparation |
Theory and Product Selection |
ProteoMiner Technology
ProteoMiner technology employs a combinatorial library of hexapeptides bound to a chromatographic support. Combinatorial synthesis creates a large library of unique hexapeptides, with each hexapeptide bound to a stationary support, or bead. Each bead, featuring a unique ligand, is expected to bind specifically to one or a small number of different proteins in a mixture, and the library of all possible sequences binds proteins up to the capacity of available beads.
When a complex biological sample is applied to the beads, high-abundance proteins saturate their ligands and excess proteins are washed away. In contrast, low-abundance proteins do not saturate their binding sites. Therefore, different samples retain relative expression levels similar to the original samples. Moreover, low-abundance proteins are enriched if the beads are eluted in a volume smaller than the original sample. The overall effect of ProteoMiner technology results in the bound and eluted material consisting of a significantly lower amount of total protein, thus allowing resolution of a greater diversity of species.
Biological sample (large dynamic range)
Bind mixture |
Wash away |
|
to library |
||
unbound protein |
||
|
Elute bound sample for analysis
Ligand library
Depletion of plasma and serum samples by ProteoMiner technology. Each bead features a different hexapeptide ligand with affinity for specific proteins in a sample. Samples are applied to the beads, allowing proteins to bind to their specific ligands. Proteins in excess are washed away, and those proteins bound to the beads are eventually eluted, allowing further downstream analysis.
28 |
29 |
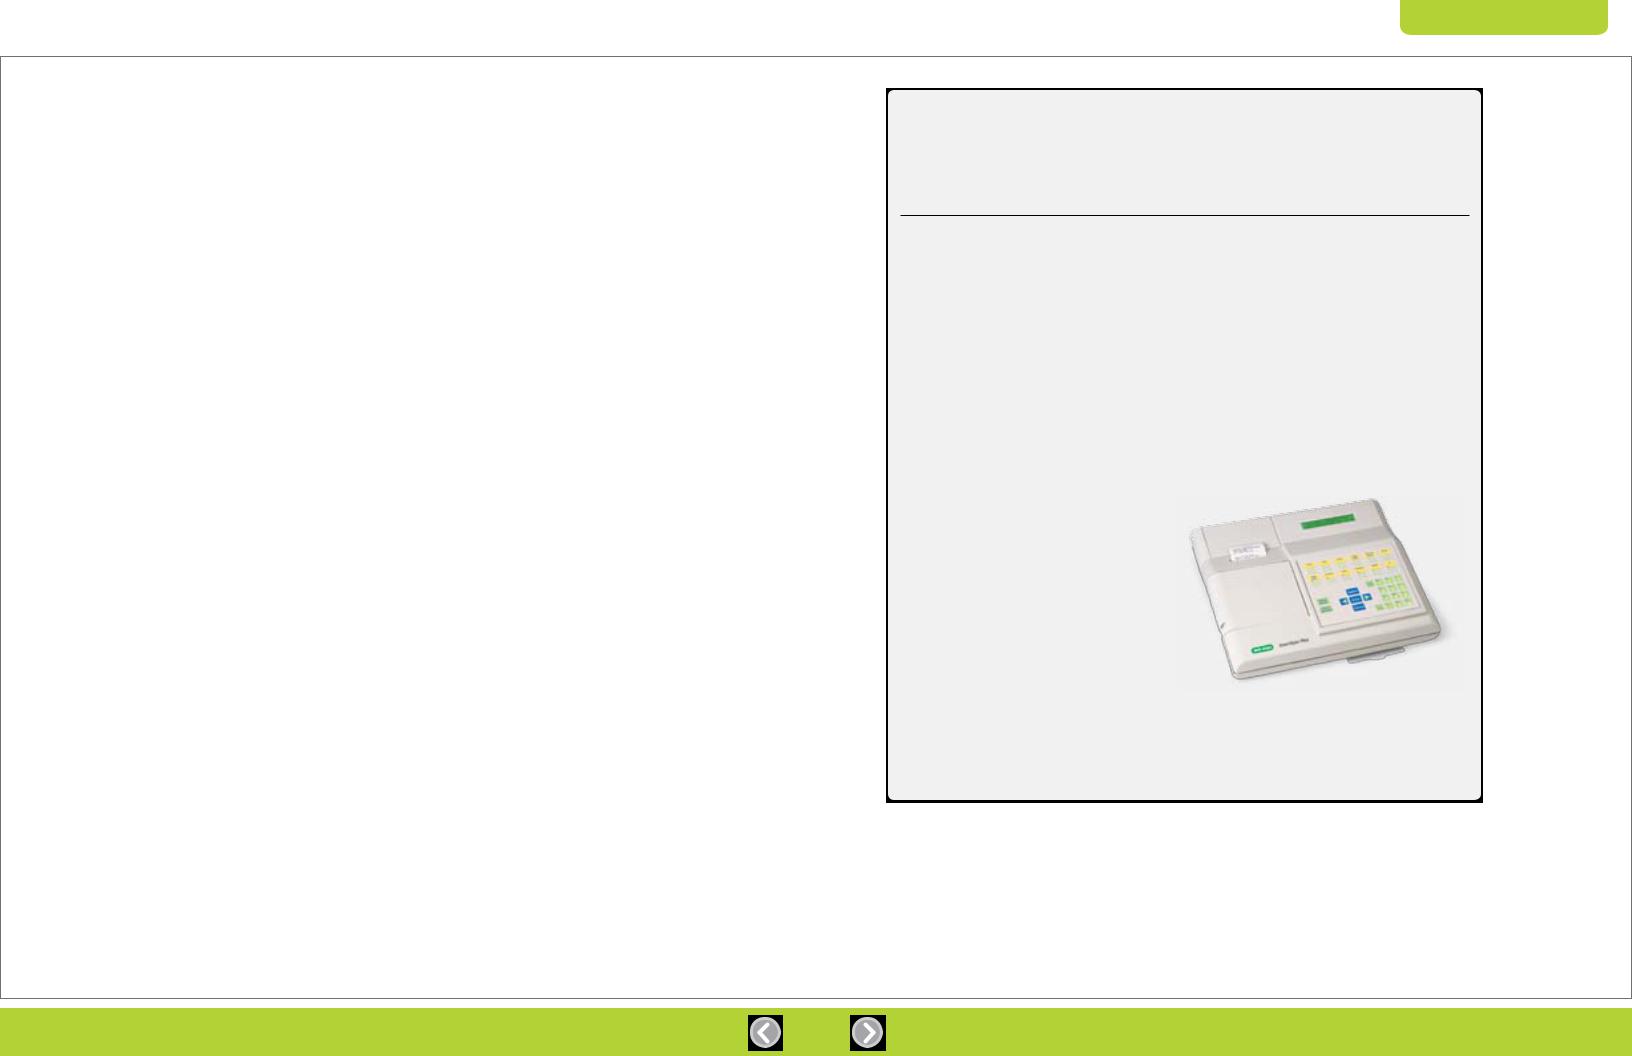
2-D Electrophoresis Guide |
Chapter 2: Sample Preparation |
Theory and Product Selection |
|
|
|
Additional Resources
Samples can be prepared for 2-D electrophoresis using many other techniques. Consult Posch (2008) for more information on:
■■Sample preparation basics (cell disruption, sample solubilization, protein assays, contaminant removal)
■■Protein labeling techniques
■■Fractionation using chemical reagents and chromatography
■■Fractionation using electrophoresis methods
■■Enrichment strategies for organelles, multiprotein complexes, and specific protein classes
■■Application of sample preparation tools and fractionation strategies to study different biological systems
Sample Quantitation (Protein Assays)
Determine the concentration of protein in a sample (Berkelman 2008) by protein assay to:
■■Ensure that the amount of protein to be separated is appropriate for the IPG strip length and visualization method
■■Facilitate comparison among similar samples; image-based analysis is simplified when equivalent quantities of proteins have been separated
The most commonly used protein assays are
visible assays, assays in which the presence of protein causes a visible color change that can be measured with a spectrophotometer (Sapan et al. 1999;
Noble and Bailey 2009; see the Protein Assay Products and SmartSpec™ Plus Spectrophotometer sidebar). All protein assays utilize a dilution series of a known protein (usually bovine serum albumin or bovine γ-globulin) to create a standard curve from which the concentration of the sample is derived (for a protocol describing protein quantitation, refer to Part II of
this guide).
The chemical components of the sample buffer and the amount of protein available for assay dictate the type of assay that may be used.
■■Bradford assays (Bradford 1976) — based on an absorbance shift of Coomassie (Brilliant) Blue G-250 dye under acid conditions, when a redder form of the dye is converted into a bluer form upon binding to protein. The increase of absorbance at 595 nm
is proportional to the amount of bound dye and, therefore, to the amount (concentration) of protein present in the sample. In comparison to other protein assays, the Bradford protein assay is less susceptible to interference by various chemicals that may be present in protein samples, with the exception of elevated concentrations of detergents like SDS.
The response of the Bradford protein assay is only slightly affected by urea, thiourea, and CHAPS in concentrations up to 1.75 M, 0.5 M, and 1% (w/v), respectively
■■Lowry (Lowry et al. 1951) — combines the reactions of cupric ions with the peptide bonds under alkaline conditions with the oxidation of aromatic protein residues. The Lowry method is based on the reaction of Cu+, produced by the peptide-mediated reduction of Cu2+, with FolinCiocalteu reagent (a mixture of phosphotungstic acid and phosphomolybdic acid in the Folin-Ciocalteu reaction). The Lowry assay is intolerant of thiourea, reductants such as DTT, and chelating agents
such as EDTA
■■BCA (bicinchoninic acid, Smith et al. 1985) — BCA reacts directly with Cu+ (generated by peptidemediated reduction of Cu2+) to produce a purple end product. The reagent is fairly stable under alkaline conditions and can be included in the copper solution to allow a one-step procedure. Like the Lowry assay, the BCA assay is intolerant of thiourea, reductants such as DTT, and chelating agents such as EDTA
2-D sample solutions typically contain reagents that interfere with all of the assays described above. The Bradford assay may be used on samples that are concentrated enough to be diluted with water so that urea, thiourea, and CHAPS are no longer
present at interfering levels (typically at least fourfold). Otherwise, modified assay procedures may need to be employed (see the Protein Assay Products sidebar).
Protein Assay Products
Protein concentration in 2-D sample solutions |
reducing agents and detergents. For more |
is best measured using the RC DC™ protein |
information on protein quantitation using visible |
assay, a modification of the Lowry assay that |
assays, refer to Bio-Rad bulletin 1069. |
incorporates a precipitation step that removes
Table 2.3. Bio-Rad protein assay selection guide.
|
Quick Start™ Bradford |
Bio-Rad |
DC™ |
RC DC |
Method |
|
|
|
|
Bradford |
• |
• |
— |
— |
Lowry |
— |
— |
• |
• |
Description |
One-step determination; |
Standard Bradford |
Detergent compatible |
Reducing agent |
|
not for use with |
assay, not to be |
(DC); Lowry assay |
and detergent |
|
SDS-containing samples |
used with elevated |
modified to save time |
compatible (RC DC) |
|
|
levels of detergents |
and to be more |
|
|
|
(>0.1% SDS) |
accurate |
|
Standard-concentration Assay |
|
|
|
|
Sample volume |
100 µl |
100 µl |
100 µl |
100 µl |
Linear range |
0.125–1.5 mg/ml |
0.125–1.5 mg/ml |
0.125–1.5 mg/ml |
0.2–1.5 mg/ml |
Low-concentration Assay |
|
|
|
|
Sample volume |
1 ml |
800 µl |
200 µl |
200 µl |
Linear range |
1.25–25 µg/ml |
1.25–25 µg/ml |
5–250 µg/ml |
5–250 µg/ml |
Microplate assay volume |
5 µl |
10 µl |
5 µl |
** |
Minimum incubation |
5 min |
5 min |
15 min |
15 min |
Assay wavelength |
595 nm |
595 nm |
650–750 nm |
650–750 nm |
|
|
|
|
|
SmartSpec Plus Spectrophotometer
The color change observed in protein assays is measured using a spectrophotometer. Bio-Rad’s SmartSpec Plus spectrophotometer has preprogrammed methods for protein quantitation and a working wavelength range of 200–800 nm. It can be used for routine applications such as:
■■Quantitation of proteins via the Bradford, Lowry, and BCA assay methods
■■Quantitation of DNA, RNA, and oligonucleotides
■■Monitoring bacterial culture growth
■■Simple kinetic assays
■■ Wavelength scans with peak detection |
SmartSpec Plus Spectrophotometer |
|
|
Features built into the SmartSpec assay |
|
methods facilitate data collection and present |
|
a complete analysis of assay results. Bio-Rad |
|
also offers compatible quartz and UV-transparent |
|
plastic cuvettes. |
|
30 |
31 |

2-D Electrophoresis Guide |
Theory and Product Selection |
|
|
CHAPTER 3
The First Dimension: Isoelectric Focusing (IEF)
32 |
33 |
|
|
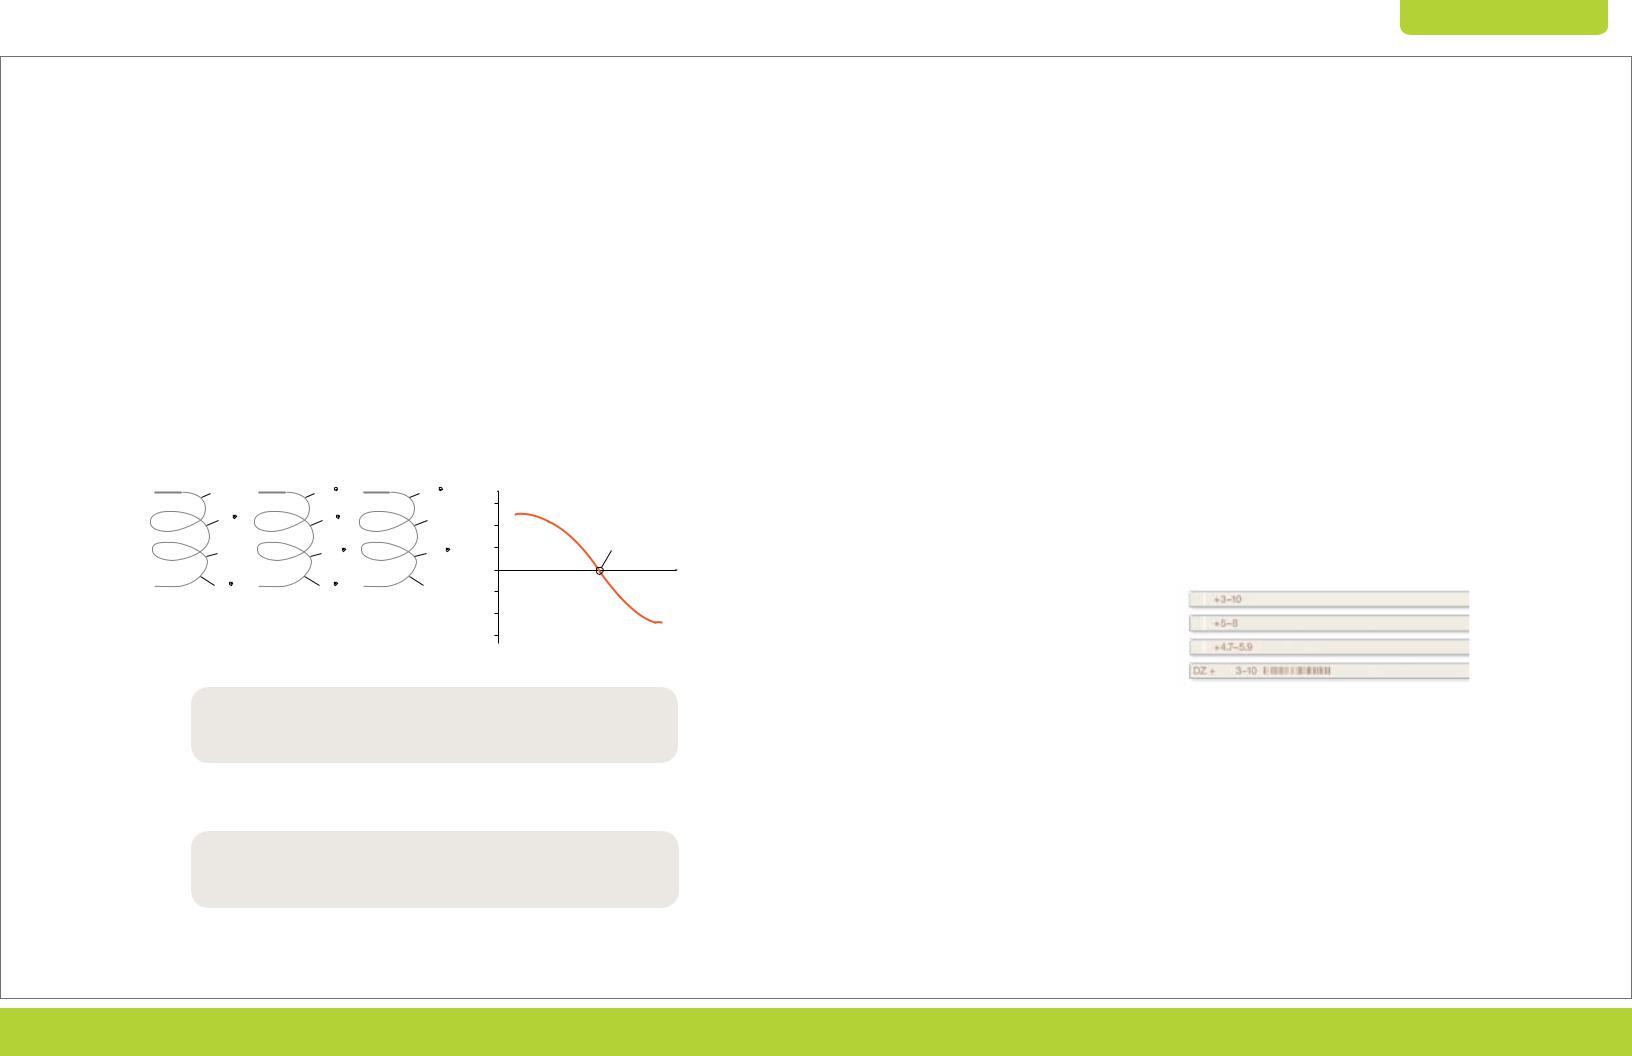
2-D Electrophoresis Guide |
Chapter 3: The First Dimension: Isoelectric Focusing (IEF) |
Theory and Product Selection |
|
|
|
Protein Separation by Isoelectric point (pI)
The first-dimension separation of 2-D electrophoresis is IEF, where proteins are separated on the basis of differences in their pI. The pI of a protein is the pH at which it carries no net charge, and it is a characteristic that is determined by the number and types of charged groups the protein carries.
Proteins are amphoteric molecules, which carry a positive, negative, or zero net charge depending on the pH of their environment. For every protein, there is a specific pH at which its net charge is zero (its pI). Proteins show considerable variation in pI, though pI values usually fall in the range of pH 3–12, with the majority falling between pH 4 and pH 8. A protein
is positively charged at pH values below its pI and negatively charged at pH values above its pI (Figure 3.1).
For IEF, a protein is placed in a medium with a pH gradient and subjected to an electric field. In response to the field, the protein moves toward the electrode with the opposite charge. Along the way, it either picks up or loses protons. Its net charge and mobility decrease until the protein eventually arrives at the point in the pH gradient equal to its pI. There, the protein is
uncharged and stops migrating (Figure 3.2).
If, by diffusion, it drifts away from the point in the gradient corresponding to its pI, it acquires charge and is pulled back. In this way, proteins condense, or are focused, into sharp bands in the pH gradient at their characteristic pI values.
IEF proceeds until a steady state is reached. Proteins approach their pI values at different rates but remain relatively fixed at those pH values for extended periods. This is in contrast to conventional electrophoresis (for example, polyacrylamide gel electrophoresis, or PAGE), where proteins continue to move through the medium until the electric field is removed. Moreover, in IEF, proteins migrate to their steady-state positions from anywhere in the system. IEF for 2-D electrophoresis is performed under denaturing conditions so that proteins are completely disaggregated and all charged groups are exposed to the bulk solution. Consequently, resolution is best under denaturing conditions. Complete denaturation
and solubilization are required to minimize aggregation and intermolecular interactions, thus ensuring that each protein is present in only one configuration.
COOH |
COO |
|
COO Net Charge |
|
|
|
|
|
|
|
|
|
|
|
|
|
|
+ 3 |
|
|
|
|
|
|
|
|
|
NH3 |
NH3 |
|
NH2 |
+ 2 |
|
|
|
|
|
|
|
|
|
|
|
|
|
|
|
|
|
|
|
|
|
|
|
COOH |
COO |
|
COO |
+ 1 |
|
|
|
|
|
Isoelectric point (pl) |
|||
|
|
|
|
|
|
|
|
|
|
||||
|
|
|
|
|
|
|
|
|
|
|
|||
|
|
|
|
0 |
|
|
|
|
|
|
|
|
|
|
|
|
NH2 |
3 |
4 |
5 |
6 |
7 |
8 |
9 |
10 |
11 |
pH |
|
|
|
|
|
|
|
|
|
|
|
|||
NH3 |
NH3 |
|
|
– 1 |
|
|
|
|
|
|
|
|
|
|
|
|
|
|
|
|
|
|
|
|
|
|
|
pH < pl |
pH = pl |
pH > pl |
|
– 2 |
|
|
|
|
|
|
|
|
|
|
|
|
|
|
|
|
|
|
|
|
|
|
|
– 3
Fig. 3.1. Dependence of protein net charge on the pH of its environment. The pH at which the net charge is 0 is the isoelectric point (pI).
|
9 |
|
5 |
|
4 |
|
|
4 |
7 |
|
5 |
|
7 |
6 |
|
5 |
4 |
|
Anode |
|
|
|
|
6 |
|
3 |
|
|
Cathode |
||||||||
|
|
|
|
|
|
9 |
|
|
|
|
|
|||||||
|
|
|
|
|
8 |
|
|
|
|
9 |
|
|
|
|
||||
+ |
3 |
|
|
|
8 |
|
5 |
|
|
6 |
|
3 |
– |
|||||
|
|
|
|
3 |
|
|
|
|
4 |
|
|
|
|
|||||
|
|
6 |
|
7 |
|
10 |
10 |
10 |
8 |
|
9 |
|
||||||
|
|
|
|
|
|
|
|
|
|
|
|
|
|
|||||
pH |
3 |
|
|
|
4 |
5 |
|
6 |
|
7 |
|
|
8 |
|
9 |
|
10 |
|
|
|
|
|
|
|
|
|
|
Focusing |
|
|
|
|
|
|
|
|
|
|
3 |
3 |
|
|
4 |
5 |
|
6 |
|
7 |
|
|
8 |
9 |
|
|
10 |
|
|
|
|
|
5 |
|
|
|
9 |
|
|
||||||||
Anode |
|
|
|
|
|
|
|
|
Cathode |
|||||||||
3 |
|
4 |
4 |
5 |
|
|
|
|
|
|
10 |
|||||||
+ |
|
|
|
7 |
|
8 |
|
|
– |
|||||||||
|
|
|
4 |
|
6 |
6 |
7 |
|
9 |
|
10 |
|
||||||
|
3 |
|
|
|
5 |
|
6 |
|
|
|
8 |
|
|
9 |
|
|
||
|
|
|
|
|
|
|
|
|
|
|
|
|
|
|
|
|
||
pH |
3 |
|
|
|
4 |
5 |
|
6 |
|
7 |
|
|
8 |
|
9 |
|
10 |
|
Fig. 3.2. Principle of IEF. A mixture of proteins is separated in a pH gradient and within an electric field according to each protein’s pI and independently of its size. The proteins migrate until they reach their pI.
IEF Media: IPG Strips vs. Carrier Ampholytes
IEF for 2-D electrophoresis is most commonly performed using immobilized pH gradient (IPG) strips. As their name implies, IPG strips contain buffering groups covalently bound to a polyacrylamide gel strip to generate an immobilized pH gradient. The pH gradients are created with sets of acrylamido buffers, which are derivatives of acrylamide containing
both reactive double bonds and buffering groups. The general structure is CH2=CH–CO–NH–R, where R contains either a carboxyl [–COOH] or a tertiary amino group (for example, –N(CH3)2). These acrylamide derivatives are covalently incorporated into polyacrylamide gels at the time of casting and
can form almost any pH gradient (Righetti 1990). IPG strips are:
■■Supplied commercially and ready to use
■■Prepared on a plastic backing to simplify handling
■■Highly reproducible and stable over even extended IEF runs (Bjellqvist et al. 1982)
■■Available in a wide variety of pH gradients and lengths (see the ReadyStrip™ IPG Strips sidebar)
Historically, first-dimension IEF was performed using carrier ampholyte–generated pH gradients and tube gels. This type of first dimension has been largely superseded by the use of IPG strips for the following reasons:
■■Carrier ampholyte tube gels must be cast by the user
■■Carrier ampholyte–generated pH gradients drift over time and are, therefore, not as reproducible as immobilized pH gradients
■■Carrier ampholytes are complex chemical mixtures, and batch-to-batch variations affect the characteristics of the pH gradient
■■Narrow pH gradients and gradients encompassing the extremes of the pH range (below pH 4 and above pH 9) cannot be accommodated
■■Tube gels can be difficult to handle
ReadyStrip IPG Strips
IPG strips simplify first-dimension separations by immobilizing the pH gradient on an easy-to-handle support strip. ReadyStrip IPG strips are available in a wide selection of pH gradients and strip lengths (from 7 to 24 cm) to fit Bio-Rad vertical
electrophoresis cells and gels. Premade ReadyStrip IEF buffers are also available for convenience and maximum reproducibility.
Relative separation. Relative focusing power expresses the enhanced resolution expected in the first dimension when using IPG strips of different lengths or pH ranges. The 7 cm pH 3–10 IPG strip
ReadyStrip IPG strip pH ranges.
is arbitrarily assigned a baseline focusing power of 1.0 to calculate the relative focusing powers of the other strips.
ReadyStrip IPG strips are preprinted to indicate anode (+) and pH range; in addition, a bar code is printed on the 24 cm strip.
|
|
|
|
|
pH |
|
Relative Focusing Power |
|
|
ReadyStrip IEF Buffer |
|||||||||||||||
Strip Range* |
3 4 5 6 7 8 9 10 |
|
7 cm |
11 cm |
17 cm |
18 cm |
24 cm |
|
3–10 |
7–10 3.9–5.1 4.7–5.9 5.5–6.7 6.3–8.3 |
|||||||||||||||
|
|
||||||||||||||||||||||||
|
|
|
|
|
|
|
|
|
|
|
|
|
|
|
|
|
|
|
|
|
|
|
|
|
|
Broad Range |
|
|
|
|
|
|
|
|
|
|
|
|
|
|
|
|
|
|
|
|
|
|
|
|
|
3–10 |
|
|
|
|
|
|
|
|
|
|
|
|
|
1× |
1.6× |
2.4× |
2.6× |
3.4× |
|
• |
|
|
|
|
|
|
|
|
|
|
|
|
|
|
|
|
|
|
|
|
|
|
|
||||||||
|
|
|
|
|
|
|
|
|
|
|
|
|
|
|
|
|
|
||||||||
3–10 nonlinear (NL) |
|
|
|
|
|
|
|
|
|
|
|
|
|
1× |
1.6× |
2.4× |
2.6× |
3.4× |
|
• |
|
|
|
|
|
|
|
|
|
|
|
|
|
|
|
|
|
|
|
|
|
|
|
||||||||
|
|
|
|
|
|
|
|
|
|
|
|
|
|
|
|
|
|
|
|
|
|
|
|
|
|
Narrow range |
|
|
|
|
|
|
|
|
|
|
|
|
|
|
|
|
|
|
|
|
|
|
|
|
|
3–6 |
|
|
|
|
|
|
|
|
|
|
|
|
|
2.3× |
3.7× |
5.7× |
6.0× |
8.0× |
|
• |
|
|
|
|
|
|
|
|
|
|
|
|
|
|
|
|
|
|
|
|
|
|
|
||||||||
5–8 |
|
|
|
|
|
|
|
|
|
|
|
|
|
2.3× |
3.7× |
5.7× |
6.0× |
8.0× |
|
• |
|
|
|
|
|
|
|
|
|
|
|
|
|
|
|
|
|
|
|
|
|
|
|
||||||||
7–10 |
|
|
|
|
|
|
|
|
|
|
|
|
|
2.3× |
3.7× |
5.7× |
6.0× |
8.0× |
|
|
• |
|
|
|
|
|
|
|
|
|
|
|
|
|
|
|
|
|
|
|
|||||||||||
|
|
|
|
|
|
|
|
|
|
|
|
|
|
|
|||||||||||
4–7 |
|
|
|
|
|
|
|
|
|
|
|
|
|
2.3× |
3.7× |
5.7× |
6.0× |
8.0× |
|
• |
|
|
|
|
|
|
|
|
|
|
|
|
|
|
|
|
|
|
|
|
|
|
|
||||||||
|
|
|
|
|
|
|
|
|
|
|
|
|
|
|
|
|
|
||||||||
Micro range |
|
|
|
|
|
|
|
|
|
|
|
|
|
|
|
|
|
|
|
|
|
|
|
|
|
3.9–5.1 |
|
|
|
|
|
|
|
|
|
|
|
|
|
5.8× |
9.2× |
14.2× |
15.0× |
20.0× |
|
|
|
• |
|
|
|
|
|
|
|
|
|
|
|
|
|
|
|
|
|
|
|||||||||||
|
|
|
|
|
|
|
|
|
|
|
|
|
|
|
|||||||||||
4.7–5.9 |
|
|
|
|
|
|
|
|
|
|
|
|
|
5.8× |
9.2× |
14.2× |
15.0× |
20.0× |
|
|
|
|
• |
|
|
|
|
|
|
|
|
|
|
|
|
|
|
|
|
|
|||||||||||
|
|
|
|
|
|
|
|
|
|
|
|
|
|
|
|||||||||||
5.5–6.7 |
|
|
|
|
|
|
|
|
|
|
|
|
|
5.8× |
9.2× |
14.2× |
15.0× |
20.0× |
|
|
|
|
|
• |
|
|
|
|
|
|
|
|
|
|
|
|
|
|
|
|
|||||||||||
|
|
|
|
|
|
|
|
|
|
|
|
|
|
|
|||||||||||
6.3–8.3 |
|
|
|
|
|
|
|
|
|
|
|
|
|
3.5× |
5.5× |
8.5× |
9.0× |
12.0× |
|
|
|
|
|
|
• |
|
|
|
|
|
|
|
|
|
|
|
|
|
|
|
|||||||||||
|
|
|
|
|
|
|
|
|
|
|
|
|
|
|
|||||||||||
|
|
|
|
|
|
|
|
|
|
|
|
|
|
|
|
|
|
|
|
|
|
|
|
|
|
* Strips are designed with sufficient overlap to allow spot matching while limiting the extent of redundant data.
34 |
35 |

2-D Electrophoresis Guide
Selection of IPG Strips
When selecting the IPG strip, consider both the pH gradient and strip length, as both determine the resolution in the final 2-D gel (see the ReadyStrip IPG strips sidebar).
Choice of pH Gradient
IPG strips are available in various pH gradients (see the table in the ReadyStrip IPG Strips sidebar). The pH gradients are linear (pH varies in a linear manner with respect to length of the strip) except in
the case of nonlinear pH 3–10 gradients (NL, see the Estimation of pI sidebar).
■■Use broad-range strips (for example, pH 3–10) for an overview of the spot distribution along the pH gradient and for comparing different sample preparation strategies. Since many proteins focus
in the middle of the pH range 3–10, using NL gradients can improve resolution of proteins in the middle of that range and compress the width of the extreme pH ranges at the ends of the gradients
■■Use narrowand micro-range gradients for greater resolution (there is a larger separation distance, more cm of gel, per pH unit). With the exclusion of proteins outside the pH range of the strip, more total protein mass can be loaded per strip to also allow detection of more proteins
■■Use overlapping pH ranges to increase resolution by expanding a small pH range across the entire width of a gel (Figure 3.3). This also allows the creation
of composite gels by matching spots from the overlapping regions using imaging software
pH 3–10
|
|
|
|
|
|
|
|
pH 3–6 |
|
|
pH 5–8 |
|
|
pH 7–10 |
|
|
|
|
|||||
|
|
|
|
|
|
|
|
|
|
|
|
|
|
|
|
|
|
|
|
|
|
|
|
Fig. 3.3. A mouse liver sample was extracted in a urea-thiourea-CHAPS solution. The extract was run in a single PROTEAN® i12™ IEF cell run on twelve 11 cm ReadyStrip IPG strips simultaneously at each of the following pH ranges: 3–10, 3–6, 5–8, and 7–10. Each pH gradient was run in triplicate. The second dimension for each IPG strip was run in 8–16% gradient Criterion™ precast gels that were stained with Bio-Safe™ Coomassie stain. The above figure shows a representative gel image for each pH range.
Choice of IPG Strip Length
IPG strips are available in a variety of lengths that match the size of most commercial second-dimension vertical electrophoresis systems. Shorter strips match mini-format systems, and longer strips match largeformat systems. Deciding which strips to use depends on the requirements for speed, sample volume, resolution, and throughput (see Chapter 4 for more details on selecting size format for 2-D electrophoresis):
■■Use shorter strips and mini-format gels for fast, convenient sample screening or method development
■■Use longer strips for the best separation with higher protein loads and for maximum resolution. The longest IPG strips and large-format gels have a large area to resolve protein spots; however, they take a long time to run
■■Combine different size formats for various benefits. For example, use a mini-format system for rapid optimization of sample preparation methods, then switch to a large format for thorough assessment of a complex sample and identification of proteins of interest. In many cases, a mini system and narrowrange IPG strips can then be used to focus in on proteins of interest
■■Use overlapping narrowand micro-range IPG strips to increase the effective length of pI resolution. When three narrow-range overlapping ReadyStrip IPG strips (pH 3–6, 5–8, 7–10) are used with the Criterion system, for example, the resolution in the first dimension (11 cm strip, pH 3–10 NL) is increased from 11 to 26 cm. When four micro-range strips
are used, the resolution in the first dimension is expanded from 11 to 44 cm
36
Chapter 3: The First Dimension: Isoelectric Focusing (IEF) |
Theory and Product Selection |
Estimation of pI
The pI of a protein is a useful parameter for protein characterization. With purified proteins, pI can be determined by IEF using IPG strips, usually under denaturing conditions. Using linear IPG strips, the pH gradient can be assumed to extend linearly between the pH extremes. Knowing the length and pH range of the IPG strip implies that experimental pI values can be assigned with a high level of accuracy (see figure). Protein pI estimations can also be made using NL IPG strips, assuming the pH profile of the IPG strip is available from the manufacturer; without the exact pH
profile of the strip, the pI estimate will be less accurate.
For pI estimation, stain the IPG strips after IEF, for example with Bio-Safe Coomassie blue stain,
and then plot the migration distance along the length of the IPG strips of each of the protein standards. Graph A shows the pH gradient along the length
of a linear pH 4–7 IPG strip. To determine the pI of an unknown, simply determine the band position (as a percentage of gel length) and read the pI from the graph. In the example, a band positioned at 50% of the gel length will have an estimated pI of 5.5.
The same strategy can be applied for protein spots on 2-D gels, but with less accuracy due to swelling or shrinkage of the 2-D gel. It may also be difficult to define the start and end positions of the IPG strip on stained 2-D gels.
With knowledge of experimental pI and molecular weight values (see Chapter 4 for details about molecular weight estimation), it is possible to make comparisons with the calculated values derived after protein spot identification using mass spectrometry. The calculation of theoretical pI values is possible with software tools available on the Internet, for example at http://web.expasy.org/compute_pi. If the values differ significantly from each other, this may indicate
a false identification or the identification of a fragment of the respective protein. However, differences in pI or molecular weight can also suggest posttranslational modifications, such as phosphorylation or glycosylation. The detection of posttranslational modifications
is a unique strength of gel-based proteomics. These modifications offer information about the function, regulation, and cellular location of proteins.
A. Linear pH 4–7 ReadyStrip IPG strip
7
6
pH
5
4
0 |
25 |
50 |
75 |
100 |
B. Nonlinear pH 3–10 ReadyStrip IPG strip
|
10 |
|
|
9 |
|
|
8 |
|
pH |
7 |
|
6 |
||
|
||
|
5 |
|
|
4 |
|
|
3 |
0 |
25 |
50 |
75 |
100 |
|
|
% Total IPG strip length |
|
|
Estimating the pI of a protein from its position along an IPG strip. A, By plotting the pH of an IPG strip as a function of its length, the pI of a protein may be derived from its focused position on that strip. In the example shown, the pI of a protein that migrates across 50% of the strip length is 5.5. B, pH profile of Bio-Rad ReadyStrip nonlinear pH 3–10 IPG strips.
37
2-D Electrophoresis Guide |
Chapter 3: The First Dimension: Isoelectric Focusing (IEF) |
Theory and Product Selection |
|
|
|
Sample Application
Commercial IPG strips are dehydrated and must be rehydrated to their original gel thickness (0.5 mm) before use. The protein sample can be applied
to the IPG strip either during or after rehydration, and rehydration can be done in either disposable rehydration/equilibration trays or directly in the focusing tray. Sample application during rehydration
is the easiest and, in most cases, most efficient way to apply sample. In some instances, however, it is best to rehydrate the IPG strips and then apply sample through sample cups while current is applied
(cup loading) (Table 3.1). Each method is discussed in the following sections.
The rehydration solution generally contains the following components to maintain protein solubility and allow tracking of the separation (see Part II, Methods for recipes):
■■Chaotrope — urea (8 M or up to 9.8 M if necessary for sample solubility), with or without 2 M thiourea
■■Detergent — nonionic or zwitterionic detergent such as CHAPS, Triton X-100, or NP-40 at 0.5–4% (w/v)
■■Reducing agent — 20–100 mM DTT
■■Ampholytes — 0.2% (w/v), usually pH 3–10; concentrations up to 1% (w/v) may be used, though this reduces the voltage and results in correspondingly longer runs
■■Tracking dye — a trace of bromophenol blue to render the IPG strip more visible for simplified handling and act as a tracking dye for confirmation of focusing
The composition of the rehydration solution should also resemble the composition of the sample solution in terms of the additives present to aid solubility. If the sample was prepared using thiourea, the rehydration solution should also contain thiourea. Likewise, the same detergent should be used. Otherwise, transition from one solution to the other can cause precipitation of proteins that are soluble in the sample solution but not in the rehydration solution
Sample Application during Rehydration
In this option, the sample is prepared in, or diluted into, rehydration solution and introduced to the IPG strip
at the time of rehydration. As the strips hydrate for at least 12 hr, proteins in the sample are absorbed and distributed over the entire length of the strip (Rabilloud et al. 1994, Sanchez et al. 1997).
Sample application can be in either the absence (passive) or presence (active) of applied voltage:
■■Active rehydration is performed in the IEF cell. A low voltage (30–100 V) is applied, and proteins enter the gel matrix under current as well as by absorption.
Active rehydration with the sample is believed to promote the entry of large proteins into the strip by applying an electrical “pull”
■■In passive rehydration, proteins enter the gel by absorption only. This allows efficient use of
equipment, since strips can be rehydrated in sample rehydration trays while other samples are focused in the IEF cell
Table 3.1. Advantages and disadvantages of sample loading methods.
Whether IPG strips are rehydrated actively or passively, they must be incubated with sample for at least 12 hr prior to IEF. This gives high molecular weight proteins time to enter the gel after the gel has become fully hydrated and the pores have attained full size.
Sample application during rehydration works because IEF is a steady-state technique; therefore, proteins migrate to their pI independently of their initial positions. The advantages of these approaches
over cup loading are:
■■Simplicity
■■Reduced risk of sample precipitation, which can occur with cup loading at the sample application point if sample concentration is too high (Rabilloud 1999)
■■Shorter focusing times can be used because the sample proteins are in the IPG strip prior to IEF
■■Large amounts of protein can be loaded
Sample Application by Cup Loading
To apply samples after IPG strip rehydration,
the sample is loaded into sample cups positioned on the rehydrated strip. This technique can be more
challenging than in-gel sample loading from a technical standpoint, but it can be beneficial in the following cases (Cordwell et al. 1997, Görg et al. 2000):
■■When samples contain high levels of DNA, RNA, or other large molecules, such as cellulose
■■When running acidic and basic IPG strips; for example, pH 7–10
■■When running micro-range IPG strips spanning ~1 pH unit
Setup for IEF
For IEF, the rehydrated IPG strips are placed into the focusing tray. The orientation (gel-side up or gel-side down) of the IPG strip in the focusing tray is largely determined by the sample loading method employed:
■■Cup loading requires gel-side up strip placement so that the sample cup may be placed in contact with the gel surface
■■In-gel sample loading is conducted gel-side down. If the IEF cell is programmed for an unattended start following rehydration, IEF must be conducted gelside down as well
■■If in-gel sample loading is performed in the rehydration/equilibration tray, IEF may be performed either gel-side up or gel-side down. This is largely a matter of user preference, though improved resolution may be observed with the gel-side up configuration, particularly with higher protein loads
In addition, electrode wicks may be placed between the electrode in the focusing tray and the IPG strip in either running configuration. Electrode wicks serve as a sink for ionic sample contaminants and proteins with pIs outside the pH range of the IPG strip used. They also prevent drying of the ends of the IPG strips during IEF. In some cases, however, the use of electrode wicks has little effect on separation quality, and they may be omitted for convenience in either running configuration if satisfactory results are obtained in their absence.
Method |
Advantages |
Disadvantages |
|
|
|
In-gel rehydration |
Simple sample application |
Poor resolution of basic proteins |
|
No precipitation at the point of sample application |
|
|
Accommodates dilute samples and larger protein loads |
|
Passive |
Focusing can follow rehydration without manual |
Not all proteins, particularly large or hydrophobic |
|
intervention if performed within the IEF instrument |
proteins, will be taken up |
Active |
More effective with certain proteins, particularly those |
Rehydration must occur within the IEF instrument |
|
of high molecular weight |
|
Cup loading |
More effective for basic proteins |
Setup more complicated; the cup must form a seal |
|
|
with the IPG strip |
■■For samples that contain large amounts of glycoproteins
Can improve resolution at extremes of the pH gradient (the end opposite the point of application)
High protein loads are difficult to accommodate; concentrated samples are required.
Sample precipitation may occur at the point of application
38 |
39 |
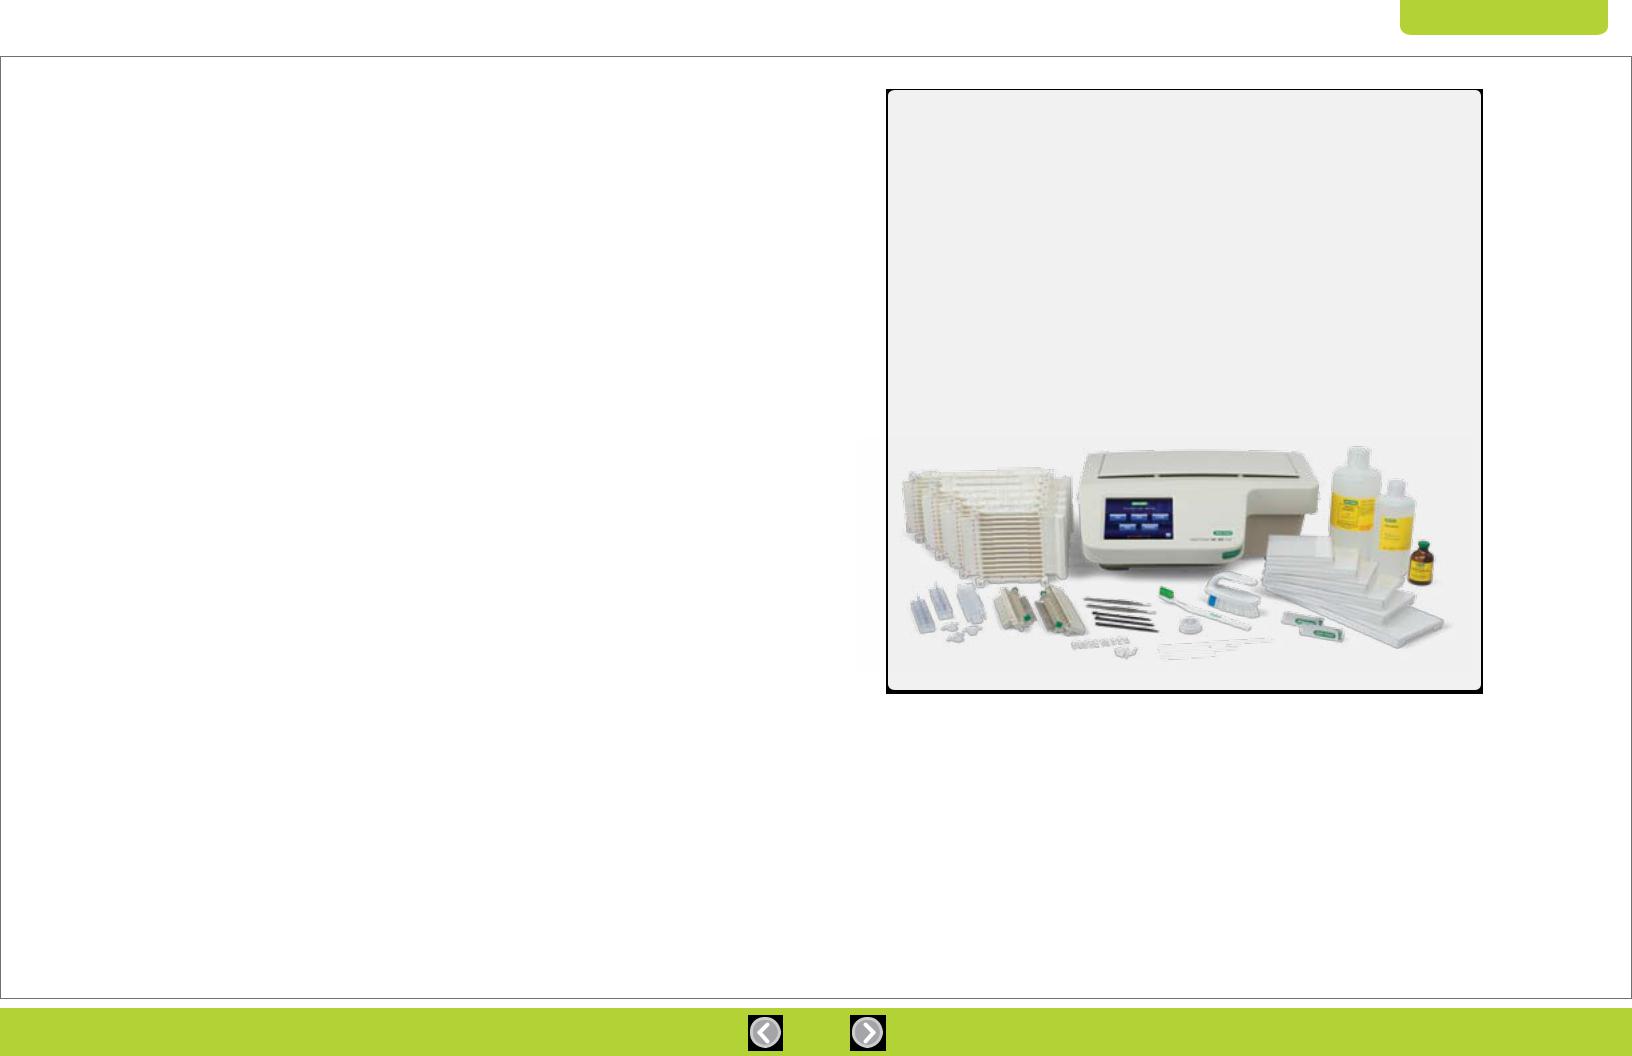
2-D Electrophoresis Guide |
Chapter 3: The First Dimension: Isoelectric Focusing (IEF) |
Theory and Product Selection |
|
|
|
Power Conditions for IEF
The pH gradient and the electric field strength both influence the time required to reach steady state and the resolution of the separation. The electric field strength is determined by the length of the IPG strip and the applied electrical field. In general, narrow pH ranges yield higher resolution and require higher voltages and more time to reach a steady state.
Longer IPG strips can withstand higher programmed voltages and require an increased number of volthours (Vh) for proper focusing. Vh are the product of voltage and time. Because the actual voltage reached is current dependent and the maximum programmed voltage may not be reached, programming the IEF cell with Vh can better ensure that samples receive
a consistent number of volts.
The electrical conductivity of the system changes during an IEF run. At the beginning, the current is relatively high because of the large number of charge carriers present. As the proteins and ampholytes move toward their pIs, and as ionic contaminants move to the ends of the IPG strip, the current gradually decreases. When the proteins reach their final positions in the pH gradient, there is little ionic movement in the system; the voltage reaches a maximum, and the current reaches a minimum.
Focusing should occur with a gradual increase in voltage followed by a prolonged focusing phase at the maximum voltage advisable for the IPG strip length used and until a set number of Vh have accumulated. The optimum duration depends on the length of the IPG strip and the pH gradient. Current is generally limited to 50 µA per IPG strip, and a streamlined onestep protocol is adequate in most circumstances,
as the voltage will rise gradually without the need for a phased focusing protocol with programmed voltage ramping. A more gradual focusing protocol may be advisable in circumstances of heavy protein load,
for some narrowand micro-range IPG strips,
or when there are high levels of charged contaminants present. Since the duration of the prolonged focusing phase is specified in Vh, the actual duration may vary depending on the average voltage during focusing.
Focusing may conclude at different times for IPG strips run at the same time with the same protocol.
It is important, therefore, to include a hold step during which the IPG strip is held at a relatively low voltage to maintain focusing until the IPG strip can be removed from the instrument.
Electrical current generates heat, which limits the magnitude of the electric field that can be applied and the ionic strength of the solutions that can be used. Thin gels dissipate heat better than thick gels and thus better withstand the high voltage that offers higher resolution. Also, as mentioned above, the current drops to a constant low value as focusing reaches
a steady state.
PROTEAN i12 IEF System
The PROTEAN i12 IEF system allows multistep runs at durations set by either time or Vh. Recommended starting electrical conditions and voltage ramping options are provided in Part II of this guide; however, sometimes the number of Vh required to complete a run must be determined empirically in a time course experiment. The optimum Vh depends on the sample and the composition of the sample solution as well as the pH gradient of the IPG strip. A more complex sample or different sample buffer might change the Vh required. The time needed to achieve the programmed Vh depends on the pH range
of the IPG strip as well as sample and buffer characteristics.
Other IEF cells only support running identical pH gradients and similar samples in batches because the programmed current and voltage are spread across all lanes. If different pH ranges or samples with varying conductivity are run at the same time,
the electrical conditions experienced by individual IPG strips are different. This may expose some strips to more or less current than desired, since the total current limit is averaged over the tray. The individual lane control provided by the PROTEAN i12 IEF cell, however, ensures that
the current limit is not exceeded in any IPG strip, even in situations where conductivity differs significantly among samples run at the same time.
The PROTEAN i12 IEF cell also allows each lane to be programmed individually, making it possible to run different protocols in different lanes.
The flexibility of this system allows running different experiments at once or varying conditions within an experiment to allow optimization in fewer runs. The system also results in better reproducibility because focusing conditions are not influenced
by other samples in the run.
PROTEAN i12 IEF Cell and Accessories
40 |
41 |
 Loading...