


NetAtlas Enterprise
Ethernet Switch Manager
User’s Guide
Version 1.01
9/2005

NetAtlas Enterprise Ethernet Switch Manager User’s Guide
Copyright
Copyright © 2005 by ZyXEL Communications Corporation.
The contents of this publication may not be reproduced in any part or as a whole, transcribed,
stored in a retrieval system, translated into any language, or transmitted in any form or by any
means, electronic, mechanical, magnetic, optical, chemical, photocopying, manual, or
otherwise, without the prior written permission of ZyXEL Communications Corporation.
Published by ZyXEL Communications Corporation. All rights reserved.
Disclaimer
ZyXEL does not assume any liability arising out of the application or use of any products, or
software described herein. Neither does it convey any license under its patent rights nor the
patent rights of others. ZyXEL further reserves the right to make changes in any products
described herein without notice. This publication is subject to change without notice.
Trademarks
ZyNOS (ZyXEL Network Operating System) is a registered trademark of ZyXEL
Communications, Inc. Other trademarks mentioned in this publication are used for
identification purposes only and may be properties of their respective owners.
Copyright 2

NetAtlas Enterprise Ethernet Switch Manager User’s Guide
Federal Communications
Commission (FCC) Interference
Statement
This device complies with Part 15 of FCC rules. Operation is subject to the following two
conditions:
• This device may not cause harmful interference.
• This device must accept any interference received, including interference that may cause
undesired operations.
This equipment has been tested and found to comply with the limits for a Class B digital
device pursuant to Part 15 of the FCC Rules. These limits are designed to provide reasonable
protection against harmful interference in a commercial environment. This equipment
generates, uses, and can radiate radio frequency energy, and if not installed and used in
accordance with the instructions, may cause harmful interference to radio communications.
If this equipment does cause harmful interference to radio/television reception, which can be
determined by turning the equipment off and on, the user is encouraged to try to correct the
interference by one or more of the following measures:
• Reorient or relocate the receiving antenna.
• Increase the separation between the equipment and the receiver.
• Connect the equipment into an outlet on a circuit different from that to which the receiver
is connected.
• Consult the dealer or an experienced radio/TV technician for help.
Notice 1
Changes or modifications not expressly approved by the party responsible for compliance
could void the user's authority to operate the equipment.
This Class B digital apparatus complies with Canadian ICES-003.
Cet appareil numérique de la classe B est conforme à la norme NMB-003 du Canada.
Certifications
Go to www.zyxel.com
1 Select your product from the drop-down list box on the ZyXEL home page to go to that
product's page.
2 Select the certification you wish to view from this page.
3 Federal Communications Commission (FCC) Interference Statement

NetAtlas Enterprise Ethernet Switch Manager User’s Guide
Safety Warnings
For your safety, be sure to read and follow all warning notices and instructions.
• To reduce the risk of fire, use only No. 26 AWG (American Wire Gauge) or larger
telecommunication line cord.
• Do NOT open the device or unit. Opening or removing covers can expose you to
dangerous high voltage points or other risks. ONLY qualified service personnel can
service the device. Please contact your vendor for further information.
• Use ONLY the dedicated power supply for your device. Connect the power cord or
power adaptor to the right supply voltage (110V AC in North America or 230V AC in
Europe).
• Do NOT use the device if the power supply is damaged as it might cause electrocution.
• If the power supply is damaged, remove it from the power outlet.
• Do NOT attempt to repair the power supply. Contact your local vendor to order a new
power supply.
• Place connecting cables carefully so that no one will step on them or stumble over them.
Do NOT allow anything to rest on the power cord and do NOT locate the product where
anyone can walk on the power cord.
• If you wall mount your device, make sure that no electrical, gas or water pipes will be
damaged.
• Do NOT install nor use your device during a thunderstorm. There may be a remote risk of
electric shock from lightning.
• Do NOT expose your device to dampness, dust or corrosive liquids.
• Do NOT use this product near water, for example, in a wet basement or near a swimming
pool.
• Make sure to connect the cables to the correct ports.
• Do NOT obstruct the device ventilation slots, as insufficient airflow may harm your
device.
• Do NOT store things on the device.
• Connect ONLY suitable accessories to the device.
Safety Warnings 4

NetAtlas Enterprise Ethernet Switch Manager User’s Guide
ZyXEL Limited Warranty
ZyXEL warrants to the original end user (purchaser) that this product is free from any defects
in materials or workmanship for a period of up to two years from the date of purchase. During
the warranty period, and upon proof of purchase, should the product have indications of failure
due to faulty workmanship and/or materials, ZyXEL will, at its discretion, repair or replace the
defective products or components without charge for either parts or labor, and to whatever
extent it shall deem necessary to restore the product or components to proper operating
condition. Any replacement will consist of a new or re-manufactured functionally equivalent
product of equal value, and will be solely at the discretion of ZyXEL. This warranty shall not
apply if the product is modified, misused, tampered with, damaged by an act of God, or
subjected to abnormal working conditions.
Note
Repair or replacement, as provided under this warranty, is the exclusive remedy of the
purchaser. This warranty is in lieu of all other warranties, express or implied, including any
implied warranty of merchantability or fitness for a particular use or purpose. ZyXEL shall in
no event be held liable for indirect or consequential damages of any kind of character to the
purchaser.
To obtain the services of this warranty, contact ZyXEL's Service Center for your Return
Material Authorization number (RMA). Products must be returned Postage Prepaid. It is
recommended that the unit be insured when shipped. Any returned products without proof of
purchase or those with an out-dated warranty will be repaired or replaced (at the discretion of
ZyXEL) and the customer will be billed for parts and labor. All repaired or replaced products
will be shipped by ZyXEL to the corresponding return address, Postage Paid. This warranty
gives you specific legal rights, and you may also have other rights that vary from country to
country.
5 ZyXEL Limited Warranty

NetAtlas Enterprise Ethernet Switch Manager User’s Guide
Customer Support
Please have the following information ready when you contact customer support.
• Product model and serial number.
• Warranty Information.
• Date that you received your device.
• Brief description of the problem and the steps you took to solve it.
METHOD
LOCATION
CORPORATE
HEADQUARTERS
(WORLDWIDE)
CZECH REPUBLIC
DENMARK
FINLAND
FRANCE
GERMANY
NORTH AMERICA
NORWAY
SPAIN
SWEDEN
SUPPORT E-MAIL TELEPHONE
SALES E-MAIL FAX FTP SITE
support@zyxel.com.tw +886-3-578-3942 www.zyxel.com
sales@zyxel.com.tw +886-3-578-2439 ftp.zyxel.com
info@cz.zyxel.com +420 241 091 350 www.zyxel.cz ZyXEL Communications
info@cz.zyxel.com +420 241 091 359
support@zyxel.dk +45 39 55 07 00 www.zyxel.dk Z y X E L C o m m u n i c a t i o n s A / S
sales@zyxel.dk +45 39 55 07 07
support@zyxel.fi +358-9-4780-8411 www.zyxel.fi Z y X EL C o m m un i c a t i on s O y
sales@zyxel.fi +358-9-4780 8448
info@zyxel.fr +33 (0)4 72 52 97 97 www.zyxel.fr Z y XE L Fr a nc e
+33 (0)4 72 52 19 20
support@zyxel.de +49-2405-6909-0 www.zyxel.de ZyXEL Deutschland GmbH.
sales@zyxel.de +49-2405-6909-99
support@zyxel.com +1-800-255-4101
+1-714-632-0882
sales@zyxel.com +1-714-632-0858 ftp.us.zyxel.com
support@zyxel.no +47 22 80 61 80 www.zyxel.no Z y X E L C o m m u n i c a t i o n s A / S
sales@zyxel.no +47 22 80 61 81
support@zyxel.es +34 902 195 420 www.zyxel.es Z y X E L C o m m u ni c a t i o n s
sales@zyxel.es +34 913 005 345
support@zyxel.se +46 31 744 7700 www.zyxel.se Z y X E L C o m m u ni c at io n s A/ S
sales@zyxel.se +46 31 744 7701
A
WEB SITE
www.europe.zyxel.com
ftp.europe.zyxel.com
www.us.zyxel.com ZyXEL Communications Inc.
REGULAR MAIL
ZyXEL Communications Corp.
6 Innovation Road II
Sc ien ce P ar k
Hsinchu 300
Ta iw a n
Czech s.r.o.
Modranská 621
143 01 Praha 4 - Modrany
Ceská Republika
Col um bu sv ej 5
2860 Soeborg
Denmark
Mal mi nk aa ri 10
00700 Helsinki
Finland
1 ru e d e s V er ge r s
Ba t. 1 / C
69760 Limonest
France
Adenauerstr. 20/A2 D-52146
Wuerselen
Germany
1130 N. Miller St.
Anaheim
CA 92806-2001
U.S.A.
Ni ls H ans en s ve i 13
0667 Oslo
Norway
Alejandro Villegas 33
1º, 28043 Madrid
Spain
Sjöporten 4, 41764 Göteborg
Sweden
Customer Support 6

NetAtlas Enterprise Ethernet Switch Manager User’s Guide
METHOD
LOCATION
UNITED KINGDOM
SUPPORT E-MAIL TELEPHONE
SALES E-MAIL FAX FTP SITE
support@zyxel.co.uk +44 (0) 8702 909090 www.zyxel.co.uk ZyXEL Communications UK
sales@zyxel.co.uk +44 (0) 8702 909091
0906 7370001(UK
only)
A
WEB SITE
ftp.zyxel.co.uk
a. “+” is the (prefix) number you enter to make an international telephone call.
REGULAR MAIL
Ltd.,11 The Courtyard,
Eastern Road, Bracknell,
Berkshire, RG12 2XB,
United Kingdom (UK)
7 Customer Support

NetAtlas Enterprise Ethernet Switch Manager User’s Guide
Table of Contents
Copyright .................................................................................................................. 2
Federal Communications Commission (FCC) Interference Statement ............... 3
Safety Warnings ....................................................................................................... 4
ZyXEL Limited Warranty.......................................................................................... 5
Customer Support.................................................................................................... 6
Table of Contents ..................................................................................................... 8
List of Figures ........................................................................................................ 14
List of Tables .......................................................................................................... 18
Preface .................................................................................................................... 22
Chapter 1
Introduction ............................................................................................................24
1.1 EMS Overview ...................................................................................................24
1.1.1 SNMPc Network Manager ........................................................................24
1.2 System Requirements ........................................................................................24
1.2.1 Device Firmware Versions Supported ......................................................25
1.3 EMS Installation .................................................................................................25
1.4 Accessing NetAtlas ............................................................................................25
Chapter 2
Switch Manager......................................................................................................28
2.1 Switch Manager Overview .................................................................................28
2.2 Access Log .........................................................................................................29
2.3 Database Management ......................................................................................30
2.3.1 Filename Convention ................................................................................30
2.3.2 Database Backup and Restore .................................................................30
2.3.3 Database Log Storage Configuration ........................................................31
2.3.4 Database Scheduled Backup Configuration .............................................32
2.4 Accessing the EMS Main Screen .......................................................................33
Chapter 3
EMS Main Window.................................................................................................. 36
3.1 Introducing the EMS Main Window ....................................................................36
Table of Contents 8

NetAtlas Enterprise Ethernet Switch Manager User’s Guide
3.2 Device Icon Colors .............................................................................................37
3.3 System Message Panel Alarm Status ................................................................37
3.4 System Message Panel Port Status ...................................................................38
3.5 Menu Shortcut Buttons .......................................................................................38
3.6 EMS Main Menu Summary ................................................................................39
3.7 Common EMS Command Buttons .....................................................................41
3.8 View the Switch ..................................................................................................41
3.9 Switch Information .............................................................................................41
3.10 Configuration Save ...........................................................................................42
Chapter 4
Map .......................................................................................................................... 44
4.1 Submap and Device Mapping ............................................................................44
4.1.1 Adding a Submap or Device .....................................................................44
4.1.2 Edit a Node ...............................................................................................45
4.1.3 Find an Object ..........................................................................................46
4.1.4 Delete a Submap ......................................................................................46
4.1.5 Delete a Device ........................................................................................47
4.2 Exit .....................................................................................................................47
Chapter 5
View ......................................................................................................................... 48
5.1 Hardware Status .................................................................................................48
5.2 Spanning Tree Protocol (STP) ...........................................................................50
5.2.1 STP Terminology ......................................................................................50
5.2.2 How STP Works .......................................................................................50
5.2.3 STP Port States ........................................................................................51
5.2.4 STP Status ................................................................................................51
5.3 VLAN Status .......................................................................................................52
5.4 Port Status ..........................................................................................................53
5.5 802.1D ................................................................................................................55
5.5.1 802.1D: MAC Table ...................................................................................55
5.5.2 View the MAC Table .................................................................................55
5.5.3 802.1D: ARP Table ...................................................................................57
5.5.4 How ARP Works .......................................................................................57
5.5.5 View the ARP Table ..................................................................................57
5.6 Multicast Status ..................................................................................................58
Chapter 6
Template.................................................................................................................60
6.1 Template Overview .............................................................................................60
6.2 VLAN Template ..................................................................................................60
6.3 IGMP Filter Template .........................................................................................61
9 Table of Contents

NetAtlas Enterprise Ethernet Switch Manager User’s Guide
6.3.1 IP Multicast Addresses .............................................................................62
6.3.2 Configuring an IGMP Filter Template ........................................................62
6.3.3 New IGMP Filter Template Screen ...........................................................63
6.4 Static Multicast Group Template .........................................................................64
6.4.1 Multicast MAC Address ............................................................................65
6.4.2 Static Multicast Group Template Screen ...................................................65
6.4.3 New Multicast Template Screen ...............................................................67
Chapter 7
Provisioning ........................................................................................................... 70
7.1 Provisioning Overview ........................................................................................70
7.2 Applying an IGMP Filter Profile ..........................................................................70
7.3 Removing an IGMP Filter Profile ........................................................................72
Chapter 8
Performance ...........................................................................................................74
8.1 Interface Performance ........................................................................................74
8.2 Table Menu Bar Icons ........................................................................................75
8.2.1 Editing a Table Entry .................................................................................76
8.2.2 Expand Dialog Box ...................................................................................77
8.3 Graph Menu Bar Icons .......................................................................................78
8.3.1 Graph Styles .............................................................................................79
8.3.2 Chart Format Display Variable ..................................................................79
8.3.3 Graph Labels ............................................................................................80
Chapter 9
Fault......................................................................................................................... 82
9.1 Event Log ...........................................................................................................82
9.2 Loopback Test ....................................................................................................83
Chapter 10
Maintenance ........................................................................................................... 86
10.1 Firmware Upgrade ...........................................................................................86
10.1.1 Procedure to Update Firmware ...............................................................86
10.2 Device Reset ....................................................................................................87
10.3 Network Element Configuration Backup and Restore ......................................88
10.4 Load Factory Default ........................................................................................89
10.5 Scheduled Network Element Configuration Backup ........................................90
10.5.1 Scheduled Network Element Configuration Backup Add ........................91
10.5.2 Scheduled Network Element Configuration Backup Remove .................92
Table of Contents 10

NetAtlas Enterprise Ethernet Switch Manager User’s Guide
Chapter 11
Tools ........................................................................................................................ 94
11.1 Accessing the Switch .......................................................................................94
11.1.1 Telnet ......................................................................................................94
11.1.2 Web Access ............................................................................................95
11.2 Ping ..................................................................................................................95
Chapter 12
Device Menu Overview .......................................................................................... 98
12.1 Device Menu Summary ....................................................................................98
12.2 Property Configuration .....................................................................................98
12.3 Introducing the Device Configuration Window .................................................98
12.3.1 Port List Multiple Port Configuration .......................................................99
12.3.2 The Copy to.. Button .............................................................................100
Chapter 13
System Configuration..........................................................................................104
13.1 System Info ....................................................................................................104
13.2 SNMP .............................................................................................................104
13.2.1 Configuring SNMP ................................................................................105
13.3 Remote Management .....................................................................................106
13.4 Time Setup .....................................................................................................108
Chapter 14
Switch Configuration ........................................................................................... 110
14.1 Switch Setup .................................................................................................. 110
14.2 Priority Queue ................................................................................................ 113
14.3 STP Configuration .......................................................................................... 114
14.4 Link Aggregation ............................................................................................115
14.4.1 Dynamic Link Aggregation ....................................................................116
14.4.2 Link Aggregation ID .............................................................................. 116
14.4.3 Configuring Link Aggregation ...............................................................117
14.4.4 DHCP Relay ......................................................................................... 117
14.4.5 DHCP Relay Agent Information ............................................................ 118
14.5 GARP Timer ...................................................................................................119
14.6 RADIUS ..........................................................................................................120
14.6.1 Introduction to Authentication ...............................................................120
14.6.2 Configuring RADIUS .............................................................................120
14.7 Filtering ..........................................................................................................121
14.7.1 Creating a New Filter ............................................................................122
14.8 MAC Forwarding ............................................................................................123
14.8.1 Configuring Static MAC Forwarding ......................................................123
14.9 Mirroring .........................................................................................................125
11 Table of Contents

NetAtlas Enterprise Ethernet Switch Manager User’s Guide
14.10 DSCP ...........................................................................................................126
Chapter 15
VLAN ..................................................................................................................... 128
15.1 Introduction to VLANs ....................................................................................128
15.2 Configuring 802.1Q VLAN ..............................................................................128
15.2.1 Modify an 802.1Q VLAN .......................................................................130
15.2.2 Removing a VLAN ................................................................................131
15.3 Introduction to Port-based VLANs ..................................................................132
15.3.1 Configuring Port Based VLAN ..............................................................132
Chapter 16
Ethernet Port Configuration................................................................................ 134
16.1 Overview ........................................................................................................134
16.2 Port Setup ......................................................................................................134
16.3 Port VLAN ......................................................................................................137
16.3.1 Configuring Port VLAN .........................................................................137
16.4 Port Link Aggregation .....................................................................................138
16.5 Port STP .........................................................................................................138
16.6 Bandwidth Control ..........................................................................................139
16.7 Broadcast Storm Control ................................................................................141
16.8 DiffServ ..........................................................................................................142
16.9 Port 802.1x .....................................................................................................143
16.10 Port Security .................................................................................................144
16.10.1 Configuring Port Security ....................................................................144
16.11 Port Mirroring ................................................................................................145
16.12 VLAN Stacking .............................................................................................146
16.13 Queue Method .............................................................................................147
Chapter 17
Routing Configuration ......................................................................................... 150
17.1 Static Route ....................................................................................................150
17.1.1 Configuring Static Routing ....................................................................150
17.1.2 Add or Modify a Static Route ................................................................151
Chapter 18
Multicast Configuration ....................................................................................... 154
18.1 Overview ........................................................................................................154
18.1.1 IGMP Snooping ...................................................................................154
18.2 Multicast Setting .............................................................................................154
18.2.1 Changing the Port Multicast Settings ....................................................156
18.2.2 Applying a Multicast Template ..............................................................156
18.2.3 Displaying IGMP Filter Profile ...............................................................157
Table of Contents 12

NetAtlas Enterprise Ethernet Switch Manager User’s Guide
18.3 MVR ...............................................................................................................158
18.3.1 Types of MVR Ports ..............................................................................159
18.3.2 MVR Modes ..........................................................................................159
18.3.3 Viewing MVR Settings ..........................................................................159
18.3.4 Creating a New Multicast VLAN ...........................................................161
18.3.5 Creating a New MVR Group .................................................................162
Chapter 19
Troubleshooting ...................................................................................................166
19.1 Installation Problems ......................................................................................166
19.2 Problems Accessing the EMS ........................................................................166
19.3 Uninstalling the EMS ......................................................................................166
19.4 Problems Finding a Device ............................................................................167
Appendix A
SNMPc Network Manager.................................................................................... 168
Starting the SNMPc Network Manager .................................................................. 168
Manual Startup................................................................................................. 168
Automatic Startup ............................................................................................ 168
SNMPc Main Window ...................................................................................... 169
Selection Tool .................................................................................................. 170
Event Log Tool ................................................................................................. 170
View Window Area........................................................................................... 171
Main and Edit Button Bar Icons ....................................................................... 171
Appendix B
Alarm Types and Causes .................................................................................... 174
Index...................................................................................................................... 176
13 Table of Contents

NetAtlas Enterprise Ethernet Switch Manager User’s Guide
List of Figures
Figure 1 SNMPc: Switch Device List Icon ........................................................................... 25
Figure 2 NetAtlas Main Screen ...................................................................................... 26
Figure 3 EMS: Main Screen ............................................................................................... 26
Figure 4 Switch Manager .................................................................................................. 28
Figure 5 Switch Manager: Admin: Access Log ................................................................... 29
Figure 6 Switch Manager: Admin: Database Management: Backup/Restore .................... 31
Figure 7 Switch Manager: Admin: Database Management: Log Storage ........................... 31
Figure 8 Switch Manager: Admin: Database Management: Scheduled Backup ................. 32
Figure 9 EMS: Main Screen ............................................................................................... 34
Figure 10 EMS Main Screen Overview ............................................................................... 36
Figure 11 EMS Main Screen Shortcut Bar ......................................................................... 38
Figure 12 Switch View ........................................................................................................ 41
Figure 13 Configuration: System Configuration: System Info ............................................ 42
Figure 14 Configuration Save ............................................................................................ 43
Figure 15 Configuration Save: Result ................................................................................ 43
Figure 16 Submaps and Device Mapping ........................................................................... 44
Figure 17 Map: Add Submap/Device .................................................................................. 45
Figure 18 Map: Edit Node ................................................................................................... 46
Figure 19 Map: Find Object ................................................................................................. 46
Figure 20 Map: Delete Warning .......................................................................................... 46
Figure 21 View: Hardware Status ....................................................................................... 48
Figure 22 View: STP Status ................................................................................................ 51
Figure 23 View: VLAN Status .............................................................................................. 53
Figure 24 View: Port Status ................................................................................................ 54
Figure 25 MAC Table Flowchart .......................................................................................... 55
Figure 26 View: 802.1d: MAC Table ................................................................................... 56
Figure 27 View: 802.1d: ARP Table .................................................................................... 58
Figure 28 View: Multicast Status ........................................................................................ 59
Figure 29 Template: VLAN ................................................................................................. 60
Figure 30 Template: IGMP Filter ........................................................................................ 62
Figure 31 Template: New IGMP Filter ................................................................................ 63
Figure 32 Multicast MAC-IP Address Mapping Example ................................................... 65
Figure 33 Template: Multicast ............................................................................................ 66
Figure 34 Template: New Multicast .................................................................................... 67
Figure 35 Provisioning: IGMP Filter ................................................................................... 71
Figure 36 Provisioning: IGMP Filter: Apply to Devices ...................................................... 71
Figure 37 Provisioning: IGMP Filter: Apply to Devices: Successful ................................... 72
Figure 38 Provisioning: IGMP Filter: Remove From Devices .............................................. 72
List of Figures 14

NetAtlas Enterprise Ethernet Switch Manager User’s Guide
Figure 39 Provisioning: IGMP Filter: Remove From Devices: Select Device ..................... 73
Figure 40 Provisioning: IGMP Filter: Remove From Devices: Successful ......................... 73
Figure 41 Performance: Interface ....................................................................................... 74
Figure 42 Table Menu Bar Icons ......................................................................................... 75
Figure 43 Edit Table Entry .................................................................................................. 76
Figure 44 Expand Field ...................................................................................................... 78
Figure 45 Graph Menu Bar ................................................................................................. 79
Figure 46 Cell Properties Select ......................................................................................... 80
Figure 47 Chart Color Codes and Line Styles ..................................................................... 80
Figure 48 Graph Variables ................................................................................................. 81
Figure 49 Fault: Event Log .................................................................................................. 82
Figure 50 Fault: Loopback Test ......................................................................................... 84
Figure 51 fault: Loopback: Result ...................................................................................... 84
Figure 52 Maintenance: Firmware Upgrade ........................................................................ 87
Figure 53 Maintenance: Firmware Upgrade: Result .......................................................... 87
Figure 54 Maintenance: Device Reset ................................................................................ 88
Figure 55 Maintenance: Device Reset: Result ................................................................... 88
Figure 56 Maintenance: Configuration Backup/Restore ..................................................... 89
Figure 57 Maintenance: Load Factory Defaults .................................................................. 90
Figure 58 Maintenance: Scheduled NE Config Backup ...................................................... 90
Figure 59 Maintenance: Scheduled NE Config Backup Add ............................................... 92
Figure 60 Telnet ................................................................................................................. 94
Figure 61 Web Access ........................................................................................................ 95
Figure 62 Ping .................................................................................................................... 96
Figure 63 Device Panel List Menus .................................................................................... 98
Figure 64 Configuration Window ......................................................................................... 99
Figure 65 Configuration Window: Port List: Multiple Port Select ........................................ 100
Figure 66 Applied Results ................................................................................................... 100
Figure 67 Copy Port Setup: Example .................................................................................. 101
Figure 68 Copy Successful ................................................................................................. 102
Figure 69 SNMP Management Model ................................................................................. 104
Figure 70 System Configuration: SNMP Conf. .................................................................... 106
Figure 71 System Configuration: Remote Management ..................................................... 107
Figure 72 System Configuration: Time Setup .................................................................... 108
Figure 73 Switch Configuration: Switch Setup (ES-2024A) ............................................... 110
Figure 74 Switch Configuration: Switch Setup (GS-2024) ................................................. 111
Figure 75 Switch Configuration: Switch Setup (ES-3124/ES-3124PWR) .......................... 111
Figure 76 Switch Configuration: Priority Queue .................................................................. 113
Figure 77 Switch Configuration: STP Conf. ....................................................................... 115
Figure 78 Switch Configuration: Link Aggregation ............................................................. 117
Figure 79 Switch Configuration: DHCP Relay .................................................................... 118
Figure 80 Switch Configuration: GARP Timer .................................................................... 120
Figure 81 Switch Configuration: RADIUS .......................................................................... 121
15 List of Figures

NetAtlas Enterprise Ethernet Switch Manager User’s Guide
Figure 82 Switch Configuration: Filtering ........................................................................... 122
Figure 83 Switch Configuration: Filtering: Add .................................................................. 122
Figure 84 Switch Configuration: MAC Forwarding .............................................................. 124
Figure 85 Switch Configuration: MAC Forwarding: Add ..................................................... 124
Figure 86 Switch Configuration: Mirroring (ES-2024) ........................................................ 125
Figure 87 Switch Configuration: Mirroring (GS-2024) ........................................................ 126
Figure 88 Switch Configuration: Mirroring (ES-3124/ES-3124PWR) ................................. 126
Figure 89 DiffServ: Differentiated Service Field ................................................................. 127
Figure 90 Switch Configuration: DSCP .............................................................................. 127
Figure 91 Selecting a VLAN Type ...................................................................................... 129
Figure 92 VLAN Configuration: 802.1Q ............................................................................. 129
Figure 93 VLAN Configuration: 802.1Q: Modify ................................................................. 130
Figure 94 VLAN Configuration: Port Based ....................................................................... 132
Figure 95 Ethernet Port Configuration: Port Setup (ES-2024A) ......................................... 134
Figure 96 Ethernet Port Configuration: Port Setup (GS-2024) ........................................... 135
Figure 97 Ethernet Port Configuration: Port Setup (ES-3124/ES-3124PWR) .................... 135
Figure 98 Ethernet Port Configuration: Port VLAN ............................................................ 137
Figure 99 Ethernet Port Configuration: Port Link Aggregation ............................................ 138
Figure 100 Ethernet Port Configuration: Port STP .............................................................. 139
Figure 101 Ethernet Port Configuration: Bandwidth Ctrl. ................................................... 140
Figure 102 Ethernet Port Configuration: Bandwidth Ctrl. (GS-2024) ................................. 140
Figure 103 Ethernet Port Configuration: Broadcast Storm Ctrl. (ES-2024A) ..................... 141
Figure 104 Ethernet Port Configuration: Broadcast Storm Ctrl. (GS-2024) ....................... 141
Figure 105 Ethernet Port Configuration: Broadcast Storm Ctrl. (ES-3124/ES-3124PWR) 141
Figure 106 Ethernet Port Configuration: DiffServ ............................................................... 143
Figure 107 Ethernet Port Configuration: Port 802.1x .......................................................... 143
Figure 108 Ethernet Port Configuration: Port Security ........................................................ 144
Figure 109 Ethernet Port Configuration: Port Security (GS-2024) ..................................... 144
Figure 110 Ethernet Port Configuration: Port Mirroring ....................................................... 146
Figure 111 Ethernet Port Configuration: VLAN Stacking ................................................... 147
Figure 112 Ethernet Port Configuration: Queue Method ................................................... 148
Figure 113 Routing Configuration: Static Route ................................................................. 150
Figure 114 Routing Configuration: Static Route: Add or Modify ......................................... 151
Figure 115 Multicast Configuration: Multicast Setting ........................................................ 155
Figure 116 Multicast Configuration: Multicast Setting: Modify ............................................ 156
Figure 117 Multicast Configuration: Multicast Setting: Load Template ............................... 157
Figure 118 Multicast Configuration: Multicast Setting: View Profile ................................... 158
Figure 119 Multicast Configuration: MVR ........................................................................... 160
Figure 120 Multicast Configuration: MVR: Add MVLAN ..................................................... 161
Figure 121 Multicast Configuration: MVR: Add MVLAN: Result ........................................ 162
Figure 122 Multicast Configuration: MVR: Select MVLAN ................................................. 162
Figure 123 Multicast Configuration: MVR: Add .................................................................. 163
Figure 124 Configuration: Multicast Configuration: MVR: Add MVR Group: Result .......... 163
List of Figures 16

NetAtlas Enterprise Ethernet Switch Manager User’s Guide
Figure 125 EMS: Remove ................................................................................................... 167
Figure 126 Automatic Startup .............................................................................................. 168
Figure 127 SNMPc Main Windows ..................................................................................... 169
Figure 128 SNMPc Main Button Bar Icons ......................................................................... 171
Figure 129 SNMPc Edit Button Bar Icons ........................................................................... 172
17 List of Figures

NetAtlas Enterprise Ethernet Switch Manager User’s Guide
List of Tables
Table 1 System Requirements ........................................................................................... 24
Table 2 Device Firmware Versions Supported ................................................................... 25
Table 3 Switch Manager Menus Overview ......................................................................... 28
Table 4 Switch Manager: Admin: Access Log .................................................................... 29
Table 5 Switch Manager: Admin: Database Management: Backup/Restore ...................... 31
Table 6 Switch Manager: Admin: Database Management: Log Storage ............................ 32
Table 7 Switch Manager: Admin: Database Management: Scheduled Backup ................. 33
Table 8 EMS Main Screen Overview .................................................................................. 37
Table 9 Device Icon Colors ................................................................................................ 37
Table 10 System Message Panel Alarm Status ................................................................. 37
Table 11 EMS Menu Summary ........................................................................................... 39
Table 12 EMS Navigation Panel Sub-link Descriptions ...................................................... 39
Table 13 Common EMS Command Buttons ...................................................................... 41
Table 14 Configuration: Switch System Configuration ....................................................... 42
Table 15 Map: Add Submap/Device ................................................................................... 45
Table 16 Status: Hardware Status ...................................................................................... 49
Table 17 STP Path Costs ................................................................................................... 50
Table 18 STP Port States ................................................................................................... 51
Table 19 View: STP Status ................................................................................................. 52
Table 20 View: VLAN Status .............................................................................................. 53
Table 21 View: Port Status ................................................................................................. 54
Table 22 View: 802.1d: MAC Table .................................................................................... 56
Table 23 View: 802.1d: ARP Table ..................................................................................... 58
Table 24 View: Multicast Status .......................................................................................... 59
Table 25 Template: VLAN ................................................................................................... 61
Table 26 Template: IGMP Filter .......................................................................................... 62
Table 27 Template: New IGMP Filter .................................................................................. 64
Table 28 Template: Multicast .............................................................................................. 66
Table 29 Template: New Multicast ...................................................................................... 67
Table 30 Performance: Interface ........................................................................................ 74
Table 31 Edit Table Entry ................................................................................................... 76
Table 32 Variable Types ..................................................................................................... 78
Table 33 Edit Table Entry ................................................................................................... 79
Table 34 Edit Style Dialog Box ........................................................................................... 80
Table 35 Graph Variables ................................................................................................... 81
Table 36 Fault: Event Log .................................................................................................. 82
Table 37 Maintenance: Configuration Backup/Restore ...................................................... 89
Table 38 Maintenance: Scheduled NE Config Backup ....................................................... 91
List of Tables 18

NetAtlas Enterprise Ethernet Switch Manager User’s Guide
Table 39 Configuration Window ......................................................................................... 99
Table 40 Copy Port Setup .................................................................................................. 101
Table 41 SNMP Commands ............................................................................................... 105
Table 42 System Configuration: SNMP Conf. .................................................................... 106
Table 43 System Configuration: Remote Management ...................................................... 107
Table 44 System Configuration: Time Setup ...................................................................... 108
Table 45 Switch Configuration: Switch Setup ..................................................................... 112
Table 46 Switch Configuration: Priority Queue ................................................................... 114
Table 47 Switch Configuration: STP Conf. ......................................................................... 115
Table 48 Aggregation ID Local Switch ............................................................................... 116
Table 49 Aggregation ID Peer Switch ................................................................................ 116
Table 50 Switch Configuration: Link Aggregation ............................................................... 117
Table 51 Switch Configuration: DHCP Relay ..................................................................... 119
Table 52 Switch Configuration: GARP Timer ..................................................................... 120
Table 53 Switch Configuration: RADIUS ............................................................................ 121
Table 54 Switch Configuration: Filtering ............................................................................. 122
Table 55 Switch Configuration: Filtering: Add .................................................................... 123
Table 56 Switch Configuration: MAC Forwarding ............................................................... 124
Table 57 Switch Configuration: MAC Forwarding: Add ...................................................... 125
Table 58 Switch Configuration: Mirroring ........................................................................... 126
Table 59 Switch Configuration: DSCP ................................................................................ 127
Table 60 VLAN Configuration: 802.1Q ............................................................................... 129
Table 61 VLAN Configuration: 802.1Q: Modify .................................................................. 131
Table 62 VLAN Port Type Descriptions .............................................................................. 131
Table 63 VLAN Configuration: Port Based ......................................................................... 133
Table 64 Ethernet Port Configuration: Port Setup .............................................................. 135
Table 65 Ethernet Port Configuration: Port VLAN .............................................................. 137
Table 66 Ethernet Port Configuring: Port Link Aggregation ............................................... 138
Table 67 Ethernet Port Configuration: Port STP ................................................................ 139
Table 68 Ethernet Port Configuration: Bandwidth Ctrl. ....................................................... 140
Table 69 Ethernet Port Configuration: Broadcast Storm Ctrl. ............................................. 142
Table 70 Ethernet Port Configuration: Port 802.1x ............................................................. 143
Table 71 Ethernet Port Configuration: Port Security .......................................................... 145
Table 72 Ethernet Port Configuration: Port Mirroring ......................................................... 146
Table 73 Ethernet Port Configuration: VLAN Stacking ....................................................... 147
Table 74 Ethernet Port Configuration: Queue Method ....................................................... 148
Table 75 Routing Configuration: Static Route .................................................................... 151
Table 76 Routing Configuration: Static Route: Add or Modify ............................................ 151
Table 77 Multicast Configuration: Multicast Setting ............................................................ 155
Table 78 Multicast Configuration: Multicast Setting: Modify ............................................... 156
Table 79 Multicast Configuration: Multicast Setting: Load Template .................................. 157
Table 80 Multicast Configuration: Multicast Setting: View Profile ....................................... 158
Table 81 Multicast Configuration: MVR .............................................................................. 160
19 List of Tables

NetAtlas Enterprise Ethernet Switch Manager User’s Guide
Table 82 General Installation Problems ............................................................................. 166
Table 83 Problems Accessing the EMS ............................................................................. 166
Table 84 Problems Accessing the EMS ............................................................................. 167
Table 85 SNMPc Main Window .......................................................................................... 169
Table 86 Selection Tool ...................................................................................................... 170
Table 87 Alarm Types and Causes .................................................................................... 174
List of Tables 20

NetAtlas Enterprise Ethernet Switch Manager User’s Guide
21 List of Tables

NetAtlas Enterprise Ethernet Switch Manager User’s Guide
Preface
Congratulations on your purchase of the NetAtlas Enterprise Ethernet Switch Manager for the
ES-3124 series, ES-2024A. and GS-2024. The Ethernet Switch Manager is an Element
Management System (EMS) that retrieves management information from switches using
SNMP.
Note: Register your product online to receive e-mail notices of firmware upgrades and
information at www.zyxel.com for global products, or at www.us.zyxel.com for
North American products.
About This User's Guide
This manual is designed to guide you through the configuration of your EMS for its
applications.
Syntax Conventions
• “Enter” means for you to type one or more characters. “Select” or “Choose” means for
you to use one predefined choices.
• The SMT menu titles and labels are in Bold Times New Roman font. Predefined field
choices are in Bold Arial font. Command and arrow keys are enclosed in square
brackets. [ENTER] means the Enter, or carriage return key; [ESC] means the Escape key
and [SPACE BAR] means the Space Bar.
• Mouse action sequences are denoted using a comma. For example, “click the Apple icon,
Control Panels and then Modem” means first click the Apple icon, then point your
mouse pointer to Control Panels and then click Modem.
• For brevity’s sake, we will use “e.g.,” as a shorthand for “for instance”, and “i.e.,” for
“that is” or “in other words” throughout this manual.
• The NetAtlas Enterprise Ethernet Switch Manager may be referred to as” the EMS” in
this User’s guide.
• The switches being managed by the EMS may be referred to as “the switch” in this User’s
Guide.
Related Documentation
• Supporting Disk
Refer to the included CD for support documents.
• Switch User’s Guide
Refer to your switch User’s Guide for directions on installation, connections,
maintenance, hardware troubleshooting and safety warnings.
• ZyXEL Glossary and Web Site
Please refer to www.zyxel.com for an online glossary of networking terms and additional
support documentation.
Preface 22

NetAtlas Enterprise Ethernet Switch Manager User’s Guide
User Guide Feedback
Help us help you. E-mail all User Guide-related comments, questions or suggestions for
improvement to techwriters@zyxel.com.tw or send regular mail to The Technical Writing
Team, ZyXEL Communications Corp., 6 Innovation Road II, Science-Based Industrial Park,
Hsinchu, 300, Taiwan. Thank you.
23 Preface

This chapter introduces and shows you how to access the EMS (Element Management
System).
1.1 EMS Overview
The Element Management System (EMS) retrieves management information from switches
using the SNMP protocol.
An EMS is composed of Network Elements (NE) that represent resources in a Network
Management System (NMS). The network elements can represent a physical piece of
equipment on the network, the components of a device on the network, or parts of the network
itself. The EMS is designed to manage the ES-3124 series, ES-2024A and GS-2024 switches
in the NMS. The ES-3124 series covers the ES-3124 and the ES-3124PWR.
NetAtlas Enterprise Ethernet Switch Manager User’s Guide
CHAPTER 1
Introduction
EMS screens vary depending on your switch models. Screens for the ES-2024A will be shown
unless otherwise specified.
1.1.1 SNMPc Network Manager
SNMPc is network management software produced by Castle Rock.
You must have SNMPc properly installed before you can use the EMS; please refer to the
appendices in this User’s Guide; go to the Castle Rock web site at www.castlerock.com or see
your SNMPc user's guide.
1.2 System Requirements
These are the system requirements for the Windows version of the EMS.
Table 1 System Requirements
HARDWARE SOFTWARE
CPU: Intel Pentium 4, 1.6 GHz or
above
Memory (RAM): 1 GB or more Database Program: PostgreSQL 8.0 or later
Hard Disk free space: 20 GB or more Castle Rock’s SNMPc 6.09 (Enterprise or
Operating System using NTFS file system:
Windows 2000 (with service pack 1), Windows XP
or Windows Server 2003.
versions.
Workgroup edition)
Chapter 1 Introduction 24
NetAtlas Enterprise Ethernet Switch Manager User’s Guide
Table 1 System Requirements (continued)
HARDWARE SOFTWARE
Screen Resolution: 1024x768 pixels
Ethernet Adaptor: 10/100 Mbps
1.2.1 Device Firmware Versions Supported
The EMS supports the devices and device firmware versions as listed in the following tale.
Table 2 Device Firmware Versions Supported
DEVICE MODEL FIRMWARE VERSION
ES-3124 360TP1C0 or later versions
ES-3124PWR 360TY1C0 or later versions
ES-2024A 360TX1C0 or later versions
GS-2024 360LT0C0 or later versions
1.3 EMS Installation
Refer to the Quick Start Guide for the EMS installation procedure.
1.4 Accessing NetAtlas
1
Follow the steps below to access NetAtlas.
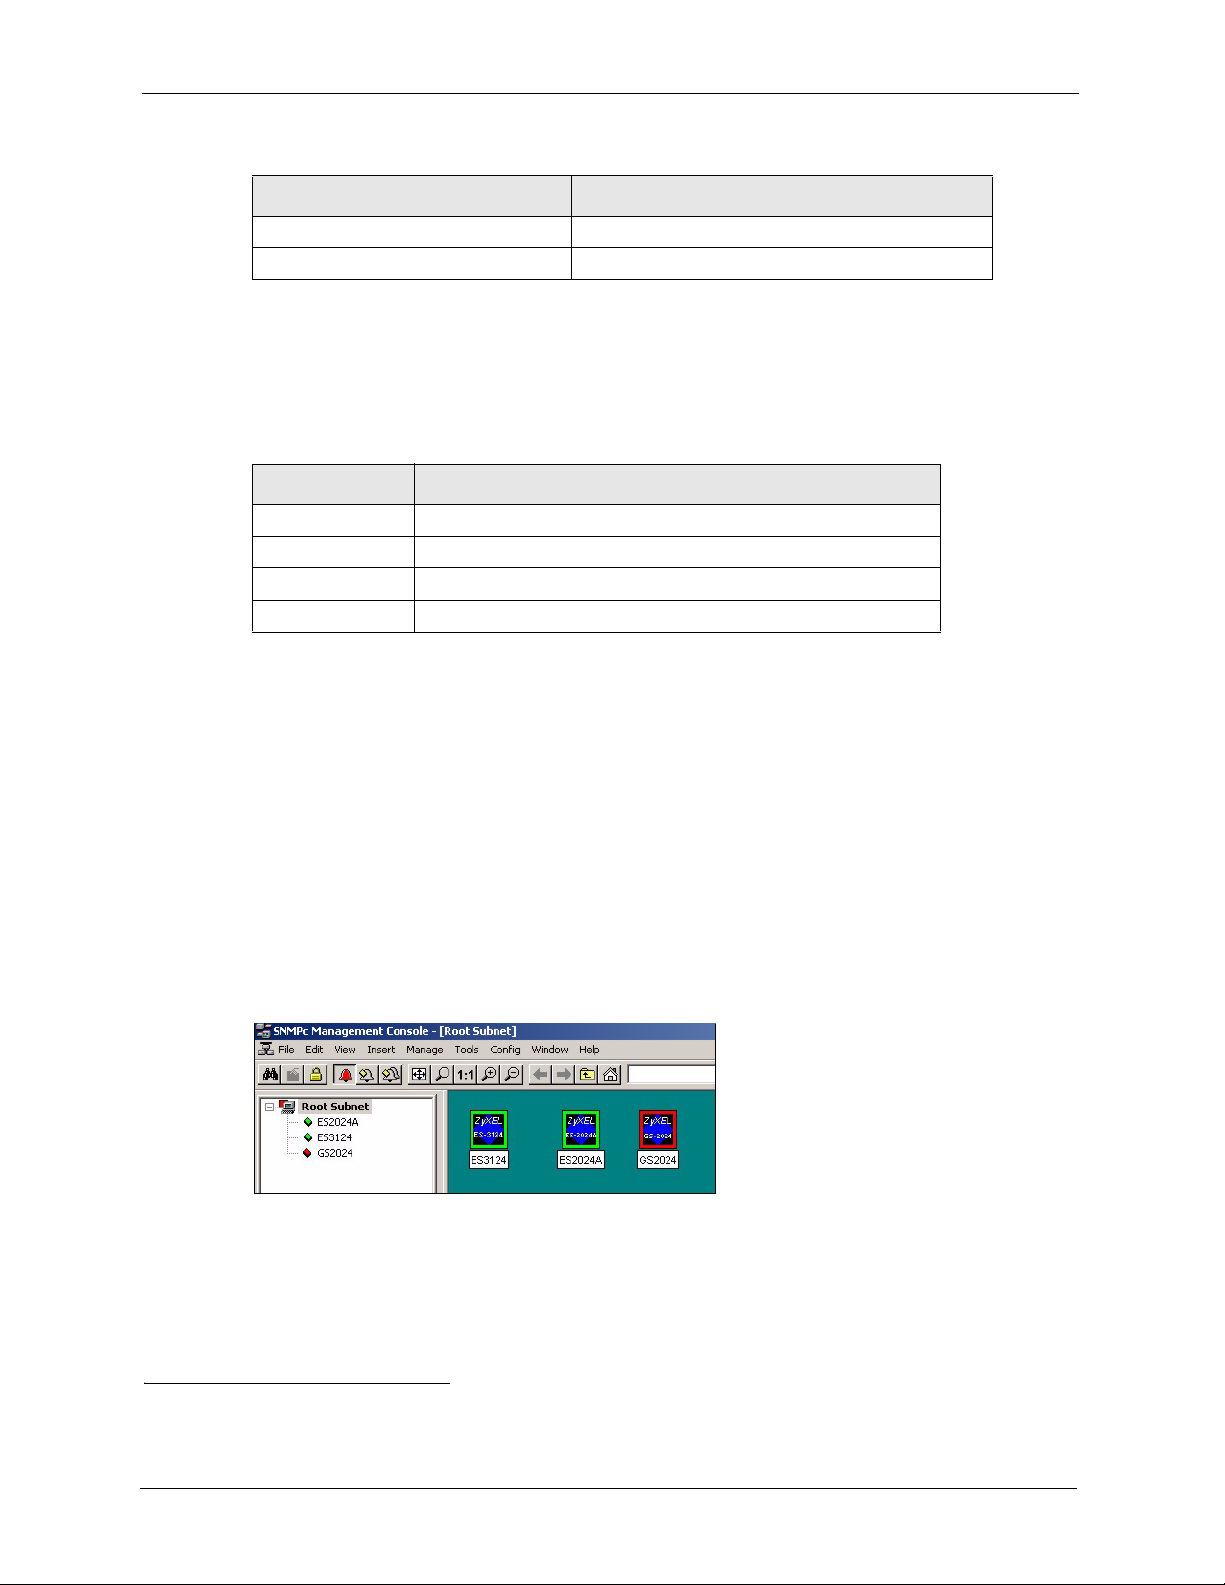
1 In the SNMPc main screen, double-click the switch icon.
Figure 1 SNMPc: Switch Device List Icon
2 Click the Switch Manager icon to display the main EMS screen.
1. The list of devices and device firmware versions supported is accurate at the time of writing.
25 Chapter 1 Introduction
NetAtlas Enterprise Ethernet Switch Manager User’s Guide
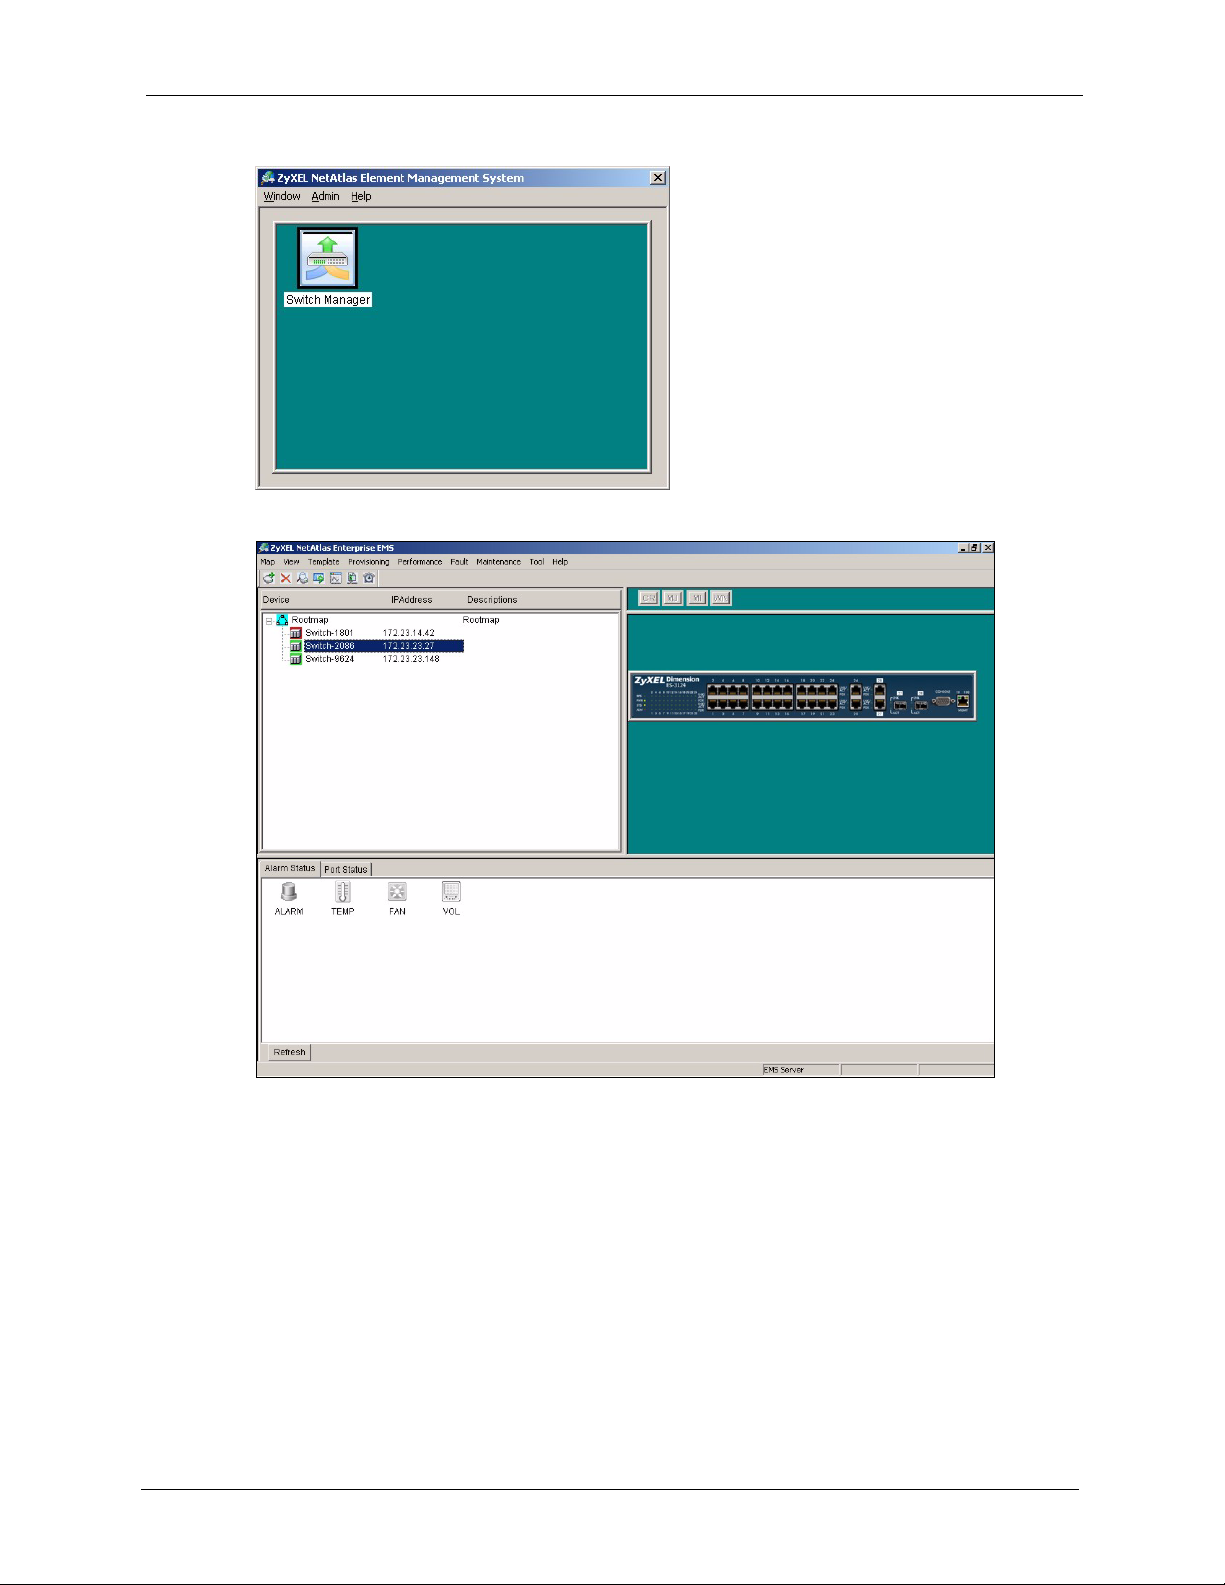
Figure 2 NetAtlas Main Screen
Figure 3 EMS: Main Screen
Chapter 1 Introduction 26

NetAtlas Enterprise Ethernet Switch Manager User’s Guide
27 Chapter 1 Introduction
NetAtlas Enterprise Ethernet Switch Manager User’s Guide
This chapter describes the Switch Manager screens.
2.1 Switch Manager Overview
Use the Switch Manager screens to view EMS and device logs and database management.
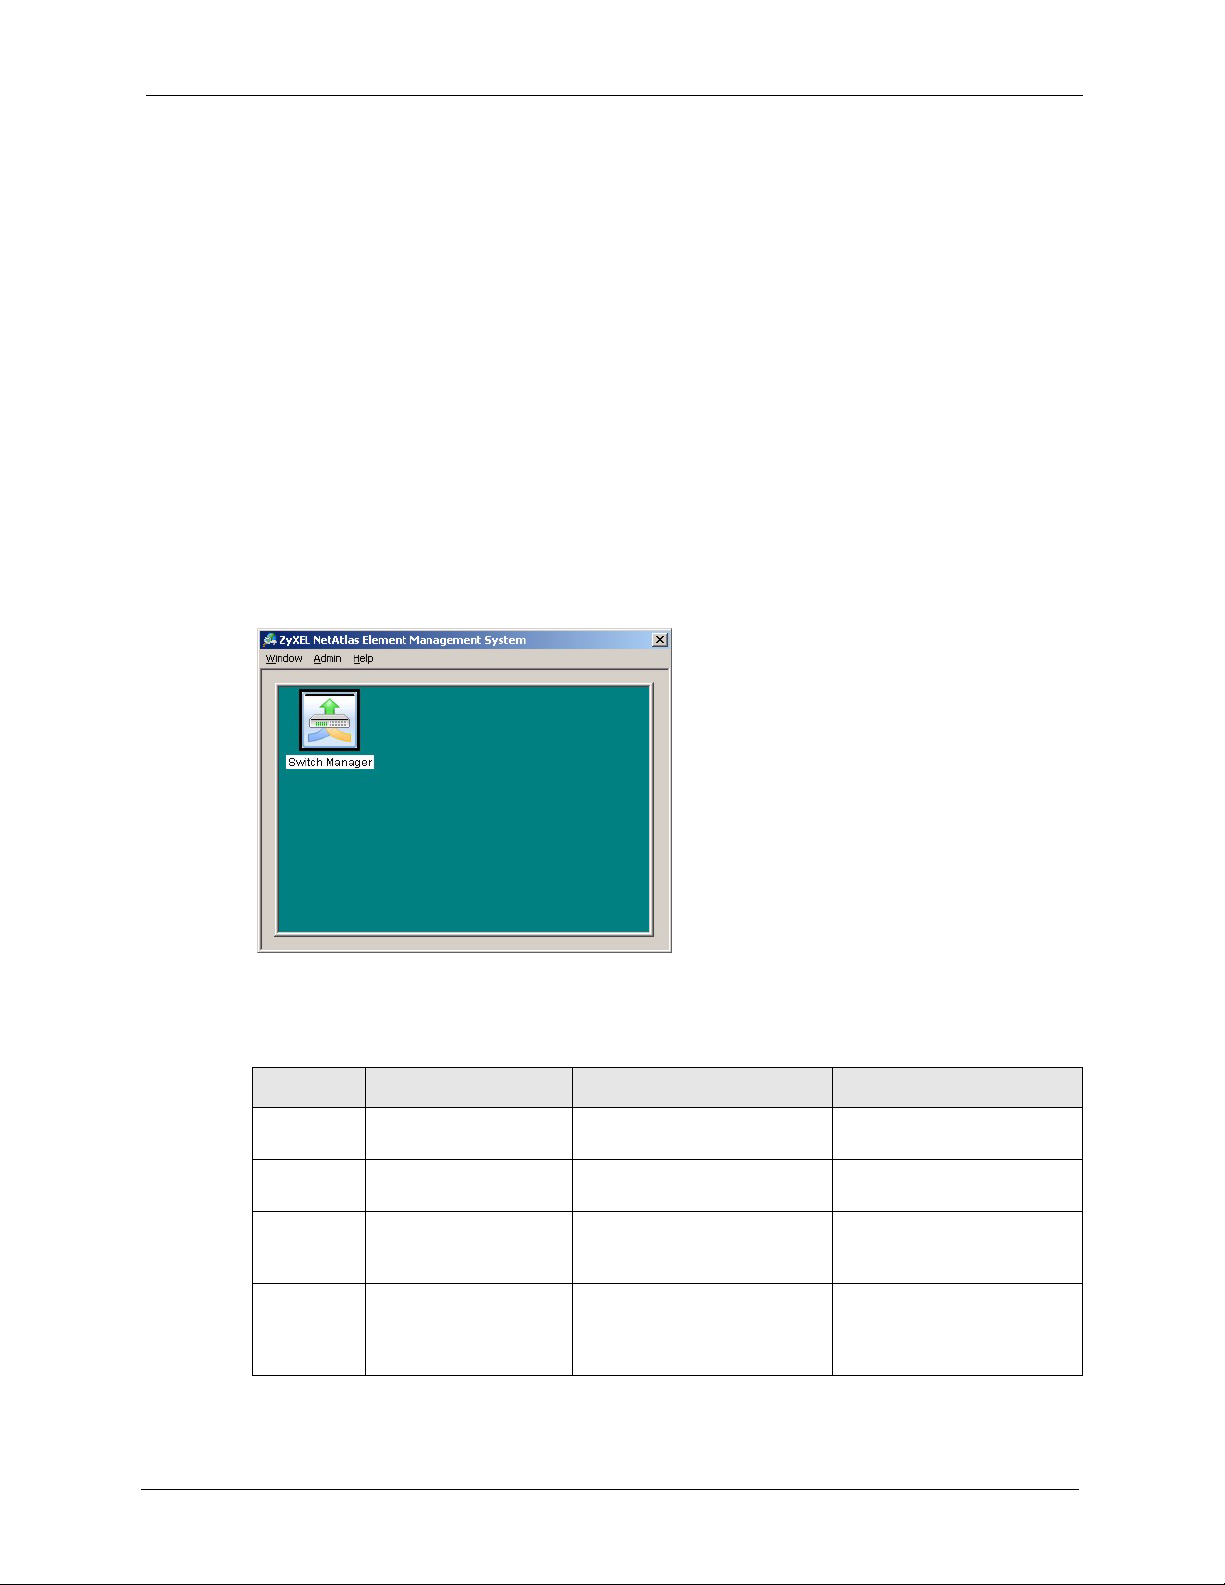
In SNMPc, double-click on a device icon to display the main Switch Manager screen as
shown.
Figure 4 Switch Manager
CHAPTER 2
Switch Manager
The following table describes the options in the switch manager screen.
Table 3 Switch Manager Menus Overview
LABEL MENU SUB-MENU DESCRIPTION
Window Exit Click Exit to close the switch
manager screen.
Admin Access Log Use this screen to display
logs.
Database Management Backup and Restore (EMS DB) Use this screen to backup or
Log Storage Configuration Use this screen to enable
Chapter 2 Switch Manager 28
restore a switch’s
configuration.
logging and specify how
many logs to store in the
database.
NetAtlas Enterprise Ethernet Switch Manager User’s Guide
Table 3 Switch Manager Menus Overview (continued)
LABEL MENU SUB-MENU DESCRIPTION
Help On-line Help Select On-line Help to
2.2 Access Log
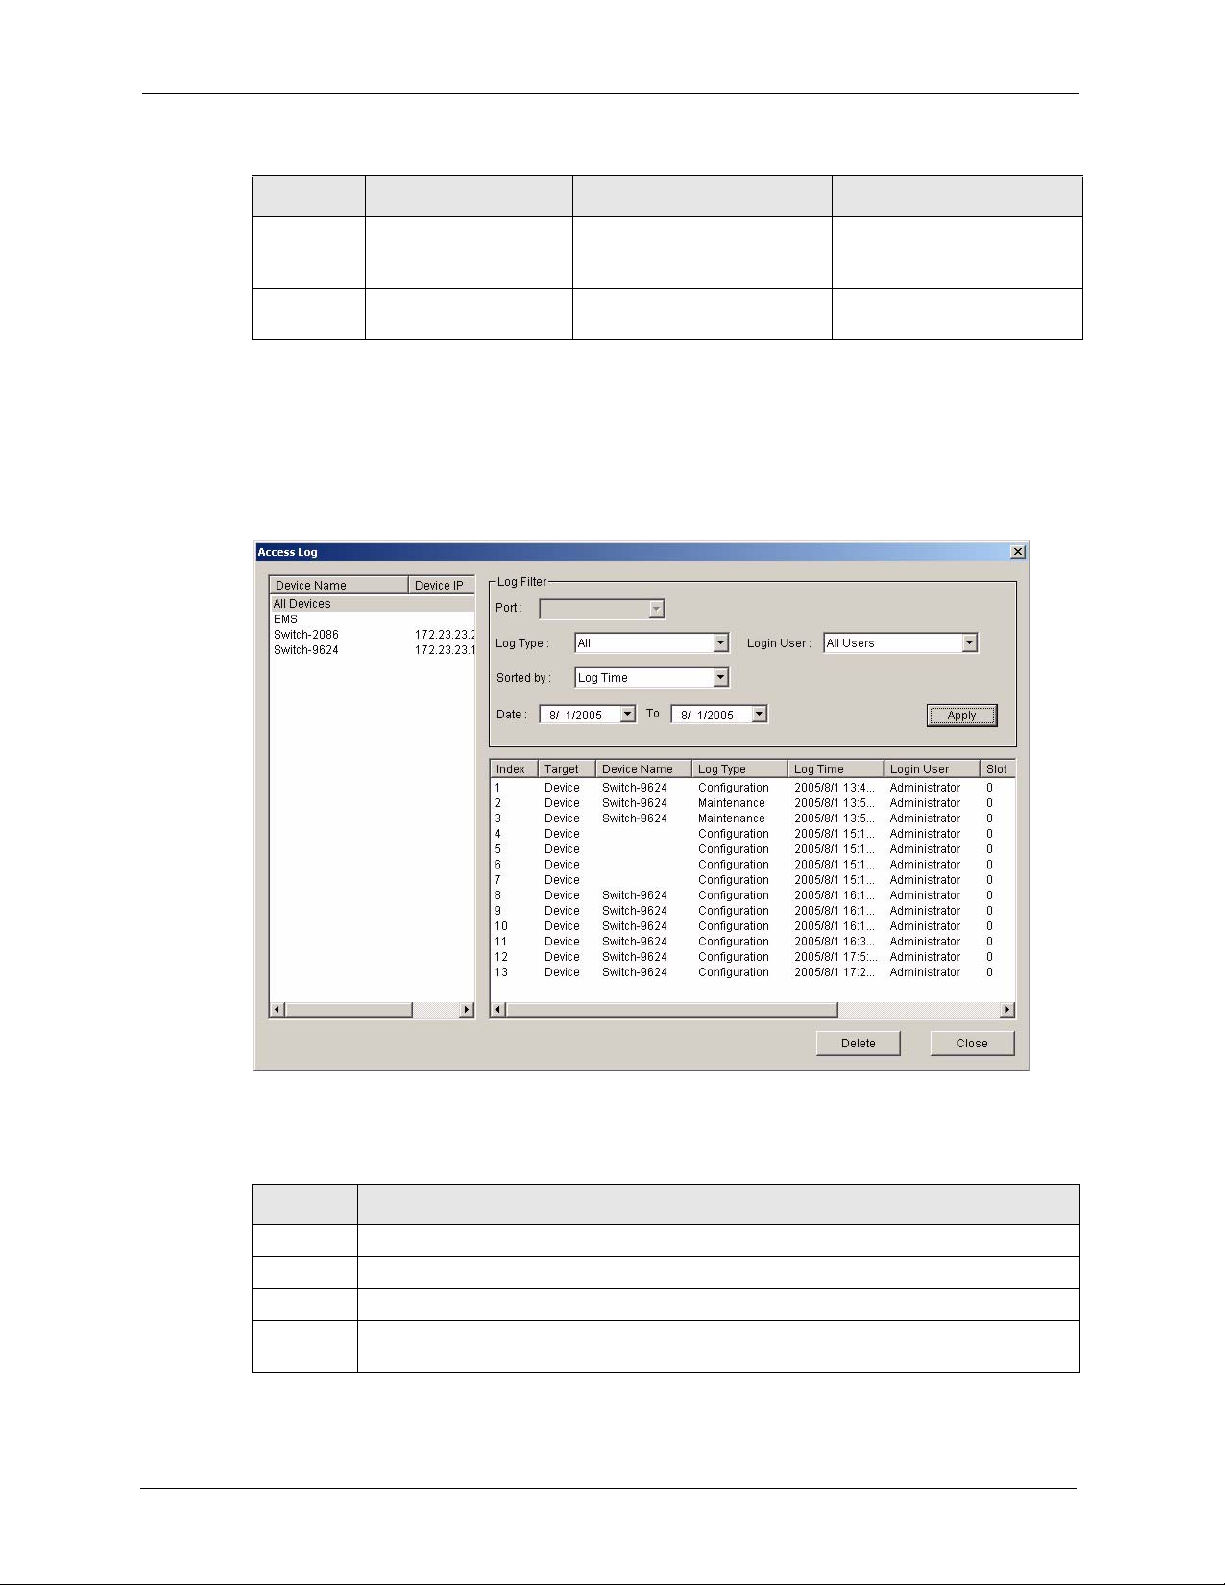
To view access logs, click Admin and then Access Log in the Switch Manager screen.
Figure 5 Switch Manager: Admin: Access Log
Scheduled Backup
Configuration (EMS DB)
Use this screen to specify
when to store logs in the
database.
display an EMS help file.
The following table describes the fields in this screen.
Table 4 Switch Manager: Admin: Access Log
LABEL DESCRIPTION
Log Filter
Port Select a port or All Ports for which you want to view switch login data via the EMS.
Log Type Select the type of logs which you want to view for the selected switch and port(s).
Login User Select All Users to view logs for all access attempts to a switch via the EMS. Select
29 Chapter 2 Switch Manager
Administrator to view only the EMS administrator access attempts.

NetAtlas Enterprise Ethernet Switch Manager User’s Guide
Table 4 Switch Manager: Admin: Access Log (continued)
LABEL DESCRIPTION
Sorted by Select By Device Name to sort the logs displayed in alphabetical order according to the
names of the switch(es). Select Log Time to sort the logs displayed according to the
times received on the switch(es).
Date Select a start date and end date from the list boxes to display logs for that period.
Apply Click Apply to display logs with the criteria set above.
Index This field displays the log number.
Target This field displays a reason for the generated log.
Device
Name
Log Type This field displays the type of log the switch generated.
Log Time This field displays the time a log was generated by a switch.
Login User This field displays the EMS user that logged into the switch
Slot This field is currently not supported.
Port This field displays the selected switch port number on which the log was generated.
Description This field displays further information about the log.
Delete Click Delete to delete a selected log from the list of log entries.
Close Click Close to close this screen.
This field displays name of the switch that generated the log(s).
2.3 Database Management
The EMS-related event and access logs information and various configuration settings are
stored in the database. The database management features enable you to back up all logs and
configurations and restore selected backed up files.
2.3.1 Filename Convention
The EMS follows a pre-defined naming convention for the backup data. The backup data is
stored in plain text format with a “txt” filename extension. The general structure of the
filename is
2.3.2 Database Backup and Restore
Click Admin, Database Management and then Backup/Restore in the switch manager to
display the following screen.
<type>.txt (for example, AccessLog.txt).
Chapter 2 Switch Manager 30

NetAtlas Enterprise Ethernet Switch Manager User’s Guide
Figure 6 Switch Manager: Admin: Database Management: Backup/Restore
The following table describes the fields in this screen.
Table 5 Switch Manager: Admin: Database Management: Backup/Restore
LABEL DESCRIPTION
Directory Specify the location you wish the EMS to restore from or back up to on your computer or
click Browse to locate it.
Backup Select Backup to transfer the database file from the EMS to the computer.
Restore Select Restore to transfer the backed up files from your computer to the EMS.
Apply Click Apply to backup or restore the database files.
Close Click Close to close the screen.
2.3.3 Database Log Storage Configuration
Click Admin, Database Management and then Log Storage Configuration in the switch
manager to display the following screen.
Figure 7 Switch Manager: Admin: Database Management: Log Storage
The following table describes the fields in this screen.
31 Chapter 2 Switch Manager

NetAtlas Enterprise Ethernet Switch Manager User’s Guide
Table 6 Switch Manager: Admin: Database Management: Log Storage
LABEL DESCRIPTION
Storage Configuration Configure the following fields to retain daily records.
Select the first radio button and a number (in thousands) from the drop-down
list box to retain that number of records. All records prior to these records are
cleared every 24 hours.
Or
Select the second radio button and a number (from 7 to 365) in the field
provided. All records up to the start of the period selected are cleared every 24
hours.
Cleared Records
Backup
Backup the cleared
records
Backup Directory Type the path and file name of the record file you wish to back up to your
User info for Windows
Account This read-only field displays the Windows login account user.
Password Enter a password in this field for the administrator Account above.
Apply Click Apply to save changes to the EMS.
Close Click Close to close the screen.
If you do not configure this section, all records (excluding the latest reserved
records) will be cleared after 24 hours and therefore cannot be retrieved later.
Select the check box and type the path and file name or click Browse to locate
the folder you wish to save all records after 24 hours. The records are cleared
but saved in the backup file.
computer in the Backup Directory text box or click Browse to locate it.
2.3.4 Database Scheduled Backup Configuration
Click Admin, Database Management and then Backup and Restore (EMS DB) in the
switch manager to display the following screen.
Figure 8 Switch Manager: Admin: Database Management: Scheduled Backup
The following table describes the fields in this screen.
Chapter 2 Switch Manager 32

NetAtlas Enterprise Ethernet Switch Manager User’s Guide
Table 7 Switch Manager: Admin: Database Management: Scheduled Backup
LABEL DESCRIPTION
Backup Schedule
Frequency Scheduled backups can be performed Daily, Weekly or Monthly. Select a
radio button to schedule database backups starting from the date and time
specified below. The default setting is No Backup.
Starting date Specify the starting date to begin database backup for the selected device(s).
Select a date from the drop-down list box.
Starting time Specify the starting time to begin database backup for the selected device(s).
Backup Directory Type the path to which you wish to back up the database files on your
User info for Windows
Account This read-only field displays the Windows login account user.
Password Enter a password in this field for the administrator Account above.
Apply Click Apply to save changes to the EMS.
Close Click Close to close the screen.
Select a time from the selection box or enter a time (hh:mm:ss AM/PM format).
computer in the Backup Directory text box or click Browse to locate it.
2.4 Accessing the EMS Main Screen
To display the EMS main screen, click on the device icon in the Switch Manager screen.
The EMS polls for all the available switches. Select a device icon to display a graphic of the
switch in the Device Panel. You can only display one switch in the Device Panel at one time.
33 Chapter 2 Switch Manager

Figure 9 EMS: Main Screen
NetAtlas Enterprise Ethernet Switch Manager User’s Guide
Chapter 2 Switch Manager 34

NetAtlas Enterprise Ethernet Switch Manager User’s Guide
35 Chapter 2 Switch Manager

NetAtlas Enterprise Ethernet Switch Manager User’s Guide
CHAPTER 3
EMS Main Window
This chapter describes the EMS main window.
3.1 Introducing the EMS Main Window
After you have accessed the EMS, double-click the switch device icon in the Device List Panel
to display the EMS main screen. The EMS retrieves device information from the switch (using
SNMP protocol).
The EMS main screen varies depending on the selected switch model.
Figure 10 EMS Main Screen Overview
1
3
2
5
The following table describes the elements in the EMS screen.
4
Chapter 3 EMS Main Window 36

NetAtlas Enterprise Ethernet Switch Manager User’s Guide
Table 8 EMS Main Screen Overview
ELEMENT FUNCTION
1 Menu Shortcut Bar Use these buttons to execute common commands quickly. Hold the
cursor over an icon to see a tool tip.
2 Device List Panel View devices in a tree structure. The colors of the device icons indicate
the time status of the represented devices.
3 Alarm Severity Icons These icons indicate the presence of any alarm/event logs. Click on an
active icon to view the Event Log screen.
4 Device Panel This is a graphical device display. Double-click on a switch to display the
5 System Message Panel View the alarm statusa and port status of the selected switch.
a. Not available on all models at the time of writing.
EMS GUI management window for the switch.
3.2 Device Icon Colors
The colors of the device icons (in the Device List Panel) indicate the status of the represented
devices stored in the database. To update the device status, double-click on a device icon. The
following table describes the colors used.
Table 9 Device Icon Colors
COLOR DESCRIPTION
Green The device is working and is responding to polling.
Red There is no response from the device or the device is not turned on.
3.3 System Message Panel Alarm Status
The colors of the alarm icons (in the System Message Panel) indicate the real-time status of
the current selected device. The following table describes the alarm states used.
Table 10 System Message Panel Alarm Status
PANEL ALARMS ALARM OFF ALARM ON
ALARM When this icon is gray out, the
FAN When this icon is gray out, the
device fan, temperature or
voltage alarm is off.
device fans are functioning
properly.
The fan, temperature and
voltage alarms are all on. A
serious hardware problem
exists.
One or more of the device
fans has a problem.
37 Chapter 3 EMS Main Window

NetAtlas Enterprise Ethernet Switch Manager User’s Guide
Table 10 System Message Panel Alarm Status (continued)
PANEL ALARMS ALARM OFF ALARM ON
TEMP When this icon is gray out,
temperatures at all sensor
points in the switch are within
the threshold temperature
range.
VOL When this icon is gray out, the
power supply at all sensor
points in the switch is within
the tolerance range.
If an alarm turns on, click the Port Status tab in the System Message Panel or proceed to
Section 5.1 on page 48 for hardware troubleshooting.
3.4 System Message Panel Port Status
Proceed to Section 5.4 on page 53 for information on the details displayed in this screen.
3.5 Menu Shortcut Buttons
The following is a brief overview of the menu shortcut buttons.
The temperature at a sensor
point in the switch has risen
above or below the threshold
temperature range.
The power supply at a sensor
point in the switch has fallen
out of the tolerance range.
Figure 11 EMS Main Screen Shortcut Bar
Add Submap/
Device
Delete Submap/
Device
Find Object
Refresh Map Port Status
Interface
Performance
Event Log
Chapter 3 EMS Main Window 38

NetAtlas Enterprise Ethernet Switch Manager User’s Guide
3.6 EMS Main Menu Summary
This is a summary of the EMS menus in the main screen. Screens, screen labels and fields vary
depending on your switch model.
Table 11 EMS Menu Summary
MAP VIEW TEMPLATE PROVISIONING PERFORMANCE FAULT MAINTENANCE TO OL HELP
Add
Submap
/Device
Edit
Node
Search
Node
Delete Port
Refresh 802.1d Scheduled NE
Exit Multicast
Hardware
Status
STP
Status
VLAN
Status
Status
Status
VLAN
Te mp l at e
IGMP
Filtering
Profile
Te mp l at e
Multicast
Te mp l at e
IGMP Filtering
Provisioning
Interface Event Log Firmware
Loopback
Te st
Upgrade
Device Reset Web
NE (Network
Element)
Configuration
Backup and
Restore
Load Factory
Default
Config Backup
The following table summarizes these sub-links in the navigation panel.
Table 12 EMS Navigation Panel Sub-link Descriptions
DESCRIPTION LABEL
Telnet About
Access
Ping
MAP Screens
Add Submap/Device This link takes you to a screen where you can add a device or a submap
folder to the EMS Device List Panel.
Edit Node This link takes you to a screen where you can edit device properties.
Search Node This link takes you to a screen where you can search for a device or a
submap folder.
Delete Click this link to delete a submap folder or devices within a folder.
Refresh Click this link to update the screen with the most recently saved settings.
View
Hardware Status This link takes you to a screen where you can view the hardware status of a
device.
STP Status This link takes you to a screen where you can view the Spanning Tree
Protocol (STP) status of a device.
VLAN Status This link takes you to a screen where you can view the VLAN status of a
device.
Port Status This link takes you to a screen where you can view the port status of a
device.
39 Chapter 3 EMS Main Window

NetAtlas Enterprise Ethernet Switch Manager User’s Guide
Table 12 EMS Navigation Panel Sub-link Descriptions (continued)
DESCRIPTION LABEL
802.1d This link takes you to a screen where you can view the MAC addresses (and
types) of devices attached to what ports and VLAN IDs or view the MAC
addresses – IP address resolution table.
Multicast Status This link takes you to a screen where you can view the multicast traffic status
of a device.
Te mp l at e
VLAN Template This link takes you to a screen where you can pre-configure a VLAN
template for upload to multiple devices.
IGMP Filtering
Profile Template
Multicast Template This link takes you to a screen where you can configure a multicast template
Provisioning
IGMP Filtering
Provisioning
Performance
Interface This link takes you to a screen where you can configure interface
Fault Screens
Event Log This link takes you to a screen where you can configure an alarm filter.
Loopback Test This link takes you to a screen where you can perform a loopback test.
Maintenance
Firmware Upgrade This link takes you to a screen where you can perform a device firmware
Device Reset This link takes you to a screen where you can reset a device.
NE (Network
Element)
Configuration
Backup and Restore
Load Factory Default This link takes you to a screen where you can load the factory default
Scheduled NE
Config Backup
Tool Screens
Te ln e t This link takes you to a screen where you can access a device Telnet
Web Access This link takes you to a screen where you can access a device Web
Ping This link takes you to a screen where you can ping a device directly through
This link takes you to screens where you can pre-configure an IGMP filter
template for upload to multiple devices.
for upload to multiple devices.
This link takes you to screens where you can apply IGMP filtering templates.
performance graphs and tables.
upgrade.
This link takes you to a screen where you can backup or restore
configuration files.
settings.
This link takes you to a screen where you can schedule when you want to
backup a device configuration file.
service.
configurator.
the EMS.
Chapter 3 EMS Main Window 40

NetAtlas Enterprise Ethernet Switch Manager User’s Guide
3.7 Common EMS Command Buttons
The following table shows common command buttons found on most EMS screens.
Table 13 Common EMS Command Buttons
LABEL DESCRIPTION
Apply Click Apply to save the changes back to the switch.
OK Click OK to save your changes and close the screen.
Cancel Click Cancel to discard all changes and close the screen.
Close Click Close to close the screen.
3.8 View the Switch
To display a selected switch, double-click the appropriate switch in the Device List Panel or
on the switch icon in the Device Panel. You can only display one switch in the device Panel
window at a time. Refer to the appropriate chapters or sections for the descriptions of each
menu screen.
Figure 12 Switch View
3.9 Switch Information
Follow the steps to display information on a switch.
1 Right-click on the switch icon in the Device List Panel.
2 Click Configuration, System and then System Info. The switch information window
displays as shown next.
3 Choose a switch from the list located on the left-hand side of the screen.
41 Chapter 3 EMS Main Window

NetAtlas Enterprise Ethernet Switch Manager User’s Guide
Figure 13 Configuration: System Configuration: System Info
The following table describes the labels in this screen.
Table 14 Configuration: Switch System Configuration
LABEL DESCRIPTION
Name Enter a descriptive name for identification purposes. If you want to change the
Contact Enter the name (up to 32 characters) of the person in charge of the selected
Location Enter the geographic location (up to 32 characters) of the selected switch.
Serial No. This field displays the serial number of the selected switch.
HW Version This field displays the hardware version of the selected switch.
OS FW Version This field displays the firmware version of the selected switch.
Ethernet Address This field displays the switch Ethernet MAC address in six hexadecimal character
Apply Click Apply to save the changes back to the switch.
Close Click Close to close the screen.
name, enter up to 32 printable characters; spaces are not allowed.
switch.
pair format.
3.10 Configuration Save
You can save the current configuration in the EMS to the selected switch.
Chapter 3 EMS Main Window 42

NetAtlas Enterprise Ethernet Switch Manager User’s Guide
Note: Do NOT turn off the switch during the updating process, as it may corrupt the
firmware and make your switch unusable.
1 To save the current switch configuration, right-click on the switch icon in the Device List
Panel.
2 Click Configuration Save.
3 Choose a switch from the list located in the screen.
Figure 14 Configuration Save
4 Click Apply to save the current configuration. All settings configured on the EMS will be
saved to the selected switch.
5 A screen displays showing the configuration save result. Click Done to close the screen.
Figure 15 Configuration Save: Result
43 Chapter 3 EMS Main Window

NetAtlas Enterprise Ethernet Switch Manager User’s Guide
This chapter describes the Map screens you use to add, edit or delete device mappings in the
EMS.
4.1 Submap and Device Mapping
The EMS mapping displays logical hierarchy for the switch in the EMS. When you first start
the EMS, the default Root Map and an icon for your switch device are created in the Device
List Panel automatically. Both devices and submaps (or folders) can be added below the
rootmap. Devices can also be added to submap folders.
The following figure shows the “Rootmap” folder. “Switch-5425”, “Gs2024” and “ES3124”
are mapped to the “Rootmap” folder.
CHAPTER 4
Map
Figure 16 Submaps and Device Mapping
Note: You cannot create, edit or delete the Rootmap.
4.1.1 Adding a Submap or Device
To add a new submap or a new device, select the Root Map or a submap icon in the Device
List Panel. Click Map and Add Submap/Device to display the following screen.
Chapter 4 Map 44

NetAtlas Enterprise Ethernet Switch Manager User’s Guide
Figure 17 Map: Add Submap/Device
The following table describes the labels in this screen.
Table 15 Map: Add Submap/Device
LABEL DESCRIPTION
Properties Select the Submap or Device radio button to add a new submap or device icon to
the Device List Panel.
If you select Submap, only the Name and Description fields display; all other fields
appear as read-only.
Name Enter a descriptive name (up to 30 characters) for this node for identification
IP Address Enter the IP address of the device.
Password Enter the administrative password (up to 30 characters) you use to log in to the
Description Enter a description (up to 30 characters) about the device.
Get Community Enter the get community, which is the password for the incoming Get- and GetNext-
Set Community Enter the set community, which is the password for incoming Set- requests from the
Trap Community Enter the trap community, which is the password sent with each trap to the SNMP
OK Click OK to save the changes and close the screen.
Cancel Click Cancel to discard the changes and close the screen.
purposes.
switch. This password is used by the EMS administrator for device firmware upload.
requests from the management station.
management station.
manager.
4.1.2 Edit a Node
Select a submap icon in the Device List Panel and then click Map and Edit Node.
45 Chapter 4 Map

NetAtlas Enterprise Ethernet Switch Manager User’s Guide
Figure 18 Map: Edit Node
Refer to Table 15 on page 45 for the field descriptions.
4.1.3 Find an Object
To find or locate a device (or node), click Map and then Find Object.
Figure 19 Map: Find Object
Enter a descriptive text (for example, the node name) in the Find field and click OK to start
the search.
4.1.4 Delete a Submap
To delete a submap, select the submap icon in the Device List Panel and click Map and then
Delete.
Figure 20 Map: Delete Warning
Note: If you delete a submap, all devices under a submap will be removed.
Chapter 4 Map 46

NetAtlas Enterprise Ethernet Switch Manager User’s Guide
4.1.5 Delete a Device
To remove a device from the Device List Panel, select the device icon and click Map and then
Delete.
4.2 Exit
Click Map and then Exit to close the EMS screen.
47 Chapter 4 Map

This chapter describes the hardware status, STP status, VLAN status, port status and 802.1d
status View screens.
5.1 Hardware Status1
View fan speeds, voltage levels and temperatures of a selected switch in the Hardware
Monitor screen.
Click View and then Hardware Status and select a switch from the device list located on the
left-hand side of the screen. The device hardware status displays.
NetAtlas Enterprise Ethernet Switch Manager User’s Guide
CHAPTER 5
View
Note: It may take a few seconds to update the screen.
Figure 21 View: Hardware Status
The following table describes the labels in this screen.
1. This features is not available for the ES-2024A at the time of writing.
Chapter 5 View 48

NetAtlas Enterprise Ethernet Switch Manager User’s Guide
Table 16 Status: Hardware Status
LABEL DESCRIPTION
Fan RPM (RPM) A properly functioning fan is an essential component (along with a sufficiently
ventilated, cool operating environment) in order for the device to stay within the
temperature threshold. Each fan has a sensor that is capable of detecting and
reporting if the fan speed falls below the threshold shown.
Index This field displays the fan number.
Current This field displays this fan’s current speed in Revolutions Per Minute (RPM).
Max This field displays this fan’s maximum speed recorded in Revolutions Per Minute
Min This field displays this fan’s minimum speed recorded in Revolutions Per Minute
Threshold This field displays the minimum speed at which a normal fan should work.
Status NORMAL indicates that this fan is functioning above the minimum speed. ERROR
Voltage (V) The power supply for each voltage has a sensor that is capable of detecting and
Index This field displays the first voltage sensor number.
Current This is the current voltage reading in volts.
Max This field displays the maximum voltage recorded at this sensor in volts.
Min This field displays the minimum voltage recorded at this sensor in volts.
Threshold This field displays the minimum voltage percentage at which the switch should work.
Status NORMAL indicates that the voltage is within an acceptable operating range at this
Temperature The switch has temperature sensors that are capable of detecting and reporting if the
Celsius Select this option to display the temperature in degrees Centigrade.
Fahrenheit Select this option to display the temperature in degrees Fahrenheit.
Index This field displays the temperature sensor number.
Current
Val ue
Max This field displays the maximum temperature recorded at this sensor.
Min This field displays the minimum temperature recorded at this sensor.
Threshold This field displays the upper temperature limit at this sensor.
Status This field displays NORMAL for temperatures below the threshold and ERROR for
Polling The text box displays how often (in seconds) this screen refreshes. You may change
Close Click Close to close the screen.
(RPM).
(RPM).
indicates that this fan is functioning below the minimum speed.
reporting if the voltage falls out of the tolerance range.
point; otherwise ERROR is displayed. ABSENT indicates that there is no power
reading at a sensor(s).
temperature rises above the threshold. You may choose the temperature unit (in
degrees Celsius or or Fahrenheit).
This shows the current temperature at this sensor.
those above.
the refresh interval by typing a new number in the text box and then clicking the
Apply button.
49 Chapter 5 View

NetAtlas Enterprise Ethernet Switch Manager User’s Guide
5.2 Spanning Tree Protocol (STP)
STP detects and breaks network loops and provides backup links between switches, bridges or
routers. It allows a switch to interact with other STP-compliant switches in your network to
ensure that only one route exists between any two stations on the network.
5.2.1 STP Terminology
The root bridge is the base of the spanning tree; it is the bridge with the lowest identifier value
(MAC address).
Path cost is the cost of transmitting a frame onto a LAN through that port. It is assigned
according to the speed of the link to which a port is attached. The slower the media, the higher
the cost - see the next table.
Table 17 STP Path Costs
LINK SPEED RECOMMENDED VALUE RECOMMENDED RANGE ALLOWED RANGE
4Mbps 250 100 to 1000 1 to 65535
10Mbps 100 50 to 600 1 to 65535
16Mbps 62 40 to 400 1 to 65535
100Mbps 19 10 to 60 1 to 65535
1Gbps 4 3 to 10 1 to 65535
10Gbps 2 1 to 5 1to 65535
On each bridge, the root port is the port through which this bridge communicates with the root.
It is the port on this switch with the lowest path cost to the root (the root path cost). If there is
no root port, then this switch has been accepted as the root bridge of the spanning tree
network.
For each LAN segment, a designated bridge is selected. This bridge has the lowest cost to the
root among the bridges connected to the LAN.
5.2.2 How STP Works
After a bridge determines the lowest cost-spanning tree with STP, it enables the root port and
the ports that are the designated ports for connected LANs, and disables all other ports that
participate in STP. Network packets are therefore only forwarded between enabled ports,
eliminating any possible network loops.
STP-aware switches exchange Bridge Protocol Data Units (BPDUs) periodically. When the
bridged LAN topology changes, a new spanning tree is constructed.
Chapter 5 View 50

NetAtlas Enterprise Ethernet Switch Manager User’s Guide
Once a stable network topology has been established, all bridges listen for Hello BPDUs
(Bridge Protocol Data Units) transmitted from the root bridge. If a bridge does not get a Hello
BPDU after a predefined interval (Max Age), the bridge assumes that the link to the root
bridge is down. This bridge then initiates negotiations with other bridges to reconfigure the
network to re-establish a valid network topology.
5.2.3 STP Port States
STP assigns five port states (see next table) to eliminate packet looping. A bridge port is not
allowed to go directly from blocking state to forwarding state so as to eliminate transient
loops.
Table 18 STP Port States
PORT STATE DESCRIPTION
Disabled STP is disabled (default).
Blocking Only configuration and management BPDUs are received and processed.
Listening All BPDUs are received and processed.
Learning All BPDUs are received and processed. Information frames are submitted to the
Forwarding All BPDUs are received and processed. All information frames are received and
learning process but not forwarded.
forwarded.
5.2.4 STP Status
View current STP information in the STP Status screen. Click Status and then STP Status.
Select a switch from the device list located on the left-hand side of the screen. The STP status
displays in the table.
Figure 22 View: STP Status
The following table describes the labels in this screen.
51 Chapter 5 View

NetAtlas Enterprise Ethernet Switch Manager User’s Guide
Table 19 View: STP Status
LABEL DESCRIPTION
STP This field displays Running if STP is activated; otherwise, it displays Down.
Bridge Root refers to the base of the spanning tree (the root bridge).
Bridge ID This is the unique identifier for this bridge, consisting of bridge priority plus MAC
address.
Hello Time
(second)
Max Age (second) This is the maximum time (in seconds) a switch can wait without receiving a
Forwarding Delay
(second)
Cost to Bridge This is the path cost from the root port on this switch to the root switch.
Port ID This is the priority and number of the port on the switch through which this switch
Topology Changed
Times
Time Since Last
Change
Polling The text box displays how often (in seconds) this screen refreshes. You may
Close Click Close to close the screen.
This is the time interval (in seconds) at which the root device transmits a
configuration message. The root bridge determines Hello Time, Max Age and
Forwarding Delay
configuration message before attempting to reconfigure.
This is the time (in seconds) the root switch will wait before changing states (that
is, listening to learning to forwarding).
must communicate with the root of the spanning tree.
This is the number of times the spanning tree has been reconfigured.
This is the time since the spanning tree was last reconfigured.
change the refresh interval by typing a new number in the text box and then
clicking the Apply button.
5.3 VLAN Status
Follow the steps below to view the VLAN status of a switch.
1 Click View and then VLAN Status.
2 Choose a switch from the list located on the left-hand side of the screen.
Chapter 5 View 52

NetAtlas Enterprise Ethernet Switch Manager User’s Guide
Figure 23 View: VLAN Status
The following table describes the labels in this screen.
Table 20 View: VLAN Status
LABEL DESCRIPTION
VLAN ID This field displays the identification number of the VLAN.
Name This field displays a unique number for identification purposes.
Elapsed Time This field displays the time since the VLAN was created.
Status This field displays Active if the VLAN is active and will remain so after the next reset
Port List This table displays all available ports that are participating in a VLAN. A tagged port is
Polling The text box displays how often (in seconds) this screen refreshes. You may change
Close Click Close to close the screen.
5.4 Port Status
of the device. This field displays GVRP if the VLAN is active and will remain so until
removed by GVRP. This field is other if the VLAN is active, but is not permanent or
created by GVRP.
marked T while an untagged port is marked U.
the refresh interval by typing a new number in the text box and then clicking the Apply
button.
Follow the steps below to view the port status of a switch.
1 Click View and then Port Status to display the following screen.
2 To view the port status of a switch choose a switch from the list located on the left-hand
side of the screen.
53 Chapter 5 View

Figure 24 View: Port Status
NetAtlas Enterprise Ethernet Switch Manager User’s Guide
The following table describes the labels in this screen.
Table 21 View: Port Status
LABEL DESCRIPTION
Port This identifies the Ethernet port.
Link Speed This field displays the speed (either 10M for 10Mbps, 100M for 100Mbps or 1000M
Stat e This field displays the STP state of the port. See the Spanning Tree Protocol
LACP This field displays whether LACP is activated.
PD This field displays the power device (PD) module status on the switch. If N/A is
TxPkts This field shows the number of transmitted frames on this port.
RxPkts This field shows the number of received frames on this port.
Errors This field shows the number of received errors on this port.
Polling The text box displays how often (in seconds) this screen refreshes. You may
Close Click Close to close the screen.
for 1000Mbps).
chapter for details on STP port states.
displayed, the switch does not have a PD.
This field displays On if the switch has a PD and it is in use.
This field displays Off if the switch has a PD, but it is not in use.
change the refresh interval by typing a new number in the text box and then clicking
the Apply button.
Chapter 5 View 54

NetAtlas Enterprise Ethernet Switch Manager User’s Guide
5.5 802.1D
Use the following screens to view a table of MAC address entries or to view a table of IP
address mappings.
5.5.1 802.1D: MAC Table
The MAC table shows how frames are forwarded or filtered across the switch’s ports. It shows
what device MAC address, belonging to what VLAN group (if any) is forwarded to which
port(s) and whether the MAC address is dynamic (learned by the switch) or static (manually
entered in Static MAC Forwarding).
The switch uses the Filtering Database to determine how to forward frames. See the following
figure.
1 The switch examines a received frame and learns the port on which this source MAC
address came.
2 The switch checks to see if the frame's destination MAC address matches a source MAC
address already learned in the Filtering Database.
• If the switch has already learned the port for this MAC address, then it forwards
the frame to that port.
• If the switch has not already learned the port for this MAC address, then the frame
is flooded to all ports. Too much port flooding leads to network congestion.
• If the switch has already learned the port for this MAC address, but the destination
port is the same as the port it came in on, then it filters the frame.
Figure 25 MAC Table Flowchart
5.5.2 View the MAC Table
Follow the steps below to view the MAC table.
55 Chapter 5 View

NetAtlas Enterprise Ethernet Switch Manager User’s Guide
1 Click View and then 802.1d.
2 To view the MAC table of a switch choose a switch from the list located on the left-hand
side of the screen and click the MAC Table tab.
Figure 26 View: 802.1d: MAC Table
The following table describes the labels in this screen.
Table 22 View: 802.1d: MAC Table
LABEL DESCRIPTION
Sort by Click one of the following buttons to display and arrange the data according to that
button type. The information is then displayed in the summary table below.
MAC Click this button to display and arrange the data according to MAC address.
VID Click this button to display and arrange the data according to VLAN group.
Port Click this button to display and arrange the data according to port number.
Index This is the incoming frame index number.
MAC Address This is the MAC address of the device from which this incoming frame came.
VID This is the VLAN group to which this frame belongs.
Port This is the port from which the above MAC address was learned.
Type This shows whether the MAC address is dynamic (learned by the switch) or static
(manually entered in the Static MAC Forwarding screen).
Polling The text box displays how often (in seconds) this screen refreshes. You may
Close Click Close to close the screen.
change the refresh interval by typing a new number in the text box and then
clicking the Apply button.
Chapter 5 View 56

NetAtlas Enterprise Ethernet Switch Manager User’s Guide
5.5.3 802.1D: ARP Table
Address Resolution Protocol (ARP) is a protocol for mapping an Internet Protocol address (IP
address) to a physical machine address, also known as a Media Access Control or MAC
address, on the local area network.
An IP (version 4) address is 32 bits long. In an Ethernet LAN, MAC addresses are 48 bits
long. The ARP Table maintains an association between each MAC address and its
corresponding IP address.
5.5.4 How ARP Works
When an incoming packet destined for a host device on a local area network arrives at the
switch, the switch's ARP program looks in the ARP table and, if it finds the address, sends it to
the device.
If no entry is found for the IP address, ARP broadcasts the request to all the devices on the
LAN. The switch fills in its own MAC and IP address in the sender address fields, and puts the
known IP address of the target in the target IP address field. In addition, the switch puts all
ones in the target MAC field (FF.FF.FF.FF.FF.FF is the Ethernet broadcast address). The
replying device (which is either the IP address of the device being sought or the router that
knows the way) replaces the broadcast address with the target's MAC address, swaps the
sender and target pairs, and unicasts the answer directly back to the requesting machine. ARP
updates the ARP Table for future reference and then sends the packet to the MAC address that
replied.
5.5.5 View the ARP Table
Follow the steps below to view the ARP table.
1 Click View and then 802.1d.
2 To view the ARP table of a switch choose a switch from the list located on the left-hand
side of the screen and click the ARP Table tab.
57 Chapter 5 View

NetAtlas Enterprise Ethernet Switch Manager User’s Guide
Figure 27 View: 802.1d: ARP Table
The following table describes the labels in this screen.
Table 23 View: 802.1d: ARP Table
LABEL DESCRIPTION
Index This is the ARP table entry number.
IP Address This is the learned IP address of a device connected to a switch port with
MAC Address This is the MAC address of the device with corresponding IP address above.
Type This shows whether the MAC address is dynamic (learned by the switch) or static
Polling The text box displays how often (in seconds) this screen refreshes. You may change
Close Click Close to close the screen.
corresponding MAC address below.
(manually entered in the Static MAC Forwarding screen).
the refresh interval by typing a new number in the text box and then clicking the Apply
button.
5.6 Multicast Status
View the IGMP multicast group membership information in the Multicast Status screen.
Click View and Multicast Status to display the screen as shown. Select a switch model in the
device list to display the multicast group membership information.
Chapter 5 View 58

NetAtlas Enterprise Ethernet Switch Manager User’s Guide
Figure 28 View: Multicast Status
The following table describes the labels in this screen.
Table 24 View: Multicast Status
LABEL DESCRIPTION
Index This field displays the index number.
VID This field displays the multicast VLAN ID.
Port This field displays the port number(s) that belongs to the multicast group.
Multicast Group This field displays the multicast group address.
59 Chapter 5 View

This chapter describes how to configure VLAN, IGMP filtering and multicast templates.
6.1 Template Overview
A template is a pre-configured set of configuration settings. Templates allow you to configure
device VLANs efficiently. The template can then be uploaded to one or more devices thus
removing the need to configure the VLAN settings for each device. See the VLAN
Configuration chapter for more information on the template upload.
6.2 VLAN Template
NetAtlas Enterprise Ethernet Switch Manager User’s Guide
CHAPTER 6
Template
Refer to Section 15.1 on page 128 for more background information on VLAN.
Click Templa te and then click VLAN to display the screen as shown. Use this screen to
configure, delete or view a VLAN template.
Figure 29 Template: VLAN
Chapter 6 Template 60

NetAtlas Enterprise Ethernet Switch Manager User’s Guide
The following table describes the labels in this screen.
Table 25 Template: VLAN
LABEL DESCRIPTION
Device Type Select a device from the drop-down list box to view the device’s VLAN configuration.
VLAN Identity
VLAN ID Enter a unique number to identify the VLAN.
VLAN Name Enter a descriptive name for identification purposes.
Egress Ports A port that is in the egress list in a VLAN. Only select this if the subscriber's DSL
modem or router supports IEEE 802.1Q VLAN.
Select the ports which you want to be egress ports from the list provided.
Forbidden Ports A port that is blocked from joining a VLAN group. No frames are transmitted through
this port.
A forbidden port cannot be an egress port and cannot add tags to outgoing traffic.
Select the ports which you want to be forbidden ports from the list provided.
Untag A port that does not tag all outgoing frames transmitted.
An egress port can be untagged.
Select the ports which you want to be untagged ports from the list provided.
New Click New to create a new VLAN. You must enter a VLAN ID and a VLAN Name to
create a new VLAN. The new VLAN and name is displayed in the left-hand column in
this screen.
Delete Click on a VLAN in the left-hand column of this screen and then click the Delete
button to remove it from the VLAN template.
Modify Click on a VLAN in the left-hand column of this screen. Change the VLAN Name or
change the configuration of the egress, forbidden and untagged ports. Click the
Modify button to save the changes to the switch.
If you want to change the VLAN ID of a VLAN configuration, you can only delete the
VLAN configuration or create a new VLAN configuration using a different VLAN ID.
Port List Click on a port in the Egress Ports list to add the selected port to the port list. If a
Close Click Close to close the screen.
port is not selected from any of the three port lists, then it is a normal tagged port.
This fields displays all available ports that are participating in a VLAN. A tagged port
is marked T while an untagged port is marked U.
6.3 IGMP Filter Template
Templates (also know as profiles) allow you to configure device IGMP filter settings
efficiently. The template can then be uploaded to one or more devices thus removing the need
to configure the IGMP filter settings for each device.
With the IGMP filter feature, you can limit the number of IGMP groups a subscriber on a port
can join. This allows you to control the distribution of multicast services (such as content
information distribution) based on service plans and types of subscription.
You can set the device to filter the multicast group join reports on a per-port basis by
configuring an IGMP filtering template and associating the profile to a port.
61 Chapter 6 Template

NetAtlas Enterprise Ethernet Switch Manager User’s Guide
IGMP filter templates allow you to control access to IGMP multicast groups. This allows you
to have a service available to a specific IGMP multicast group. You can configure an IGMP
filter template for an IGMP multicast group that has access to a service (like a SIP server for
example).
6.3.1 IP Multicast Addresses
In IPv4, a multicast address allows a device to send packets to a specific group of hosts
(multicast group) in a different subnetwork. A multicast IP address represents a traffic
receiving group, not individual receiving devices. IP addresses in the Class D range (224.0.0.0
to 239.255.255.255) are used for IP multicasting. Certain IP multicast numbers are reserved by
IANA for special purposes (see the IANA web site for more information).
6.3.2 Configuring an IGMP Filter Template
Click Templa te and then click IGMP Filtering Template to display the screen as shown.
Figure 30 Template: IGMP Filter
The following table describes the labels in this screen.
Table 26 Template: IGMP Filter
LABEL DESCRIPTION
No. This field displays the index number.
IGMP Filter
Name
New/Add Click New/Add to create an IGMP filter profile.
Delete Click Delete to remove one or more selected IGMP filter profiles.
Chapter 6 Template 62
This name identifies the IGMP filter profile.

NetAtlas Enterprise Ethernet Switch Manager User’s Guide
Table 26 Template: IGMP Filter (continued)
LABEL DESCRIPTION
Modify Click Modify to edit a selected IGMP filter profile.
IGMP Filter
Parameters
Index This is the number of the IGMP filter profile.
Star t IP This field displays the starting multicast IP address for a range of multicast IP addresses
End IP This field displays the ending multicast IP address for a range of IP addresses to which
OK Click OK to save your changes.
This table displays the settings of the selected IGMP filter above.
to which you want this IGMP filter profile to allow access.
you want this IGMP filter profile to allow access.
6.3.3 New IGMP Filter Template Screen
Click New/Add in the IGMP Filtering Template screen to display the screen as shown.
Figure 31 Template: New IGMP Filter
The following table describes the labels in this screen.
63 Chapter 6 Template

NetAtlas Enterprise Ethernet Switch Manager User’s Guide
Table 27 Template: New IGMP Filter
LABEL DESCRIPTION
No. This field displays the index number.
IGMP Filter Name Type a name (up to 31 printable characters) to identify the IGMP filter profile.
New/Add Click New/Add to create a new IGMP filter template.
Delete Click Delete to remove the selected IGMP filter template.
Modify Click Modify to change the settings of the selected IGMP filter template.
Start Address Enter the starting multicast IP address for a range of multicast IP addresses to
which you want this IGMP filter profile to allow access.
End Address Enter the ending multicast IP address for a range of IP addresses to which you
want this IGMP filter profile to allow access.
If you want to add a single multicast IP address, enter it in both the Start IP and
End IP fields.
Index This is the number of the IGMP filter profile. Double-click a profile’s index number
to edit the profile.
Start Address This field displays the starting multicast IP address for a range of multicast IP
addresses to which you want this IGMP filter profile to allow access.
End Address This field displays the ending multicast IP address for a range of IP addresses to
Close Click Close to close this screen.
which you want this IGMP filter profile to allow access.
6.4 Static Multicast Group Template
Use the static multicast filter to allow incoming frames based on multicast MAC address(es)
that you specify. This feature can be used in conjunction with IGMP snooping to allow
multicast MAC address(es) that are not learned by IGMP snooping. Use the static multicast
filter to pass routing protocols, such as RIP and OSPF.
A static multicast group template allows you to configure multicast filters efficiently. The
template can then be uploaded to one or more devices thus removing the need to configure the
static multicast filter settings for each device.
Traditionally, IP packets are transmitted in one of either two ways - Unicast (1 sender to 1
recipient) or Broadcast (1 sender to everybody on the network). Multicast delivers IP packets
to just a group of hosts on the network.
IGMP (Internet Group Multicast Protocol) is a network-layer protocol used to establish
membership in a multicast group - it is not used to carry user data. Refer to RFC 1112 and RFC
2236 for information on IGMP versions 1 and 2 respectively.
You can set the switch to forward multicast data to specific port(s). This is essential for
sending multicast traffic to hosts that cannot report their membership with IGMP.
Chapter 6 Template 64

NetAtlas Enterprise Ethernet Switch Manager User’s Guide
6.4.1 Multicast MAC Address
All Ethernet devices must have a unique MAC address to communicate with one another.
Device such as routers and switches on the LAN keeps a table of MAC-IP address mappings.
When a packet is received, the destination IP address is looked up in the address mapping table
and the packet is forwarded to the intended Ethernet device. IP multicast packets are in the
Class D group addresses, thus an IP multicast address does not correspond to a unique
Ethernet device.
The IANA has reserved a range of address (01:00:5e:00:00:00 to 01:00:5e:7f:ff:ff in
hexadecimal notation) for multicasting. This range gives 23 usable bits. The IP-MAC
multicast address mapping is done by copying the lower-order 23-bit of a Class D address to
the lower-order 23-bit of the MAC multicast address.
The following figure shows an example.
Figure 32 Multicast MAC-IP Address Mapping Example
Since 32 Class D addresses are mapped to the same multicast MAC address, filtering (by
checking the destination IP address) is recommended on the Ethernet devices to reduce
excessive multicast packets.
6.4.2 Static Multicast Group Template Screen
Click Templa te and then click Static Multicast Group Template to display the screen as
shown.
65 Chapter 6 Template

Figure 33 Template: Multicast
NetAtlas Enterprise Ethernet Switch Manager User’s Guide
The following table describes the labels in this screen.
Table 28 Template: Multicast
LABEL DESCRIPTION
Device Type Select a device from the drop-down list box to view the device’s VLAN configuration.
Te mp l at e
No. This field displays the index number.
Multicast Name This field displays the descriptive name for the multicast template.
New Click New to create a new multicast template.
Modify Click Modify to change the settings of the selected multicast template.
Delete Click Delete to remove the selected multicast template.
Port List
Port This field displays the port number.
Immed. Leave This field displays True when the switch is set to remove this port from the multicast
tree when an IGMP version 2 leave message is received on this port.
This field displays False when the feature is disabled.
Group Limit This field shows whether the switch limit the number of multicast groups this port is
allowed to join or not.
Once a port is registered in the specified number of multicast groups, any new IGMP
join report frame(s) is dropped on this port.
Max. Group
Number
This field displays the number of multicast groups this port is allowed to join.
Chapter 6 Template 66

NetAtlas Enterprise Ethernet Switch Manager User’s Guide
Table 28 Template: Multicast (continued)
LABEL DESCRIPTION
IGMP Filtering This field displays the name of the IGMP filtering profile to use for this port.
Close Click Close to close this screen.
6.4.3 New Multicast Template Screen
To create a new multicast template, click New in the Multicast Te mp late screen. A screen
displays as shown.
Figure 34 Template: New Multicast
The following table describes the labels in this screen.
Table 29 Template: New Multicast
LABEL DESCRIPTION
Profile Name Enter a descriptive name for the new multicast template.
Port This field displays the port number.
Immed. Leave Specify whether the switch is to remove this port from the multicast tree when an
IGMP version 2 leave message is received on this port.
Select Tru e from the drop-down list box to activate the immediate leave feature.
Select False to disable this feature.
Group Limit Select True to limit the number of multicast groups this port is allowed to join. Once a
port is registered in the specified number of multicast groups, any new IGMP join
report frame(s) is dropped on this port.
Select False to disable this feature.
Max. Group
Number
IGMP Filter Select the name of the IGMP filtering profile to use for this port.
67 Chapter 6 Template
Enter a number to limit the number of multicast groups this port is allowed to join.
Once a port is registered in the specified number of multicast groups, any new IGMP
join report frame(s) is dropped on this port.

NetAtlas Enterprise Ethernet Switch Manager User’s Guide
Table 29 Template: New Multicast (continued)
LABEL DESCRIPTION
OK Click OK to save the settings and close this screen.
Cancel Click Cancel to discard all changes and close this screen.
Chapter 6 Template 68

NetAtlas Enterprise Ethernet Switch Manager User’s Guide
69 Chapter 6 Template

This chapter shows you how to use the Provisioning screens to apply templates.
7.1 Provisioning Overview
After you have created an IGMP filter profile (or template) in the Template screens, you can
use the Provisioning screens to apply or delete IGMP filter profiles to or from a device.
Note: You must first create IGMP filtering templates before you can apply them
using the Provisioning screen. Refer to the chapter on creating templates
for more information.
NetAtlas Enterprise Ethernet Switch Manager User’s Guide
CHAPTER 7
Provisioning
7.2 Applying an IGMP Filter Profile
Follow the steps below to apply an IGMP filter to a device.
1 Click Provisioning and IGMP Filter Provisioning to display the screen as shown.
2 Select Apply IGMP Filters under Action.
3 Select a profile you want to use on the left and click Add. You can view the profile
settings by clicking View IGMP Filter. Refer to the chapter on IGMP filter template
settings for field descriptions.
Chapter 7 Provisioning 70

NetAtlas Enterprise Ethernet Switch Manager User’s Guide
Figure 35 Provisioning: IGMP Filter
4 Click Apply To Devices to apply the selected IGMP filer profile(s).
5 A screen displays as shown. Select the device(s) to which you want to apply the IGMP
filter(s). To select more than one device, press [SHIFT] or [CTRL] and select at the same
time.
Figure 36 Provisioning: IGMP Filter: Apply to Devices
6 Click Apply to copy the IGMP filter profile settings to the selected device(s).
7 A screen displays showing the profile copy status. Click OK to close this screen.
71 Chapter 7 Provisioning

NetAtlas Enterprise Ethernet Switch Manager User’s Guide
Figure 37 Provisioning: IGMP Filter: Apply to Devices: Successful
7.3 Removing an IGMP Filter Profile
Follow the steps below to remove an IGMP filter from a device.
1 Click Provisioning and IGMP Filter Provision to display the screen as shown.
2 Select Remove IGMP Filters under Action.
3 Select a profile you want to remove and click Add. You can view the profile settings by
clicking View IGMP Filter. Refer to the chapter on IGMP filter template settings for
field
Figure 38 Provisioning: IGMP Filter: Remove From Devices
4 Click Apply To Devices.
5 A screen displays as shown. Select the device(s) from which you want to remove the
IGMP filter(s). To select more than one device, press [SHIFT] or [CTRL] and select at
the same time.
Chapter 7 Provisioning 72

NetAtlas Enterprise Ethernet Switch Manager User’s Guide
Figure 39 Provisioning: IGMP Filter: Remove From Devices: Select Device
6 Click OK to remove the IGMP filter profile settings from the selected device(s).
7 A Result screen displays showing the profile removal status. Click Close to close this
screen.
Figure 40 Provisioning: IGMP Filter: Remove From Devices: Successful
73 Chapter 7 Provisioning
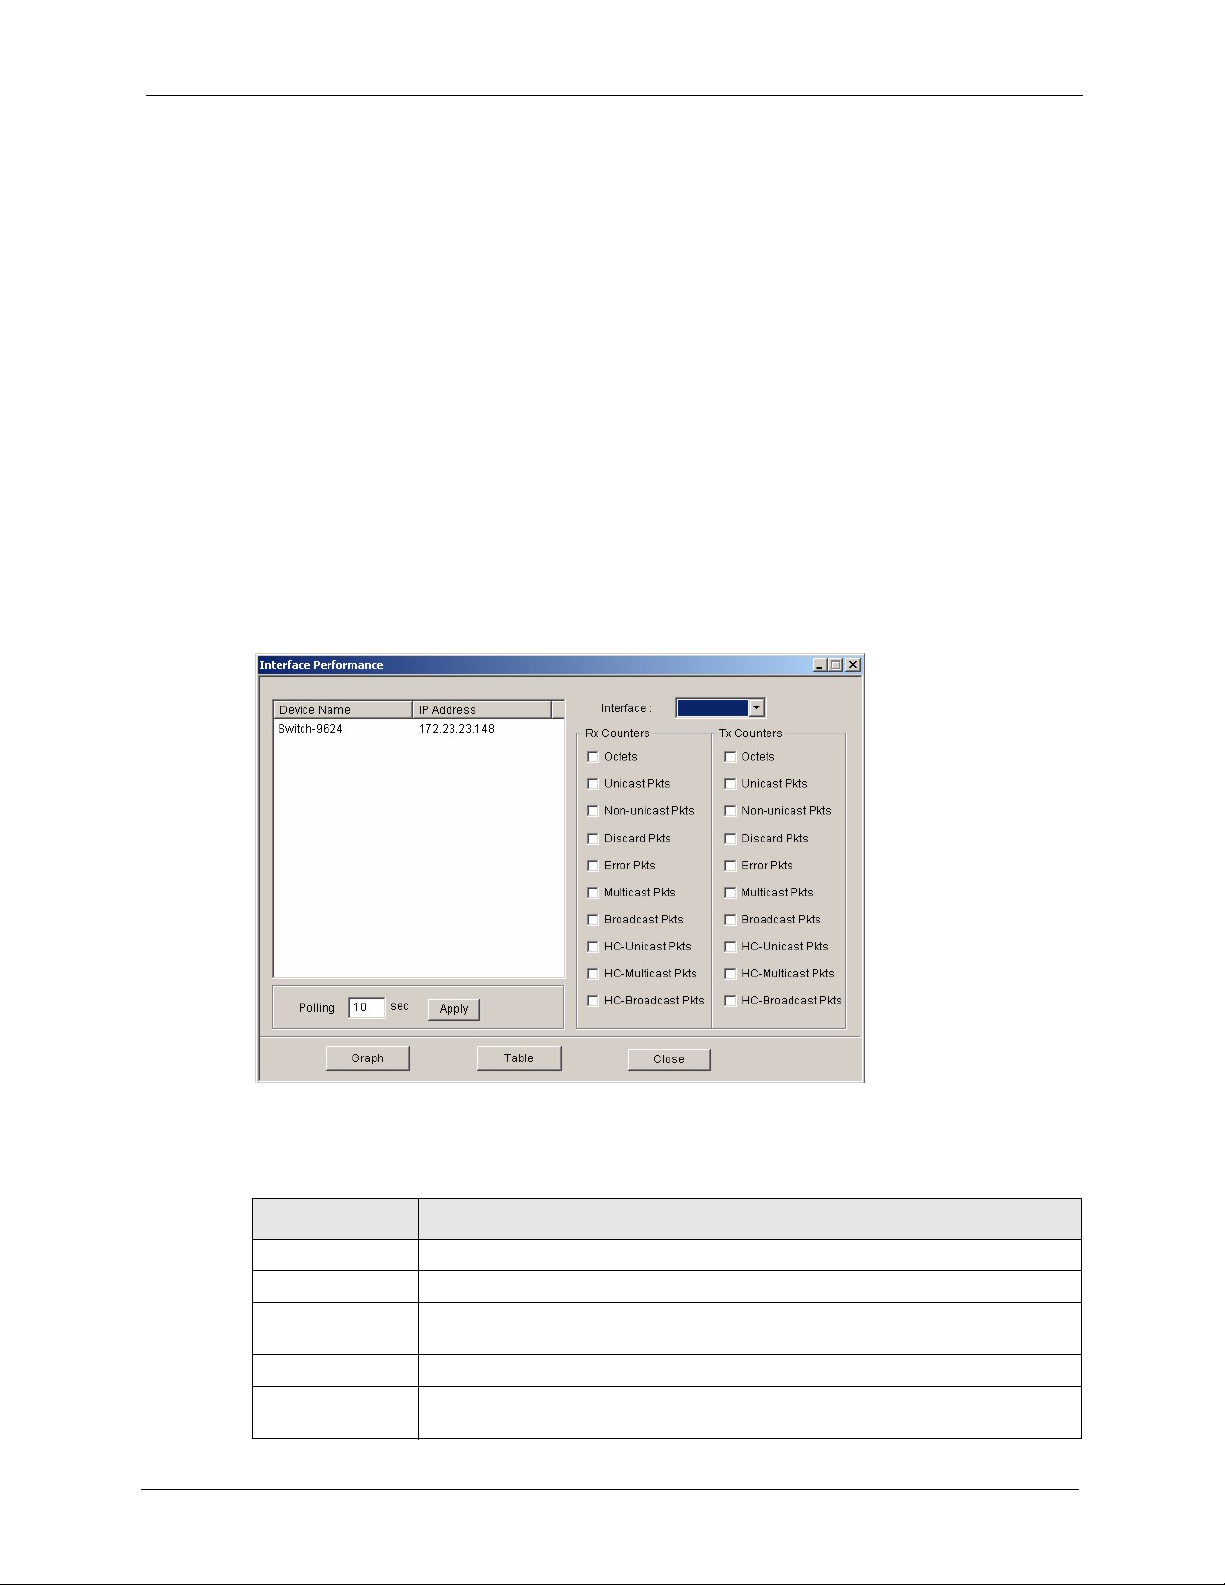
This chapter describes the interface performance screen, graph setup and table setup. View
Ethernet history statistics for your switch network.
8.1 Interface Performance
This section shows you how to configure what you want to display in a performance table or
graph.
Click Performance and then Interface in the EMS main menu.
Figure 41 Performance: Interface
NetAtlas Enterprise Ethernet Switch Manager User’s Guide
CHAPTER 8
Performance
The following table describes the labels in this screen.
Table 30 Performance: Interface
LABEL DESCRIPTION
Interface Select an interface (or port) from the drop-down list box.
Rx Counters The following fields display the types of packet counters received on this interface.
Tx Counters This following fields display the types of packet counters transmitted on this
interface.
Octets Select this option to show the total number of octets received or transmitted.
Unicast Pkts Select this option to show the total number of good unicast packets received or
transmitted that were dropped.
Chapter 8 Performance 74

NetAtlas Enterprise Ethernet Switch Manager User’s Guide
Table 30 Performance: Interface (continued)
LABEL DESCRIPTION
Non-unicast Pkts Select this option to show the total number of good non-unicast packets received
or transmitted that were dropped.
Discard Pkts Select this option to show the total number of packets received or transmitted that
were dropped.
Error Pkts Select this option to show the total number of error packets received or
transmitted.
Multicast Pkts Select this option to show the total number of good multicast packets received or
transmitted.
Broadcast Pkts Select this option to show the total number of good broadcast packets received or
HC-Unicast Pkts Select this option to show the number of unicast packets (High Capacity (HC) 64 ~
HC-Multicast Pkts Select this option to show the number of multicast packets (High Capacity (HC) 64
HC-Broadcast Pkts Select this option to show the number of broadcast packets (High Capacity (HC)
Graph Click the Graph button to create a graph based on the above selections.
Table Click the Tab le button to create a table based on the above selections.
Close Click Close to close the screen.
transmitted.
1518 octets long) dropped because they either had a bad Frame Check Sequence
(FCS) or non-integer number of octets (alignment error).
~ 1518 octets long) dropped because they either had a bad Frame Check
Sequence (FCS) or non-integer number of octets (alignment error).
64 ~ 1518 octets long) dropped because they either had a bad Frame Check
Sequence (FCS) or non-integer number of octets (alignment error).
8.2 Table Menu Bar Icons
The following figure displays the table menu bar icons. These icons are common to all screens
that display information in tabular format.
Figure 42 Table Menu Bar Icons
Edit Short Search Edit SNMPc
Controls Names Entry Help
Pause Switch Show Save to Poll
Polling Axis Graph File Interval
75 Chapter 8 Performance

8.2.1 Editing a Table Entry
Note: You can edit a table entry in all screens that display information in tabular
format.
In any tabulated screen display, click the Edit icon in the menu bar icon to display the
Edit Table Entry screen and edit any field in a table. There is a set of variable names, value
and set button controls that operate on the fields of the selected table. There is also a set of
function control buttons on the right. For tables that have more than ten entries, the Edit Table
Entry screen supports multiple pages.
Figure 43 Edit Table Entry
Variable Name Variable Values Variable Set Button Previous and Next Page Buttons
NetAtlas Enterprise Ethernet Switch Manager User’s Guide
Expand
First
Get
Next
Stop
Set All
Done
Help
The following table describes the labels in this screen.
Table 31 Edit Table Entry
COMMAND DESCRIPTION
Variable Names The first vertical column contains the variable names; these are the names of fields
in the selected table. These names are set by SNMPc and cannot be changed.
Some tables have variable names with an asterisk to the right of the name. These
variables are used as indices into the table. All index variables must be specified to
perform a Set operation.
Var iab le Valu es The second vertical column contains the variable values in pull down list boxes. You
Variable Set
Button
can change the value by typing into the pull down edit box. If the variable has integer
aliases defined in the MIB, you can select an alias by clicking on the down arrow and
selecting an item from the drop down list. You must enter the variable value in the
proper format. Use the expand button (see next section) to view the variable type.
Each variable value has a small Set button to the right. Click this Set button to
perform an SNMP set on only one variable. Set buttons are grayed for variables that
are read-only.
Chapter 8 Performance 76

NetAtlas Enterprise Ethernet Switch Manager User’s Guide
Table 31 Edit Table Entry (continued)
COMMAND DESCRIPTION
Previous/Next
Page Buttons
Expand Click the Expand button to expand the view of the active variable value edit box.
First Click the First button to obtain the first entry of the table from the node. The variable
Get Click the Get button to obtain the selected table entry. Enter all of the index values to
Next Click the Next button to obtain the next entry of the table from the node, using an
Stop Click the Stop button to abort the current SNMP operation. This button can be used
Set All Click the Set All button to set all writable variable values to the node. You must enter
Done Click this button when you’re done editing this dialog box.
Help Click this button for online help.
Each page shows up to ten variables. The page number and total number of pages
are displayed in the top right corner. Use the >> button to move to the next page and
click the << button to move to the previous page.
First click on the edit box, then select the Expand button.
values will be updated. You do not need to enter index values - they will be ignored.
select a table entry. If you have already displayed an entry, and perhaps modified the
value boxes, you can Click the Get button to refresh the variable values.
SNMP GetNext operation. The variable values are updated. If there are no more
entries in the table, a message is displayed. You can specify a starting point for the
GetNext by entering index values. You do not need to enter all index values, but if
you enter the Nth index value, you must also enter the 1st through (N-1)th index
values.
to stop a command when a node is not responding and you don't want to wait for the
timeout period.
all of the index values (those with an asterisk to the right of the variable name) to
select the table entry. If you do not know the proper index values, you can first find
the entry you want to change by using the First and Get, Next buttons. Some nodes
do not allow set operations to all variables that are defined as writable in the MIB.
For these nodes, you will have to individually set table entry variables using the
variable Set buttons.
Note: You can only use the variable Set button (via the EMS) to update system
contact, system name, system location and the administrative status of each
port.
8.2.2 Expand Dialog Box
In the Edit Table Entry screen click the Expand button to expand the view of the active
variable value edit box. First click on the edit box, then click Expand.
77 Chapter 8 Performance

NetAtlas Enterprise Ethernet Switch Manager User’s Guide
Figure 44 Expand Field
The Expand screen shows the variable value in a larger edit box, so you can more easily enter
a long value. It also shows the variable type and a description from the MIB source file.
Possible variable types are shown in the following table.
Table 32 Variable Types
TYPE DESCRIPTION
Number This can be an INTEGER, COUNTER, GAUGE or Time Ticks. Data is normally represented
HexArr OCTET PRIM TYPE. Data is formatted as a list of two digit hexadecimal numbers,
ObjID OBJECT IDENTIFIER. Data is formatted in MIB dot format, optionally with a leading text
String This is OCTET PRIM TYPE with printable (ASCII string) data (DisplayString).
IP Addr IP ADDRESS PRIM TYPE in dotted decimal notation, for example, 128.9.118.0.
as a decimal number. However, in cases where INTEGER aliases are defined in the MIB,
an ASCII word will be displayed. For example, the value for ifOperStatus is displayed as UP
or DOWN.
representing one byte each, and separated by a single space, for example 22 3E 44 A1 10.
identifier, for example sysObjectID.0 or 1.3.6.1.2.1.1.2.0.
8.3 Graph Menu Bar Icons
These graphical menu bar icons are common to all screens that display information in
graphical format.
Chapter 8 Performance 78

NetAtlas Enterprise Ethernet Switch Manager User’s Guide
Figure 45 Graph Menu Bar
Restart Save to Bar Poll Paging Scroll
Graph File Chart Interval Controls Controls
Pause Line Pie Distribution Vertical
Graph Graph Chart Scale
8.3.1 Graph Styles
Use one of the style buttons to change the graph style to one of the following:
Table 33 Edit Table Entry
STYLE DESCRIPTION
Line Each variable is displayed as a line, with time as the horizontal axis. The vertical axis
represents the size of each polled value for each poll interval.
Bar The cumulative average value for each variable is displayed as a vertical bar.
Pie All variables are displayed as relative sized portions of a pie diagram. The entire display
represents a single poll interval.
Distribution Each variable is displayed as a stacked vertical bar. Each segment of the bar represents
the amount of time that the variable value is within a certain range (as a percent). The
legend on the right side of the display shows the corresponding range for each color. The
entire display represents a single poll interval.
8.3.2 Chart Format Display Variable
Choose which variables to display in chart format by doing one of the following:
1 Click a variable cell in a table and click the bar chart icon.
2 Display the chart menu and then deselect variables (all are displayed by default).
3 Right-click a variable’s cell and select Properties.
79 Chapter 8 Performance

NetAtlas Enterprise Ethernet Switch Manager User’s Guide
Figure 46 Cell Properties Select
4 A display properties dialog box opens. Select the Display check box.
Figure 47 Chart Color Codes and Line Styles
You may also edit the color code and line style for a variable in the dialog box as described in
the following table.
Table 34 Edit Style Dialog Box
FIELD DESCRIPTION
Display Check Display to view information about this variable in chart format.
Color Choose a color from this drop down list.
Style Choose a line style from this drop down list.
Scale Select the scaling multiplier from this drop down list. This factor is applied to each value in
the line before it is displayed and can be used to keep all graph lines within a similar range
of values. The range is from 0.0001 to 1000.0.
8.3.3 Graph Labels
In the Interface screen click the Graph button to display the following screen.
Chapter 8 Performance 80

NetAtlas Enterprise Ethernet Switch Manager User’s Guide
Figure 48 Graph Variables
The following table describes the labels in this screen.
Table 35 Graph Variables
LABEL DESCRIPTION
Style This is the line style discussed above.
Var iable This is the variable being represented by the line style discussed above.
Scale This is the scaling multiplier.
Cur This is the current value of the variable.
Min This is the minimum value of the variable.
Max This is the maximum value of the variable.
Ave This is the average value of the variable.
To ta l This is the total value of the variable.
Baseline This is a measure of the typical variable behavior. After a learning period has transpired,
SNMPc can automatically generate baseline alarms when variable values exceed the
baseline.
81 Chapter 8 Performance

This chapter describes the event logs and how to perform loopback tests using the Fault
screens.
9.1 Event Log
To display system event logs click Fault and then Event Log to view the following screen.
Figure 49 Fault: Event Log
NetAtlas Enterprise Ethernet Switch Manager User’s Guide
CHAPTER 9
Fault
The following table describes the labels in this screen.
Table 36 Fault: Event Log
LABEL DESCRIPTION
Alarm Filter
Port To display event logs of a port, select the port from the drop-down list box.
Chapter 9 Fault 82

NetAtlas Enterprise Ethernet Switch Manager User’s Guide
Table 36 Fault: Event Log (continued)
LABEL DESCRIPTION
Alarm Type Select the type of logs from the drop-down list box. Choices are All,
Communication, QualityOfService, ProcessingError, Equipment and
Environmental.
Select All for system event logs generated by all alarm types.
Select Communication for transmission and signal logs.
Select QualityOfService for performance logs.
Select Processing Error for software and configuration problem logs.
Select Equipment for hardware-related logs.
Select Environmental for environmental logs.
See the appendix for a more detailed list of possible alarm causes.
Severity Select the severity level of the logs you want to display from the drop-down list box.
The choices and associated colors are as follows:
• Critical - Red
• Major - Orange
• Minor - Yellow
• Information - Blue
• Normal - Green
Sorted by Select Log Time to sort event logs by the time at which they were generated or
Date / To Specify the time range to display the event logs.
Apply Click Apply to display event logs generated within the specified time period.
Alarm
Index This field displays the index number of the event logs.
Acknowledge This field displays whether a log has been acknowledged so that EMS users will
Type This field displays the type of the event log.
Severity This field displays the severity of the event log.
Device Name This field displays the name of the device on which the event log was generated.
Port This field displays the port number on which the event log was generated.
Date Time This field displays the date and time when the event log was generated.
Description This field displays some information about the event log.
Acknowledge Click Acknowledge to acknowledge any selected log messages.
Delete Click Delete to remove the selected log.
Close Click Close to close this screen.
select Device Name to sort event logs by the device from which they were
generated.
know when a log has been dealt with by an administrator.
9.2 Loopback Test
Follow the steps below to perform an internal loopback test.
1 Click Fault and then Loopback Test.
2 Choose a switch from the list located on the left-hand side of the screen.
83 Chapter 9 Fault

NetAtlas Enterprise Ethernet Switch Manager User’s Guide
3 Choose a port from the list located on the right-hand side of the screen.
4 In the Timeout field, accept the default or specify a connection timeout period (in
seconds).
5 Click Apply to start the loopback test.
Figure 50 Fault: Loopback Test
6 A screen displays showing the test result. Click OK to close the screen.
Figure 51 fault: Loopback: Result
Chapter 9 Fault 84

NetAtlas Enterprise Ethernet Switch Manager User’s Guide
85 Chapter 9 Fault

NetAtlas Enterprise Ethernet Switch Manager User’s Guide
CHAPTER 10
This chapter tells you how to backup and restore your configuration file as well as upload new
firmware and configuration files.
10.1 Firmware Upgrade
You must be logged in with system administrator rights to use this function.
Note: Do NOT turn off the switch during the updating process, as it may corrupt the
firmware and make the selected switch unusable.
10.1.1 Procedure to Update Firmware
Maintenance
You can perform firmware upgrade on all switches of the same type simultaneously on
the EMS. To update firmware, first download the latest firmware, then unzip and store it
on your computer. You can use this EMS FTP client to connect to a selected switch.
Note: Do NOT turn off the switch during the updating process, as it may corrupt the
firmware and make your switch unusable.
1 Click Maintenance and then Firmware Upgrade.
2 Select a device type from the Device Type drop-down list box.
3 The list displays the switches of the selected type. Select a switch or multiple switches on
which you want to upgrade the firmware.
4 Type the path and file name of the firmware file you wish to upload to the switch in the
FW Image text box or click Browse to locate it. After you have specified the file, click
Apply.
Chapter 10 Maintenance 86

NetAtlas Enterprise Ethernet Switch Manager User’s Guide
Figure 52 Maintenance: Firmware Upgrade
5 After the file transfer is complete, a screen displays showing the result. Click Done to
close the screen. When the firmware upgrade process is complete, the switch(es)
automatically restarts (the SYS LED blinks).
Figure 53 Maintenance: Firmware Upgrade: Result
6 Wait until the switch(es) has finished rebooting before accessing it again. Check the
firmware version on the switch to make sure that the firmware is updated successfully.
10.2 Device Reset
Use the Reboot System screen to restart a switch without physically turning the power off.
1 Click Maintenance, Device Reset to display the screen as shown.
2 Select a device from the list and click Apply.
87 Chapter 10 Maintenance

NetAtlas Enterprise Ethernet Switch Manager User’s Guide
Figure 54 Maintenance: Device Reset
3 A screen displays. Click Done. The switch will restart. This takes up to two minutes. This
does NOT affect the switch’s configuration.
Figure 55 Maintenance: Device Reset: Result
10.3 Network Element Configuration Backup and Restore
A Network Element (NE) is a network device that provides support or services to the user.
Follow the steps below to backup or restore a switch configuration file to your computer.
1 Click Maintenance and then NE Configuration Backup and Restore.
2 Select a device type from the drop-down list box and select a switch in the list box.
3 Under Directory/File Name, type the path and file name of the file you wish to restore to
the switch or backup to your computer in the text box provided or click Browse to locate
it.
4 Select the Save running config to configuration check box to save the current switch
configuration if you want to back up to your computer.
5 Select Backup to save the configuration to your computer. Or select Restore to restore
the configuration file back to the switch.
Chapter 10 Maintenance 88

NetAtlas Enterprise Ethernet Switch Manager User’s Guide
6 Click Apply.
7 If you chose Restore, the switch automatically restarts when the configuration file upload
is complete.
8 Click Close to close this screen.
Figure 56 Maintenance: Configuration Backup/Restore
The following table describes the labels in this screen.
Table 37 Maintenance: Configuration Backup/Restore
LABEL DESCRIPTION
Directory/File Name Type the path and file name of the configuration file you wish to restore to the
Save running-config to
configuration
Backup Click the Backup radio button to transfer the configuration file from your switch
Restore Click the Restore radio button to transfer the configuration file from your
Apply Click Apply to backup or restore the switch(es) configuration file.
Close Click Close to close this screen.
switch or backup to your computer in the Directory / File Name text box or
click Browse to locate it.
Select the Save running-config to configuration text box to save the most
recently updated configuration to a file specified in the Directory/File Name
field.
to a computer.
computer to a switch.
10.4 Load Factory Default
Follow the steps below to reset a switch configuration to the factory defaults.
1 Click Maintenance and then Load Factory Default.
2 Select a switch from the list of devices shown.
3 Click Apply to clear all configuration information and return the switch to the factory
defaults.
89 Chapter 10 Maintenance

NetAtlas Enterprise Ethernet Switch Manager User’s Guide
This takes up to two minutes. If you want to access the switch web configurator again,
you may need to change the IP address of your computer to be in the same subnet as that
of the default switch IP address.
4 Click Close to close this screen.
Figure 57 Maintenance: Load Factory Defaults
10.5 Scheduled Network Element Configuration Backup
Perform configuration backups according to a schedule. Set the frequency, time and date of the
backup and the location where you want to backup the configuration file.
Figure 58 Maintenance: Scheduled NE Config Backup
The following table describes the labels in this screen.
Chapter 10 Maintenance 90

NetAtlas Enterprise Ethernet Switch Manager User’s Guide
Table 38 Maintenance: Scheduled NE Config Backup
LABEL DESCRIPTION
Backup Schedule
Frequency Scheduled backups can be performed on a Daily, Weekly or Monthly basis.
Select a radio button to schedule configuration backups starting at the date
and time specified below. The default setting is No Backup.
Starting date Specify the starting date to begin a configuration file backup for the selected
device(s). Select a date from the drop-down list box.
Starting time Specify the starting time to begin a configuration file backup for the selected
Backup Directory Type the path and file name of the configuration file you wish to backup to your
User info for Windows To perform scheduled backups, you need to specify your Windows
Account This read-only field displays the Windows login account user.
Password Enter a password in this field for the administrator Account above.
Add Click the Add button to add a switch to the list of devices in the backup
Remove Click the Remove button to remove a switch from the list of devices in the
Apply Click Apply to save changes to the EMS.
Close Click Close to close this screen.
device(s). Select a time from the selection box or enter a time (hh:mm:ss AM/
PM format).
computer in the Backup Directory text box or click Browse to locate it.
administrator account information. This allows the EMS to add a scheduled
task in Windows.
schedule.
backup schedule.
10.5.1 Scheduled Network Element Configuration Backup Add
Follow the steps below to add a device to the list of devices in the Scheduled NE
Configuration Backup screen.
1 Click the Add button in the Scheduled NE Config Backup screen.
2 Click the OK button.
91 Chapter 10 Maintenance

NetAtlas Enterprise Ethernet Switch Manager User’s Guide
Figure 59 Maintenance: Scheduled NE Config Backup Add
10.5.2 Scheduled Network Element Configuration Backup Remove
To remove a device from the Scheduled NE Configuration Backup screen, click the
Remove button in the Scheduled NE Config Backup screen.
Chapter 10 Maintenance 92

NetAtlas Enterprise Ethernet Switch Manager User’s Guide
93 Chapter 10 Maintenance

This chapter shows you how to access a switch via Telnet or web configurator directly through
the EMS. You may need to do this to test the switch network connection for example.
11.1 Accessing the Switch
Access the switch remotely via Telnet or web browser.
Note: When you access a switch via Telnet or the web configurator, you CANNOT
make any changes to that switch using the EMS.
11.1.1 Telnet
NetAtlas Enterprise Ethernet Switch Manager User’s Guide
CHAPTER 11
Tools
Telnet is the login and terminal emulation protocol common on the Internet and in UNIX
environments. It operates over TCP/IP networks. Its primary function is to allow users to log
into remote host systems.
The administrator uses Telnet from a computer on a remote network to access the switch. You
can use remote Telnet access as shown next.
1 Select a switch from the list of devices shown in the Device List Panel.
2 Click Tool and then Tel net to open a console session for Telnet access to the switch.
3 Type the switch user name and password to access the switch command line prompt.
Figure 60 Telnet
4 Refer to the switch User’s Guide for information on the commands used in this screen.
Chapter 11 Tools 94

NetAtlas Enterprise Ethernet Switch Manager User’s Guide
11.1.2 Web Access
Configure the switch using the web configurator as shown.
1 Select a switch from the list of devices shown in the Device List Panel.
2 Click Tool and then Web Access to open the switch web configurator password screen.
From here you can log in directly to the switch.
3 Type the switch User name and Password to access the web configurator.
Figure 61 Web Access
4 Refer to the switch User’s Guide for information on the web configurator main screen.
11.2 Ping
Ping the host to see if the links and TCP/IP protocol on both your computer and the switch is
working. Follow the steps below:
1 Select a switch from the list of devices shown in the Device List Panel.
2 Click Tool and then Ping to have the computer ping the IP address of the selected device.
3 The Command Prompt window automatically closes after the computer pings the selected
Note: The device IP address varies according to whether the switch is connected to
switch three times.
the EMS computer using an in-band or an out-of-band IP address.
95 Chapter 11 Tools

Figure 62 Ping
NetAtlas Enterprise Ethernet Switch Manager User’s Guide
Chapter 11 Tools 96

NetAtlas Enterprise Ethernet Switch Manager User’s Guide
97 Chapter 11 Tools

NetAtlas Enterprise Ethernet Switch Manager User’s Guide
Device Menu Overview
This chapter introduces the device configuration menus.
12.1 Device Menu Summary
To select a device configuration menu, right-click on a device in the Device List Panel.
Figure 63 Device Panel List Menus
CHAPTER 12
12.2 Property Configuration
See Section 4.1.2 on page 45 for information on the Edit Device screen.
12.3 Introducing the Device Configuration Window
The following example screen displays the main features used to configure EMS-managed
devices. See the individual screen selections for details on switch feature configuration.
Chapter 12 Device Menu Overview 98

NetAtlas Enterprise Ethernet Switch Manager User’s Guide
Figure 64 Configuration Window
3
1
2
4
5
The following table describes the elements in this screen.
Table 39 Configuration Window
LABEL DESCRIPTION
1 Device Panel This panel displays all active devices (of the same type) currently managed by
2 Port List Panel This field displays a list of switch ports. This list displays in the Ethernet Port
3 Copy to.. Click the Copy to.. button to copy the configuration from the switch that you are
4 Configuration
Panel
5 Close Click Close to close a configuration screen. If you close a screen without first
the EMS.
Configuration screens only.
To make configuration changes to each port or ports, select a port number or
multiple port numbers (by pressing the [CTRL] key and clicking at the same
time) in the Port List Panel.
currently configuring to the port(s) on the same switch or other switch(es). Port
configurations can also be copied to other device ports in the Ethernet Port
Configuration screens.
Use this panel to make configuration changes to a device based on a port or
multiple ports selected in the Port List Panel.
If the screen does not have a Port List Panel, then use this panel to make
configuration changes to a device selected in the Device Panel.
Click Apply to save configuration changes.
clicking Apply, configuration changes will not be saved.
12.3.1 Port List Multiple Port Configuration
Configure more than one port at the same time by pressing the [CTRL] key and clicking at the
same time in the Port List Panel.
99 Chapter 12 Device Menu Overview

NetAtlas Enterprise Ethernet Switch Manager User’s Guide
Figure 65 Configuration Window: Port List: Multiple Port Select
Click Apply when you are satisfied with the configuration changes. A screen displays
showing the configuration result.
Figure 66 Applied Results
4 Click Done to close the screen.
12.3.2 The Copy to.. Button
The Copy to.. button allows you to copy the configuration from the switch you are currently
configuring to one or more switches.
1 In the Device Panel list, select a device that you want configure.
2 Select a tab in the Configuration Panel.
3 Select a port or multiple ports (by pressing the [CTRL] key and clicking at the same time)
from the Port List Panel.
4 Make your configuration changes in the Configuration Panel and click the Apply button.
5 Click the Copy to.. button. The following screen displays.
Chapter 12 Device Menu Overview 100
 Loading...