

Page 1
CONCRETE THICKNESS GAUGE (CTG
-
2)
PATENT PENDING
System Reference Manual
CTG-2 with WinCTG2 Software Version 1.7
Page 2
NOTICES
Errors and Omissions
This document is believed to be accurate, but Olson Instruments, Inc. will not be
responsible for any errors or omissions which may be found. Further, Olson Instruments
will not be responsible for any damages resulting from any errors or omissions.
Proprietary Information
This document, as well as all software written by Olson Instruments, Inc., is proprietary
to Olson Instruments, Inc. This manual may not be sold, reproduced, or used with any
other product other than the Olson Instruments CTG-2 unless approved by Olson
Instruments, Inc. Further, this manual and the accompanying software may not be used
by any party other than the original purchaser without prior approval of Olson
Instruments, Inc.
Warranty
(See Sales Contract Documents)
Copyright
Copyright 2016 by Olson Instruments, Inc. All rights reserved. No part of this publication
may be reproduced or utilized in any form or by any means, electronic or mechanical,
including photocopying, recording, or by any information storage or retrieval system,
without prior written permission of the above named copyright holder.
Written by:
Olson Instruments, Inc.
12401 W. 49th Avenue
Wheat Ridge, Colorado
USA 80033-1927
Office: (303)423-1212
Fax: (303)423-6071
E-Mail: equip@olsoninstruments.com
Revised: August 2017
1
Page 3

Table of Contents
INTRODUCTION ............................................................................................................................................................ 3
1.1 Organization and Scope of Manual .................................................................................................................. 4
1.2 Test Methodology ............................................................................................................................................. 4
2.0 HARDWARE ........................................................................................................................................................ 5
2.1 Hardware Component Listing ........................................................................................................................... 5
2.2 Location and Replacement of Batteries............................................................................................................ 6
2.3 Hardware Setup ............................................................................................................................................... 7
3.0 WinCTG2 SOFTWARE SETUP ......................................................................................................................... 10
3.1 Prerequisite Software ..................................................................................................................................... 10
3.2 Software Installation ....................................................................................................................................... 10
3.3 Software Updates ........................................................................................................................................... 10
3.4 Software Uninstallation................................................................................................................................... 10
4.0 DATA AQUISITION ............................................................................................................................................ 12
4.1 General Information about the WinCTG2 Software ........................................................................................ 12
4.2 IE Data Acquisition without Velocity Calibration ............................................................................................. 13
4.3 IE Data Acquisition with Known-Thickness Velocity Calibration ..................................................................... 21
4.4 View Mode ..................................................................................................................................................... 23
4.5 Thick Concrete Testing .................................................................................................................................. 24
4.6 Units ............................................................................................................................................................... 25
4.7 Volume ........................................................................................................................................................... 25
4.8 Save Parameters ........................................................................................................................................... 25
4.9 Reset Parameters .......................................................................................................................................... 26
4.10 Operation Notes and Tips ............................................................................................................................ 26
5.0 WinCTG2 SOFTWARE ANALYSIS .................................................................................................................... 29
5.1 Start Program ................................................................................................................................................. 29
5.2 Open Data Files ............................................................................................................................................. 30
5.3 Filtering .......................................................................................................................................................... 30
5.4 Windowing ...................................................................................................................................................... 31
5.5 Concrete Velocity ........................................................................................................................................... 33
5.6 Open Next Data File ....................................................................................................................................... 33
6.0 WinCTG2 SOFTWARE EXPORTING OPTIONS ............................................................................................... 34
6.1 Copy or Save Image....................................................................................................................................... 34
6.2 Export Test Results to Comma Separated Format ......................................................................................... 34
6.3 Export Raw Data to Comma Separated Format ............................................................................................. 35
7.0 WinCTG2 SOFTWARE LANGUAGE OPTIONS ................................................................................................ 36
8.0 CARE AND MAINTENANCE .............................................................................................................................. 37
APPENDIX A................................................................................................................................................................ 38
2
Page 4

INTRODUCTION
The Olson Instruments CTG-2 system is commonly used for thickness evaluation and
rapid flaw detection on concrete and masonry structural materials. The method is
normally applied to plate-like objects such as slabs and walls, but is also used on
columns, mat foundations, and beams. The method requires access to only one side for
testing.
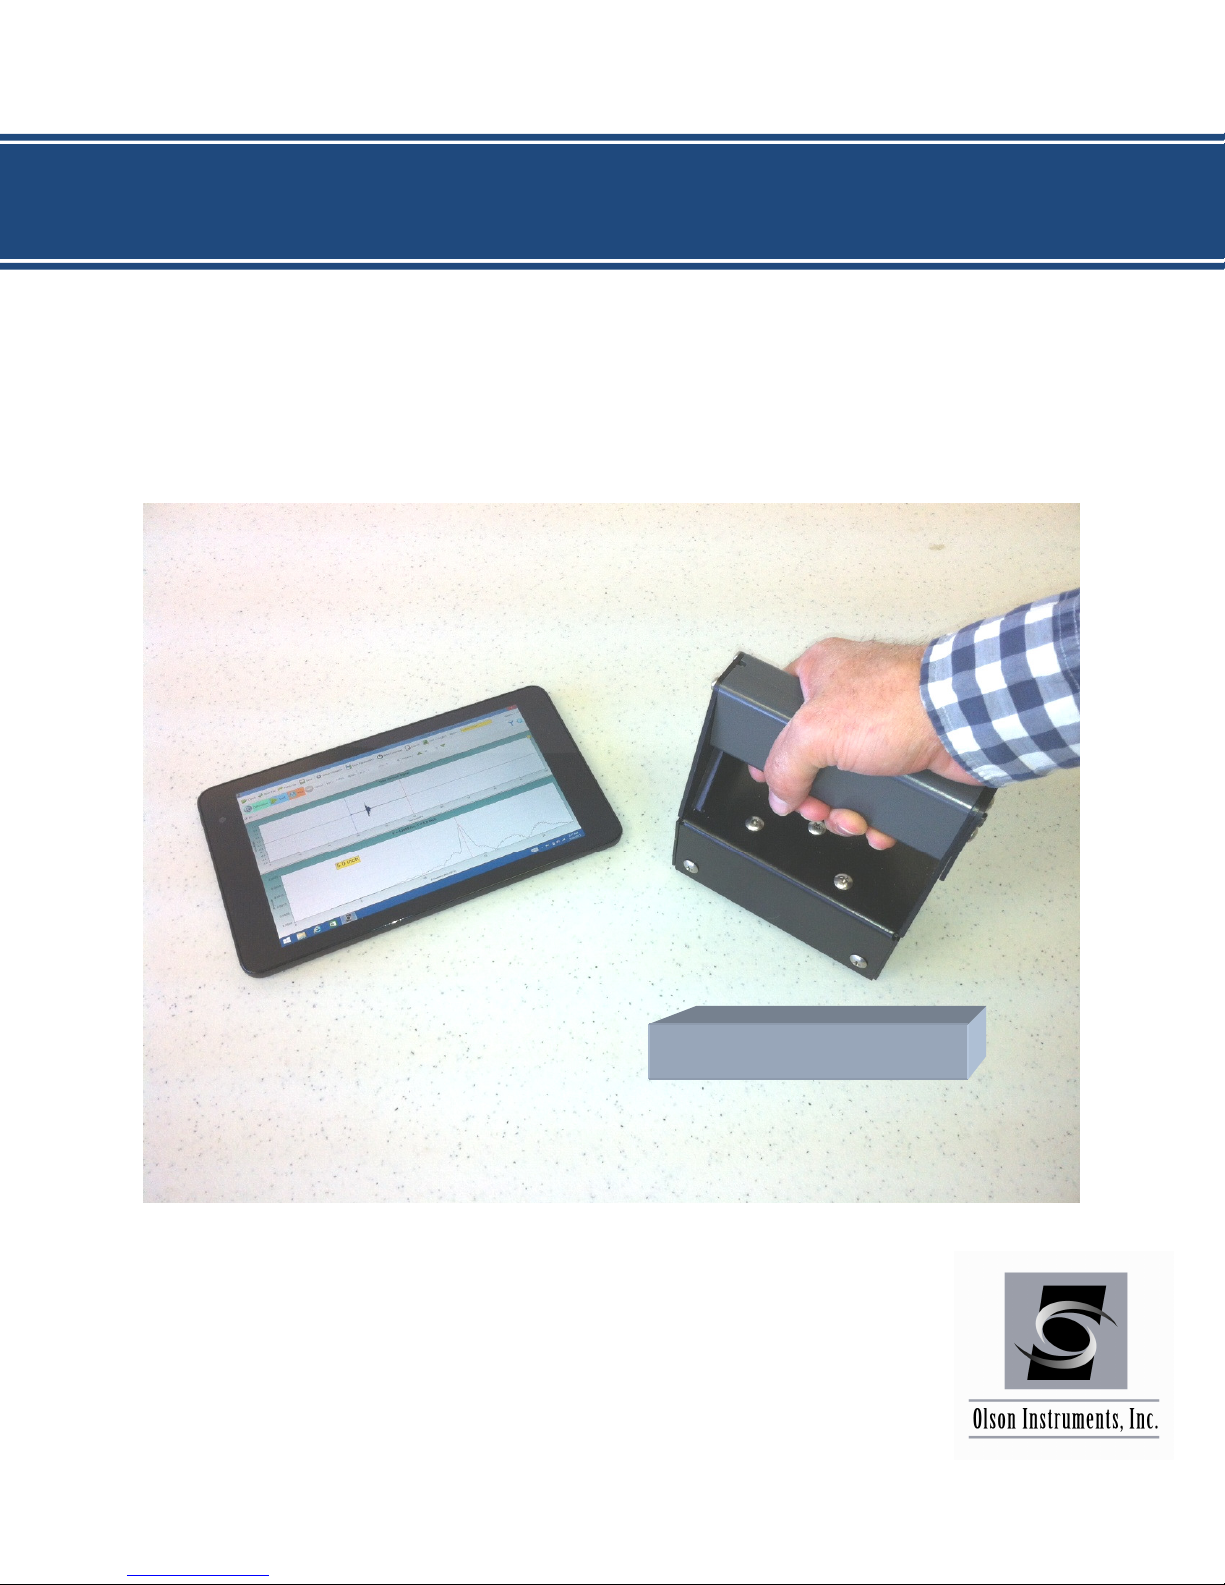
The CTG-2 is a powerful, hand-held device meant to be used with most Windows 7 and
Windows 8 laptop computers or tablets. The CTG-2 is designed to measure the
thickness of concrete slabs and walls in the range of approximately 3.2 inches (8.1 cm)
out to about 6 feet (1.8 m) without the need for drilling, coring, or other means. Test
results are acquired and analyzed with Olson’s WinCTG2 software, making the CTG-2
system a fully functional Impact Echo (IE) based thickness measuring system, capable
of analyzing echoes from multiple cracks and other flaws. In addition, a summary of test
results can be saved in comma separated format for use in an excel spreadsheet.
The WinCTG2 software features a graphical display of both the raw time signal as well
as the received signal spectrum (which can be saved and recalled), which allows visual
indication of data quality, easy differentiation of bad data, and even the location of
partial cracking damage. This unit can also be used to determine relative concrete
quality (by measuring concrete compression wave velocity) for test cylinders and other
samples with known thicknesses. The device can also be used for thickness
measurements of many materials other than concrete, such as plastics, stone, etc.,
depending on the properties and internal structure of the material being tested.
The CTG-2, when used with the default concrete velocity value of 12,000 fps, has an
accuracy of up to approximately 10%. This accuracy can be improved to approximately
2% when the unit is calibrated for velocity at a location of known thickness.
To confirm functionality of the CTG-2, it is advised to test the unit on a slab of known
thickness or on a 6” x 12” concrete cylinder which can be readily obtained from a
concrete supplier.
The CTG-2 with automated solenoid and displacement transducer comes with a phoneplug-to-phone-plug cable used to connect the unit to a laptop or tablet. A microphone
adaptor is included to ensure the cable will work with different microphone/headset
ports. A USB jump drive is supplied with the necessary software and a microUSB-toUSB cable is included so the software on the USB jump drive can be downloaded onto
Windows devices. The user must supply a Windows 7 or Windows 8 laptop/tablet.
Details of the hardware and its usage are included in Section 2.0. Suggested Windows
devices that are known to work with the CTG-2 are listed in Appendix A.
3
Page 5
1.1 Organization and Scope of Manual
The CTG-2 is a sturdy battery powered unit designed for easy, fast, and reliable
operation by anyone with no special training required for basic operation. This manual
covers step-by-step hardware assembly, software setup, simplified operation
instructions for data acquisition, data analysis, and output generation. If any problems
with the system appear that are not covered in this manual, please call Olson
Instruments at the number included in the front of this manual.
1.2 Test Methodology
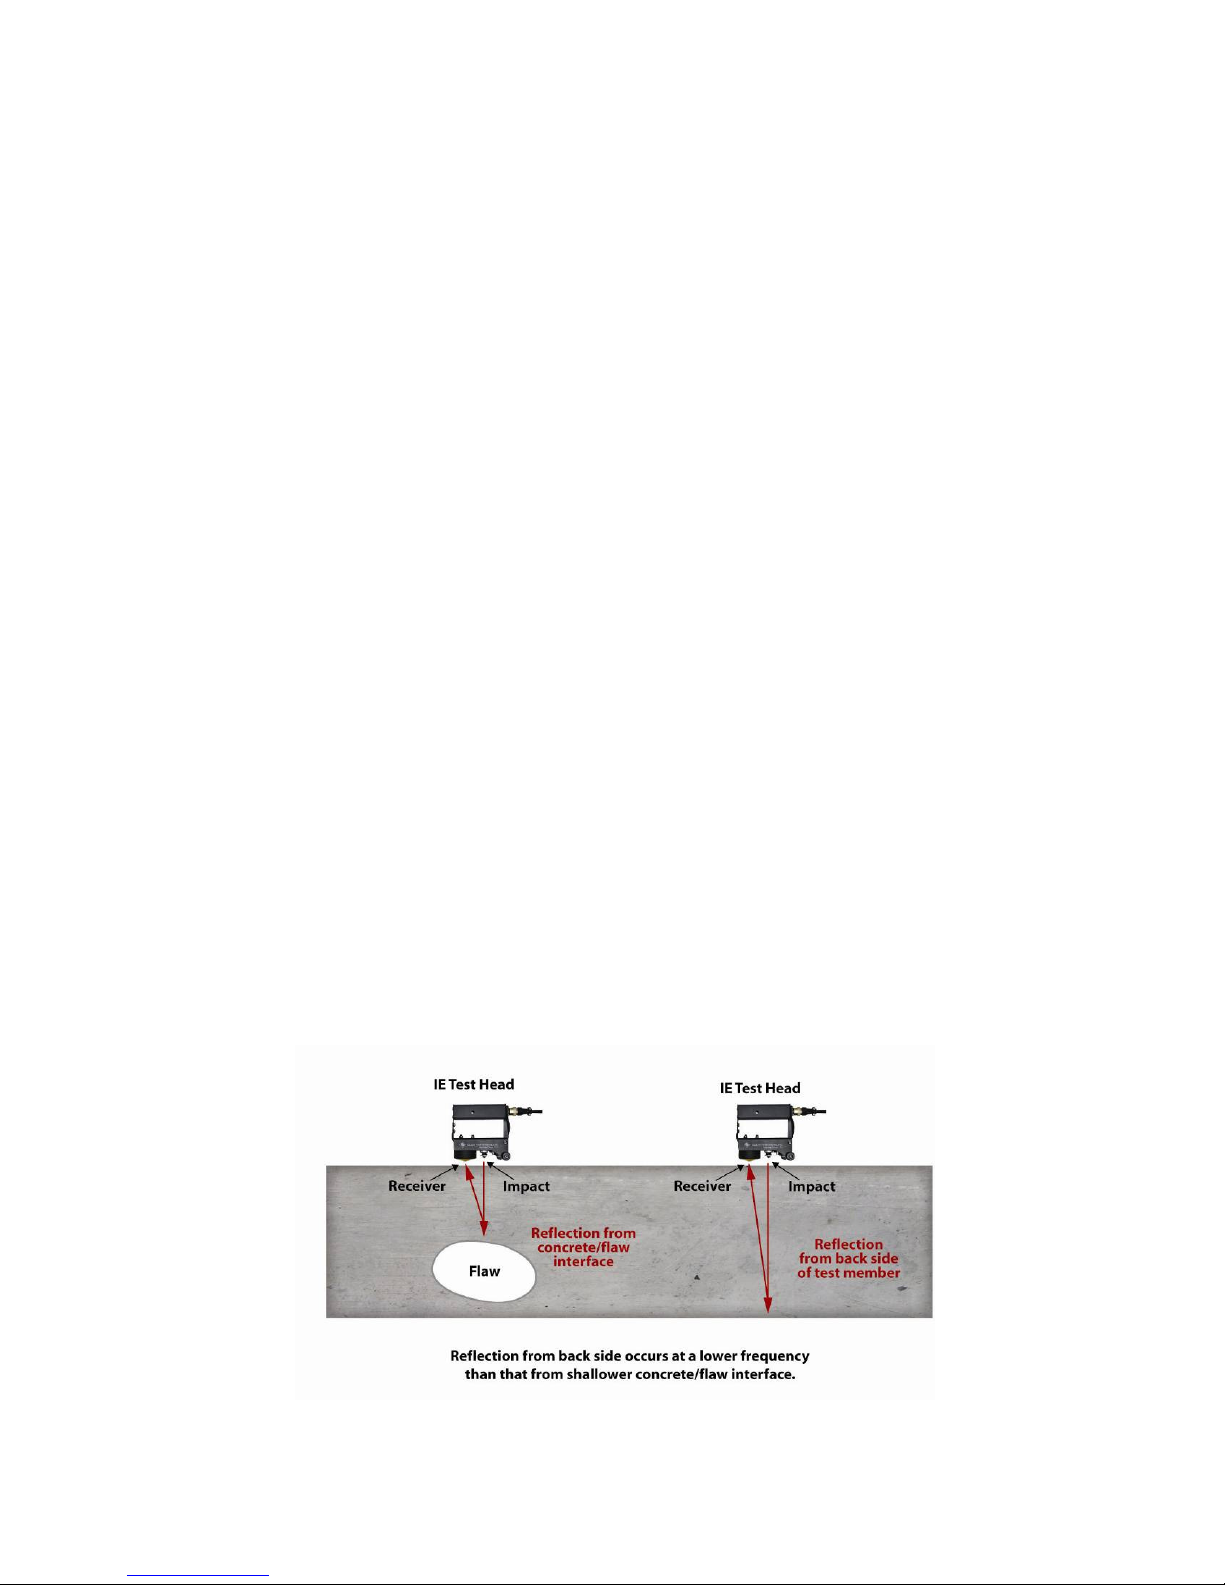
The Impact Echo tests performed with the CTG-2 involve impacting the
concrete/masonry member with an impactor solenoid and identifying the reflected wave
energy with a displacement transducer as shown in the figure below. Note that the
solenoid impactor and displacement transducer are built into the IE head. The test head
is pressed against the top of the tested member and held while tests are performed at
each test point. The resonant echoes of the displacement responses are usually not
apparent in the time domain, but are more easily identified in the frequency domain.
Therefore, amplitude spectra of the displacement responses are calculated by
performing a Fast Fourier transform (FFT) analysis to determine the resonant echo
peak(s). The relationship among the resonant echo depth frequency peak (f), the
compression wave velocity (VP) and the echo depth (D) is expressed in the following
equation:
D = βVp/(2*f) (1)
where β is a geometric shape factor ranging in value from 0.8 for a pier/column shape to
0.96 for a slab/wall shape. A slab/wall shape has a single thickness resonance while
beam and column shapes have multiple resonances due to their cross-sectional shape.
4
Page 6
2.0 HARDWARE
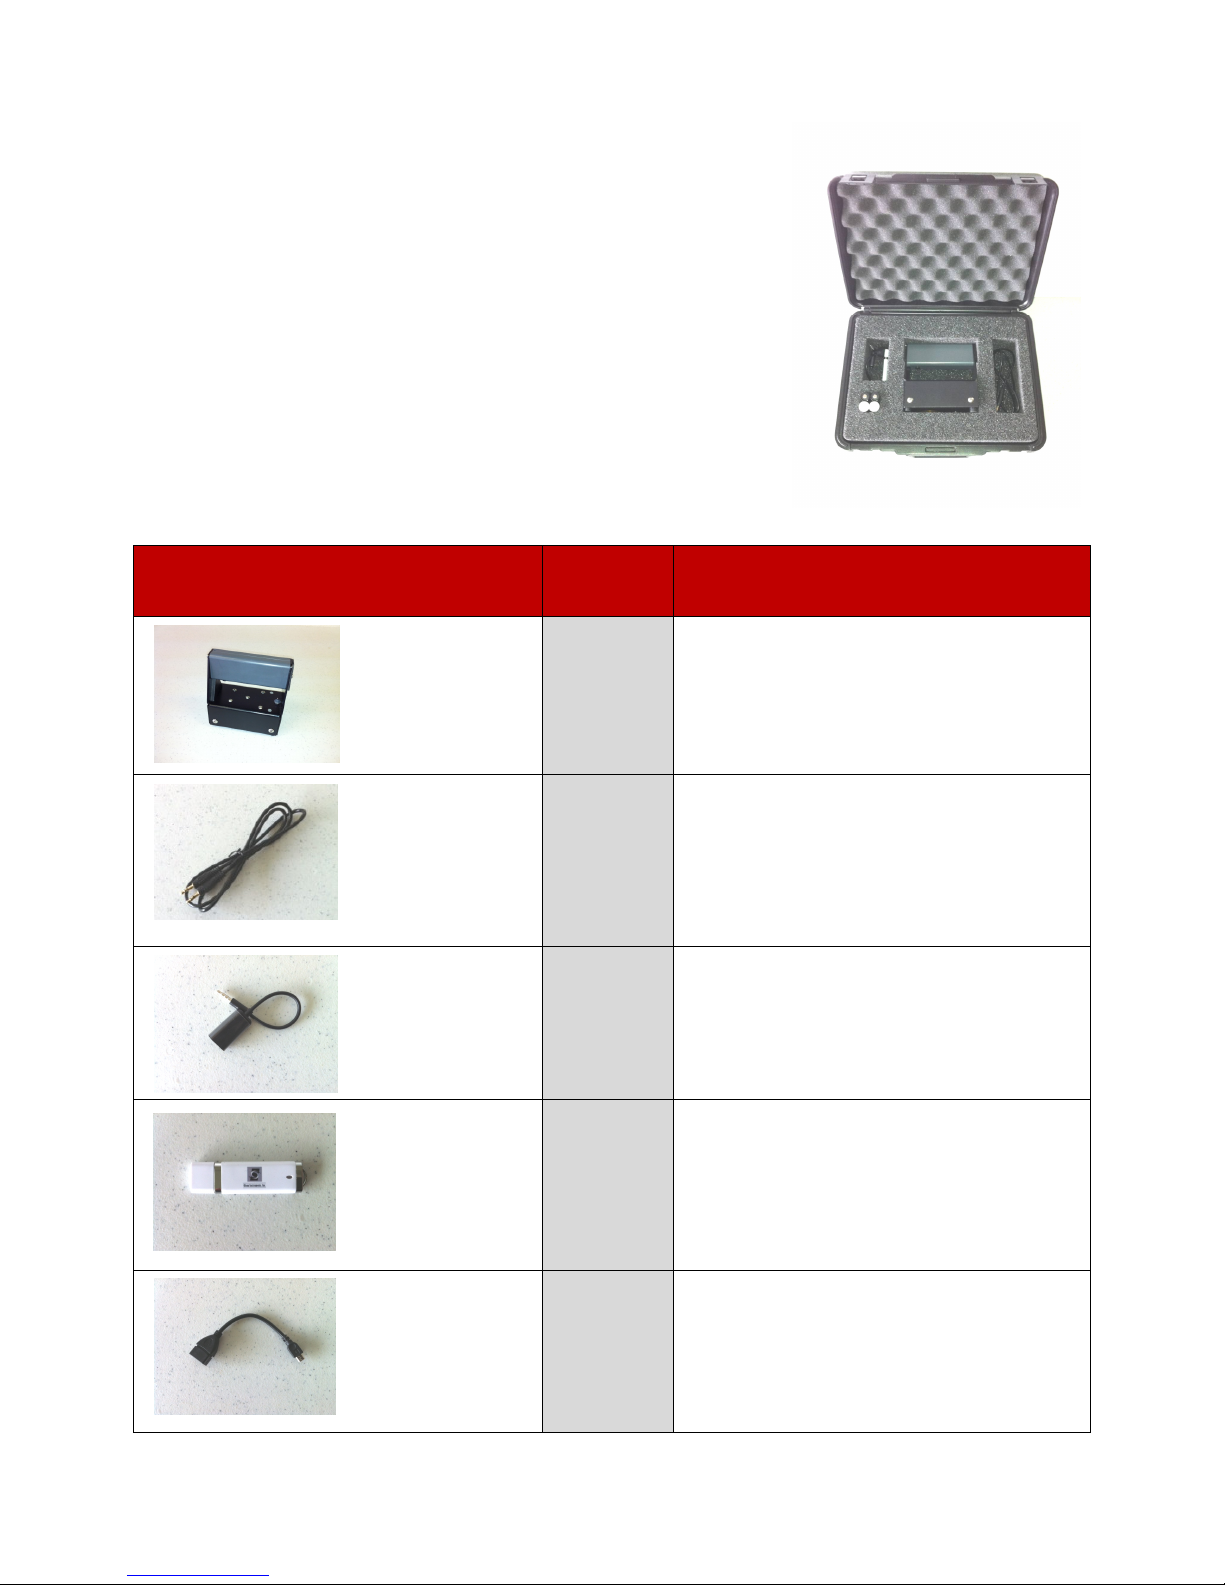
The CTG-2 system consists of a few basic components
packaged into a carrying case. The carrying case with
foam insert stores the CTG-2 IE test head and cables. It
includes a small compartment to store four CR123A 3V
spare batteries. A description of each of the included
components as well as their connection and operation is
included in the following sections.
2.1 Hardware Component Listing
COMPONENT NAME
COMPONENT NAME
COMPONENT NAMECOMPONENT NAME
QTY
QTY
QTYQTY
DESCRIPTION
DESCRIPTION
DESCRIPTIONDESCRIPTION
CTG
CTG----2 IE
2 IE Test
Test Head
CTGCTG
2 IE 2 IE
Phone
Phone----Plug
Plug----to
PhonePhone
PlugPlug
Phone
Phone----Plu
Plugggg Cable
PhonePhone
PluPlu
Microphone Adaptor
Microphone Adaptor
Microphone AdaptorMicrophone Adaptor
Olson Jump Drive
Olson Jump Drive
Olson Jump DriveOlson Jump Drive
Test Test
to----
toto
Cable
CableCable
Head
HeadHead
The test head includes an automated solenoid
impactor to create the impact and a
1111
1111
1111
1111 Jump Drive with Olson WinCTG2 Software.
displacement transducer sensor to receive the
signal. Includes four CR123A 3V lithium photo
batteries.
To connect the IE Test Head to the Microphone
Adaptor.
To connect the Phone-Plug-to-Phone-Plug
Cable to the Windows device.
USB to MicroUSB
USB to MicroUSB
USB to MicroUSB USB to MicroUSB
Adapt
Adaptor
AdaptAdapt
or
oror
1111
To connect Jump Drive with Olson WinCTG2
Software to Windows Device.
5
Page 7
i
2.2 Location and Replacement of Batteries
The CTG-2 is provided with four CR123A 3V nonrechargeable long life lithium photo
batteries to power the system. (If desired, rechargeable CR123A 3V batteries can be
purchased and used with the unit.) The CTG-2 unit is designed to turn on when the
toggle switch on the base of the unit is flipped into the on position, making the indicator
light at the top of the handle illuminate green.
When the batteries are losing power, the green light will not illuminate. Instead, the red
light will come on. To ensure accurate readings, the batteries must be replaced at this
time. When light fails to illuminate (either green or red), the batteries have lost power
and MUST be replaced.
Location of the Batteries: the four CR123A batteries that power the CTG-2 IE test
head are located inside the handle of the test head.
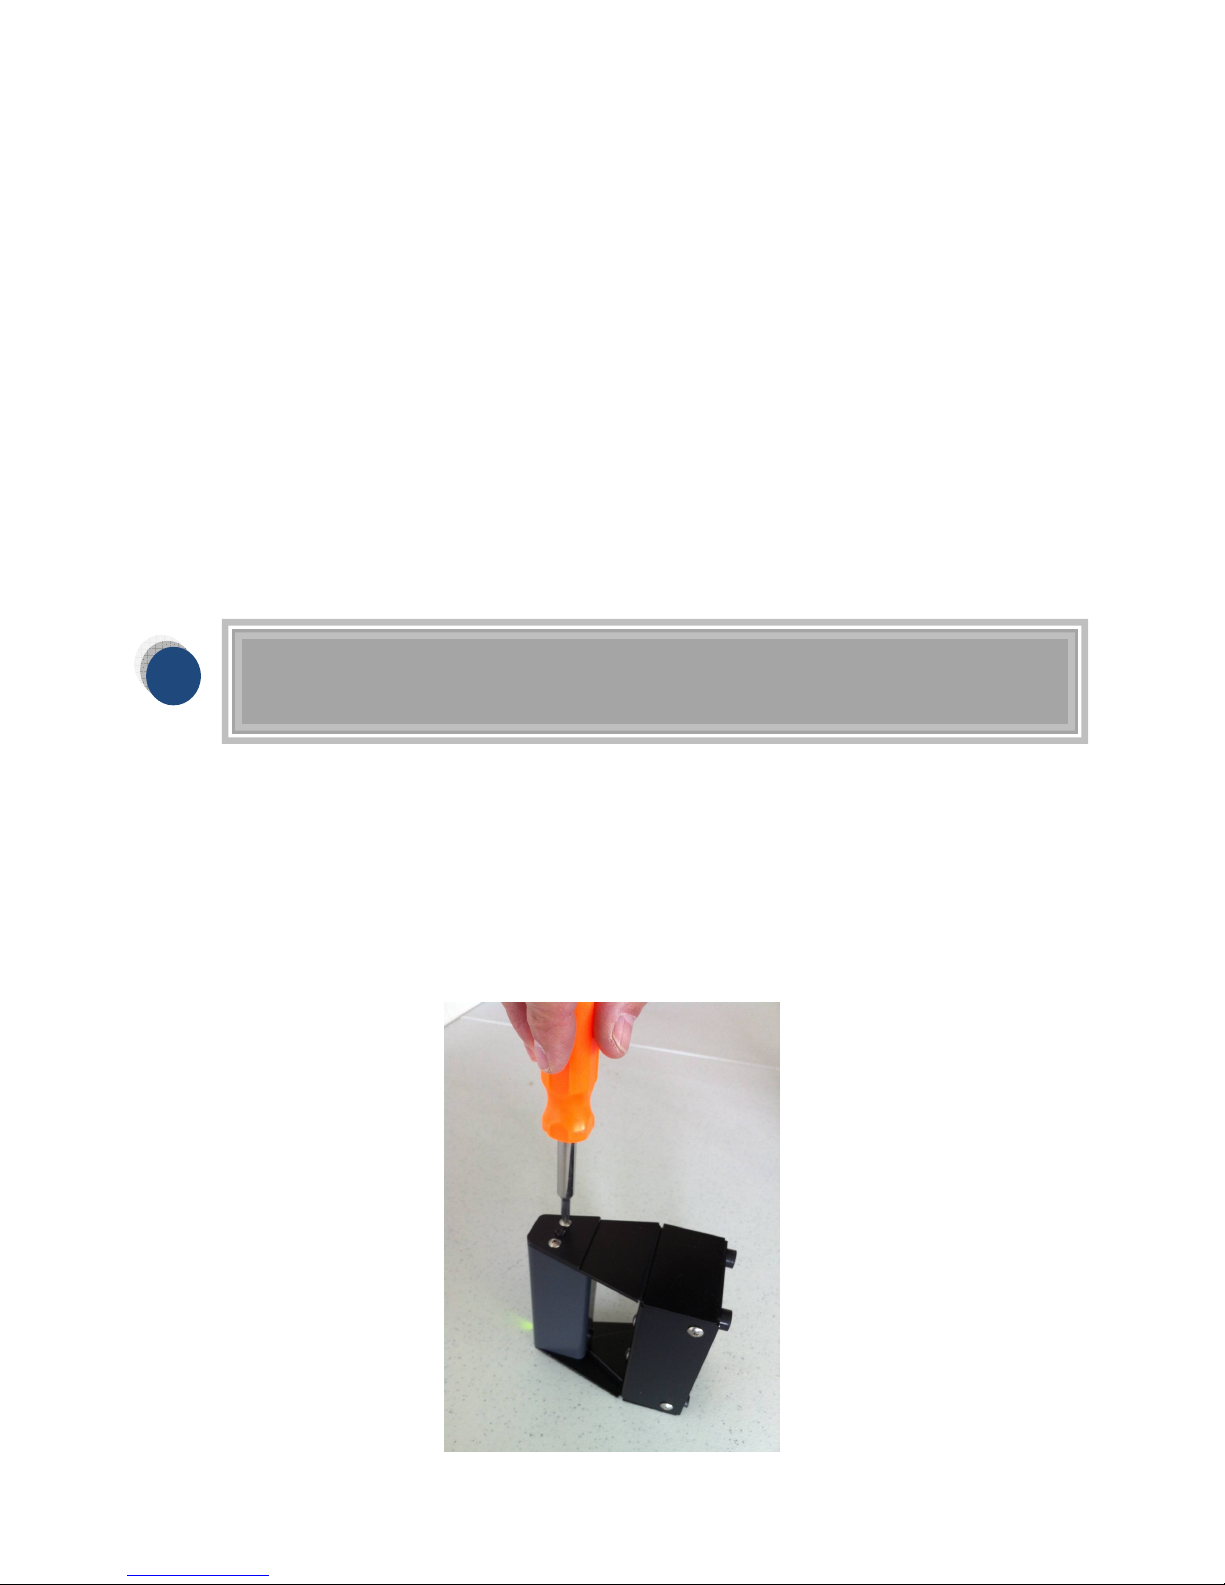
Battery Replacement: To replace the batteries, follow these steps:
1. Using the toggle switch located at the base of the IE head, turn off the unit and
2. Use a Phillips screwdriver to remove the 2 screws at the rear of the handle as
We recommend carrying spare batteries, and have provided a space for
them in the carrying case.
make sure the green light on the handle is not illuminated.
shown in the picture below. Remove the battery compartment cover.
6
Page 8
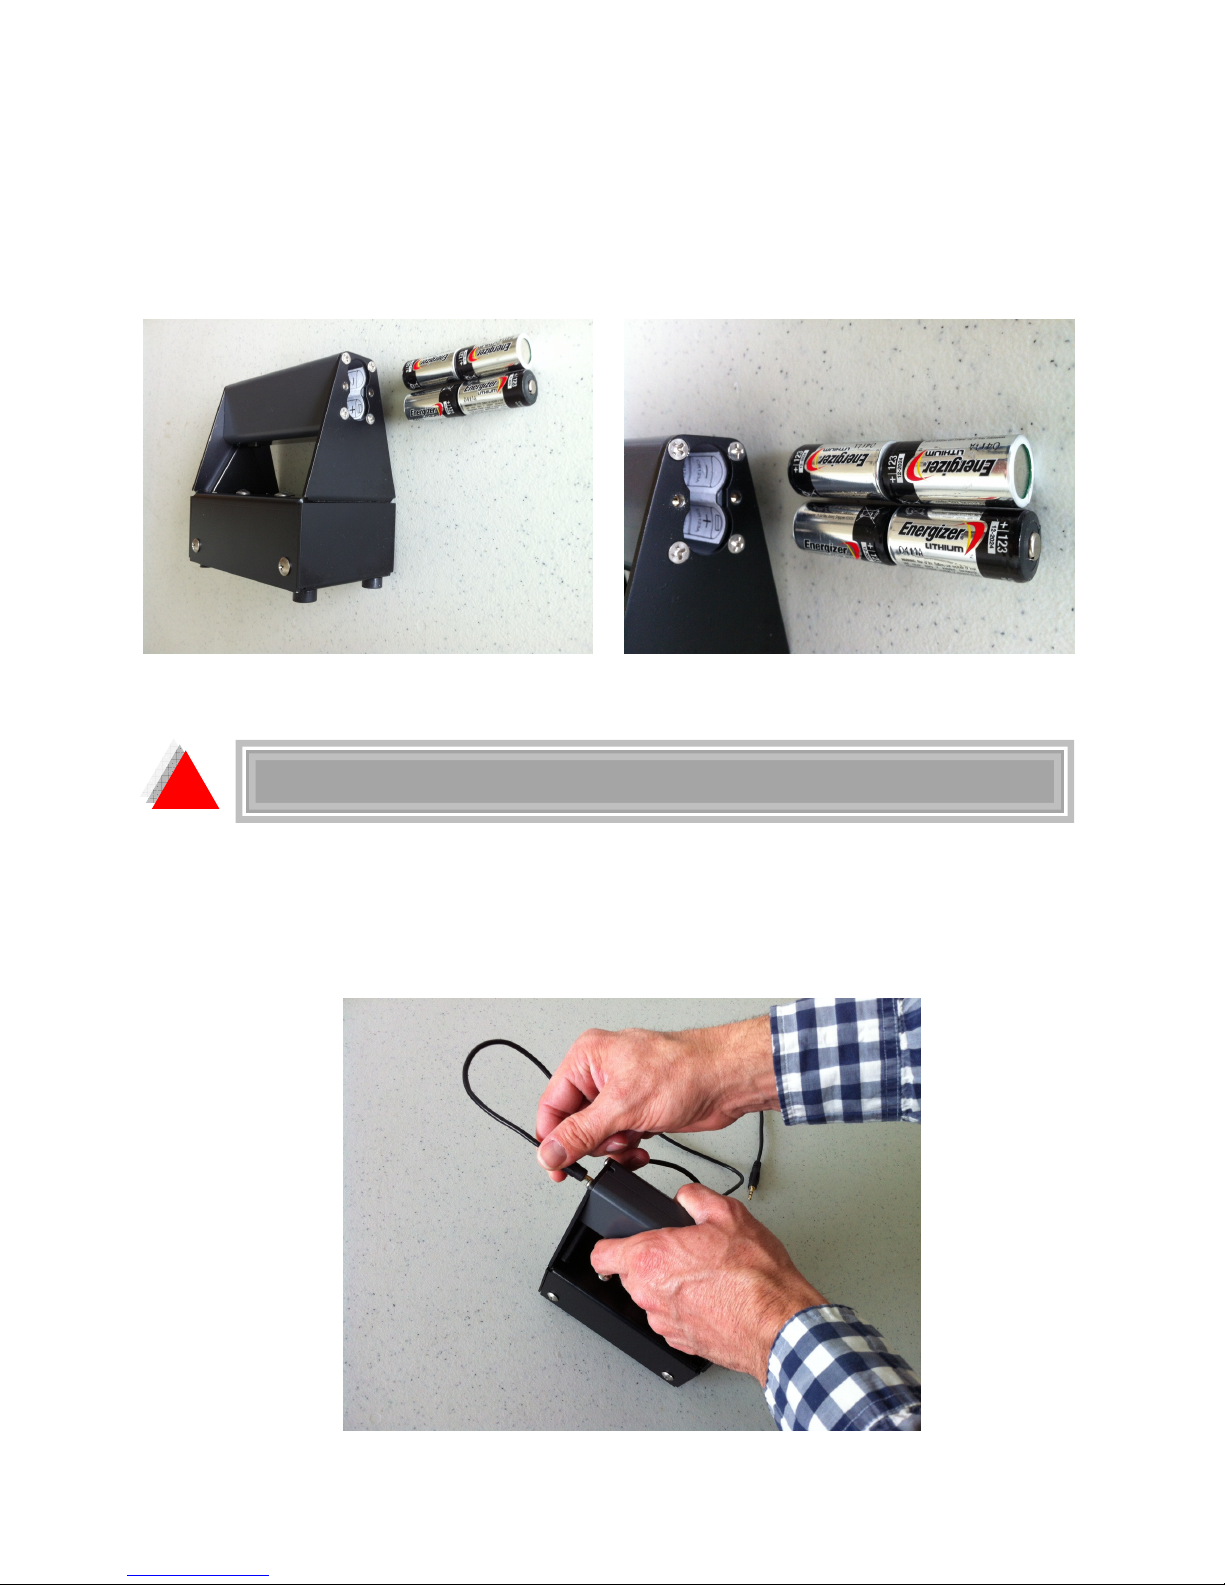
3. Turn the front of the unit upward to allow the batteries to slide out.
4. Insert new batteries following the polarity diagram inside the handle as shown in
the pictures below.
5. Replace the battery cover and screws.
!
2.3 Hardware Setup
1. Connect the Phone-Plug-to-Phone-Plug Cable to the IE Test Head as shown in the
picture below.
Do not expose the CTG-2 system or the batteries to water.
7
Page 9

2. Connect the other end of the Phone-Plug-to-Phone-Plug Cable to the Microphone
Adaptor, if necessary (laptops and desktops will not normally require the microphone
adaptor). There are two jacks on the Microphone Adaptor. One is identified with a
microphone icon. The other is identified with a headset icon. Select the appropriate
jack. Tablets will normally require the microphone jack. Note: the CTG-2 unit will
NOT work with tablets that have only a headphone jack. The tablet MUST support a
headset OR microphone.
3. Connect the other end of the Microphone Adaptor to the Windows Device. Or, if
using a laptop/desktop, connect the other end of the Phone-Plug-to-Phone-Plug
Cable to the Windows Device.
8
Page 10
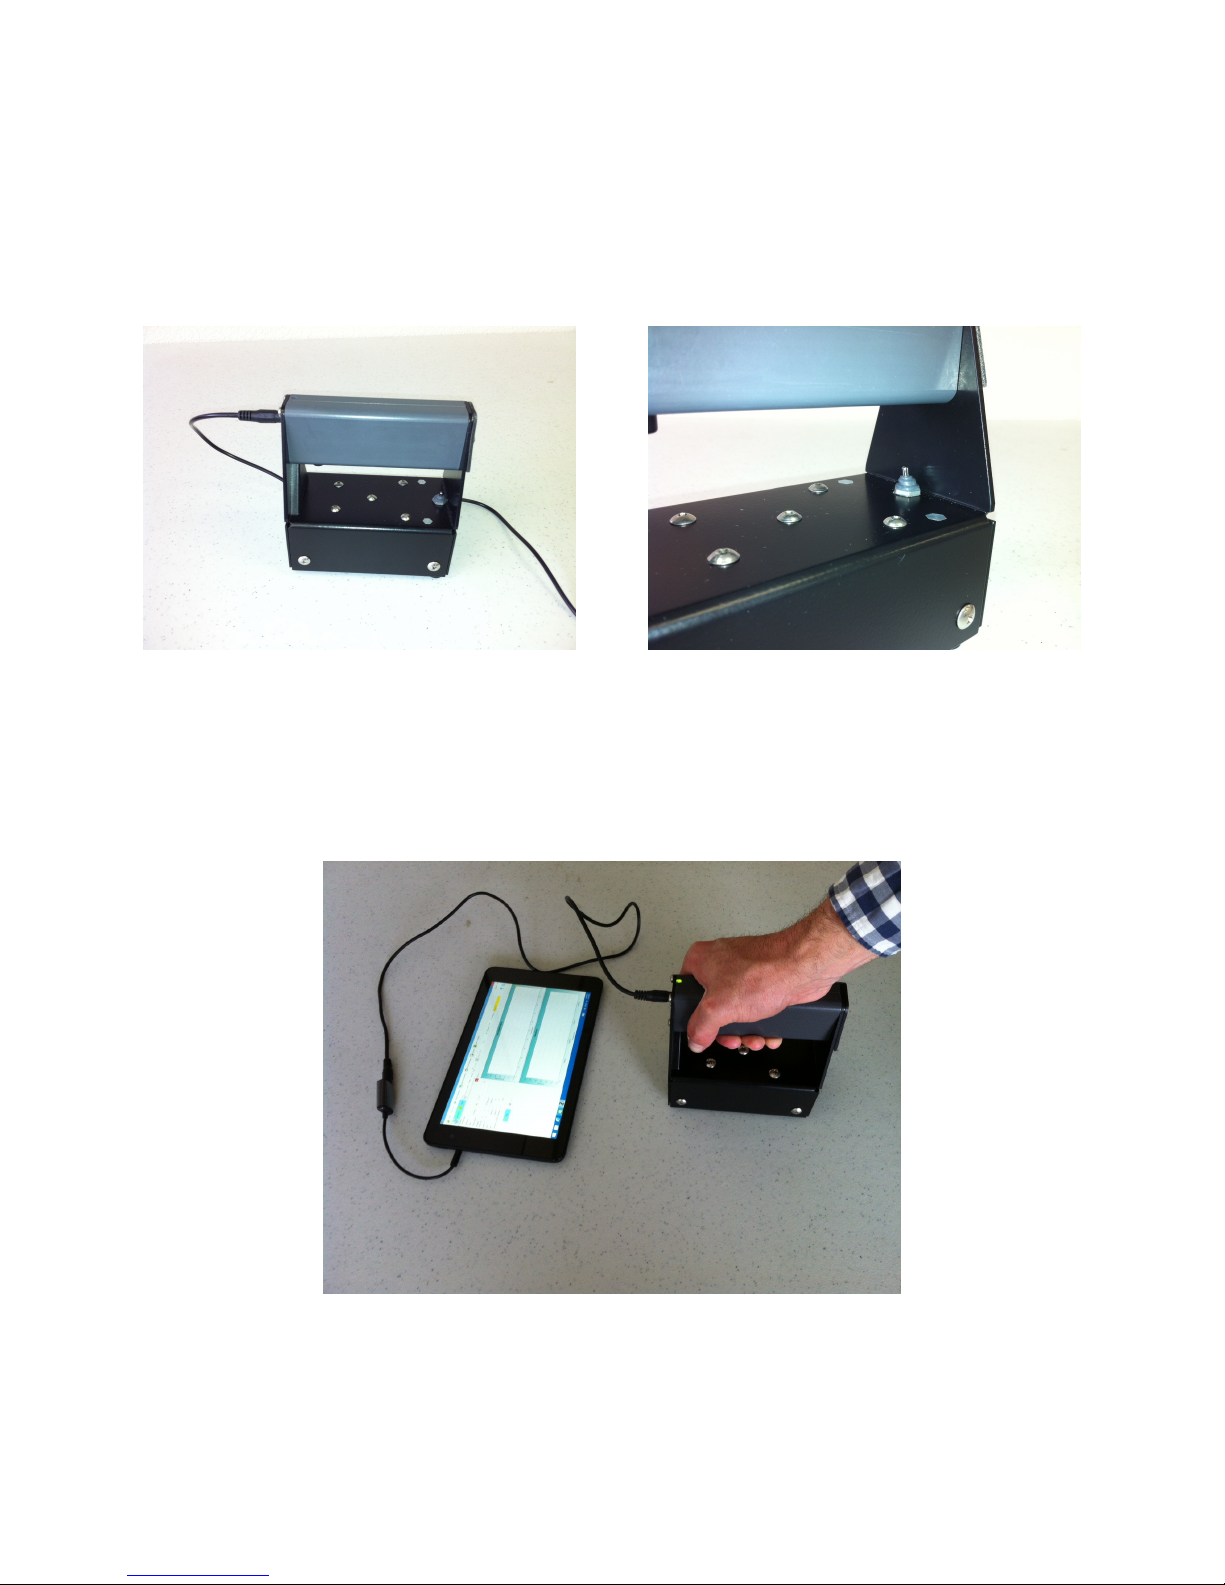
4. Flip the toggle switch on the base of the IE test head to activate the unit. When the
green light is illuminated, the IE test head is powered up and ready to collect data.
5. The picture below shows the complete CTG-2 system ready to acquire data. In this
case, an 8” tablet is being used. We recommend a minimum 8” size tablet. We
recommend that the tablet be used in “landscape” mode.
9
Page 11

3.0 WinCTG2 SOFTWARE SETUP
This section covers the steps required to install the WinCTG2 software on a tablet,
laptop or desktop computer from the supplied installation jump drive.
3.1 Prerequisite Software
Windows .Net Framework 4 is required for the WinCTG2 software and is installed
automatically with the program. The software is fully compatible with Windows 7 and
Windows 8 (32 or 64 bit) operating systems.
3.2 Software Installation
1. Uninstall any previous version of WinCTG2.
2. Using the USB to MicroUSB adaptor, connect the provided jump drive to the
Windows device. Copy the WinCTG2 Setup directory on the jump drive to the
desktop on the device. On the Windows device, open WinCTG2
Setup/Release/setup.exe. The software will be installed using a Setup Wizard.
Select “Next” as appropriate. Select “Yes” when prompted to confirm changes.
Select “Close” to exit. The default location for the software installation is “C:/Olson
Instruments/WinCTG2” unless the user changes the location during the installation
process.
3.3 Software Updates
To update the software, completely uninstall the WinCTG2 Setup software per Section
3.4 and install the new version of WinCTG2 Setup by selecting the “Setup” executable
in the “Release” directory. The program will install a shortcut on your desktop.
3.4 Software Uninstallation
The following steps are required to uninstall the WinCTG2 Software on a desktop or
laptop computer.
1. Click on “Start/Control” Panel
2. Select “Programs and Features”
3. Highlight WinCTG2 Setup, select “Uninstall”
The following steps are required to uninstall the WinCTG2 Software on a tablet.
1. Turn on tablet. The “Start” panel should present.
2. Touching the screen, flick to reach the “Apps” panel below.
10
Page 12

3. Touching the screen, flick to reach the Dell “Apps” panel to the right.
4. Select “Control Panel”.
5. Select “Programs”.
6. Select “WinCTG2 Setup”.
7. Select “Uninstall”.
8. Select “Yes” to confirm uninstallation.
9. Select “Yes” to confirm changes.
The uninstall process will begin automatically, removing all installed components
including shortcuts. This uninstall process might take up to five minutes. Do not exit the
installation until it is completed.
11
Page 13

4.0 DATA AQUISITION
This section includes instructions for data collection with the WinCTG2 Software. If you
have an area of known thickness that can be used for velocity calibration, please refer
to Section 4.3 before testing.
4.1 General Information about the WinCTG2 Software
The WinCTG2 software is comprised of 3 different panels: the Data Parameter panel,
the Filter panel, and the Waveform Data panel. Each panel (except the waveform data
panel) is collapsible if not needed (especially during the data acquisition process) to
enlarge the waveform data panel. Figure 1 below shows an overview of the program
layout. The shortcuts to turn on each panel are located on the upper right corner of the
screen. The function of each shortcut is described below:
• Toggles the filter panel on/off
• Toggles the parameter panel on/off
Filter Panel
Waveform Data Panel
Parameter Panel
Figure 1 – WinCTG2 Layout for IE Test Results
12
Page 14

4.2 IE Data Acquisition without Velocity Calibration
It is not necessary to calibrate for velocity in order to perform the Impact Echo test and
collect data using the system’s default value of 12,000 fps (3,657 m/s) as an average
velocity for sound concrete. But the operator should understand that using the default
value results in up to approximately a 10% error in the results as compared to
approximately a 2% error when the unit is calibrated for velocity at a location of known
thickness.
1. Turn on your tablet or laptop (with the hardware connected and turned on as
described in Section 2.0) and select the WinCTG2 shortcut on the desktop. The
software will open as shown in Figure 2 below. Within the Waveform Data Panel, the
top plot box shows the current time domain data and the bottom plot box shows the
frequency spectrum. Per the “Status” field in the Main Menu, the program is currently
in “Stand by” mode.
Figure 2 – Main Screen for WinCTG2 Software
2. Filename Feature: Fill in the “Date” field and “Project Name” field as desired.
3. Geometry Feature: If you have laid out a grid for data collection and want the
software to keep track of your X and Y coordinates, use the Geometry Feature to
document the coordinates. In the “Length (X)” field, enter the total length you plan to
13
Page 15

test in the X direction and in the “Length (Y)” field, enter the total length you plan to
test in the Y direction. Select the “Moving X” checkbox if you plan to move from test
point to test point in the X direction. Select the “Moving Y” checkbox if you plan to
move from test point to test point in the Y direction. In the “Start X” field, enter a
value for the start point in the X direction as well as the “Interval X” (or distance
between test points) in the X direction. Finally, in the “Start Y” field, enter a value for
the start point in the Y direction as well as the “Interval X” (or distance between test
points) in the Y direction.
Unless changed, a default value of 6 inches will be used for “Expected Concrete
Thickness”. This value is used to limit the amount of data analyzed and presented by
the software so it is important to alter this number as appropriate, however, 6 inches
is an appropriate value to use for slabs ranging in thickness from 4 inches to 8
inches.
4. At this point, the user has two options for collecting and saving data. The “Setup
Filename” option in the Main Menu can be used to set up automatic file naming for
files that will be saved (this is the suggested mode). Or the “Start” option in the
Toolbar can be used to start testing without setting up automatic file naming. When
using this mode, the user will be prompted to name each file individually. Note that
the “View” option in the Toolbar can also be used as discussed in Section 4.4 to
view data without saving or recording files.
14
Page 16

Set up Automatic File Naming: To set up sequential numbering of the files to be
collected, select the “Setup Filename” option found in the Main Menu. This will open
a dialogue box as shown in Figure 3 below. Enter the directory where the data is to
be saved along with an alphabetical prefix and a numerical suffix. (The alphabetical
prefix will remain fixed and the numerical suffix will increase with each test.) When
finished, select “Start” to close the dialogue box then select the “Start” option found
on the Toolbar to start collecting data.
Figure 3 – Set Up Filenames
15
Page 17

Start Testing without Setting up Automatic File Naming: To start collecting data
without using the “Setup Filename” option, select the “Start” option found on the
Toolbar. A “Save As” dialogue box will open as shown in Figure 4 below. Enter the
individual filename desired. When finished, select “Save” to close the dialogue box
and proceed with testing.
Figure 4 – Start Testing without Setting up Filenames
5. After selecting the “Start” option on the Toolbar, the system is now waiting to receive
data (in the form of an impact) as reported in the “Status” field which is currently in
“Ready to Test” mode. See Figure 5 below.
i
i
Some Windows devices will trigger when the “Start” or “View”
option is selected. When this happens, reject the data and
proceed with the testing instructions below.
If the IE head is repositioned after the “Start” or “View” option is
selected, data acquisition will be triggered. When this happens,
reject the data and proceed with the testing instructions below.
16
Page 18

surface.
Figure 5 – System Waiting to Receive Data
6. With the IE head powered up and the green light on the top of the handle
illuminated, press the trigger button on the underside of the handle. The unit will fire
the solenoid on the CTG-2 head and create an impact. The displacement transducer
sensor on the CTG-2 head will record the data and the software will display the data
on the screen as shown in Figure 6 below. The program is now waiting for you to
either accept or reject the data as reported in the “Status” field which is currently in
“Accept or Reject” mode.
i
When placing the CTG-2 on a test surface, place the rear feet
down first then rotate the unit down into position. This will
ensure proper contact between the sensor tip and the test
!
Gently rotate the sensor tip onto the test surface as a sudden
impact to the sensor might result in damage to the sensing
element.
17
Page 19

Figure 6 – Data Displayed with Thickness Reported above the Frequency Spectrum Plot
7. Good data can be identified by a waveform signal in the Time Domain (top plot) that
ranges from 0.1 volt to 0.8 volt AND the presence of a prominent peak in the
Frequency Spectrum (bottom plot). (In Figure 6 above, the data was collected on a
6” x 12” cylinder so there are additional resonant peaks displayed in the data.) The
following Figures 7A through 7D, demonstrate both acceptable and unacceptable
data. It is recommended to verify repeatability of results by taking at least two tests
at the same location.
i
The default value for volume (or gain) is 10. The available volume
varies in different tablets/laptops and the initial setting might not
be appropriate to collect good data. If the waveform signal does
not range from 0.1 volt to 0.8 volt, carefully adjust the volume as
described in Section 4.6 and retest. Caution must be used when
adjusting the volume as a high volume can result in noisy data.
18
Page 20

Figure 7A – Example of Good Data and a Single Prominent Peak in the Frequency Spectrum
Figure 7B – Example of Poor Data (Noise) and many Peaks/Hash in the Frequency Spectrum
19
Page 21

Figure 7C – Example of Nonexistent Data and Noise Peaks in the Frequency Spectrum
Figure 7D – Example of Good Data and Multiple Peaks in the Frequency Spectrum that might
Indicate the Presence of Multiple Cracks
20
Page 22

8. If the data is acceptable, select the green box (with a checkmark) found in the
Toolbar to accept and save the data. If the data is not acceptable, select the red box
(marked with an X) found in the Toolbar to reject the data. After you have rejected
the data, the program will wait for another impact. The program will continue to wait
after every impact until you have accepted a record. Only then will it allow you to
move on to the next test point.
9. Repeat the steps above until all the records are collected.
10. During the display of the data (before accepting or rejecting), several user options
are available to allow additional data processing and display. First, a cursor function
is available on the Frequency Spectrum (bottom plot) to allow the user to obtain the
thickness values of peaks other than the largest one. Simply click on or touch the
screen at the desired location. Next, the data can be windowed in or out by dragging
the blue or red cursor to the desired location on the Time Domain plot (top plot).
Finally, the frequency filtering can be changed by adjusting the filter bar in the Filter
Panel located above the Waveform Panel.
11. After the data has been accepted (and saved), the data can be recalled by selecting
the “Open” option found in the Main Menu then selecting the desired filename.
4.3 IE Data Acquisition with Known-Thickness Velocity Calibration
The CTG-2 measures thicknesses of concrete by measuring the time required for an
echo to bounce off the back side of the concrete member being tested. The thickness if
then computed by using this travel time along with the speed of sound in the concrete.
The speed of sound in concrete can vary over a range of 10,000 to 14,000 feet per
second or 3,000 to 4,300 meters per second depending on the mix design, aggregate
type, and age of the concrete. Lower strength mixes typically have velocities in the
lower range, while high strength mixes have higher velocities. The default velocity used
in the WinCTG2 software is 12,000 ft/s (3,657 m/s) which is a typical value found in
normal slabs and walls with 3,000 – 4,000 psi concrete mixes. Using this velocity with
no additional calibration should give thicknesses within 10% or less of the actual value
for most concrete structures. To increase accuracy, the unit can be calibrated.
The WinCTG2 software includes a feature that allows accurate calibration of the
concrete velocity at any location where the user knows the actual concrete thickness
and can collect good-quality data. This allows the user to improve the accuracy of
readings from up to approximately a 10% error to approximately a 2% error. Typical
locations for calibration include next to coreholes, cutouts, slab edges, etc. It can also
be done on walls near holes or edges, or other known-thickness features that were
placed with the same concrete mix as the structure being tested. To use, select the
21
Page 23

“Calibration” option on the Toolbar. This will open a “Calibration Form” dialogue box as
shown in Figure 8 below.
Figure 8 – Calibrate for Velocity at Location of Known Thickness
Enter the value of the thickness measured at the test location. If you want to save the
calibration file, select “Yes” and save the file, giving it a name like “cal1”. Otherwise,
select “No” if you don’t want to save the file.
At a location 6” – 12” from the known thickness location, press the test head firmly
against the test surface and press the trigger button on the underside of the handle. The
solenoid in the test head will immediately fire and a waveform will be collected. The data
should show a clear, prominent IE echo peak and corresponding velocity. When you
accept the data, a small dialogue box will appear and report the velocity as shown in
Figure 9 below. If you want to accept this value, select on “Yes” and the velocity will be
changed in the “Vel” field. If you don’t want to accept this value, select “No” and the
velocity will not be changed.
22
Page 24

Figure 9 – Calibrate for Velocity at Location of Known Thickness
The velocity calibration mode can also be used to measure relative velocities of
concrete in a member with known thicknesses (such as a wall) to find degraded or lowstrength zones.
4.4 View Mode
View mode can be used when it is not necessary to save your data files or if you want to
perform a quick succession of tests to scope out a job before you start saving data. To
use, select the “View” option on the Toolbar. Note that the “Status” field will report that it
is in “Ready to Test” mode. The system is now waiting to receive data (in the form of an
impact). With the IE head powered up and the green light on the top of the handle
illuminated, press the trigger button on the underside of the handle. The unit will fire the
solenoid on the CTG-2 head and create an impact. The displacement transducer sensor
on the CTG-2 head will record the data and the software will display the data on the
screen as shown in Figure 10 below. The program is now waiting for you select the
“View” option again for further testing. When you are ready to start to saving data, select
the “Start” option or “Setup Filename” option and proceed with testing according to
Section 4.2 or 4.3.
23
Page 25

Figure 10 – Testing in View Mode
4.5 Thick Concrete Testing
The CTG-2 is primarily designed to measure concrete thicknesses ranging from
approximately 3.2 inches (8.1 cm) to about 20 inches (50.8 cm), however, it is possible
to measure thicknesses up to 6 feet (2 m) by using the following procedure:
First, change the “Expected Concrete Thickness” Value (found in the Geometry Feature
on the Parameter Panel) from the default value of 6 inches (152.4 mm) to a number that
represents the approximate expected thickness of the member you are testing.
Now, start the testing using one of the three test mode options (Setup Filename, Start or
View). With the IE head powered up and the green light on the top of the handle
illuminated, press the unit firmly against the concrete member to be tested and use a
small external hammer to impact the top of the concrete. The displacement transducer
sensor on the CTG-2 head will record the data and the software will display the data on
the screen.
When testing thick concrete, it is important to select the proper hammer to obtain the
best quality data. For tests on concrete expected to be between 2 and 3 feet (0.6 to 1m)
thick, a 1 pound (0.5 kg) steel hammer is the best choice. For thicker structures, use of
a 3 pound (1.5 kg) or larger hammer will result in clearer data.
24
Page 26

4.6 Units
The units can be changed from Metric to English or vice versa during data collection.
Select the “Unit” option found on the Main Menu, as shown in Figure 11 below, to
change the units.
Units
Figure 11 – Units
4.7 Volume
The volume (or gain) can be changed during data collection by adjusting the green
“Volume” option arrows upward or downward or by typing a new value in the “Volume”
field found on the Toolbar, as shown in Figure 12 Below.
Figure 12 – Volume
Volume
4.8 Save Parameters
The parameters (such as “Expected Concrete Thickness” and “Velocity”) can be saved
by selecting the “Save Parameters” option found in the Main Menu as shown in Figure
13 below. Upon exiting the program, you will get another opportunity to save
parameters. Be careful when you save parameters; they will be saved by the program
for future use the next time you open the software. If you have calibrated for velocity,
this velocity may not be valid for your next job.
Figure 13 – Save Parameters
25
Page 27

4.9 Reset Parameters
To return the parameters to the factory settings, select the “Reset Parameter” option
found in the Main menu as shown in Figure 14 below.
Figure 14 – Reset Parameters
4.10 Operation Notes and Tips
Concrete Thickness Readings: The CTG-2 is primarily designed to work on plate-like
structures with dimensions that are at least 6 times the thickness. Structures which are
block-like will give unreliable readings due to additional resonances present in the
structure. When testing slabs or walls, it is important to check the Frequency Spectrum
plot to assure that a prominent peak has been selected by the software.
Expected Concrete Thickness: Within any concrete structure, there might be
additional resonances present. To minimize the chance for false readings, the CTG-2
requires an “Expected Concrete Thickness” value from which the default filter frequency
value is computed. This limits the thickness range of the CTG-2 and attenuates
frequencies outside the range of interest. When changing this value, be certain to exit
the field to ensure that the value is accepted (use tab to exit or click on another field).
Solenoid Positioning: The automatic solenoid impactor must be positioned over an
even concrete surface. If the solenoid is positioned over a hole/depression or over a
bump/high spot, unreliable results may occur.
Delamination Conditions: If the user attempts to measure thin concrete that is outside
the range of the CTG-2 unit (indicated by a hollow, drummy noise at the time of impact),
multiple peaks will be displayed in the Frequency Spectrum plot. Delamination
conditions may be a result of thin concrete or damaged, cracked concrete. These sorts
of results will also appear if a test is attempted on a table top or metal surface, or if a
test is done through unbonded tile or other topping material.
Thick Concrete: If the user attempts to measure thick concrete that is outside the
range of the CTG-2, multiple invalid peaks might be displayed in the Frequency
Spectrum plot.
Typical Velocity Ranges: If a location of known thickness is not available, the
accuracy of the thickness readings can still be improved over the default velocity of
12,000 fps by inputting a typical value from the table below based on the estimated
strength of the concrete.
26
Page 28

2,000 – 3,000 psi: 11,000 fps
3,000 – 4,000 psi: 12,000 fps (default value)
4,000 – 6,000 psi: 13,000 fps
6,000 – 8,000 psi: 14,000 fps
Note that these values are general guidelines which will increase the accuracy of the
measurements to 5% of full scale for cases where a direct calibration cannot be done.
Note that the accuracy of the unit improves to 2% if a direct calibration can be done.
Pan Pour: When testing a corrugated pan pour slab, test in a straight line that is
transverse to the direction of the corrugations, making note of the “thinner” concrete
zones and the “thicker” concrete zones. Note that the areas between the thin zones and
thick zones may produce data with two peaks or more. Data from these areas will
probably not be useful. After the thick zones have been identified, test parallel to the
corrugations in the thick zone if you want to identify the maximum thickness of the pan
pour. Position the axis of the CTG-2 unit parallel to the direction of the corrugations.
Calibration of the CTG-2 on slab on metal deck (pan deck) concrete: The CTG-2
has the greatest accuracy (typically 2%) if a test at a known-thickness location is
conducted and used to calibrate the concrete velocity. However, for the special case of
pan-deck slabs, it is also possible to obtain a reasonable calibration (typically about 4%
or better) by using the known dimensions of the metal deck pan.
To measure the velocity of the concrete in a pan deck slab, take a minimum of two
thickness readings using the default velocity value of 12,000 ft/sec. One should be
centered over a “Thick” part of the slab (D1 below) and the other centered over a “thin”
part of the deck (D2 below). Find these locations by performing a series of close-spaced
(0.5 to 1 inch) tests along a line to find points which are at the centers of typical thick
and thin sections of the slab. Then, using the known deck height variation (H1 as shown
below, from specifications or from direct measurement on the slab bottom), use the
following equation to compute the calibrated velocity (Vc):
Vc = 12,000 * (H1/(D1-D2))
(where 12,000 fps is the default velocity and Vc is the new calibrated velocity)
27
Page 29

Concrete
Top of
H1
D2
Metal Pan
D1
Software Troubleshooting: If the software does not work as expected, the best
recourse is to reset the parameters, close the program and restart the program.
Signal Troubleshooting: If the CTG-2 unit is operating correctly (with the green light
illuminated on the handle) and ‘no data’ or ‘noisy data’ is being received when the status
bar reads “Ready to Test”, check for the following:
1. Make sure you are using the Microphone Adaptor, if necessary. The Microphone
Adaptor might not be necessary on a laptop/desktop but will probably be necessary on
a tablet.
2. If you are using the microphone adaptor, make sure that it is plugged into the
Windows 7 device, not the CTG-2 unit.
3. If your data does not show a clear, prominent peak in the Frequency Spectrum
(bottom plot), check to make sure your volume is not set too high. Try lowering it to 10
and work your way up in intervals of 10 if necessary.
4. A noisy signal without a prominent peak in the Frequency Spectrum may indicate that
the concrete is too thin to test (less than ~ 3.2 inches). Verify that your unit is working
correctly by returning to a previous location that has been successfully tested.
5. A noisy signal without a prominent peak in the Frequency Spectrum may indicate that
the concrete is thicker than the range specified in “Expected Concrete Thickness”. Try
increasing this value to see if the results improve.
General Tips: Practice with your CTG-2 on a location of known concrete thickness
before you take the unit to the first jobsite. Get familiar with your equipment and know
what to expect from its performance.
General Troubleshooting: If the CTG-2 unit does not impact after pressing the trigger
button (or if the impact is not hard/loud enough), the solenoid impactor might be stuck.
Carefully pull the impactor out with your fingernails and clean with a Q-tip dampened
with alcohol.
28
Page 30

5.0 WinCTG2 SOFTWARE ANALYSIS
This section includes instructions for data analysis with the WinCTG2 Software.
5.1 Start Program
Select the WinCTG2 shortcut on the desktop. The software will open as shown in Figure
15 below.
Figure 15 - Main Screen for WinCTG2 Software
29
Page 31

5.2 Open Data Files
1. Select the “Open” option found in the Main Menu. The “Open” dialogue box will
appear as shown in Figure 16 below. Navigate to the .ctg data files saved earlier and
select the data file you want to open. After you have opened a file, the “Status” field
will report that you are in “Analysis Mode”
Figure 16 – Open File for Analysis
5.3 Filtering
Interactive filtering is implemented in this software. A Butterworth filter of 4th order is
used. The type of pass-band can be selected in the Filter Panel. The default pass-band
filter for IE data is “Highpass” which is the recommended filter for most IE situations.
The frequencies can be set using the arrows below the slider bar as shown in Figure 17
below or can be typed into the filtering fields (F1 and F2). There are three options for
pass-band filtering:
• Lowpass – Passes the frequencies below the right mark. This type of pass-band
is NOT recommended for general Impact Echo data analysis.
• Highpass – Passes the frequencies above the left mark. This type of pass-band
is recommended for Impact Echo data analysis.
30
Page 32

• Bandpass – Passes the frequencies between the left and right mark. This type of
pass-band can be used for Impact Echo data analysis if there is interference from
low frequency noise.
The following guidelines can be used for selecting appropriate filters:
1. When the expected concrete thickness is less than 3 inches, a bandpass filter of
10,000 to 50,000 Hz is appropriate
2. When the expected concrete thickness is between 3 inches and 6 inches, a
highpass filter of 6000 Hz is appropriate.
3. When the expected concrete thickness is between 6 inches and 12 inches, a
highpass filter of 3000 Hz is appropriate.
4. When the expected thickness is greater than 12 inches, a highpass filter of 1000
Hz is appropriate.
Left Mark – To set the high pass value
Right Mark – To set the low pass value Filter Pass
Figure 17 – Filter Panel
5.4 Windowing
Interactive time-domain windowing is implemented in this software. Two cursors (left
blue and right red) found on the top plot box can be dragged into the data to window the
front and back of the time domain waveform. This feature is useful to eliminate any front
interference from the solenoid (front end) and/or the interference from double hitting or
other noise (back end). Figures 18A and 18B show the effect on the frequency
spectrum before and after windowing is applied to a typical time domain data waveform
with noise present. Notice that the spectrum from the windowed time domain data in
Figure 18B is smoother than the un-windowed data in Figure 18A.
31
Page 33

Figure 18A – Time domain and Spectrum before Windowing is Applied
Figure 18B – Time domain and Spectrum after Windowing is Applied
32
Page 34

5.5 Concrete Velocity
The default concrete velocity used for concrete thickness calculation (or depth of the
echo) is 12,000 fps. This is an average velocity value for typical sound concrete. But
sound concrete velocity values range from 10,000 fps (weaker concrete) to 14,000 fps
(strong concrete). If this velocity needs to be modified, simply enter the new velocity
value in the “Vel” field found on the Toolbar as shown in Figure 19 below.
Concrete Velocity
Figure 19 – Concrete Velocity
i
Typical concrete velocity is 12,000 – 13,000 ft/sec or 3,600 – 4,000 m/s. Higher
strength concrete may have a higher velocity. Young concrete (less than 7
days old) may have a slower velocity. Poor concrete may also have a slower
velocity.
5.6 Open Next Data File
If the data filenames have a fixed alphabetical prefix and are numbered sequentially in
the suffix, it is possible to scroll quickly through the data. Note that this is the normal
way files are saved on the CTG-2. Use the buttons “Next File” and “Prev File” to quickly
open the files, as shown in Figure 20.
Quick File Opening
Figure 20 – Quick File Opening
33
Page 35

6.0 WinCTG2 SOFTWARE EXPORTING OPTIONS
This section describes options for exporting images and a summary table of test results.
6.1 Copy or Save Image
After the IE file is opened, either the top or bottom plot (Time Domain or Frequency
Spectrum) can be copied to the clipboard for easy pasting into reports or other
documents. Just right click on the desired plot (hold your finger on the screen if using a
tablet) then select “Copy” to save to your clipboard or select “Save Image As” and use
the “Save as Type” dropdown menu to save as an .emf, .png, .gif, .jpg, .tif, or .bmp for
later use.
6.2 Export Test Results to Comma Separated Format
The WinCTG2 software allows the export of test results to comma separated format
which can be entered into an Excel Spreadsheet. Select the “Export” option found in the
Main Menu and the “Export Output” dialogue box will appear as shown in Figure 21
below. Enter the desired directory then enter the alphabetical filename prefix, the first
numerical suffix, the total number of records collected under that filename setup and the
name you want to give to the file.
Figure 21 – Export Test Results to Comma Separated Format
34
Page 36

A summary table of test results will be saved in a .txt file with data arranged in columns
as shown in Figure 22 below. The column format is as follows:
1. File Name
2. X location of the test (ft or m)
3. Y location of the test (ft or m)
4. Frequency associated with the measured thickness (Hz)
5. Measured thickness (inches or mm)
The columns of information are separated by commas, so when importing the data into
a spreadsheet, be sure to click on the “commas as delimiters” checkboxes.
Figure 22 – Results Exported to Excel Spreadsheet
6.3 Export Raw Data to Comma Separated Format
The WinCTG2 software allows the export of individual waveform (raw) data in comma
separated format to an Excel Spreadsheet. After opening an existing file, click anywhere
on the waveform plot then use the hot key “W” to export. A “Save As” dialogue box will
appear on the screen. Name the .csv file and click on “Save”. The .csv file will be saved
in the same directory as the data file.
35
Page 37

7.0 WinCTG2 SOFTWARE LANGUAGE OPTIONS
The WinCTG2 Software can be operated in several different languages. To browse for
different languages, select the “Language” option located at the far right of the Main
Menu.
Language Option
Figure 23 – Language Options
36
Page 38

8.0 CARE AND MAINTENANCE
The CTG-2 unit is rugged but it is not indestructible. Certain precautions should be
taken to ensure the reliable operation of the unit.
1. Take care not to drop the CTG-2 as damage might result.
2. Do not slide sensor tip or rubber feet along the test surface.
3. Use the toggle switch on the base of the IE head to turn the unit off when not in use.
This will prolong battery life.
4. The CTG-2 should be kept clean and free of mud and dirt, as mud can interfere with
the operation of the automatic solenoid impactor and small rocks or other objects on
the sensor can result in poor data or low signal amplitudes.
5. The CTG-2 should not be exposed to direct rain or other moisture. Do not submerge
the CTG-2. If the unit falls into water, immediately remove the batteries, disconnect
the cable, remove the bottom cover, clean off any mud or dirt, and allow the unit to
dry out.
37
Page 39

APPENDIX A
_______________________________________________________
SUGGESTED WINDOWS DEVICES
The Olson Instruments CTG-2 unit should work with most desktops, laptops and betterquality tablets. The CTG-2 unit will NOT work with tablets that have only a headphone
jack. The tablet MUST support a headset OR microphone. In addition, some
inexpensive tablets that support a microphone might not have an adequate microphone.
The following is a list of tablet models that have been tested at our facility and are
known to work with the CTG-2. This list will change over time so contact us at
info@olsonengineering with questions and to report models you have found to work.
Toshiba Encore 8
Dell Venue 8 Pro 3000
Microsoft Surface Pro 3
Acer Iconia W4
We recommend a minimum 8” size tablet for the best software display. We recommend
that the tablet be used in “landscape” mode.
38
 Loading...