

Page 1
MTS TestSuite™ Fracture Analyzer User Guide
100-219-118 E be certain.
Page 2

© 2013 MTS Systems Corporation. All rights reserved.
Trademark Information
MTS is a registered trademark of MTS Systems Corporation within the United States. This trademark may
be protected in other countries.Windows and Windows NT are registered trademarks and Excel is a
trademark of Microsoft Corporation. Pentium is a registered trademark of Intel Corporation. All other
trademarks or service marks are property of their respective owners.
Proprietary Software
Software use and license is governed by the MTS End User License Agreement which defines all rights
retained by MTS and granted to the End User. All Software is proprietary, confidential, and owned by MTS
Systems Corporation and cannot be copied, reproduced, disassembled, decompiled, reverse engineered,
or distributed without express written consent of MTS.
Software Verification and Validation
MTS software is developed using established quality practices in accordance with the requirements detailed
in the ISO 9001 standards. Because MTS-authored software is delivered in binary format, it is not user
accessible. This software will not change over time. Many releases are written to be backwards compatible,
creating another form of verification. The status and validity of MTS operating software is also checked
during system verification and routine calibration of MTS hardware. These controlled calibration processes
compare the final test results after statistical analysis against the predicted response of the calibration
standards. With these established methods, MTS assures its customers that MTS products meet MTS’s
exacting quality standards when initially installed and will continue to perform as intended over time.
Manual Part Number—Publication Date—Release
100-219-118 E—August
2013—TestSuite MP 2.6 or later
100-219-118 D—September
2012—TestSuite MP 2.3
Page 3

Contents
1.0 Technical Support 7
2.0 Preface 11
3.0 Introduction 15
1.1.0 How to Get Technical Support........................................................................................................7
1.2.0 Before You Contact MTS................................................................................................................7
1.3.0 If You Contact MTS by Phone........................................................................................................9
1.4.0 Problem Submittal Form in MTS Manuals...................................................................................10
2.1.0 Before You Begin..........................................................................................................................11
2.2.0 Documentation Conventions.........................................................................................................11
3.1.0 Application Overview...................................................................................................................16
3.2.0 Overview of MTS TestSuite File Structure...................................................................................16
3.2.1.0 Project.............................................................................................................................17
3.2.2.0 Test.................................................................................................................................18
3.2.3.0 Test Denition................................................................................................................19
3.2.4.0 Test Run..........................................................................................................................20
3.2.5.0 Test Run State Colors.....................................................................................................22
3.2.6.0 Analysis Denitions.......................................................................................................22
3.2.7.0 Analysis Runs.................................................................................................................23
3.3.0 Viewing the Main Window...........................................................................................................24
3.4.0 Using the Menu Bar......................................................................................................................25
3.4.1.0 File Menu Options..........................................................................................................25
3.4.2.0 Denition Menu Options...............................................................................................26
3.4.3.0 View Menu Options........................................................................................................26
3.4.4.0 Display Menu Options...................................................................................................27
3.4.5.0 Tools Menu Options.......................................................................................................28
3.4.6.0 Preferences Menu Options.............................................................................................28
3.5.0 Using the Analysis Toolbar...........................................................................................................29
4.0 Getting Started 31
4.1.0 Begin an Analysis..........................................................................................................................32
4.1.1.0 Analyze Example Test Data...........................................................................................32
4.1.2.0 How to Open a Test and Analyze Your Test Data..........................................................32
4.2.0 Data Analysis................................................................................................................................33
4.2.1.0 Activities and Tests........................................................................................................33
4.2.2.0 Creating a New Analysis Denition..............................................................................33
4.2.3.0 Creating a New Analysis Run........................................................................................33
MTS TestSuite™ Fracture Analyzer User Guide 3
Page 4

4.2.4.0 Opening an Existing Analysis Run................................................................................33
5.0 Customizing the Main Window 35
5.1.0 Overview.......................................................................................................................................36
5.1.1.0 Understanding Views and Displays................................................................................36
5.1.2.0 Creating, Editing, and Deleting Views...........................................................................38
5.1.3.0 Organizing Views in a Display.......................................................................................38
5.1.4.0 Creating, Saving, and Editing Displays..........................................................................39
5.2.0 Conguring Chart and Table Properties........................................................................................40
5.2.1.0 Populating Charts with Data...........................................................................................40
5.2.2.0 View Properties..............................................................................................................40
5.2.3.0 Traces Properties............................................................................................................40
5.2.4.0 X-Axis and Y-Axis Properties.......................................................................................41
5.2.5.0 Line and Symbol Properties...........................................................................................42
5.2.6.0 Limit or Curve Fit Line Properties.................................................................................43
5.2.7.0 Refresh All Analysis Views...........................................................................................43
5.3.0 Charts and Tables (Views).............................................................................................................44
5.3.1.0 Array-Variable Chart......................................................................................................44
5.3.2.0 History Chart..................................................................................................................44
5.3.3.0 Hysteresis Chart.............................................................................................................44
5.3.4.0 History Marker Chart.....................................................................................................46
5.3.5.0 Drop-Line Markers.........................................................................................................47
5.3.6.0 Cycle Marker Chart........................................................................................................47
5.3.7.0 Cycle Time Chart...........................................................................................................48
5.3.8.0 Array-Variable Table......................................................................................................49
5.3.9.0 Variable Table.................................................................................................................50
5.3.10.0 Fixed-Column Boundary Table....................................................................................50
5.3.11.0 Variable-Column Boundary Table................................................................................51
5.3.12.0 Data Acquisition Variable Table...................................................................................51
5.3.13.0 Variable Table for Multiple Runs.................................................................................52
5.3.14.0 Variable-Column Table for Multiple Runs...................................................................52
6.0 Data Analysis 53
6.1.0 Analysis.........................................................................................................................................54
6.1.1.0 Analysis Procedure.........................................................................................................54
6.1.2.0 Analysis Activities.........................................................................................................54
6.2.0 Variable Table Analysis.................................................................................................................55
6.2.1.0 Changing the Value of a Variable...................................................................................55
6.2.2.0 Changing a Failure Cycle Variable.................................................................................56
6.2.3.0 Dening a Calculated Variable.......................................................................................56
6.3.0 Analyzing Multiple Test Runs.......................................................................................................57
4 MTS TestSuite™ Fracture Analyzer User Guide
Page 5

6.3.1.0 Multiple Test Runs Overview.........................................................................................57
6.3.2.0 Analyze Multiple Test Runs...........................................................................................58
6.4.0 Data Acquisition Signal Addition and Removal...........................................................................58
6.4.1.0 Adding a Data Acquisition Signal..................................................................................58
6.4.2.0 Removing a Data Acquisition Signal.............................................................................59
7.0 Variable Analysis 61
7.1.0 Variables and Functions.................................................................................................................62
7.2.0 Variables Editor.............................................................................................................................62
7.2.1.0 Editing Properties for Multiple Variables.......................................................................64
7.2.2.0 Variable Categories.........................................................................................................64
7.2.3.0 Variable Details..............................................................................................................65
7.2.4.0 Variable Properties.........................................................................................................65
7.2.5.0 Variable Calculated Properties.......................................................................................66
7.2.6.0 Variable Format Properties.............................................................................................67
7.2.7.0 Variable Range Properties..............................................................................................67
7.2.8.0 Choice Lists....................................................................................................................68
7.3.0 Variable Classes.............................................................................................................................69
7.3.1.0 Arrays.............................................................................................................................69
7.3.2.0 Array Variables...............................................................................................................70
7.3.3.0 Numeric Variables..........................................................................................................71
7.3.4.0 String Variables..............................................................................................................71
7.3.5.0 Calculated Variables.......................................................................................................71
7.4.0 Managing Variables.......................................................................................................................72
7.4.1.0 Variables Overview........................................................................................................72
7.4.2.0 New Variable Window...................................................................................................72
7.4.3.0 Creating a New Variable.................................................................................................73
7.4.4.0 Deleting a Variable.........................................................................................................73
7.4.5.0 Variable Used By............................................................................................................73
7.4.6.0 Adding a New Category.................................................................................................74
7.5.0 Variable Calculations.....................................................................................................................74
7.5.1.0 Calculation Editor Overview..........................................................................................74
7.5.2.0 Operators in a Calculation..............................................................................................75
7.5.3.0 Variable-Specic Information........................................................................................77
7.5.4.0 Calculation Functions.....................................................................................................77
7.5.5.0 Functions and Arguments in a Calculation....................................................................78
7.5.6.0 Modulus Calculation Functions......................................................................................79
7.5.7.0 Strain and Stress Calculation Functions.........................................................................80
7.5.8.0 Fatigue Life Calculation Function..................................................................................81
7.6.0 Data Acquisition Editor.................................................................................................................81
7.6.1.0 Variable Mapping...........................................................................................................82
7.6.2.0 Mapping a Signal to a Variable......................................................................................84
MTS TestSuite™ Fracture Analyzer User Guide 5
Page 6

7.6.3.0 Mapping Additional Variable Calculations....................................................................84
7.6.4.0 Tagged Blocks................................................................................................................84
7.7.0 Function Manager Overview.........................................................................................................86
7.7.1.0 Edit Function..................................................................................................................87
7.7.2.0 Function Usage and Syntax Guidelines..........................................................................88
7.7.3.0 Update All......................................................................................................................89
6 MTS TestSuite™ Fracture Analyzer User Guide
Page 7

1.0 Technical Support
1.1.0 How to Get Technical Support
Start with your manuals
The manuals supplied by MTS provide most of the inf ormation you need to use and maintain your equipment.
If your equipment includes software, look for online help and README files that contain additional product
information.
Technical support methods
MTS provides a full range of support services after your system is installed. If you ha ve any questions about
a system or product, contact Technical Support in one of the following ways.
Web site
Outside the U.S.
For technical support outside the United States, contact your local sales and service office. For a list of
worldwide sales and service locations and contact information, use the Global MTS link at the MTS web site:
www.mts.com > Global Presence > Choose a Region
www.mts.com > Contact Us (upper-right corner) > In the Subject field, choose
To escalate a problem; Problem Submittal Form
Worldwide: tech.support@mts.comE-mail
Europe: techsupport.europe@mts.com
Worldwide: 1 800 328 2255 - toll free in U.S.; +1 952 937 4000 - outside U.S.Telephone
Europe: +800 81002 222, International toll free in Europe
1.2.0 Before You Contact MTS
MTS can help you more efficiently if you have the following information available when you contact us for
support.
MTS TestSuite™ Fracture Analyzer User Guide 7
Page 8

Know your site number and system number
The site number contains your company number and identifies y our equipment type (such as material testing
or simulation).The number is typically written on a label on your equipment before the system leaves MTS.
If you do not know your MTS site number, contact your sales engineer.
Example site number: 571167
When you have more than one MTS system, the system job number identifies your system.You can find
your job number in your order paperwork.
Example system number: US1.42460
Know information from prior technical assistance
If you have contacted MTS about this problem before, we can recall your file based on the:
• MTS notification number
• Name of the person who helped you
Identify the problem
Describe the problem and know the answers to the following questions:
• How long and how often has the problem occurred?
• Can you reproduce the problem?
• Were any hardware or software changes made to the system before the problem started?
• What are the equipment model numbers?
• What is the controller model (if applicable)?
• What is the system configuration?
Know relevant computer information
For a computer problem, have the following information available:
• Manufacturer’s name and model number
• Operating software type and service patch information
• Amount of system memory
• Amount of free space on the hard drive where the application resides
• Current status of hard-drive fragmentation
• Connection status to a corporate network
Know relevant software information
For software application problems, have the following information available:
• The software application’s name , v ersion number, build number, and (if available) software patch number .
This information can typically be found in the About selection in the Help menu.
• The names of other applications on your computer, such as:
• Anti-virus software
• Screen savers
8 MTS TestSuite™ Fracture Analyzer User Guide
Page 9

• Keyboard enhancers
• Print spoolers
• Messaging applications
1.3.0 If You Contact MTS by Phone
A Call Center agent registers your call before connecting you with a technical support specialist. The agent
asks you for your:
• Site number
• Name
• Company name
• Company address
• Phone number where you can be reached
If your issue has a notification number, please provide that number. A new issue will be assigned a unique
notification number.
Identify system type
To enable the Call Center agent to connect you with the most qualified technical support specialist available,
identify your system as one of the following types:
• Electrodynamic material test system
• Electromechanical material test system
• Hydromechanical material test system
• Vehicle test system
• Vehicle component test system
• Aero test system
Be prepared to troubleshoot
Prepare to perform troubleshooting while on the phone:
• Call from a telephone close to the system so that you can implement suggestions made over the phone.
• Have the original operating and application software media available.
• If you are not familiar with all aspects of the equipment operation, have an experienced user nearby to
assist you.
Write down relevant information
In case Technical Support must call you:
• Verify the notification number.
• Record the name of the person who helped you.
MTS TestSuite™ Fracture Analyzer User Guide 9
Page 10

• Write down any specific instructions.
After you call
MTS logs and tracks all calls to ensure that you receive assistance for your problem or request. If you have
questions about the status of your problem or have additional information to report, please contact Technical
Support again and provide your original notification number.
1.4.0 Problem Submittal Form in MTS Manuals
Use the Problem Submittal Form to communicate problems with y our software, hardware, man uals, or service
that are not resolved to your satisfaction through the technical support process.The form includes check
boxes that allo w you to indicate the urgency of y our problem and y our e xpectation of an acceptable response
time.We guarantee a timely response—your feedback is important to us.
You can access the Problem Submittal Form at www.mts.com > Contact Us (upper-right corner) > In the
Subject field, choose To escalate a problem; Problem Submittal Form
10 MTS TestSuite™ Fracture Analyzer User Guide
Page 11

2.0 Preface
2.1.0 Before You Begin
Safety first!
Before you use y our MTS product or system, read and understand the safety information provided with your
system. Improper installation, operation, or maintenance can result in hazardous conditions that can cause
severe personal injury or death, or damage to your equipment and specimen. Again, read and understand
the safety information provided with your system before you continue. It is very important that you remain
aware of hazards that apply to your system.
Other MTS manuals
In addition to this manual, you may receive additional manuals in paper or electronic form.
You may also receive an MTS System Documentation CD. It contains an electronic copy of the manuals that
pertain to your test system.
Controller and application software manuals are typically included on the software CD distribution disc(s).
2.2.0 Documentation Conventions
The following paragraphs describe some of the conventions that are used in your MTS manuals.
Hazard conventions
Hazard notices may be embedded in this manual.These notices contain safety information that is specific
to the activity to be performed. Hazard notices immediately precede the step or procedure that may lead to
an associated hazard. Read all hazard notices carefully and f ollow all directions and recommendations.Three
different levels of hazard notices may appear in your manuals. Following are examples of all three levels.
(for general safety information, see the safety information provided with your system.)
DANGER:
Danger notices indicate the presence of a hazard with a high level of risk which, if
ignored, will result in death, severe personal injury, or substantial property damage.
WARNING:
Warning notices indicate the presence of a hazard with a medium lev el of risk which,
if ignored, can result in death, severe personal injury, or substantial property damage.
MTS TestSuite™ Fracture Analyzer User Guide 11
Page 12
CAUTION:
Caution notices indicate the presence of a hazard with a low level of risk which, if
ignored, could cause moderate or minor personal injury or equipment damage, or
could endanger test integrity.
Other special text conventions
Important:
Important notices provide information about your system that is essential to its proper
function.While not safety-related, if the important information is ignored, test results may
not be reliable, or your system may not operate properly.
Note:
Notes provide additional information about operating your system or highlight easily
overlooked information.
Recommended:
Recommended notes provide a suggested way to accomplish a task based on what MTS
has found to be most effective.
Tip:
Tips provide helpful information or a hint about how to most efficiently accomplish a task.
Access:
Access provides the route you should follow to a referenced item in the software.
Example:
Examples show specific scenarios relating to your product and appear with a shaded
background.
Special terms
The first occurrence of special terms is shown in italics.
Illustrations
Illustrations appear in this manual to clarify text.They are examples only and do not necessarily represent
your actual system configuration, test application, or software.
Electronic manual conventions
This manual is available as an electronic document in the Portable Document File (PDF) format. It can be
viewed on any computer that has Adobe Acrobat Reader installed.
12 MTS TestSuite™ Fracture Analyzer User Guide
Page 13

Hypertext links
The electronic document has many hypertext links displayed in a blue font. All blue words in the body text,
along with all contents entries and index page numbers, are hypertext links.When you click a hypertext link,
the application jumps to the corresponding topic.
MTS TestSuite™ Fracture Analyzer User Guide 13
Page 14

Page 15

3.0 Introduction
Topics:
•
Application Overview.............................................................................................................................16
•
Overview of MTS TestSuite File Structure.............................................................................................16
•
Viewing the Main Window......................................................................................................................24
•
Using the Menu Bar...............................................................................................................................25
•
Using the Analysis Toolbar....................................................................................................................29
MTS TestSuite™ Fracture Analyzer User Guide 15
Page 16

3.0 Introduction
3.1.0 Application Overview
This application enables standard and custom in-depth analysis of test data, including post-processing, using
basic statistical and graphical displays.The application supports test run data from the Multipurpose Elite
application and Model 793.20 Cyclic Fatigue software.
Some features of this application function the same way that they do in the Multipurpose Elite application.
To learn more about using the following features and other features that are available in both applications,
see the Multipurpose Elite User guide that is included with your MTS TestSuite installation CD:
• Managing users and roles
• Importing and exporting tests and test run data
• Converting tests and templates using the Conversion Wizard
• Sorting and filtering data in tables
• Copying values or images to the clipboard
• Using the Error List and Application Log
• Editing Specimen Geometries with the Specimen Geometry Manager
• Removing peaks and valleys deducted from noise with the Decimation Utility
• Creating diagnostic files
3.2.0 Overview of MTS TestSuite File Structure
The MTS TestSuite file heirarchy comprises sev eral individual components. Each component stores a specific
set of information. For example, a test contains a set of activities (known as the procedure), and the test run
contains the data acquisition information and variable values that were obtained when the test was run.
Furthermore, each component has a relationship with at least one other component. For e xample, the analysis
definition uses the information in the test run to create an analysis run in either the Fatigue Analyzer or
Fracture Analyzer applications.
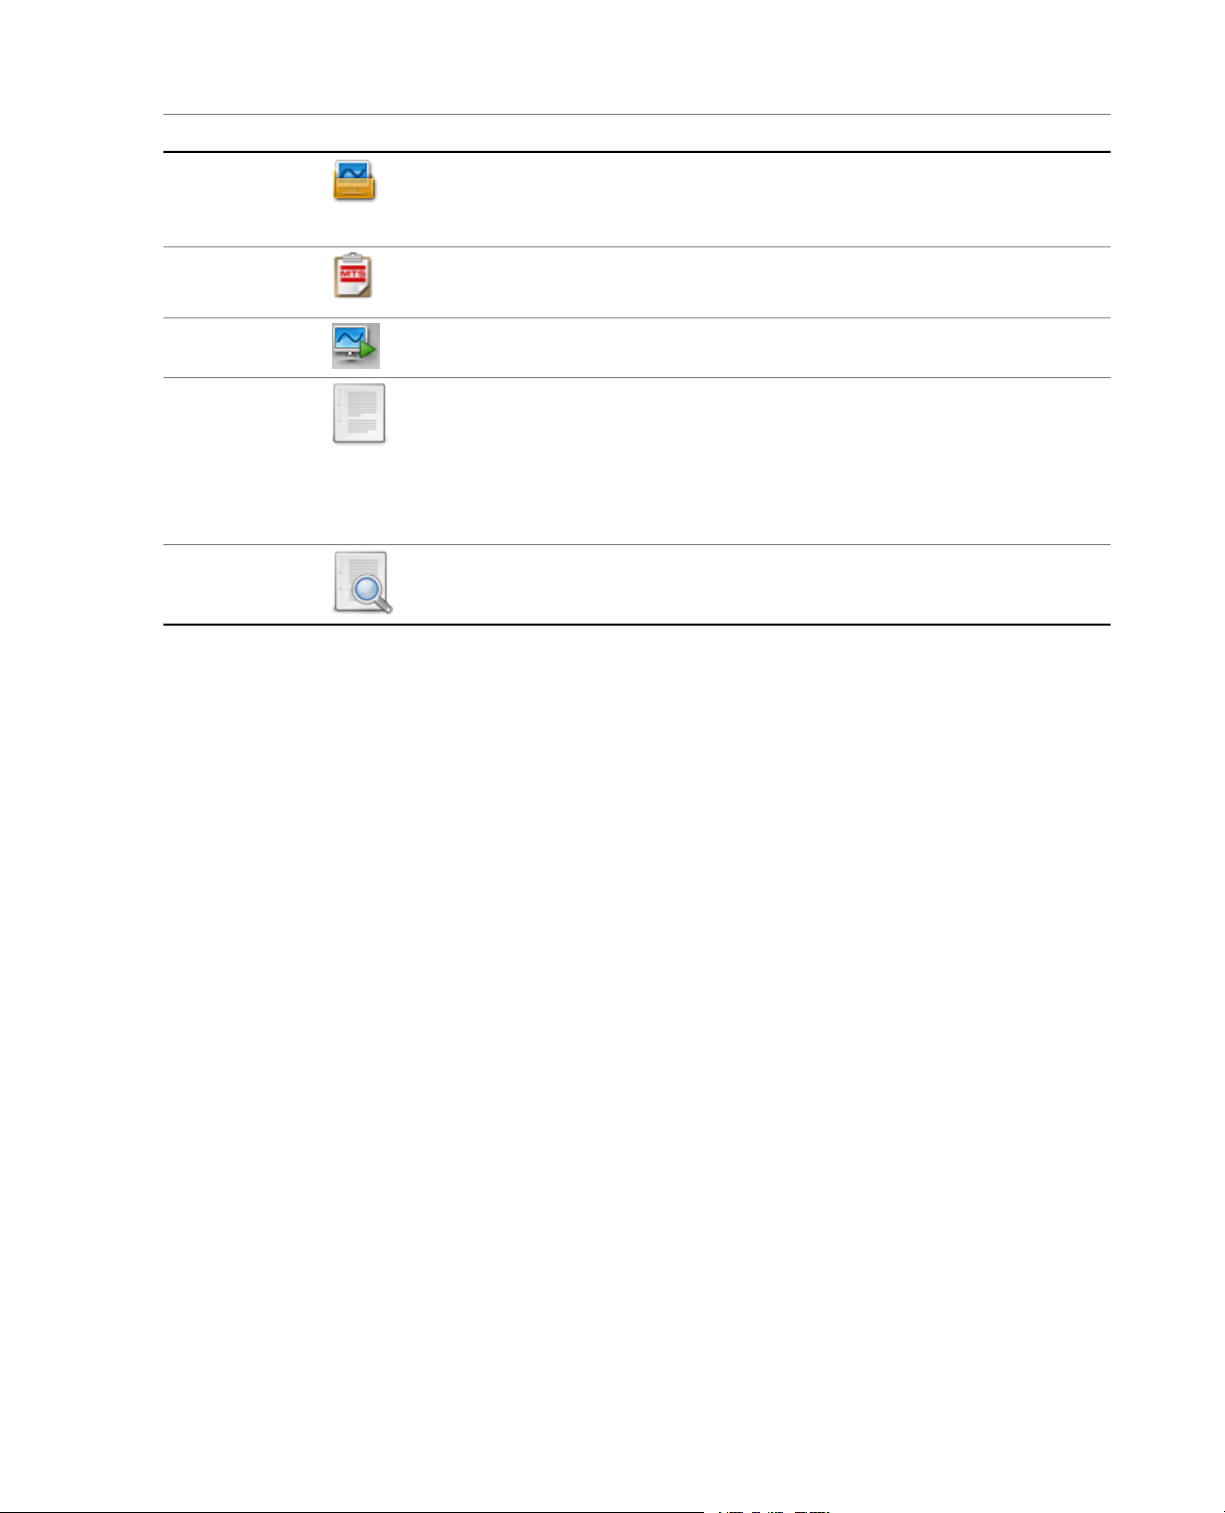
In the following table, each of the main components of the MTS TestSuite structure are described. In the
following sections of this document, the data stored in these components and the relationships between these
components is described in detail.
Components of the MTS TestSuite Architecture
DescriptionIconName
Project
A project is a collection of tests and test templates. By creating separate projects,
you can organize similar tests and test templates and various project-level
settings, such as the language or unit types used.
16 MTS TestSuite™ Fracture Analyzer User Guide
Page 17
3.0 Introduction
DescriptionIconName
Test
Test Template
Analysis
Definition
Analysis Run
A test is the core component of MTS TestSuite.The test contains the test
definition along with any test runs, analysis definitions, or analysis runs that have
been created.
Test templates eliminate the need to re-create existing information and provide
an easy way to run standard tests.
A test run contains all data that was gathered during a single run of the test.Test Run
The analysis definition is available in either the Fatigue Analyzer or Fracture
Analyzer application as an overlay to the information that was gathered during
a test run.You can customize the views and displays associated with an analysis
definition to manipulate how the test run data is presented on the screen.
Additionally , you can customiz e the variable values , DA Q mappings, and functions
in order to create analysis runs and analyze various "what if" scenarios.
The analysis run uses the analysis definition and the data in a test run to produce
a set of analysis results.
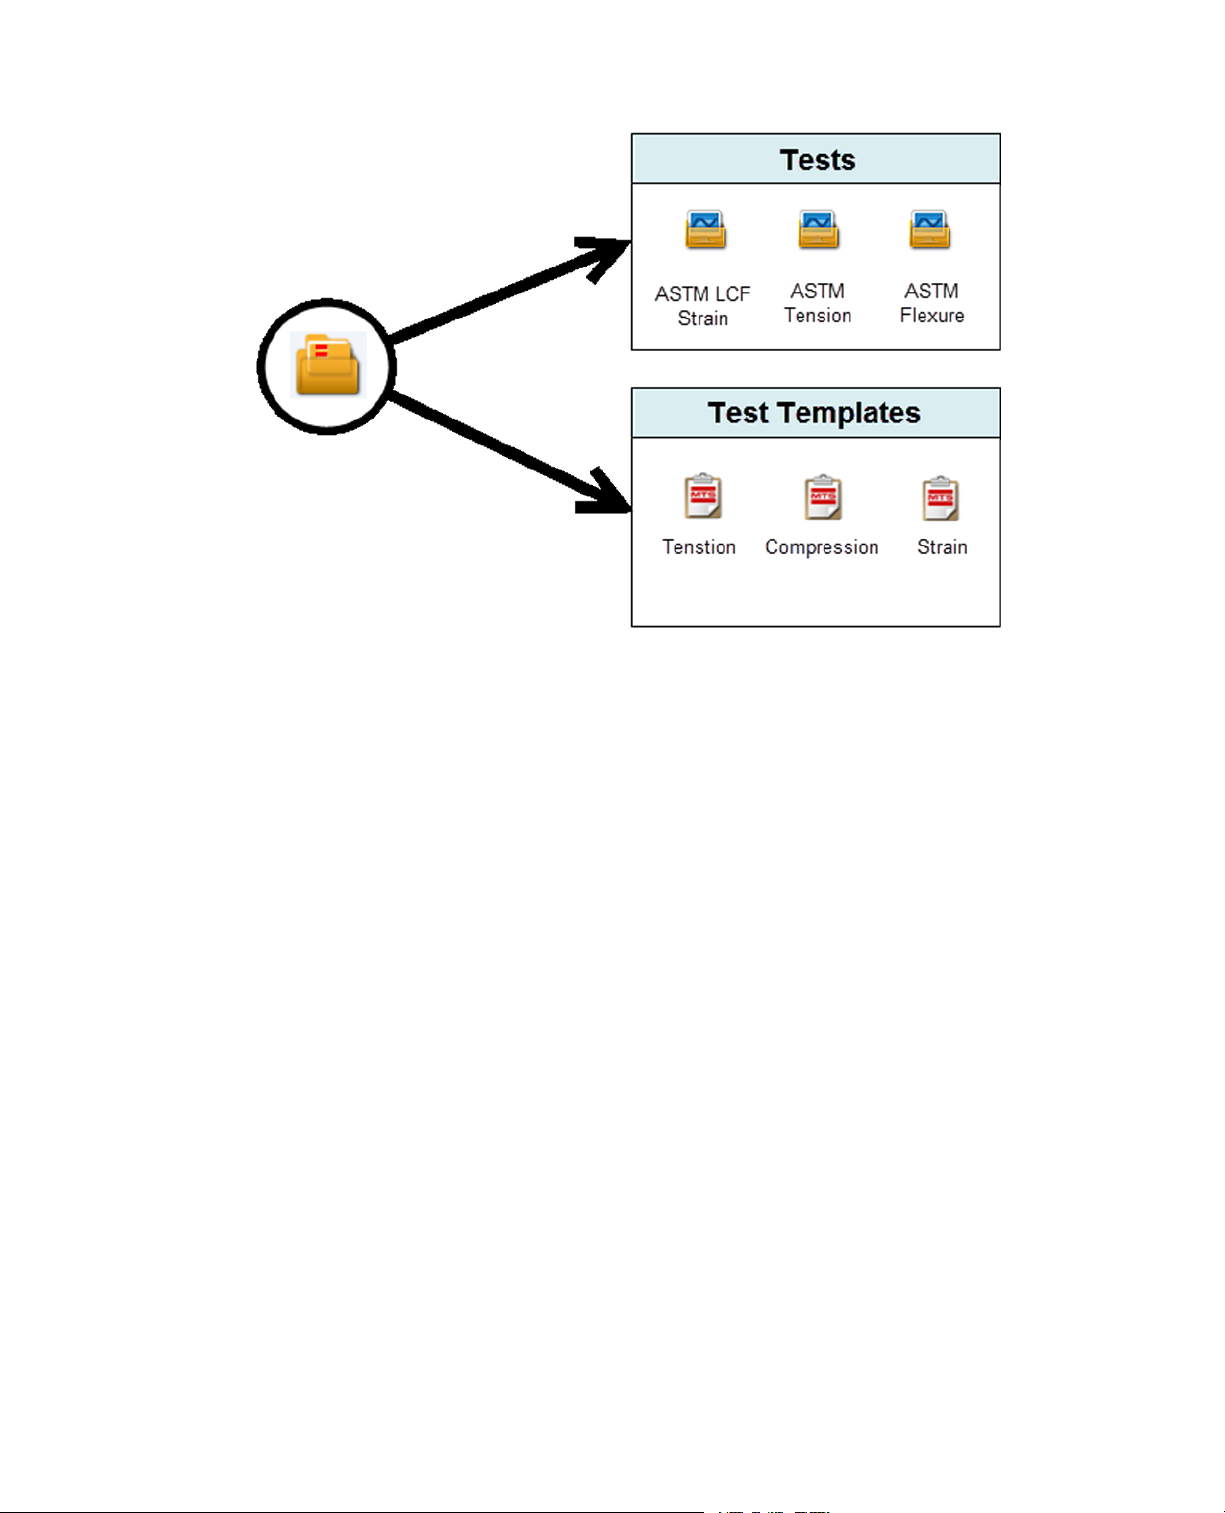
3.2.1.0 Project
A project is the highest level component in the MTS TestSuite file heirarchy. A project contains the following:
• A collection of tests
• A collection of test templates
• Project settings, such as the name and location of directories in which the tests, test templates, report
templates, external files, and data exports are stored.
T o vie w or edit your av ailable projects and their associated settings, clic k Preferences, select Configuration,
and then select the Project tab.The other tabs on the Configuration window contains settings that are
application-wide and persist regardless of which project you have selected.
MTS TestSuite™ Fracture Analyzer User Guide 17
Page 18
3.0 Introduction
A Project Contains Project Settings, Tests, and Test Templates
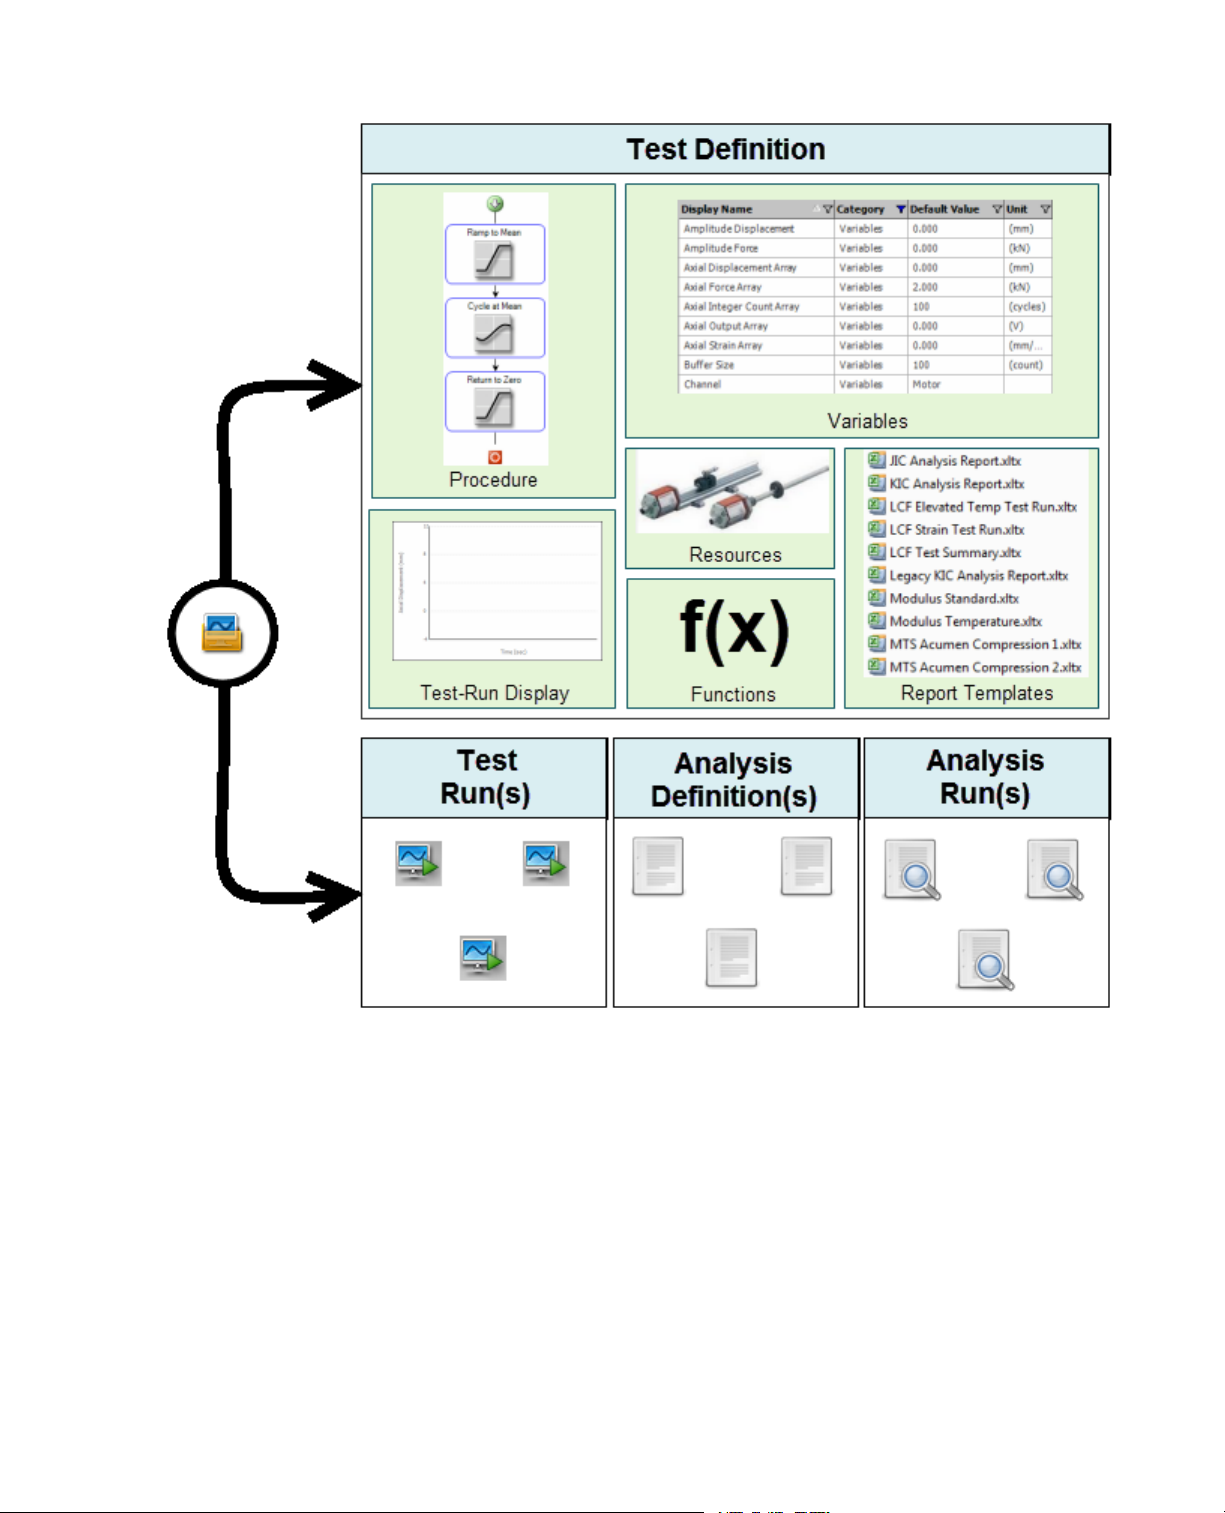
3.2.2.0 Test
A Test is stored within a project folder, and contains the following components:
• Test Definition—Contains the main components of the test, such as the procedure, variables, test-run
display, resources, functions, and report templates.
• Test Run(s)—Contains information that was gathered during the test run, such as variable values.
• Analysis Definition(s)—Contains variable definitions, functions, DAQ-to-variable mappings, and the
views and displays that organize and present the data within either the Fatigue Analyzer or Fracture
Analyzer applications.
• Analysis Runs—Uses the data gathered from test runs to show data according to the analysis definition.
18 MTS TestSuite™ Fracture Analyzer User Guide
Page 19
3.0 Introduction
A Test Contains the Test Definition, Test Run(s), Analysis Definition(s), and Analysis Run(s)
3.2.3.0 Test Definition
The test definition is stored within the test.The test definition contains the following main components that
define the test:
• Procedure: A collection of test activities that are performed step-by-step when the test is run.
• Resources: A collection of test resources mapped to the controller resources that will be used during the
test.
• Variables: Containers that can hold values that may change during the test run, such as time or axial
displacement.Variables facilitate data manipulation and communication between different components
MTS TestSuite™ Fracture Analyzer User Guide 19
Page 20

3.0 Introduction
of the test. After a test run is complete, values that are stored in variables can be changed using the
Fatigue Analyzer and the Fracture Analyzer in order to simulate various "what if" scenarios.
• Test-Run Display: A customizable user interface that shows data when the test is run.
• Report Templates: A collection of Microsoft Excel Template files that define the layout of generated
reports.
• Functions: A sequence of instructions that receive arguments and produce a result.
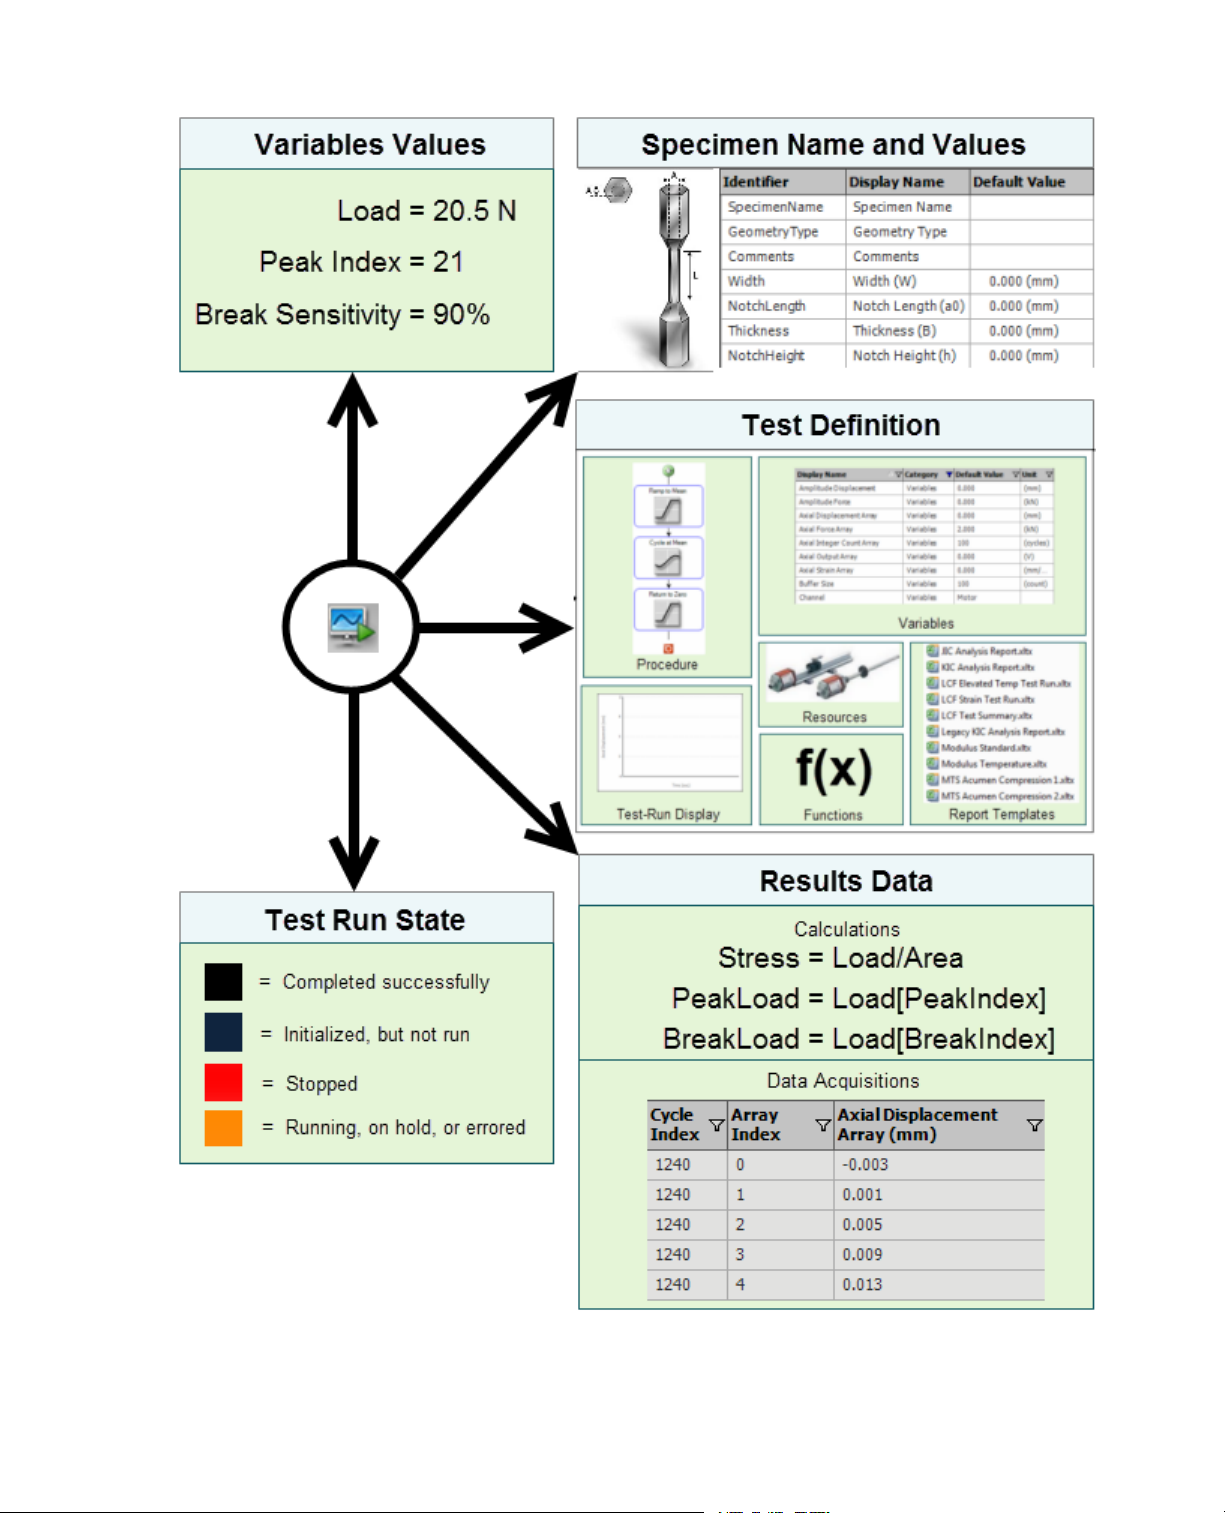
3.2.4.0 Test Run
A test run is the record of a test performed on a single, selected specimen.Test runs are stored in the test
and include:
• A copy of the test definition, including the procedure, at the time the test run is created.
• A copy of the name of the selected specimen and its values at the time the test run is created.
• Variable values during the test run.
• The state of the test run.
• Results data, such as data acquisitions and calculations.
20 MTS TestSuite™ Fracture Analyzer User Guide
Page 21
3.0 Introduction
Components of a Test Run
MTS TestSuite™ Fracture Analyzer User Guide 21
Page 22

3.0 Introduction
3.2.5.0 Test Run State Colors
The color of a test run entry indicates its run state.
Test Run State Colors
DescriptionColor
The test run completed successfully.Black
The test run initialized successfully but has not run.Dark Blue
The test run stopped.Red
Orange
The test run is running, on hold, or an error occurred. If a test run name is
orange, data may not be available. If an error occurs while the test runs, no
data is viewable. If an interruption occurs, some data may be available.
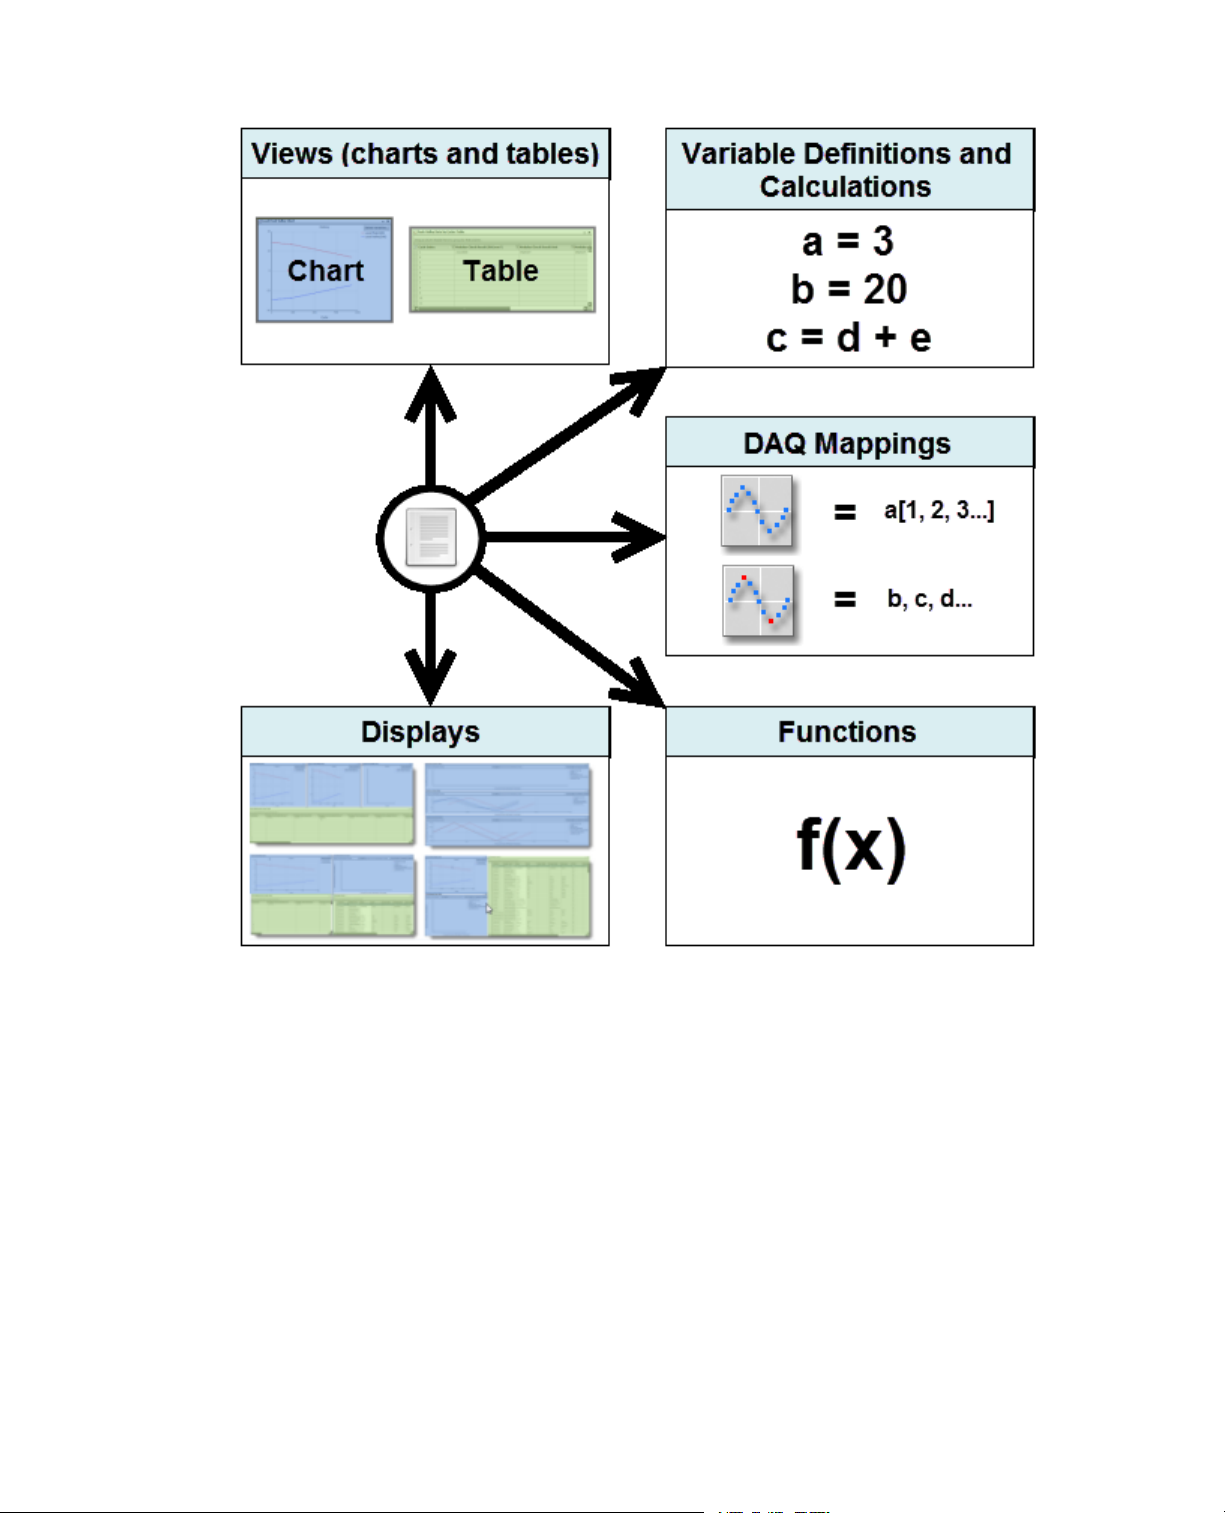
3.2.6.0 Analysis Definitions
An analysis definition acts as an overlay to the information in the test run to produce an analysis run. An
analysis definition includes user-defined views, displays, variable definitions, calculations DAQ mappings,
and functions.The analysis definition is similar to a test because it simply contains a definition of what
information will be used or populated, but it does not actually contain data or variable v alues; those are stored
in the analysis run.
Changes you make to an analysis definition are reflected in any analysis run that uses the definition. A test
can contain multiple analysis definitions.
22 MTS TestSuite™ Fracture Analyzer User Guide
Page 23
3.0 Introduction
An Analysis Definition Contains Views, Displays, Variables, DAQ Mappings, and Functions
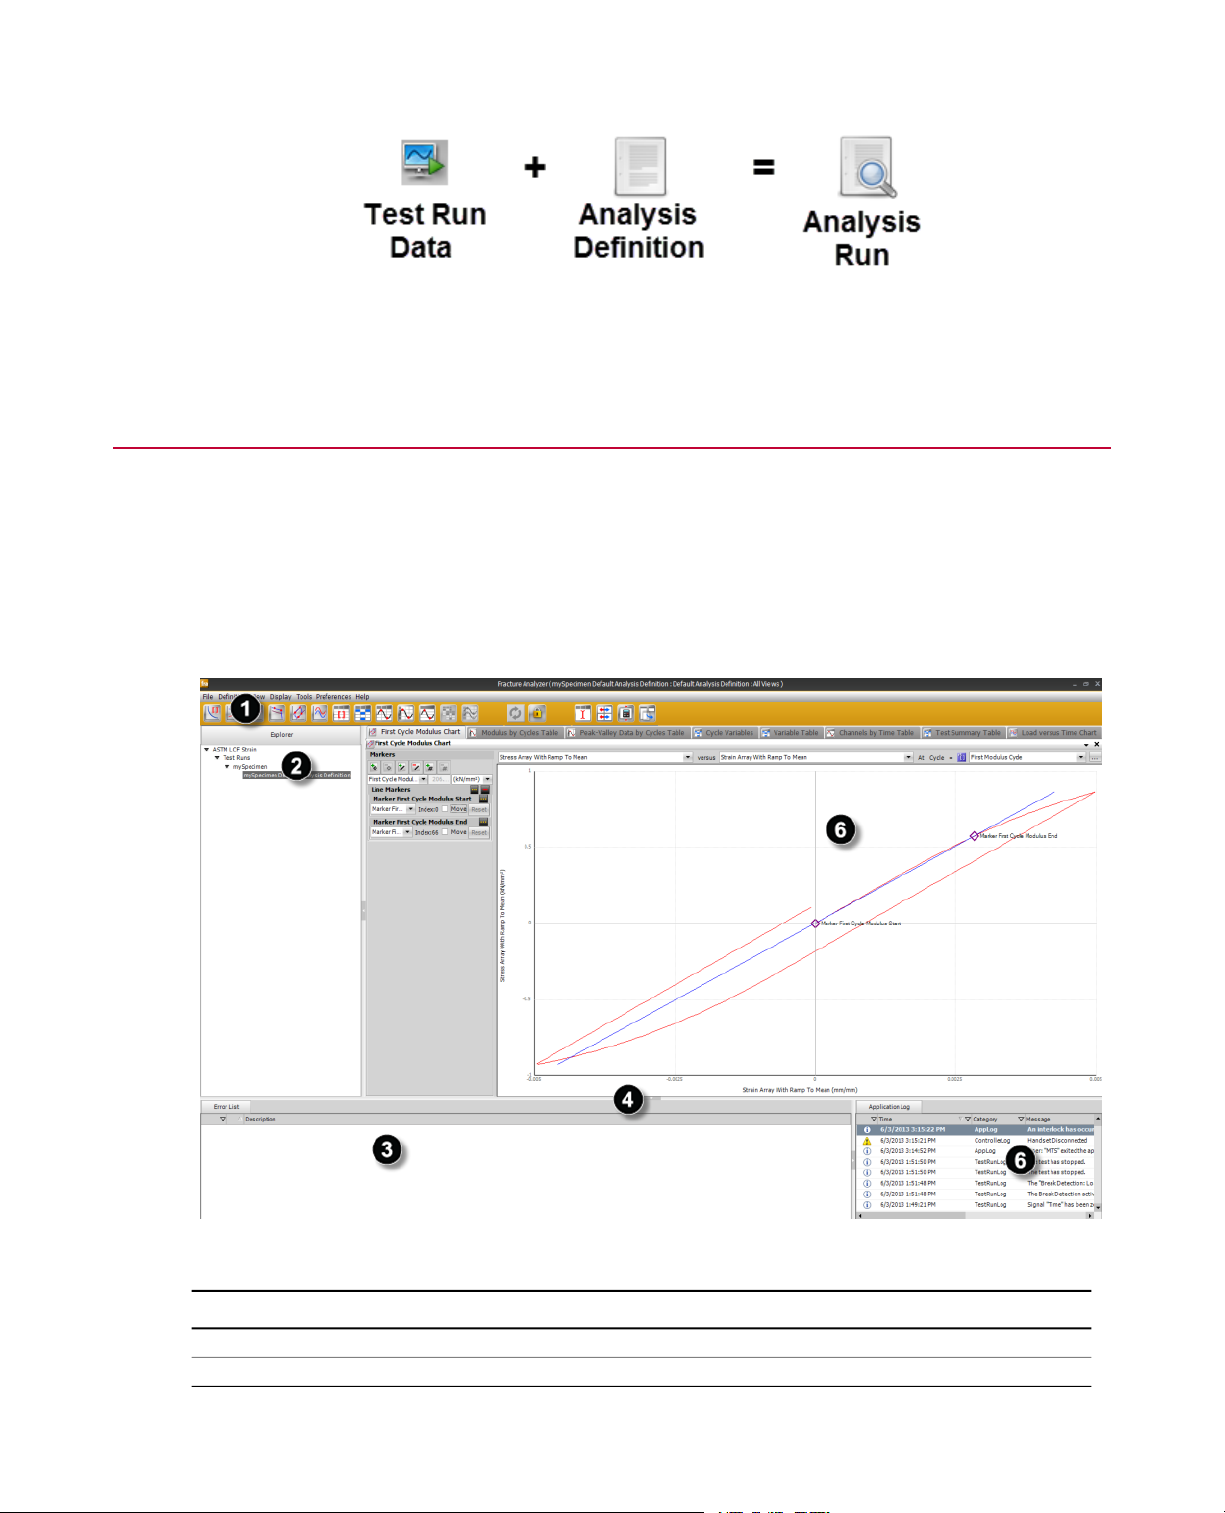
3.2.7.0 Analysis Runs
Analysis runs apply the views and variables of an analysis definition to the data from one or more test runs
stored in the same test. An analysis run does not alter the original test data, but uses the data to produce an
independent set of analysis results. An analysis run contains the analysis results and any reports generated
within the analysis run.
An analysis run does not contain the calculations, variables, or displa ys used to generate and view the results.
This information is stored in the analysis definition. If you change anything in the analysis definition, those
changes are updated the next time you vie w an analysis run based on that analysis definition. Multiple analysis
definitions can be saved and used for a given test. Additionally, multiple analysis runs can exist in a test.
When the data from two or more analysis runs are contained in the same analysis, the collection is called a
multi-run analysis.
MTS TestSuite™ Fracture Analyzer User Guide 23
Page 24
3.0 Introduction
Analysis Runs use the Analysis Definition and Test Run Data to Generate Data
3.3.0 Viewing the Main Window
The Fracture Analyzer application main window has four sections:
• The top section contains menu options and a toolbar.
• The left section contains the Explorer.
• The major portion of the window contains the work area.
• The bottom section contains the Error List panel and the Message Log.
Fracture Analyzer Application Main Window
DescriptionCallout
Menus and Toolbars1
Explorer Panel2
24 MTS TestSuite™ Fracture Analyzer User Guide
Page 25

3.0 Introduction
DescriptionCallout
Error List Panel3
Closes Error List and Message Log4
Message Log5
Work Area6
3.4.0 Using the Menu Bar
3.4.1.0 File Menu Options
Menus provide navigation to se veral user activity options .The File menu supports file-level and analysis-le vel
activities.
File Menu Options
Analyze Test Run
View Analysis Run
Close Analysis Run
Analyze Multiple Runs
Close Multi-Run
Analysis
Save As
DescriptionItem
Shows the Open Test window that contains a list of available tests.Open Test
Shows a window in which you can define new analysis runs and definitions.
The menu item is active when you highlight a test run in the Explorer panel.
Shows the properties window for the analysis run.The menu item is active
when you highlight an analysis run in the Explorer panel.
Closes an open analysis run.The menu item becomes active when you open
an analysis run.
Shows the test window that contains the list of av ailab le analysis runs. Select
two or more analysis runs for comparison.The menu item becomes active
when you highlight the Test Run element in the Explorer panel.
Closes the multi-run analysis window after you selected a multi-run analysis
to view.
Deletes the current test and all related analysis information.Delete Test
Saves the test and all related analysis information.Save
Saves the test and all related analysis inf ormation using a location and name
that you choose.
Import
• Project—Imports a project.
• Test—Retrieves a test file with a .tsproj file extension and installs it as an
analysis test.
MTS TestSuite™ Fracture Analyzer User Guide 25
Page 26

3.0 Introduction
DescriptionItem
• Test Run—Imports a test run.
• Legacy Data—Retrieves test runs, templates or files from data archived
from previous software products. For more information about importing
legacy files, see the Multipurpose Elite User guide that is included with
your MTS TestSuite installation CD.
Export
Close Test
• Test Stores an analysis test to disk as a file with a .tsproj file extension.
This option provides a convenient way to transfer test data between
workstations.
• Test Run Allows you to select the test runs that you want to export and
save them in a .tsproj file.
• Raw Data Allows you to export filtered data (data acquisition list, signal
list, and so forth) for a specific test run as a text file (tab-delimited or CSV).
Terminates an open analysis test.The menu item becomes active when you
open an analysis test.
Closes the application.Exit
3.4.2.0 Definition Menu Options
Use the Definition menu to access several managers and editors.
Definition Menu Options
DescriptionItem
Definition Manager
Data Acquisition
Editor
Opens a window that contains details of the various analysis definitions.You
can also rename or delete definitions.
Opens a window where you can create, modify, organize, and delete variables.Variable Editor
Opens a window where you can map signal data into variables that can be
used for various functions such as adding variab le mapping and calculations,
or change existing mappings.
Opens a window where you can add custom calculations.Function Manager
Opens a window where you can rename or delete views and displays.Display Manager
3.4.3.0 View Menu Options
Use the View menu to customize the data display.
26 MTS TestSuite™ Fracture Analyzer User Guide
Page 27

View Menu Options
3.0 Introduction
DescriptionItem
Returns all views to a docked position.Re-Dock All Views
Closes all views in the work area.Close All Views
Zoom
Point Picking
Format Axes
Format Line and
Symbol
Print Data
Export Data
Allows you to click and drag to select an area of a chart to zoom in to .To reset
the zoom level, right-click the chart and select Reset Zoom.
Shows vertical and horizontal guidelines that move with the cursor. Highlight
a point on the graph to show its X and Y values.
Shows the Format Axes window .You can also see this window if you right-click
in the work area of a chart.
Shows the Line and Symbol window.You can also see this window if you
right-click in the work area of a chart.
Shows the Print Preview window.You can use the zoom and print functions
for tabular data.
Shows the Save As window.You can save tabular data as a Microsoft Excel
(.xls) or other type of file.
3.4.4.0 Display Menu Options
Use the Display menu to manage saved views and displays.The names of currently available views appear
at the bottom of the menu.
Note:
Click the Display Manager button to delete displays and views.
Display Menu Options
DescriptionItem
Creates a display.Create New Display
Shows the Save Current Display window.Type a unique name and click OK.Save Current Display
Shows the Select Display window. Type a unique name and click OK.Select Display
Explorer
Shows or removes the Explorer panel. A check mark appears next to the
menu item when the panel is active.To remove or show the panel, click the
menu item.
MTS TestSuite™ Fracture Analyzer User Guide 27
Page 28

3.0 Introduction
DescriptionItem
Message Log
Error List
Shows or removes the Message Log panel. A check mark appears next to
the menu item when the panel is active.To remove or show the panel, click
the menu item.
Shows or removes the Error List panel. A check mark appears next to the
menu item when the panel is active.To remove or show the panel, click the
menu item.
3.4.5.0 Tools Menu Options
Use the Tools menu to access other MTS TestSuite applications.
Tools Menu Options
DescriptionItem
Opens the Specimen Geometry Manager window.Specimen Geometry
Manager
Multipurpose Elite
Application
Opens the Multipurpose Elite application.This option is only available if the
Multipurpose Elite application is licensed on your MTS TestSuite installation.
Fatigue/Fracture
Analyzer Application
Decimation Utility
Compare (Variable or
Function)
Opens either the Fatigue Analyzer application or the Fracture Analyzer
application.This option is only available if the both the Fatigue and Fracture
Analyzer applications are licensed on your MTS TestSuite installation.
Reduces the size of a large data file by removing data points from the original
data set.This action is irreversible. Unlike the other analysis functions,
decimating a large data file will affect the original test run data.
Creates a diagnostic file that you can send to MTS Technical Support.Create Diagnostic File
Opens the Variable/Function comparison tool. This tool allows you to easily
compare variable or function groups that are used in one or more specified
tests.
To help you identify differences in the list of variables or functions you are
comparing, click Show Only Differences.To quickly change a variable so it
matches a variable you are comparing it against, click Add Change.
3.4.6.0 Preferences Menu Options
Use the Preferences menu to edit the system configuration and manage user accounts. F or more information
about editing your system configuration settings and user accounts, see the Multipurpose Elite User Guide,
which is included with your MTS TestSuite installation disk.
28 MTS TestSuite™ Fracture Analyzer User Guide
Page 29

3.5.0 Using the Analysis Toolbar
The Analysis Toolbar allows you to click an icon to create a new chart or table, manage editors, functions,
views, and displays.
Analysis Toolbar
DescriptionItem
3.0 Introduction
New Array-Variable
Chart
New History Chart
New Hysteresis Chart
New History Marker
Chart
New Cycle Marker
Chart
New Array-Variable
Table
New Variable Table
New Fixed-Column
Boundary Table
Create a chart to show data that is collected and calculated during each test
cycle and stored in arrays.
Create a history chart to plot cycle data in relation to time or another index
type.
Create a hysteresis chart to plot the stress and strain data produced during
a test cycle.
Create a history marker chart to show general history data with markers that
indicate specific points in the data.
Create a cycle marker chart to plot the loading modulus and the unloading
modulus.
Create a multi-cycle time chart that plots array data for multiple cycles.New Cycle Time Chart
Create a table that shows the element values in one or more selected array
variables.
Create a variable table that shows the current value of the selected analysis
run variables.
Create a table that shows the values of point-by-point arrays and group
variables.
New Variable-Column
Boundary Table
Variable Table
New Variable Table
for Multiple Runs
New Variable-Column
Boundary Table for
Multiple Runs
Create a table that shows the current values of the selected boundary variables
by group.
Create a table that provides information about the data acquisition variab les.New Data Acquisition
Create a table that shows data from two or more analysis runs that were
selected as a multi-run analysis.
Create a table that shows data from two or more analysis runs that you
selected as a multi-run analysis.
MTS TestSuite™ Fracture Analyzer User Guide 29
Page 30

3.0 Introduction
DescriptionItem
Refresh All Analysis
Views
Unlock the Current
Analysis
Data Acquisition
Editor
Update all references to variables , calculation, and data acquisition definitions
using the current configuration and overridden variable values.
Allows you to select and open a different analysis run in the Explorer panel.
You can open the Variable Editor or Data Acquisitions Editor , make changes,
refresh the screen, and show updates when locked.
Create, modify, organize, and delete test variables.Variable Editor
Map signal data into variables that can be used for various functions such as
adding variable mappings and calculations, or change existing mappings.
Define functions that you can use in variable calculations and other functions.Function Manager
Rename or delete views and displays.Display Manager
30 MTS TestSuite™ Fracture Analyzer User Guide
Page 31

4.0 Getting Started
Topics:
•
Begin an Analysis..................................................................................................................................32
•
Data Analysis.........................................................................................................................................33
MTS TestSuite™ Fracture Analyzer User Guide 31
Page 32

4.0 Getting Started
4.1.0 Begin an Analysis
You can begin an analysis using a sample test to help you learn the application. If you have a test created
in a testing application that contains at least one test run with valid data, you can begin analyzing your test
results instead.
4.1.1.0 Analyze Example Test Data
To familiarize yourself with the software, begin an analysis using an example test:
1. On the File menu, click Open Test.
2. Select the Sample LCF Strain Test .
3. Click OK and then Open.The Explorer panel contains the test hierarchy.
4. Double-click the analysis run you w ant to use .The Select Display window prompts y ou to select a displa y.
The default option is All Views.
5. Click OK.The application shows the Sample LCF Strain Test main window.Tabs appear above the chart
from left to right in the approximate order of typical analysis activities.
4.1.2.0 How to Open a Test and Analyze Your Test Data
To begin analyzing your test data by opening a new test that contains one or more test runs:
1. On the File menu, click Open Test.
2. Select the name of the test and click Open.
The Explorer panel contains the test hierarchy.
3. Right-click a test run and click Analyze Test Run.
4. Type a unique name for your analysis run in the Analysis Name box.
5. If an analysis definition does not already exist, clic k in the New Definition Name bo x of the Add Definition
Name panel. Enter a unique name, and then click Add New.
6. Click Add Analysis.
7. Click OK to display the default screen area arrangement.
The view icons are active.You can select the charts and tables made available by the toolbar buttons.
32 MTS TestSuite™ Fracture Analyzer User Guide
Page 33

4.0 Getting Started
4.2.0 Data Analysis
4.2.1.0 Activities and Tests
Analysis activities include mathematical and statistical evaluation of the results obtained from the material
test of one or more specimens. An evaluation of data from multiple test runs is a multi-run analysis.
A project is a collection of settings that indicate where different items necessary for a test can be found.When
the test is opened, it opens with default settings when looking for external files and reports. It also contains
settings that indicate where the tests can be found and where to look for test templates.
Tests can be logically grouped when they contain references to the same set of external files. However, you
can open a test in a different project to change the files referenced b y the test without modifying the test itself
(files are specified relative to the directories in the project settings).
4.2.2.0 Creating a New Analysis Definition
1. Select the name of a test run in Explorer.
2. Click File > Analyze Test Run.
3. Enter the name of the new analysis definition in the New Definition Name box and click Add New.
4.2.3.0 Creating a New Analysis Run
1. Select the name of a test run in Explorer.
2. Click File > Analyze Test Run.
3. Enter the name of the new analysis run in the Analysis Name box. Select a run name and analysis
definition, then click Add Analysis.
4.2.4.0 Opening an Existing Analysis Run
1. Select the name of a test marked with a + in Explorer and click the + to expand the list.
2. Double-click the name of the analysis run to open it.
MTS TestSuite™ Fracture Analyzer User Guide 33
Page 34

Page 35

5.0 Customizing the Main Window
Topics:
•
Overview................................................................................................................................................36
•
Configuring Chart and Table Properties.................................................................................................40
•
Charts and Tables (Views).....................................................................................................................44
MTS TestSuite™ Fracture Analyzer User Guide 35
Page 36

5.0 Customizing the Main Window
5.1.0 Overview
5.1.1.0 Understanding Views and Displays
Within the application's main window, data is shown in Charts and Tables. Charts and tables may also be
called Views.Views contain cycle selection settings and analysis variables mapped to test run variables.The
content of each view is context-specific and depends on the property settings that are selected for the view.
Chart and Table
You can customize which views appear in the main window along with the size, location, and shape of each
view. For example, if you want to examine the peak-valley data that was acquired during your testing, you
might add the following views to the main window:
• Load Peak Valley Chart
• Stress Peak Valley Chart
• Strain Peak Valley Chart
• Peak-Valley Data by Cycles Table
After you add these four views, the main window may look like the following:
36 MTS TestSuite™ Fracture Analyzer User Guide
Page 37

5.0 Customizing the Main Window
Four Views Containing Peak-Valley Data
When you are finished resizing the views to your liking, you can save the current on-screen presentation of
views as a Displayso that you do not have to recreate it in the future. A display is simply a certain organization
and presentation of different views.When you save the display, the size, shape, and location of each view
within the display is saved.When you create new displays, you can also re-use existing views that you
previously created. Additionally, each view can be configured separately in multiple different displays.
You can create and save sev eral different displa ys to meet v arious analysis needs. F or example , the f ollowing
image contains four different displays showing various data:
Examples of Various Displays
MTS TestSuite™ Fracture Analyzer User Guide 37
Page 38

5.0 Customizing the Main Window
5.1.2.0 Creating, Editing, and Deleting Views
When you create a new view, it is stored in the analysis run. If you delete a view, no change is made to any
display that contains the view. The only change is that the display no longer contains the view. Although the
application saves the view, the application does not save the original content. If you modify the analysis
definition to use new variable values, the presented content changes.
You can customize certain properties of a view, such as the thickness and color of lines used in charts or the
visible columns in a table.When you sav e the displa y (using the Displa y menu), these properties of the view
are also saved. Other properties, such as the variab le values that populate data in a chart or table, are stored
in the analysis run; not the view or display. Because the view retrieves the variable values from the analysis
run, the data in the view will refresh when the variable values change.
• To create a new view, click a view icon in the analysis toolbar and enter a name for the new view.
• To customize which views appear in the current display, save a display, click the Display menu, and then
enable or disable the desired views.
• To rename or delete a display, select Definition > Display Manager. In the Display Manager, select the
display and click Rename or Delete directly below the Displays panel.
5.1.3.0 Organizing Views in a Display
There are several w ays to organize views in a displa y.When you click the window title bar and drag the view,
the view remains where it is positioned when you release your mouse b utton.Y ou can drag an y side or corner
to change the shape and size of the frame. As you move the view, transparent positioning arrows appear on
the screen.When your mouse pointer reaches a positioning arrow , a portion of the display becomes highlighted.
To dock the view in that area, release your mouse button.
To create new displays, save current displays, or select existing displays, click Display on the toolbar.To
manage views and saved displays, click Definition > Display Manager to open the Display Manager.
Tabbed display
Within a display, you can show multiple views. Multiple views can be arranged using tabbed, split-screen, or
undocked (independent) configurations. In a tabbed configuration, click the tab that contains the view name
to make it prominent.
Tabbed Display
Split-screen displays
In a split-screen configuration, all views are equally prominent.To create a split-screen configuration, click
the drop-down button in the upper right-hand corner of the display and select Floating or double-click the
window title bar.The window changes size and location on the screen. Drag the window with your cursor to
the new location. Repeat for additional views.
38 MTS TestSuite™ Fracture Analyzer User Guide
Page 39

5.0 Customizing the Main Window
Split-Screen Display
Undocked displays
When an undocked display is closed, only the window size is retained.When a display is reopened on a
dual-screen system, the application opens on the device to which the mouse points.
5.1.4.0 Creating, Saving, and Editing Displays
A display includes one or more views and the location and size of the vie w(s) in the main windo w .Your saved
displays are stored in the analysis definition and are immediately propagated to all existing analysis runs that
are based on the analysis definition.
When you save a display, the views in the display are not saved separately. If the view changes, the display
changes. No Undo or Back function is available. If your intention is to save the exact display for future
reference, you must store your view and create a new view for use with any value changes.To retain your
views and displays, save the test before it is closed. If the test is not saved, the application discards new
views and displays.
• To open a saved display, select the name listed in the Display menu.
• To save a display, select Display > Save Current Display.
• To rename or delete a display, select Definition > Display Manager. In the Display Manager, select the
display and click Rename or Delete directly below the Displays panel.
Use the Display Manager to rename and delete displays. Select the view or display and click Rename or
Delete directly below the Views or Displays panel.
MTS TestSuite™ Fracture Analyzer User Guide 39
Page 40

5.0 Customizing the Main Window
5.2.0 Configuring Chart and Table Properties
5.2.1.0 Populating Charts with Data
Some charts, such as the Load vs.Time and Hysteresis charts, allow you to specify which cycle numbers
will show in the chart. Other charts, such as Load Peak-Valley and Strain Peak-Valley charts, allow you to
specify which cycle variables will be used to populate the charts data. For example, if you select the Failure
Cycle variable, the cycle in which a failure occurred will appear in the chart.
To choose which cycles or variables you want to see data for, click either the Numeric or Variable button
located at the top-right area of the chart. In the window that appears, click the cycle number or variable and
then click the right-arrow button to move a cycle number or variable to the Selected panel.
To move multiple items, drag the cursor over two or more items while you press the left mouse button.You
can also click two individual items while you hold the Shift key to form a range, or click several individual
items while you hold the Ctrl key.
5.2.2.0 View Properties
Customize and display charts and tables through their properties panel. For charts, the Format Axes and
Format Line and Symbol options are available from the Vie w menu or from a conte xt menu that is a v ailab le
when you right-click a chart.
Table columns and rows can be grouped, sorted, and filtered. Changes you make to the table occur
immediately.
5.2.3.0 Traces Properties
Traces
DescriptionItem
Traces
Lists the names of the variable that is selected for the traces. A trace is the
representation of a series of values plotted against another series of values.
Depending on the type of view, you can plot signal or variable data on either
the Y- or X-axis. If you define more than one trace on an axis, all the traces
must have the same dimension. For example, you cannot add a force signal
trace and a displacement signal trace together on the Y-axis. If you define
more than one trace on an axis, a legend is displayed by default.You can
use the Hide Legend option to hide the legend.
If no signal is selected for the Y Signal trace, the box shows Undefined
Variable.
Color
40 MTS TestSuite™ Fracture Analyzer User Guide
Use the color that appears or click the drop-down button and select a color
for the selected trace.
Page 41

5.0 Customizing the Main Window
DescriptionItem
Y Array
Point Pick
Assign an array to the selected trace that is added on the Y axis. Click the
drop-down button for a list of a vailable resource arra ys .When a second trace
is added to a Y axis, the signal list is filtered to only show arrays.
Clear the check box to use the index of the array for the X axis.X Array
Select the box, click the drop-down button, and select an array to plot on the
X axis.
Shows vertical and horizontal guidelines that move with the cursor. Highlight
a point on the graph to show its X and Y values.
Edit the size, color, location, and border of the charts title and legend.Titles and Legend
5.2.4.0 X-Axis and Y-Axis Properties
X-Axis and Y-Axis Properties
DescriptionItem
Display Unit
Select a display unit for the selected trace signal.The list only shows the set
of units that are compatible with the dimension of the signal that is assigned
to the selected trace.
Mean or Amplitude
Log Scale
Blank is the default value.
Set the display range of the Y axis to the maximum or minimum values.Maximum or Minimum
Click the corresponding button to use this feature.
To have the software calculate the maximum or minimum value(s) of the Y
signal and then set the maximum or minimum display range to the value(s),
click to clear the required check boxes.
To manually set the maximum or minimum display range for the Y axis, select
the required check box es and then specify the maxim um or minimum v alues .
Set the display range of the Y axis to the amplitude or mean values. Amplitude
is a plus or minus display range. Mean is an offset, and the amplitude is relativ e
to the mean.
• Click the corresponding button to use this feature.
• Click to clear the check box(es) to have the application set the amplitude
or mean display range to the amplitude or mean value(s) of the X signal.
• Select the check box(es) and then specify the amplitude or mean values
to manually set the amplitude or mean display range for the X axis.
Toggle between linear scale and log scale for the axis. Select the check box
for logarithmic scale. Leave the box blank for linear scale.
MTS TestSuite™ Fracture Analyzer User Guide 41
Page 42

5.0 Customizing the Main Window
DescriptionItem
Expand Only
Select the check box to allow a range to automatically expand if the data
exceeds the maximum and minimum ranges.The chart does not rescale to
a smaller range.
5.2.5.0 Line and Symbol Properties
Line and Symbol Display Properties
Opacity
Draw Line
Symbol Type
Symbol Size
DescriptionItem
Adjust the opacity to better see through traces when they overlap. If you set
the opacity to a lower value, it makes the trace more transparent.
Select this check box to dra w lines between data points . Clear the Draw Line
check box and clic k OK to only show data points if a Symbol T ype is selected;
otherwise, the trace is not drawn.
Select the thickness of the lines from 1 to 10 points.Line Thickness
Select the line style as solid, dotted, or dashed.Line Type
Select the type of symbol to mark the location of data points. If you do not
want to mark the data points with symbols, choose the blank selection in the
list.
Select the size of the data point symbols.To automatically size the symbols,
select the multiple size image, which is the first item in the drop-down list.
42 MTS TestSuite™ Fracture Analyzer User Guide
Page 43

5.2.6.0 Limit or Curve Fit Line Properties
Limit or Curve Fit Lines
DescriptionItem
Click to add a limit or curve fit line.Add a Limit or Curve
Fit Line
Click to remove a limit or curve fit line.Remove a Limit or
Curve Fit Line
5.0 Customizing the Main Window
Limit or Curve Fit
Lines
Color
Lists the names of the limit or curve fit lines that are defined for the scope or
chart. If more than one line is defined, use the up-arrow and down-arrow
buttons to scroll the list.
Click the Add icon to add a limit or curve fit line. Click the Minus icon to
remove a limit or curve fit line.
When the Horizontal, Vertical, or Slope Intercept radio button is selected
and no variable is defined, this box shows Undefined Limit.
Use the color that is shown, or click the down-arrow and select an alternate
color for the selected trace.
The types include:Limit Type
• Horizontal—Shows a single value parallel to the X axis.
• Vertical—Shows a single value parallel to the Y axis.
• Slope Intercept, M*x+b—Shows a curve aligned with the slope of the
trace.
• General Array—Shows an array for the X and Y variables as complex
limits that are not linear, such a logarithmic or polynomial.
Click the down arrow and select a variable, or create a new variable.Y Variable
Click the down arrow and select a variable, or create a new variable.X Variable
Enter text for the trace legend.Legend Label
5.2.7.0 Refresh All Analysis Views
The Refresh All Analysis Views button updates all references to all variables, calculations, and data
acquisition definitions using the current configuration and overridden variable v alues . Calculations and views
using the variable are updated.To activate the option, click the button.When the update is complete, the
icon is unavailable.
MTS TestSuite™ Fracture Analyzer User Guide 43
Page 44

5.0 Customizing the Main Window
5.3.0 Charts and Tables (Views)
5.3.1.0 Array-Variable Chart
The Array-Variable chart shows data that is collected and calculated during each test cycle and stored in
arrays.This chart is used in several ways:
• As a runtime display activity
• As an analysis tool in the Fracture Analyzer application
• As an image in reports in the Reporter Add-In for Excel
An Array-Variable chart plots the entire variable array. The data is not cyclic or time-based.The Y axis of the
chart must be an array variable.The X axis can be an array variable or the index of the Y axis array.You can
add multiple traces to the Y axis, and you can add multiple Y axes.When the chart has multiple traces, a
legend on the chart identifies the individual traces.
You can create new numeric variables when you define additional traces. Click the <new variable> variable
list item to display the New Numeric Variable window.
You can include Array-Variable charts in reports.
5.3.2.0 History Chart
Overview
The History chart shows minimum-maximum or peak-valley cycle data in relation to time or an index, such
as a data group, data point, or cycle number. The Y axis presents data values and the X axis presents index
values.
History charts are typically one of the first views used for checking test data. For example, strain peak and
strain valley may provide the first signal-strength indicator. History peak and valley curves can also be the
starting points for checking stress and load results.
You can include an image of a History chart in reports.
Analysis
History charts are also available in the Fatigue Analyzer and Fracture Analyzer applications.
If more than one type of group is availab le, select a v alue from the drop-do wn list.The default v alue is Cyc le.
Other variables listed in this box are variables specified in the Save Variables box of the Map Variables
window.
If an invalid cycle is selected for the chart, a warning icon appears with the error message, “Invalid cycle
values are not plotted.”
5.3.3.0 Hysteresis Chart
The Hysteresis chart shows the cyclic or group data produced during a test cycle.
44 MTS TestSuite™ Fracture Analyzer User Guide
Page 45

5.0 Customizing the Main Window
Runtime
In the Multipurpose Elite application, hysteresis charts are available as part of the Runtime Display and
View Results.To create a new Hysteresis chart in Runtime Display, double-click or drag the icon to the
work area.To see a Hysteresis chart in View Results, click the Hysteresis tab.
Group variable mapping occurs in the Procedure definition part of the test. If more than one type of group is
available, the Monitor for Change box of the hysteresis chart properties contains a drop-down selection
button.The default v alue is Cycle. Other variables listed in the Monitor f or Change box are v ariables specified
in the Save Variables box of the Map Variables window.
You can select a cycle by number or by using a variable. On the chart, the zero-value reference lines are
slightly darker than the other reference lines to provide a visual orientation to your data.
You can include an image of a Hysteresis chart in reports.
Analysis
To see a Hysteresis chart in the Fatigue Analyzer application or the Fracture Analyzer application, click the
New Hysteresis Chart button. If more than one type of group is a v ailable , select a value from the drop-do wn
list.The default value is Cycle. Other variables listed in this box are variables specified in the Save Variables
box of the Map Variables window.
The Hysteresis chart can plot the same time variables on its X axis as the Cycle Time chart. However, the
Cycle Time chart shifts overlaying cycles to zero at the start of the cycle. Because the shift does not occur
on the Hysteresis chart, the cycles are separated by the elapsed time.
Properties
The following table lists Hysteresis Chart properties.
Hysteresis Chart Properties
DescriptionItem
Specify a unique name to identify the chart in the test.Display Name
Group
Cycles to Display
If more than one type of group is availab le, select a v alue from the drop-down
list.The default value is Cycle. Other variables listed in this bo x are variables
specified in the Save Variables box of the Map Variables window.
Select an array-type variable from the drop-down list.Y Variable
Select an array-type variable from the drop-down list.X Variable
Use the toggle button to change between a numeric value and unit of measure
or a variable to determine the input type.When the number setting is active,
type a value in the adjacent box.When the variable setting is active, click the
drop-down indicator and select an item from the list of available variables.
MTS TestSuite™ Fracture Analyzer User Guide 45
Page 46

5.0 Customizing the Main Window
5.3.4.0 History Marker Chart
The History Marker chart allows you to add markers and lines to history charts. In f atigue tests, y ou can show
failure cycle information or data from user-specified groups.To create a new History Marker chart, click the
New History Chart button.
To select a variable for the Y-Axis Data box, click the drop-down box to see the list of available items.The
X axis represents the index. If more than one type of index is available, click the drop-down selection button
to see a list of available items.The default value is Cycle. Other variables listed in this box are variables
specified in the Save Variables box of the Map Variables window.
If an invalid cycle is selected for the chart, a warning icon appears with the error message, “Invalid cycle
values were not plotted.”
Properties
The Markers panel provides a toolbar that allows you to add and remove marker points, marker lines, and
marker values to the chart.
Markers Toolbar Properties
DescriptionItem
Add Marker Point
Remove Marker Point
Add Marker Line
Shows a panel to create one marker , adds one new marker to the chart, and
activates the Remove Marker Point button.
To set the marker, click the drop-down button to show a list of variables and
select a variable. A value is assigned to the index and a marker appears on
the chart.
To reposition the marker, select the Move check bo x. Move your cursor along
the curve.When the cursor touches a data point, an orange circle surrounds
the point and shows the X and Y values.To set the marker, click the curve at
the data point.The orange circle changes to an orange diamond shape. Clic k
to clear the check box.The marker changes to a purple diamond shape.
To move the marker to the original location, click Reset.
When a marker point is added to the chart, the Remove Marker Point button
becomes active. It remains active until you select another button on the
Markers toolbar or a box in a marker, line, or value entry.
Shows a panel for setting two markers and a drop-line offset. Set the markers
with the same procedure as with the Add Marker Point b utton.The drop-line
offset is specified as a numeric percentage, a decimal number (unity), or a
variable.The default value is 10%.To select a variable, click the
Number-Variable Selection button, and click an item in the list.
The default setting for the drop line is par allel to the direction between the two
drop-line markers.You can change the direction by selecting the Horizontal
or Vertical check box.
Remove Marker Line
46 MTS TestSuite™ Fracture Analyzer User Guide
When a marker line is added to the chart, the Remove Marker Line button
becomes active. It remains active until you select another button on the
Markers toolbar or a box in a marker, line, or value entry.
Page 47

5.0 Customizing the Main Window
DescriptionItem
Add Marker Value
Remove Marker Value
Shows a panel to set one variable v alue.The selected marker value appears
in the New Failure Cycle Chart panel. The Value box is unavailable and you
cannot change the value.The Units box has a drop-down button that shows
a list of unit options.The content of the list is context-sensitive and depends
on the marker selection.The marker’s value and units appear, but the marker
is not added to the chart.
When you add a marker value to the chart, the Remove Marker Value button
becomes active. It remains active until you select a button on the Markers
toolbar or you click in a box in the Markers panel.
5.3.5.0 Drop-Line Markers
On the Failure Cycle chart, two markers, Drop-Line Start and Drop-Line End, are typically defined relative to
the stable cycle and crack initiation cycle. Drop-Line Start represents the stable cycle. Drop-Line End represents
the crack initiation cycle.The drop line markers provide a way of moving markers on the chart curve without
overriding the stable cycle or crack initiation cycle values.
Drop-line marker buttons are best illustrated using a simple example.
1. Click the Add Marker Line button to add a marker line.
2. Click Drop Fit Start for the first marker and click Drop Fit End for the second marker.
The Remove Marker Line button becomes active.
3. Click the Add Marker Point button to add a marker point, and select Failure Cycle Number.
The Remove Marker Point button becomes active.
4. Click the Move box of the Drop Fit End marker.
The Remove Marker Line button becomes active.
5.3.6.0 Cycle Marker Chart
The Cycle Marker chart plots the loading modulus and the unloading modulus. Additionally, this chart can be
used as a Hysteresis chart with markers.The variable and index selection interface is the same as for the
Hysteresis chart. Marker points, lines, and values can be added in the same way as with the History Marker
chart. Howe v er , the Cycle Mark er chart uses indices from the array inde x, rather than cycles .The array inde x
depends on how the timed data was sampled and is not shown on the chart.To create a new Cycle Marker
chart, click the New Cycle Marker Chart button.
The typical calculation for the loading modulus or the unloading modulus is:
Loading Modulus(Stress Array, Strain Array, IndexLow, IndexHigh)
The calculation for IndexLo w and IndexHigh is -1.This value causes the function to determine the index when
calculating the modulus. If you mo ve a marker on the chart, the calculation is performed using the array v alue
at the index designated by the marker. The modulus value is calculated for only the cycle currently shown
on the History Marker chart.
MTS TestSuite™ Fracture Analyzer User Guide 47
Page 48

5.0 Customizing the Main Window
Cycle Marker Chart Properties
DescriptionItem
Specify a unique name to identify the chart in the test.Display Name
Group
Cycles to Display
If more than one type of group is availab le, select a v alue from the drop-down
list.The default value is Cycle. Other variables listed in this bo x are variables
specified in the Save Variables box of the Map Variables window.
Select an array-type variable from the drop-down list.Y Variable
Select an array-type variable from the drop-down list.X Variable
Use the toggle button to change between a numeric value and unit of measure
or a variable to determine the input type for the Cycle # bo x.When the number
setting is active, type a value in the adjacent box.When the variable setting
is active, click the drop-down indicator and select an item from the list of
available variables.
5.3.7.0 Cycle Time Chart
The Cycle Time chart plots cycle data for multiple cycles.The Y axis presents cycle array data.The X axis
presents time array data.To create a new Cycle Time chart, click the New Cycle Time button.
The variables you choose f or the Y axis and the X axis must be array-type variables. Additionally, the v ariable
you choose for the X axis must have a time dimension. If a single time array variable exists when you create
the runtime display, the application selects the time array variable for the X axis.
When cycles overlap, the chart shifts the time to zero at the start of the cycle.The Hysteresis chart can plot
the same time variables on the X-axis, but the time is not shifted, so the cycles are separ ated b y the elapsed
time.
During your analysis, you can select a Cycle Time chart following a history chart. F or e xample, after y ou view
the strain peak-valley, you can look at the strain and running time for cycle 1, the half-life cycle, and the last
strain.
Cycle Time Chart Properties
DescriptionItem
Specify a unique name to identify the chart in the test.Display Name
Y-Axis
Group
48 MTS TestSuite™ Fracture Analyzer User Guide
The left-most box provides a drop-down list of array-type variables available
for selection.
This box provides a drop-down list of array variables available for selection.X-Axis
If more than one type of group is availab le, select a v alue from the drop-down
list.The default value is Cycle. Other variables listed in this bo x are variables
specified in the Save Variables box of the Map Variables window.
Page 49

5.0 Customizing the Main Window
DescriptionItem
Click this button to show the Numeric Selection window.Numeric
Click this button to show the Variables Selection window.Variable
5.3.8.0 Array-Variable Table
The Array-Variable table shows you the element values in one or more selected array variables. Click the
Array Variables button to open the Variables Selection window. Use the arrows to mov e A vailable Variables
to the Selected Variables box and click OK.
Variables Selection Window
• Right Arrow button—Click this button to add a variable that you have selected on the Available Variables
panel to the Selected Variables panel.
• Double Right Arrow button—Click this button to add all variables to the Selected Variables panel.
• Left Arrow button—Click this button to delete a single variable from the Selected Variables panel.
• Double Left Arrow button—Click this button to delete all the variables from the Selected Variables panel.
The default left-hand column of the table is the Array Index. Subsequent columns contain the values of the
array variables.
You can see the units for each selected array variable using the Column Chooser button.
MTS TestSuite™ Fracture Analyzer User Guide 49
Page 50

5.0 Customizing the Main Window
5.3.9.0 Variable Table
The Variable table shows the current value of the selected analysis run variables.The table supports direct
value overrides that can be used for error correction or “what if” speculation.
Variable Table
You can override values for data not measured from a signal directly in the Value column. However, you
cannot override and recalculate calculations, unless you type a number in the Value column. In that case,
the calculation is handled as an assigned constant value.
Changes made in the Variable Table are processed only in the current analysis run.
5.3.10.0 Fixed-Column Boundary Table
The Fixed-Column Boundary table shows the current value of cycle variables with one cycle variable row for
each cycle.To see the array variable values, expand the variable row for a cycle.
50 MTS TestSuite™ Fracture Analyzer User Guide
Page 51

Fixed-Column Boundary Table
5.3.11.0 Variable-Column Boundary Table
5.0 Customizing the Main Window
The Variable-Column Boundary table shows the current values of the selected variables.The number of
possible table columns depends on the number of data-collection variables and types of indexes. Each row
contains data from one cycle or data group.
5.3.12.0 Data Acquisition Variable Table
A Data Acquisition Variable table provides information about the data acquisition variables in each Data
Acquisition Editor. Click Column Chooser to select the columns to display.
To group the table rows based on a column, drag the column heading above the column area.To restore the
columns, drag the column heading to the first row. Additionally, rows can be sorted and filtered.
You can print and export tabular data with the View menu, Print Data, and Export Data options.
Data Acquisition Variable Table Properties
DescriptionItem
Specify a unique name to identify the chart in the test.Display Name
Select a Data
Acquisition Activity
Group
Click the drop-down button for a list of array-type variables available for
selection.
If more than one type of index is av ailab le, select a v alue from the drop-do wn
list.The default value is Cycle. Other variables listed in this bo x are variables
specified in the Save Variables box of the Map Variables window.
Show the Numeric Selection window.Numeric
Show the Variables Selection window.Variable
MTS TestSuite™ Fracture Analyzer User Guide 51
Page 52

5.0 Customizing the Main Window
5.3.13.0 Variable Table for Multiple Runs
The Variable Table for Multiple Runs shows data from two or more analysis runs selected as a multi-run
analysis.The table is typically used for comparing the data of the analysis runs.This table is activated, along
with the Variable-Column Table for Multiple Runs, when a multi-run analysis is created.
Values and calculations cannot be changed or recalculated in the table.Values that have been previously
changed in an analysis run are indicated by a check mark in the Modified column of the table row.
The table columns available for the table are determined by the analysis definition. For display, columns are
removed or added using the Column Chooser button.
The number of rows for each analysis run is determined by the number of identifiers in the analysis run. Rows
can be grouped, sorted, and filtered for ease of comparison.
The Variable Table for Multiple Runs cannot be saved for future use. However, data can be printed using
View > Print Data and exported using View > Export Data.
5.3.14.0 Variable-Column Table for Multiple Runs
The New Variable-Column Table for Multiple Runs shows data from two or more analysis runs selected as
a multi-run analysis.The table is typically used for comparing the data of the analysis runs.This table is
activated with the Variable Table for Multiple Runs when a multi-run analysis is created.
The table has one row for each analysis run.The table columns are determined by the analysis definition.
For display, table columns are added or removed using the Column Chooser button.
The New Variable-Column Table for Multiple Runs cannot be saved for future use. However, data can be
printed and exported.
52 MTS TestSuite™ Fracture Analyzer User Guide
Page 53

6.0 Data Analysis
Topics:
•
Analysis..................................................................................................................................................54
•
Variable Table Analysis..........................................................................................................................55
•
Analyzing Multiple Test Runs.................................................................................................................57
•
Data Acquisition Signal Addition and Removal......................................................................................58
MTS TestSuite™ Fracture Analyzer User Guide 53
Page 54

6.0 Data Analysis
6.1.0 Analysis
The application supports a variety of analysis activities, including:
• Analysis of completed tests
• Reanalysis of a data set requiring updated parameters
• “What if?” analysis to evaluate hypothetical scenarios
• Cross-specimen analysis to compare two different sets of test data
6.1.1.0 Analysis Procedure
You can perform data analysis on a system separate from the test system. If the test is stored and used on
the network, you can simply open the test from that network location. Alternatively, if you need to import the
test to a different computer, you would need to move the data to the analysis system.To do so, import the
test with the File > Import test menu options.
Variable definitions applied to different test runs must be scrutinized carefully. For example, Test Run 1 has
Analysis Definition 1 and variables V1, V2, and V3. Test Run 2 was performed on a different specimen that
has very different properties. If variables V3, V4, and V5 map to Test 2, the results could be somewhat
affected.You can obtain the best results when you closely examine your variables and data.
6.1.2.0 Analysis Activities
An analysis typically includes several activities.
1. When the file is available to the work station, open the test, File > Open Test.
The Explorer shows the test structure.
2. If your test does not include an analysis run, right-click the test run and select Analyze Test Run.
The New Analysis Run window appears.
3. Select a test run name, enter a unique analysis definition name in the New Definition Name box if one
does not already exist, and then click Add New.
4. Click Add Analysis.
The Explorer lists the analysis run below the test run name.
5. If your analysis run does not open without your intervention, double-clic k the analysis run name, or select
the name and click View Analysis Run.
The next step in the process is to verify the variab le definitions and create new v ariables and calculations.
6. Click Variable Editor. Examine the variables and their definitions to verify that they are what you expect.
7. Click Data Acquisition Editor.
A test run typically has multiple data acquisition activity tables that filter data for ease of use. For example,
one or more tables contain timed data and one or more tables contain peak-valley data. Select the data
acquisition activity table for the type of data you want to work with first. A mapping applies only for a
54 MTS TestSuite™ Fracture Analyzer User Guide
Page 55

6.0 Data Analysis
specific table.To use a variable in more than one data acquisition activity table, you must map it for each
table.
8. To select the data acquisition activity table that you want to work with, click the down-arrow in the Select
a Data Acquisition Activity box and select the name of an activity table.
9. To map a signal to a variable:
a) Select the signal name in the Signal to Variable Mapping panel.
The Signal to Variable Mapping panel provides information from the test run.The items in the Variable
column are available in your test and contain test data values.
b) Click the down-arrow in the Variable column and select the variable name or <new variable>.
c) If you select <new variable>, a window opens so that you can define a new variable. Complete the
boxes as necessary and click OK.
The Additional V ariables to Calculate panel pro vides information about other calculated values contained
in your analysis definition.The items in the right-hand frame are designated for recalculation at the
end of every cycle.
10. T o calculate a v ariable for e very cycle, select the variable name from the Ad ditional V ariable Calculations
list and click the right arrow button.
11. When you have finished the mapping, click the Refresh button.
The recalculated values are updated in the analysis run you currently have open.
A recommended procedure is to create a copy of your test and analysis definition.
12. Click File > Save As to save your test.
13. Type a new test name and click Save.
The variable definitions and mapping are transferred to your new test and can be modified to meet your
requirements.Your original test is protected from any new values, variables, and calculations you make
in your analysis.The test data does not change. Analysis data and calculation changes do not modify the
test run data in any way.
With the variables defined, mapped, or calculated, you can begin re viewing and analyzing the data through
the various charts and tables.
6.2.0 Variable Table Analysis
The Variable table enables you to directly change data values in the Value column.When you refresh the
analysis run, you can examine the effects on other v alues .The altered values are an ov erlay of actual v alues,
and no test data is changed. Additionally, you can map measured signal data to variables and override their
values.
6.2.1.0 Changing the Value of a Variable
To change the value of a variable in the Variable table:
1. Click in the table cell that you want to change in the Value column.
MTS TestSuite™ Fracture Analyzer User Guide 55
Page 56

6.0 Data Analysis
The table row becomes highlighted.The value becomes bold and underlined.Your cursor blinks in the
table cell. A value entry icon appears at the left end of the row.
2. Highlight the value, type the new value, and click the value entry icon.
The new value replaces the old value.The Refresh All Analysis Views button becomes active.
3. Click the Refresh All Analysis Views button.
4. Examine the table and other views for changes in the data.
6.2.2.0 Changing a Failure Cycle Variable
To change a failure cycle variable in a Variable table:
1. Click the New Variable Table button to open a Variable table.
The application presents a Variable table.The table row becomes highlighted.
For example, highlight the value (240) in the Value column of the Failure Cycle row and type 245.
The value becomes bold and underlined.Your cursor blinks in the table cell. A value entry icon appears
at the left end of the row.
2. Click the value entry icon.
The new value replaces the old value.The Refresh All Analysis Views button becomes active.
3. Click the Refresh All Analysis Views button.
The Processing Analysis Run Views window shows a progress bar.
4. Select the Failure Cycle Chart tab immediately to the left of the New Variable Table tab in the upper
right-hand portion of the screen.
The Failure chart moves to the front.The Failure Cycle value is 245 in the Markers panel.
The Reset button becomes availab le because the F ailure Cyc le v alue is changed.To restore the original
value, click Reset.
6.2.3.0 Defining a Calculated Variable
This procedure defines a new variable that performs a calculation. For example, the specimen diameter is
multiplied by the gage length to calculate the variable.
To define a calculation variable:
1. Open an analysis run.
2. Right-click the analysis run name in Explorer and select View Definition Variables.
The Variable Editor is shown in the Variables window.
3. Click Add New Variable.
The New Variable window opens.
4. Type variable name Area2 and click OK.
The variable appears in a row at the bottom of the table.
5. Click in the Dimension box, click the drop-down button, and click Area.
56 MTS TestSuite™ Fracture Analyzer User Guide
Page 57

6. Select the Is Calculated check box and click ....
The Calculation Editor window opens.
7. In the Variables panel, select Diameter and right-click Insert.
The diameter moves to the Calculation panel.
8. In the Functions panel, select the * symbol (multiplication) and right-click Insert.
The * symbol moves to the Calculation panel.
9. In the Variables panel, select GageLength and right-click Insert.
GageLength moves to the Calculation panel.
10. Click OK.
The Variable Editor opens.
11. Click the Refresh All Analysis Views button.
12. Close the window.
6.3.0 Analyzing Multiple Test Runs
6.0 Data Analysis
A multi-run analysis is a collection of analysis runs.The runs can be based on different specimens and
analysis definitions.The test runs may be from multiple tests, but the test runs must reside in the same test
and the same test for analysis.
The analyst has the responsibility to be aware of data characteristics.The application does not distinguish
or compensate for differences in analysis or test definitions.
When you create an analysis set, you get two tables, a New Variable Table for Multiple Runs and a New
Variable-Column Table for Multiple Runs.
6.3.1.0 Multiple Test Runs Overview
Determine if all the test runs you want to analyze exist in the same test or are from different tests.
If all the test runs that you want to analyze are in the same test, follow the procedure detailed in Analyze
Multiple Test Runs on page 58.
If you have a test file that contains test runs that you want to analyze with test runs from another test, use
the following procedure.
1. Export the test runs to a test file.
You can export the test runs in the Fatigue Analyzer application or the Multipurpose Elite application.
2. Import the exported test runs to the test file that will contain all the test runs that you want to analyze.
3. Open the test in the Fatigue Analyzer application.
4. Use the Analyze Multiple Test Runs procedure to simultaneously analyze all the test runs of interest.
MTS TestSuite™ Fracture Analyzer User Guide 57
Page 58

6.0 Data Analysis
6.3.2.0 Analyze Multiple Test Runs
When the test runs are in your analysis test, open the analysis set and create an analysis run for each test
run.The following procedure uses the Sample LCF Strain Test as an example.
1. On the File menu, click Open Test.
2. Click Sample LCF Strain test and click Open.
The Explorer panel shows the test hierarchy.
3. Right-click the “Test Run” entry to show a context menu.
4. Click Analyze Multiple Runs.
The New Analysis Multiple Runs window shows the list of a vailable analysis runs and additional inf ormation.
5. Click the check box for each analysis run to include in the analysis set and click Analyze Multiple Runs.
The Variable Table for Multiple Runs and Variable-Column Boundary Table for Multiple Runs tables open.
6.4.0 Data Acquisition Signal Addition and Removal
Signals can be added and removed from Data Acquisition activities f or analysis purposes.You can add one
or more signals in an analysis application alone. Removal requires you to make changes in Multipurpose
Elite and Fatigue Analyzer or Fracture Analyzer. Removal deletes the signal definitions without altering the
variable definitions or the original test definition and data.
You can verify that the addition or deletion is successful by checking the Fixed-Column Boundary table for
the array value that you added or removed.
You can add one or more signals in an analysis application to obtain statistical information without performing
another test, but you can only add and map variables to signals that were captured in the test run.You can
change signals and values to determine if you want to retest with different parameters.
To add a signal, you must first define the array variable to contain the data.You can add the variable from
the <new variable> entry of the drop-down button in the Variable box in the Data Acquisitions window or
from the Variable Editor.To remove the signal, un-map the data acquisition signal from the variable.
6.4.1.0 Adding a Data Acquisition Signal
To add a data acquisition signal using the Data Acquisition Editor:
1. Select the analysis run in the Explorer panel.
2. Click the Data Acquisition Editor button in the toolbar.
3. Select the correct Data Acquisition activity.
4. In the Signal to Variable Mapping section, select the row of the signal that you want to add.
5. In the Variable column, clic k the drop-down b utton and select the arra y variab le or select <new v ariable>.
If you select <new variable>, the New Variable window allows you to create an array variable.
58 MTS TestSuite™ Fracture Analyzer User Guide
Page 59

6. Click Update Signal List.
7. Click Close to save the changes made in the Data Acquisition Editor.
Important:
You must click Close before the next step (Refresh All Analysis Views) to save the changes made
in the Data Acquisition Editor.
8. Click the Refresh All Analysis Views button in the toolbar.
9. Click File > Save.
6.4.2.0 Removing a Data Acquisition Signal
To remove a data acquisition signal using the Data Acquisition Editor:
1. In Fatigue Analyzer or Fracture Analyzer, open the test and double-click the analysis run.
2. Open the Definition Manager window by clicking on the Definition menu > Definition Manager.
3. Select the analysis run and click Data Acquisitions.
4. Click the drop-down button of the Variable box in the row of the signal you want to remove.
5. Click the blank line to deselect the array variable and click Update Signal List.
6. Click Close.
6.0 Data Analysis
Important:
If you do not click Close before the next step (Refresh All Analysis Views), the changes made in
the Data Acquisition Editor are not saved.
7. Close the window and click the Refresh All Analysis Views button in the toolbar.
8. Click File > Save.
MTS TestSuite™ Fracture Analyzer User Guide 59
Page 60

Page 61

7.0 Variable Analysis
Topics:
•
Variables and Functions........................................................................................................................62
•
Variables Editor......................................................................................................................................62
•
Variable Classes....................................................................................................................................69
•
Managing Variables...............................................................................................................................72
•
Variable Calculations.............................................................................................................................74
•
Data Acquisition Editor..........................................................................................................................81
•
Function Manager Overview..................................................................................................................86
MTS TestSuite™ Fracture Analyzer User Guide 61
Page 62

7.0 Variable Analysis
7.1.0 Variables and Functions
You can analyze test results by reviewing the variables and functions used in the test.You can change the
data presented in the test by changing the variables and functions used in the mathematical and statistical
calculations.The original test data is not lost and does not change.
The Fatigue Analyzer and Fracture Analyzer applications have test data variables and analysis variables.
Test data variables map to signal data calculations for data acquisition activities that occur when you run a
test.These variables are av ailable for analysis as part of the stored test. Copies of the original test data values
are also available in the analyzer applications.
Analysis variables are variables in analysis definitions and analysis runs. Many analysis variables are based
on test data variables. Other variables are for system use. Additionally, the user may define variables for use
while analyzing data.
The analysis definition contains a copy of all test variables.The analysis run contains the data the test
generates.The data includes all user-created variables, calculations, and changed values that result from
data manipulation.
When a variable value changes , the ne w v alue triggers activation of the Refresh All Anal ysis Views button.
When you click the Refresh All Analysis Views button, the new value proliferates to all analysis runs that
use the same analysis definition.
Although test data variables are av ailable in the analyzer applications, analysis variab les are not available in
the test control applications.
Analysis-run variables are accessible from the Variable Editor.
7.2.0 Variables Editor
Open the Variables Editor by clicking the Variables Editor button in the toolbar.
Use the Variables Editor to view and edit the available variables within a test.You can create your own
variables and variable categories using the Variables editor . By default, disabled and read-only variables are
hidden from view.You can use the Variables Actions or context menus to show or hide variables.
Any changes you make to the display of the Variables Editor are saved when you close the application.That
is, if you filter or sort variables, set the variab le order , hide or display certain columns, or set the column order ,
your changes to the display will be retained the next time you open the application.
62 MTS TestSuite™ Fracture Analyzer User Guide
Page 63

Parts of the Variables Editor Window
DescriptionItemNumber
7.0 Variable Analysis
Variables Editor Window
1
Search, Toolbar,
and Menu Access
Provides menus and quick-access toolbar icons that allow y ou to perform
tasks such as searching for the Display Name of a variable, adding or
deleting variables, and access to the Variable Actions menu.You can
show all variables, and show or hide read-only or disabled variables in
the variables table.You can also right-click in the variables table to
quickly access a context menu for variable actions.
Variable Actions Menu
Selects which columns you want to show in the variables table.Column Chooser2
Column Chooser
MTS TestSuite™ Fracture Analyzer User Guide 63
Page 64

7.0 Variable Analysis
DescriptionItemNumber
3
Filter and Sort
Icons for Columns
Selected variable4
Filters by your selected filter criteria and sorts in ascending or descending
order. If a filter for a column is currently active, the filter icon appears
blue.
Filter
Shows the properties for the variable currently selected in the variables
table.
Shows the properties for the currently selected variable.Properties5
7.2.1.0 Editing Properties for Multiple Variables
You can select multiple variables in the Variables tab and change a parameter for the selected variables.
Only the changed parameter is applied to the selected variables.
In general, you cannot edit read-only variables, which include the System and Specimen groups. However,
for both System and Specimen variables, you can edit the Display Name, Availability options, and Format
options. If the variable is a Specimen variable, you can additionally edit the Unit and Default Option.
Use the far-left blank column to select multiple variable rows.You can click with the Ctrl or Shift keys.
You cannot edit calculations for multiple selected variables.
7.2.2.0 Variable Categories
The Variable categories organize variables based on functionality or user preference. Every test has two
predefined categories, Specimen and System.These categories contain predefined variables.You cannot
add variables to these categories or change the names of these categories.The default setting is to hide the
Specimen and System variables.To view them, click the Show Read-Only Variables button.
When you create new variables, they are added, by default, to a category called Variables.You can create
additional categories and assign user-defined variables to them.
You are not required to create additional categories for variables. However, categories can help differentiate
variables by type or by usage. For example, you may want to create one category that pertains to command
variables and another that pertains to data acquisition variables.
Variable selection windows also show variables by category groups.
64 MTS TestSuite™ Fracture Analyzer User Guide
Page 65

7.0 Variable Analysis
7.2.3.0 Variable Details
The V ariable Details panel sets the main properties of the selected variable or v ariables . New categories are
defined using the Category box.You can set or change the value type with the String and Array check
boxes .You can set or change the Dimension, Unit, and Default values.The calculated frame sets the value
as calculated.The Edit button opens the Calculation Editor.
7.2.4.0 Variable Properties
Variable Properties
DescriptionItem
Select the category of the variable.Category
Optionally, you can create a new category using the New Category option
from the drop-down list.
Uniquely identify the variables among all variables in the test.Identifier
Display Name
Default Value
Variable identifiers can contain only alphabetical, numeric, and underscore
(_) characters and must begin with an alphabetical character.They cannot
contain spaces or other special characters.
Provide a more operator-friendly way of identifying the same variable for use
in displays and reports.The default display name is the same as the identifier .
The display name must be a unique name, except it can match its variable
identifier.The display name can contain alphanumeric characters and spaces.
The name cannot contain periods and must not begin with a number.
Specify a default value for the variable to use until another value is provided
for the variable, either through user input or through calculation.
Specify a value that is consistent with the variable type , such as a numeric or
string value.
If you enter a string for a numeric variable, the default value is forced to a
numeric value of 0.000. If you enter a numeric value for a string variable, the
number is treated as a string, and not as a numeric value.
If a numeric default value is entered outside the variable Range, an error
message is generated.
Specify the default value. Available options are:Default Option
• Use Default Value from the Default Value field
• Use Previous Test Run Value
Specify the type of variable.The following types of variables are available:Type
MTS TestSuite™ Fracture Analyzer User Guide 65
Page 66

7.0 Variable Analysis
DescriptionItem
• Array of Boolean—The variable holds multiple v alues of the Boolean data
type.
• Array of Numbers—The variable holds multiple values of the numeric
data type.
• Array of Text—The variable holds multiple values of the text data type.
• Boolean—The variable type holds a Boolean value of either True or False.
• Number—(Default) The variable type holds numeric values.
• Te xt—Specify that the variable holds alphanumeric text r ather than numeric
data.
Dimension
Unit
Select the unit dimension.The dimension indicates a type of measurement,
such as length or force. However, the dimension does not specify which unit
type is used when displaying this measurement.You must specify the unit
type in the Unit field.
The dimension of a variable determines where it can be used.The dimension
is used to filter out incompatible variables from being incorrectly used within
the application. Only those variables that have a dimension that matches the
dimension of the signal can be used in the processing activity.
This property is not used when the variable data is a string.
Select a unit type in which the dimension is displayed.The unit indicates a
unit of measurement, such as mm (millimeters) or m (meters) for length, or N
(Newtons) or lbf (pounds) for force.The list only shows the set of units that
are compatible with the dimension of the variable.This is the unit of measure
that you want to assign to the variable value.
This property is not used when the variable data is a string.
7.2.5.0 Variable Calculated Properties
The Calculation panel shows the defined calculation for a variable.
Variable Calculated Properties
DescriptionItem
Is Calculated
Evaluate Only During
Test
66 MTS TestSuite™ Fracture Analyzer User Guide
If a calculation has been defined for the variable and you clear the Is
Calculated check box, the calculation equation is cleared (erased).
To create a calculation, click Is Calculated and click Edit.
To edit a calculation, click ....Edit
Select this check box to limit e valuation of the calculation to only during testing
(in either TW or MP), not post-test.The calculation is not performed in the
Page 67

DescriptionItem
Fatigue or Fracture Analysis applications (for example, when a marker is
moved).
This check box must be selected if the calculation contains references to
functions that access the controller, such as Signal(), SignalFullscale(), and
SystemRate(). If the check box is not selected, a validation error occurs that
you must clear before you can start a new test run.
7.2.6.0 Variable Format Properties
Use the Format panel to define properties for displaying the numeric value of a variable.
Variable Format Properties
DescriptionItem
7.0 Variable Analysis
Format Type
Digit Type
With Fixed, the number is shown in standard notation. For example, twenty
million would be displayed as 20000000.000 for a digit type of Decimal with
digits set to 3.
With Scientific, the number is shown in E scientific notation. For example,
twenty million is displayed as 2.000E+007 for a digit type of Decimal with
digits set to 3.This notation is typically used for number values too large or
small to be shown in standard decimal notation.
With Decimal, the number of digits specifies the number of digits to the right
of the decimal symbol. For example, zero would be displayed as 0.000 with
digits set to 3.
With Significant, the number of digits specifies the number of digits that are
significant. For example, zero would be displayed as 0.00 with digits set to 3.
Specifies how many digits to use for the digit type.Digits
7.2.7.0 Variable Range Properties
Use the Range panel to force the value of a numeric variable to be equal to or between the minimum and
maximum limits.The default value must be inside the range, or the range must accommodate the default
value.
Variable Range Properties
DescriptionItem
Use Range
When this option is selected, the application checks the value of the v ariab le
during the test to determine if the value is within the specified range.
MTS TestSuite™ Fracture Analyzer User Guide 67
Page 68

7.0 Variable Analysis
DescriptionItem
If the value of the variable is not within the range, the application adjusts the
value to be within the range. If the value of the variable does fall inside the
specified range, the value remains unchanged.
Specifies the smallest number the variable value can be.Minimum
If Inclusive is used and the value of the variable is less than the minimum
value, the application sets the variable value equal to the minimum value.
If Exclusive is used and the value of the variable is less than the minimum
value, the application sets the variable value so that it equals the minimum
value plus the Resolution value.
Specifies the largest number the variable value can be.Maximum
If Inclusive is used, and the value of the v ariable is greater than the maximum
value, the application sets the variable value equal to the maximum value.
If Exclusive is used, and the value of the v ariable is greater than the maximum
value, the application sets the variable value so that it equals the maximum
value minus the Resolution value.
Sets the value of the variable, relative to the edge of the range.Resolution
If the value of the variable f alls outside the specified (minimum and maximum)
range, the value will be adjusted to fall within the range.The adjustment is
relative to the closest edge of the range plus or minus the Resolution v alue.
For example , if a value of -5 is entered and the range is Minim um 0 Exclusive ,
Maximum 10 Exclusive, and the Resolution is 1, the value will be set to 1.
Howev er, if a value of 1.75 is entered, the value will not be changed because
it falls within the specified range. If .75 is entered, the value will be set to 1
because .75 is outside of the Minimum 0 Exclusive limit.
7.2.8.0 Choice Lists
You can set multiple values for a variable in a choice list and use them in many activities. Choice list values
are made up only of strings.
Use variable choice lists in If-Else conditions and While loops. F or example, in an If-Else activity, the condition
checks for the v alue of the variable to be equal to one of the choice list values. If that value matches, the test
procedure follows the “if” path.You can create a wave shape v ariable with v alues of triangle, sine, and square
as its values as another example.
Global and local lists
You can define choice lists for local use or global use. Use a local choice list if you are using one instance
of the variable that only contains those values. A local choice list has no name and is assigned only to one
variable. Use global choice lists if you want to assign the same choice list to multiple variables.This keeps
consistency and predictability in your test.
When you create a variable with a choice list, you must assign a default value from your list of values. Note
the following when deleting choice lists:
68 MTS TestSuite™ Fracture Analyzer User Guide
Page 69

7.0 Variable Analysis
• If you delete a variable that uses a local choice list, you also delete the choice list.
• If you delete a variable that uses a global choice list, only the variable is deleted.The global choice list
remains and is available for use with other variables.
Properties
The Choice List panel is available only for string variables.
Choice List Panel Properties
DescriptionItem
Use Choice List
Edit
Select this option to modify an existing choice list or create a new choice list.
If you select this box, the field selection is required, as indicated by the error
icon.
When you create a variable with a choice list, y ou must assign a def ault value
from your list of values.
Click the drop-down menu to see the available global choice lists or to create
a new one in the Global Choice Editor.
Click <modify choice lists> to open the Global Choice Editor.
Add a selection to the choice list.This function affects only local choice lists.Add
Edit the identifier name or the display name of a choice list selection.This
function affects only local choice lists.
Remove a choice list selection.This function affects only local choice lists.Remove
7.3.0 Variable Classes
7.3.1.0 Arrays
An array is a variab le that holds multiple values of the same data type.The elements of an array are indexed
from zero. For example, an array with an identifier of “A” and a size of ten contains the elements:
A[0], A[1], A[2], A[3], A[4], A[5], A[6], A[7], A[8], and A[9]
The elements of an array can be individually ref erenced or assigned. For example, arrays are used for cyclic
data acquisition. Every time a Data Acquisition activity is triggered, arrays assigned to the activity are
repopulated with data. Data from the previous data acquisition is replaced.
You can use arrays to perform calculations on a series of values. For example, you can use array data to
calculate the minimum, maximum, and mean of cycle data.
MTS TestSuite™ Fracture Analyzer User Guide 69
Page 70

7.0 Variable Analysis
7.3.2.0 Array Variables
Array variables store multiple values of the same data type.You can use array variables in several types of
activities:
• Cycle with Data Acquisition activity
• Custom Waveform with Data Acquisition activity
• Data Acquisition activity
• Fatigue data analysis
• Fracture data analysis
• Point-by-Point calculations
• Variables that store changing uncalculated values that are not part of a data acquisition activity
• Variables that store recurring calculations
View values
In the Fatigue Analyzer and Fracture Analyzer applications, you can view the values in charts or tables:
• Cycle Marker chart
• Cycle Time chart
• Hysteresis chart
• Array-Variable chart
• Array-Variable table
• Variable table
• Fixed-Column Boundary table
With the Reporter Add-In for Excel, you can include the image of the charts that show array variable values.
You can also use the Reporter Add-In for Excel to display charts and tables of array data.
Create new array variables
You can create new array variables in several areas of the application.
In the Multipurpose Elite application, perform one of the following procedures to create new array variables:
• Click Add New Variable in the Variable Editor window.
• Click the Counter box drop-down menu in the Data Acquisition activity properties window, and click
<new variable> to create a block variable array.
• Click in the Properties panel of a Cycle with Data Acquisition or Custom Waveform with Data
Acquisition activity to open the Data Acquisition window.
In the Fatigue Analyzer and the Fracture Analyzer applications, perform one of the following procedures to
create new array variables:
• Click Add New Variable in the Variable Editor.
• Click the drop-down menu of the Variables box in the Variable-to-Signal Mapping panel of the Data
Acquisition Editor and click <new variable>.
70 MTS TestSuite™ Fracture Analyzer User Guide
Page 71

7.0 Variable Analysis
After you create the new variable in either the Multipurpose Elite, Fatigue Analyzer, or Fracture Analyzer
applications, the Properties panel appears. In the Properties panel, select one of the Array options in the
Type field to create a new array variable.
Calculations
The Calculation Editor provides a variety of array functions for use with array variables. Some result in an
array. Some result in a single value, depending on the operation contained in the function.
You can perform arithmetic operations on array variables.You can also create custom functions to perform
specialized processing on data arrays and other array variables.
7.3.3.0 Numeric Variables
By default, variables are defined as single-v alue, numeric values .Y ou can assign either integer or floating-point
values to a numeric variable.
To specify that a numeric variable hold a multiple-value array, select the Array of Numbers option in the
Type field.
7.3.4.0 String Variables
To specify that a variable hold a string, click String as the type. A string can contain alphabetic, n umeric, and
space characters. In addition to using string variables to store te xt values, y ou can also include string variables
in calculations that use text functions to parse and manipulate the string values. String variab les also can be
used in choice lists.
To specify that a string variable hold a multiple-value array, select the Array of Text option in the Type field.
7.3.5.0 Calculated Variables
Calculated variables perform calculations to determine the value of the variable.The calculation can include
operations, functions, and ref erences to other variables .The result of the calculation must generate the same
type of data that is stored in the variable.The application validates variable equations as they are entered
by you and notifies you if the equation is valid.
Note:
If a calculation has been defined for the variable and you clear the Use Calculation check box, the
panel clears and the equation is lost. If y ou later decide that y ou want to use the original equation, y ou
must re-create it.
For example, you want to create several calculations that include velocity, which is itself a calculation.You
can create a calculation variable, label it “velocity,” define its equation, and use it wherever an equation
requires a value for velocity. This method is more efficient than repeatedly creating an identical velocity
equation.
MTS TestSuite™ Fracture Analyzer User Guide 71
Page 72

7.0 Variable Analysis
7.4.0 Managing Variables
7.4.1.0 Variables Overview
You create and define variables on the Variables tab.The application also provides shortcuts in various
places to allow you to conveniently create a new variable at the point of use.
By default, any variables you create are selected to go into a category called Variables.You can create new
categories to manage the variables you create.
After you create a variable, you can reference it in activities in the test procedure, runtime displays, test
reports, and in the analysis application.
You can define variable values in the following ways:
• As a string or as a numeric value
• As a single value or as multiple values in an array
• As a constant value or as a calculated value
Calculations can include operations, functions, and references to other variables. If a calculation is used in
a variable, the result must generate the same type of data that is stored in the variable.The application
validates variable equations as they are entered by you and notifies you if the equation is valid.
7.4.2.0 New Variable Window
Use the New Variable window to create new variables at many locations within the application.With the New
Variable window you can define the same basic properties as you can with the main Variable Editor, except
that certain properties are preselected based on the context where you define the variable:
• The default category is Variables.
• The Identifier box supplies the unique name that reflects the box where you requested the new variable .
• The display name is a user-friendly variation of the identifier.This name must be unique but can match
its identifier.
• The Default Value and units are based on the box where you requested the new variable.
• The String or Array check boxes are available and may be preselected based on the box where you
requested the new variable.
The window also contains portions of the V ariable Editor f or you to set as necessary to meet your requirements:
• Calculation
• Availability
• Format
• Range
72 MTS TestSuite™ Fracture Analyzer User Guide
Page 73

7.0 Variable Analysis
7.4.3.0 Creating a New Variable
1. Click the New Variable button.
The New Variable window prompts you to type a unique identifier for the new variable.The identifier can
contain only alphabetical and numerical characters, ‘-’ and ‘_’.The name must not begin with a number.
The identifier cannot contain spaces, periods, and other special characters.
2. Click OK.
The properties of the variable are specified in the Variable Details panel.
7.4.4.0 Deleting a Variable
You can delete any variables that you create.You cannot delete read-only variables, which include variables
in the System and Specimen categories.
1. On the Explorer tab, click Variables.
2. Click Update Used By to update the column in the table that shows if the variable is in use in the test.
If you delete a variable that is in use, validation errors occur in the test where the deleted variable is
referenced.You must resolve validation errors before you can create a new test run.
Note:
Note the Used By information before you delete a variable.When you delete a variable, you also
delete the Used By information, which can be useful in resolving validation errors.
3. Select the variable in the table, and then click Delete Variable.
4. If you delete a variable that is in use, you are asked to confirm that you want to delete the variable.To
remove the variable from the table, click Yes.
Deleted variables are not fully deleted from the test until you save the test.
7.4.5.0 Variable Used By
The Used By table column on the Variables tab and window indicates if and where a variable is used in the
application.This column also shows any views in the application that use the variable.The table does not
automatically show the Used By column until you click Update Used By.You can add the column using
Column Chooser, but all entries are set to Unknown. Click Update Used By to update the column content.
The Used By function is helpful if you:
• Edit a variable used by more than one process. If a variable is used by multiple processes, you may want
to create a new variable, rather than edit a variable and impact all of its uses.
• Troubleshoot a complex test definition or when you plan to delete or replace a variable definition. If you
delete a variable that is in use, v alidation errors occur in the test where the deleted v ariable is ref erenced.
After you update the Used By information, click the drop-down button for the entry in the Used By column.
The display lists the location where the variable is activ e . If the variable is defined but unused, the table entry
is Not Used.
MTS TestSuite™ Fracture Analyzer User Guide 73
Page 74

7.0 Variable Analysis
To locate where the variable is used, click the entry.
• For a calculation, the entry for the calculated variable becomes selected.
• For an activity, the procedure appears in the work area with the activity selected.
• For a runtime view, the Runtime Display appears with the view selected.
• For a data acquisition, the Data Acquisition window appears with the corresponding entry selected.
7.4.6.0 Adding a New Category
By default, any variables you create on the Variables tab are entered into a category called Variables.You
can create new categories to manage the variables you create.
Categories can only be created in the Variables window when you either create a variable or when you edit
a variable. If y ou create a new v ariable from a drop-down list at the point of use , the category must be created
first to make it available in the drop-down list.You can assign the variable to a category at a later time, with
no impact on the use of the variable.
1. Click the Variables tab or open the Variables Editor by clicking the Variables Editor icon in the toolbar.
2. Click the Add New Variable icon and enter a new variable.
3. In the Properties panel for the new variable, click the Category column drop-down list and click New
Category.
4. Enter the variable category name.
If one or more variables are selected, they are grouped in the new category.
If no variables are selected, the new category is added to the list.
7.5.0 Variable Calculations
7.5.1.0 Calculation Editor Overview
Click Use Calculation in the Variable Editor and click the ... button to access the Calculation Editor.Four
panels comprise this screen: Calculation, Errors, Variables, and Functions.
Calculation panel
Use the Calculation panel to build a variable calculation.You can edit text directly in the panel, or you can
use the Variables and Functions panels to insert defined variable and functions. Note the following on the
Calculation panel:
• Variables can use reference signals, other variables, and calculation parameters.
• Names are not case-sensitive.
• Variables and signal labels have identifiers and display names. Use the identifier name when creating a
calculation that uses the signal.
When you are satisfied with the calculation, click OK to add the calculation to the variable selected in the
Variable Editor window.
74 MTS TestSuite™ Fracture Analyzer User Guide
Page 75

7.0 Variable Analysis
Note:
If adjacent variable names are not separated by a space or function in the Calculation panel, they are
interpreted as a single variable name.This is likely to result in a “...variable..., was not found” error
message.
Errors panel
The Errors panel continually evaluates the calculation as you build it.
Note:
Calculations are validated only on syntax and references to variables and functions, not expected
results.
Variables panel
The Variables panel lists all variables defined for the test. Double-click a variable or click a variable and click
Insert to add the variable to the calculation.The cursor location in the Calculation panel shows the added
variable.
To sort the displayed variables, click a column heading to sort the variables by the values in that column.
Click the same column heading again to reverse the sort order.
Functions panel
The Functions panel contains a list of defined program functions and operators. Double-click a function or
click a function and then click Insert to add the function to the calculation.
Click the drop-down list to select specific categories of functions.
To sort the displayed functions, click a column heading to sort the functions by the values in that column.
Click the same column heading again to reverse the sort order.
Square brackets [ ] indicate you can add an optional parameter. Remove the square brackets regardless if
you add an optional parameter. A calculation error occurs if they are not removed.
Parentheses ( ) in the syntax means that you must add a parameter.
For example, the function below requires two variable parameters that contain the stress and strain data.
The start and end indexes for loading and unloading modulus calculations are optional because they are in
square brackets.
CycleModulus(Stress,Strain[, startIndexLoading,endIndexLoading, startIndexUnloading, endIndexUnloading])
Note:
The variable parameters between the parentheses are not the identities of the v ariables.They indicate
the type of variable that must be placed in the syntax.
7.5.2.0 Operators in a Calculation
The following table sho ws all the recognized oper ators organized b y group and listed in order of precedence .
Within a group, all operators have the same precedence.
MTS TestSuite™ Fracture Analyzer User Guide 75
Page 76

7.0 Variable Analysis
Note:
Some languages use a semicolon as a list separator instead of a comma. If you are using one of those
languages, the last operator of the table would be replaced with a semicolon.
Order of Operations
DirectionFunctionOperatorPrecedence
Left-to-RightArray Index[ ]1
Function Call( )
.
Variable-Specific
Information
Right-to-LeftLogical NOT!2
Left-to-RightUnary Plus+
Unary MinusOnes Complement~
Left-to-RightMultiply*3
Divide/
Modulus%
Left-to-RightAddition+4
Subtraction–
Left-to-RightBitwise Shift Left<<5
Bitwise Shift Right>>
Greater Than>
Less than or Equal<=
Greater Than or Equal>=
Not Equal To!=
76 MTS TestSuite™ Fracture Analyzer User Guide
Left-to-RightLess Than<6
Left-to-RightEqual to==7
Left-to-RightBitwise AND&8
Left-to-RightBitwise XOR^9
Page 77

7.0 Variable Analysis
DirectionFunctionOperatorPrecedence
Left-to-RightBitwise OR|10
Left-to-RightLogical AND&&11
Left-to-RightLogical OR||12
Right-to-LeftAssignment=13
Left-to-RightComma - List Separator,14
7.5.3.0 Variable-Specific Information
You can reference variables with delimited notation. A dot separates the variable name from the specifier:
<variable_name>.<specifier>
For example, the display name of a variable named PeakLoad is: <PeakLoad>.<display name>
Specifiers Properties
DescriptionItem
Shows the display name of the variable.Display
Shows the internal name of the variable.Identifier
Shows the units of the variable.Units
Size
Shows the array size of the variable. If the variable is not an array, the value
is 1.
7.5.4.0 Calculation Functions
The functions available in the Calculation Editor are tools f or calculating the v alue of a v ariable.The functions
support computations using arithmetic, logic, and test variables.
The functions can be grouped in three categories:
• Functions that require one or more arguments be passed to them
• Functions that operate directly on an operand
• Functions that do not require any arguments such as Pi()
Operators
Functions that operate directly on an operand are referred to as operators.When an operator is added to a
calculation, it acts directly on the operands to its left and right by assigning a value, perf orming a comparison,
or performing a mathematical calculation.
MTS TestSuite™ Fracture Analyzer User Guide 77
Page 78

7.0 Variable Analysis
However, some operators like the Not (!), Ones Complement (~), and Subtraction when used as a Negate
(-), operate on only one argument to the right.
Functions requiring arguments
In general syntax, functions that require arguments are written as a function name followed immediately by
the required arguments enclosed in parenthesis. For example: cos(number) – where “cos” is the function
identifier and “(number)” is the required argument.
7.5.5.0 Functions and Arguments in a Calculation
The Calculation Editor contains functions that can be inserted into the Calculation panel from the Functions
panel.When an insertion occurs, the function is represented by an identifier, followed immediately by a
parenthetical representation of the expected argument or arguments. If multiple arguments are required, their
representatives are separated within the parenthesis using delimiters, such as commas or semicolons,
depending on the local language.The representative arguments are placeholders for an expected type of
data.
Argument types
The types of arguments that can be passed to a function are:
• Number
• String
• Array
• Signal or test input
In all cases, the argument type that is shown in the Calculation window must be replaced by a meaningful
value.The meaningful value can be an actual value, a variable that contains a value that is of the correct
type for the argument, or another function that produces a result that is of the correct type for the argument.
For example, if the function cos(number) is added to the Calculation panel, the message, “The variable,
number, was not found” is shown in the Error panel.The argument “number” must be replaced with a value,
a variable of the correct type, or a function that e valuates to the correct type. In this case the number 30, the
variable CycleCount, or the function cos(sin(30)) validates the calculation.The Error panel message reads,
“Equation is OK” when one of these replacements is used.
Argument syntax
When replacing a representative number or string argument type with an actual number value or a string
value, you must use the correct syntax for the value.
• A string value must be enclosed between double-quotes. For example: the function ToLower(string), can
be replaced by ToLower(“This is a short sentence.”), but not by ToLower(This is a short sentence.).
• A numeric value is typed without quotes. For example: the function cos(number) can be replaced by
cos(30), but not by cos(“30”).
Arguments can also be replaced with variables of the correct type.
Unique functions
There are unique functions available in the Calculation Editor that do not accept arguments.
• The function e() represents the natural logarithmic base, e.
78 MTS TestSuite™ Fracture Analyzer User Guide
Page 79

7.0 Variable Analysis
• The function Pi() represents the mathematical constant, pi.
• The function SystemRate() represents the system data rate.
7.5.6.0 Modulus Calculation Functions
Modulus is calculated from the slope of the Least Squares Fit calculation of the Stress and Strain arrays
between the starting and ending indexes.
Loading Modulus
LoadingModulus(Stress, Strain[, startIndex, endIndex])
The loading modulus is the modulus of the portion of the curve where the load on the specimen increases.
This function calculates the loading modulus using the Stress and Strain arrays between the startIndex and
endIndex.
If the startIndex is set to -1, the optimum start index is the valley offset by 5 points . If variables represent this
box in the function and the original value is -1, the variable contains the calculated index at the completion
of the function.
If the endIndex is set to -1, you can calculate the optimum endpoint:
1. Locate a nominal end index at 25% of the stress range and within the linear modulus range.
2. Calculate a nominal modulus at the nominal end index.
3. Expand the nominal end index away from the start index until the new modulus value differs from the
nominal modulus by more than 2%.
4. The endIndex is set before the newly calculated modulus exceeds the nominal modulus.
If variables represent this box in the function and the original v alue is -1, the variable contains the calculated
index at the completion of the function.
UnLoading Modulus
UnLoadingModulus(Stress, Strain[, startIndex, endIndex])
The unloading modulus is the modulus of the portion of the curve where the load on the specimen decreases .
This function calculates the unloading modulus using the Stress and Strain arrays between the startIndex
and endIndex.
If the startIndex is set to -1, the optimum starting index is the peak offset by 5 points. If variables represent
this box in the function and the original value is -1, the variable contains the calculated index at completion
of the function.
If the endIndex is set to -1, you can calculate the optimum endpoint:
1. Locate a nominal end index at 25% of the stress range and within the linear modulus range.
2. Calculate a nominal modulus at the nominal end index.
3. Expand the nominal end index away from the start index until the new modulus value differs from the
nominal modulus by more than 2%.
4. The endIndex is set before the newly calculated modulus exceeds the nominal modulus.
If variables represent this box in the function and the original v alue is -1, the variable contains the calculated
index at the completion of the function.
MTS TestSuite™ Fracture Analyzer User Guide 79
Page 80

7.0 Variable Analysis
Cycle Modulus
CycleModulus(Stress, Strain[, startIndexLoading, endIndexLoading, startIndexUnloading,
endIndexUnloading])
CycleModulus returns the average of LoadingModulus and UnloadingModulus.
First Cycle Modulus
FirstCycleModulus(Stress, Strain[, startIndex, endIndex])
The FirstCycleModulus function returns the modulus of the data in the region prior to the first peak or valley
because the first cycle is typically a partial cycle.The modulus is either a loading or unloading modulus, based
on an increase or decrease in the specimen load during the first cycle.
7.5.7.0 Strain and Stress Calculation Functions
Calculated Inelastic Strain
CalcInelStrain(Stress, Strain, Modulus)
The CalcInelStrain function returns the value: Strain - Stress/Modulus
The calculation provides the value of the Strain minus the Stress divided b y the modulus. If Strain and Stress
are arrays, the result is an array. If Strain and Stress are single numbers, the result is a single number.
Hysteresis Area
HysteresisArea(StressArray, StrainArray)
The HysteresisArea function returns the area under the curve defined by the Stress and Strain array data.
Measured Inelastic Strain
MeasInelStrainMax(stressVar, strainVar)
MeasInelStrainMin(stressVar, strainVar)
The measured inelastic strain range is specific to materials fatigue testing, especially Low Cycle Fatigue
(LCF).The application calculates the mean stress from the stress and strain data that represents one cycle.
The two points where the mean intersects the curve determines the strain values.The MeasInelStrainMax
function returns the maximum of these two strain values.The MeasInelStrainMin function returns the minimum
of these two strain values.
StrainA
StrainA(StrainMax, StrainMin)
The StrainA function returns the value: ((StrainMax - StrainMin)/(StrainMax + StrainMin))
StrainR
StrainR(StrainMax, StrainMin)
The StrainR function returns the value: StrainMin/StrainMax
80 MTS TestSuite™ Fracture Analyzer User Guide
Page 81

7.0 Variable Analysis
StressA
StressA(StressMax, StressMin)
The StressA function returns the value: ((StressMax - StressMin)/(StressMax + StressMin))
StressR
StressR(StressMax, StressMin)
The StressR function returns the value: StressMin/StressMax
7.5.8.0 Fatigue Life Calculation Function
Fatigue Life
FatigueLife(YAxis, XAxis, startIndex, endIndex, percentageDrop)
The FatigueLife function returns the index of the point where the material under test fails.The failure point is
after endIndex where the Y-Axis value f alls below (percentageDrop) the Least Squares Fit line of X-Axis and
Y-Axis data between startIndex and endIndex.This function provides the drop line for the F ailure Cycle chart.
7.6.0 Data Acquisition Editor
The Data Acquisition Editor allows you to map signal data into variables that can be used to perf orm calculations
on signal data, perform logical condition checks for If-Else and While statements, and to log current signal
values.To access the Data Acquisition Editor, click Definition menu > Data Acquisition Editor.
In the Fatigue and Analyzer applications, you can map a variable to signal data and recalculate the data for
those cycles that are selected or defined in the properties for the Data Acquisition activity.The original test
data is not changed or lost.
MTS TestSuite™ Fracture Analyzer User Guide 81
Page 82

7.0 Variable Analysis
Data Acquisition Editor Window
DescriptionCallout
Available signals1
Other available calculations2
Additional variables saved with each cycle or group3
Mapped variables4
Other variables calculated with each cycle5
7.6.1.0 Variable Mapping
Cycle, point-by-point, and group data acquisition activities require you to map variables to the signals you
want to acquire. Perform this mapping in the Map Variables window.
82 MTS TestSuite™ Fracture Analyzer User Guide
Page 83

7.0 Variable Analysis
Signal to Variable Mapping
The Signal to Variable Mapping part of the window allows you to map signals to variables.
Four types of data can be calculated for each signal that is selected for data acquisition.The data types are:
• Mean
• Minimum
• Maximum
• Array
The application only calculates data for a signal if it is mapped to a variable.
T o see the v ariables that are av ailable to map , click the drop-down b utton. If the Filter variables b y dimension
and calculation type check box is selected, the variable list includes only the variables with the same
dimension and calculation type as the signal. If the check box is clear, all variables appear in the list.
If a variable is mapped to signal data, the data is calculated during the test run for those cycles that are
selected or defined in the properties for the Data Acquisition activity.The data values for each acquired
cycle are available for use in the runtime display and are saved for post-test analysis.
Default mapping
To automatically create new variables (if the defaults do not already exist) f or selected signals and map them
to the correct signal data calculations, click the Use Default Variables button.The name of each variable is
the combination of the signal name and calculation name.The application also copies the new variable
definitions to the Variables tab.
Alternative user variable mapping
Alternatively, you can map a user-defined v ariable to an y signal data calculation.The variable y ou map must
have a dimension that matches the signal data.
You cannot map a variable to a signal data calculation if the variable already contains a calculation. Ho we ver,
variables that contain a calculation may optionally be used in the Additional Variables to Calculate panel.
Additional variables to calculate
The Available Calculations panel lists variables that have a calculation.The calculations in the Selected
Calculated V ariables panel are perf ormed on those variables when the Data Acquisition activity is performed
in the test procedure.The data from the calculation is available for runtime displa y and for post-test analysis.
Data for a calculated variable m ust exist when the calculation occurs . If a calculation is based on one or more
other variables, data must exist for those variables. If the data does not exist, the calculation cannot be
performed.
A calculation can be based on a variable that is mapped to signal data. As a result, you can perform an
additional calculation on the data at the time the data is acquired for the cycle.
To view the list of variables that contain calculations, select:
• Signal Dependent Variables—Shows the variables that have a calculation if part of the calculation is
based on a variable that is mapped to a signal data calculation. If another variable is referenced in the
calculation, the data for that variable must exist for the calculation to succeed.
• Calculated Variables—Shows the variables that have a calculation.This option enlarges the variable
selection scope. As a result, you must be careful to mak e sure that all calculation ref erences are resolved.
MTS TestSuite™ Fracture Analyzer User Guide 83
Page 84

7.0 Variable Analysis
• All Variables—Shows all variables, including variables that do not have a calculation.You can change
the variable to include a calculation or change an existing calculation b y selecting the variable and clic king
the Create or Edit Calculation button. Make sure that all calculation references are resolved.
Save variables
Select one or more variables to store the value in the raw data file for each group. Cyclic data is stored at
the end of each cycle. Group data is stored at each boundary, such as a step or segment. Non-cyclic data
is stored at the end of the data acquisition.The stored data lets you reset the value at each capture point of
the acquisition.
To specify a variable, click + or - and select one or more variables.
7.6.2.0 Mapping a Signal to a Variable
To map a signal to a variable using the Data Acquisition Editor:
1. Select Filter variables by dimension and calculation type to configure the list of variables that are
suitable to map to signal data.
2. Click the Variable box of the row of the signal to map.
3. Click the drop-down button and select a variable or <new variable>.
If you select <new variable>, the New Numeric Variable window opens.
4. Click OK.
7.6.3.0 Mapping Additional Variable Calculations
To map additional variable calculations using the Data Acquisition Editor:
1. In the Available Calculations panel, select one of these radio buttons to configure the list of variables:
• Signal Dependent Variables
• Calculated Variables
• All Variables
2. Select a calculation that you want to occur each cycle.
3. Click the right arrow button next to the calculation to go to the Additional Cycle Calculations panel.
4. Click Close.
7.6.4.0 Tagged Blocks
Data collection can result in a block with incomplete or invalid data if a collection limit is reached or a failure
occurs, such as a hardware shutdown or restart.The capability to tag one or more blocks for e xclusion allows
the data to be successfully analyzed.
Process
You can detect that the data is incomplete due to a failure issue by viewing an Array-Variable chart and a
Hysteresis chart. An Array-Variable chart shows y ou the entire range of data. An irregularity in the pattern or
84 MTS TestSuite™ Fracture Analyzer User Guide
Page 85

7.0 Variable Analysis
an incomplete pattern indicates a group to investigate. Configure the Hysteresis chart to show you the data
for the groups or cycles of interest.You can detect a restart issue by viewing a History chart.When you have
identified the group you want to exclude, select it in the Tagged Blocks window and refresh the data.
Results
A data refresh recalculates the values of the variables and some v ariables change in v alue .The recalculated
values are modified on charts and tables.
The results of two application-supplied functions, Cycle() and Block(), change significantly.The data arrays
return span blocks and the tagged blocks are no longer included. For example, five data blocks are included
in an analysis run.Variable MyArra yVar is defined to be an array of five elements that are values of MaxLoad.
If one cycle block is excluded, MyArrayVar = Cycle(MaxLoad) returns four elements.
As another example, variable MyGroupArrayVar is defined to be an array of 12 JIC Steps (blocks) with load
values. If 2 steps are excluded, MyGroupArrayVar = Block(“JIC Step”, JICLoadArray) returns values for 10
steps.
The collected data remains unchanged.The signal-to-variable mapping remains unchanged. Additional
calculations do not occur because the tagged blocks could affect the results of the calculations.
Properties
Use the Tagged Blocks window to remove one or more blocks from analysis calculations.
Tagged Blocks Properties
DescriptionItem
Specifies the type of block, such as Cycle or JIC Step.Select Block
This panel shows the blocks that are tagged for exclusion.Tag Blocks
• Right Arrow button—Click this button to add a single block that you have
selected on the Available panel to the Tagged panel.
• Double Right Arrow button—Clic k this button to add all bloc ks to the Tagged
panel.
• Left Arrow button—Click this button to remove a single block from the
Tagged panel.
• Double Left Arrow button—Click this button to remove all the blocks from
the Tagged panel.
Tagging Blocks
1. Open the test in the application.
2. Right-click the analysis run and click View Tagged Blocks.
3. Select the type of blocks. If more than one type exists, click the drop-down list button to see the list of
types.
4. Select one or more blocks, such as cycle numbers, to exclude and click a button to move the highlighted
groups to the Tagged panel.
5. Click OK.
MTS TestSuite™ Fracture Analyzer User Guide 85
Page 86

7.0 Variable Analysis
7.7.0 Function Manager Overview
The Function Manager window provides information about the specialized calculations that are used for
material testing. Application-supplied functions are read-only. However, you can add, delete, and edit
user-defined (custom) functions.
Filter
You can open the Function Manager window within several contexts. For example, in the Multipurpose Elite
application, you can click the Function Manager button from the Specimen Geometry Editor.You can
right-click Test Definition in the Explorer. In the Fatigue Analyzer application, you can click the Function
Manager button on the toolbar.
The application filters the entries in the Function Manager window according to the context. For example,
when you access the Function Manager window in the Multipurpose Elite application from the Specimen
Geometry Editor, only geometry-specific functions appear in the table.You do not see those same functions
when you click the Function Manager button on the toolbar in the Fatigue Analyzer application.
Sort
You can sort entries presented in the Function Manager window based on any of the column headings . Click
the column heading to rearrange the rows. Click again to reverse the order based on the same column.
Define
Functions are defined in the Edit Function window using the Python programming language. Functions can
be simple or complex, based on the instructions you add for the function.
Function availability
Functions are available first from where the y are created. Functions created in the Specimen Geometry Editor
are available through the domain, but are not available in the test definition.To make functions that were
created in the Specimen Geometry Editor become available in the test definition, click Update All in the
Function window. Once the functions are in the test definition, any tests run from that point are in the test
runs. In the analysis applications , the functions are included in the analysis definition, and you can also create
additional functions for analysis runs.
Properties
Function Manager Properties
DescriptionItem
Function Name
Specify a name to identify the function.The name cannot contain spaces,
begin with a number, or contain special char acters. All user-defined functions
must follow Python naming rules.
List the arguments of the function.Arguments
86 MTS TestSuite™ Fracture Analyzer User Guide
Page 87

7.0 Variable Analysis
DescriptionItem
Category
Copy
Update All
Show the user-defined type of functions. Functions created in the Geometry
Specimen Editor fall into the Geometry category. Functions created in the
Function Editor fall into the Test Definition category.
Describe the function.Description
Open the Edit Function window to create a new function.Add
Confirm your request to delete the selected function.Delete
Change the function’s definition using the Edit Function window.Edit
Copy the function’s definition to a new function. Select the function and click
Copy.
Update all geometric-specific functions.This button removes e xisting functions
and copies all functions defined in all geometries in the domain.
Close the Functions window.Close
7.7.1.0 Edit Function
Use the Edit Function window to create user-defined functions using the Python programming language.The
Edit Function window lets you do the following:
• Create multi-line calculations and use them across test runs and analyses.
• Enter If statements, Loop statements, and other statements as supported in Python for more complex
calculations.
• Assign multiple variables to a function.
• Interact with other external sources.
• Validate statement syntax.
The validation section provides the result of the syntax check.The validation does not check for variable
scope or interaction with other functions and calculations. It is y our responsibility to debug y our functions and
ensure that they perform the calculations and results that you require.
You can enter the code in other editors and paste them into the Python Code work area.
Properties
Edit Function Properties
DescriptionItem
Function Name
Shows the function name. A name that is unique within the test is prefilled in
the Function Name box.When you enter a function name in the work area,
MTS TestSuite™ Fracture Analyzer User Guide 87
Page 88

7.0 Variable Analysis
DescriptionItem
the new name shows in this box.The name is case-sensitive, and must not
contain spaces.
Category
Usage
Python Code
Validation
Functions
To change a function using the Specimen Geometry Manager:
1. In the Specimen Geometry Manager window, select the specimen geometry that includes the function
you want to change and click Copy or Edit.
The Specimen Geometry Editor window appears.
2. Click Function Manager.
The Functions window appears.
3. Click Edit.
Shows the function category . If you create the function through the Specimen
Geometry Manager, the category is Geometry. If you create the function from
the Test Definition, the category is Test Definition.
Shows how to use your function and the arguments required. As you enter
the function name and the variables in the work area, you will see the name
and variables replace the generic text in the Usage box.
Enter your function in this area.You can add, edit, and delete functions and
arguments by changing the def line.
Validates your code as you are entering it.You see a descriptive message
for invalid statement syntax.“Validation successful” indicates valid statement
syntax.
The Edit Function window appears.
4. Type your changes to the Python code.
The result of the code syntax validation appears in the bottom panel of the window.
5. When you have finished, click OK to return to the Functions window.
7.7.2.0 Function Usage and Syntax Guidelines
SetValue
To set a test variable in a function, you must enter the code as in the following example:
TestVariableX.SetValue(10)
88 MTS TestSuite™ Fracture Analyzer User Guide
Page 89

7.0 Variable Analysis
Note:
The example above is not entered as TestVariableX=10.You must enter SetValue in the Function
Editor.
Arrays
To read a test variable array in a function, enter the code as in the following example:
functionVariableX=TestVariableX.Value.ValueArray
The above syntax is the function variable code to get the value of the array variable.
Non-array variables
To read a test variable that is not an array, enter the code as in the following example:
functionVariableX=TestVariableX
Order of sub-functions
If you have more than one function within the main function, the main function should appear first in the code ,
for example:
def SquareAndSum(a,b):
return Sum(Mat,Power(a,2) +Math.Power(b,2)
def Sum(a,b):
return a+b
Here the main function SquareAndSum uses a helper subfunction Sum. Only the first function shows in the
global function list.
Recommended:
Limit the use of sub-functions and enter one function so that it appears in the global list correctly .
Using multiple sub functions can become problematic and cause errors when the test is run.
Parentheses
Parentheses ( ) indicate you must add a parameter to the function.
To specify a variable, click Edit List and select one or more variables.
Square brackets
Square brackets [ ] indicate y ou can add an optional parameter to the function.The brack ets must be removed
in any case, or an error occurs.
7.7.3.0 Update All
The Update All button synchronizes the common functions in the test or analysis definition with all geometries
of the same domain as the test domain. A common function is a function that has one name b ut has diff erent
MTS TestSuite™ Fracture Analyzer User Guide 89
Page 90

7.0 Variable Analysis
geometry-specific calculations. Placeholders for the common functions are added to the test, if any are not
already there.
The body of the function is updated (replaced) in the test run to include the calculations that are specific to
the selected test specimen’s geometry. If you change the domain, it updates the geometry-specific variable
and function placeholders in the test and the analysis definitions.
Use Update All when you want to:
• Add a new geometry.
• Add a function to a geometry and want to make it available to a test.
• Synchronize in your test the functions that have different definitions for various geometries.
During post-test analysis, the Update All button enables you to change calculations and e xamine the results
of “what-if” scenarios.
Button location
The Update All button appears in the Functions context menu in the Multipurpose Elite application. In the
analyzer application, the button appears in the Function Manager window, accessible through the menu item
and the toolbar button.
Geometry-specific functions
Some functions perform specialized calculations that are based on the specific specimen geometry; that is,
the body of the function is not determined until a specimen is selected at the beginning of a test run.This is
because different specimens require different function calculations in order to return the correct result.
For example , if you run a test using the CTOD F racture domain (such as the ASTM E1290 test), the Crac kSize
function is used to calculate the size of the crack that develops during the test. However, if you open the
function manager to examine the function prior to running the test, only the function parameters exist and the
function body will be undefined.When you run the test and select a specimen, the body of the function will
change depending upon which specimen you choose.
All geometry-specific functions belong to the Geometry category. If you want to view which other functions
are geometry-specific, open the Calculation Editor, sort by Category, and scroll to the group of Geometry
functions.
During test definition
During test definition, the application reads the functions that are common throughout the test domain and
creates empty placeholder functions.The body of the function is updated later to include the geometry-specific
definition.Variables that call the function can validate successfully and avoid possible issues resulting from
function complexities.This approach provides flexibility b y allowing test development to be independent from
the geometry.
During analysis
You cannot create a test or test run during post-test analysis.You can, however, synchronize the common
functions using the Update All button.The analysis run receives the geometry’s implementation from the
analysis definition and recalculates the value in the test run.
Update All
To update all variables and functions:
90 MTS TestSuite™ Fracture Analyzer User Guide
Page 91

7.0 Variable Analysis
1. In the Multipurpose Elite application Explorer tab, click Test Definition and click on the Edit button. In
the Fatigue Analyzer and Fracture Analyzer applications, select Definition > Function Manager.
The Function Manager window displays.
2. Click Update All or Update Variables and Functions.
A message prompts you to confirm your intent to update the functions.
3. Click OK to update the functions or click Cancel to prevent the update.
MTS TestSuite™ Fracture Analyzer User Guide 91
Page 92

Page 93

Index
A
analysis
activities 33
begin 32
create definition 22
create run 22
flow 54
runs and sets description 23
test run 90
without template 32
analysis run
compare data 52
argument
syntax 78
array variable 69
Array-Variable Table 49
B
blocks
tagged 85
C
calculation
additional cycle 84
FatigueLife function 81
function arguments 78
function types 77
modulus functions 79
operators 75
strain and stress function definitions 80
chart
array variable 44
cycle time 48
failure cycle chart 81
curve fit line 43
custom function editor 26
cycle
variable table 51
variable table for multiple runs 52
D
display (continued)
manager 26
menu 27
positioning arrows 38
screen locations 38
split-screen 38
tabbed 38
Display Manager 27
drop fit 47
drop-line markers 47
E
edit function window 87
editor
custom function 26
data acquisition 26
variable 26
example test
begin 32
export
data 27
test file menu option 26
expressions in calculations 74
F
failure cycle
chart 81
chart markers and marker lines 46
File menu 25
fixed-column boundary table 50
function
e() 78
edit function properties 87
FatigueLife 81
manager 86
manager properties 86
Pi() 79
syntax 88
SystemRate() 79
test definition 90
update all 90
usage 88
data acquisition
signal addition and removal 58
data acquisition editor 26
display
basics 39
create new 39
description 37
G
group boundaries
exclude 85
MTS TestSuite™ Fracture Analyzer User Guide 93
Page 94

I
T
import
test file menu option 25
invalid cycle values not plotted 46
L
limit line 43
line and symbol
properties 42
M
main window
Fracture Analyzer application 24
map variables 82
markers and marker lines 46
message log
display 28
N
numeric selection window 40
O
open example test 32
P
panel
available calculations 83
calculated 66
Preferences
menu 28
print data 27
procedure
define calculated variable 56
R
refresh all analysis views
button 62
user interface 43
S
scientific notation 67
signal
addition and removal in data acquisition 58
signal-to-variable mapping
excluded group boundaries 85
slope intercept 43
specimen geometry
update all 89
test
about 17
open 16
run state colors 22
toolbar
analysis 29
markers 46
Tools menu 28
traces
properties 40
U
update all 89
V
variable
about numeric 71
array 69
calculated 71
calculated properties 66
categories 64
change failure cycle value example 56
create new 73
cycle table 51
cycle table for multiple runs 52
delimited notation 77
details 65
editor 62
format panel 67
main properties 65
map 82
range properties 67
selection 40
signal mapping 55
strings 71
table for multiple runs 52
value reset 56
variable editor 26
Variables Editor 62
view
close 27
create new 39
menu 26
overview 38
properties 40
refresh all 62
W
window
edit function 87
excluded group boundaries 85
numeric selection 40
94 MTS TestSuite™ Fracture Analyzer User Guide
Page 95

100-219-118 E
Page 96

 Loading...