


T M 1 1 - 6 4 2 5 - 2 8 3 7 - 1 4 & P - 6
TM 11-6425-2837-14&P-6
i
|
|
Model |
86601A |
||
Section |
C O N T E N T S |
|
|
||
P a g e |
Section IV. |
|
Page |
||
0. |
0 - 1 |
|
|||
|
|
4-9 |
|||
I. |
1-1 |
4-17. |
|
||
1-2. |
1-1 |
4-18. |
|
4-10 |
|
1-6. |
1 - 1 |
4-19. |
|
4 - 1 0 |
|
1-8. |
1-1 |
4-20. |
|
4-11 |
|
1-12. |
1-1 |
4-21. |
|
4-12 |
|
1-13. |
1-2 |
|
|
||
1-13. |
1 - 2 |
4-23. |
|
4-16 |
|
|
|
4-23. |
|
4-16 |
|
|
|
4-24. |
|
4-17 |
|
I I . |
2-1 |
4-25. |
|
4-19 |
|
2 - 1 |
2-1 |
4-26. |
|
4-20 |
|
4-2. |
2-1 |
V . |
|
5 - 1 |
|
2-5. |
2-1 |
|
|||
2 - 7 . |
2-1 |
5-1. |
|
5 - 1 |
|
2-10. |
2-1 |
5-7. |
|
5 - 1 |
|
2-12. |
2-1 |
5-10. |
|
5-1 |
|
2-14. |
2-1 |
5-13. |
|
5-1 |
|
2-16. |
2-1 |
5-14. |
|
5 - 2 |
|
2-18. |
2-1 |
5-15. |
|
|
|
2-23. |
2-1 |
5-16. |
|
5 - 4 |
|
III. |
3-1 |
|
5 - 6 |
||
5-17. |
|
5 - 9 |
|||
3-1. |
3-1 |
5-18. |
|
|
|
3-4. |
3-1 |
|
|
5-10 |
|
3-6. |
3-1 |
|
|
|
|
3-11. |
3-1 |
VI . |
|
6-1 |
|
IV. |
4 - 1 |
6 - 1 . |
|
6-1 |
|
6-6. |
|
6-1 |
|||
4 - 1 . |
4 - 1 |
|
|
|
|
4 - 3 . |
4 - 1 |
VII. |
|
7-1 |
|
4-8. |
4-1 |
7 - 1 . |
|
7-1 |
|
4-9. |
4-1 |
7-5. |
|
7 - 1 |
|
4-10. |
4-2 |
|
|
|
|
4-11. |
4-2 |
VIII. |
|
8 - 1 |
|
4-12. |
4-3 |
8-1. |
|
8 - 1 |
|
4-13. |
4-4 |
8-3. |
|
8-1 |
|
4-14. |
4-5 |
8-10. |
|
8-1 |
|
4-15. |
4-6 |
8-12. |
|
8-1 |
|
4-15. |
4-7 |
8-17. |
|
8-1 |
|
|
ILLUSTRATIONS |
|
|
||
Figure |
Page |
Figure |
|
Page |
|
1-1. |
|
||||
1-0 |
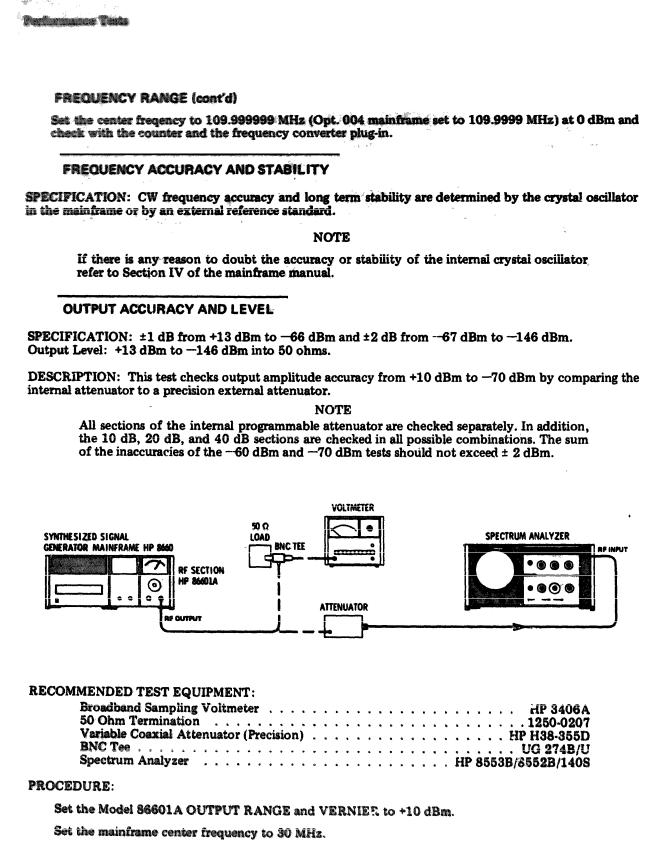
4-2. Output Accuracy and Level Test Setup . |
. . |
4-2 |
||
1-2. |
|||||
1-1 |
4-3. Output Flatness Test Setup . . . . . |
. . |
4-3 |
||
1-3. |
1-6 |
4-4. Impedance Test Setup . . . . . . . |
. . |
4-4 |
|
1-4. |
1-6 |
4-5. Harmonic Signal Test Setup . . . . . |
. . |
4-5 |
|
1-5. |
|||||
1-6 |
4-6. Spurious Signal Test Setup . . . . . |
. . |
4-6 |
||
3-1. |
3-0 |
4-7. Signal-to-Phase Noise Test Setup. . . . |
. . |
4-8 |
|
4-1. |
4-8. Signal-to-AM Noise Ratio Test Setup . . |
. . |
4-9 |
||
4-1 |
4-9. Amplitude Modulation Test Setup . . . |
. . |
4-10 |
||
ii
Model 86601A |
|
|
|
|
|
|
|
|
|
|
|
|
ILLUSTRATIONS (cont'd) |
|
|
||
Figure |
|
|
P a g e |
F i g u r e |
|
Page |
||
4 - 1 0 . |
|
|
4 - 1 2 |
8 - 4 . |
|
|
8-6 |
|
4 - 1 1 . |
|
|
|
8 - 5 . |
|
8 - 7 |
||
|
|
|
|
4-13 |
8 - 6 . |
|
|
8 - 7 |
4 - 1 2 . |
|
|
4 - 1 5 8-7. |
|
|
8 - 8 |
||
4 - 1 3 . |
|
|
4-16 8-8. |
|
|
8-10 |
||
4 - 1 4 . |
|
|
4 - 1 8 8-9. |
|
|
8 - 1 1 |
||
4 - 1 5 . |
|
|
4-19 |
8-10. |
|
|
8-11 |
|
4 - 1 6 . |
|
|
4-20 |
8-11. |
|
|
8-11 |
|
5 - 1 . |
|
|
|
5 - 2 |
8-12. |
|
|
8-11 |
5 - 2 . |
|
|
|
5 - 3 |
8-13. |
|
|
8 - 1 2 |
5 - 3 . |
|
|
|
5 - 4 |
8-14. |
|
|
8-13 |
5 - 4 . |
|
|
|
5 - 6 |
8-15. |
|
|
8 - 1 3 |
5 - 5 . |
|
|
|
5 - 9 |
8-16. |
|
|
8-13 |
|
|
|
|
8-17. |
|
|
8-13 |
|
5 - 6 . |
|
|
|
5-10 |
8-18. |
|
8 - 1 5 |
|
7 - 1 . |
|
|
|
7 - 3 |
8-19. |
|
8-15 |
|
7 - 2 . |
|
|
|
7 - 5 |
|
|
|
|
7 - 3 . |
|
|
|
7-5 |
8-20. |
|
|
8 - 1 5 |
7 - 4 . |
|
|
|
7 - 7 |
8-21. |
|
|
8 - 1 6 |
7 - 5 . |
|
|
|
7 - 8 |
8-22. |
|
|
8-17 |
7 - 6 . |
|
|
|
7-9 |
8-23. |
|
8-17 |
|
7 - 7 . |
|
|
|
7-10 8-24. |
|
8 - 1 7 |
||
7 - 8 . |
|
|
|
7-11 |
|
|
|
|
8 - 1 . |
|
|
|
8 - 0 |
8-25. |
|
|
8-19 |
8 - 2 . |
|
|
|
8-3 |
8-26. |
|
|
8-19 |
8 - 3 . |
|
|
|
|
8-27. |
|
|
8-21 |
|
|
|
|
8 - 4 |
8-28. |
|
|
8-21 |
|
|
|
|
TABLES |
|
|
|
|
Table |
|
|
|
Page |
Table |
|
|
Page |
1-1. |
el 86601A Specifications |
1-2 |
6 - 3 . |
R e p l a c e a b l e |
P a r t s |
6 - 3 |
||
1-2. Test Equipment and |
|
|
|
6 - 4 . Manufacture's Code List |
6 - 1 5 |
|||
|
Accessories |
List |
|
1 - 4 |
6 - 5 . P a r t N u m b e r - N a t i o n a l S t o c k |
|
||
1-3. 40 dB Amplifier Specifications |
1-6 |
|
N u m b e r C r o s s R e f e r e n c e I n d e x 6-16 |
|||||
4-1. Spurious checks |
|
4-7 |
7-1. Manual Changes by Serial Number |
7-1 |
||||
4-2. |
Carrier Envelope |
Distortion |
Test |
4-14 |
7-2. Assembly-Change Cross Reference Index |
7-4 |
||
4-3. Performance Test Record |
|
4-22 |
8-1. Schematic Diagram Notes |
8-5 |
||||
5-1. |
Harmonic Distortion Level |
Checks |
5-5 |
8-2. Assembly Locations |
8-7 |
|||
6-1. Part Numbers for |
|
|
|
8-3. 1 dB Attenuation Checks |
8-16 |
|||
|
Assembly Exchange Orders |
6-1 |
8-4. |
Attenuator Driver |
Levels |
8-20 |
||
6 - 2 . R e f e r e n c e D e s i g n a t o r s a n d |
|
|
|
|
|
|||
|
A b b r e v i a t i o n s U s e d i n |
|
|
|
|
|
||
|
P a r t s L i s t |
|
|
6 - 2 |
|
|
|
|
APPENDIXES
A . B. C . D.
REFERENCES |
A - 1 |
COMPONENTS OF END ITEM LIST (NA) |
|
ADDITIONAL AUTHORIZATION LIST (NA) |
|
MAINTENANCE ALLOCATION |
D - l |
E. REPAIR PARTS AND SPECIAL
TOOLS LISTS E-1 F . EXPENDABLE SUPPLIES AND
MATERIALS LIST (NA)
i i i
TM 11-6425-2837-14&P-6
S E C T I O N 0
I N T R O D U C T I O N
0 - 1 . S C O P E
0-2. INDEXES OF PUBLICATIONS
0-3. MAINTENANCE FORMS, RECORDS,
AND REPORTS
agement System.
b.Report of Packaging ad Handling Deficiencies. Fill out and forward DD Form 6 (Packaging Improvement Report) as prescribed in AR 700-58/NAVSUP- INST 4030.29/AFR 71-13/MCO P4030.29A, and DLAR 4145.8.
c.Discrepancy in Shipment Report (DISREP) (SF 361). Fill out and forward Discrepancy in Shipment
0-4. REPORTING EQUIPMENT IMPROVEMENT RECOMMENDATIONS
( E I R ) .
EIR can and must be submitted by anyone who is aware of an unsatisfactory condition with the equip ment design or use. It is not necessary to show a new design or tit a better way to perform a procedure; just simply tell why the design is unfavorable or why a procedure is difficult. EIR may be submitted on SF 368 (Quality Deficiency Report). Mail direct to Commander, US Army Communications and Electronics Materiel Readiness Command, ATTN: DRSEL-ME- MQ, Fort Monmouth, NJ 07703. A reply will be furnished to you.
0-5. ADMINISTRATIVE STORAGE
Administrative storage of
used by Army activities shall be in accordance with paragraph 2-16.
0-6. DESTRUCTION OF ARMY ELECTRONICS
MATERIEL
Destruction of Army electronics materiel to prevent enemy use shall be in accordance with TM 750-244-2.
0 - 1
Model 86601A
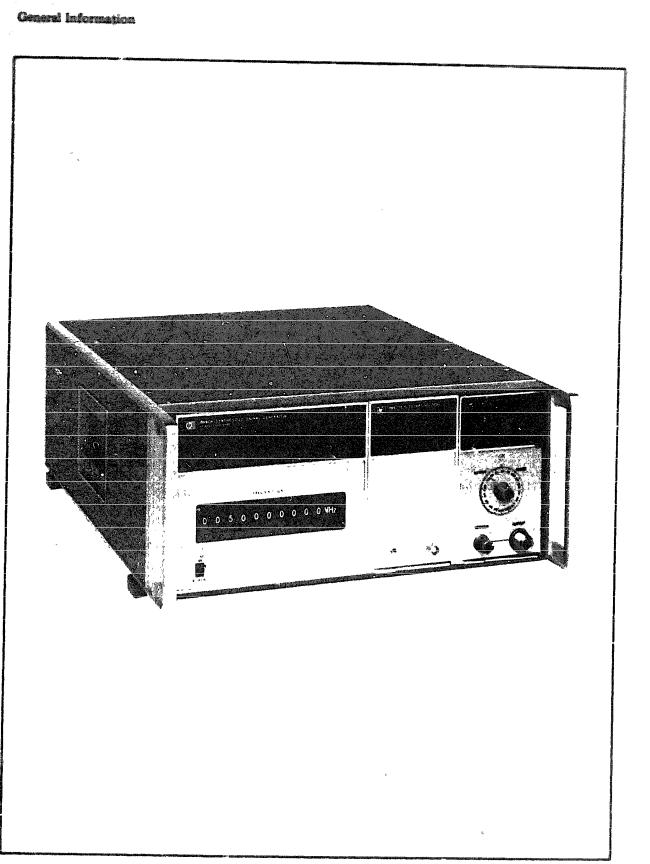
Figure 1-1. Model 88601A RF Section
1 - 0

Model 86601A
S E C T I O N I
G E N E R A L I N F O R M A T I O N
1 - 1 . 
1-2.
1 - 3 .
section covers instrument ations and other basic in-
1-4. Figure 1-1 shows a front view of the HP  1A installed in the HP Model 8660A
mainframe ready for use.
1-5. The various sections of this manual provide information as follows:
a. SECTION II, INSTALLATION, provides
information relative to incoming inspection, power requirements, mounting, packing and shipping, etc.
b. SECTION III, OPERATION, provides information relative to operating the instrument.
c. SECTION IV, PERFORMANCE TESTS,
provides information required to asccitain that the instrument is performin, in accordance with published specifications.
d. SECTION V, ADJUSTMENTS, provides inform&ion required to properly adjust and align the instrument after repairs are made.
e. SECTION VI REPLACEABLE PARTS provides ordering information for all parts and assemblies.
f. SECTION VII, MANUAL CHANGES,
Figure 1-2. Instrument Identification
1-8. DESCRIPTION
1-9. The HP Model 86601A RF Section output plug-in provides a .01 to 109.999999 MHz output when installed in one of the HP Model 8660 mainframes. The output frequency may be selected in increments as low as 1 Hz or 100 Hz depending on the mainframe used.
1-10. The only operator controls on the Model 86601A are the attenuator (OUTPUT RANGE and VERNIER) controls. These controls provide a  the rf output at any level between - 146 dBm an
 +13 dBm. In remote operation these controls are inh
g . |
|
1-11. |
f o r t h e M o d e l |
-1.
1 - 6 .
1 - 1 2 .
1 - 7 .
1 - 1
Model 86601A
1-13. |
|
1 - 1 5 . |
|
|
1 - 1 6 . |
1 - 1 4 . |
|
|
of the HP 11672A |
Kit, but may be ord |
|
Separately. |
|
|
|
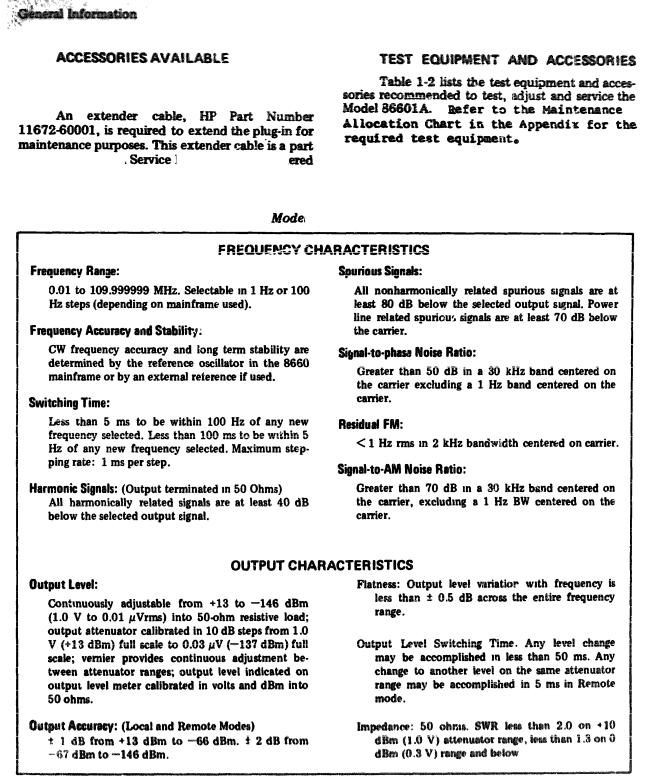
Table 1-1. |
l 86602A Specifications |
1 - 2
Model 86601A
Table 1-1. Model 86601A Specifications (Cont'd)
1 - 3

Model 86601A
Table 1-2. Test and Equipment and Accessories List
1 - 4
Model 86601A
Table 1-2. Test Equipment and Accessories List (cont'd)
1 - 5
Model 86601A
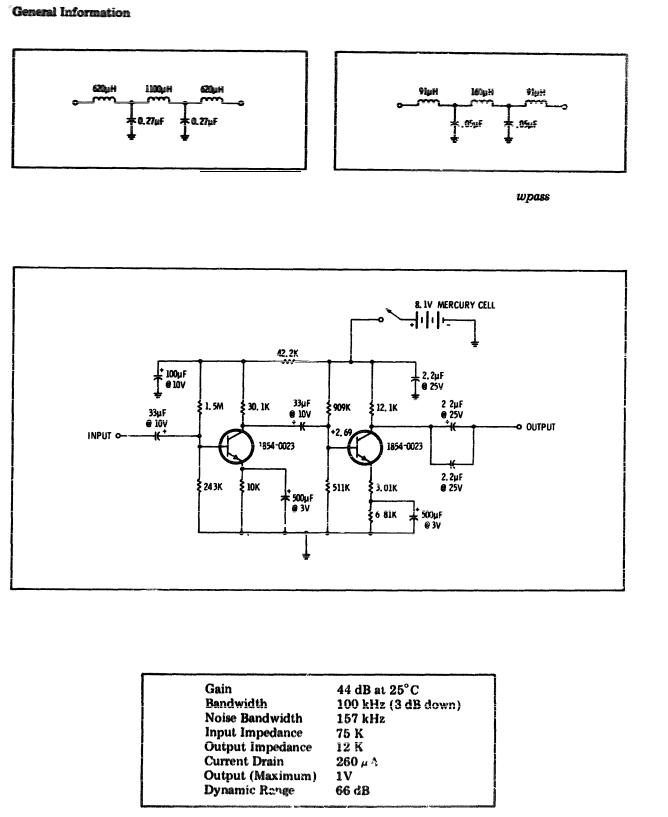
Figure 1-3. 15 kHz Lowpass Filter |
Figure 1-4. 100 kHz Lo |
Filter |
Figure 1-5. 40 dB Amplifier
Table 1-3. 40 dB Amplifier Specifications
1 - 6
Model 86601A
S E C T I O N I I
I N S T A L L A T I O N
2 - 1 .
2 - 2 .
2 - 3 .
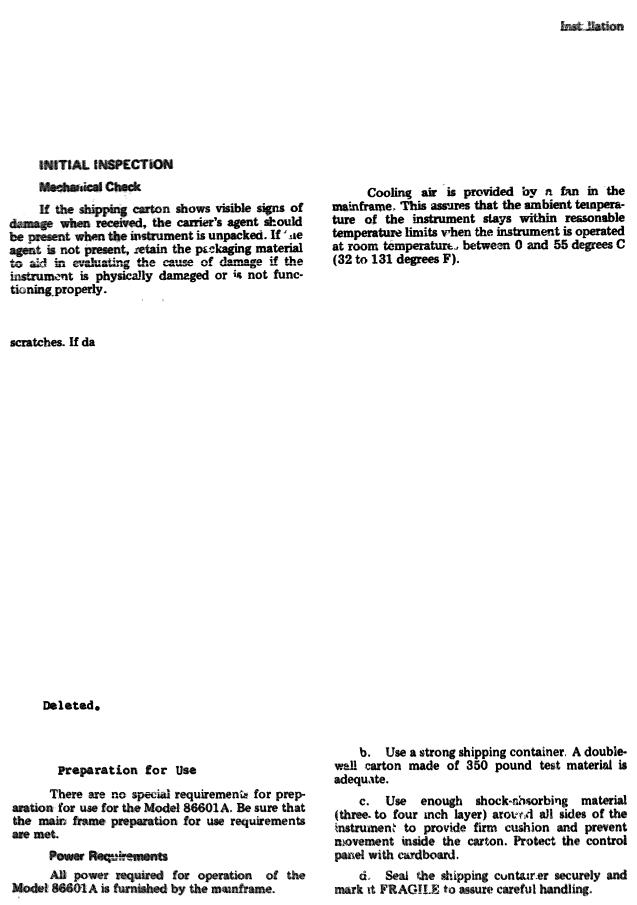
2 - 4 . ment for physical damage
  ken parts and dents or amage is found refer to paragraph 2-7 for recommended claim procedure. If the instru-
ment appears to be free of damage, perform the electrical check (see paragraph 2-5). The packaging material should be retained for possible future use.
2-5. Electrical Check
2-6. The electrical performance check consists of performing the performance test procedures in Section IV of this manual. These procedures enable
the |
operator to determine |
that |
the instrument is, |
or |
is not, operating within |
the |
specifications listed |
in Table 1-1. The initial performance and accuracy of the instrument are certified as stated on the inside front cover of this manual. If the instrument does not operate as specified, refer to paragraph 2-7 for the recommended claim procedure.
2 - 7 . 
2-8. If physical damage is found when the instrument is unpacked, notify the carrier and the nearest Hewlett-Packard Sales/Service office immediately. The HP Sales/Service office will arrange for repair or replacement without waiting for a claim to be settled with the carrier.
2-9.
2 - 1 0 .
2-11.
2 - 1 4 .
2 - 1 5 .
2-16. Storage and Shipment
2-17 If the instrument is to be stored for an extended period of time it should be enclosed in a clean sealed enclosure.
2-18. Original Packaging
2-19. The same containers and materials used in factory packaging can be obtained through any Hewlett-Packard Sales/Service office l
2 - 20 . If the instrument is being returned to Hewlett-Packard for service attach a tag indicating the type of service required, return address, model number and full serial number Also mark the container FRAGILE to assure careful handling.
2-21. In any correspondence refer to the instrument by model number and full serial number.
2-22. Other Packaging Material
2-23. The following general instructions should be followed when repackaging with commercially available materials :
a. Wrap the instrument in heavy paper or plastic. (If shipping to a Hewlett-Packard Service office or center, attach a tag indicating the type of service required, return address, model number and full serial number.)
2 - 1 2 .
2-13.
2 - 1
Model 86601A
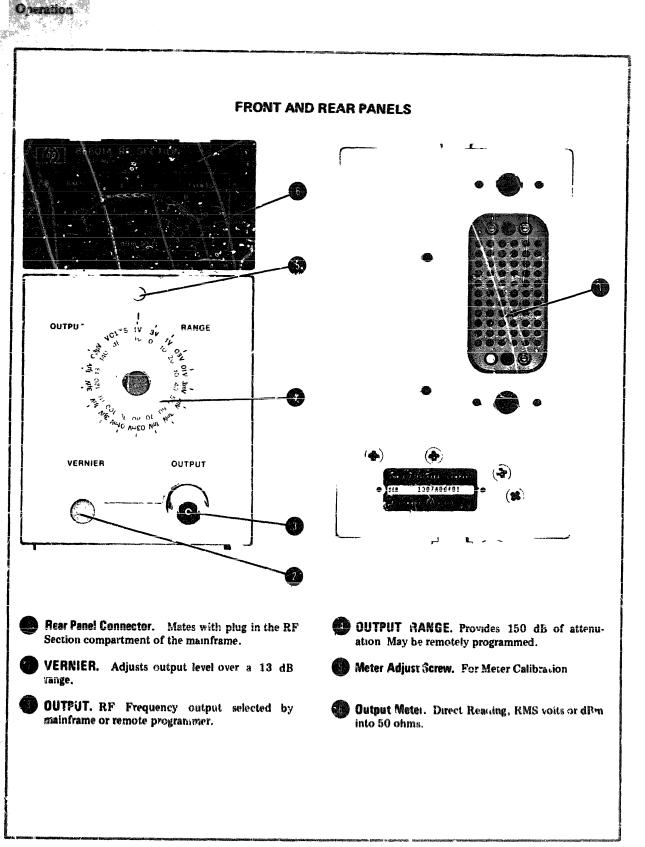
Figure 3-1. Front and Rear Panel Controls, Indicators and Connectors
3 - 0
Model 86601A
|
S E C T I O N I I I |
|
O P E R A T I O N |
3-1. INTRODUCTION |
3-8. |
3 - 2 . |
|
3 - 3 . |
3-9. The front panel attenuator controls are in- |
hibited when the instrument is operated in the remote mode.
NOTE
NOTE
If a modulation plug-in section is not used it will be necessary to have the Model 86631A Auxiliary Section in place in the modulation plug-in drawer.
3-4. PANEL FEATURES
3-5. Front and rear panel controls, indicators and connectors of the Model 86601A are shown in Figure 3-1.
3-6. OPERATING PRINCIPLES
3-7. The Model 86601A may be operated by front panel controls in the local mode or externally programmed in the remote mode.
NOTE
The remote mode is selected by the external programming device which places a ground on pin 5 of the blue ribbon connector (J3) on the rear panel of the Model
Model 86601A Option 001 instruments do not include the 150 dB (10 dB steps) programmable attenuator.
3-10. In Option 001 instrumen Model 86601A may be adjus from +13 to 0 dBm by means
control; in the remote mode the output may be reduced by 9 dB in 1 dB steps.
3-11. OPERATOR’S CHECKS
3-12. During checkout at the factory the Model 86601A RF Section if adjusted for proper operation. No adjustment should be required when the instrument is received.
3-13. The Operator’s Checks specified in Section III of the mainframe are adequate for checking the output frequency of the Model 86601A.
3-14. If a plug-in Modulation Section is being used, the checks specified in Section III of the Modulation Section Manual should also be performed.
3 - 1 / 3 - 2
Model 86601A
S E C T I O N I V
P E R F O R M A N C E T E S T S
4-1. INTRODUCTION
4-2. This section  instructions for performance testing the Model 86601A RF Section plug-in. it is assumed in all tests that the Model 86601A is interconnected with a mainframe that is known to be functioning properly.
4-3. Purpose.
4-4. The performance test procedures are used to check instrument performance for incoming inspection and periodic evaluation. The tests are designed to verify published specifications for the instrument. Each test applies directly to a listed specification (see Table l-l).
4 - 5 .
4-6. Test Equipment R The test equipment required for performance testing is listed in Table 1-2 and in the individual tests. Test instruments other than those listed may be used providing their performance equals or exceeds the specifications listed in Table 1-2.
4-7. Front Panel Checks and Adjustments. Refer to paragraph 3-11, Operator’s Checks.
4-8. PERFORMANCE TESTS
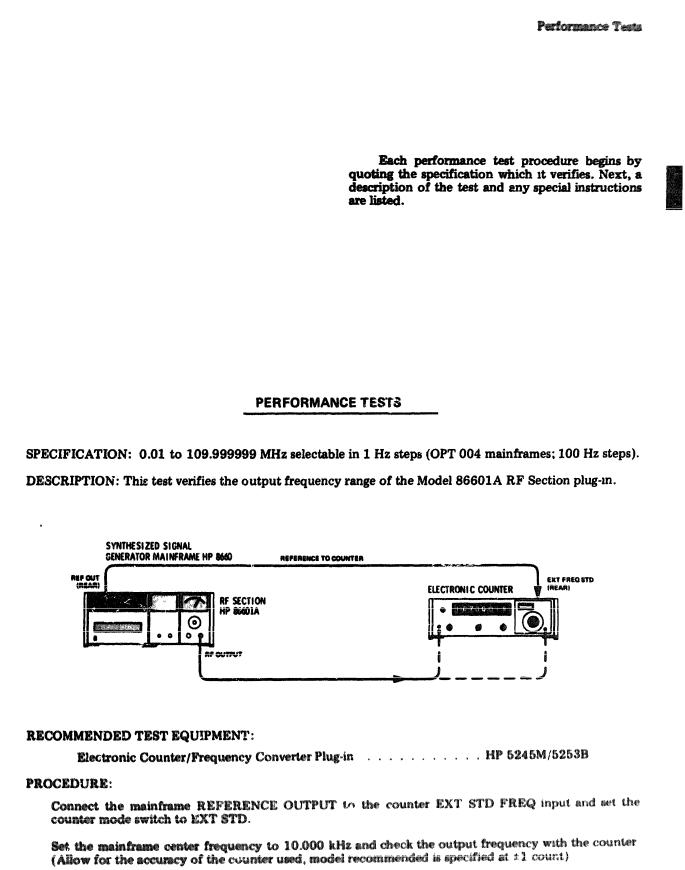
4-9. FREQUENCY RANGE
Figure 4-1. Frequency Range and Accuracy Test Setup
1 .
2 .
4 - 1
Model 86601A
PERFORMANCE TESTS
4 - 9 .
3 .
4 - 1 0 .
4 - 1 1 .
Figure 4-2. Output Accuracy and Level Test Setup
1 .
2 .
4 - 2
Model 86601A
PERFORMANCE TESTS
4-11. OUTPUT ACCURACY AND LEVEL (cont'd)
3 .
voltmeter indicates the correct level ±1 dB. Disconnect the sampling voltmeter.
4.Set the external attenuator to SO dB and connect it between the Model 86601A OUTPUT and the Spectrum Analyzer RF INPUT. Set the Model 86601A output level to +10 dBm.
5.Set a convenient reference level on the Spectrum Analyzer with the vertical scale (LOG 2 dB/Div).
6.Change the external attenuator to 70 dB and the Model 86601A OUTPUT RANGE to 0 dBm. The
Spectrum Analyzer display should be within ± 1 dB of the established reference level.
7.Continue decreasing the attenuation of the external attenuator and the Model 86601A OUTPUT RANGE in 10 dB steps until the OUTPUT RANGE is set to -70 dBm and the external attenuator is set to 0 dB. The spectrum Analyzer display should remain within ±1 dB for levels down to --70 dBm. These tests assure the specification of ±2 dB from -67 dBm to -146 dBm.
4-12. OUTPUT FLATNESS
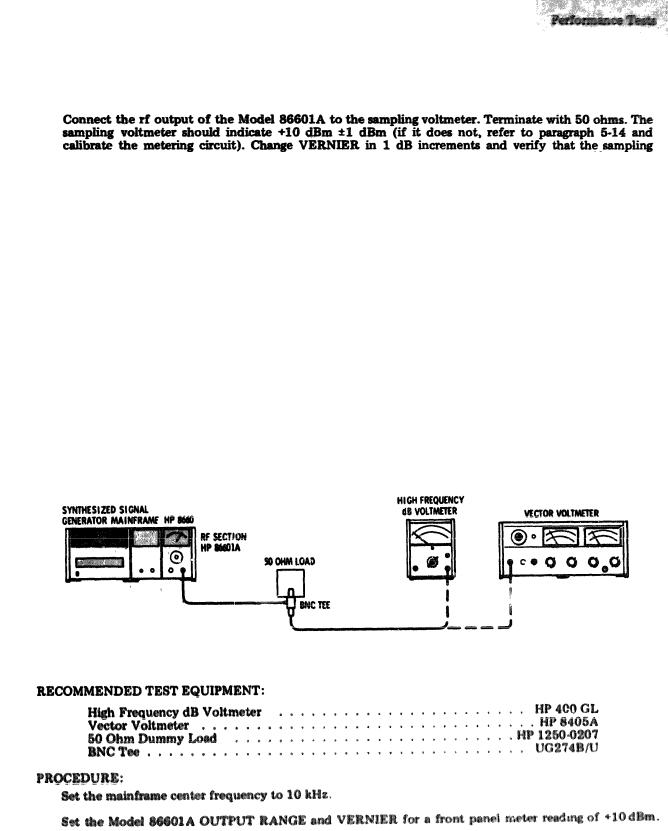
SPECIFICATION: Output flatness: Output level variations with frequency <± 0.5 dBm across the frequency range.
DESCRIPTION: This test verifies flatness of the output signal from 10 kHz to 109.9 MHz.
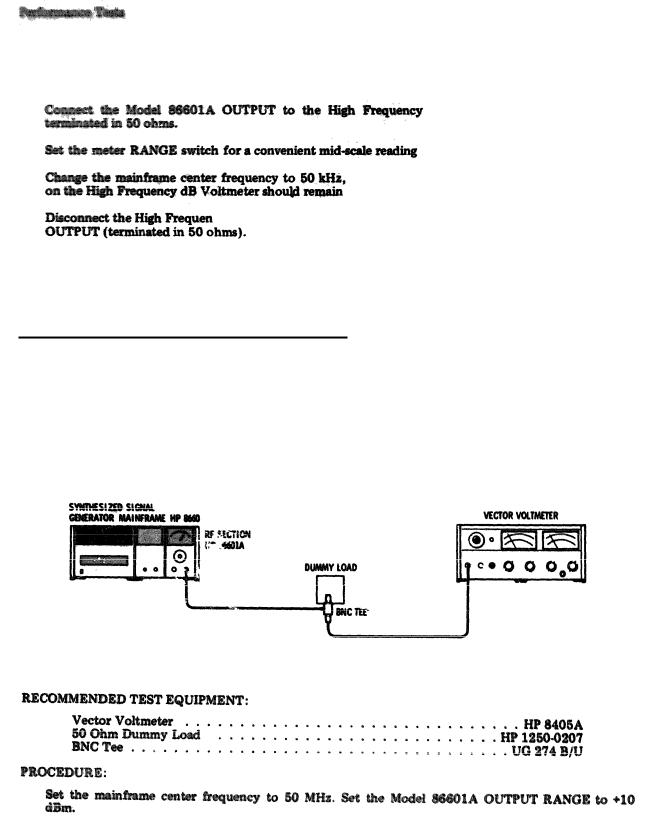
Figure 4-3. Output Flatness Test Setup
1 .
2 .
4 - 3
Model 86601A
PERFORMANCE TESTS
4-12. OUTPUT FLATNESS (con'd)
3 .
4.
5.
dB  a
a  Tee
Tee
on the High Frequency dB voltmeter.
then 100 kHz, and finally 500 kHz. The level read within a ±0.5 dB window.
6 . |
c y dB Voltmeter and connect the Vector Voltmeter to the Model 86601A |
7 .  a Vector Voltmeter range that will provide a convenient mid-scale reference with the mainframe
  uency set to 1 MHz.
8 .  e mainframe center frequency to 10 MHz, then 50 MHz, and finally 109.9 MHz. The reference level indicated on the Vector Voltmeter should remain within the ±0.5 dB window.
4-13. IMPEDANCE: 50 OHMS
SPECIFICATION: SWR less than 2:1 on +10 dBm output range; less than 1.3:1 on 0 dBm output range and below.
DESCRIPTION: The Model 86601A RF OUTPUT is measured with a voltmeter, first with no external load, then with a 50 ohm external dummy load. The source resistance RS is determined and the SWR is calculated by dividing RO by RS (or RS by RO if RO is < RS).
Figure 4-4. Impedance Test Setup
1 .
4 - 4
Model 86601A
PERFORMANCE TESTS
4-13. IMPEDANCE: 50 OHMS (cont'd)
2.
3.Record the RF output level.
VOC
4.Terminate the BNC Tee 50 ohms.
5.Record the RF output level.
V 1
6. The Model 86601A source resistance is found by using the following formula:
RS = R o V o c - R O
V 1
VOC = 1st measurement (step 3)
V1 = 2nd measurement (step 5)
RO = 50 ohm termination
7. Determine SWR. SWR = R O
R S R O
8.Record SWR
9.Reduce the Model 86601A OUTPUT RANGE to 0 dBm.
10.Repeat steps 2 through 8 at 0 dBm. SWR should be < 1.3:1.
11.Record SWR
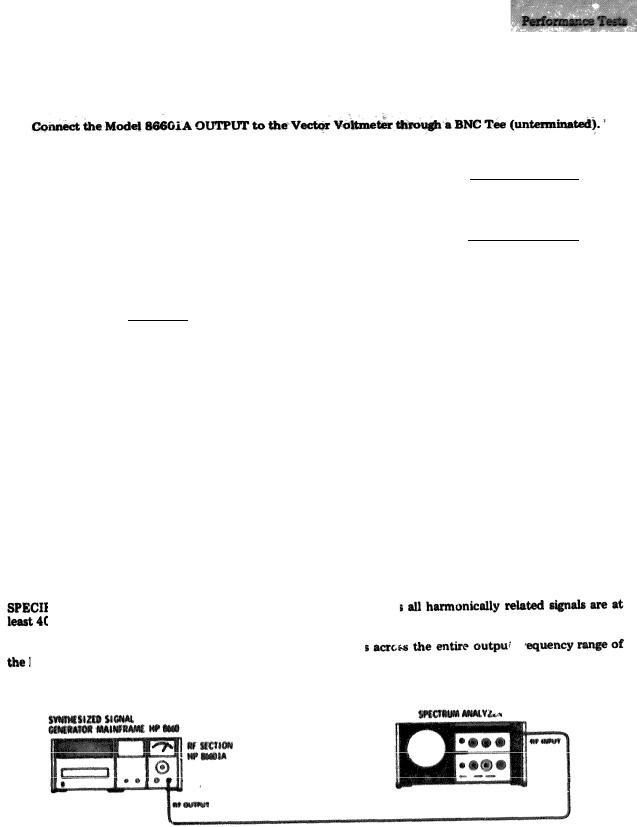
4-14. HARMONIC SIGNALS
FICATION: With the Model 86601A terminated in 50 ohm 0 dB below the selected frequency.
DESCRIPTION: Th  cond and third harmonic Model 86601A.
Figure 4-5. Harmonic Signal Test Setup
mVrms
mVrms
4 - 5
|
|
|
Model 86601A |
|
PERFORMANCE |
TESTS |
|
4 - 1 4 . |
|
|
|
|
|
HP |
8554L/8552B/140S |
1. |
1A OUTPUT RANGE to -10 dBm and set the VERNIER control to +3 dBm. |
||
|
|||
2 . |
odel 8660A OUTPUT to the Spectrum Analyzer RF INPUT and set the Spectrum |
||
|
|||
|
INPUT ATTENUATION to 20 dB. |
|
|
3 . |
third harmonics at the following center frequencies: 10 kHz, 400 kHz, 4 MHz, 10 |
||
|
|||
|
MHz. All harmonic signals should |
be more than 40 |
dB below the level of the |
4-15. SPURIOUS SIGNALS
SPECIFICATION: All nonharmonically related spurious signals are at least 80 dB below the selected output signal. Power line related spurious signals are at least 70 dB below the carrier.
DESCRIPTION: This test checks for common spurious signals by mixing the signal from the unit under test with a reference signal offset by 1 kHz. The Wave Analyzer measures common spurious signals generated in the unit under test.
Figure 4-6. Spurious Signal Test Setup
1 .
4 - 6
Model 86601A
PERFORMANCE TESTS
4-15. SPURIOUS SIGNALS (cont’d)
2.Connect the equipment as shown in Figure 4-6.
3.Set the reference unit center frequency to 50.001 MHz and the output level to +13 dBm.
4.Set the center frequency of the unit under test to 50 MHz and the output level to -87 dBm.
5.Set the Wave Analyze; mode switch to NORMAL and scale value to RELATIVE.
6.Set the wave Analyzer to 1 kHz and adjust levels for a 0 dB reading on the scale.
7.Set the unit under test OUTPUT RANGE and VERNIER to -7 dBm.
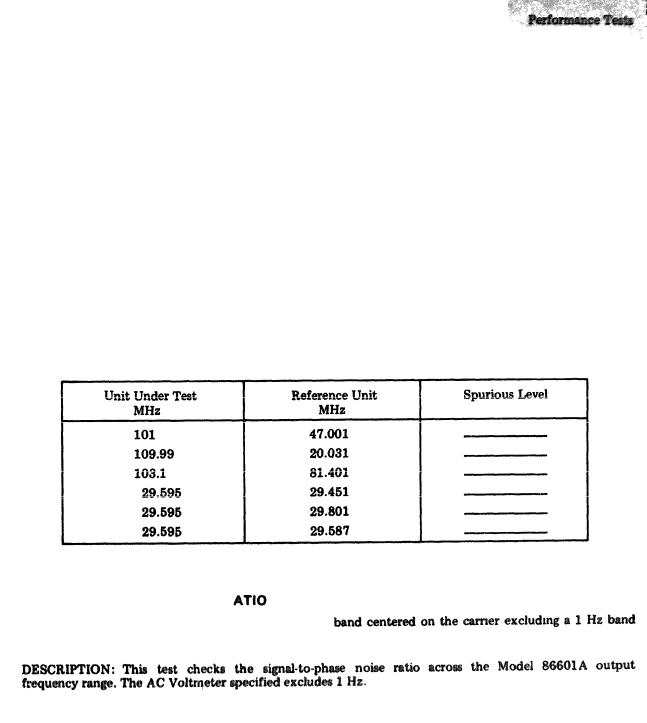
8.Set the reference unit and the unit under test as shown in Table 4-1 and note that spurious levels are lower than -80 dB (0 dB on Wave Analyzer scale).
9.Corrected reading is -80 dB minus the Wave Analyzer meter reading.
Table 4-1. Spurious Signal Checks
4-16. SIGNAL-TO-PHASE NOISE R
SPECIFICATION: Lower than -50 dB in a 30 kHz centered on the carrier.
4 - 7

Model 86601A
4-10. SIGNAL-TO-PHASE NOISE RATIO
|
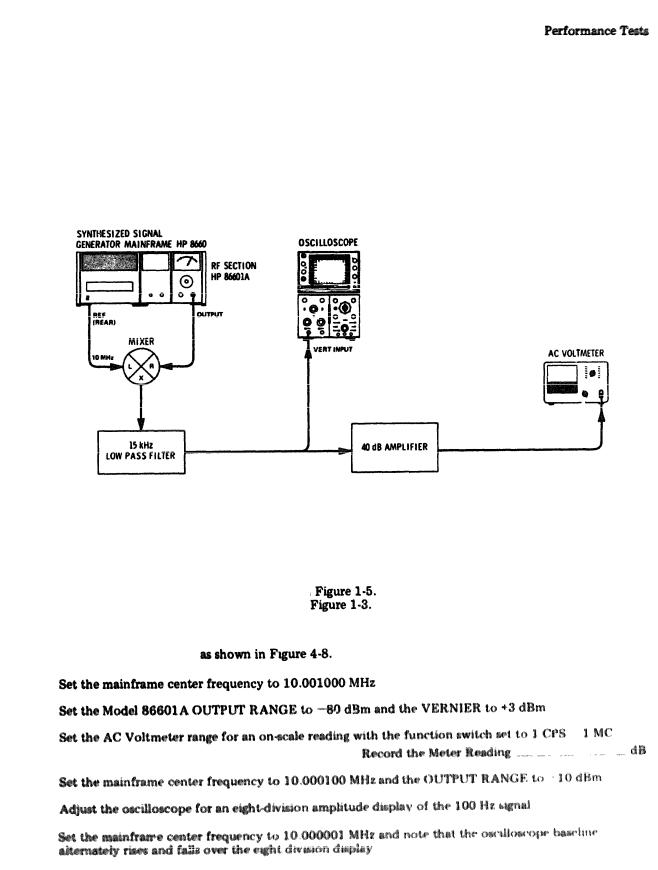
Figure 4-7. Signal-to-Phase Noise Test Setup |
|
RECOMMENDED TEST EQUIPMENT: |
|
|
Oscilloscope |
HP |
180A/1801A/1821A |
Double Balanced |
Mixer |
HP 10514A |
AC Voltmeter |
|
H P 4 0 3 A |
40 dB Amplifier (special) see details in Figure 1-5. Low Pass Filter (special) see details in Figure 1-3.
PROCEDURE:
1. the equipment as shown in Figure 4-7.
2.mainframe center frequency to 10.001 MHz. Set the Model 86601A OUTPUT RANGE to -60
d the VERNIER for a meter reading of +3 dBm.
3. Set the RF Voltmeter Function Switch to 1 CPS-1 MC and record the reading. |
|
dB |
4.Set the mainframe center frequency to 10.000100 MHz and the OUTPUT RANGE to -10 dBm.
5.Adjust the oscilloscope for an ei
6.
7.
8 .
9 .
1 0 .
4 - 8
Model 86601A
PERFORMANCE TESTS
4-17. SIGNAL-TO OISE RATIO
SPECIFICATION: Lower than -70 dB in a 30 kHz hand centered on the carrier excluding a 1 Hz bandwidth centered on the carrier.
DESCRIPTION: This test checks AM noise across the Model 86601A frequency range. The AC voltmeter specified excludes 1 Hz.
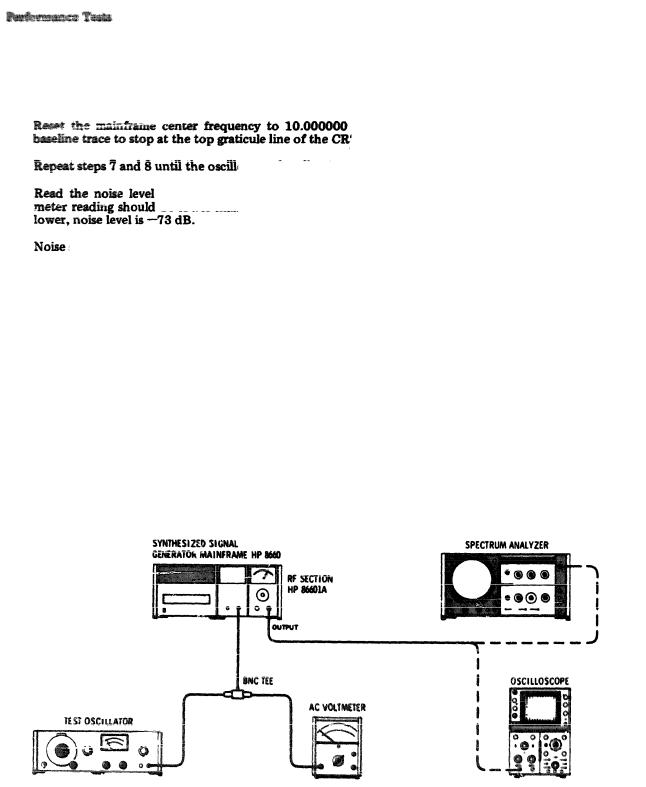
Figure 4-8. Signal-to-AM Noise Ratio Test Setup |
|
|
RECOMMENDED TEST EQUIPMENT |
|
|
Oscilloscope |
HP |
180A/1801A/1821A |
Double Balanced Mixer |
|
HP10514A |
AC Voltmeter |
|
HP 403A |
40 dB Amplifier (special); see details in Low Pass Filter (special); see details in
PROCEDURE:
1. Connect the equipment
2 .
3 .
4 .
5 .
6.
7.
4 - 9
Model 86601A
PERFORMANCE TESTS
4-17. SIGNAL-TO-AM NOISE RATION (cont'd)
8.
9.
1 0 .
1 1 .
MHz at a time that will cause the oscilloscope
T.
oscope baseline trace is stopped at the top graticule line ±1/10 div.
on the AC Voltmeter. Noise = -70 dB ± the difference in meter readings. The be lower than the reference established in step 4. Example: Meter reading is 3 dB
should be lower than -70 dB.
Record Noise Level |
dB |
4-18. RESIDUAL FM
SPECIFICATION: <1 Hz rms in 2 kHz bandwidth centered on the carrier.
DESCRIPTION: Residual FM is checked indirectly in the checks for signal-to-phase noise across the Model 86601A frequency range.
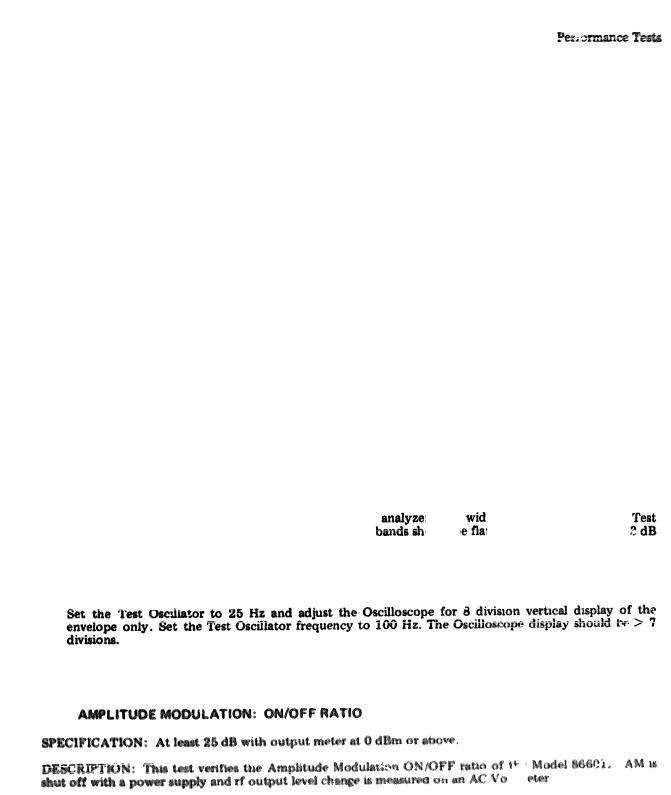
4-19. AMPLITUDE MODULATION
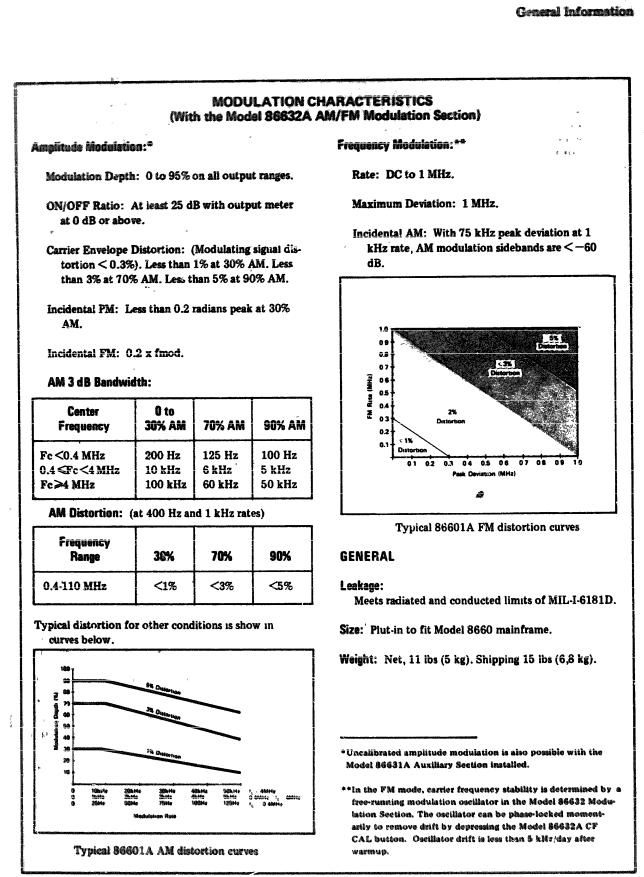
SPECIFICATION: 0 to 95% on all output ranges (with Model 86632A or 86631A Modulation Section in place).
DESCRIPTION: This test checks AM frequency response with the mainframe center frequency set to 50 MHz, 3 MHz, and 300 kHz. AM rate is provided from a test oscillator and measured on a Spectrum Analyzer and Oscilloscope.
Figure 4-9. Amplitude Modulation Test Setup
4 - 1 0
Model 86601A |
|
|
PERFORMANCE |
TESTS |
|
4-19. AMPLITUDE MODULATION (cont’d) |
|
|
RECOMMENDED TEST EQUIPMENT: |
|
|
Spectrum Analyzer |
HP |
8553B/8552B/140S |
High Frequency dB Voltmeter |
|
HP 400 GL |
Oscilloscope |
HP |
180A/1801A/1821A |
Test Oscillator |
|
HP 651B |
BNC Tee |
|
UG 274 B/U |
PROCEDURE:
1.Connect the equipment as shown in Figure 4-9.
2.Set the Spectrum Analyzer as follows: INPUT ATTENUATION 30 dB, BANDWIDTH 1 kHz, SCAN WIDTH 10 kHZ, CENTER FREQUENCY 50 MHz, LOG-LINEAR 2 dB/Div, SCAN TIME 20 mSec/Div and VIDEO FILTER to OFF,
3.Set the mainframe center frequency to 50 MHz and the Model 86601A output level to +3 dBm.
4.Set the Model 86631A AM switch to ON (if the Model 86632A is being used, set the MODE switch to AM and the SOURCE switch to EXTERNAL AC and AM to 50%).
5.Set the Test Oscillator output to 10 kHz at .5 Vrms as read on AC Voltmeter.
6. Adjust the spectrum analyzer until the carrier is at the top graticule line. Amplitude Modulation should be 50% ±5% with sidebands down -12 dB ±0.5 dB.
7.Adjust the Test Oscillator frequency from 10 Hz to 50 kHz. The AM % should be flat ± 4 db from 10 Hz to 20 kHz and down 3 dB at about 50 kHz.
8. Set the mainframe |
center frequency to 3 MHz and |
r scan |
th to 2 kHz. Adjust the |
Oscillator frequency |
from 10 Hz to 10 kHz. The side |
ould b |
t ±.2 dB to 2 kHz; down |
at about 5 kHz; down 8 dB at about 10 kHz.
9. Set the mainframe center frequency to 300 kHz. Disconnect the rf OUTPUT from the Spectrum Analyzer and connect it to the Oscilloscope.
1 0 .
4 - 2 0 .
4 - 1 1

Model 86601A
PERFORMANCE TESTS
4 - 2 0 .
Figure 4-10. Amplitude Modulation ON/OFF Ratio Test Setup |
|
ENDED TEST EQUIPMENT: |
|
Broadband Sampling Voltmeter |
HP 8406A |
Power Supply |
HP 721A |
PROCEDURE:
1.Connect the equipment as shown in Figure 4-10 (with the Model 86631A AM switch off).
2.Set the power supply to +4 Vdc.
3. Set |
the mainframe center |
frequency to 50 MHz and output level of the Model 86601A to +13 dBm. |
Set |
a reference point on |
the Voltmeter. |
4.Switch the Model 86631A AM switch to ON.
5. The Model 86601A output level should drop to <-12 dBm. (25 dB ON/OFF ratio).
4 - 2 1 . 
SPECIFICATION: Envelope distortion should be less than 1% at 30% AM. Less than 3% at 70% AM. Less than 5% at 90% AM.
DESCRIPTION: Amplitude Modulation distortion is checked at 30%, 70% and 90%.
4-12
Model 86601A
PERFORMANCE TESTS
4-21. AMPLITUDE  ODULATION CARRIER ENVELOPE DISTORTION (cont’d)
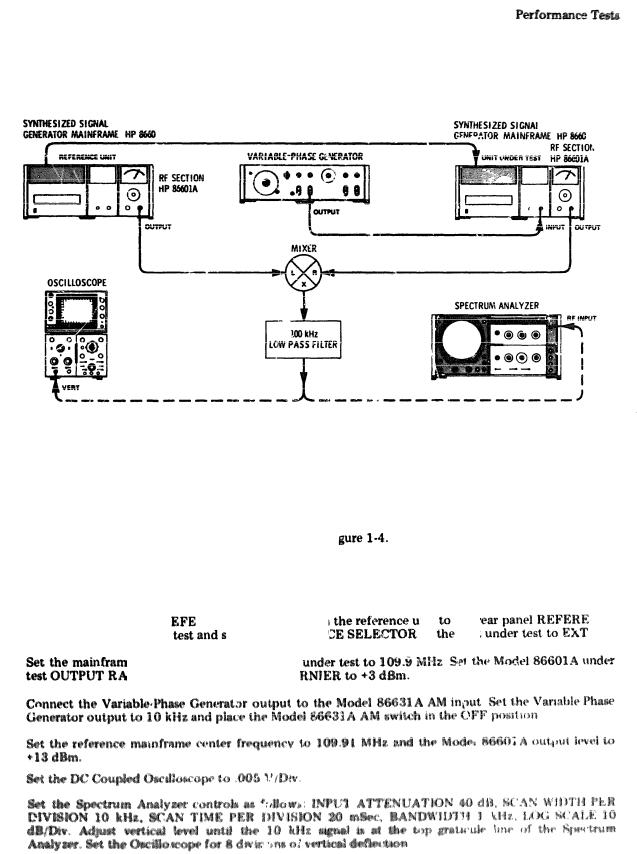
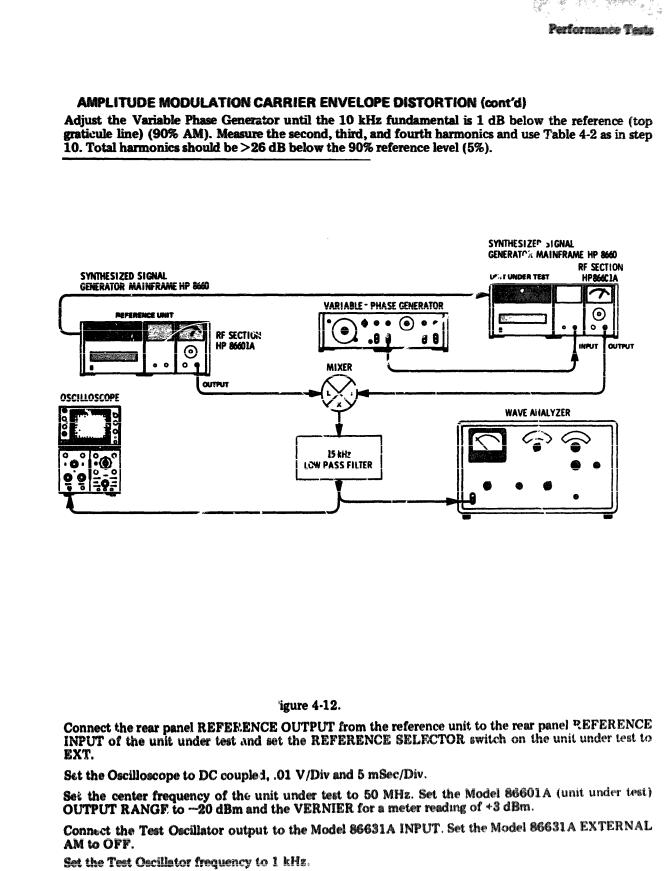
Figure 4-11. Amplitude Modulation Carrier Envelope Distortion Test Setup
RECOMMENDED TEST EQUIPMENT’: |
|
Double Balanced Mixer |
HP 10514A |
Spectrum Analyzer |
HP 8553B/8552B/140S |
Synthesized Signal Generator |
HP 8660A/B/866C1A/86631A |
Variable Phase Generator |
|
Oscilloscope |
HP 180A/1801A/1821A |
Low Pass Filter 100 kHz (special); see details in Fi |
|
PROCEDURE:
1.Connect the equipment as shown in Figure 4-11.
2. Connect the rear panel R |
RENCE OUTPUT from |
nit |
the r |
NCE |
INPUT of the unit under |
et the REFEREN |
o f |
unit |
. |
3.
4.
5 .
6.
7.
e center frequency of time unit NGE to --20 dBm  the VE
4 - 1 3
Model 86601A
PERFORMANCE TESTS
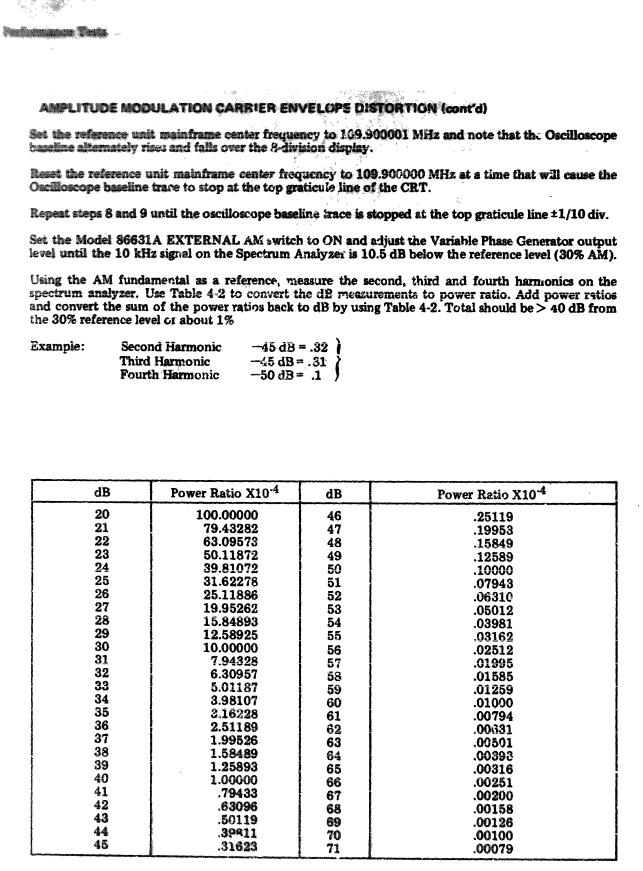
4-21.
8 .
9 .
1 0 .
1 1 .
1 2 .
=.73 = -41.5 dB
13.Adjust the Variable Phase Generator until the 10 kHz fundamental is 3 dB below the reference (top graticule line) (70% AM). Using the 10 kHz fundamental as a reference, measure the second,-third and fourth harmonica and use Table 4-2 as in step 10. Total harmonics should be > 30 dB below the 70% reference level (3%).
Table 4-2. Carrier Envelope Distortion Test
4 - 1 4
Model 86601A
PERFORMANCE TESTS
4 - 2 1 .
1 4 .
4-22. INCIDENTAL PHASE MODULATION
SPECIFICATION: Less than 0.2 radians peak at 30% AM.
DESCRIPTION: This test checks the AM to PM ratio. AM is set to 30% Modulation with an external Test Oscillator. The ratio is measured with a Wave Analyzer.
|
|
Figure 4-12. Incidental PM Test Setup |
||
RECOMMENDED TEST EQUIPMENT: |
|
|
||
Synthesized Signal Generator |
HP |
8660A/B/86601A/86631A |
||
Oscilloscope |
|
|
HP 180A/1801A/1821A |
|
Test |
Oscillator |
|
|
HP 651B |
Wave |
Analyzer |
|
|
H P 3 0 2 A |
Double Balanced |
Mixer |
|
HP 10514A |
|
15 kHz Low Pass Filter (special); see details in Figure 1-3. |
HP 203A |
|||
Variable Phase |
Generator |
|
||
PROCEDURE:
1. Connect the equipment as shown in F
2 .
3 .
4 .
5.
6.
4 - 1 5
 Loading...