

Page 1

Getting Started
with the
TI-82 STATS
Page 2

Important information
Texas Instruments makes no warranty, either express or implied, including
but not limited to any implied warranties of merchantability and fitness for
a particular purpose, regarding any programs or book materials and makes
such materials available solely on an "as-is" basis.
In no event shall Texas Instruments be liable to anyone for special, collateral,
incidental, or consequential damages in connection with or arising out of
the purchase or use of these materials, and the sole and exclusive liability of
Texas Instruments, regardless of the form of action, shall not exceed the
purchase price of this calculator. Moreover, Texas Instruments shall not be
liable for any claim of any kind whatsoever against the use of these
materials by any other party.
US FCC Information Concerning Radio Frequency Interference
This equipment has been tested and found to comply with the limits for a
Class B digital device, pursuant to Part 15 of the FCC rules. These limits are
designed to provide reasonable protection against harmful interference in a
residential installation. This equipment generates, uses, and can radiate
radio frequency energy and, if not installed and used in accordance with the
instructions, may cause harmful interference with radio communications.
However, there is no guarantee that interference will not occur in a
particular installation.
If this equipment does cause harmful interference to radio or television
reception, which can be determined by turning the equipment off and on,
you can try to correct the interference by one or more of the following
measures:
• Reorient or relocate the receiving antenna.
• Increase the separation between the equipment and receiver.
• Connect the equipment into an outlet on a circuit different from that to
• Consult the dealer or an experienced radio/television technician for
Caution: Any changes or modifications to this equipment not expressly
approved by Texas Instruments may void your authority to operate the
equipment.
which the receiver is connected.
help.
© 2003 Texas Instruments Incorporated
.
ii
Page 3

Contents
About the TI-82 STATS....................................................................1
About this book ..............................................................................2
TI-82 STATS keys..............................................................................3
Turning the TI-82 STATS on and off...............................................4
Home screen....................................................................................5
y and ƒ keys.........................................................................7
‘ and y 5.........................................................................8
Entering an expression ...................................................................9
TI-82 STATS menus........................................................................10
Editing and deleting.....................................................................13
Using ¹ and Ì .............................................................................15
Using parentheses.........................................................................17
Storing a value..............................................................................19
Graphing a function .....................................................................21
Changing mode settings...............................................................23
Setting the graphing window......................................................26
Using q....................................................................................28
Building a table.............................................................................29
Using the CATALOG......................................................................31
Performing simple calculations....................................................32
Using the equation solver ............................................................35
Entering data into lists .................................................................37
Plotting data .................................................................................39
iii
Page 4

Calculating a linear regression.....................................................43
Calculating statistical variables ....................................................44
Using the MATRIX Editor..............................................................45
Error messages ..............................................................................49
Resetting defaults.........................................................................50
Connecting to a computer ...........................................................51
Quick reference.............................................................................51
Texas Instruments (TI) Support and Service.................................53
Battery precautions.......................................................................54
iv
Page 5

About the TI-82 STATS
The TI-82 STATS includes these features:
• Graphing - store, graph, and analyze up to 10 functions,
up to 6 parametric functions, up to 6 polar functions, and
up to three sequences.
• Sequences - generate sequences and graph them over
time.
• Tables - create function evaluation tables to analyze many
functions simultaneously.
• Matrices - enter and save up to 10 matrices and perform
standard matrix operations on them.
• Lists - enter and save as many lists as memory allows for
use in statistical analyses.
• Statistics - perform one- and two-variable, list-based
statistical analyses, including logistic and sine regression
analysis; plot the data as a histogram, xyLine, scatter plot,
modified or regular box-and-whisker plot, or normal
probability plot.
The CD included with your TI-82 STATS package also includes an
electronic guidebook, which is a complete reference manual for
the TI-82 STATS. If the CD is not available, you can download a
copy of the electronic guidebook from the Texas Instruments web
page at
education.ti.com/guides
1
Page 6

About this book
This Getting Started Guide was designed for:
• students who are using a graphing calculator for the first
time.
• student who are using the TI-82 STATS for the first time.
• students who need a quick review of procedures for
common operations on the TI-82 STATS.
This book gives a quick overview of each topic, along with
keystroke instructions for easy examples. All examples assume
that the TI-82 STATS is using default settings. For complete
information on any topic, see the electronic guidebook on the CD
that came with your TI-82 STATS.
Look for the
symbol at the top of the page in this guide.
These notes direct you to the chapter in the Guidebook that
provides complete details about the topic.
2
Page 7

g
TI-82 STATS keys
y
Provides access
to the function
or character
shown above
each key in
reen.
ƒ
Provides access
to the
characters
shown above
each key in
orange.
É
Turns on the
TI-82 STATS.
} ~ † |
Let you move
the cursor in
four directions.
‘
Clears (erases)
the entry line
or deletes an
entry and
answer on the
home screen.
Í
Evaluates an
expression,
executes an
instruction, or
selects a menu
item.
3
Page 8

Turning the TI-82 STATS on and off
To turn on the TI-82 STATS, press É. The É
key is located at the lower left corner of the
TI-82 STATS.
For more details,
see Guidebook
Chapter 1.
To turn off the TI-82 STATS, press the y key
followed by the É key. OFF is the second function of É.
When you turn off the TI-82 STATS, all settings and memory
contents are retained. The next time you turn on the TI-82 STATS,
the home screen displays as it was when you last used it.
Automatic Power Down™
To prolong the life of the batteries, Automatic Power Down™
(APD™) turns off the TI-82 STATS automatically after about five
minutes without any activity. The next time you turn on the
calculator, it is exactly as you left it.
4
Page 9

Home screen
When you turn on your TI-82 STATS the first time, you should see
this screen:
If you cannot read the text on the screen, press the y key and
then press and hold † or }. Pressing † lightens the screen and
} darkens the screen.
To clear this text from your screen, press ‘ twice. You should
now see the home screen, a blank screen with a flashing cursor.
The home screen is where you enter problems and see results.
If you pressed ‘ above and you still do not see a blank home
screen, press the y key followed by the z key (to select
QUIT).
5
Page 10
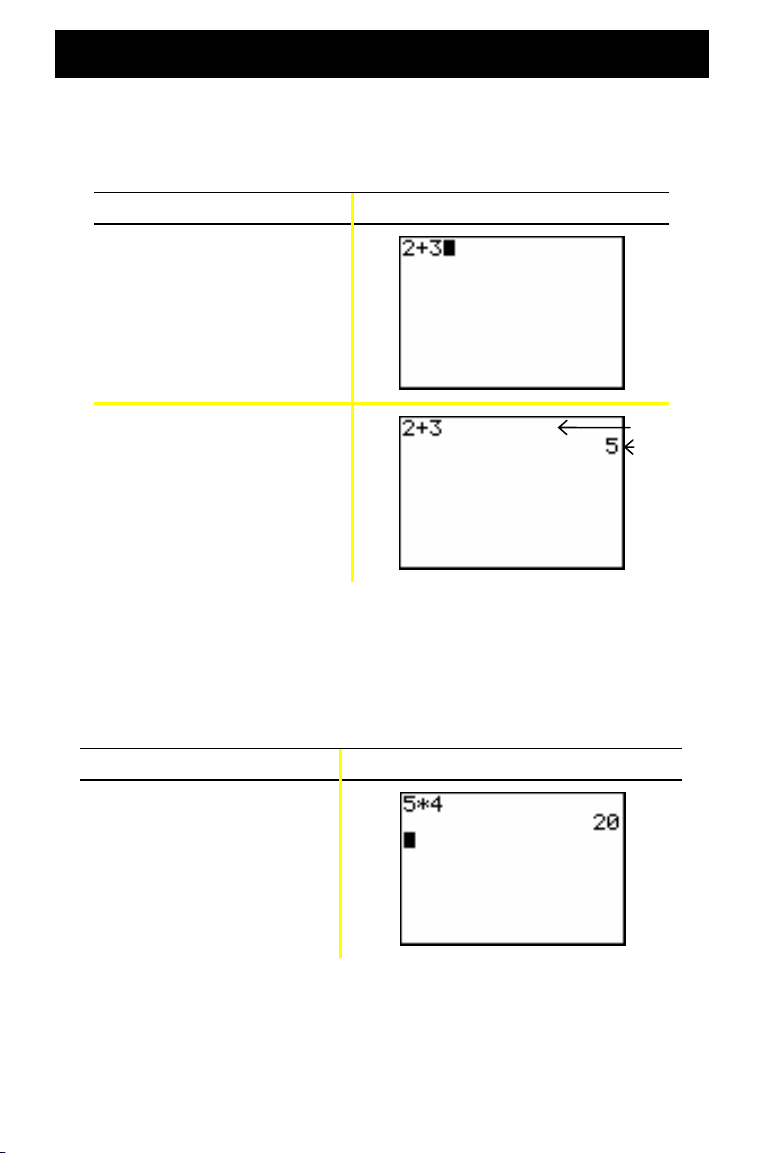
Home screen (continued)
Example: Add 2 + 3 on the home screen.
Press Result
2 Ã 3
Í
Note: Results are displayed on the next line (the answer line), not on the
entry line.
Example: Multiply 5 x 4.
Press Result
5 ¯ 4
Í
Entry line
Answer
line
6
Page 11

y and ƒ keys
Most keys on the TI-82 STATS can perform two or more functions.
To use a function printed on a key, press the key. To use a
function printed above a key in green or orange, you must first
press the y key or the ƒ key.
y key
Second functions are printed above the keys in green (the same
color as the y key). Some secondary functions enter a function
or a symbol on the home screen (sin-1 or ‡, for example). Others
display menus or editors.
To view the ANGLE menu, for example, look for ANGLE (printed
in green) above the key near the top of the TI-82 STATS
keyboard. Press the y key (and then release it) and then press
. In this book and in the TI-82 STATS Guidebook, this key
combination is indicated by y ;, not y . When you
see these key combinations, press each key separately, not at the
same time.
Note: The flashing cursor changes to Þ when you press the y key. If
you press the
pressing
y
key accidentally, you can undo the action by
y
a second time.
ƒ key
The ƒ key lets you enter the alphabetic characters and some
special symbols. To enter T, for example, press ƒ (and then
release it) and then press ¶. In this book and in the TI-82 STATS
Guidebook, this key combination is indicated by ƒ [ T ].
If you have several alphabetic characters to enter, press
y 7 to avoid having to press the ƒ key multiple times.
This locks the alpha key in the On position until you press ƒ a
second time to unlock it.
Note: The flashing cursor changes to Ø when you press the
If you press the
pressing
ƒ
ƒ
key accidentally, you can undo the action by
a second time.
7
ƒ
key.
Page 12

‘ and y 5
‘ key
The ‘ key erases the home screen. This key is located just
below the four blue arrow keys at the upper right corner of the
TI-82 STATS keyboard. If you press ‘ during an entry, it clears
the entry line. If you press ‘ when the cursor is on a blank
line, it clears everything on the home screen.
Although it does not affect the calculation, it is frequently
helpful to clear the previous work from the home screen before
you begin a new problem. As you work through this guide, we
recommend that you press ‘ each time you begin a new
Example. This removes the previous example from the home
screen and ensures that the screen you see matches the one
shown in the example.
y 5
If you accidentally press a menu key, pressing ‘ will
sometimes return you to the home screen, but in most cases you
must press y 5 to leave the menu and return to the home
screen.
8
Page 13
Entering an expression
An expression consists of numbers, variables, operators, functions,
and their arguments that evaluate to a single answer. 2X + 2 is an
expression.
Type the expression, and then press Í to evaluate it. To enter
a function or instruction on the entry line, you can:
• Press its key, if available. For example, press «.
— or —
• Select it from the CATALOG. For example, press y
N, press † to move down to
select log(.
— or —
• Select it from a menu, if available. For example, to find
round function, press , press ~ to select NUM,
the
then select 2:round(.
log(, and press Í to
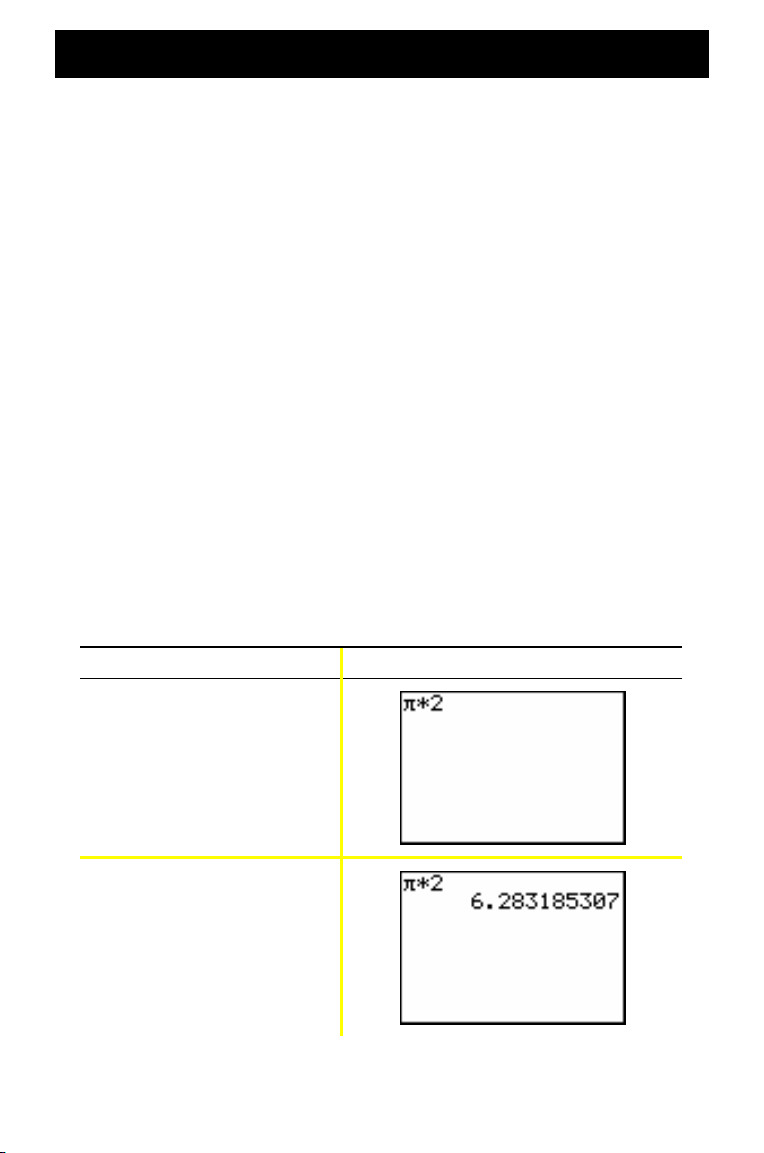
Example: Enter and evaluate the expression p Q
Press Result
y B ¯ 2
Í
9
2.
Page 14
TI-82 STATS menus
Many functions and instructions are entered on
the home screen by selecting from a menu.
To select an item from the displayed menu:
For more details,
see Guidebook
Chapter 1.
• Press the number or letter shown at the left of that item.
— or —
• Use the cursor arrow keys, † or }, to highlight the item,
and then press Í.
Some menus close automatically when you make a selection, but
if the menu remains open, press y 5 to exit. Do not press
‘ to exit, since this will sometimes delete your selection.
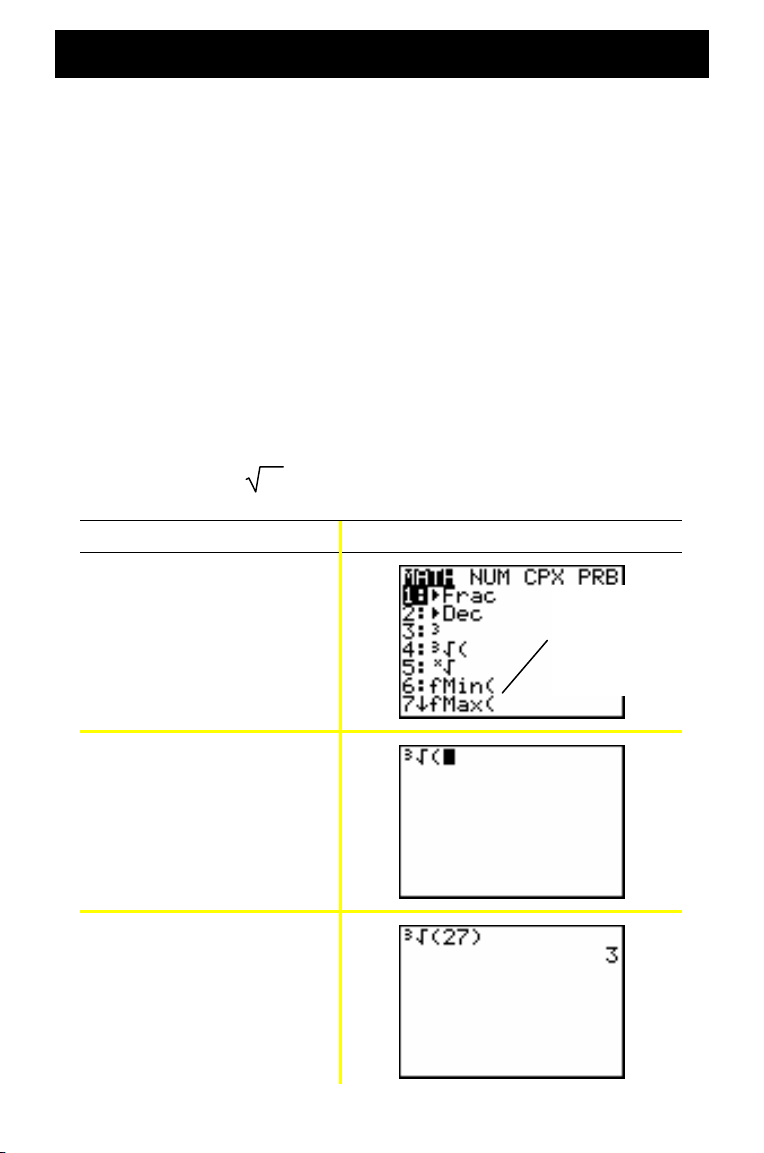
Example: Enter
Press Result
3
27 on the home screen entry line.
Menus
containing an
arrow next to
the final item
continue on a
second page.
4
— or —
† † † Í
2 7 ¤
Í
10
Page 15
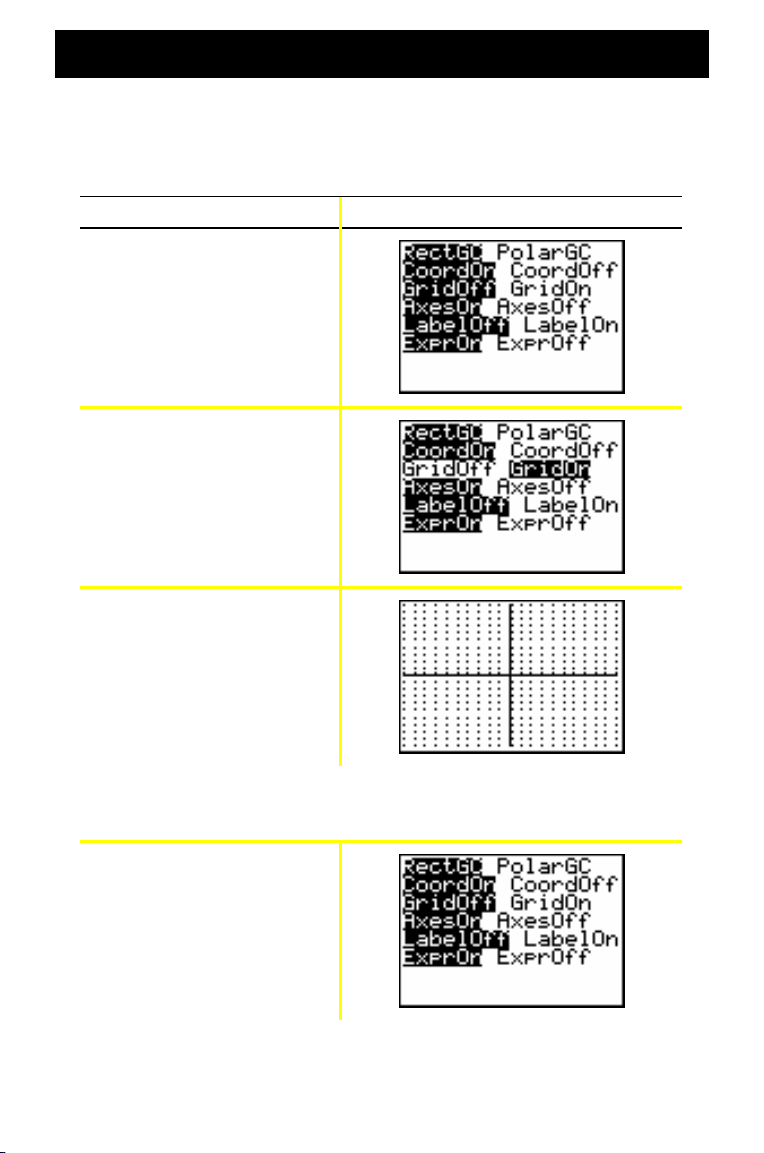
TI-82 STATS menus (continued)
Example: Change the FORMAT menu setting to display grid
points on the graph.
Press Result
y .
† † ~
Í
s
Example: Turn off the display of grid points.
y . † †
Í
Note: Press
y 5
or
‘
to close the FORMAT menu and return
to the home screen.
11
Page 16

TI-82 STATS menus (continued)
Summary of menus on the TI-82 STATS
Press To display
y 8 LINK menu — to communicate with another
calculator.
y L MEMORY menu — to check available memory and
manage existing memory.
MATH menu — to select a math operation.
VARS menu — to select variable names to paste to
the home screen.
y , STAT PLOTS menu — to define statistical plots.
y N CATALOG menu — to select from a complete,
alphabetic list of all TI-82 STATS built-in functions
and instructions.
y . FORMAT menu — to define a graph’s appearance.
y > MATRIX menu — to define, view, and edit
matrices.
y < DRAW menu — to select tools for drawing on
graphs.
y = DISTRIBUTIONS menu — to select distribution
functions to paste to the home screen or editor
screens.
y : TEST menu — to select relational operators
(=, ƒ, {, |, etc.) and Boolean operators (and, or,
xor, not) to paste to the home screen.
12
Page 17
Editing and deleting
You can change any expression or entry using the backspace |
key, the delete { key, or the insert y 6 key. You can make a
change before or after you press Í.
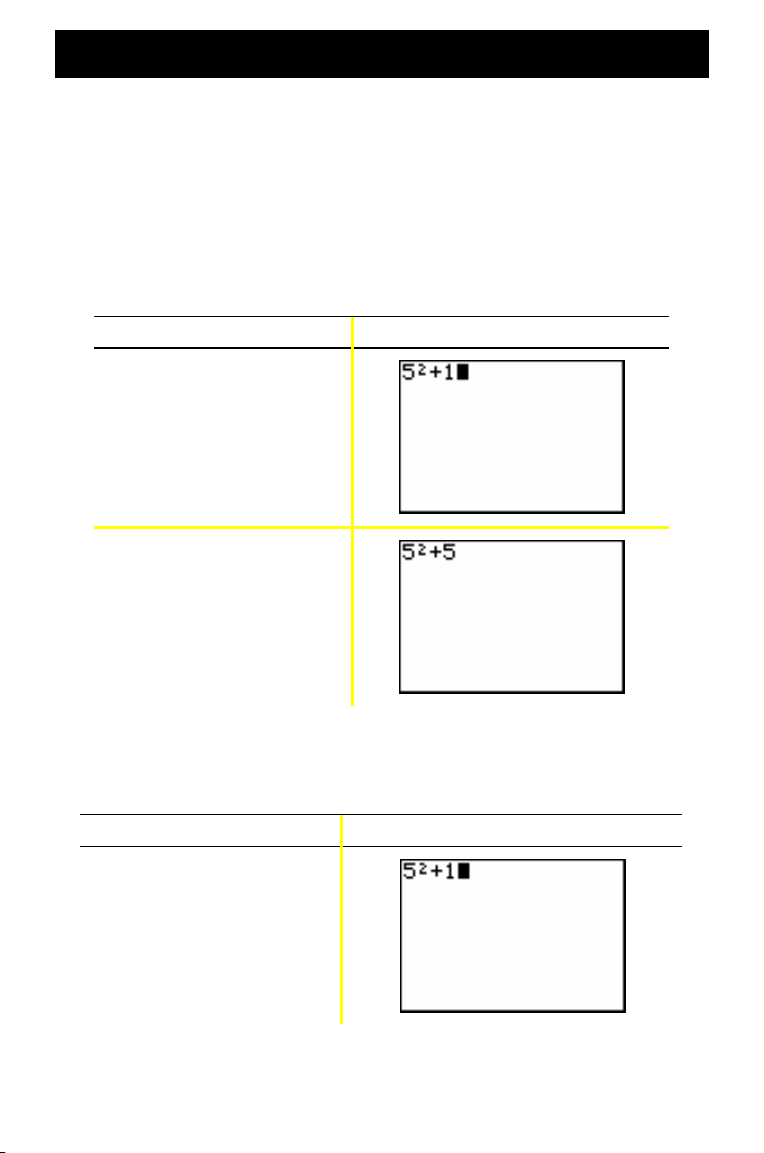
Example: Enter the expression 5
2
+ 1, and then change the
expression to 52 + 5.
Press Result
5 ¡ Ã 1
| 5
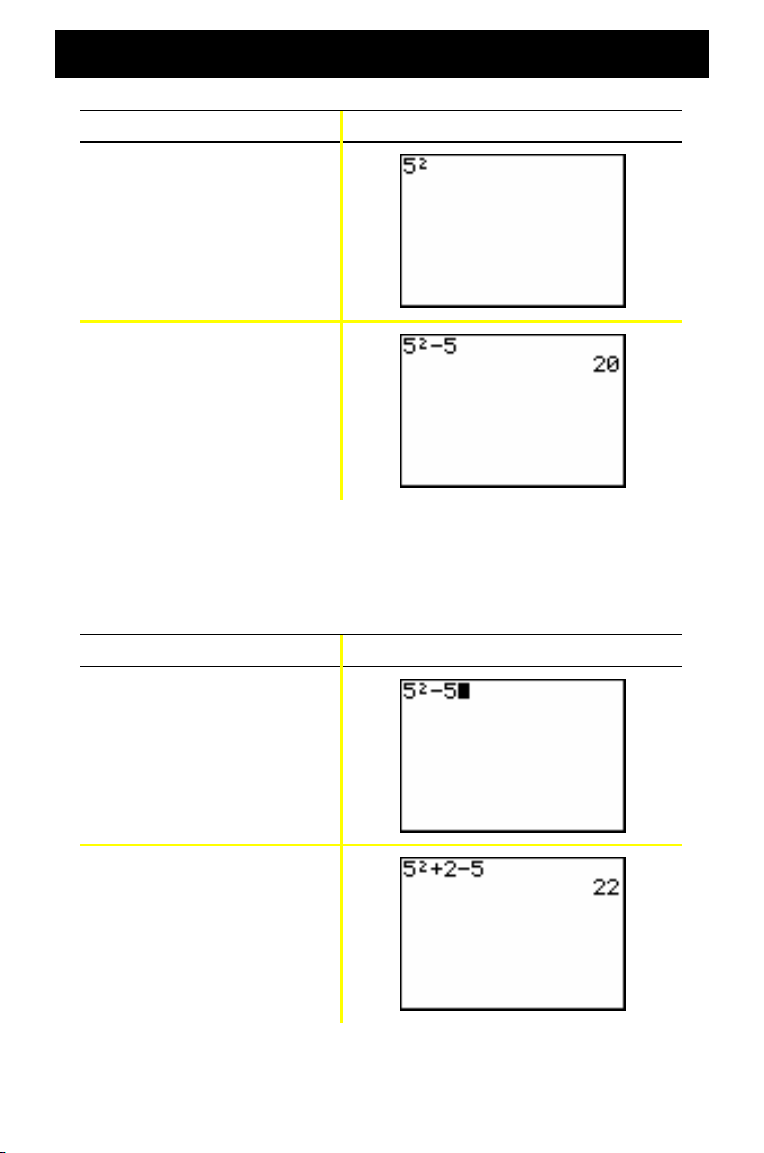
Example: Enter the expression 52 + 1, and then change the
expression to 52 - 5.
Press Result
5 ¡ Ã 1
13
Page 18
Editing and deleting (continued)
Press Result
| | { {
¹ 5
Í
Example: Change the example above to 52 + 2 - 5 using
y [ to recall the expression and y 6 to
insert + 2 into the expression.
Press Result
y [
| | y 6
2
Ã
Í
14
Page 19

Using ¹ and Ì
Many calculators (including the TI-82 STATS) make a distinction
between the symbols for subtraction and negation.
Use ¹ to enter subtraction operations. Use Ì to enter a negative
number in an operation, in an expression, or on a setup screen.
Example: Subtract 10 from 25.
Press Result
2 5 ¹ 1 0
Í
Example: Add 10 to L25.
Press Result
Ì 2 5 Ã 1 0
Í
15
Page 20

Using ¹ and Ì (continued)
Example: Subtract L10 from 25.
Press Result
2 5 ¹ Ì 1 0
Í
Note: Notice that the TI-82 STATS displays a slightly different symbol for
negation and subtraction to make it easier for you to distinguish
between the two. The negative symbol is raised and slightly shorter.
16
Page 21

Using parentheses
Since all calculations inside parentheses are
completed first, it is sometimes important to place
a portion of an expression inside parentheses.
Example: Multiply 4*1+2; then multiply 4*(1+2).
Press Result
4 ¯ 1 Ã 2
Í
4 ¯ £ 1 Ã 2 ¤
Í
Note: The closing parenthesis ¤ is optional. The operation will be
completed if you omit it. The exception to this rule occurs when
there is another operation following the parenthetical operation. In
this case, you must include the closing parenthesis.
For more details,
see Guidebook
Chapter 3.
17
Page 22

Using parentheses (continued)
Example: Divide 1/2 by 2/3.
Press Result
£ 1 ¥ 2 ¤ ¥
2 ¥ 3 ¤
£
Í
1
Example: Calculate 16 ^
Press Result
1 6 › £ 1 ¥ 2 ¤
Í
.
2
2
Example: Calculate (L3)
Press Result
.
£ Ì 3 ¤ ¡
Í
Note: Try each of these examples without the parentheses and see what
happens!
18
Page 23

Storing a value
Values are stored to and recalled from memory using variable
names.
Example: Store 25 to variable A and multiply A by 2.
Press Result
2 5 ¿ ƒ [A]
Í
2 ¯ ƒ [A]
Í
— or —
ƒ
[A] ¯ 2
Í
19
Page 24

Storing a value (continued)
Example: Find the value of 2X3 - 5X2 - 7X + 10 when X = M0.5.
Press Result
Ì Ë 5 ¿ „
Í
(stores L.5 to X)
2 „ › 3
5 „ ¡
¹
7 „ Ã 1 0
¹
Í
You can remove a value stored to a variable using the DELVAR
function or by storing 0 to the variable.
Example: Delete the value (L.5) stored to X above by storing 0.
Press Result
0 ¿ „
Í
„
Í
20
Page 25

Graphing a function
o
Displays the
Y= Editor,
where you
can enter
one or more
functions or
expressions
to graph.
p
Lets you set
the viewing
window to
produce the
best display
of your
graph.
„
Lets you enter one
of four symbols:
X (if you are in
Function mode), T
(in Parametric
mode),
mode), or n (in
Sequence mode).
q (in Polar
q
Lets you
quickly adjust
the window
to a
predefined
setting.
s
Displays the
graph you
have
defined.
r
Lets you
move the
cursor along
the graphed
function
using
| and ~.
21
Page 26

Graphing a function (continued)
To graph a function, you must:
1. Display the Y= Editor.
For more details,
see Guidebook
Chapter 3.
2. Enter the function.
3. Display the graph.
Note: If you previously changed graph type in the mode settings, you must
change the type back to Func (the default setting) before you graph.
Example: Graph the function Y = X2 + 1.
Press Result
o
If Y1 is not
blank, see
Note.
„ ¡ Ã 1
s
Note: If Y1 is not empty, press
the Y= Editor, press
‘
† ‘
22
. If there are additional entries in
until all are clear.
Page 27

Changing mode settings
The mode settings determine how entries are
interpreted and how answers are displayed on
the TI-82 STATS.
For more details,
see Guidebook
Chapter 1.
Example: Change the mode setting for decimals from Float to
3 decimal places.
Press Result
z
† ~ ~ ~ ~
Í
y 5
1 Ë 2 3 4 5 6
Í
Note: You must press
the setting and then exit the mode menu without pressing
the setting will not be changed.
Í
to change a mode setting. If you highlight
23
Í
,
Page 28

Changing mode settings (continued)
The mode menu includes the following settings:
Setting Choices
Numeric
notation
Decimal
Normal:
Sci
(scientific): for example, 1.234567â4
Eng
(engineering): for example, 12.34567â3
Float:
based on the result (up to 10 digits)
0 - 9:
value (0 - 9) that you specify
Angle
measure
Type of
graph
Plot type
Sequential or
simultaneous
graphing
Radian:
Degree:
Func
(functional): plots functions, where Y is a
function of X
Par
(parametric): plots relations, where X and Y
are functions of T
Pol
(polar): plots functions, where r is a function
of ôq
Seq
(sequence): plots sequences
Connected:
calculated for the selected functions
Dot
: plots only the calculated points of the
selected functions
Sequential:
Simul
the same time
for example, 12345.67
lets the number of decimal places change
sets the number of decimal places to a
interprets angle values as radians
interprets angle values as degrees
draws a line connecting each point
draws graphs one at a time
(simultaneous): draws all selected graphs at
Real or
complex
mode
Screen
display
Real:
displays real numbers, such as 1, 1/2, 3
a+b×
(rectangular complex): displays as 3+2×
re^q×
(polar complex): displays as re^q×
Full:
displays full screen
Horiz:
displays a horizontal split screen
G-T:
displays a vertical split screen (graph & table)
24
Page 29

Changing mode settings (continued)
The importance of mode settings
Example: Multiply 2/3 Q 2.
Press Result
z † ~ Í
2 ¥ 3 ¯ 2 Í
Your first reaction to this example is that the calculator has
produced a wrong answer. But you have set it to round to 0
decimal places (the nearest whole number), so for this setting the
answer is correct. If you set rounding (decimals displayed) to 0
and then forget to reset it for later calculations, you may be
surprised by some of your answers! With mode set to the default
setting of Float, the result will be:
Press Result
2 ¥ 3 ¯ 2
Í
25
Page 30

Setting the graphing window
To obtain the best view of the graph, you may
need to change the boundaries of the window.
To display the WINDOW Editor, press p
.
Xmin
Ymin
Window variables
(shown in WINDOW Editor)
Corresponding viewing window
(shown on Graph window)
For more details,
see Guidebook
Chapter 3.
Ymax
Xscl
Xmax
Yscl
The Xmin, Xmax, Ymin, and Ymax variables represent the
boundaries of the viewing window.
: the minimum value of X to be displayed.
Xmin
Xmax: the maximum value of X to be displayed.
Ymin: the minimum value of Y to be displayed.
Ymax: the maximum value of Y to be displayed.
Xscl (X scale): the distance between the tick marks on the X axis.
Yscl (Y scale): the distance between the tick marks on the Y axis.
Xres: pixel resolution—not usually changed except by advanced
users.
To change the values:
1. Move the cursor to highlight the value you want to change.
2. Do one of the following:
• Type a value or an expression. The old value is erased
when you begin typing.
— or —
• Press ‘ to clear the old value; then type the new one.
3. Press Í, †, or }.
26
Page 31

Setting the graphing window (continued)
Note: Values are stored as you type them; you do not need to press
Í
. Pressing
window variable.
4. After you have made all changes, press y 5 to close the
WINDOW Editor (or s to display the graph).
Example: Change the window settings to display a maximum
X value of 25, a minimum X value of L25, a maximum
Y value of 50, and a minimum Y value of L50.
Press Result
p
Í
simply moves the cursor to the next
Ì 2 5 † 2 5 † †
5 0 † 5 0
Ì
y 5
27
Page 32

Using q
The TI-82 STATS has ten predefined window
settings that let you quickly adjust the graph
window to a predetermined level of
For more details,
see Guidebook
Chapter 3.
magnification. To display this menu, press q.
Selection Result
1: ZBox Lets you draw a box (using the cursor pad) to
define the viewing window.
2: Zoom In After you position the cursor and press Í,
magnifies the graph around the cursor.
3: Zoom Out After you position the cursor and press Í,
displays more of the graph.
4: ZDecimal Sets the change in X and Y to increments of
.1 when you use r.
5: ZSquare Adjusts the viewing window so that X and Y
dimensions are equal.
6: ZStandard Sets the standard (default) window variables.
7: ZTrig Sets the built-in trigonometry window
variables.
8: ZInteger After you position the cursor and press Í,
sets the change in X and Y to whole number
increments.
9: ZoomStat Sets the values for currently defined
statistical lists.
0: ZoomFit Fits Ymin and Ymax between Xmin and
Xmax.
28
Page 33

Building a table
Tables are useful tools for comparing values for a
function at multiple points.
For more details,
see Guidebook
Chapter 7.
Example: Build a table to evaluate the function Y = X
each integer between L10 and 10.
Press Result
z † † †
Í
(sets function graphing mode)
o
3
N 2X at
„ 3
2 „
¹
y -
29
Page 34

Building a table (continued)
Press Result
Ì 1 0 Í
(sets TblStart; default settings
shown for the other fields are
appropriate)
y 0
Note: Press † repeatedly to see the changes in X and Y.
Clearing the Y= Editor
Before proceeding with the remaining examples in this guide,
clear the Y= Editor.
Press Result
o
‘
30
Page 35

Using the CATALOG
The CATALOG is an alphabetic list of all functions
and instructions on the TI-82 STATS. Some of these
items are also available on keys and menus.
For more details,
see Guidebook
Chapter 15.
To select from the CATALOG:
1. Position the cursor where you want to insert the item.
2. Press y N.
3. Press † or } to move the 4 indicator to the function or
instruction. (You can move quickly down the list by typing the
first letter of the item you need. You do not need to press
ƒ. The CATALOG defaults to Alpha-lock mode.)
4. Press Í. Your selection is pasted on the home screen.
Notes:
•
Items are listed in alphabetical order. Those that do not start with a
letter (
+, ‚, ‡, p
•
You can also paste from the CATALOG to an editor, such as the
, and so on) are at the end of the list.
Y= Editor.
Example: Enter the rand function on the home screen.
Press Result
y N [R] †
Í
The Ø indicates
that Alpha-lock
is on.
31
Page 36

Performing simple calculations
Changing a decimal to a fraction
Example: Add 1/2 + 1/4 and change your answer to a fraction.
Press Result
1 ¥ 2 Ã 1 ¥ 4
Í
1
Í
Note: You can perform an operation using the last answer without entering
the value again. When you do this, (as you did in the step 2 above), the
TI-82 STATS enters
Ans
on the screen.
Finding the least common multiple
Example: Find the least common multiple of 15 and 24.
Press Result
~ } }
Í
1 5 ¢ 2 4 ¤
Í
32
Page 37

Performing simple calculations (continued)
Finding the square root
Example: Find the square root of 256.
Press Result
y C 2 5 6 ¤
Í
Finding the factorial of numbers
Example: Compute the factorial of 5 and 30.
5 ~ ~ ~ 4
3 0 ~ ~ ~ 4
Press Result
Í
Í
Scientific
notation
33
Page 38

Performing simple calculations (continued)
Solving trigonometric functions
Example: Find the sine of an angle of 72¡.
Press Result
˜ 7 2
y ; Í ¤
Í
Note: If you are solving multiple problems using angles, be sure that mode
is set to Degree. If you are in Radian mode and do not wish to
change the mode, you can use
this example) to add the degree symbol to the calculation and
override the Radian mode setting.
y ; Í
(as you did in
Adding Complex Numbers
Example: Add (3+5×) + (2-3×).
Press Result
£ 3 Ã 5 y V ¤
2 ¹ 3 y V ¤
à £
Í
Note: The × character is the second function of Ë (the decimal key).
34
Page 39

Using the equation solver
You can use the TI-82 STATS equation solver to solve for a
variable in an equation.
Example: Find the roots for the equation X
Press Result
}
Í
Note: If you do not see
and then press
eqn:0=
‘
as shown above, press } (the up arrow),
to erase the existing equation.
„ ¡ ¹
2
- 13X - 48 = 0.
1 3 „ ¹ 4 8
35
Page 40

Using the equation solver (continued)
Press Result
Í
ƒ \
1 0 0
ƒ \
The two roots are M3 and 16. Since you did not enter a guess, the
TI-82 STATS used 0 (the default guess) and first returned the
answer nearest 0. To find other roots, you must enter another
guess. In this example, you entered 100.
36
Page 41

Entering data into lists
You can enter data into lists using either of two
methods:
• Using braces and ¿ on the home screen
— or —
• Using the statistical list editor.
Using ¿
Example: Store 1, 2, 3, and 4 to list 1 (L1).
Press Result
y E 1 ¢ 2 ¢
3 ¢ 4 y F
¿
For more details,
see Guidebook
Chapter 11 and
Chapter 12.
y d
Í
37
Page 42

Entering data into lists (continued)
Using the statistical list editor
Example: Store 5, 6, 7, and 8 to list 2 (L2).
Press Result
… Í
~ } ‘ Í
(if L2 already contains data)
5 Í 6 Í
7 Í 8 Í
y 5 y e
Í
(displays the contents of the
list on the home screen)
38
Page 43

p
Plotting data
When you have statistical data stored in lists,
you can display the data you have collected in
a scatter plot, xyLine, histogram, box plot, or
normal probability plot.
You will need to:
1. Determine which lists contain your data.
2. Tell the calculator which lists of data you want to plot
and define the plot.
3. Display the plot.
Determine which lists contain your data
Press Result
…
For more details,
see Guidebook
ter 12.
Cha
Í
Note: In some cases, you may have several lists stored and you may have
to press
~
several times to find the correct lists.
39
Page 44

Plotting data (continued)
Tell the calculator which lists you want to plot
Press Result
y ,
4 Í
(turns plots off
if any plots are on)
y ,
Í
40
Page 45

Plotting data (continued)
Press Result
Í
(turns Plot1 on)
† † y 9
Í
(enters L1 as the Xlist)
† y 9 †
Í
(enters L2 as the Ylist)
† ~ Í
(selects + as the
plotting mark)
41
Page 46

Plotting data (continued)
Press Result
o ‘
Note: This step is optional and is not necessary unless there is a previous
entry in the Y= Editor. If there are additional entries in the
Y= Editor, press
Display the plot
Press Result
s
† ‘
until all are clear.
q } } Í
(selects ZoomStat)
Note: If you would like to add the regression line to a scatter plot, follow
the instructions on page 43, adding Y1 to the end of the instruction:
LinReg(ax+b) L1, L2, Y1
Y1.) Press
s
to see the regression line.
. (Press
42
~ Í Í
to add
Page 47

Calculating a linear regression
If you wish to calculate the linear regression for data, you can do
so using the LinReg instruction from the … CALC menu.
Example: Calculate the linear regression for the data entered
in L1 and L2 (on pages 37 and 38).
Press Result
… ~ † † †
Í
y d ¢ y e
Í
Note: The information on the last screen means that the points in L1 and L2
[(1,5) (2,6) (3,7) (4,8)] all lie on the line Y = X + 4.
43
Page 48

Calculating statistical variables
The TI-82 STATS lets you easily calculate one-variable or twovariable statistics for data that you have entered into lists.
Example: Using the data that you entered into L1 on page 37,
calculate one-variable statistics.
Press Result
… ~
Í
y d
Í
44
Page 49

Using the MATRIX Editor
Creating a new matrix
Press Result
|
Í
2 Í 2 Í
For more details,
see Guidebook
Chapter 10.
1 Í 5 Í
2 Í 8 Í
Note: When you press
next cell so that you can continue entering or editing values. To
enter a new value, you can start typing without pressing
but you must press
Í
, the cursor automatically highlights the
Í
to edit an existing value.
45
Í
,
Page 50

Using the MATRIX Editor (continued)
Using matrices to solve systems of equations
You can solve several equations simultaneously by entering their
coefficients into a matrix and then using the rref (reduced rowechelon form) function. For example, in the equations below,
enter 3, 3, and 24 (for 3X, 3Y, and 24) in the first row, and 2, 1, 13
(for 2X, 1Y, and 13) in the second row.
Example: Solve 3X + 3Y = 24
and 2X + Y = 13
Press Result
~ ~ †
Í
2 Í 3 Í
46
Page 51

Using the MATRIX Editor (continued)
Press Result
3 Í 3 Í 2 4
Í
2 Í 1 Í 1 3
Í
y 5
~
} } } } }
Í
47
Page 52

Using the MATRIX Editor (continued)
Press Result
† Í
Í
You can interpret the resulting matrix as:
[1 0 5] represents 1X + 0Y = 5 or X = 5
[0 1 3] represents 0X + 1Y = 3 or Y = 3
The solution to this system of equations is X = 5, Y = 3.
48
Page 53

pp
Error messages
Occasionally, when you enter a function or
instruction or attempt to display a graph, the
TI-82 STATS will return an error message.
Example: Enter the least common multiple function
For more details,
see Guidebook
endix B.
A
lcm(
followed by only one number.
Press Result
~ } } Í
2 7 ¢
Í
If you select 1:Quit, you return to the home screen with the cursor
on a new entry line. If you select
2:Goto, you return to the
original entry line; the cursor is flashing at the location of the
error. You can now correct the error and continue.
You can find a complete list of error conditions with explanations
in the Guidebook, Appendix B: General Information.
49
Page 54

p
Resetting defaults
If you are getting unexpected results, or if another
person has used your calculator and may have
changed the settings, you should consider
resetting defaults on the TI-82 STATS.
Press Result
y L
5
2
For more details,
see Guidebook
ter 18.
Cha
2
WARNING: If you reset All Memory in step 3 above, you will delete stored
variables, lists, applications, and programs. Be sure you have
backed up any essential data before you select this option.
50
Page 55

Connecting to a computer
You can connect your TI-82 STATS to a personal computer using
TI Connect™ software and a TI Connectivity cable. The software
is included on the CD in the TI-82 STATS package.
When you connect to the TI Connect ™ software, the TI-82 STATS
calculator will be identified by TI Connect ™ as a TI-83 calculator.
Everything else should function as expected.
For more information, consult the TI Connect™ Help.
51
Page 56

Quick reference
Press
y } Darken the screen
y † Lighten the screen
y ~ Move the cursor to the end of an expression
y | Move the cursor to the beginning of an
ƒ † Page down to the next screen (on menus)
ƒ } Page up to the next screen (on menus)
y [ Place your last entry on the current entry line on
y Z Place Ans (a reference to your last answer) on
To
expression
the home screen
the current entry line on the home screen,
allowing you to use the answer in the next
calculation
{ Delete the character under the cursor
y 6 Insert additional characters at the cursor
† } Move the cursor from line to line
~ | Move the cursor from character to character
within a line
‘ Clear the current line. (If the cursor is on a blank
line, clears everything on the home screen.)
52
Page 57

Texas Instruments (TI) Support and Service
For general information
For more information about TI products and services, contact TI
by e-mail or visit the TI Internet address.
E-mail inquiries: ticares@ti.com
Home Page: education.ti.com
Service and warranty information
For information about the length and terms of the warranty or
about product service, refer to the warranty statement enclosed
with this product or contact your local Texas Instruments
retailer/distributor.
53
Page 58

Battery precautions
Take these precautions when replacing batteries.
• Do not leave batteries within the reach of children.
• Do not mix new and used batteries. Do not mix brands (or types
within brands) of batteries.
• Do not mix rechargeable and non-rechargeable batteries.
• Install batteries according to polarity (+ and - ) diagrams.
• Do not place non-rechargeable batteries in a battery recharger.
• Properly dispose of used batteries immediately.
• Do not incinerate or dismantle batteries.
54
 Loading...