

Page 1
C
over Page
OPERATING MANUAL
®
Transpector CPM
Compact Process Monitor
PN 074-641-P1B
Page 2

Trademarks
The trademarks of the products mentioned in this manual are held by the companies that
produce them.
INFICON®, Transpector®, and FabGuard® are registered trademarks and FabGuard Explorer™ is a trademark
of INFICON.
Windows®, Windows NT® and Microsoft® are registered trademarks of Microsoft Corporation.
®
is a registered trademark of DuPont Co.
Teflon
Swagelok
®
is a registered trademark of Swagelok Co.
All other brand and product names are trademarks or registered trademarks of their respective companies.
Disclaimer
The information contained in this manual is believed to be accurate and reliable. However, INFICON assumes
no responsibility for its use and shall not be liable for any special, incidental, or consequential damages related
to the use of this product.
Due to our continuing program of product improvements, specifications are subject to change without notice.
Copyright
©2016 All rights reserved.
Reproduction or adaptation of any part of this document without permission is unlawful.
Page 3
Declaration Of Conformity
Page 1
Page 4

Warranty
WARRANTY AND LIABILITY - LIMITATION: Seller warrants the products
manufactured by it, or by an affiliated company and sold by it, and described on
the reverse hereof, to be, for the period of warranty coverage specified below, free
from defects of materials or workmanship under normal proper use and service.
The period of warranty coverage is specified for the respective products in the
respective Seller instruction manuals for those products but shall not be less than
one (1) year from the date of shipment thereof by Seller. Seller's liability under this
warranty is limited to such of the above products or parts thereof as are returned,
transportation prepaid, to Seller's plant, not later than thirty (30) days after the
expiration of the period of warranty coverage in respect thereof and are found by
Seller's examination to have failed to function properly because of defective
workmanship or materials and not because of improper installation or misuse and
is limited to, at Seller's election, either (a) repairing and returning the product or
part thereof, or (b) furnishing a replacement product or part thereof, transportation
prepaid by Seller in either case. In the event Buyer discovers or learns that a
product does not conform to warranty, Buyer shall immediately notify Seller in
writing of such non-conformity, specifying in reasonable detail the nature of such
non-conformity. If Seller is not provided with such written notification, Seller shall
not be liable for any further damages which could have been avoided if Seller had
been provided with immediate written notification.
THIS WARRANTY IS MADE AND ACCEPTED IN LIEU OF ALL OTHER
WARRANTIES, EXPRESS OR IMPLIED, WHETHER OF MERCHANTABILITY OR
OF FITNESS FOR A PARTICULAR PURPOSE OR OTHERWISE, AS BUYER'S
EXCLUSIVE REMEDY FOR ANY DEFECTS IN THE PRODUCTS TO BE SOLD
HEREUNDER. All other obligations and liabilities of Seller, whether in contract or
tort (including negligence) or otherwise, are expressly EXCLUDED. In no event
shall Seller be liable for any costs, expenses or damages, whether direct or
indirect, special, incidental, consequential, or other, on any claim of any defective
product, in excess of the price paid by Buyer for the product plus return
transportation charges prepaid.
No warranty is made by Seller of any Seller product which has been installed,
used or operated contrary to Seller's written instruction manual or which has been
subjected to misuse, negligence or accident or has been repaired or altered by
anyone other than Seller or which has been used in a manner or for a purpose for
which the Seller product was not designed nor against any defects due to plans or
instructions supplied to Seller by or for Buyer.
This manual is intended for private use by INFICON® Inc. and its customers.
Contact INFICON before reproducing its contents.
NOTE: These instructions do not provide for every contingency that may arise in
connection with the installation, operation or maintenance of this equipment.
Should you require further assistance, please contact INFICON.
Warranty
www.inficon.com reachus@inficon.com
Standard INFICON One Year
Page 1
Page 5

Transpector CPM Operating Manual
Table Of Contents
Cover Page
Trademarks
Disclaimer
Copyright
Declaration Of Conformity
Warranty
Chapter 1
Getting Started
1.1 General Safety Information. . . . . . . . . . . . . . . . . . . . . . . . . . . . . . . . . . . . . . 1-1
1.2 Purpose of Transpector CPM . . . . . . . . . . . . . . . . . . . . . . . . . . . . . . . . . . . .1-2
1.2.1 Description of the Transpector CPM . . . . . . . . . . . . . . . . . . . . . . . . . . . . . . 1-2
1.3 Using this Operating Manual . . . . . . . . . . . . . . . . . . . . . . . . . . . . . . . . . . . . 1-3
1.4 How to Contact INFICON . . . . . . . . . . . . . . . . . . . . . . . . . . . . . . . . . . . . . . . 1-4
1.4.1 Returning Transpector CPM to INFICON . . . . . . . . . . . . . . . . . . . . . . . . . . . 1-4
1.5 Transpector CPM Performance Specifications. . . . . . . . . . . . . . . . . . . . . . .1-5
1.5.1 General Specifications . . . . . . . . . . . . . . . . . . . . . . . . . . . . . . . . . . . . . . . . . 1-5
1.5.2 Hex Block Orifice Sampling Inlets . . . . . . . . . . . . . . . . . . . . . . . . . . . . . . . .1-7
1.5.3 Atmospheric Pressure (Capillary) Sampling. . . . . . . . . . . . . . . . . . . . . . . . . 1-8
1.6 Physical Requirements. . . . . . . . . . . . . . . . . . . . . . . . . . . . . . . . . . . . . . . . .1-9
1.6.1 Physical Dimensions . . . . . . . . . . . . . . . . . . . . . . . . . . . . . . . . . . . . . . . . . . 1-9
1.6.2 Weight . . . . . . . . . . . . . . . . . . . . . . . . . . . . . . . . . . . . . . . . . . . . . . . . . . . . 1-10
1.6.3 Ventilation Requirements . . . . . . . . . . . . . . . . . . . . . . . . . . . . . . . . . . . . . . 1-10
1.7 Electrical Power Requirements . . . . . . . . . . . . . . . . . . . . . . . . . . . . . . . . . 1-10
1.7.1 Required Supply Voltage . . . . . . . . . . . . . . . . . . . . . . . . . . . . . . . . . . . . . . 1-10
1.7.1.1 Acceptable Supply Voltage Range. . . . . . . . . . . . . . . . . . . . . . . . . . . . . . . 1-10
1.7.1.2 Required Frequency . . . . . . . . . . . . . . . . . . . . . . . . . . . . . . . . . . . . . . . . . . 1-10
1.7.1.3 Power Rating . . . . . . . . . . . . . . . . . . . . . . . . . . . . . . . . . . . . . . . . . . . . . . .1-10
1.7.1.4 Fuse Rating . . . . . . . . . . . . . . . . . . . . . . . . . . . . . . . . . . . . . . . . . . . . . . . . 1-11
1.7.1.5 Overvoltage Category. . . . . . . . . . . . . . . . . . . . . . . . . . . . . . . . . . . . . . . . .1-11
1.7.1.6 Electrical Connections . . . . . . . . . . . . . . . . . . . . . . . . . . . . . . . . . . . . . . . . 1-11
1.8 Nitrogen Purge Gas (Corrosive System Only) . . . . . . . . . . . . . . . . . . . . . . 1-11
1.9 Exhaust Gas. . . . . . . . . . . . . . . . . . . . . . . . . . . . . . . . . . . . . . . . . . . . . . . . 1-12
1.10 Air Pressure Requirements . . . . . . . . . . . . . . . . . . . . . . . . . . . . . . . . . . . . 1-13
1.10.1 Required Air Pressure . . . . . . . . . . . . . . . . . . . . . . . . . . . . . . . . . . . . . . . .1-13
1.10.2 Air Pressure Range . . . . . . . . . . . . . . . . . . . . . . . . . . . . . . . . . . . . . . . . . . 1-13
TOC – 1
Page 6

Transpector CPM Operating Manual
1.10.3 Moisture Content of Compressed Air Supply . . . . . . . . . . . . . . . . . . . . . . . 1-13
1.10.4 Air Pressure Connections. . . . . . . . . . . . . . . . . . . . . . . . . . . . . . . . . . . . . . 1-13
1.11 Vacuum Requirements. . . . . . . . . . . . . . . . . . . . . . . . . . . . . . . . . . . . . . . . 1-14
1.11.1 Required Vacuum. . . . . . . . . . . . . . . . . . . . . . . . . . . . . . . . . . . . . . . . . . . . 1-14
1.11.2 Acceptable Range Of Vacuum. . . . . . . . . . . . . . . . . . . . . . . . . . . . . . . . . . 1-14
1.12 Environmental Requirements . . . . . . . . . . . . . . . . . . . . . . . . . . . . . . . . . . . 1-14
1.12.1 Use . . . . . . . . . . . . . . . . . . . . . . . . . . . . . . . . . . . . . . . . . . . . . . . . . . . . . . . 1-14
1.12.2 Altitude Range . . . . . . . . . . . . . . . . . . . . . . . . . . . . . . . . . . . . . . . . . . . . . . 1-14
1.12.3 Maximum Humidity. . . . . . . . . . . . . . . . . . . . . . . . . . . . . . . . . . . . . . . . . . . 1-14
1.12.4 Pollution Degree. . . . . . . . . . . . . . . . . . . . . . . . . . . . . . . . . . . . . . . . . . . . . 1-14
1.12.5 Maximum Operating Temperature . . . . . . . . . . . . . . . . . . . . . . . . . . . . . . . 1-14
1.12.6 Minimum Operating Temperatures. . . . . . . . . . . . . . . . . . . . . . . . . . . . . . . 1-14
1.12.7 Clean Room Requirements . . . . . . . . . . . . . . . . . . . . . . . . . . . . . . . . . . . . 1-15
1.12.8 Anti-Static Conditions . . . . . . . . . . . . . . . . . . . . . . . . . . . . . . . . . . . . . . . . . 1-15
1.13 Computer System Requirements . . . . . . . . . . . . . . . . . . . . . . . . . . . . . . . . 1-15
1.13.1 Operating System. . . . . . . . . . . . . . . . . . . . . . . . . . . . . . . . . . . . . . . . . . . . 1-15
Chapter 2
2.1 Installation Overview . . . . . . . . . . . . . . . . . . . . . . . . . . . . . . . . . . . . . . . . . . 2-1
2.2 Transpector Electronics Module, Heat Guard, and Cable Box Installation . 2-2
2.2.1 Attach Transpector Electronics Module . . . . . . . . . . . . . . . . . . . . . . . . . . . . 2-2
2.2.2 Attach Heat Guard . . . . . . . . . . . . . . . . . . . . . . . . . . . . . . . . . . . . . . . . . . . . 2-3
2.2.3 Attach Cable Box . . . . . . . . . . . . . . . . . . . . . . . . . . . . . . . . . . . . . . . . . . . . . 2-4
2.3 Sniffer Installation. . . . . . . . . . . . . . . . . . . . . . . . . . . . . . . . . . . . . . . . . . . . . 2-5
2.4 Mounting the Pumping System . . . . . . . . . . . . . . . . . . . . . . . . . . . . . . . . . . 2-5
2.4.1 Installing the Support Kit . . . . . . . . . . . . . . . . . . . . . . . . . . . . . . . . . . . . . . . 2-6
2.4.2 Atmospheric Support Frame . . . . . . . . . . . . . . . . . . . . . . . . . . . . . . . . . . . . 2-7
2.5 CPM Controller Installation. . . . . . . . . . . . . . . . . . . . . . . . . . . . . . . . . . . . . . 2-7
2.6 Transpector Cable Box Connections . . . . . . . . . . . . . . . . . . . . . . . . . . . . . . 2-9
2.7 CPM Foreline Pump Installation. . . . . . . . . . . . . . . . . . . . . . . . . . . . . . . . . 2-11
2.8 Software Installation. . . . . . . . . . . . . . . . . . . . . . . . . . . . . . . . . . . . . . . . . . 2-11
Chapter 3
3.1 Introduction. . . . . . . . . . . . . . . . . . . . . . . . . . . . . . . . . . . . . . . . . . . . . . . . . . 3-1
3.2 General Networking Information. . . . . . . . . . . . . . . . . . . . . . . . . . . . . . . . . . 3-1
3.2.1 IP Addresses . . . . . . . . . . . . . . . . . . . . . . . . . . . . . . . . . . . . . . . . . . . . . . . . 3-1
3.2.2 Subnetworking . . . . . . . . . . . . . . . . . . . . . . . . . . . . . . . . . . . . . . . . . . . . . . . 3-2
3.3 Transpector CPM IP Address. . . . . . . . . . . . . . . . . . . . . . . . . . . . . . . . . . . . 3-2
Installation
Connecting Transpector CPM
TOC – 2
Page 7

Transpector CPM Operating Manual
3.3.1 Using the INFICON Mass Spectrometer Search Utility to
Change the Transpector CPM IP Address . . . . . . . . . . . . . . . . . . . . . . . . . . 3-3
3.3.1.1 Change IP Address . . . . . . . . . . . . . . . . . . . . . . . . . . . . . . . . . . . . . . . . . . . 3-4
3.3.1.2 Launch Web UI. . . . . . . . . . . . . . . . . . . . . . . . . . . . . . . . . . . . . . . . . . . . . . . 3-5
3.3.1.3 Find Device. . . . . . . . . . . . . . . . . . . . . . . . . . . . . . . . . . . . . . . . . . . . . . . . . .3-5
3.3.1.4 Show Settings. . . . . . . . . . . . . . . . . . . . . . . . . . . . . . . . . . . . . . . . . . . . . . . .3-5
3.4 Connecting Transpector CPM . . . . . . . . . . . . . . . . . . . . . . . . . . . . . . . . . . . 3-6
3.4.1 Connecting a Single Transpector CPM . . . . . . . . . . . . . . . . . . . . . . . . . . . .3-6
3.4.1.1 Single Transpector CPM Direct Connection Installation. . . . . . . . . . . . . . . .3-6
3.4.1.2 Installing a Single Transpector CPM on an Existing Local Network. . . . . . . 3-6
3.4.2 Installing Multiple Transpector CPM Sensors. . . . . . . . . . . . . . . . . . . . . . . . 3-7
3.4.2.1 Installing Multiple Transpector CPM Directly to a Host Computer . . . . . . . . 3-7
3.4.2.2 Installing Multiple Transpector CPM on an Existing Local Network . . . . . . .3-7
3.5 Changing the Computer IP Address. . . . . . . . . . . . . . . . . . . . . . . . . . . . . . . 3-8
3.5.1 Windows 7 . . . . . . . . . . . . . . . . . . . . . . . . . . . . . . . . . . . . . . . . . . . . . . . . . .3-8
Chapter 4
How the CPM System Works
4.1 CPM Components . . . . . . . . . . . . . . . . . . . . . . . . . . . . . . . . . . . . . . . . . . . . 4-1
4.2 Theory of Operation . . . . . . . . . . . . . . . . . . . . . . . . . . . . . . . . . . . . . . . . . . .4-2
4.3 Instrument Overview. . . . . . . . . . . . . . . . . . . . . . . . . . . . . . . . . . . . . . . . . . .4-2
4.3.1 Input/Output (Aux I/O) . . . . . . . . . . . . . . . . . . . . . . . . . . . . . . . . . . . . . . . . . 4-2
4.3.1.1 CPM Aux I/O Connector . . . . . . . . . . . . . . . . . . . . . . . . . . . . . . . . . . . . . . . .4-3
4.3.1.2 Two Digital Inputs . . . . . . . . . . . . . . . . . . . . . . . . . . . . . . . . . . . . . . . . . . . . . 4-3
4.3.1.3 One Status Relay Output . . . . . . . . . . . . . . . . . . . . . . . . . . . . . . . . . . . . . . .4-3
4.3.1.4 One Analog Input . . . . . . . . . . . . . . . . . . . . . . . . . . . . . . . . . . . . . . . . . . . . .4-4
4.3.2 Ultra-High Vacuum System . . . . . . . . . . . . . . . . . . . . . . . . . . . . . . . . . . . . .4-4
4.3.2.1 Foreline Subsystem . . . . . . . . . . . . . . . . . . . . . . . . . . . . . . . . . . . . . . . . . . . 4-5
4.3.3 Heater(s) Subsystem . . . . . . . . . . . . . . . . . . . . . . . . . . . . . . . . . . . . . . . . . . 4-5
4.3.4 CPM Controller Subsystem . . . . . . . . . . . . . . . . . . . . . . . . . . . . . . . . . . . . .4-5
4.3.5 Solenoid Valves . . . . . . . . . . . . . . . . . . . . . . . . . . . . . . . . . . . . . . . . . . . . . .4-6
4.3.6 Sensor and Transpector Electronics Module Subsystem. . . . . . . . . . . . . . . 4-7
4.4 Application . . . . . . . . . . . . . . . . . . . . . . . . . . . . . . . . . . . . . . . . . . . . . . . . . .4-8
4.5 Sample Inlet Systems and Examples of Use . . . . . . . . . . . . . . . . . . . . . . . .4-9
4.5.1 Inlet System . . . . . . . . . . . . . . . . . . . . . . . . . . . . . . . . . . . . . . . . . . . . . . . . .4-9
4.5.2 High Pressure Sampling: Orifice Bypass (V4) . . . . . . . . . . . . . . . . . . . . . . 4-12
4.5.3 Dual-Capillary Sampling Option . . . . . . . . . . . . . . . . . . . . . . . . . . . . . . . . . 4-13
4.6 Advice and Tips . . . . . . . . . . . . . . . . . . . . . . . . . . . . . . . . . . . . . . . . . . . . .4-14
4.6.1 Achieving Good Base Pressure in the CPM. . . . . . . . . . . . . . . . . . . . . . . . 4-14
4.6.2 Avoiding Trapped Gas when Sampling Valves are Closed . . . . . . . . . . . . 4-14
TOC – 3
Page 8

Transpector CPM Operating Manual
Chapter 5
Theory and Application Guide
5.1 Theory of Operation . . . . . . . . . . . . . . . . . . . . . . . . . . . . . . . . . . . . . . . . . . . 5-1
5.2 Sensors . . . . . . . . . . . . . . . . . . . . . . . . . . . . . . . . . . . . . . . . . . . . . . . . . . . . 5-1
5.2.1 The Ion Source. . . . . . . . . . . . . . . . . . . . . . . . . . . . . . . . . . . . . . . . . . . . . . . 5-2
5.2.2 The Quadrupole Mass Filter. . . . . . . . . . . . . . . . . . . . . . . . . . . . . . . . . . . . . 5-4
5.2.2.1 Scanning Characteristics . . . . . . . . . . . . . . . . . . . . . . . . . . . . . . . . . . . . . . . 5-6
5.2.2.2 The Zero Blast . . . . . . . . . . . . . . . . . . . . . . . . . . . . . . . . . . . . . . . . . . . . . . . 5-7
5.2.3 The Ion Detector. . . . . . . . . . . . . . . . . . . . . . . . . . . . . . . . . . . . . . . . . . . . . . 5-8
5.2.3.1 The Electron Multiplier (EM) Detector . . . . . . . . . . . . . . . . . . . . . . . . . . . . . 5-8
5.2.3.2 The Continuous Dynode Electron Multiplier/Faraday Cup Detector. . . . . . . 5-9
5.3 How to Interpret The Result . . . . . . . . . . . . . . . . . . . . . . . . . . . . . . . . . . . . 5-11
5.3.1 Qualitative Interpretation Of Mass Spectra . . . . . . . . . . . . . . . . . . . . . . . . 5-11
5.3.1.1 Ionization Process . . . . . . . . . . . . . . . . . . . . . . . . . . . . . . . . . . . . . . . . . . . 5-13
5.3.1.2 Isotope Ratios . . . . . . . . . . . . . . . . . . . . . . . . . . . . . . . . . . . . . . . . . . . . . . 5-15
5.3.1.3 Electron Energy Effects . . . . . . . . . . . . . . . . . . . . . . . . . . . . . . . . . . . . . . . 5-17
5.3.1.4 A Qualitative Interpretation Guide . . . . . . . . . . . . . . . . . . . . . . . . . . . . . . . 5-19
5.3.1.5 Dry Etching Chemistries. . . . . . . . . . . . . . . . . . . . . . . . . . . . . . . . . . . . . . . 5-22
5.3.1.6 Tungsten CVD . . . . . . . . . . . . . . . . . . . . . . . . . . . . . . . . . . . . . . . . . . . . . . 5-24
5.3.1.7 Copper MOCVD . . . . . . . . . . . . . . . . . . . . . . . . . . . . . . . . . . . . . . . . . . . . . 5-25
5.3.2 Quantitative Interpretation of Mass Spectra
(Calculating Partial Pressures). . . . . . . . . . . . . . . . . . . . . . . . . . . . . . . . . . 5-26
5.3.3 Additional Information For Interpreting Mass Spectra . . . . . . . . . . . . . . . . 5-32
5.3.3.1 Ion Source Characteristics . . . . . . . . . . . . . . . . . . . . . . . . . . . . . . . . . . . . . 5-32
5.3.3.2 Scanning Characteristics . . . . . . . . . . . . . . . . . . . . . . . . . . . . . . . . . . . . . . 5-33
5.3.3.3 Fragmentation Factors . . . . . . . . . . . . . . . . . . . . . . . . . . . . . . . . . . . . . . . . 5-34
Chapter 6
Operation
6.1 HexBlock . . . . . . . . . . . . . . . . . . . . . . . . . . . . . . . . . . . . . . . . . . . . . . . . . . . 6-1
6.1.1 HexBlock Inlet . . . . . . . . . . . . . . . . . . . . . . . . . . . . . . . . . . . . . . . . . . . . . . . 6-2
6.1.1.1 Hex Block Process Connections . . . . . . . . . . . . . . . . . . . . . . . . . . . . . . . . . 6-3
6.1.2 Calibration Option. . . . . . . . . . . . . . . . . . . . . . . . . . . . . . . . . . . . . . . . . . . . . 6-3
6.1.2.1 High Mass FC5311 Tuning Reference. . . . . . . . . . . . . . . . . . . . . . . . . . . . . 6-4
6.1.3 Process Gauge (CDG) . . . . . . . . . . . . . . . . . . . . . . . . . . . . . . . . . . . . . . . . . 6-5
6.2 Heaters. . . . . . . . . . . . . . . . . . . . . . . . . . . . . . . . . . . . . . . . . . . . . . . . . . . . . 6-5
6.3 Pumping System . . . . . . . . . . . . . . . . . . . . . . . . . . . . . . . . . . . . . . . . . . . . . 6-5
6.3.1 Foreline Pump . . . . . . . . . . . . . . . . . . . . . . . . . . . . . . . . . . . . . . . . . . . . . . . 6-6
6.3.1.1 Foreline Pirani Gauge . . . . . . . . . . . . . . . . . . . . . . . . . . . . . . . . . . . . . . . . . 6-6
TOC – 4
Page 9

Transpector CPM Operating Manual
6.3.2 Turbo Molecular Pump . . . . . . . . . . . . . . . . . . . . . . . . . . . . . . . . . . . . . . . . .6-6
6.3.2.1 Turbo Molecular Pump Status . . . . . . . . . . . . . . . . . . . . . . . . . . . . . . . . . . . 6-7
6.4 Nitrogen Purge Valve for the Turbo Molecular Pump on Corrosive Pumping
Systems . . . . . . . . . . . . . . . . . . . . . . . . . . . . . . . . . . . . . . . . . . . . . . . . . . . .6-7
6.5 Filament Control . . . . . . . . . . . . . . . . . . . . . . . . . . . . . . . . . . . . . . . . . . . . . .6-7
6.5.1 Interlock . . . . . . . . . . . . . . . . . . . . . . . . . . . . . . . . . . . . . . . . . . . . . . . . . . . .6-7
6.5.2 Total Pressure Calibration . . . . . . . . . . . . . . . . . . . . . . . . . . . . . . . . . . . . . .6-7
6.5.3 Filament Lifetime . . . . . . . . . . . . . . . . . . . . . . . . . . . . . . . . . . . . . . . . . . . . .6-8
6.6 Pneumatic Digital Pressure Switch and Pressure Gauge . . . . . . . . . . . . . 6-11
6.6.1 Setup Procedure. . . . . . . . . . . . . . . . . . . . . . . . . . . . . . . . . . . . . . . . . . . . .6-11
6.6.2 How to Test for Proper Settings . . . . . . . . . . . . . . . . . . . . . . . . . . . . . . . . . 6-14
6.6.3 How to Lock and Unlock the Settings. . . . . . . . . . . . . . . . . . . . . . . . . . . . . 6-14
Chapter 7
Maintenance
7.1 Introduction. . . . . . . . . . . . . . . . . . . . . . . . . . . . . . . . . . . . . . . . . . . . . . . . . .7-1
7.2 Safety Considerations . . . . . . . . . . . . . . . . . . . . . . . . . . . . . . . . . . . . . . . . . 7-1
7.2.1 Toxic Material . . . . . . . . . . . . . . . . . . . . . . . . . . . . . . . . . . . . . . . . . . . . . . . .7-2
7.2.2 Radiation . . . . . . . . . . . . . . . . . . . . . . . . . . . . . . . . . . . . . . . . . . . . . . . . . . . 7-2
7.2.3 Electrical Voltages . . . . . . . . . . . . . . . . . . . . . . . . . . . . . . . . . . . . . . . . . . . .7-2
7.3 Maintenance Procedures . . . . . . . . . . . . . . . . . . . . . . . . . . . . . . . . . . . . . . .7-3
7.3.1 Bakeout of Quadrupole. . . . . . . . . . . . . . . . . . . . . . . . . . . . . . . . . . . . . . . . . 7-3
7.3.2 Spare Heating Jacket . . . . . . . . . . . . . . . . . . . . . . . . . . . . . . . . . . . . . . . . . .7-3
7.4 General Instructions For All Repair Procedures . . . . . . . . . . . . . . . . . . . . . . 7-4
7.5 Required Tools, Materials, or Parts . . . . . . . . . . . . . . . . . . . . . . . . . . . . . . . 7-5
7.5.1 Tools for Replacing the Filament Kit . . . . . . . . . . . . . . . . . . . . . . . . . . . . . . 7-5
7.5.2 Tools for Replacing the Ion Source . . . . . . . . . . . . . . . . . . . . . . . . . . . . . . .7-5
7.5.3 Tools for Replacing the Electron Multiplier . . . . . . . . . . . . . . . . . . . . . . . . . . 7-5
7.5.4 Parts Required For Maintenance . . . . . . . . . . . . . . . . . . . . . . . . . . . . . . . . . 7-5
7.6 Changing Diaphragms in the Foreline Pump . . . . . . . . . . . . . . . . . . . . . . . .7-6
7.6.1 Replacement Interval . . . . . . . . . . . . . . . . . . . . . . . . . . . . . . . . . . . . . . . . . . 7-6
7.6.2 Diaphragm kit PN 923-418-G1 . . . . . . . . . . . . . . . . . . . . . . . . . . . . . . . . . . .7-6
7.6.3 Procedure . . . . . . . . . . . . . . . . . . . . . . . . . . . . . . . . . . . . . . . . . . . . . . . . . . .7-7
7.7 Transpector Sensor Maintenance . . . . . . . . . . . . . . . . . . . . . . . . . . . . . . . 7-16
7.7.1 How to Determine if a Filament Kit Replacement is Required . . . . . . . . . . 7-17
7.7.2 Transpector Sensor Filament Replacement . . . . . . . . . . . . . . . . . . . . . . . . 7-18
7.7.3 Transpector Sensor Ion Source Replacement . . . . . . . . . . . . . . . . . . . . . .7-20
7.7.4 Electron Multiplier Replacement. . . . . . . . . . . . . . . . . . . . . . . . . . . . . . . . . 7-23
7.8 HexBlock Inlet Maintenance . . . . . . . . . . . . . . . . . . . . . . . . . . . . . . . . . . . . 7-29
7.8.1 Valve and Orifice Replacement . . . . . . . . . . . . . . . . . . . . . . . . . . . . . . . . . 7-29
TOC – 5
Page 10

Transpector CPM Operating Manual
Chapter 8
Diagnosing Problems
8.1 Introduction. . . . . . . . . . . . . . . . . . . . . . . . . . . . . . . . . . . . . . . . . . . . . . . . . . 8-1
8.2 Communication Problems . . . . . . . . . . . . . . . . . . . . . . . . . . . . . . . . . . . . . . 8-1
8.3 CPM Symptom—Cause— Remedy Chart . . . . . . . . . . . . . . . . . . . . . . . . . . 8-2
8.4 If You Cannot Resolve Your Problem . . . . . . . . . . . . . . . . . . . . . . . . . . . . . 8-9
8.5 Event Log Files. . . . . . . . . . . . . . . . . . . . . . . . . . . . . . . . . . . . . . . . . . . . . . . 8-9
Chapter 9
Recommended Parts List
9.1 Ordering Information . . . . . . . . . . . . . . . . . . . . . . . . . . . . . . . . . . . . . . . . . . 9-1
9.2 CPM Consumable Parts. . . . . . . . . . . . . . . . . . . . . . . . . . . . . . . . . . . . . . . . 9-1
9.3 Preventative Maintenance Parts . . . . . . . . . . . . . . . . . . . . . . . . . . . . . . . . . 9-3
9.4 Replacement Spare Parts . . . . . . . . . . . . . . . . . . . . . . . . . . . . . . . . . . . . . . 9-3
Chapter 10
FabGuard Explorer Operation
10.1 Operation (FabGuard Explorer) . . . . . . . . . . . . . . . . . . . . . . . . . . . . . . . . . 10-1
10.2 Introduction. . . . . . . . . . . . . . . . . . . . . . . . . . . . . . . . . . . . . . . . . . . . . . . . . 10-1
10.3 Connecting to Transpector CPM . . . . . . . . . . . . . . . . . . . . . . . . . . . . . . . . 10-2
10.4 RGA Configuration—CPM tab . . . . . . . . . . . . . . . . . . . . . . . . . . . . . . . . . . 10-4
10.4.1 Valves and Orifices pane . . . . . . . . . . . . . . . . . . . . . . . . . . . . . . . . . . . . . . 10-5
10.4.1.1 Inlet LP . . . . . . . . . . . . . . . . . . . . . . . . . . . . . . . . . . . . . . . . . . . . . . . . . . . . 10-5
10.4.1.2 Inlet HP. . . . . . . . . . . . . . . . . . . . . . . . . . . . . . . . . . . . . . . . . . . . . . . . . . . . 10-5
10.4.1.2.1 Inlet HC . . . . . . . . . . . . . . . . . . . . . . . . . . . . . . . . . . . . . . . . . . . . . . . . . . . 10-5
10.4.1.2.2 Inlet Bypass . . . . . . . . . . . . . . . . . . . . . . . . . . . . . . . . . . . . . . . . . . . . . . . . 10-5
10.4.1.2.3 Inlet Calibration . . . . . . . . . . . . . . . . . . . . . . . . . . . . . . . . . . . . . . . . . . . . . 10-6
10.4.2 Gauges pane . . . . . . . . . . . . . . . . . . . . . . . . . . . . . . . . . . . . . . . . . . . . . . . 10-6
10.4.2.1 Process Gauge. . . . . . . . . . . . . . . . . . . . . . . . . . . . . . . . . . . . . . . . . . . . . . 10-6
10.4.3 Bypass Delay - Interlock between V2 and V4 . . . . . . . . . . . . . . . . . . . . . . 10-7
10.5 CPM Configuration Monitor . . . . . . . . . . . . . . . . . . . . . . . . . . . . . . . . . . . . 10-8
10.6 CPM Sensor Acquisition Defaults . . . . . . . . . . . . . . . . . . . . . . . . . . . . . . 10-12
10.6.1 What to Acquire (RGAs). . . . . . . . . . . . . . . . . . . . . . . . . . . . . . . . . . . . . . 10-12
10.6.1.1 Acquisition Modes . . . . . . . . . . . . . . . . . . . . . . . . . . . . . . . . . . . . . . . . . . 10-12
10.6.1.1.1 Spectrum Mode Acquisition Parameters . . . . . . . . . . . . . . . . . . . . . . . . . 10-14
10.6.1.2 Selected Masses Mode . . . . . . . . . . . . . . . . . . . . . . . . . . . . . . . . . . . . . . 10-15
10.6.1.2.1 Existing Masses . . . . . . . . . . . . . . . . . . . . . . . . . . . . . . . . . . . . . . . . . . . . 10-16
10.6.1.2.2 Adding Masses. . . . . . . . . . . . . . . . . . . . . . . . . . . . . . . . . . . . . . . . . . . . . 10-17
10.6.2 How to Acquire (CPM) . . . . . . . . . . . . . . . . . . . . . . . . . . . . . . . . . . . . . . . 10-20
10.6.2.1 Ionizer Presets . . . . . . . . . . . . . . . . . . . . . . . . . . . . . . . . . . . . . . . . . . . . . 10-21
TOC – 6
Page 11

Transpector CPM Operating Manual
10.6.2.2 Start Parameters . . . . . . . . . . . . . . . . . . . . . . . . . . . . . . . . . . . . . . . . . . . 10-21
10.6.2.2.1 Start Mode Type . . . . . . . . . . . . . . . . . . . . . . . . . . . . . . . . . . . . . . . . . . . . 10-21
10.6.2.2.2 Data Threshold. . . . . . . . . . . . . . . . . . . . . . . . . . . . . . . . . . . . . . . . . . . . . 10-22
10.6.2.2.3 Emission . . . . . . . . . . . . . . . . . . . . . . . . . . . . . . . . . . . . . . . . . . . . . . . . . . 10-22
10.6.2.2.4 Multiplier . . . . . . . . . . . . . . . . . . . . . . . . . . . . . . . . . . . . . . . . . . . . . . . . . . 10-22
10.6.2.2.5 Relay 1 . . . . . . . . . . . . . . . . . . . . . . . . . . . . . . . . . . . . . . . . . . . . . . . . . . . 10-22
10.6.2.3 Stop Parameters. . . . . . . . . . . . . . . . . . . . . . . . . . . . . . . . . . . . . . . . . . . . 10-23
10.6.2.3.1 Stop Mode Type . . . . . . . . . . . . . . . . . . . . . . . . . . . . . . . . . . . . . . . . . . . . 10-23
10.6.2.3.2 Data Threshold. . . . . . . . . . . . . . . . . . . . . . . . . . . . . . . . . . . . . . . . . . . . . 10-23
10.6.2.3.3 Maximum Duration . . . . . . . . . . . . . . . . . . . . . . . . . . . . . . . . . . . . . . . . . . 10-24
10.6.2.3.4 Emission . . . . . . . . . . . . . . . . . . . . . . . . . . . . . . . . . . . . . . . . . . . . . . . . . . 10-24
10.6.2.3.5 Multiplier . . . . . . . . . . . . . . . . . . . . . . . . . . . . . . . . . . . . . . . . . . . . . . . . . . 10-24
10.6.2.3.6 Relay 1 . . . . . . . . . . . . . . . . . . . . . . . . . . . . . . . . . . . . . . . . . . . . . . . . . . . 10-25
10.6.2.4 Dwell. . . . . . . . . . . . . . . . . . . . . . . . . . . . . . . . . . . . . . . . . . . . . . . . . . . . . 10-25
10.6.2.4.1 Dwell Mode. . . . . . . . . . . . . . . . . . . . . . . . . . . . . . . . . . . . . . . . . . . . . . . .10-25
10.6.2.4.2 Dwell Time . . . . . . . . . . . . . . . . . . . . . . . . . . . . . . . . . . . . . . . . . . . . . . . .10-26
10.6.2.5 Delay . . . . . . . . . . . . . . . . . . . . . . . . . . . . . . . . . . . . . . . . . . . . . . . . . . . . 10-26
10.6.2.5.1 Delay Mode . . . . . . . . . . . . . . . . . . . . . . . . . . . . . . . . . . . . . . . . . . . . . . . 10-26
10.6.2.5.2 Time Between Scans . . . . . . . . . . . . . . . . . . . . . . . . . . . . . . . . . . . . . . . .10-27
10.6.2.5.3 Stabilization Time . . . . . . . . . . . . . . . . . . . . . . . . . . . . . . . . . . . . . . . . . . . 10-27
10.6.2.6 Correction . . . . . . . . . . . . . . . . . . . . . . . . . . . . . . . . . . . . . . . . . . . . . . . . .10-27
10.6.2.6.1 Baseline . . . . . . . . . . . . . . . . . . . . . . . . . . . . . . . . . . . . . . . . . . . . . . . . . .10-27
10.6.2.6.2 Peak Lock. . . . . . . . . . . . . . . . . . . . . . . . . . . . . . . . . . . . . . . . . . . . . . . . .10-28
10.6.2.7 Inlet. . . . . . . . . . . . . . . . . . . . . . . . . . . . . . . . . . . . . . . . . . . . . . . . . . . . . . 10-28
10.6.2.7.1 Close After . . . . . . . . . . . . . . . . . . . . . . . . . . . . . . . . . . . . . . . . . . . . . . . .10-29
10.6.2.7.2 Duty Cycle . . . . . . . . . . . . . . . . . . . . . . . . . . . . . . . . . . . . . . . . . . . . . . . . 10-29
10.6.2.8 Heater. . . . . . . . . . . . . . . . . . . . . . . . . . . . . . . . . . . . . . . . . . . . . . . . . . . . 10-29
10.6.2.8.1 Off After . . . . . . . . . . . . . . . . . . . . . . . . . . . . . . . . . . . . . . . . . . . . . . . . . . 10-29
Chapter 11
Glossary
Chapter 12
Bibliography
TOC – 7
Page 12
Chapter 1
WARNING
WARNING - Risk Of Electric Shock
WARNING - Risk Of Electric Shock
WARNING - Risk Of Electric Shock
Getting Started
1.1 General Safety Information
Transpector CPM is not for use in a manner not specified
by INFICON.
There are no user serviceable components within the
Transpector CPM case.
Transpector CPM Operating Manual
Potentially lethal voltages are present when the line cord
is connected to Transpector CPM.
Refer all Transpector CPM maintenance to qualified
personnel.
1–1
Page 13

1.2 Purpose of Transpector CPM
Transpector CPM samples a representative fraction of a process environment and
directs the gas sample to a Residual Gas Analyzer (RGA). The CPM can detect
levels of impurities in process gases at sub-ppm levels.
1.2.1 Description of the Transpector CPM
Transpector CPM is comprised of:
®
FabGuard
control and status information. It includes a full array of basic residual gas
analyzer (RGA) features, including Spectrum or Selected Peaks scanning,
Leak Detection and Recipe Generation.
Quadrupole Sensor analyzes gases by: (1) ionizing the gas molecules,
(2) separating the ions by their mass-to-charge ratio, and (3) measuring the
quantity of ions at each mass. The sensor can indicate the partial pressures of
gases characteristic of processes occurring within a vacuum or other vessel,
and is used to investigate the nature of a process or to monitor process
conditions.
Electronics Module (Transpector
module and quadrupole sensor are a matched set. The electronics module
attaches to and is supported by the sensor.
or FabGuard Explorer™ software provides automatic or manual
Transpector CPM Operating Manual
®
) controls the sensor. The electronics
CPM Controller consolidates control functions into a single device. The CPM
controller works in conjunction with the Transpector electronics module to
control valve activation, heaters, pumps, and power to all elements of the
system.
Pumping System provides process sampling from 1.5 atmospheres to high
vacuum.
Inlet Valves, a HexBlock™ inlet provides several sampling ranges, a
calibration reference, and a process pressure gauge.
1–2
Page 14
1.3 Using this Operating Manual
CAUTION
WARNING
WARNING - Risk Of Electric Shock
Before using this manual, please take a moment to understand the Cautions and
Warnings used throughout. They provide pertinent information that is useful in
achieving maximum instrument efficiency while ensuring personal safety.
NOTE: Notes provide additional information about the current topic.
HINT: Hints provide insight into product usage.
Failure to obey these messages could result in damage
to the sensor.
Failure to obey these messages could result in personal
injury.
Transpector CPM Operating Manual
Potentially lethal voltages are present.
1–3
Page 15

1.4 How to Contact INFICON
To contact INFICON regarding Transpector CPM, please use the following contact
information:
INFICON, Inc.
Two Technology Place
East Syracuse, NY 13057
USA
Tel: +315.434.1100
Fax: +315.437.3803
E-mail: reachus@inficon.com
Worldwide customer support information is also available at www.inficon.com
under Contact >> Support Worldwide
Sales and Customer Service
Technical Support
Repair Service
If experiencing a problem with Transpector CPM, please have the following
information readily available:
Transpector CPM Operating Manual
The Transpector CPM serial number
A description of the problem
An explanation of any attempts at corrective action
The exact wording of any error messages received
1.4.1 Returning Transpector CPM to INFICON
Do not return any component of the Transpector CPM to INFICON without first
speaking with a Customer Support Representative. A Return Material
Authorization (RMA) number must be obtained from the Customer Support
Representative.
If a package is delivered to INFICON without an RMA number, the package will be
held and customer contact will be made. This will result in delays in servicing
Transpector CPM.
Prior to being given an RMA number, a Declaration Of Contamination (DOC) form
may need to be completed if the sensor has been exposed to process materials.
DOC forms must be approved by INFICON before an RMA number is issued.
INFICON may require that the sensor be sent to a designated decontamination
facility, not to the factory.
1–4
Page 16

Transpector CPM Operating Manual
1.5 Transpector CPM Performance Specifications
1.5.1 General Specifications
Table 1-1 General specifications
Mass Range (AMU) 1 – 100 1 – 200 1 – 300
Resolution <1 AMU wide @ 10% peak height over entire mass range
(per AVS 1993 recommended practice)
Total Pressure Range
Total Pressure
Accuracy
1
2
5x10⁻⁷–1x10⁻³ Torr (6.6x10⁻⁷–1.3x10⁻³ mbar)
±25% 1x10
-6
–1x10⁻³ Torr (1.3x10⁻⁶–1.3x10⁻³ mbar)
Maximum Ion Source
Operating Pressure
Nominal Operating
Pressure
4
System Operating
Pressure
Sensitivity
@ Low Emission
@ High Emission
Minimum Detectable
Partial Pressure
5
Maximum Data Rate
(analog scans OR
selected peaks)
Abundance Sensitivity
Zero Blast
Detection Limit
Linearity
7
8
9
3
-8
Torr (1.3x10⁻⁸ mbar)–1.2 atmospheres (with proper inlet configuration)
1x10
Amps/Torr (Amps/mbar)
-6
>4x10
>2x10
(1.3x10
6
(>3x10⁻⁶)
-5
(>1.5x10⁻⁵)
-13
1x10
-13
<5 ppm <10 ppm <100 ppm
<2 ppm <25 ppm <200 ppm
<1 ppm <2 ppm <4 ppm
Torr
mbar)
1x10⁻³ Torr (1.3x10⁻³ mbar)
2x10⁻⁴ Torr (2.6x10
-4
mbar)
Amps/Torr (Amps/mbar)
-6
-5
2x10
(2.6x10
(>1.5x10⁻⁶)
(>7.6x10⁻⁶)
-13
To rr
-13
mbar)
>2x10
>1x10
1.8 ms per point
(555 data points per second)
±20%
Amps/Torr (Amps/mbar)
-6
-6
4x10
(5.3x10
(>7.6x10⁻⁷)
(>3.8x10⁻⁶)
-13
Torr
-13
mbar)
>1x10
>5x10
1–5
Page 17

Transpector CPM Operating Manual
Table 1-1 General specifications (continued)
Mass Range (AMU) 1 – 100 1 – 200 1 – 300
Minimum Background
Pressure
Maximum Sensor and
1x10⁻⁸ Torr
(1.3x10
150°C
-8
mbar)
Inlet Temperature
1
Ion source pressure reading @ low emission using total pressure lens
2
Total pressure accuracy @ low emission
3
Maximum ion source operating pressure @ low emission
4
-4
2x10
5
MDPP at the ion source with EM on and 1 s dwell time
6
Mass 40 contribution onto 41 AMU
7
Zero blast contribution onto 2 AMU
8
Minimal detectable concentration with Krypton in air @ a 1 s dwell time
9
For 1 Torr orifices and lower. Linearity @ low emission at 0.1 to 2 times the nominal orifice pressure
Torr in the ion source will produce about 1x10
-5
Torr in the quadrupole region
1–6
Page 18

1.5.2 Hex Block Orifice Sampling Inlets
Table 1-2 HexBlock inlets and available orifices (maximum nominal pressure for orifice)
Inlet Orifices
V1 (LP) 3 mTorr (no orifice)
V2 (HP) 3 mTorr (no orifice)
10 Torr (bypass)
30 Torr (bypass)
1 Torr Sniffer (bypass)
3 Torr Sniffer (bypass)
7 Torr Sniffer (bypass)
10 Torr Sniffer (bypass
30 Torr Sniffer (bypass)
100 Torr Sniffer (bypass)
Transpector CPM Operating Manual
10 mTorr
15 mTorr
100 mTorr
360 mTorr
1 Torr
10 mTorr
15 mTorr
100 mTorr
360 mTorr
1 Torr (bypass)
3 Torr (bypass)
1–7
V3 (HC) 1 mTorr (High Conductance)
Page 19

1.5.3 Atmospheric Pressure (Capillary) Sampling
Table 1-3 Capillary sampling option
Transpector CPM Operating Manual
Process Pressure Range
o
(23
C ambient, no purge)
Capillary Size and Lengths 1/16 in. OD x 1.5 m SS capillary
Process Gas Consumption 2.6 sccm @ 300 Torr (400 mbar)
Response Time for Composition
Changes (response to normal inert
gases)
300 to 900 Torr (400 to 1199 mbar)
1/16 in. OD x 3.0 m SS capillary
17 sccm @ 760 Torr (1013 mbar)
30 sccm @ 900 Torr (1199 mbar)
Capillary Delay: t(1.5m) = 0.3 s
t(3.0m) = 1 s
Intermediate Volume Tau = 0.7 s
CPM Isolation time constant = 75 s
1–8
Page 20
1.6 Physical Requirements
183 mm
362 mm
(7.2 in.)
(14.3 in.)
378 mm
(14.9 in.)
545 mm
(21.5 in.)
152 mm
(6.0 in.)
1.6.1 Physical Dimensions
Figure 1-1 Pumping system dimensions
Transpector CPM Operating Manual
Pumping System dimensions
545 x 152 x 378 mm (21.5 x 6.0 x 14.9 in.)
CPM Controller dimensions
195 x 207 x 89 mm (7.7 x 8.1 x 3.5 in.)
Foreline Pump dimensions
1–9
218 x 150 x 147 mm (8.6 x 5.9 x 5.8 in.)
NOTE: See Figure 2-8 on page 2-10 for cable connections.
Page 21

1.6.2 Weight
CAUTION
The approximate weight of Transpector CPM (without the Foreline Pump and the
CPM controller) is 15.5 kg (34 lb.).
NOTE: This weight does not include connecting cables.
1.6.3 Ventilation Requirements
For adequate ventilation, maintain at least 25.4 mm (1 in.)
clearance around the Transpector electronics module,
the CPM heaters and the pumping system.
If enclosing Transpector CPM, the enclosure must be large enough or ventilated to
provide adequate cooling airflow to the fan on the Transpector CPM pumping
system and the fan in the Transpector CPM controller.
Transpector CPM Operating Manual
1.7 Electrical Power Requirements
The CPM system components that require AC power input are:
CPM controller . . . . . . . . . . . . . . . . . Universal input, any voltage in the range
Personal computer . . . . . . . . . . . . . . Universal input, any voltage in the range
1.7.1 Required Supply Voltage
Except for the AC power input, the CPM controller supplies all required voltages.
1.7.1.1 Acceptable Supply Voltage Range
The AC power input must be 100, 120, or 230 V
NOTE: If the input power is less than 100 V
reach their nominal temperature will be increased.
1.7.1.2 Required Frequency
50 or 60 Hz, ±5%
specified in section 1.7.1.1 is acceptable.
specified in section 1.7.1.1 is acceptable.
~, ±10%
~, the time required for the heaters to
1.7.1.3 Power Rating
CPM controller—500 VA
1–10
Page 22

1.7.1.4 Fuse Rating
CAUTION
Transpector CPM Operating Manual
3.15 A @ 250 V
Interrupt Current 35 A @ 250 V~
Type T (5 x 20 mm)
1.7.1.5 Overvoltage Category
Overvoltage Category II (per EN61010-1:2010)
Short Term: 1440 V < 2 seconds
Long Term: 490 V < 5 seconds
1.7.1.6 Electrical Connections
One of the following:
110 V
230 V
NOTE: Do not replace power cord with an inadequately rated cord. Cord must be
~, three-pronged, grounded plug
~, European style, two-pronged plug with ground contact
rated 10 A or higher.
~
1.8 Nitrogen Purge Gas (Corrosive System Only)
The corrosive service Turbo Molecular Pump requires 10 to 25 sccm nitrogen
purge gas flow through its bearings to protect the bearings from corrosion and loss
of lubricant by evaporation. The CPM nitrogen regulator range is
10–15 psi (gauge). It is set for 10 sccm flow at the factory.
The corrosive service Turbo Molecular Pump (CVD/Etch),
requires nitrogen purge gas flow whenever the system is
operational.
Normally, dry nitrogen is supplied at the acceptable pressure range for the air
pressure. (See section 1.10.1 on page 1-13). In this manner, dry nitrogen can be
supplied directly to the solenoid valve block and to the pressure regulator via the
supplied 6.35 mm (1/4 in.) tee. The regulator supplies dry nitrogen at a reduced
pressure for the purge.
1–11
Page 23
Figure 1-2 Compressed air supply connection
WARNING
CAUTION
Dry Compressed Air
Dry nitrogen
58–100 psi (gauge)
58–100 psi (gauge)
Bearing Purge
Corrosive System Only
Recommended Setting
is 75-80 psi (gauge)
Transpector CPM Operating Manual
The pressure range is 58–100 psi (gauge) (4–6.9 bar) [400–690 kPa].
Recommended setting is 75-80 psi (gauge) (5.17 to 5.52 bar) [517 kPa to
552 kPa].
1.9 Exhaust Gas
Exhausting gas from the Turbo Molecular Pump is required for corrosive
applications. With non-corrosive applications, exhaust the Turbo Molecular Pump
in accordance with the facility's requirements. The dry Foreline Pump has a
6.35 mm (1/4 in.) Swagelok
Nitrogen pressure must not exceed 100 psi (gauge)
(6.9 bar) [690 kPa].
Nitrogen pressure must be at least 58 psi (gauge)
(4 bar) [400 kPa].
®
tube adapter for an exhaust fitting.
1–12
Page 24
1.10 Air Pressure Requirements
WARNING
CAUTION
CAUTION
1.10.1 Required Air Pressure
Dry compressed air (or dry nitrogen) is used to operate the electro-pneumatic inlet
valves. The minimum air pressure required to operate the inlet valves is
58 psi (gauge) (4 bar) [400 kPa]. Recommended setting is 75-80 psi (gauge)
(5.17 to 5.52 bar) [517 kPa to 552 kPa].
1.10.2 Air Pressure Range
The air pressure range is 58–100 psi (gauge) (4–6.9 bar) [400–690 kPa].
Recommended setting is 75-80 psi (gauge) (5.17 to 5.52 bar) [517 kPa to
552 kPa].
Air pressure must not exceed 100 psi (gauge)
(6.9 bar) [690 kPa].
Transpector CPM Operating Manual
Air pressure must be at least 58 psi (gauge) (4 bar)
[400 kPa].
1.10.3 Moisture Content of Compressed Air Supply
The compressed air supply used for inlet valve operation must be dried to the
extent that changes in compressed air pressure during operation will not produce
condensation in lines, solenoids or valve actuators.
Moisture condensation can cause corrosion.
1.10.4 Air Pressure Connections
The compressed air supply connects to the CPM solenoid with 6.35 mm (1/4 in.)
polymer hose. The 6.35 mm (1/4 in.) connector is a friction-lock, right-angle fitting
to adapt the supply hose to the solenoid base.
1–13
Page 25

1.11 Vacuum Requirements
CAUTION
1.11.1 Required Vacuum
The Turbo Molecular Pump and Foreline Pump create vacuum. The Foreline Pump
must provide <10 Torr (13 mbar) when there is up to 30 sccm of nitrogen purge plus
process gas bypass flow.
Do not exceed 10 Torr (13 mbar) Foreline Pump pressure.
1.11.2 Acceptable Range Of Vacuum
The CPM manifold can achieve <1x10⁻⁸ Torr (1.33x10⁻⁸ mbar) of base pressure (no
sample flow) after bakeout and cool down. This level of vacuum requires a foreline
pressure of <10 Torr (13 mbar).
Transpector CPM Operating Manual
1.12 Environmental Requirements
1.12.1 Use
Indoor use only.
1.12.2 Altitude Range
Up to an altitude of 2000 m (6561 ft.)
Contact INFICON for operation at higher altitudes.
1.12.3 Maximum Humidity
80% relative humidity (no condensation)
1.12.4 Pollution Degree
Pollution Degree 2 (per EN61010-1:2001)
1.12.5 Maximum Operating Temperature
50°C (122°F) Transpector Electronics Module
35°C (95 °F) for the turbo pump under maximum gas load
1.12.6 Minimum Operating Temperatures
20°C (68°F)
1–14
Page 26

1.12.7 Clean Room Requirements
The CPM is clean room compatible (including silicone rubber heaters).
1.12.8 Anti-Static Conditions
CPM passes standard EN 61326-1:2013.
1.13 Computer System Requirements
The minimum system requirements for FabGuard® Explorer Operating Software
are listed in Table 1-4:
Table 1-4 Minimum computer requirements for FabGuard Explorer
Parameters FabGuard Explorer Requirements
Processor 2.4+ GHz Dual Core
Memory 4+ GB
Transpector CPM Operating Manual
Hard Drive
Resolution 1024 X 768 16-bit color or greater
Ethernet Port One free Ethernet port for connection to Transpector CPM
Operating
System
INFICON can supply a controller to run the software that operates
Transpector CPM System. (Refer to section 1.4 on page 1-4.)
1.13.1 Operating System
FabGuard Explorer software requires either Windows 7 or Windows 8 for proper
operation.
See Chapter 10 or the FabGuard Explorer CD for FabGuard Explorer software
operation.
SATA 80 GB to 1 TB 7200+ RPM
Windows 7
®
or Windows 8
®
1–15
Page 27

Chapter 2 Installation
2.1 Installation Overview
The Transpector CPM system is partially disassembled for shipping and must be
re-assembled prior to operation. The Transpector sensor is shipped inside the
CPM manifold tee, but the remaining components such as the Transpector
electronics module, cable box, CPM controller, diaphragm foreline pump and all
connecting cables will need to be installed per the instructions in this chapter:
1 Install the Transpector electronics module, heat guard, and cable box. (See
section 2.2 on page 2-2.)
2 Install sniffers, if applicable. (See section 2.2 on page 2-2.)
3 Mount CPM to process tool, if applicable. (See section 2.4 on page 2-5.)
4 Install the CPM controller and connect communications cables from the CPM
controller to the Transpector cable box (See Figure 2-6 on page 2-8.)
Transpector CPM Operating Manual
5 Connect cables on the Transpector cable box to the various CPM sub systems,
and the control computer. (See Figure 2-8 on page 2-10.)
6 Install the CPM Foreline Pump. (See section 2.7 on page 2-11.)
7 Install the software. (See section 2.8, Software Installation, on page 2-11.)
2–1
Page 28
Transpector CPM Operating Manual
Mounting Nut
CPM Manifold Tee
Transpector Electronics Module
Cable Box
Transpector Sensor
2.2 Transpector Electronics Module, Heat Guard, and Cable Box Installation
The Transpector electronics module and cable box must be mounted in an area
where the ambient temperature does not exceed 50°C (122°F) and there is ample
air flow. Best performance is achieved when the electronics module is not exposed
to wide temperature variations.
2.2.1 Attach Transpector Electronics Module
The Transpector sensor is typically already installed inside the CPM Manifold Tee.
The Transpector electronics module must be mounted onto the sensor:
1 The Transpector sensor mounting connector assembly includes a mounting nut
and an O-ring. Place the nut over the end of the sensor and roll the O-ring back
to the groove on the sensor. When the mounting nut is tightened, the O-ring
compresses making a tight fit on the sensor housing.
2 Note the recessed area on the sensor feedthrough and the ground tab on the
Transpector electronics module. Match the recessed area of the feedthrough
to the ground tab and carefully slide the Transpector electronics module fully
onto the sensor.
3 Finger tighten the mounting nut on the Transpector sensor.
Figure 2-1 Transpector electronics module dimensions
2–2
Page 29
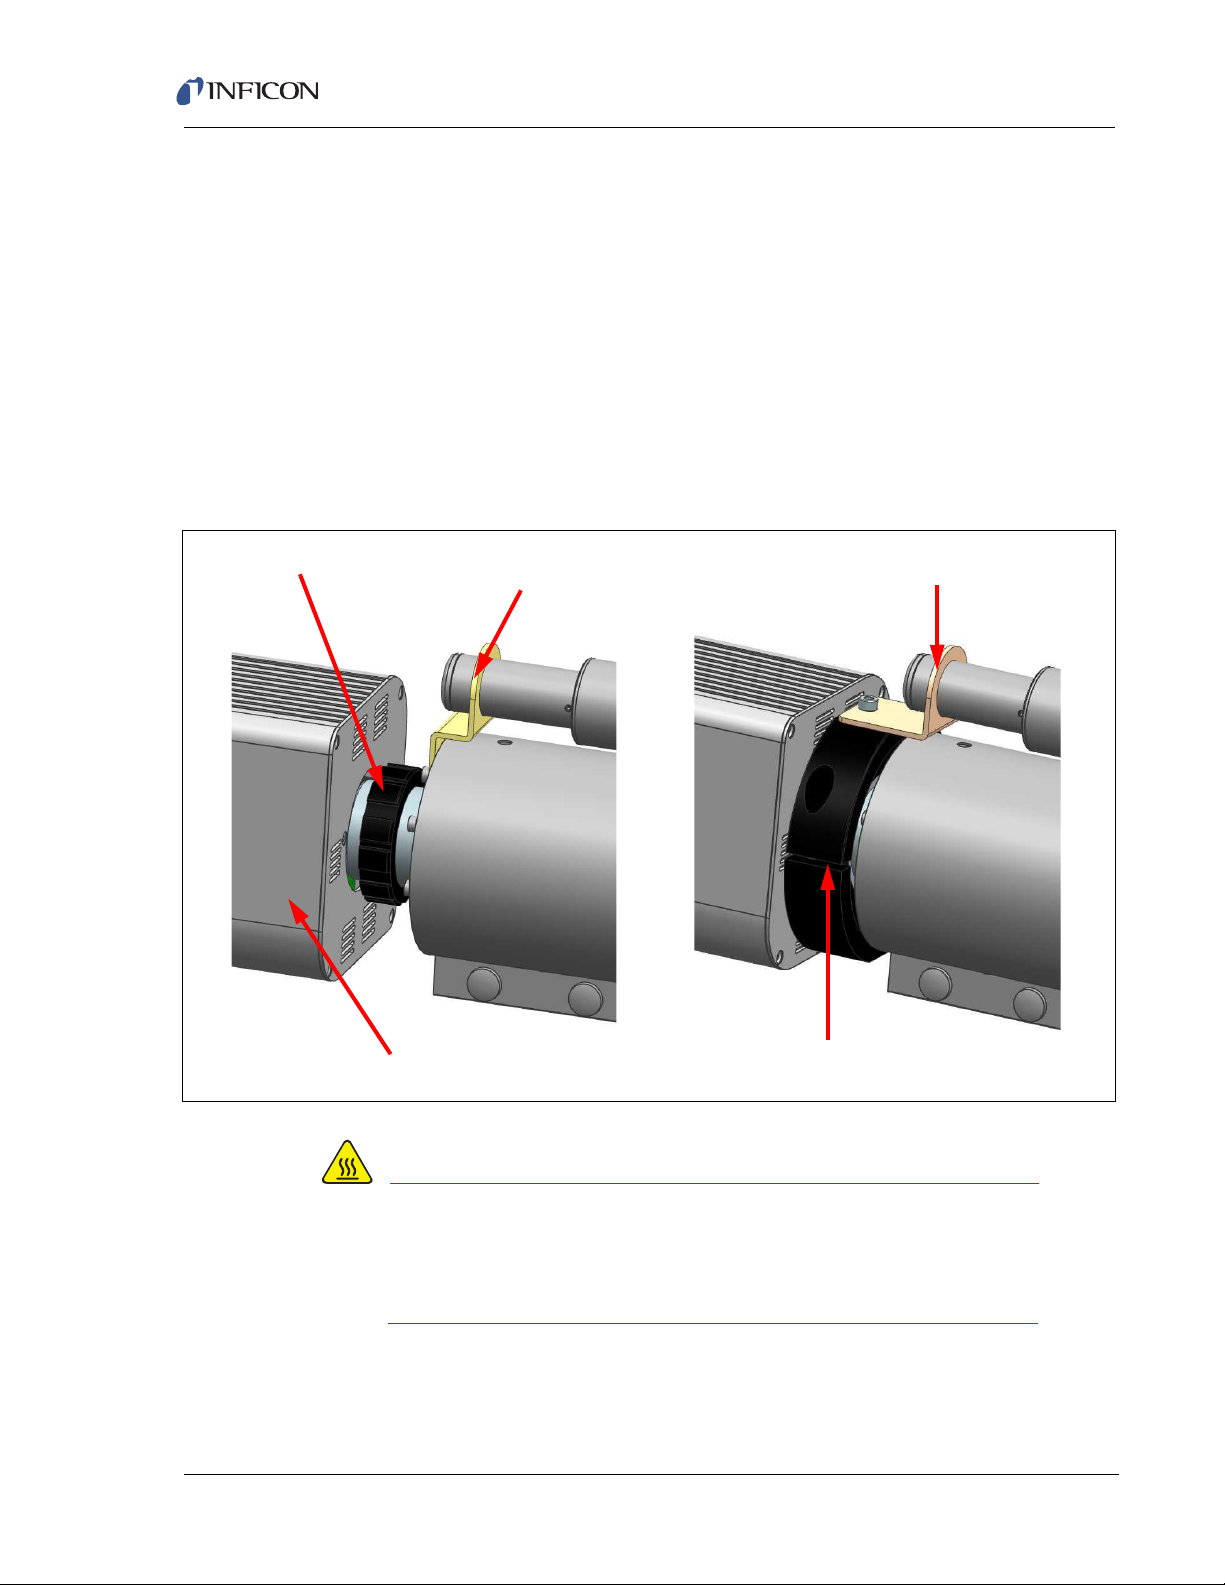
2.2.2 Attach Heat Guard
WARNING - High Temperature
Calibration Reference
Shipping Bracket
Heat Guard
Calibration Reference
Standard Bracket
Transpector Electronics Module
Mounting Nut
To decrease the risk of burns when the heating jacket is on, a heat guard is
provided for the metal surfaces between the Transpector electronics box and the
CPM manifold tee.
1 Loosen the single screw that attaches the calibration reference shipping
bracket to remove the bracket. Replace the screw.
2 Attach heat guard between the Transpector electronics module and the
mounting nut using the two screws provided.
3 Attach calibration reference standard bracket to the heat guard and secure the
bracket to the heat guard with the provided screw.
Figure 2-2 Heat Guard and Calibration Reference Bracket
Transpector CPM Operating Manual
Metal surfaces will be hot when heating jacket is on.
Attach heat guard to avoid risk of burns from metal
surfaces between Transpector electronics module and
CPM manifold tee.
2–3
Page 30
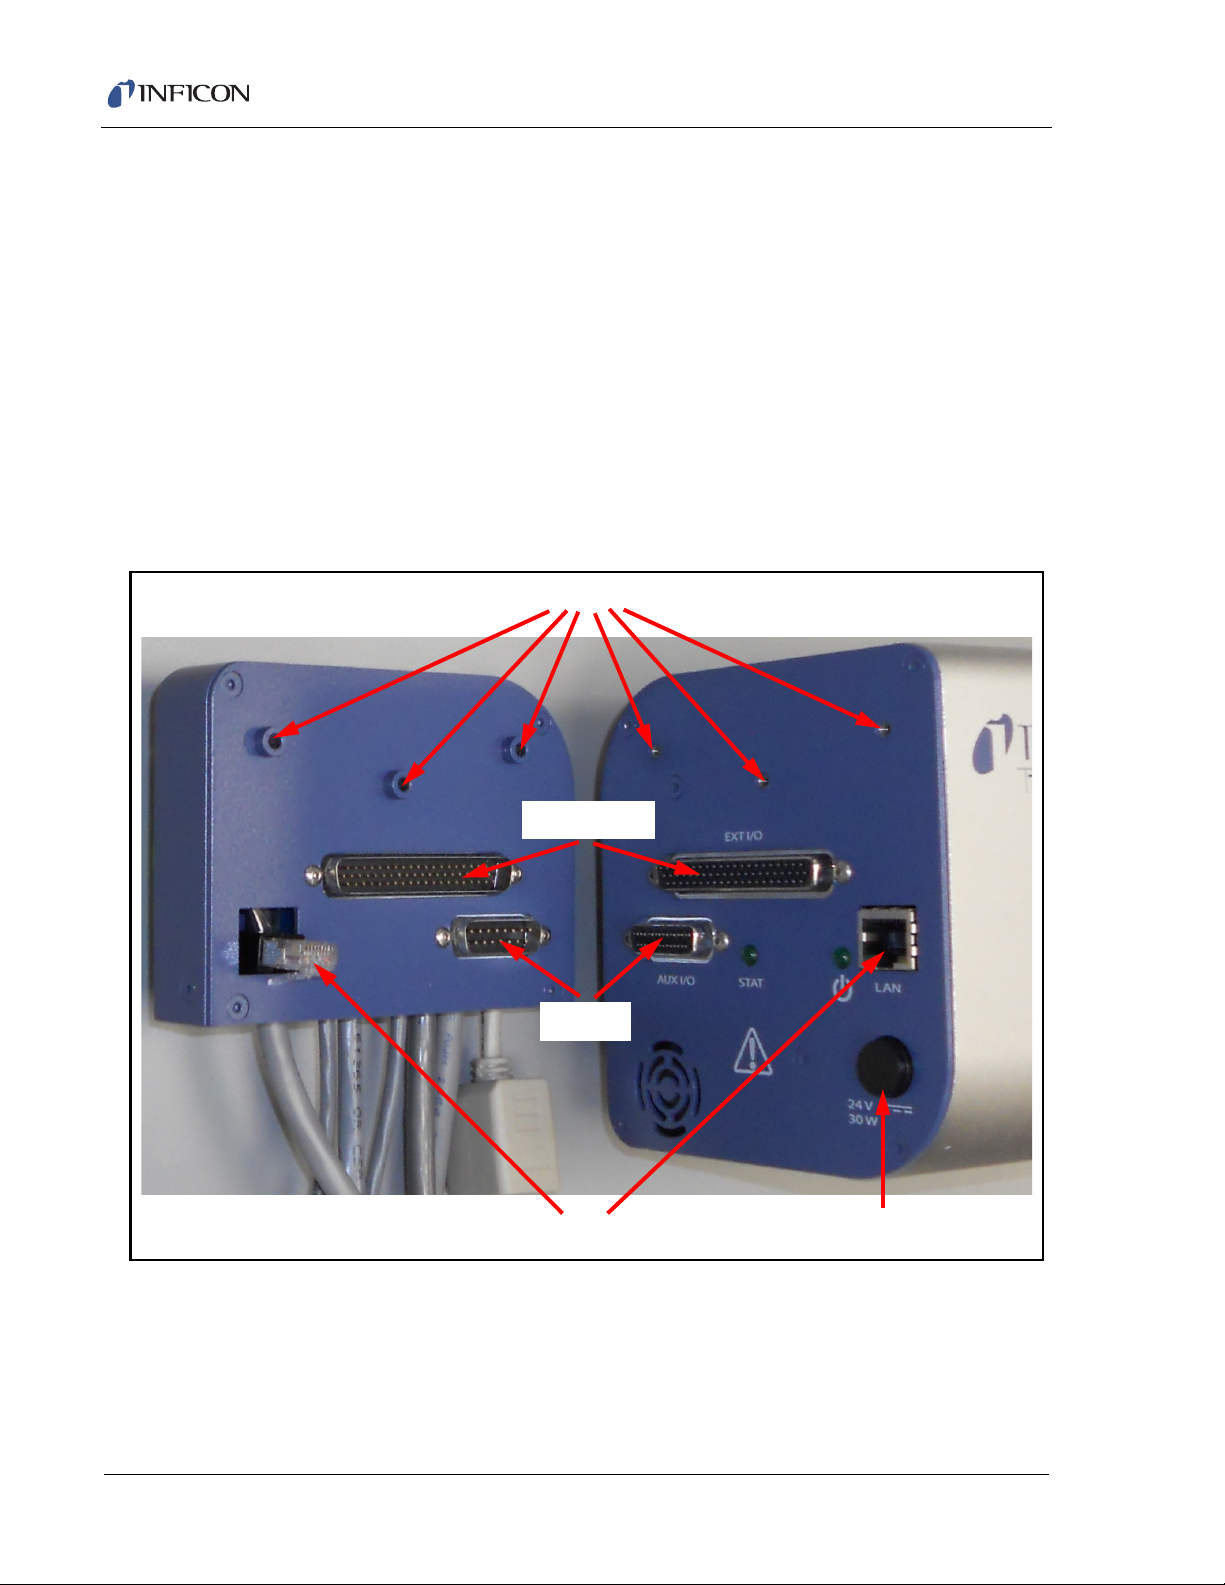
2.2.3 Attach Cable Box
Screw Holes
Ethernet Connection
Extended I/O
Aux I/O
Transpector 24V Input
The cable box and Transpector electronics module are connected via an Ethernet
connection, a 15-pin Aux I/O connection, and a 62-pin extended I/O connection.
Three screws are used to stabilize the cable box on the electronics module.
(See Figure 2-3.)
To connect the cable box to the electronics module:
1 Insert the Ethernet jack on the cable box into the Ethernet port on the
electronics module.
2 Carefully insert the 15-pin Aux I/O and 62-pin extended I/O connectors until
they are secure and the Ethernet connector snaps into place.
3 Secure the cable box on the electronics module with the three provided screws.
Figure 2-3 Transpector electronics module and cable box
Transpector CPM Operating Manual
2–4
Page 31

WARNING - Risk Of Electric Shock
DO NOT remove the cover from the Transpector 24 V
CAUTION
input. 24V is supplied to the Transpector electronics box
from the controller.
2.3 Sniffer Installation
Install the sniffer into the Swagelok® fitting on the hexblock using the 1/4 in.
(6.35 mm) nut and vespel ferrule supplied with the sniffer.
2.4 Mounting the Pumping System
The Transpector CPM system typically mounts directly to a process chamber via
the CF or KF process connection at the end of the Hexblock inlet. Normally there
is no need to use an additional isolation valve between the Hexblock and the
process chamber.
Transpector CPM Operating Manual
If an isolation valve is needed and the CPM does not have a CDG interlock for the
Hexblock inlet, it is essential to pump down the volume between the Hexblock and
isolation valve from the process side before the CPM is turned on. If this volume is
not pumped down properly filament failure can be the result.
If an isolation valve is used ensure and trapped volumes
are pumped out in order to avoid filament failure.
A support kit is supplied for CPM configurations with a standard process
connection. The support kit, PN 922-209-G1, consists of two 1.22 m (4 ft.) support
legs, two adjustable feet and mounting hardware.
2–5
Page 32

2.4.1 Installing the Support Kit
1 Measure the support leg to make sure there is ample room for installation. The
leg may be cut to size.
NOTE: One end of the support leg has a threaded hole for the adjustable foot.
When cutting the leg, make sure that the threaded hole end is used for
the support.
2 Screw the adjustable foot fully into the bottom of the support leg. (See Figure
2-4.)
3 Install the right angle bracket onto the support leg using the T-nut and bolts
provided. Finger tighten.
4 Install the second bolt and T-nut into the bracket, leaving it loose.
5 Slide the T-nut into the CPM foreline block groove and adjust the position of the
leg so that it is perpendicular to the floor with the adjustable foot about 12.7 mm
(1/2 in.) from the floor.
6 Tighten all hardware.
7 Install the safety cap.
Transpector CPM Operating Manual
Figure 2-4 Adjusting leg position
2–6
8 Unscrew the adjustable foot until it supports Transpector CPM and relieve
pressure from the flange.
9 Tighten the lock nut on the adjustable foot against the support leg.
Page 33

2.4.2 Atmospheric Support Frame
Atmospheric Transpector CPMsystems do not need the standard support legs. An
atmospheric system is mounted to a support frame, which also houses the CPM
controller. (See Figure 2-5.)
Figure 2-5 CPM configured with support frame for atmospheric sampling
Transpector CPM Operating Manual
2.5 CPM Controller Installation
The CPM controller is standard 1/2 rack, 2U height rack mountable. The CPM
controller is provided with feet and can sit on the floor or table.
Cable connections on the CPM controller are:
Cable bundle that includes the CPM interface cable (connects to the cable box on
the back of the Transpector electronics module), heater cable, and ground strap
Foreline pump power cable
CPM Controller power cable
2–7
Page 34

Transpector CPM Operating Manual
CPM Interface
Foreline
Power
Heater
Fuse
Main Power
Electrical
Input
On/Off
Ground
The back panel of the CPM controller is shown in Figure 2-6. Connections are
shown in Figure 2-8.
Figure 2-6 CPM controller rear panel
2–8
Page 35

2.6 Transpector Cable Box Connections
The cable box mounted on the back of the Transpector electronics module makes
cable connections to most of the subcomponents of the CPM System. (See Figure
2-7. Cable connections for the entire CPM system are shown in Figure 2-8.)
Short Ethernet cable with port (600-1485-P1) attaches to the supplied RJ45,
Cat5e Ethernet cable, which then connects to the control computer. For
networking information, see Chapter 3, Connecting Transpector CPM.
Aux I/O cable (600-1486-P1) is available for User I/O. See section 4.3.1.1 on
page 4-3 for additional information about Aux I/O.
Turbo pump cable (600-1475-P1) connects to the turbo pump controller.
Pirani cable (600-1474-P1) connects to the foreline Pirani gauge.
Solenoid cable (600-1476-P1) connects to the solenoid valve block as well as
the digital pressure switch.
CDG cable (600-1473-P1) connects to the CDG gauge.
CPM cable (600-1472-P1) connects to the CPM interface cable in the cable
bundle from the CPM controller.
Figure 2-7 Cable box and cables
Transpector CPM Operating Manual
(600-1485-P1)
MMSP CPM Ethernet Cable
Turbo Cable (600-1475-P1)
MMSP Aux I/O Cable (600-1486-P1)
Foreline Gauge Cable (600-1474-P1)
CDG Cable (600-1473-P1)
CPM Control Cable (600-1472-P1)
Valve Manifold Cable (600-1476-P1)
2–9
Page 36

Figure 2-8 CPM cable connections
r
r
r
CPM Sensor
Heater Jacket
Hex
Block
Inlet
Transpector CPM Operating Manual
Cable Box (Bottom View)
Transpector CPM
Cable Box
CDG
Pirani
Foreline Block
Transpector CPM Controlle
Forepump
CPM
Interface
Powe
15 9
Turbo
Molecula
Pump
600-1473-P1
1, 3, 5 Or 10 m
Cable Bundle
600-1477-Gx
AC In
Htr
Turbo
Gnd
Ctrl
600-1474-P1
Pressure
Switch
Valve
Block
Fan
600-1130-PX
600-1475-P1
600-1154-PX
600-1155-P5
600-1476-P1
600-1480-PX
922-205-GX
Ethernet
Foreline Pump
600-1475-P1
600-1485-P1
600-1486-P1
600-1474-P1
IO
600-1472-P1
600-1473-P1
600-1476-P1
2–10
Page 37

2.7 CPM Foreline Pump Installation
WARNING
CAUTION
Foreline
Connection
Exhaust Port
Foreline Power
Cable
The 24 V (dc) dry Foreline Pump has the following connections:
Electrical connection to the CPM controller
Foreline hose connection from the UHV Turbo Molecular Pump foreline block
Exhaust port connection—required for corrosive or toxic gas sampling. Refer
to appropriate standards such as
Proper exhaust connections must be installed when
sampling toxic, corrosive or any hazardous gases to
protect the environment from lethal levels of gas.
Transpector CPM Operating Manual
SEMI S6-0707E for exhaust gas guidelines.
If a customer-supplied foreline pump is used, it must
provide a continuous pressure below 10 Torr.
Figure 2-9 Two-stage foreline pump components
2.8 Software Installation
Refer to the FabGuard Explorer Operating Manual for information regarding
software installation.
2–11
Page 38

Chapter 3
CAUTION
Connecting Transpector CPM
3.1 Introduction
Transpector CPM communicates via Ethernet. Devices on an Ethernet network
have two identifying addresses: an IP address and a MAC address.
IP addresses are assigned to identify individual devices on a network. Each
device on an Ethernet network must have a unique IP address.
IP addresses can be reassigned to other devices on the network as long as
each device has a unique IP address.
MAC addresses are unique for each device. MAC addresses are never
duplicated.
3.2 General Networking Information
3.2.1 IP Addresses
Transpector CPM Operating Manual
IP addresses can be either static or dynamic.
Static (manual) IP addresses are set by the user and are changeable by the
user. Static IP addresses are preferred.
Dynamic (automatic) IP addresses are automatically set by a host or by a
server on a network. Dynamic IP addresses can be set through Dynamic Host
Communication Protocol (DHCP).
NOTE: When using Static IP addresses on a large network (e.g., on a company
network), a block of addresses should be reserved for static IP address
use and prohibited from being assigned by the DHCP server (host). This
will avoid duplicate IP address conflicts.
Use static IP addresses with Transpector CPM. Using
DHCP, the host server may generate a new IP address if
Transpector CPM is taken offline and then returned
online or if there is an IP address conflict on the network.
If the Transpector CPM IP address is randomly changed
during data acquisition, FabGuard will not reconnect to
the new sensor IP address, which will result in a loss of
communication and loss of data.
3–1
Transpector CPM follows the IPv4 IP address convention. An example IP address
is
192.168.1.100. Each of the four parts is referred to as an “octet”. The
IP address consists of a Network Prefix and a Host Protocol.
Page 39

3.2.2 Subnetworking
An IP network can be split into multiple subnets. Subnetting sets a region of the
IP address as a Network Prefix for all IP addresses inside the subnet through a
subnet mask. The subnet mask determines which octets of the IP address are
used as the network prefix. (See Table 3-1.)
In order for two network devices to communicate, they must be on the same
subnet, be connected to the same internet network and have the same network
prefix.
NOTE: If two devices have different network prefixes, the two devices are on
different subnets.
Table 3-1 Subnetting
IP address 192.168.1.104 192.168.1.105 192.168.1.150
Subnet mask 255.255.255.0 255.255.0.0 255.255.255.192
Transpector CPM Operating Manual
Example 1 Example 2 Example 3
Network prefix 192.168.1.0 192.168.0.0 192.168.1.128
Host Protocol 0.0.0.104 0.0.1.105 0.0.0.22
3.3 Transpector CPM IP Address
The default Transpector CPM IP address is 192.168.1.100 with a subnet
mask of
NOTE: When connecting to an existing local network, there must be a static
Two methods of changing the Transpector CPM IP address are available.
INFICON Mass Spectrometer Search Utility. (See section 3.3.1.)
Transpector Web UI. (See section 3.3.1.2 on page 3-5.)
255.255.0.0.
IP address for each Transpector RGA. Contact the network administrator
for IP address assignments.
3–2
Page 40

Transpector CPM Operating Manual
3.3.1 Using the INFICON Mass Spectrometer Search Utility to
Change the Transpector CPM IP Address
The INFICON Mass Spectrometer Search Utility (IMSSU) is located on the
software installation disk and the RGA Manuals CD. The IMSSU does not need to
be installed. Double-click INFICONMassSpecSearch.exe. The IMSSU will
display. (See Figure 3-1.)
Figure 3-1 INFICON mass spectrometer search utility
3–3
The IMSSU detects every Transpector RGA installed on the network regardless of
IP address. The IMSSU will run automatically, or it can be manually started by
clicking Search (Clears List). The display shows:
Genus (MPCPM for Transpector CPM sensors)
Serial Number
Current IP address
MAC address
DHCP status (On or Off)
Description (user editable)
Page 41

Right-click on a sensor to display the menu shown in Figure 3-2.
CAUTION
Figure 3-2 IMSSU right-click menu
3.3.1.1 Change IP Address
1 Right-click on the sensor and select Change IP Address. The TCP/IP
Properties window will display. (See Figure 3-3.)
Figure 3-3 TCP/IP Properties window
Transpector CPM Operating Manual
The TCP/IP Properties window displays the:
Transpector CPM MAC Address
Transpector CPM IP address
Change To text box, to enter a new Transpector CPM IP address
DHCP On or DHCP Off selection
Set DHCP Off so the IP address cannot be automatically
assigned.
2 Type the new IP address in the Change To text box.
3 Click Apply. Transpector CPM will automatically reboot and will return online
with the new IP address.
4 Launch Web UI.
3–4
Page 42

3.3.1.2 Launch Web UI
Transpector Web UI can be launched from inside of the IMSSU. (Refer to the
074-581-P1 Transpector Web UI Operating Manual.)
3.3.1.3 Find Device
Find Device On will flash the power indicator on the device. The indicator will flash
for up to 60 seconds and then illuminate.
Find Device Off selected within 60 seconds after selecting Find Device On will
stop the search.
3.3.1.4 Show Settings
Click Show Settings to display multiple settings useful for troubleshooting.
The display shows:
Serial Number
Gateway
IP Address
DHCP Status
MAC Address
Transpector CPM Operating Manual
Description
Subnet Mask
Name
Description
Structure Version
Name
Box Type
Port
Firmware Version
TCP/IP Source
3–5
Page 43

3.4 Connecting Transpector CPM
Before connecting Transpector CPM, decide:
Is Transpector CPM going to be on:
a private network (installed directly on either a computer or a router that is
not hooked up to the internet), or
an internal network where multiple computers are connected with acce ss to
the internet?
Is more than one Transpector CPM sensor being installed at the same time?
3.4.1 Connecting a Single Transpector CPM
3.4.1.1 Single Transpector CPM Direct Connection Installation
When installing a single Transpector CPM on a private network or directly
connected to a computer, changing the IP address of Transpector CPM is
necessary only if the computer being used to connect to Transpector CPM has a
different network prefix than Transpector CPM.
Transpector CPM Operating Manual
The network prefix of Transpector CPM is
host computer used to control Transpector CPM must have a subnet mask of
192.168.x.x. The IP address of the
255.255.0.0 and a network prefix of 192.168.x.x.
If this is not the case, change the computer IP address to match the network prefix
of Transpector CPM. For example, giving the computer an IP address of
192.168.1.101 will allow Transpector CPM to communicate directly with the
computer. (See section 3.5, Changing the Computer IP Address, on page 3-8.)
3.4.1.2 Installing a Single Transpector CPM on an Existing Local Network
When installing a single Transpector CPM on an existing local network, the default
IP address of Transpector CPM may not be compatible with the network.
Transpector CPM can have either a Static IP address (recommended) or a
Dynamic IP address set by DHCP (not recommended).
Contact the network administrator for information regarding valid IP addresses and
ask the administrator to assign an IP address for Transpector CPM. (Refer to
section 3.3.1, Using the INFICON Mass Spectrometer Search Utility to Change the
Transpector CPM IP Address, on page 3-3.)
3–6
Page 44

Transpector CPM Operating Manual
CAUTION
CAUTION
3.4.2 Installing Multiple Transpector CPM Sensors
Each Transpector CPM is shipped with an identical default IP address. When
installing multiple Transpector CPM, the IP address of each Transpector CPM
must be changed one at a time so that each Transpector CPM has a unique
IP address. (Refer to section 3.3.1, Using the INFICON Mass Spectrometer Search
Utility to Change the Transpector CPM IP Address, on page 3-3.)
Do not connect multiple Transpector CPM to a network
without first changing the IP addresses. Otherwise, there
will be IP address conflicts on the network.
3.4.2.1 Installing Multiple Transpector CPM Directly to a Host Computer
A private local network must be created when multiple Transpector CPM sensors
are connected to a single host computer instead of an existing local area network.
Transpector CPM must be installed on either a router or Ethernet switch. The
router or switch is connected to the host computer through the LAN port of the
router/switch.
3.4.2.2 Installing Multiple Transpector CPM on an Existing Local Network
Use an Ethernet switch instead of a router when multiple Transpector CPM
sensors are connected to an existing local network.
Routers can cause conflicts with local networks because
the router will attempt to set IP addresses for all network
connected devices.
Since Transpector CPM sensors are network connected devices, each sensor
must have an IP address assigned to it by a network administrator. After changing
each IP address manually, connect all of the sensors to the Ethernet switch and
connect the switch to the local network.
3–7
Page 45

3.5 Changing the Computer IP Address
An alternative to changing the Transpector CPM IP address is to change the host
computer’s IP address to allow for communication between the host computer and
Transpector CPM.
3.5.1 Windows 7
NOTE: Changing the IP address of the host computer requires administrator
rights.
1 Click Start, then click Control Panel. (See Figure 3-4.)
Figure 3-4 Start menu
Transpector CPM Operating Manual
2 In the Network and Internet group. click View network status and tasks.
(See Figure 3-5.)
Figure 3-5 View network status and tasks
3–8
Page 46

Transpector CPM Operating Manual
3 On the network status and tasks window, click Change adapter settings.
(See Figure 3-6.)
Figure 3-6 Change adapter settings
4 If the host computer is connected directly to Transpector CPM through the
Ethernet port of the computer, right-click Local Area Connection and select
Properties. (See Figure 3-7.)
Figure 3-7 Changing adapter settings
3–9
Page 47

Transpector CPM Operating Manual
5 Click Internet Protocol Version 4 (TCP/IPv4).
6 Click Properties. (See Figure 3-8.)
Figure 3-8 TCP/IPv4
7 On the TCP/IPv4 properties window, click Use the following IP address.
(See Figure 3-9.)
Figure 3-9 Use the following IP address
3–10
Page 48

Transpector CPM Operating Manual
8 In IP address, type 192.168.1.XXX. The last octet can be any number as
long as it is unique to the network and is not the same as the Transpector CPM
IP address. (See Figure 3-10.)
9 In Subnet mask, type 255.255.0.0.
10 Click OK.
Figure 3-10 Changing the computer IP address
11 The IP address will now be set to the manual IP address chosen in step 7.
12 Exit all menus.
13 Connect to Transpector CPM.
14 To change the IP address back to its default settings, follow steps 1 through 6
and reset the properties to their original settings.
3–11
Page 49

Chapter 4
7
5
4
3
2
1
14
12
11
9
10
6
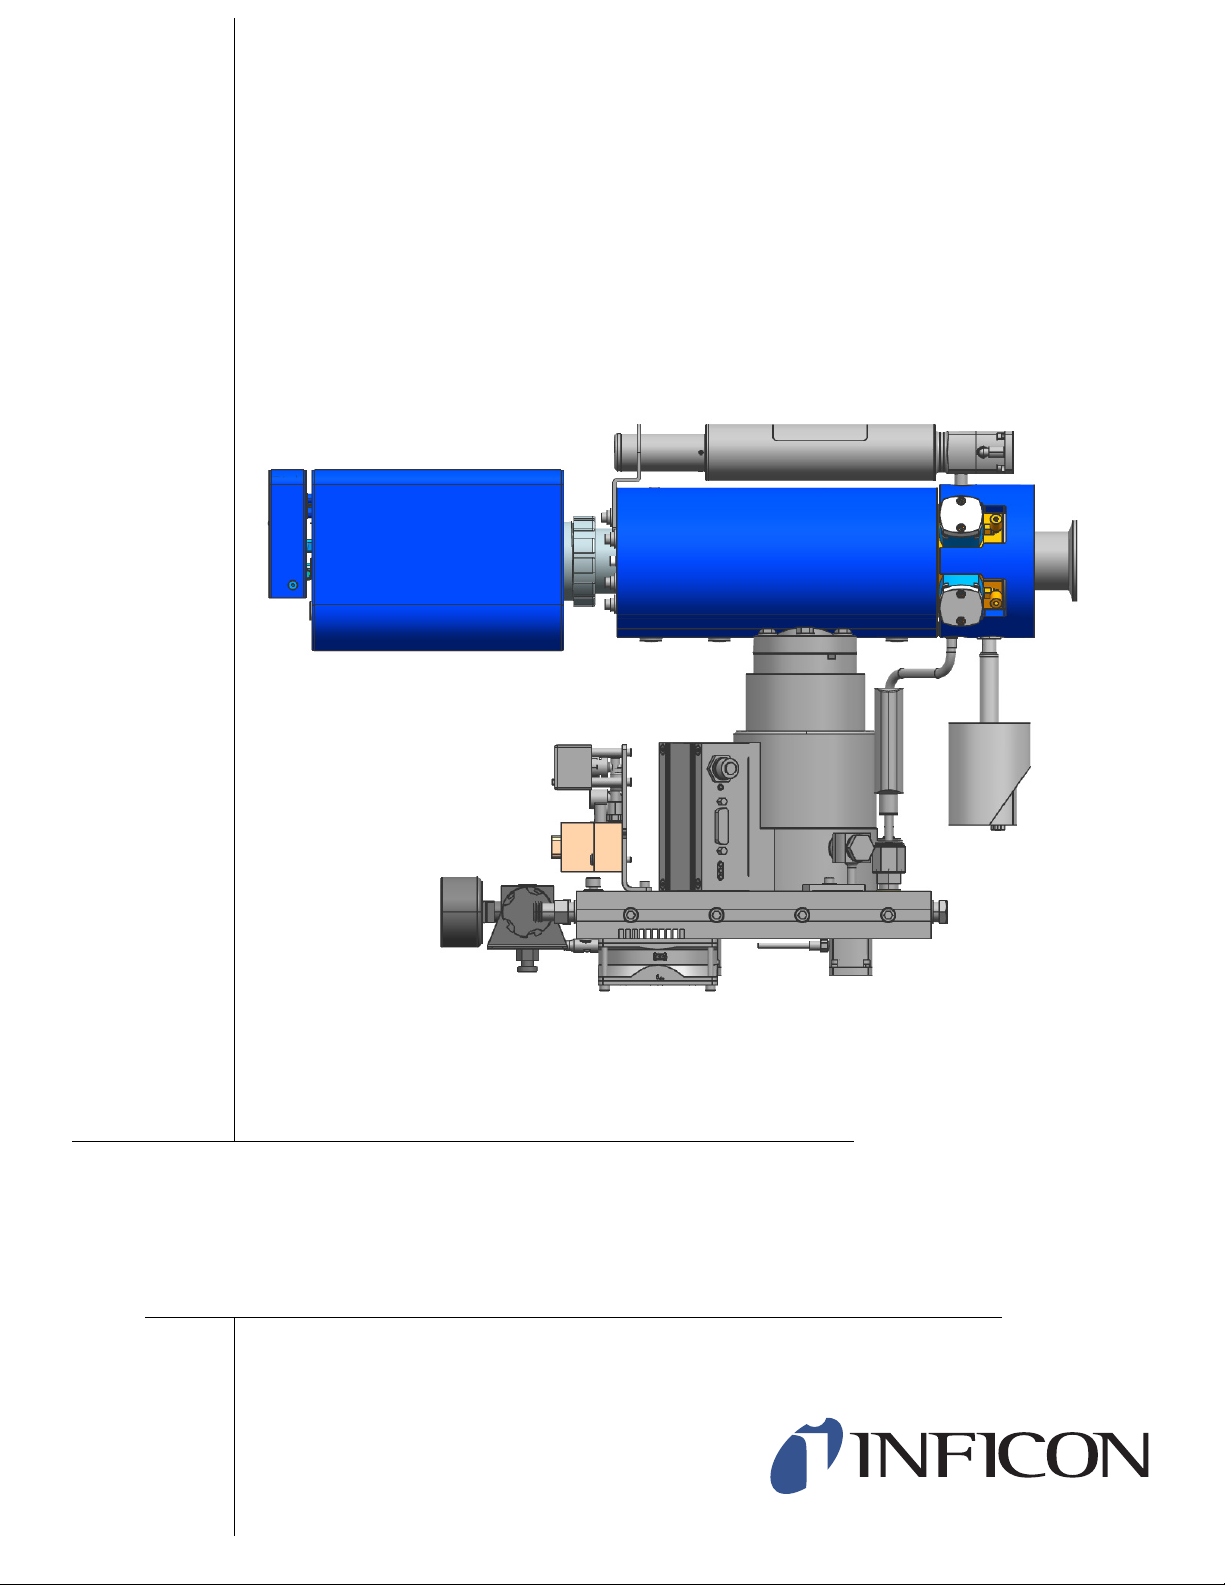
1 . . . . . .Process Pressure Gauge
2 . . . . . .Process Connection (CF40, KF40 or KF25)
3 . . . . . .HexBlock™ Inlet
4 . . . . . .Optional Calibration Reference
5 . . . . . .CPM Sensor (inside manifold)
6 . . . . . .Sensor Manifold and Heater
7 . . . . . .CPM Transpector Electronics Module
8 . . . . . .Pressure Switch
9 . . . . . .Valve Solenoids
10 . . . . .Nitrogen Regulator (for nitrogen purge and valve operation)
11 . . . . .Integrated Foreline Block
12 . . . . .UHV Turbo Molecular Pump
13 . . . . .Foreline Pirani Gauge
14 . . . . .Bypass Connection for High Pressure Applications
8
13
How the CPM System Works
4.1 CPM Components
A fully configured CPM corrosive pumping system is illustrated in Figure 4-1. (The
CPM controller and foreline diaphragm pump are not shown.)
Figure 4-1 CPM pumping system components
Transpector CPM Operating Manual
4–1
Page 50

4.2 Theory of Operation
CAUTION
Many gas analysis applications involving pressures too high for direct exposure to
the quadrupole sensor (pressures greater than 1.0E-4 Torr/mbar) require a
pressure converter to reduce the pressure and keep the sensor at high vacuum.
With a pressure converter, a quadrupole sensor may be used for high pressure
applications such as sputtering, Chemical Vapor Deposition (CVD), etch, vacuum
furnace analysis, and laser gas analysis.
Transpector CPM pressure is the pressure inside the closed ion source (CIS). The
nominal operating pressure inside the closed ion source is approximately
2E-4 Torr. Since the conductance between the closed source and the sensor
manifold is 0.7 L/s and given the effective pumping achieved using the turbo
molecular pump attached to this manifold, the pressure in the mass analyzer region
is approximately 23 times lower than in the closed source. Thus, with the source at
~2E-4 Torr, the pressure in the manifold is approximately 1.0E-5 Torr.
Pressure converters use orifices and/or capillaries to reduce the partial pressure of
the gas-mixture, typically by a fixed proportion, with minimum mass discrimination.
An orifice, a small disk with a defined hole, acts as a conductance limitation. When
both the volume and the high vacuum pump speed are constant, the orifice hole
size determines the pressure at the sensor. Orifices are available in various sizes
to cover various pressure ranges.
Transpector CPM Operating Manual
FabGuard Explorer and FabGuard display total pressure
inside the closed ion source.
Optimum performance is obtained when the total
pressure display reads ~2x10
energy mode (40 eV, 200 A).
Operation in high energy mode (70eV, 2000 A) will give
an inaccurate total pressure reading.
4.3 Instrument Overview
4.3.1 Input/Output (Aux I/O)
This section describes the available input and output (I/O) for Transpector CPM.
See Figure 4-2 for a pinout diagram.
Transpector CPM has two digital inputs for manual emission control, one digital
relay output for emission status, and one analog input.
-4
Torr measured in low
4–2
Page 51

4.3.1.1 CPM Aux I/O Connector
CAUTION
User I/O is through a 15 pin DSUB connector on the cable box attached to the back
of the Transpector electronics module. (See Figure 2-8 on page 2-10.)
A mating DB15 Male connector is supplied in the ship kit for connecting to the
Transpector CPM Aux I/O connections.
4.3.1.2 Two Digital Inputs
Logic Inputs 1 and 2 are by default set to remotely control emission status.
(See Table 4-1.)
Connecting Pin 14 (Logic Input 1) to Pin 15 (Ground) will turn on the emission.
Connecting Pin 13 (Logic Input 2) to Pin 15 (Ground) will turn off the emission.
Table 4-1 Digital inputs
Emission ON PIN 14
Emission OFF PIN 13
Ground PIN 15
Transpector CPM Operating Manual
Controlling emission through digital inputs bypasses all
software and hardware interlocks. When using digital
inputs for controlling Transpector CPM emission,
develop an interlock that will not allow the emission to
turn on if the pressure is too high for operation of
Transpector CPM.
4.3.1.3 One Status Relay Output
One status relay output is active (closed) when the emission is on.
See Table 4-2.
Table 4-2 Status relay output
EMISSION ON Relay closed. PIN 2 and PIN 1 connected
EMISSION OFF Relay open
CONTACT RATING 24 V (dc) at 0.5 A
NOTE: The status relay is not available when HPR or calibration reference options
are selected.
4–3
Page 52

4.3.1.4 One Analog Input
One analog input is differential and can handle inputs between 0 to +10 volts and
common mode voltages of 100 volts. See Table 4-3.
Table 4-3 2 analog inputs
ANALOG INPUT 1 (+) PIN 9
ANALOG INPUT 1 (-) PIN 10
NOTE: The analog input is supported through FabGuard software.
Figure 4-2 CPM Aux I/O pinout diagram
Transpector CPM Operating Manual
4.3.2 Ultra-High Vacuum System
The vacuum system provides low pressure to:
establish a sample flow from the process by pressure difference.
provide low pressure for optimum operation of the sensor.
A dry pumping system comprised of a Turbo Molecular Pump and Foreline Pump
is used to minimize hydrocarbons in the residual gas background.
The Turbo Molecular Pump provides a high compression ratio between the high
vacuum side and the Foreline Pump side for all gases, including hydrogen.
Hydrogen is the major residual gas component in ultra-high vacuum. The high
compression ratio for hydrogen is important for producing a low base pressure.
4–4
Page 53

4.3.2.1 Foreline Subsystem
WARNING - High Temperature
The foreline subsystem components include a flexible foreline hose of various
lengths (
The Foreline Pump produces base pressures (no gas flow) of 2 Torr, significantly
less than the 10 Torr needed for the Turbo Molecular Pump operation. The 2 Torr
operating pressure for the foreline is in the viscous gas flow regime such that the
foreline does not require a large diameter. The inside diameter of the foreline is
6 mm (1/4 in.) which produces a 2 Torr pressure drop across a 10 m length of
foreline at 20 sccm of gas flow.
The foreline Pirani gauge can be used to troubleshoot pumping system problems
and to verify that the turbo pump is being backed properly.
10 m), a foreline Pirani gauge, and a diaphragm foreline pump.
4.3.3 Heater(s) Subsystem
The heaters are dual temperature (150°C and 90°C), dual element silicone rubber
pad heaters with silicone rubber foam insulation.
The CPM controller supplies power to the heaters.
Transpector CPM Operating Manual
Heaters are software controlled at low temperature (90°C) or high temperature
(150°C).
During or immediately after bakeout, the heating jacket
and metal surfaces in the vicinity of the heating jacket are
hot. These surfaces exceed 100°C at the maximum
ambient operating temperature (50°C), and will cause
burns if touched.
4.3.4 CPM Controller Subsystem
The CPM controller contains all of the AC components, the AC-DC converter which
supplies the +24 V (dc) for the Transpector, the Foreline Pump, the Turbo
Molecular Pump controller, and valve solenoids.
The AC-DC converter accepts input voltages ranging 90-240V (ac). The output is
24 V (dc) @ 12A. The output is supplied through the CPM controller interface cable
to the Transpector electronics.
The heater drive circuit controls the AC voltage to the heaters. The heaters are
interlocked and will not turn on if the pump is not up to speed or if there are any
faults.
4–5
Page 54

4.3.5 Solenoid Valves
Exhaust Muffler
Air Supply
Line Connection
9-Pin D Connector
Air
Lines
To
Val ves
V3
V1
V0
V2
V5
V4
The solenoid-controlled valves are a group of valves joined together as one
manifold assembly which is mounted to a bracket on the Turbo Molecular Pump
foreline block. The valves are controlled either by the CPM controller rocker
switches or the Valves Aux I/O connector.
When solenoid valves are activated, compressed air from the input air supply
(ranging 58–100 psi (gauge) (4–6.9 bar) [400–690 kPa]) will open the appropriate
valve. The recommended setting is 75-80 psi (gauge) (5.17 to 5.52 bar) [517 kPa
to 552 kPa]. All valves are electropneumatically operated. There are six solenoid
valves: (See Figure 4-3.)
V0—Foreline isolation valve and nitrogen purge valve on corrosive systems.
Automatically opened and closed by the start/stop of the pumping system.
V1—Low pressure orifice valve for the HexBlock or the capillary sampling option.
Configured depending on the application. Typically used for background
monitoring.
V2—High pressure orifice valve for the HexBlock or the capillary sampling option.
Typically used for process pressure sampling. User configured depending on the
application.
Transpector CPM Operating Manual
V3—High conductance valve (1 mT maximum nominal pressure)
V4—Bypass valve used in conjunction with the high pressure bypass option or the
capillary sampling option
V5—Calibration reference
For more details about the function of each valve, see section 6.1.1 on page 6-2.
NOTE: Each solenoid has a red indicator that illuminates when the solenoid is
activated.
Figure 4-3 Solenoid valve block
4–6
Page 55

Transpector CPM Operating Manual
4.3.6 Sensor and Transpector Electronics Module Subsystem
The sensor is a quadrupole partial pressure analyzer that analyzes gases by:
1 Ionizing some of the gas molecules.
2 Separating the ions by mass.
3 Measuring the quantity of ions at each mass.
The masses, unique for each substance, allow the identification of the gas
molecules from which the ions were created. The magnitudes of these signals are
used to determine the partial pressures (i.e., amounts) of the respective gases.
The Transpector electronics module mounts to the sensor and provides all of the
requirements for operating the sensor, making the appropriate ion current
measurements, communicating to a computer, and sending the resulting output to
the computer.
The Transpector electronics module cable box contains all the cable connections
to the various components of the CPM pumping system, including turbo pump,
gauges and solenoid valves. See Figure 2-8 on page 2-10 for a schematic of cable
connections.
4–7
Page 56

4.4 Application
The pumping system reduces the pressure of process gas to a pressure at the ion
source which optimizes partial pressure measurements. The pressure reduction
orifices produce 2x10
of gas that produces this pressure is:
Transpector CPM Operating Manual
-4
Torr pressure in the closed ion source (CIS). The flow rate
Q(T-L/s)= P
= 2x10
= 1.4x10
P
= the pressure at the CIS ion source within the CPM tee region
CIS
S
= the pumping speed of the closed ion source
CIS
Q = throughput of the CIS ion source
CIS SCIS
-4
(Torr) x 0.7 (L/s)
-4
(T-L/s)
This flow rate produced by process gas flowing through the process gas orifice is:
Q(T-L/s) = (P
Process - PCIS
where the conductance C
) * C
Process Orifice
Process Orifice
~1.4x10⁻⁴ (T-L/s)
determines the orifice diameters needed to
produce this flow for each process pressure.
A selection of orifice diameters are available for reducing pressure for a
multi-decade range of (maximum) process pressures ranging 0.001–100 Torr.
For example, a 10 Torr orifice has a 20 micron diameter hole to produce
approximately 2x10
-4
Torr at the CIS when the process has 10 Torr of nitrogen.
Since process pressures can vary within the operating range of the process,
different pressure reductions may be needed. The CPM system has a variety of
inlet orifices that allow pressure range sampling which typically covers
measurement of the base pressure of the process chamber (for leak detection and
base vacuum analysis) with a high conductance port and two orifices for process
pressures. Various inlet systems are described with their typical use in section 4.5.
4–8
Page 57

Transpector CPM Operating Manual
4.5 Sample Inlet Systems and Examples of Use
4.5.1 Inlet System
Figure 4-4 shows the HexBlock inlet.
Figure 4-4 HexBlock inlet
Table 4-4 Inlet system
Hex Block Inlets Part Number
Hex Block Inlet with one orifice (V1) and high vacuum (V3) 923-604-G11
Hex Block Inlet with one orifice (V2) with
high pressure by-pass (V4) and high vacuum (V3)
Hex Block Inlet with two orifices (V1) and (V2) 923-604-G13
Hex Block Inlet with two orifices (V1) and (V2) with
high pressure by-pass (V4)
Hex Block Inlet with two orifices (V1), (V2),
and high vacuum (V3)
Hex Block Inlet with two orifices (V1), (V2) with
high pressure by-pass (V4), and high vacuum (V3)
923-604-G12
923-604-G14
923-604-G15
923-604-G16
4–9
Page 58

Transpector CPM Operating Manual
When both volume and high vacuum pump speed are constant, the orifice hole size
determines the pressure at the sensor. Orifices are available in various sizes to
cover several pressure ranges. Table 4-5 and Table 4-6 show different orifices for
low and high pressure range application. Figure 4-5 shows pressure ranges for
sampling which will assist in choosing the proper orifice for the application.
Table 4-5 Hex block orifices (V1 for low pressure, typically background)
HexBlock Orifices Part Number
10 mTorr orifice 923-706-G6
15 mTorr orifice 923-706-G8
100 mTorr orifice 923-706-G5
360 mTorr orifice 923-706-G7
1 Torr orifice 923-706-G4
3 Torr orifice 923-706-G9
10 Torr orifice 923-706-G3
Table 4-6 Hex Block orifices, sniffers and capillaries
(V2 for high pressure, typically process pressure)
Size of Orifices, Sniffers and Capillaries Part Number
10 mTorr orifice 923-706-G6
15 mTorr orifice 923-706-G8
100 mTorr orifice 923-706-G5
360 mTorr orifice 923-706-G7
1 Torr orifice 923-706-G4
3 Torr orifice 923-706-G9
10 Torr orifice 923-706-G3
30 Torr orifice
(requires high pressure by-pass)
7 Torr sniffer
(requires high pressure by-pass, 30.5 cm length)
10 Torr sniffer
(requires high pressure by-pass, 5 cm length)
923-706-G10
923-707-G3
923-707-G1
4–10
100 Torr sniffer
(requires high pressure by-pass, 5 cm length)
923-707-G2
Page 59

Table 4-6 Hex Block orifices, sniffers and capillaries
(V2 for high pressure, typically process pressure)
Size of Orifices, Sniffers and Capillaries Part Number
Transpector CPM Operating Manual
30 Torr sniffer
(requires high pressure by-pass, 10 cm length)
300 Torr sniffer
(requires high pressure by-pass, 5 cm length)
30 Torr sniffer
(requires high pressure by-pass, 30.5 cm length)
10 Torr sniffer
(requires high pressure by-pass, 30.5 cm length)
Figure 4-5 Pressure Ranges for Sampling for CPM Inlet Orifices and Sniffers
923-707-G4
923-707-G5
923-707-G6
923-707-G7
4–11
Page 60

4.5.2 High Pressure Sampling: Orifice Bypass (V4)
When process pressures exceed 10 Torr, the process gas is dense enough that the
gas molecules collide with each other more often than with the walls of the
sampling system. In this transition or viscous flow regime, the time constant for
detecting changes in process gas composition becomes dominated by the time it
takes for the gas species that changes in the process to diffuse through the gas
matrix and arrive at the sampling orifice. This diffusion time is proportional to the
process pressure and the square of the distance from the process to orifice. This
sampling method effectively shortens the diffusion distance from process change
to the sampling orifice by drawing a small quantity (10 sccm) of the process gas
through the sampling valve and bypass valve to the interstage port of the Turbo
Molecular Pump. When the process gas flows in this manner, the diffusion distance
of the gas is reduced to about 2 cm and the response time for changes in the
process gas is significantly reduced.
Transpector CPM Operating Manual
4–12
Page 61

4.5.3 Dual-Capillary Sampling Option
The Dual-Capillary Sampling option reduces the pressure of a process atmosphere
ranging 300–1400 Torr to an intermediate pressure that is <10 Torr at the closed
ion source. (See Figure 4-6.) The exit orifice to the pumping line limits the flow to
the Turbo Molecular Pump and establishes the interstage pressure. The capillary
is inserted through the Swagelok
sealed by tightening the Swagelok nut with a re-usable ferrule.
Figure 4-6 Dual-Capillary sampling option (shown with calibration reference)
Transpector CPM Operating Manual
®
connection fitting. It is locked in place and
4–13
Page 62

Transpector CPM Operating Manual
CAUTION
4.6 Advice and Tips
4.6.1 Achieving Good Base Pressure in the CPM
The CPM vacuum manifold must be baked out after initial installation or whenever
the RGA sensor is exposed to air. After an eight hour bakeout and cool down, the
base pressure must be less than 5E-7 Torr at 40 eV, 200
background mass spectrum to look for the largest peak. If the spectrum is
dominated by mass 18, continued bakeout is required to reduce water vapor.
4.6.2 Avoiding Trapped Gas when Sampling Valves are Closed
When V2 is closed, the sampled process pressure is trapped between V2 and O2.
This gas will pump out in a few minutes. It is best to keep V2 open until the process
pressure is evacuated. Then open V1 to scan the background spectrum of the
process vacuum system.
Close the sampling valves when finished with
measurements to avoid pressure bursts to the RGA if the
process is vented.
A. If not, examine the
NOTE: CPM will turn off emission and the electron multiplier and close all
sampling valves when a pressure burst occurs.
4–14
Page 63

Chapter 5
Ion Source Mass Filter
Detector / Electron Multiplier
Theory and Application Guide
5.1 Theory of Operation
A Closed Ion Source (CIS) analyzer takes a representative process gas sample
and directs it to the ionization region of a Residual Gas Analyzer (RGA). The
sampling and flow of the gas sample is accomplished by successive reduction of
pressure from the process to the Turbo Molecular Pump through fixed geometry
pump-in channels. Transpector CPM detects levels of impurities in process gases
that are significantly lower—at sub-ppm levels for many components—than those
detected by open-ion source RGA analyzers.
5.2 Sensors
The three main components of the Transpector CPM sensor are:
Transpector CPM Operating Manual
ion source (ionizer)
quadrupole mass filter
detector/electron multiplier
These components are mounted on an electrical feedthrough flange bolted to the
vacuum manifold. (See Figure 5-1.)
The sensor works only in a high-vacuum environment because the ions, once
created, must not collide with other gas molecules as they move through the
sensor.
Figure 5-1 CPM sensor
5–1
Page 64

5.2.1 The Ion Source
CAUTION
Sealing Disk
Spring
Anode Cylinder
Filament Block
Shield Washer
Anode Plate
Insulator Rings
Focus Plates
Upper Tube Ring
Filament
(Electron Repeller not shown)
The Transpector CPM sensor closed ion source requires a pressure reducing
orifice because process pressures are typically far greater than the maximum at
which the closed ion source can operate. (See Figure 5-2.)
Figure 5-2 Closed ion source
Transpector CPM Operating Manual
Inside the closed ion source, a heated filament emits electrons which bombard the
incoming gas molecules giving them an electrical charge. While this charge may
be either positive or negative, Transpector CPM detects only positive ions. Once a
molecule is charged (ionized), electric fields can be used to manipulate the
molecule.
The default filament is made of tungsten. Tungsten offers the best resistance to
aggressive gases, particularly those containing fluorine and chlorine. A yttria
coated iridium filament can be used in oxygen or water vapor heavy environments
(that will quickly oxidize the tungsten filament).
Tungsten filaments will be destroyed when operated at
high pressure because they react with oxygen and water
vapor at operating temperature.
5–2
Page 65

Transpector CPM Operating Manual
The term emission current refers to the stream of electrons emitted by the filament.
Emission current is controlled by the temperature of the filament.
The filament is centered over a hole in the anode cylinder. The potential (voltage)
on the anode is positive with respect to the filament. The electron repeller, a flat
plate, is located behind the filament and is electrically connected to the negative
side of the filament. The potential difference between the filament and the anode
determines the kinetic energy (electron energy) of the emitted electrons. The
electron energy determines how gas molecules will ionize when struck by
electrons.
Electron energy can range from 70 eV down to 10 eV. Operation below 70 eV is
restricted to emission currents of no greater than 200 μA. At 70 eV or above, an
emission current of 2 mA will maximize sensitivity for background monitoring and
leak checking.
The ions formed within the anode cylinder are pulled away by the potential on the
focus lens and formed into an ion beam. (The focus lens is also called an extractor,
since it extracts the ions from the region in which they are created.) The focus lens
focuses the ion beam into the hole in the source exit lens. To attract positive ions,
the focus lens is biased negatively with respect to the anode.
The potential on the source exit lens is negative with respect to the anode and the
focus lens. The ion beam passes through the hole in the exit lens and is injected
into the mass filter.
The closed ion source pumping speed is approximately 0.7 L/s. This will create a
pressure differential between the ion source and the quadrupole region. The closed
ion source will operate with a maximum process pressure up to about 2 mTorr
(2.7E-3 mbar). This ion source is used with an orifice to reduce the high pressure
down to approximately 2E-4 Torr (2.7E-4 mbar). The pressure in the closed ion
source will be about 23 times higher than the pressure in the quadrupole (e.g.,
2.3E-4 Torr in the ion source will produce 1E-5 Torr in the quadrupole region).
See section 6.5, Filament Control, on page 6-7 for more ion source information.
5–3
Page 66

5.2.2 The Quadrupole Mass Filter
X
Z
Y
The ions produced in the ion source are injected into the mass filter, which rejects
all ions except those with a specific mass-to-charge ratio. Most ions contain only
one unit of charge. The mass filter is a quadrupole, to which is applied a
combination of RF and DC potentials. The RF frequency and amplitude determine
the mass. The RF/DC ratio determines the filter selectivity. (See Figure 5-3.)
Figure 5-3 The sensor’s quadrupole mass filter
Transpector CPM Operating Manual
The mass filter’s four rods (hence the term quadrupole) are alternately charged to
direct ions of specific masses down through the center, deflecting all larger and
smaller masses (hence the term mass filter).
The mass filter consists of four parallel rods, or poles, in a square array. The rods,
and the insulators in which they are mounted, form an extremely precise
mechanical assembly. The distance between the center of the square array and the
closest rod surface is known as the quadrupole radius, r
. Ideally, the rod should
0
have a hyperbolic shape (towards the center of the assembly) rather than round. If
the ratio of the round rod radius to r
is equal to 1.148, the resulting electric field is
0
a reasonably good approximation of the desired hyperbolic shape.
Opposite rods are electrically connected together. The ions are directed into the
space between the poles in a direction nominally parallel to the length of the rods.
There the ions are separated according to their mass-to-charge ratios by the lateral
forces resulting from the potentials applied to the poles.
The applied potentials consist of an RF component and a DC component. The RF
potential on one set of rods is out of phase by 180° with respect to the RF potential
on the other set of rods, but all are the same amplitude. For one pair of rods, the
“X” pair, the DC potential is positive. For the other, the “Y” pair, the DC potential is
of the same magnitude but negative. The DC and RF potentials are referenced to
a center voltage (pole zero).
5–4
Page 67

Transpector CPM Operating Manual
XV 2ftcos U PZ++=
YV 2ft +cos U–PZ+=
V 14.438M f2r
0
2
=
The following equations summarize the potentials applied to the rods:
[1]
[2]
V = RF amplitude
f = RF frequency
t = time
U = DC potential
PZ = pole zero.
The RF component removes the low-mass ions from the beam. Ions of sufficiently
low mass have their motions remain in phase with the applied RF. These ions will
gain energy from the field and oscillate with increasingly large amplitudes.
Eventually, as they travel along the length of the rods, they will strike one of the
rods and be neutralized. High mass ions are focused by the RF component to an
area close to the quadrupole’s long axis, the Z axis.
The DC component is superimposed on the RF to remove high mass ions from the
beam. The DC field deflects the high mass ions toward the negative poles,
opposing the focusing effects of the RF field. Eventually, these high mass ions
strike the negative rods and are neutralized. By a suitable choice of DC-to-RF ratio,
the mass filter can be made to discriminate against both high and low mass ions.
The ion energy directed along the Z axis of the mass filter is dependent on the
difference between the potential at which the ions were formed (the anode voltage)
and the pole zero. The ion energy is usually only slightly modified by the electric
field (the fringing field) between the source exit aperture and the quadrupole.
Imbalances in the amplitude of the two phases of RF applied to the rod pairs, and
DC voltages are also applied, resulting in a further modification of the ion energy.
The mass of the ions passed by the filter is determined by the RF amplitude, the
RF frequency, and the quadrupole radius. (See equation [6].)
[3]
V = peak-to-peak RF amplitude in Volts
M = mass of the ion in atomic mass units (AMU) per electron charge
f = RF frequency in megahertz
r
= quadrupole radius in centimeters.
0
For example, a 200 AMU singly-charged ion would pass through a quadrupole with
r
nominal 6.35 mm (1/4 in.) diameter rods (an
of 0.277 cm), operating at
0
1.78 MHz, at a peak-to-peak RF amplitude of approximately 700 Volts.
5–5
Page 68

The mass of ions transmitted (M) is directly proportional to the RF amplitude
(provided f is constant). As the RF amplitude is increased, progressively higher
mass ions will be made to oscillate in phase with the RF field and thus gain
sufficient energy to strike the poles. The DC voltage must be increased to maintain
the high mass rejection properties of the filter. A mass spectrum is generated by
sweeping the RF amplitude along with the DC voltage.
The next section (Scanning Characteristics) discusses the variation in the
efficiency of transmission of ions through the filter with mass. Following that,
section 5.2.2.2, The Zero Blast, discusses the behavior of the filter at very low
masses where the applied voltages approach zero.
5.2.2.1 Scanning Characteristics
The quadrupole acts as a mass filter for a mixed beam of ions, rejecting those of
both high and low mass, while passing those of an intermediate mass. The
selectivity of the mass filter is expressed in terms of resolution, R, which is
numerically given by the ratio of the center mass, M, to the width, M (both in
AMU), of the pass band. Since the number of the ions passed by the filter falls off
gradually as the edge of the pass band is approached, the width is defined at the
point where the ion current falls to some specified fraction (usually 1/2 or 1/10) of
the maximum value. The width of the pass band is determined by the DC-to-RF
ratio.
Transpector CPM Operating Manual
The quadrupole can be designed so that R varies in any desired manner with M.
However, keeping M constant ensures adequate separation of masses that are
1 AMU apart. This mode of scanning is called Constant M. As a result, R is
proportional to M, and therefore the efficiency with which ions of mass M are
transmitted through the quadrupole decreases with M. Therefore, the sensitivity of
the sensor decreases as M increases.
5–6
Page 69

5.2.2.2 The Zero Blast
Zero Blast signal contribution
When the RGA scans over the very low end of the mass spectrum, the RF and DC
voltages applied to the rods approach zero. The quadrupole then ceases to act as
a filter and a large current of unseparated ions is detected, called the zero blast.
(See Figure 5-4.)
Zero blast will interfere with the observation of masses 1 and 2 in the higher
pressure range of the RGA (i.e., 1E-6 Torr to 5E-4 Torr) when significant quantities
of higher-mass ions are present. The zero blast contribution to the mass 2 signal
intensity can be between 5 ppm and 100 ppm depending on the mass range of the
RGA.
Figure 5-4 The zero blast
Transpector CPM Operating Manual
5–7
Page 70

5.2.3 The Ion Detector
The ion detector region of the sensor consists of the quadrupole exit lens, the
electron multiplier and the detector itself. The quadrupole exit aperture is biased
negatively with respect to the anode, focusing ions that have been transmitted
through the quadrupole into the electron multiplier and detector.
5.2.3.1 The Electron Multiplier (EM) Detector
The Electron Multiplier (EM) acts as an in situ preamplifier for improved sensitivity.
Incoming ions are accelerated into the EM by a high negative voltage (usually
-1.0 kV or more). When an ion strikes the surface of the EM, one or more
secondary electrons are emitted. These electrons are accelerated to a second
surface which is at a more positive potential, where additional electrons are
generated.
This process repeats itself until a pulse of electrons emerges from the output of the
EM and is collected on a Faraday Cup. The result is that as many as a million
electrons or more can be produced by each incident ion. The current output from
an EM detector is negative due to this pulse of electrons.
Transpector CPM Operating Manual
The ratio of the electron output current to the incident ion current is the EM gain.
The gain primarily depends on the EM type, the voltage applied to the EM input,
the voltage applied across the EM, the condition of the EM, and to a lesser extent
the mass and chemical nature of the incident ion. In general, EM gain decreases
as the ion mass increases.
The advantage of the EM detector sensor is it’s high sensitivity (as much as
500 A/Torr), making it possible to measure partial pressures as low as 1x10
-15
Torr
for a 100 AMU sensor.
5–8
Page 71

Transpector CPM Operating Manual
CDEM Cone
Electron Collector
Signal Output
Deflector Shield
5.2.3.2 The Continuous Dynode Electron Multiplier/Faraday Cup Detector
The Continuous Dynode Electron Multiplier/Faraday Cup (CDEM/FC) detector
amplifies the electron pulse, significantly increasing the analyzer’s sensitivity.
Figure 5-5 CDEM/FC detector
The CDEM/FC detector continuous dynode element is a special type of glass,
rather than a discrete dynode EM which is a copper-beryllium alloy. The advantage
of the CDEM/FC detector over a discrete dynode EM detector is that CDEM/FC
performance does not degrade when exposed to air and does not need to be
stored under vacuum.
The maximum operating temperature for the CDEM/FC detector is 150°C. It can
be baked out at 300°C with the high voltage off.
The CDEM/FC detector is slightly slower to recover after exposure to excessive
input or output currents. It may take a bit longer to stabilize its gain after the high
voltage is changed.
The CDEM/FC detector is operated at high voltages between -0.6 and -2.0 kV.
A new CDEM/FC detector will typically have a gain between 10 and 1,000 at
-0.8 kV. The gain at -3.0 kV typically exceeds 1 x 10
6
. The Transpector CPM
default EM voltage is -0.8 kV.
5–9
Page 72

Transpector CPM Operating Manual
CAUTION
CAUTION
CAUTION
Do not operate the CDEM/FC detector at temperatures
above 150°C. Permanent damage may result.
Avoid output currents in excess of 1 x 10⁻⁶ amps.
Either decrease the high voltage or decrease the
pressure.
Use the minimum CDEM/FC detector voltage required to obtain the necessary
peak amplitudes and/or signal-to-noise ratio. Operating at higher voltages than
necessary will result in premature aging of the EM. As the CDEM/FC detector
ages, the voltage needed to obtain a specific EM gain will increase.
Since EM performance depends on the condition of its interior surfaces, prevent
hydrocarbon or other contamination:
Make sure diffusion-pumped vacuum systems are properly trapped to reduce
oil back-streaming.
Make sure turbomolecular pumped systems are interlocked to eliminate
mechanical pump oil back-streaming through a nonspinning turbo pump.
EM gain reduction from these kinds of problems can range from 50% to more than
90%. The initial gain of the EM is generally high enough to accommodate some
degradation and yet still be usable. With repeated instances of contamination, the
EM will eventually require replacement.
In addition to hydrocarbon contamination, an EM can be
adversely affected by exposure to highly reactive
chemicals. Avoid any substance that will either cause the
deposition of a surface film on the EM or etch its surface.
Avoid high levels of reactive fluorides, such as tungsten
hexafluoride, hydrogen fluoride, and nitrogen trifluoride.
5–10
Page 73

5.3 How to Interpret The Result
Qualitative Interpretation Of Mass Spectra explains how to determine which
substances are present in the gas sample being analyzed. (See section 5.3.1.)
Quantitative Interpretation of Mass Spectra (Calculating Partial Pressures)
explains how to estimate how much of each substance is present. (See section
5.3.2 on page 5-26.)
Additional Information For Interpreting Mass Spectra provides additional
information regarding interpreting mass spectra. (See section 5.3.3 on page
5-32.)
Software packages for Transpector instruments include routines which serve as
aids in the interpretation of spectra and the calculation of partial pressures and
relative concentrations.
For a discussion of how the Transpector produces its measurements, see Chapter
4, How the CPM System Works.
5.3.1 Qualitative Interpretation Of Mass Spectra
Transpector CPM Operating Manual
The graphical output of a partial pressure analyzer is a mass spectrum. A mass
spectrum is a pattern of peaks on a plot of ion intensity as a function of ion
mass-to-charge ratio. Each chemical substance has a characteristic mass
spectrum. Different instruments will give slightly different spectra for the same
substance. The particular characteristics of the ionizer, mass filter, detector, and
the manner in which the sample is introduced into the mass spectrometer all
influence the spectrum that is produced.
Rarely will a mass spectrum be obtained for a pure substance. Most of the time
(especially for residual gas analyzers), the spectrum obtained will be a composite
of the individual substances which together comprise the actual sample present.
Figure 5-6 shows the mass spectrum of air. The top graph shows the mass
spectrum of a single scan during the data run with the raw signal data on the y-axis
and the mass data on the x-axis. The prominent peaks for air are mass 28 (N
mass 32 (O
masses 14 and 16 respectively. These are created when N
), mass 40 (Ar) and mass 18 (H20). Also notice the N and O peaks at
2
and O2 are broken
2
),
2
apart in the ion source. The bottom graph is a trend analysis showing a few
selected mass signals versus time.
5–11
Page 74

Figure 5-6 Air mass spectrum
N
N
2
O
2
Ar
O
H
2
O
Transpector CPM Operating Manual
5–12
Page 75

5.3.1.1 Ionization Process
When a sufficiently energetic electron strikes a gas molecule, there are many
processes that can occur, some of which are summarized in Table 5-1.
Table 5-1 Electron Impact Ionization Processes
XYZ + e-
+
XYZ
+ 2e
2+
XYZ
XY + Z
+
XY
+ Z + 2e
+
X
+ YZ + 2e
X + YZ
XZ + Y
+
XZ
+ Y + 2e
+ 3e
+
+ 2e
+
+ 2e
+
+ 2e
Transpector CPM Operating Manual
-
-
-
-
-
-
-
-
(1)
(2)
(3)
(4)
(5)
(6)
(7)
(8)
-
In all cases, the reactants are a high energy electron (e
) and a gas molecule
(XYZ). The products of the first reaction are the molecule with a single electron
removed (the parent ion) and two low energy electrons. In the second reaction, two
electrons are removed from the gas molecule, resulting a doubly charged ion.
Triply (or even more highly) charged ions are possible, provided the incident
electron has enough energy.
Reactions 3 through 8 are examples where the original molecule is broken into
fragments, at least one of which is positively charged (negative ions can also be
produced in this manner). Only the positive ion fragments are observed; the neutral
(uncharged) fragments are not detected. The mass spectrum obtained when the
parent molecule breaks apart under electron impact is commonly referred to as the
fragmentation pattern (or cracking pattern). The fragmentation pattern for nitrogen
at an electron energy of 70 eV is displayed in Figure 5-7.
5–13
Page 76

Figure 5-7 A nitrogen fragmentation pattern
14N+
14
N
2
+
14
N15N
+
Transpector CPM Operating Manual
This nitrogen fragmentation pattern shows 14N+ (14 AMU), 14N
14N15N+
(29 AMU).
+
(28 AMU), and
2
In general, peaks from multiple charged species will be less intense than those for
the corresponding singly charged ion. For example, the doubly charged peak for
argon is typically less than one fifth as intense as the singly charged peak (this
intensity ratio is sensitive to the incident electron energy).
There are some situations when it is difficult to determine whether the ion is singly
or multiply charged. When a molecule is comprised of two atoms of the same
element, the typical partial pressure analyzer cannot distinguish between the singly
charged one-atom fragment ion and the doubly charged two-atom molecular ion,
which will both have the same mass-to-charge ratio. Refer to Figure 5-7. The peak
+
at 28 AMU is the parent ion, N
at 14 AMU is from N
+
or N
. It is not discernible from this spectrum if the peak
2
2+
. The 14 AMU peak in the nitrogen spectrum is from
2
the singly charged fragment ion.
Most ions (with the important exception of complex hydrocarbons) have masses
very close to integer values. When the mass of an ion is not evenly divisible by the
number of charges on it, the mass-to-charge ratio will not be an integer. Thus, Ar
will appear at 13.33 AMU, while F
2+
will appear at 9.5 AMU.
3+
5–14
Page 77

5.3.1.2 Isotope Ratios
An additional cause of multiple peaks in the mass spectrum of a pure substance is
that most elements are comprised of more than one isotope. For example, 99.63%
of all nitrogen atoms in nature have a mass of 14 AMU; only 0.37% have a mass
of 15 AMU. Examine the nitrogen spectrum in Figure 5-7. The largest peak at
28 AMU is the parent ion, N
and is 0.74% (two times 0.37%) as high as the parent peak since there are two
nitrogen atoms in the ion, each one of which has a 0.37% chance of being 15 AMU.
Some elements have many intense isotopes. For example, xenon is
0.096% mass 124, 0.090% mass 126, 1.92% mass 128, 26.44% mass 129,
4.08% mass 130, 21.18% mass 131, 26.89% mass 132, 10.44% mass 134,
and 8.87% mass 136.
Isotope ratios, like fragmentation patterns, aid in recognizing specific materials.
Under normal partial pressure analyzer ionization conditions, the peak height ratios
for the various isotopes of an element will be the same as the ratios of their natural
abundance’s. For example, the probability of ionizing the mass 35 isotope of
chlorine (
Thus, the peak height ratio of mass 35 to 37 from HCl will be 3.07 to 1
(75.4% / 24.6%).
Transpector CPM Operating Manual
+
. The peak at 29 AMU is the isotope peak, 14N15N+,
2
35
Cl) is the same as the probability of ionizing the mass 37 isotope (37Cl).
Table 5-2 lists the isotopic ratios for lighter elements. For a complete listing of the
natural abundances for the isotopes of all the elements, see the Handbook of
Chemistry and Physics from CRC Press.
Table 5-2 Isotope ratios
Isotope Ratios
Element Mass No. Relative
Abundance
H 1 99.985
20.015
He 3 0.00013
4 ~100.0
B 10 19.78
11 80.22
C 12 98.892
13 1.108
N 14 99.63
15 0.37
5–15
Page 78

Table 5-2 Isotope ratios (continued)
Isotope Ratios
Element Mass No. Relative
Abundance
O 16 99.759
17 0.0374
18 0.2039
F 19 100.0
Ne 20 90.92
21 0.257
22 8.82
Na 23 100.0
Al 27 100.0
Si 28 92.27
Transpector CPM Operating Manual
29 4.68
30 3.05
P 31 100.0
S 32 95.06
33 0.74
34 4.18
36 0.016
Cl 35 75.4
37 24.6
Ar 36 0.337
38 0.063
40 99.600
5–16
Page 79

5.3.1.3 Electron Energy Effects
10
8
6
4
2
0
100
200
300
400
500
Electron Energy (eV)
Ar
+
Ar3+x10
Ar
4+
x100
Ar
2+
The exact fragmentation pattern will depend on the energy of the bombarding
electrons. Figure 5-8 graphs the number of argon ions (of different charge states)
produced per incident electron per Torr of gas pressure as a function of electron
energy.
Figure 5-8 Electron energy effects
12
N
Transpector CPM Operating Manual
From a paper by W. Bleakney, Physical Review, 36, p. 1303, published in 1930.
This graph shows the number or argon ions, N, formed per electron per Torr at
0°C versus electron energy.
The appearance potential—the minimum electron energy required to produce a
specific ion — for Ar
+
is 15.7 eV. The number of argon ions produced rises steeply
with energy until a maximum is reached at about 55 eV. As the electron energy
rises above this level, the rate of Ar
+
production slowly decreases.
Typically in mass spectrometry, electron impact ionization is carried out at an
electron energy of 70 eV for two reasons:
70 eV is above the minimum energy required to produce at least some positive
ions from any sufficiently volatile chemical species.
70 eV is near the energy at which the rate of ion production is at its maximum
for most of the common gases.
Operating at 70 eV provides a universal detector with good sensitivity for gases
typically encountered.
5–17
Page 80

Transpector CPM Operating Manual
Sometimes there is a problem with mass spectral overlap— ions with differing
chemical composition form chemically distinct source molecules, but with the same
mass. For example, there is a problem with detecting small amounts of water vapor
in argon, as is often desired when monitoring a PVD process. Normally, water
vapor is monitored at 18 AMU (H
O+). Overlap from the doubly charged argon36
2
isotope also shows up at mass-to-charge ratio 18 (most mass filters, including
quadrupoles, are really mass-to-charge ratio filters and not true mass filters).
Approximately 3,400 parts per million of all argon atoms are the mass 36 isotope.
Also, at 70 eV, the doubly-charged argon ion, Ar
of the singly charged Ar
(3,400 ppm times 15%) of
+
ion. Therefore, there will be approximately 510 ppm
36Ar2+
at 18 AMU, making it impossible to detect several
ppm of water vapor at the same mass. Another ion from water vapor, the OH
17 AMU, could be used instead. Unfortunately, OH
has an intensity of only 25% of that of the parent ion H
2+
, has about 15% of the intensity
+
at 17 AMU from water vapor
O+. To detect several ppm
2
+
at
of water vapor would require the detection of less than one ppm of current at
17 AMU. This is difficult because there will be some tailing of the 510 ppm
36Ar2+
peak at 18 AMU onto 17 AMU.
The best solution to this argon/water vapor problem is to make use of a property of
ions known as appearance potential. The appearance potential for an ion from a
given substance is the minimum electron energy required to produce that particular
type of ion from the specified substance. Table 5-3 lists appearance potentials for
various ions from common gases.
Table 5-3 Appearance potentials for various ions from common gases
Ion Gas Mass-to-Charge Appearance Potential (eV)
+
Ar
Ar
Ar
N
N
O
O
CO
CO
O
C
CO
O
C
2+
3+
+
2
+
+
2
+
+
2
+
+
+
+
+
+
argon 40 15.7
argon 20 43.5
argon 13.3 >70
nitrogen 28 15.6
nitrogen 14 24.3
oxygen 32 12
oxygen 16 14.01
carbon dioxide 44 13.8
carbon dioxide 28 19.4
carbon dioxide 16 19.4
carbon dioxide 12 22.7
carbon monoxide 28 14.1
carbon monoxide 16 20.9
carbon monoxide 12 20.9
5–18
Page 81

Transpector CPM Operating Manual
CAUTION
Table 5-3 Appearance potentials for various ions from common gases
Ion Gas Mass-to-Charge Appearance Potential (eV)
+
H2O
OH
H
HF
+
+
2
+
water vapor 18 12.6
water vapor 17 13.5
hydrogen 2 15.5
hydrogen fluoride 20 16.1
Table 5-3 shows that the appearance potential for Ar2+ is 43.5 eV, while that for
H
O+ is 13.5 eV. Therefore, by choosing an electron energy below 43.5 but above
2
13.5 eV, it is possible to produce the water vapor ion without producing doubly
charged argon ions, permitting the detection of water vapor at 18 AMU.
The Transpector CPM sensor and electronics can operate at electron energies
below 70 eV, with reduced electron emission (200 μA, max.). When monitoring
PVD processes, the CPM should be operated at 40 eV with an electron emission
current of 200 μA to reduce power to the filament. The software has the capability
to switch the CPM between 70 eV, 2.0 mA (CIS high) for background monitoring
and 40 eV, 200 μA (CIS low) for process monitoring.
With FabGuard Explorer, electron energy can be changed to a voltage ranging 10–
100 eV.
Below 70 eV it is necessary to limit the electron emission
current to no more than 200 μA, in order to not overpower
the filament. Overpowering the filament will result in
shortened filament life.
5.3.1.4 A Qualitative Interpretation Guide
A partial pressure analyzer identifies unknown substances by interpreting three
characteristics: fragmentation patterns, multiply charged ions, and isotope ratios.
Simple spectra are easy to interpret. The analysis of complicated mixtures is more
difficult.
Table 5-4 is a spectrum interpretation guide for examining an unknown spectrum.
It lists the masses of peaks, possible ion identities for each of these masses, and
common sources for each of these ions. This guide is by no means all-inclusive,
and only goes up to 50 AMU. Processes such as CVD and Etch often involve fairly
complex chemicals which provide very complicated spectra that extends to masses
well beyond 50 AMU.
5–19
Page 82

.
Table 5-4 Spectrum interpretation guide
AMU # Chemical Symbol Sources
1 H water F or hydrogen F
Transpector CPM Operating Manual
2 H
3 HD,
, D hydrogen, deuterium (2H)
2
3
H hydrogen-deuterium, tritium (3H)
4 He helium
5 No known elements
12
6 C Doubly Ionized
7 NDI
8 ODI
14
N (Rare)
16
O (Rare)
C (Rare)
9 No known elements
10
10 Ne,
BDI
11 Ne, 11BDI
20
Ne (Rare), BF3, BCl
22
Ne (Rare), 11BF3, BCl
3
12 C carbon, carbon monoxide F,
carbon dioxide F
13 CH,
14 N, CH
15 CH
13
C methane F, carbon isotope
2
3
nitrogen, methane F or Note 1
methane F or Note 1
3
16 O, CH
17 OH, NH
18 H
, NH
4
2
3
O water
2
oxygen or carbon monoxide F, ammonia
water F, ammonia F
19 F fluorine or freon F
20 Ar
2+
, Ne, HF argon Dl, neon, hydrofluoric acid
21
22
22
Ne, CO
2
neon, DI CO
2
23
24 C
25 C
26 C
27 C
28 N
2
H See Note 1
2
CN See Note 1, hydrogen cyanide F
2H2
, Al, HCN See Note 1, aluminum, hydrogen cyanide
2H3
, CO, C2H4, Si nitrogen, carbon monoxide, ethylene P,
2
See Note 1
silicon
5–20
Page 83

Table 5-4 Spectrum interpretation guide (continued)
AMU # Chemical Symbol Sources
Transpector CPM Operating Manual
29 CH3CH
30 C
, NO ethane P, nitric oxide
2H6
31 P, C H
32 O
, S oxygen, sulfur, methanol P
2
2
OH, phosphorus, methanol F,
2
ethane F or ethanol F or isopropyl alcohol
33 HS hydrogen sulfide F
34 H
S, 34S, O
2
2
hydrogen sulfide P, sulfur isotope,
oxygen isotope
35
35
36 HCl,
Cl chlorine isotope, See Note 2
36
Ar, C
3
hydrochloric acid, argon isotope,
hydrocarbons
37
37
38
Cl, C3H chlorine isotope, See Note 2, hydrocarbons
37
HCl, C3H
2
hydrochloric acid or see Note 2,
hydrocarbons
39 C
3H3
40 Ar, C
41 C
3H5
3H4
See Note 3, hydrocarbons
argon, See Note 1, hydrocarbons
See Note 1, hydrocarbons
42 C
43 C
44 CO
45 CH
46 CH
47 C
48 HC
49 C
50 C
3H6
, CH3CO Note 1, acetone F or methyl ethyl ketone F
3H7
, C3H
2
8
O ethanol F or isopropyl alcohol F
3CH2
OH ethanol P
3CH2
35
Cl See Note 2
35
Cl, SO See Note 2, sulfur dioxide F
37
Cl See Note 2
37
Cl, CF2, C4H
See Note 1, hydrocarbons
Carbon dioxide, See Note 3
See Note 2, freon F, Note 3
2
NOTE: (1) Fragments of several hydrocarbons, such as mechanical pump
oil, diffusion pump oil, vacuum grease, cutting oil, and organic
solvents.
(2) Fragments of several chlorinated hydrocarbons, such as carbon
tetrachloride, tichloroethylene, and many freons.
(3) Fragments from both straight chain hydrocarbons and benzene
ring hydrocarbons.
(4) F = Fragment ion; P = Parent ion; DI = Doubly ionized
5–21
Page 84

5.3.1.5 Dry Etching Chemistries
Table 5-5 lists materials to be etched, the typical chemistries used, the chemical
species that are important, and a list of masses used to monitor each specie.
Many different chemistries exist for etching any given film. Only a few of the more
common etch processes are listed in Table 5-5. The important species listed for
each process were picked for the list on the basis of their either being reagent
gases for the listed process, known reaction product gases, potentially
troublesome impurities (e.g., H
Table 5-5 is not an all-inclusive list. There may be other important species, such as
highly reactive intermediates, which are not included. The list of monitored masses
for each process is a general guide.
Transpector CPM Operating Manual
O), or probable by-product gases.
2
Significant spectral overlap exists (for example, COF
N
), which must be considered when interpreting the data. Furthermore, many
2
cracking patterns for the important species are very complicated because of the
molecule’s complexity and because of multiple isotope peaks. Only a few of the
more intense or unique masses are listed.
Table 5-5 Dry etching chemistries
Etched
Material
Al (and alloys) BCl
Typical
Reagents
3
Important
Species
/Cl2 (+N2)BCl
Cl
N
O
AlCl
Al2Cl
HCl
H
2
3
2
2
2
3
6
O
and SiF4 or CO, CO2 and
2
Monitored
Masses
81, 83, 116, 118, 46, 48
70, 72, 74
28, 14
32, 16
134, 97, 62, 27
266, 231, 196, 161, 134, 97, 62
36, 38
18, 17
5–22
Page 85

Table 5-5 Dry etching chemistries (continued)
Transpector CPM Operating Manual
Etched
Material
W (and alloys)
(TiN liner)
W (and alloys)
(TiN liner)
Typical
Reagents
SF
6
NF
3
Important
Species
SF
6
WF
6
F
2
HF
H
O
2
O
2
N
2
WOF
4
TiF
4
NF
3
WF
6
F
2
HF
H
O
2
N
2
O
2
WOF
4
TiF
4
Monitored
Masses
127, 89, 108
279, 281
38
20
18, 17
32, 16
28, 14
257, 259
86, 67, 105, 48
52, 33, 71
279, 281
38
20
18, 17
28, 14
32, 16
257, 259
86, 67, 105, 48
SiO2
(and
boro-phospho-s
ilicate glass)
CHF
CHF
/CF4,
3
3/O2
CHF
CF
O
SiF
CO
HF
H
2
COF
C2F
3
4
2
4
2
51, 69
69, 50
32, 16
85, 66, 47
44, 28, 16, 12
20
O
2
6
18, 17
47, 66
119
5–23
Page 86

Table 5-5 Dry etching chemistries (continued)
Transpector CPM Operating Manual
Etched
Material
Typical
Reagents
Si3N4 CF4/O
Poly-Si BCl
HBr/Cl2/O
Important
Species
2
CF
O
SiF
NF
CO
4
2
4
3
2
HF
H
O
2
COF
2
N
2
CO
/Cl
3
2
BCl
Cl
SiCl
3
2
4
HCl
H
O
2
2
HBr
Cl
O
SiCl
SiBr
SiBrXCl
2
2
4
4
(1-X)
H2O
HCl
Monitored
Masses
69, 50, 31
32, 16
85, 66, 47
52, 33, 71
44
20
18, 17
47, 66
28, 14
28, 12
81, 83, 116, 118, 46, 48
70, 72, 74
133, 135, 170
36, 38
18, 17
80, 82
70, 72, 74
32, 16
170, 133, 135
348, 267, 269
many peaks
18, 17
36, 38
5.3.1.6 Tungsten CVD
Table 5-6 lists some of the materials of interest and the masses at which to monitor
them for blanket tungsten or tungsten silicide deposition. Oxygen and water vapor
are unwanted contaminants during tungsten deposition because they react with the
tungsten hexafluoride to produce tungsten oxyfluorides and oxides, which, except
for WOF
5–24
, are nonvolatile and can result in particle generation. The presence of
4
Page 87

Transpector CPM Operating Manual
WOF4 may be the only indication that water vapor or oxygen are also present, but
not detected by the mass spectrometer because of rapid reaction with the tungsten
hexafluoride.
Table 5-6 Tungsten CVD materials of interest
Chemical Type Monitoring Mass
WF6 reagent 279
H2 reagent 2
SiH4 reagent 30, 31, 32
Ar reagent 40
N2 reagent 28
(interference from SiH4)
HF product 20 (at 35 eV)
O2 contaminant 32
(interference from SiH4)
H2O contaminant 18 (at 35 eV)
5.3.1.7 Copper MOCVD
Table 5-7 lists some of the materials of interest and the masses for monitoring them
for the deposition of copper using Cu
unwanted contaminants.
Table 5-7 Copper MOCVD materials of interest
Chemical Types Monitoring Mass
CuI(hfac)(tmvs) reagent 201, 63
H(hfac) product 139
WOF4 by-product 257
I
(hfac)(tmvs). Oxygen and water vapor are
H2 reagent 2
Ar reagent 40
tmvs product 100, 85
O2 contaminant 32
H2O contaminant 18
(if Ar present, use 35 eV)
5–25
Page 88

5.3.2 Quantitative Interpretation of Mass Spectra
PP
a
K
abIab
=
PP
a
M
ab
AbIab=
M
ab
1
FF
ab
XF
a
------------------------------
=
(Calculating Partial Pressures)
Partial pressure is defined as the pressure of a designated component in a gas
mixture. By Dalton’s Law, the sum of all the partial pressures is the total pressure.
The partial pressure analyzer is designed so that the height of a peak in a mass
spectrum is proportional to the number of ions giving rise to that peak. The number
of ions is more or less proportional to the partial pressure of the substance giving
rise to that peak (over some specified operating pressure range). Therefore, the
height of a peak is proportional to the partial pressure of the substance giving rise
to that peak.
Equation [4] shows the relationship between the partial pressure of substance a
determined by measuring the ion current at mass b:
PP
= the partial pressure of substance a
a
K
= the proportionality constant for the peak at mass b from substance a
ab
I
= the ion current at mass b from substance a
ab
The proportionality constant (Kab) depends on the nature of the substance being
detected and on the characteristics of the partial pressure analyzer. The substance
dependent part is called the material factor (M
is called the analyzer factor (A
) and depends primarily on the ion mass (b).
b
Therefore, the original equation [4] can therefore be rewritten as follows:
ab
Transpector CPM Operating Manual
[4]
). The instrument dependent part
[5]
The material factor (M
) depends on the fragmentation pattern for the particular
ab
substance, the fragmentation pattern for a reference gas (usually nitrogen), and the
ease with which the substance can be ionized relative to the same reference gas.
The relationship is shown in equation [6]:
[6]
The fragmentation factor for substance (a) at mass (b) is (FF
). It is equal to the
ab
fraction of the total current of all ions from substance (a) which have a mass (b).
The ionization probability of substance (a), relative to nitrogen (i.e., XF
(XF
). That is, it is the ratio of total ion current (for all masses) from substance (a)
a
=1) is
N
to the total ion current from nitrogen (N), both measured at the same true partial
pressure. Both fragmentation factors and ionization probabilities depend strongly
on the energy of the ionizing electrons. If the correct values of these factors are not
known for the exact conditions of the particular analyzer being used, they can be
approximated using published values for other conditions with, generally, only a
small loss in accuracy.
5–26
Page 89

Transpector CPM Operating Manual
Fragmentation factors can be calculated from fragmentation patterns given in the
general references cited in Chapter 12, Bibliography. Other valuable references
include the Index of Mass Spectral Data from ASTM, and EPA/NIH Mass Spectral
Data Base by Heller and Milne and an extensive library of spectra is available from
the National Institute of Standards and Technology.
Table 5-8 lists the fragmentation factors (FF) for the major peaks for selected
substances.
NOTE: Actual fragmentation factors vary significantly depending especially on the
ionizer, electron energy, and mass filter turning. For best accuracy,
measure fragmentation factors with the same instrument used for the
analysis, under the same tuning conditions.
5–27
Page 90

Transpector CPM Operating Manual
Table 5-8 Typical fragmentation factors for the major peaks of some common substances
.
(at 70eV electron energy)
Mass FF Mass FF Mass FF
acetone: (CH
CO helium: He oxygen: O
3)2
43 .46 4 1.00 32 .82
58 .11 16 .18
42 .03 hydrogen: H
2
27 .05 2 1.00 toulene: C6H5CH
argon: Ar 92 .24
40 .87 krypton: Kr 39 .07
20 .13 84 .45 65 .04
86 .13 63 .03
benzene: C
6H6
82 .10
78 .43 83 .10 trichlorethylene: C
51 .09 130 .17
52 .09 methane: CH
4
50 .08 16 .44 132 .16
15 .39 97 .10
carbon dioxide: CO
2
14 .09 60 .08
44 .86 13 .05
28 .06 12 .02 water: H
16 .05 17 .01 18 .77
12 .01 17 .21
methanol: CH
OH 16 .02
3
carbon monoxide: CO 31 .31
28 .87 32 .21 xenon: Xe
12 .08 29 .07 132 .26
16 .04 28 .04 129 .26
29 .01 131 .22
neon: Ne 134 .11
ethanol: C
OH 20 .91 136 .09
2H5
31 .45 22 .09
45 .22
46 .08 nitrogen: N
2
27 .07 28 .87
29 .05 14 .12
29 .01
2
3
91 .33
HCl
2
3
95 .16
O
2
5–28
Page 91

Transpector CPM Operating Manual
Ionization probability factors can be approximated by substituting the relative ion
gauge sensitivities for various gases. Table 5-9 lists relative ion gauge sensitivities
for some common gases.
NOTE: Table 5-9 lists relative ionization gauge sensitivities for selected
molecules. The data was compiled from Empirical Observations on the
Sensitivity of Hot Cathode Ionization Type Vacuum Gauges by R. L.
Summers (NASA Technical Note NASA TN D5285, published in 1969).
Similar, although more limited, lists of ionization sensitivities can be found
in the books by O’Hanlon, and Drinkwine and Lichtman. (See Chapter 12,
Bibliography.)
HINT: Actual ionization probabilities vary significantly depending especially on the
ionizer and the electron energy. For best accuracy, measure the relative
ionization probability using a hot cathode ionization gauge (calibrated for
nitrogen) to monitor a known pressure of the substance of interest. The
ratio of the gauge reading to the known true pressure is the relative
ionization probability. To determine the true pressure, use a gauge which is
gas species independent (e.g., a capacitance manometer) or a gauge with
a known sensitivity factor (e.g., a spinning rotor gauge).
Table 5-9 Ionization Probabilities For Some Common Substances
Substance Formula Relative
Substance Formula Relative
Ionization
Gauge
Sensitivity
acetone (CH
CO 3.6 hydrogen chloride HCl 1.6
3)2
air 1.0 hydrogen fluoride HF 1.4
ammonia NH
3
argon Ar 1.2 hydrogen sulfide H
benzene C
benzoic acid C
bromine Br
butane C
carbon dioxide CO
carbon disulfide CS
6H6
COOH 5.5 lithium Li 1.9
6H5
2
4H10
2
2
1.3 hydrogen iodide HI 3.1
S2.2
2
5.9 krypton Kr 1.7
3.8 methane CH
4
4.9 methanol CH3OH 1.8
1.4 neon Ne 0.23
4.8 nitrogen N
2
carbon monoxide CO 1.05 nitric oxide NO 1.2
carbon tetrachloride CCl
chlorobenzene C
chloroethane C
6H5
2H5
chloroform CHCl
chloromethane CH
4
Cl 7.0 oxygen O
Cl 4.0 n-pentane C5H
3
Cl 3.1 phosphine PH
3
6.0 nitrous oxide N2O1.7
2
12
4.8 phenol C6H5OH 6.2
3
Ionization
Gauge
Sensitivity
1.6
1.0
1.0
6.0
2.6
5–29
Page 92

Table 5-9 Ionization Probabilities For Some Common Substances (continued)
A
a
1
TFbDF
ab
G S
---------------------------------------------------
=
Transpector CPM Operating Manual
Substance Formula Relative
cyclohexane C6H
deuterium D
dichlorodifluormethane CCl
dichloromethane CH
dintrobenzene C
6H4
ethane C
ethanol C
2H5
ethylene oxide (CH
helium He 0.14 xenon Xe 3.0
hexane C
hydrogen H
The analyzer factor, Ab, depends on the transmission and detection characteristics
of the analyzer, the EM gain (if the analyzer is so equipped), and the basic
sensitivity. (See equation [7].)
Substance Formula Relative
4
3
3
2
Ionization
Gauge
Sensitivity
3.7
3.6
6.7
2.1
2.3
6.8
9.0
7.8
Ionization
Gauge
Sensitivity
12
2
2F2
2Cl2
(NO2)
2H6
2
6.4 propane C3H
0.35 silver perchlorate AgClO
2.7 stannic iodide Snl
7.8 sulfur dioxide SO
7.8 sulfur hexafluoride SF
2.6 toluene C6H5CH
8
4
2
6
OH 3.6 trinitrobenzene C6H3(NO2)
O 2.5 water H2O1.0
2)2
6H14
2
6.6 xylene C6H4(CH3)
0.44
[7]
The transmission factor of the mass filter at mass (b) is (TF
). The transmission
b
factor is the fraction of ions at mass (b) which pass through the mass filter, relative
to nitrogen ions at mass 28. Nominally, the transmission factor is equal to 28
divided by the mass of the ion (b).
The detection factor (DF
) is equal to 1 for a Faraday Cup detector. For an EM,
ab
the detection factor is a function of the mass of the ion and its chemical nature, and
is measured relative to that of a reference gas, typically nitrogen. In general, as the
mass ion increases, the EM detection factor decreases.
The gain of the EM (G) measured at mass 28 for nitrogen, is the EM output current
divided by the Faraday mode output current, under otherwise identical conditions.
The multiplier gain is a strong function of the high voltage applied.
The sensitivity of the instrument (S) is the Faraday mode ion current from a given
pressure of pure nitrogen measured at mass 28, and is typically expressed in
A/Torr.
5–30
Page 93

Transpector CPM Operating Manual
PP
a
FF
N28
FF
ab
XF
ab
TF
b
DF
ab
G S
-------------------------------------------------------------------------------------------
Iab=
The overall relation between partial pressure and ion current, given in equation [8],
is quite general. The constants for this equation can be obtained from various
tables, but for the best accuracy, they should be measured for each instrument.
[8]
PP
= partial pressure of substance a (usually in Torr).
a
FF
= fragmentation factor, or fraction of total ion current from substance a having mass b
ab
(dimensionless; see Table 5-8 on page 5-28).
FF
= fragmentation factor for N2+ ions at 28 AMU from nitrogen (dimensionless; typically
N28
around 0.9).
XF
= ionization probability of substance a relative to nitrogen; approximately the same as the
a
relative ion gauge sensitivity as shown in (dimensionless).
TF
= transmission factor, the fraction of total ions at mass b which pass through the mass filter,
b
relative to ions with a mass of 28 AMU; nominally,
T
= 28 / M (dimensionless).
FM
DF
= detection factor for mass (b) ions from substance (a), relative to nitrogen at 28 AMU;
b
a
assumed to be 1.00 for Faraday detectors, but varies for EM detectors (dimensionless).
G = EM gain for nitrogen ions at 28 AMU (dimensionless; set equal to 1 for a Faraday Cup
detector).
S = sensitivity of instrument to nitrogen, the ion current at 28 AMU per unit of nitrogen partial
pressure (usually in A/Torr).
Iab = ion current of mass peak (b) resulting from substance (a)
In amps; assumes that there are no other substances present which contribute significantly to
the total current at mass peak (b).
5–31
Page 94

Transpector CPM Operating Manual
CAUTION
5.3.3 Additional Information For Interpreting Mass Spectra
5.3.3.1 Ion Source Characteristics
A closed ion source, and the particular inlet system selected, can have an effect on
the mass spectrum obtained.
The analyzer itself is a source of gas molecules because of outgassing from its
surfaces. Usually, outgassing levels can be reduced by baking the analyzer in
vacuum and by using the degas function (wherein the ion source surfaces are
bombarded by high energy electrons). Overnight bakeouts at the maximum
allowable temperature is the best way to minimize the effects of outgassing of the
sensor, manifold, and inlet system.
NOTE: It can take more than three hours for all parts of the sensor to reach
maximum temperature during a bakeout, and more than six hours to cool
down.
Make sure EM high voltage is off if the bakeout
temperature exceeds 150°C. Otherwise, permanent
damage to the EM may result.
It is possible that the opposite of outgassing can occur, that is, gas molecules can
be captured by the surfaces of the sensor. This effect is called pumping. The
magnitude of the signals of the gases pumped will be lower than is properly
representative of the composition of the gas in the vacuum chamber. Significant
temporary pumping effects will frequently occur following degassing the ion source.
Reactions involving gas molecules on surfaces of the analyzer can result in a
change of composition. Gases can either be consumed by the surfaces, or
produced by the surfaces. One example of gas consumption is the reaction of
oxygen with a hot filament, particularly when tungsten filaments are used. The
typical result is an anomalously low concentration of oxygen detected.
See O’Hanlon’s book for more information on filament materials and their
interactions with the gas being analyzed. (See Chapter 12, Bibliography.) An
example of gases being produced from surfaces is the liberation of carbon
monoxide molecules from a thorium oxide coated iridium filament by a sputtering
mechanism in the presence of significant quantities of argon. It is for this reason
that the PVD version of the CIS uses tungsten filaments.
There are cases where at least some of the ions detected are emitted from
surfaces in the ion source under electron bombardment and are not generated in
the gas phase from neutral molecules. This process is known as electron
stimulated desorption (ESD), or sometimes as electron induced desorption (EID).
When the sensor has been exposed to fluorine containing substances (e.g., sulfur
hexafluoride, chlorofluorocarbons, perfluorotributylamine, or perfluorokerosene)
5–32
Page 95

Transpector CPM Operating Manual
for extended periods of time, it is not uncommon for a strong F+ peak at 19 AMU to
remain even after the fluorine containing substance has been removed. When
operating in the UHV region, ESD/EID of H
+
, C+, O+, and CO+ (and other ions) is
not uncommon. The clue to diagnosing this problem is that the observed
fragmentation patterns do not match known gas phase patterns. See pages five
and six, and typical spectra TS2 through 5, 16, 28, and 30, of Partial Pressure
Analyzers and Analysis by Drinkwine and Lichtman for more information on
ESD/EID.
Partial pressure analyzers are also characterized by varying degrees of mass
discrimination, that is, the sensitivity of the instrument is a function of mass. Ion
sources show mass discrimination because various substances offer different
degrees of difficulty of ionization. Generally, heavy, large molecules are ionized
more readily than light, small molecules. There is a rough correlation between the
number of electrons in a molecule and its ease of ionization. Although the total ion
yield (that is, the sum of ions of all masses) is electron energy and ionizer
dependent, a reasonable estimate for the number of ions produced (relative to a
standard, usually nitrogen) in a partial pressure analyzer is the relative ionization
gauge sensitivity.
5.3.3.2 Scanning Characteristics
Quadrupole mass filters can also exhibit mass discrimination characteristics
depending on how the control voltages are varied during the sweep through the
mass range. Most instruments are designed to operate with a constant peak width
(constant M) which results in a resolution which is proportional to the mass. This
characteristic provides a good degree of peak separation throughout the mass
spectrum, but results in an ion transmission efficiency (i.e., the fraction of all ions
of the selected mass entering the mass filter which are transmitted through it)
which decreases as mass increases.
The way the mass scale is calibrated (tuned)— the way the peak positions and
widths are adjusted—can have a significant effect on the transmission efficiency of
the mass filter across the mass spectrum. If the adjustments are not made properly,
the ratios of peak heights across the mass range will not be correct.
5–33
Page 96

5.3.3.3 Fragmentation Factors
The fragmentation factor is the fraction of the total ion current contributed by ions
of the chosen mass. Only peaks contributing at least one percent to the total ion
current are included in the list. The sum of the factors for all the peaks in a mass
spectrum cannot exceed 1.00. The sum can be less than 1.00 if only some of the
peaks are listed (either there are many peaks, or some of the ions produced lie
outside the mass range of the particular instrument used).
The data presented in Table 5-8 on page 5-28 are typical fragmentation factors for
some common gases at an electron energy of 70 eV. These fragmentation factors
can vary considerably with electron energy. For instance, at 35 eV the only
significant peak in argon is Ar
+
at 40 AMU.
Transpector CPM Operating Manual
5–34
Page 97

Chapter 6
CAUTION
Operation
6.1 HexBlock
The HexBlock provides several inlets, a process pressure gauge (CDG) and a
calibration reference. It allows for up to three pressure ranges, including a high
conductance inlet that covers various applications such as High Density Plasma
Etch (HDP), TiN Deposition such as TDMAT, W CVD, or any other semiconductor
process. Advantages include:
small vacuum path lengths
minimum surface area
interchangeable orifices
multiple process connection options (CF40, KF40 and KF25)
Transpector CPM Operating Manual
multiple sniffer (capillary) inlet options for sampling the process
The orifices mounted in the HexBlock valves are replaceable.
Pressure ranges for the two main sampling valves are:
V1 . . . 3 mTorr–10 Torr
V2 . . . 3 mTorr–Atmosphere
The tool and the CPM must be vented before changing
orifices, except when a tool isolation valve is installed.
6–1
Page 98

6.1.1 HexBlock Inlet
CAUTION
V1—Low pressure sampling (LP). Indicates background pressures for some
etch or CVD process. (No bypass available.)
V2—High pressure sampling (HP). Indicates process pressures for etch, CVD
and 300 mm degas sampling. Bypass is optional.
V3—High Conductance. Similar to a wide open position. Used for any high
vacuum condition lower than 1 mTorr.
V4—Bypass. Used in conjunction with V2 in high pressure applications (above
1 Torr). V4 connects to the interstage of the Turbo Molecular Pump via a bypass
tube which pulls gas from the process directly to V2. This can cut the response
time down from several minutes to less than ten seconds for a 100 Torr process.
The V4 bypass inlet typically consumes approximately 17 sccms of process gas.
NOTE: When sampling lighter gases such as hydrogen and helium, it may be
Transpector CPM Operating Manual
necessary to connect the V4 bypass tube to the foreline pump port rather
than the turbo pump interstage port to improve pumping efficiency.
To prevent pressure bursts to the RGA, V4 should open
before V2 to ensure the pressure is correct for the V2
orifice. When V2 is closed, V4 should remain open for
several seconds to pump out residuals left from sampling
the process.
V5—Calibration Reference. Used for mass tuning and as a sensitivity
reference, providing:
a means to tune the RGA
a reference for adjusting the EM voltage
a way to check whether the orifices are getting dirty or clogged
a reference for tracking the performance of the RGA
The Calibration Valve refers to the option of adding a Calibration Reference to
the CPM system. The Calibration Reference is located near the ion source.
NOTE: The Transpector emission and EM are turned off prior to opening
Calibration Valve (V5). This is due to trapped gas in the calibration
reference.
Sniffer or Capillary— The sniffer or capillary option allows sampling closer to
the actual process reactions and it gives a faster response time and better
signal (uses valve V2). Capillaries also provide part of the necessary pressure
drop to sample from atmospheric pressure.
6–2
CDG Gauge—The CDG gauge measures process pressure. It helps to
prevent accidental or erroneous inlet valves from being opened.
Page 99

6.1.1.1 Hex Block Process Connections
Table 6-1 Hex block process connections
Types of connections Part Number
KF25 In-line connection 923-700-G1
KF40 In-line connection 923-701-G1
CF40 In-line connection 923-702-G1
KF25 90 degree elbow connection 923-703-G1
KF40 90 degree elbow connection 923-704-G1
CF40 90 degree elbow connection 923-705-G1
6.1.2 Calibration Option
A single source of gas mixture will accomplish two calibration functions:
Mass scale calibration
Transpector CPM Operating Manual
Partial pressure reference levels
NOTE: Selection of the appropriate gas mixture components is dictated by the
mass range desired.
Test Mix 1 composition is listed in Table 6-2. The method of delivery is a flow
reference with a remote on/off valve (V5). The gas flow rate is calibrated at the
-4
factory and is kept small (typically 1x10
Torr-L/s) by a sintered leak. Flow through
the leak element is viscous, therefore the gas composition in the reservoir is not
altered by sampling. The pumping system does not allow other valves to be opened
with the calibration reference to ensure that no calibration mix enters the tool.
Table 6-2 Mix 1: Calibration mixture of selected impurities in argon
Component
(Composition)
Mix 1 H
Ar (Balance) 36, 38, 40
(1%) 2
2
He (1%) 4
N
(1%) 28
2
Kr (1%) 84
Calibration Masses
Xe (1%) 134, 136
NOTE: Refer to the software operating manual for more information regarding
Mass Tuning. Results using FabGuard Explorer or FabGuard with this
calibration mixture may be different than shown above due to the
programming of the ionization probability and material factors.
6–3
Page 100

6.1.2.1 High Mass FC5311 Tuning Reference
CAUTION
The FC5311 Tuning Reference Gas option is available for adjusting peak position
for 300 AMU CPMs. It is controlled via a manual valve. FC5311 Tuning Reference
Gas is a volatile liquid. It is located at the inlet of the high vacuum pump.
A bakeout must be performed if FC5311 Tuning
Reference Gas is sampled. Up to 24 hours of pumping
may be required to remove all trace levels.
The perfluorophenanthrene liquid in the FC5311 Tuning Reference has a high
molecular weight and a vapor pressure of 100 Pa (1 Torr) at 22°C (71.6°F). The
mass spectrum is given as mass and characteristic peak intensity in Table 6-3. The
masses of abundant peaks can be used with the Tune option of FabGuard Explorer
to calibrate the mass scale, particularly for 200 AMU and 300 AMU sensors.
Table 6-3 Mix 2: FC5311 reference mass spectrum
70 eV, peak intensity ranging 1–100%
Transpector CPM Operating Manual
Mass Intensity Mass Intensity
55 1.83 219 2.66
56 1.09 231 4.06
57 2.97 243 7.66
69 100 255 2.09
70 1.17 267 2.55
93 5.97 286 2.09
94 1.27 293 7.65
100 11 . 0 9 305 1.14
112 1.50 317 2.27
119 16.80 331 1.12
124 1.49 343 1.17
131 47.08 367 1.88
143 5.26 405 4.23
155 3.05 455 18.30
6–4
162 5.64 505 4.41
169 7.66 517 1.17
181 11 . 2 3 555 4.62
 Loading...