

Page 1
OPERATING MANUAL
SQM-242
Thin Film Deposition Controller
IPN 074-549-P1A
™
Page 2

Page 3

www.inficon.com reachus@inficon.com
©2011 INFICON
®
OPERATING MANUAL
SQM-242
Thin Film Deposition Controller
IPN 074-549-P1A
™
Page 4

Trademarks
The trademarks of the products mentioned in this manual are held by the companies that
produce them.
LabVIEW™ is a trademark of National Instruments.
Z-Match® and SQM-242™ are trademarks of INFICON GmbH.
Windows®, Microsoft®, Visual Basic® and ActiveX® are registered trademarks of Microsoft Corporation.
All other brand and product names are trademarks or registered trademarks of their respective companies.
Disclaimer
The information contained in this manual is believed to be accurate and reliable. However, INFICON assumes
no responsibility for its use and shall not be liable for any special, incidental, or consequential damages related
to the use of this product.
Due to our continuing program of product improvements, specifications are subject to change without notice.
Copyright
©2011 All rights reserved.
Reproduction or adaptation of any part of this document without permission is unlawful.
Page 5

DECLARATION OF CONFORMITY
This is to certify that this equipment, designed and manufactured by:
INFICON Inc.
Two Technology Place
East Syracuse, NY 13057
USA
meets the essential safety requirements of the European Union and is placed on the market
accordingly. It has been constructed in accordance with good engineering practice in safety
matters in force in the Community and does not endanger the safety of persons, domestic
animals or property when properly installed and maintained and used in applications for
which it was made.
Equipment Description:
Applicable Directives: 2006/95/EC (LVD)
SQM-242 (including all options)
2004/108/EC (General EMC)
2002/95/EC (RoHS)
Applicable Standards:
Safety: EN 61010-1:2001
Emissions: EN 61326-1:1997/A1: 1998/A2: 2001 (Radiated & Conducted Emissions)
Class A: Emissions per Table 3
(EMC – Measurement, Control & Laboratory Equipment)
Immunity: EN 61326-1:1997/A1: 1998/A2: 2001 (General EMC)
Class A: Immunity per Table A1
(EMC – Measurement, Control & Laboratory Equipment)
RoHS: Fully compliant
CE Implementation Date:
July 2003 (Updated February 2011)
Authorized Representative:
Steve Schill
Thin Film Business Line Manager
INFICON Inc.
ANY QUESTIONS RELATIVE TO THIS DECLARATION OR TO THE SAFETY OF INFICON'S PRODUCTS SHOULD BE DIRECTED, IN
WRITING, TO THE AUTHORIZED REPRESENTATIVE AT THE ABOVE ADDRESS.
Page 6

Page 7

Warranty
WARRANTY AND LIABILITY - LIMITATION: Seller warrants the products
manufactured by it, or by an affiliated company and sold by it, and described on
the reverse hereof, to be, for the period of warranty coverage specified below, free
from defects of materials or workmanship under normal proper use and service.
The period of warranty coverage is specified for the respective products in the
respective Seller instruction manuals for those products but shall not be less than
two (2) years from the date of shipment thereof by Seller. Seller's liability under
this warranty is limited to such of the above products or parts thereof as are
returned, transportation prepaid, to Seller's plant, not later than thirty (30) days
after the expiration of the period of warranty coverage in respect thereof and are
found by Seller's examination to have failed to function properly because of
defective workmanship or materials and not because of improper installation or
misuse and is limited to, at Seller's election, either (a) repairing and returning the
product or part thereof, or (b) furnishing a replacement product or part thereof,
transportation prepaid by Seller in either case. In the event Buyer discovers or
learns that a product does not conform to warranty, Buyer shall immediately notify
Seller in writing of such non-conformity, specifying in reasonable detail the nature
of such non-conformity. If Seller is not provided with such written notification,
Seller shall not be liable for any further damages which could have been avoided if
Seller had been provided with immediate written notification.
THIS WARRANTY IS MADE AND ACCEPTED IN LIEU OF ALL OTHER
WARRANTIES, EXPRESS OR IMPLIED, WHETHER OF MERCHANTABILITY OR
OF FITNESS FOR A PARTICULAR PURPOSE OR OTHERWISE, AS BUYER'S
EXCLUSIVE REMEDY FOR ANY DEFECTS IN THE PRODUCTS TO BE SOLD
HEREUNDER. All other obligations and liabilities of Seller, whether in contract or
tort (including negligence) or otherwise, are expressly EXCLUDED. In no event
shall Seller be liable for any costs, expenses or damages, whether direct or
indirect, special, incidental, consequential, or other, on any claim of any defective
product, in excess of the price paid by Buyer for the product plus return
transportation charges prepaid.
No warranty is made by Seller of any Seller product which has been installed,
used or operated contrary to Seller's written instruction manual or which has been
subjected to misuse, negligence or accident or has been repaired or altered by
anyone other than Seller or which has been used in a manner or for a purpose for
which the Seller product was not designed nor against any defects due to plans or
instructions supplied to Seller by or for Buyer.
This manual is intended for private use by INFICON® Inc. and its customers.
Contact INFICON before reproducing its contents.
NOTE: These instructions do not provide for every contingency that may arise in
connection with the installation, operation or maintenance of this equipment.
Should you require further assistance, please contact INFICON.
www.inficon.com reachus@inficon.com
Page 8

Page 9

SQM-242 Operating Manual
Table Of Contents
Trademarks
Disclaimer
Copyright
Chapter 1
Introduction
1.1 Introduction. . . . . . . . . . . . . . . . . . . . . . . . . . . . . . . . . . . . . . . . . . . . . . . . . . 1-1
1.1.1 Related Manuals. . . . . . . . . . . . . . . . . . . . . . . . . . . . . . . . . . . . . . . . . . . . . .1-2
1.2 Instrument Safety . . . . . . . . . . . . . . . . . . . . . . . . . . . . . . . . . . . . . . . . . . . . . 1-3
1.2.1 Definition of Notes, Cautions and Warnings. . . . . . . . . . . . . . . . . . . . . . . . . 1-3
1.2.2 General Safety Information. . . . . . . . . . . . . . . . . . . . . . . . . . . . . . . . . . . . . .1-4
1.3 How To Contact Customer Support . . . . . . . . . . . . . . . . . . . . . . . . . . . . . . .1-5
1.3.1 Returning Your Instrument to INFICON . . . . . . . . . . . . . . . . . . . . . . . . . . . .1-5
1.4 Specifications . . . . . . . . . . . . . . . . . . . . . . . . . . . . . . . . . . . . . . . . . . . . . . . . 1-6
1.4.1 SQM-242 Measurement . . . . . . . . . . . . . . . . . . . . . . . . . . . . . . . . . . . . . . . .1-6
1.4.2 SAM-242 Inputs . . . . . . . . . . . . . . . . . . . . . . . . . . . . . . . . . . . . . . . . . . . . . . 1-6
1.4.3 SQM-242/SAM-242 Outputs. . . . . . . . . . . . . . . . . . . . . . . . . . . . . . . . . . . . .1-6
1.4.4 Setup Parameters. . . . . . . . . . . . . . . . . . . . . . . . . . . . . . . . . . . . . . . . . . . . .1-6
1.4.5 External Communications (SQS-242 only). . . . . . . . . . . . . . . . . . . . . . . . . . 1-7
1.4.6 Computer Requirements . . . . . . . . . . . . . . . . . . . . . . . . . . . . . . . . . . . . . . . 1-7
1.4.7 General Specifications . . . . . . . . . . . . . . . . . . . . . . . . . . . . . . . . . . . . . . . . .1-7
1.4.8 Operating Environment. . . . . . . . . . . . . . . . . . . . . . . . . . . . . . . . . . . . . . . . .1-8
1.4.9 Storage Temperature . . . . . . . . . . . . . . . . . . . . . . . . . . . . . . . . . . . . . . . . . . 1-8
1.4.10 Warm Up Period . . . . . . . . . . . . . . . . . . . . . . . . . . . . . . . . . . . . . . . . . . . . . .1-8
IPN 074-549-P1A
1.4.11 Size. . . . . . . . . . . . . . . . . . . . . . . . . . . . . . . . . . . . . . . . . . . . . . . . . . . . . . . .1-8
1.4.12 Connector Clearance Requirements . . . . . . . . . . . . . . . . . . . . . . . . . . . . . . 1-8
1.4.13 Weight . . . . . . . . . . . . . . . . . . . . . . . . . . . . . . . . . . . . . . . . . . . . . . . . . . . . . 1-8
1.5 Unpacking and Inspection . . . . . . . . . . . . . . . . . . . . . . . . . . . . . . . . . . . . . .1-9
1.6 Parts and Options Overview. . . . . . . . . . . . . . . . . . . . . . . . . . . . . . . . . . . . .1-9
1.6.1 Base Configurations . . . . . . . . . . . . . . . . . . . . . . . . . . . . . . . . . . . . . . . . . . .1-9
1.6.2 Accessories . . . . . . . . . . . . . . . . . . . . . . . . . . . . . . . . . . . . . . . . . . . . . . . . .1-9
1.6.3 Sensors . . . . . . . . . . . . . . . . . . . . . . . . . . . . . . . . . . . . . . . . . . . . . . . . . . .1-10
TOC - 1
Page 10

Chapter 2
2.1 SQM-242 Card Installation. . . . . . . . . . . . . . . . . . . . . . . . . . . . . . . . . . . . . . 2-1
2.2 SQM-242 Driver Installation . . . . . . . . . . . . . . . . . . . . . . . . . . . . . . . . . . . . . 2-2
2.3 Software Installation. . . . . . . . . . . . . . . . . . . . . . . . . . . . . . . . . . . . . . . . . . . 2-2
2.4 SQM-242 Card Connections . . . . . . . . . . . . . . . . . . . . . . . . . . . . . . . . . . . . 2-3
2.5 SAM-242 Card Connections. . . . . . . . . . . . . . . . . . . . . . . . . . . . . . . . . . . . . 2-5
2.6 Digital I/O . . . . . . . . . . . . . . . . . . . . . . . . . . . . . . . . . . . . . . . . . . . . . . . . . . . 2-6
Chapter 3
3.1 Introduction. . . . . . . . . . . . . . . . . . . . . . . . . . . . . . . . . . . . . . . . . . . . . . . . . . 3-1
3.2 Main Dialog Box . . . . . . . . . . . . . . . . . . . . . . . . . . . . . . . . . . . . . . . . . . . . . . 3-1
3.3 Edit: Auto/Manual Mode. . . . . . . . . . . . . . . . . . . . . . . . . . . . . . . . . . . . . . . . 3-3
3.4 Edit: Recorder Mode . . . . . . . . . . . . . . . . . . . . . . . . . . . . . . . . . . . . . . . . . . 3-5
3.5 File Menu . . . . . . . . . . . . . . . . . . . . . . . . . . . . . . . . . . . . . . . . . . . . . . . . . . . 3-6
3.6 View Menu . . . . . . . . . . . . . . . . . . . . . . . . . . . . . . . . . . . . . . . . . . . . . . . . . . 3-6
3.6.1 View Menu: Readings . . . . . . . . . . . . . . . . . . . . . . . . . . . . . . . . . . . . . . . . . 3-6
3.6.2 View Menu: Input Setup . . . . . . . . . . . . . . . . . . . . . . . . . . . . . . . . . . . . . . . . 3-7
3.6.3 View Menu: Card Setup . . . . . . . . . . . . . . . . . . . . . . . . . . . . . . . . . . . . . . . 3-10
SQM-242 Operating Manual
Installation
SQM-242 CoDep
Chapter 4
4.1 Introduction. . . . . . . . . . . . . . . . . . . . . . . . . . . . . . . . . . . . . . . . . . . . . . . . . . 4-1
Chapter 5
5.1 Introduction. . . . . . . . . . . . . . . . . . . . . . . . . . . . . . . . . . . . . . . . . . . . . . . . . . 5-1
5.2 Operation . . . . . . . . . . . . . . . . . . . . . . . . . . . . . . . . . . . . . . . . . . . . . . . . . . . 5-2
Chapter 6
6.1 Introduction. . . . . . . . . . . . . . . . . . . . . . . . . . . . . . . . . . . . . . . . . . . . . . . . . . 6-1
6.2 DLL Functions . . . . . . . . . . . . . . . . . . . . . . . . . . . . . . . . . . . . . . . . . . . . . . . 6-2
6.3 Sample Files. . . . . . . . . . . . . . . . . . . . . . . . . . . . . . . . . . . . . . . . . . . . . . . . . 6-6
Chapter 7
7.1 Troubleshooting Guide. . . . . . . . . . . . . . . . . . . . . . . . . . . . . . . . . . . . . . . . . 7-1
7.1.1 Troubleshooting the SQM-242 . . . . . . . . . . . . . . . . . . . . . . . . . . . . . . . . . . . 7-2
7.1.2 Troubleshooting Sensors . . . . . . . . . . . . . . . . . . . . . . . . . . . . . . . . . . . . . . . 7-4
7.1.3 Troubleshooting Computer Communications. . . . . . . . . . . . . . . . . . . . . . . . 7-9
SQM-242 Monitor
SQM-242 Multi
IPN 074-549-P1A
Communications
Troubleshooting and Maintenance
TOC - 2
Page 11

SQM-242 Operating Manual
7.2 Replacing the Crystal . . . . . . . . . . . . . . . . . . . . . . . . . . . . . . . . . . . . . . . . . 7-10
7.2.1 Front Load . . . . . . . . . . . . . . . . . . . . . . . . . . . . . . . . . . . . . . . . . . . . . . . . .7-10
7.2.2 Cool Drawer . . . . . . . . . . . . . . . . . . . . . . . . . . . . . . . . . . . . . . . . . . . . . . . .7-11
7.2.3 Bakeable Sensor . . . . . . . . . . . . . . . . . . . . . . . . . . . . . . . . . . . . . . . . . . . .7-13
7.2.4 Sputtering Sensor. . . . . . . . . . . . . . . . . . . . . . . . . . . . . . . . . . . . . . . . . . . . 7-14
7.2.5 Crystal Snatcher. . . . . . . . . . . . . . . . . . . . . . . . . . . . . . . . . . . . . . . . . . . . . 7-15
7.3 Crystal Sensor Emulator
IPN 760-601-G2 . . . . . . . . . . . . . . . . . . . . . . . . . . . . . . . . . . . . . . . . . . . . . 7-16
7.3.1 Diagnostic Procedures . . . . . . . . . . . . . . . . . . . . . . . . . . . . . . . . . . . . . . . .7-17
7.3.1.1 Measurement System Diagnostic Procedure . . . . . . . . . . . . . . . . . . . . . . .7-17
7.3.1.2 Feed-Through Or In-Vacuum Cable
Diagnostic Procedure . . . . . . . . . . . . . . . . . . . . . . . . . . . . . . . . . . . . . . . . .7-18
7.3.1.3 Sensor Head Or Monitor Crystal
Diagnostic Procedure . . . . . . . . . . . . . . . . . . . . . . . . . . . . . . . . . . . . . . . . .7-19
7.3.1.4 System Diagnostics Pass But
Crystal Fail Message Remains. . . . . . . . . . . . . . . . . . . . . . . . . . . . . . . . . .7-20
7.3.2 Sensor Cover Connection . . . . . . . . . . . . . . . . . . . . . . . . . . . . . . . . . . . . . 7-21
7.3.2.1 Compatible Sensor Heads . . . . . . . . . . . . . . . . . . . . . . . . . . . . . . . . . . . . .7-21
7.3.2.2 Incompatible Sensor Heads . . . . . . . . . . . . . . . . . . . . . . . . . . . . . . . . . . . . 7-21
7.3.3 Emulator Specifications . . . . . . . . . . . . . . . . . . . . . . . . . . . . . . . . . . . . . . . 7-22
Chapter 8
Calibration
8.1 Importance of Density, Tooling and Z-Ratio. . . . . . . . . . . . . . . . . . . . . . . . . 8-1
8.2 Determining Density . . . . . . . . . . . . . . . . . . . . . . . . . . . . . . . . . . . . . . . . . . .8-1
8.3 Determining Tooling . . . . . . . . . . . . . . . . . . . . . . . . . . . . . . . . . . . . . . . . . . . 8-2
8.4 Laboratory Determination of Z-Ratio . . . . . . . . . . . . . . . . . . . . . . . . . . . . . .8-2
8.5 Tuning the Control Loop. . . . . . . . . . . . . . . . . . . . . . . . . . . . . . . . . . . . . . . . 8-4
8.5.1 Fast Source . . . . . . . . . . . . . . . . . . . . . . . . . . . . . . . . . . . . . . . . . . . . . . . . .8-6
IPN 074-549-P1A
8.5.2 Slow Source . . . . . . . . . . . . . . . . . . . . . . . . . . . . . . . . . . . . . . . . . . . . . . . . .8-7
8.5.3 Loop Tuning Procedure . . . . . . . . . . . . . . . . . . . . . . . . . . . . . . . . . . . . . . . . 8-8
Chapter 9
Measurement and Control Theory
9.1 Basics. . . . . . . . . . . . . . . . . . . . . . . . . . . . . . . . . . . . . . . . . . . . . . . . . . . . . . 9-1
9.1.1 Monitor Crystals . . . . . . . . . . . . . . . . . . . . . . . . . . . . . . . . . . . . . . . . . . . . . .9-2
9.1.2 Period Measurement Technique . . . . . . . . . . . . . . . . . . . . . . . . . . . . . . . . .9-4
9.1.3 Z-match Technique. . . . . . . . . . . . . . . . . . . . . . . . . . . . . . . . . . . . . . . . . . . .9-5
9.1.4 Active Oscillator . . . . . . . . . . . . . . . . . . . . . . . . . . . . . . . . . . . . . . . . . . . . . . 9-6
9.1.5 Control Loop Theory. . . . . . . . . . . . . . . . . . . . . . . . . . . . . . . . . . . . . . . . . . . 9-8
TOC - 3
Page 12

Appendix A
A.1 Introduction. . . . . . . . . . . . . . . . . . . . . . . . . . . . . . . . . . . . . . . . . . . . . . . . . .A-1
SQM-242 Operating Manual
Material Table
TOC - 4
IPN 074-549-P1A
Page 13
1.1 Introduction
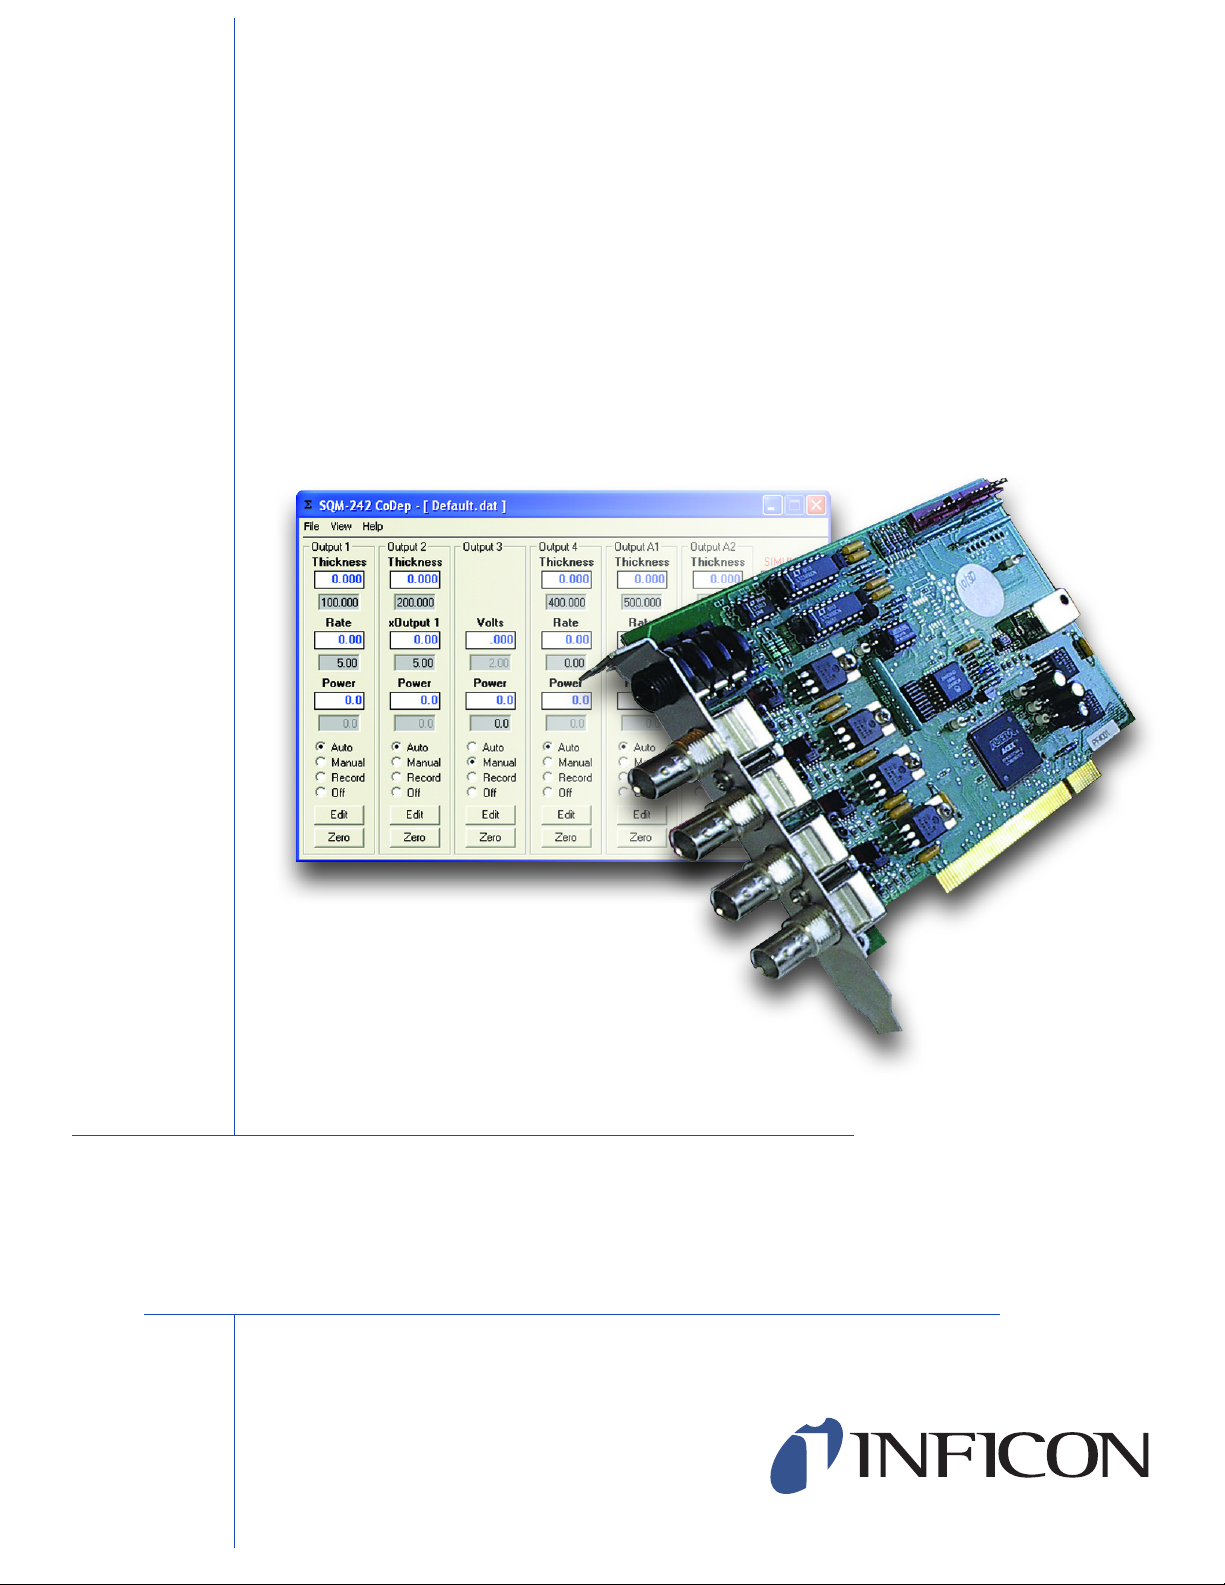
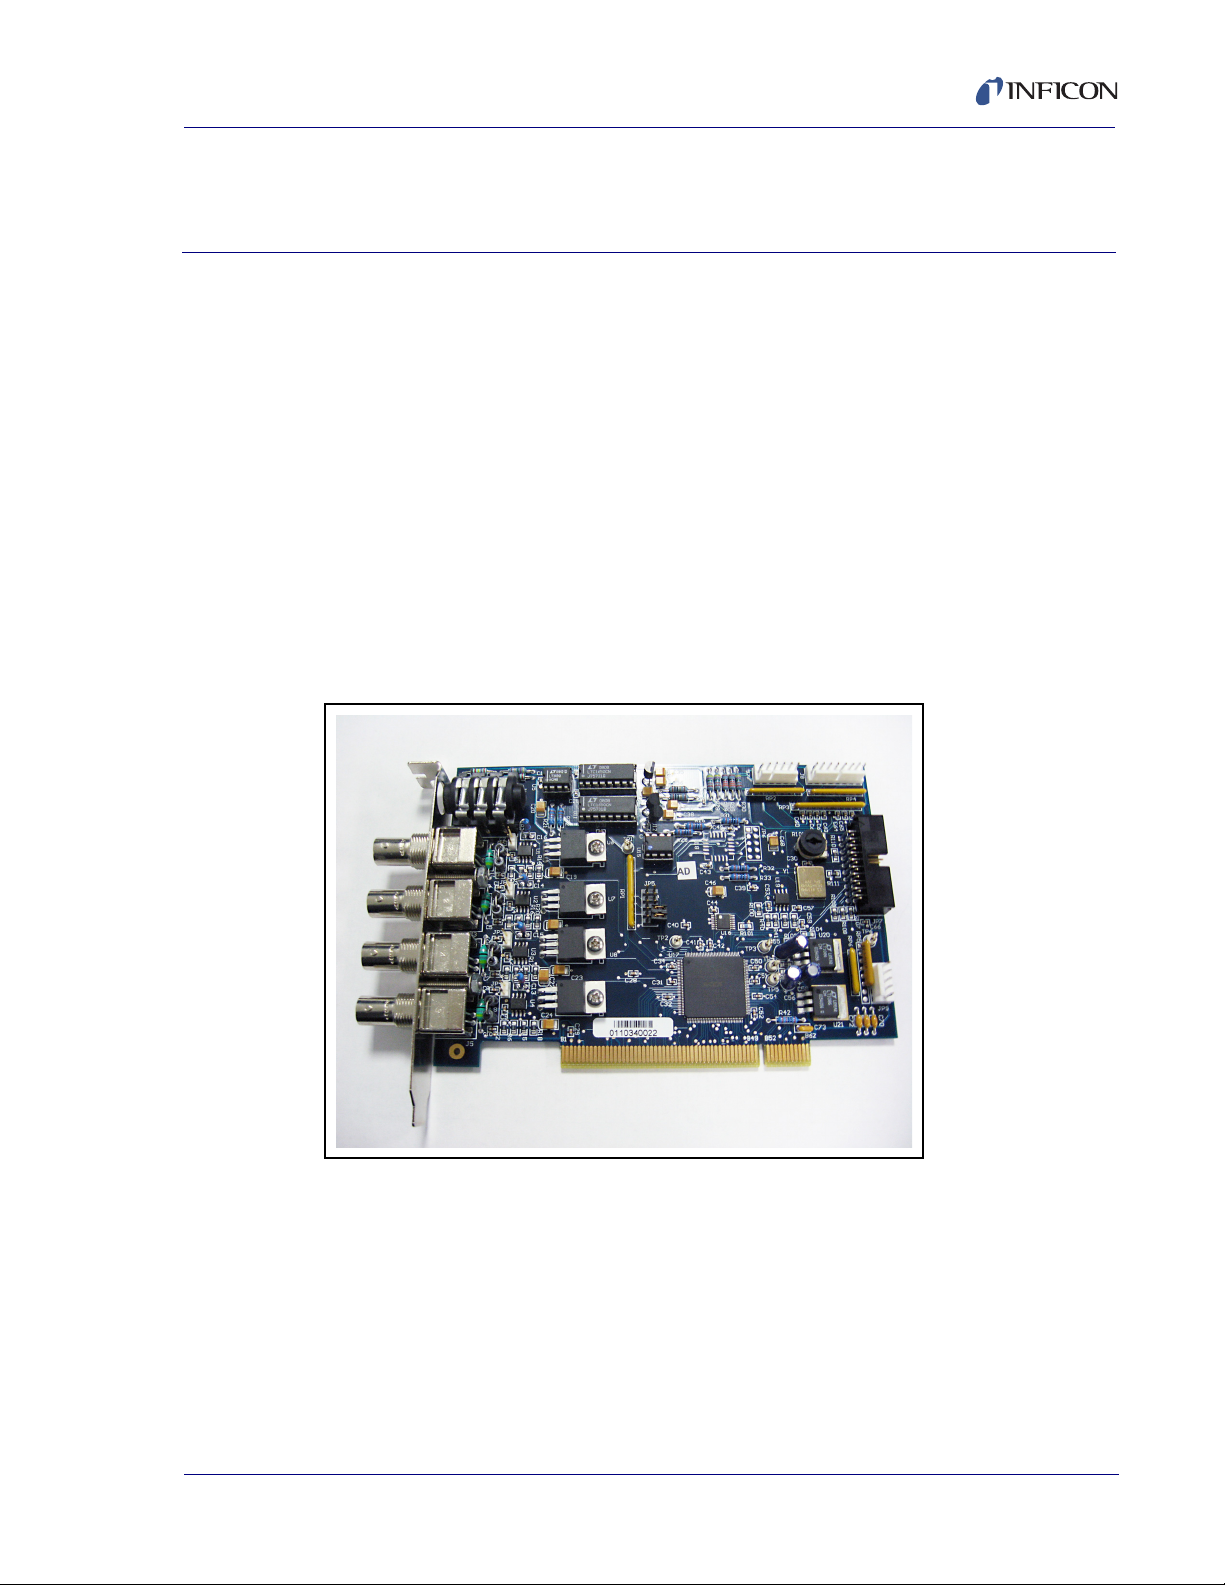
The SQM-242 Card is a powerful thin film deposition controller on a PCI card.
Significant features include:
Measure four 1 MHz to 10 MHz quartz crystal sensors simultaneously.
Controls two deposition source supplies simultaneously (co-deposition).
Install multiple cards for up to 24 sensors and 12 control outputs.
Measure four +/- 10 V analog inputs with optional (SAM-242) piggyback card.
Installs in any PC running Windows
PCI slot.
Interfaces to your program with Windows DLL and ActiveX
Sample Visual Basic
Figure 1-1 SQM-242 Deposition Control Card
SQM-242 Operating Manual
Chapter 1
Introduction
®
98/2000/ME/XP/7-32-bit with a vacant
®
interfaces.
®
and LabVIEW™ programs with source code are included.
IPN 074-549-P1A
The sample software included with SQM-242 card allows you to:
Co-deposit up to six materials, using up to eight sensors.
Use analog inputs to control heaters, gas flow, and other process variables.
Use outputs for recording rate, thickness, power, or voltage.
Save film setup parameters and deposition data to disk.
Simulate deposition for developing and testing film setups.
1 - 1
Page 14

SQM-242 Operating Manual
The optional SQS-242 software allows multi-layer deposition recipes, graphics,
flexible PLC-based digital I/O and RS-232/Ethernet external control.
The SQM-242 card is a PID loop process controller designed for use primarily in
physical vapor deposition. The SQM-242 card monitors and/or controls the rate
and thickness of thin film depositions. The SQM-242 reads frequency from an
in-vacuum 1 to 10 MHz quartz crystal driven by a small external oscillator module.
The oscillator module uses the in-vacuum crystal as the feedback element of an IC
oscillator circuit to amplify the crystal signal to about 0.75 volts peak to peak. The
SQM-242 card supplies 5 V (dc) to the oscillator module, and reads the module's
frequency output signal on a single BNC cable. On the SQM-242, a 200 MHz
reference oscillator sets a known measurement period. By counting the input
transitions during the measurement period, a frequency is calculated.
Deposition rate and thickness are inferred from the frequency change induced by
mass added to a quartz crystal. This technique positions sensors in the path
between, or to the side of, the target substrate and the source of vaporized
material. The sensor incorporates an exposed oscillating quartz crystal whose
frequency decreases as material accumulates. The change in frequency provides
information to determine rate and thickness and to continually control the
evaporation power source. With user supplied time, thickness and power limits and
with desired rates and material characteristics, the SQM-242 card is capable of
automatically controlling the process in a precise and repeatable manner. User
interaction is accomplished via the front panel or serial communications and
consists of selection or entry of parameters to define the process.
When reading this SQM-242 Manual, please pay particular attention to the
NOTES, CAUTIONS, and WARNINGS found throughout the text. The Notes,
Cautions, and Warnings are defined in section 1.2.1 on page 1-3.
1.1.1 Related Manuals
Sensors are covered in separate manuals. PDF files of these manuals are
contained in the 074-5000-G1 CD, part of the Ship Kit.
074-154 - Bakeable Sensor
074-156 - Front Load Sensor, Single/Dual
074-157 - Sputtering Sensor
147-800 - Cool Drawer Sensor, Single/Dual
IPN 074-549-P1A
1 - 2
Page 15
SQM-242 Operating Manual
CAUTION
WARNING
WARNING - Risk Of Electric Shock
1.2 Instrument Safety
1.2.1 Definition of Notes, Cautions and Warnings
When using this manual, please pay attention to the NOTES, CAUTIONS and
WARNINGS found throughout. For the purposes of this manual they are defined as
follows:
NOTE: Pertinent information that is useful in achieving maximum instrument
efficiency when followed.
Failure to heed these messages could result in damage
to the instrument.
Failure to heed these messages could result in personal
injury.
Dangerous voltages are present which could result in
personal injury.
IPN 074-549-P1A
1 - 3
Page 16
SQM-242 Operating Manual
WARNING - Risk Of Electric Shock
WARNING - Risk Of Electric Shock
WARNING
1.2.2 General Safety Information
The SQM-242/SAM-242 card(s) do not have any user
serviceable components.
Dangerous voltages may be present whenever the PC is
on or external input/relay connectors are present.
Refer all maintenance to technically qualified personnel.
This instrument contains delicate circuitry which is
susceptible to transient voltages/static.
Refer all maintenance to technically qualified personnel
Failure to operate the SQM-242 card(s) in the manner
intended by INFICON can circumvent the safety
protection provided by the instrument and may result in
personal injury.
IPN 074-549-P1A
1 - 4
Page 17

SQM-242 Operating Manual
1.3 How To Contact Customer Support
Worldwide support information regarding:
Technical Support, to contact an applications engineer with questions
regarding INFICON products and applications, or
Sales and Customer Service, to contact the INFICON Sales office nearest you,
or
Repair Service, to contact the INFICON Service Center nearest you,
is available at www.inficon.com.
When you contact Customer Support, please have the following information readily
available:
The firmware version displayed at power-up for your instrument and software
version if you are calling about the optional applications software.
A description of your problem.
An explanation of any corrective action that you may have already attempted.
The exact wording of any error messages that you have received.
To contact Customer Support, see Support at www.inficon.com.
1.3.1 Returning Your Instrument to INFICON
Do not return any component of your instrument to INFICON without first speaking
with a Customer Support Representative. You must obtain a Return Material
Authorization (RMA) number from the Customer Support Representative.
If you deliver a package to INFICON without an RMA number, your package will be
held and you will be contacted. This will result in delays in servicing your
instrument.
Prior to being given an RMA number, you may be required to complete a
Declaration Of Contamination (DOC) form. DOC forms must be approved by
IPN 074-549-P1A
INFICON before an RMA number is issued. INFICON may require that the
instrument be sent to a designated decontamination facility, not to the factory.
Before returning your instrument, create a record of all user-entered parameters so
they may be re-entered, if required.
1 - 5
Page 18

SQM-242 Operating Manual
1.4 Specifications
1.4.1 SQM-242 Measurement
Crystal Frequency . . . . . . . . . . . . . . . . 1.0 MHz to 10.0 MHz
Frequency Resolution. . . . . . . . . . . . . 0.06 Hz @ 6 MHz
Reference Frequency Accuracy. . . . 0.002%
Reference Frequency Stability . . . . . ±2 ppm (0-50°C)
Thickness & Rate Resolution . . . . . . 0.027 Å, 0.044 Å/s @ 2 readings/s,
Thickness Accuracy . . . . . . . . . . . . . dependent on process conditions, especially
Measurement Technique . . . . . . . . . Active Oscillation
Number of Sensor . . . . . . . . . . . . . . 4
1.4.2 SAM-242 Inputs
material density = 2.7 gm/cc
sensor location, material stress, temperature
and density
Number of inputs . . . . . . . . . . . . . . . 4, non-isolated
Connectors. . . . . . . . . . . . . . . . . . . . BNC
Input Range . . . . . . . . . . . . . . . . . . . 0 to ± 10 V (dc)
Input Impedance . . . . . . . . . . . . . . . 20 k
Resolution . . . . . . . . . . . . . . . . . . . . 15 bit (plus sign)
1.4.3 SQM-242/SAM-242 Outputs
Number of inputs . . . . . . . . . . . . . . . 2, non-isolated
Connectors. . . . . . . . . . . . . . . . . . . . 1/4" Dual Phone Jack
Output Voltage . . . . . . . . . . . . . . . . . 0 to ±10 V (dc)
Source Impedance . . . . . . . . . . . . . . 1 k
Resolution . . . . . . . . . . . . . . . . . . . . 15 bit (plus sign)
1.4.4 Setup Parameters
Material Density . . . . . . . . . . . . . . . . 0.4 to 99.99 gm/cc
Ω
IPN 074-549-P1A
Ω
1 - 6
Z-Ratio . . . . . . . . . . . . . . . . . . . . . . . 0.50 to 25.00
Sensor Tooling . . . . . . . . . . . . . . . . . 0 to 399%
Full Scale Voltage. . . . . . . . . . . . . . . 0 to ±10 V
Page 19

SQM-242 Operating Manual
Power . . . . . . . . . . . . . . . . . . . . . . . . 0 to 100%
Slew Rate . . . . . . . . . . . . . . . . . . . . . 0 to 100%/s
P Term . . . . . . . . . . . . . . . . . . . . . . . 0 to 9999
I Term . . . . . . . . . . . . . . . . . . . . . . . . 0 to 99.9 s
D Term . . . . . . . . . . . . . . . . . . . . . . . 0 to 99.9 s
Rate . . . . . . . . . . . . . . . . . . . . . . . . . 0 to 999.9 s
Final Thickness . . . . . . . . . . . . . . . . 0 to 999.9 Å
Mode . . . . . . . . . . . . . . . . . . . . . . . . Normal or Simulate
Output Control . . . . . . . . . . . . . . . . . PID or Manual
Sensor/Output map . . . . . . . . . . . . . Any sensor can control any output
Analog/Output Map (SAM-242) . . . . Any analog input can control any output
Measurement Period . . . . . . . . . . . . 0.1 to 2 s
1.4.5 External Communications (SQS-242 only)
Serial Port. . . . . . . . . . . . . . . . . . . . . RS-232C
Baud Rates. . . . . . . . . . . . . . . . . 9,600; 19,200; 38,400;
Ethernet TCP/IP Port . . . . . . . . . . . . Static address, DHCP not supported.
1.4.6 Computer Requirements
Processor . . . . . . . . . . . . . . . . . . . . . 1 GHz Pentium IV or comparable
RAM . . . . . . . . . . . . . . . . . . . . . . . . . 256 MB RAM
Memory . . . . . . . . . . . . . . . . . . . . . . 30 MB hard disk space
Operating System. . . . . . . . . . . . . . . Windows 98/ ME/ NT/ 2000 SP4/ XP SP2/
7 32-Bit
IPN 074-549-P1A
Comm Port . . . . . . . . . . . . . . . . . . . . PCI Slot, Serial or USB for PLC I/O
communications (SQS-242 only)
1.4.7 General Specifications
SQM-242 Card Type . . . . . . . . . . . . PCI (32 bit, 5V, 33MHz)
SQM-242 Max. Cards/Computer . . . 6
SAM-242 Card Typer . . . . . . . . . . . . Slave to SQM-242 (ribbon cable)
SAM-242 Max. Cards/Computer . . . 1
Power Consumption . . . . . . . . . . . . . 5 W Max
1 - 7
Page 20

SQM-242 Operating Manual
1.4.8 Operating Environment
Usage. . . . . . . . . . . . . . . . . . . . . . . . Indoor only
Temperature. . . . . . . . . . . . . . . . . . . 0 to 50°C (32-122°F)
Humidity . . . . . . . . . . . . . . . . . . . . . . 0 to 80% RH. @ 31°C, non-condensing
Altitude . . . . . . . . . . . . . . . . . . . . . . . 0 to 2000 m
Installation (Overvoltage) . . . . . . . . . Category II
Measurement Category . . . . . . . . . . II
Pollution Degree. . . . . . . . . . . . . . . . 2
Equipment Type . . . . . . . . . . . . . . . . Class 1 (grounded type). Suitable for
Protection . . . . . . . . . . . . . . . . . . . . . Not protected against harmful ingress of
1.4.9 Storage Temperature
continuous operation
moisture
Storage Temperature . . . . . . . . . . . . -40 to 70°C (-40 to 158°F)
1.4.10 Warm Up Period
Warm Up Period. . . . . . . . . . . . . . . . None required;
For maximum stability allow 5 minutes.
1.4.11 Size
Not including user connectors
4.21 in. L x 5.91 in. W
(107 mm L x 150 mm W)
1.4.12 Connector Clearance Requirements
Rear . . . . . . . . . . . . . . . . . . . . . . . . . Less than 4.0 in. (102 mm)
1.4.13 Weight
1 card . . . . . . . . . . . . . . . . . . . . . . . . 0.2 kg / 0.4 lb.
IPN 074-549-P1A
1 - 8
Page 21

1.5 Unpacking and Inspection
1 If the SQM-242 card has not been removed from its packaging, do so now.
2 Carefully examine the card for damage that may have occurred during
shipping. This is especially important if you notice obvious rough handling on
the outside of the container. Immediately report any damage to the carrier and
to INFICON.
3 Do not discard the packing materials until you have taken inventory and have
at least performed successful installation.
4 Take an inventory of your order by referring to your order invoice and the
information contained in section 1.6.
5 To install the card, see Chapter 2, Installation.
6 For additional information or technical assistance, contact INFICON, refer to
section 1.3 on page 1-5.
1.6 Parts and Options Overview
SQM-242 Operating Manual
1.6.1 Base Configurations
SQM-242 Card . . . . . . . . . . . . . . . . . . . . .782-SQM-242
SQS-242 Software . . . . . . . . . . . . . . . . . .782-SQS-242, Optional
SAM-242 Card . . . . . . . . . . . . . . . . . . . . .782-SAM-242, Optional
Technical Manual . . . . . . . . . . . . . . . . . . .074-549 on 074-5000-G1 CD
1.6.2 Accessories
Each sensor requires an oscillator kit to interface to the controller:
SQM-242 10' Oscillator Kit . . . . . . . . 782-934-003-10
SQM-242 25' Oscillator Kit . . . . . . . . 782-934-003-25
IPN 074-549-P1A
SQM-242 50' Oscillator Kit . . . . . . . . 782-934-003-50
SQM-242 100' Oscillator Kit . . . . . . . 782-934-003-99
Above kits consist of oscillator 782-900-010, 6 inch BNC oscillator to feedthrough
cable 782-902-011 and BNC controller to oscillator cable 782-902-012-10,
782-902-012-25, 782-902-012-50 or 782-902-012-99. These kits are designed for
use with the standard in-vacuum cables ranging in length from 6 inches (15.2 cm)
to 36 inches (91.4 cm). The 007-044 standard in-vacuum cable supplied with the
front load style sensors are 30.75 inches (78.1 cm) long.
1 - 9
Page 22

SQM-242 Operating Manual
1.6.3 Sensors
Front Load Single Sensor . . . . . . . . . . . . . . . . . . . . SL-XXXXX
Front Load Dual Sensor . . . . . . . . . . . . . . . . . . . . . . DL-AXXX
Cool Drawer Single Sensor . . . . . . . . . . . . . . . . . . . CDS-XXFXX
Cool Drawer Dual Sensor . . . . . . . . . . . . . . . . . . . . CDD-XFXX
Sputtering Sensor. . . . . . . . . . . . . . . . . . . . . . . . . . . 750-618-G1
Front Load UHV Bakeable Sensor. . . . . . . . . . . . . . BK-AXF
NOTE: All shuttered sensors require a feedthrough with an air line and a
Pneumatic Shutter Actuator Control Valve. . . . . . . . 750-420-G1
NOTE: Multi-crystal (rotary) sensors should not be used with the SQM-242
NOTE: Consult individual sensor manuals for part muber configurations.
pneumatic shutter actuator control valve.
1 - 10
IPN 074-549-P1A
Page 23
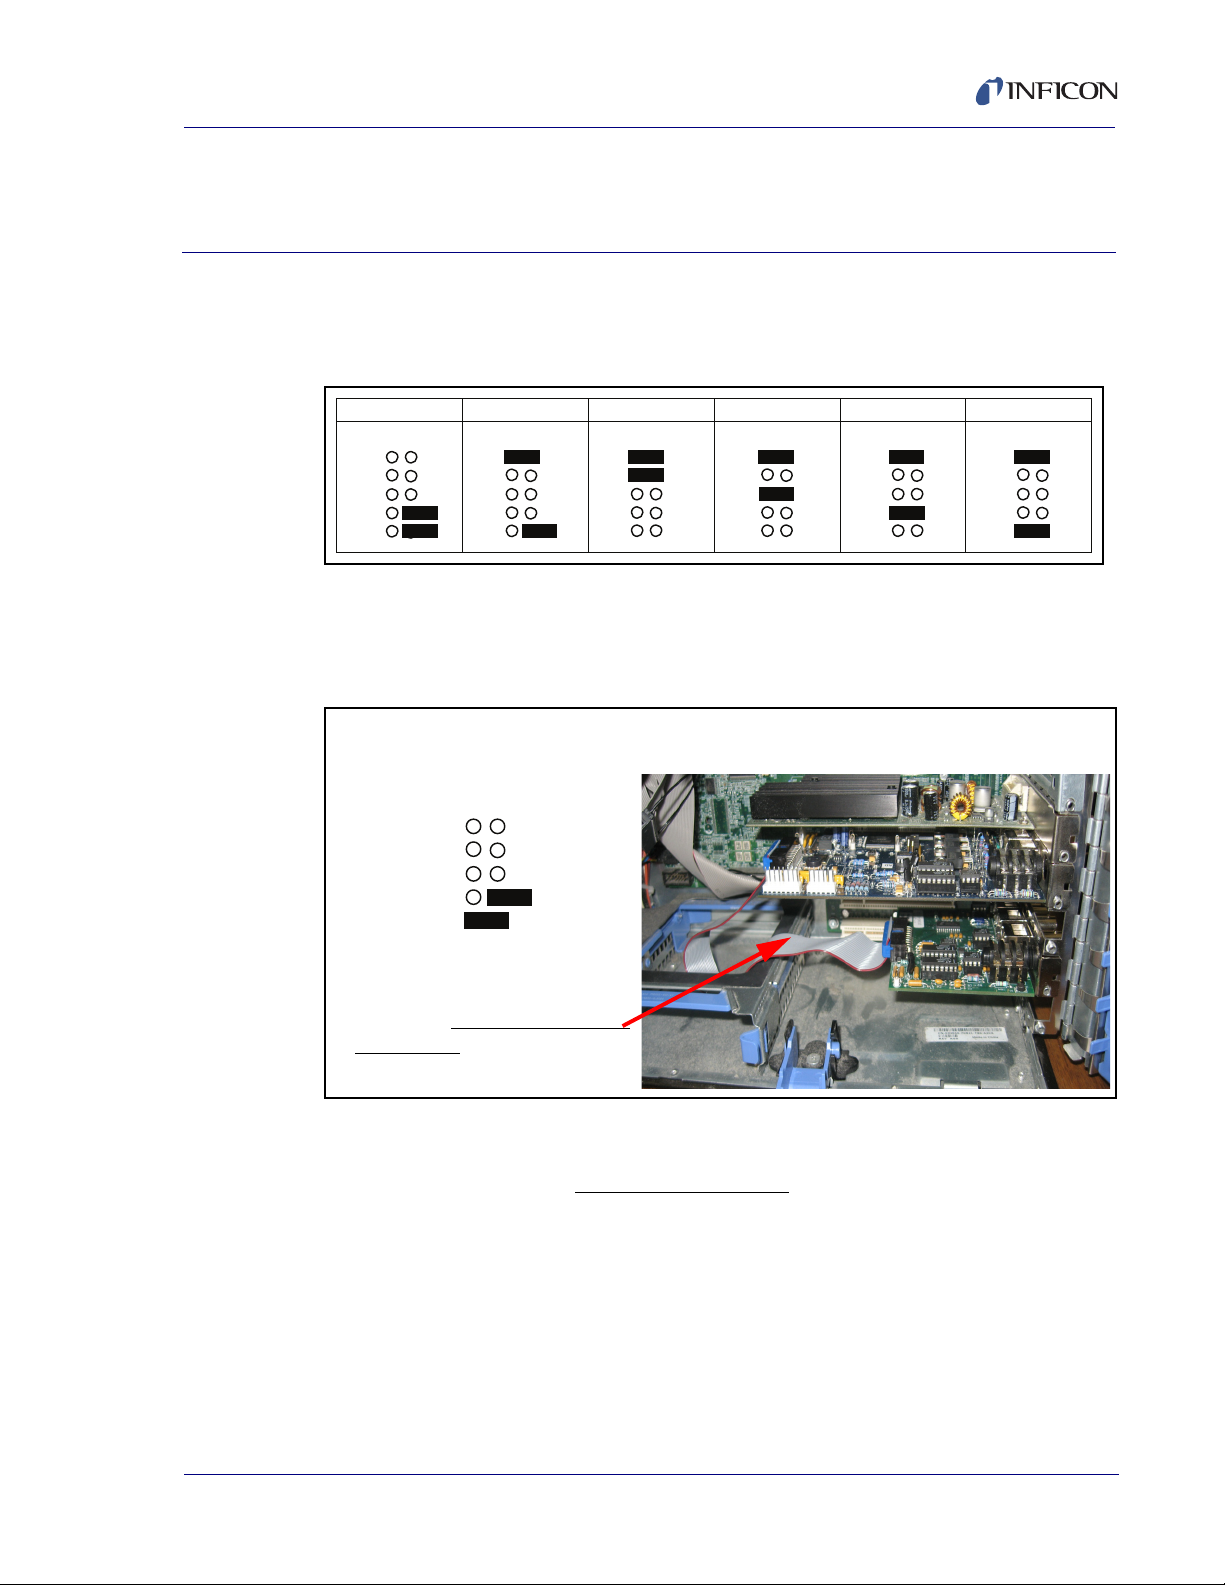
2.1 SQM-242 Card Installation
Card 1 Card 2 Card 3 Card 4 Card 5 Card 6
JP5 JP5 JP5 JP5 JP5 JP5
JP5
Card 1 Jumper
with SAM-242 Card installed
Card 1 with SAM-242
Ribbon Cable installed
The SAM-242 card can go on
either side of SQM-242 Card 1,
as long as
the ribbon cable is
not twisted (red stripe on one
side of both cards).
Jumper each SQM-242 card before installation as shown in Figure 2-1.
Figure 2-1 Jumper Configurations
If you are installing a SAM-242 analog piggyback card, it must be connected to
Card 1. Set the Card 1 jumper as shown in Figure 2-2 when the optional SAM-242
card is used.
SQM-242 Operating Manual
Chapter 2
Installation
IPN 074-549-P1A
Figure 2-2 SAM-242 Card Installation
Once each card is jumpered:
1 Turn off the computer, unplug the power cord, and remove the computer cover.
2 Locate an empty PCI slot and remove the screw holding the blank bracket for
the slot. Remove the blank bracket.
3 With the card’s gold contacts down, place it above the PCI slot with the BNC
connectors on the card extending through the back of the computer. Press
down on the card to seat it into the connector. Repeat with each card.
4 Replace the screw at the top of the card bracket to secure the card. Replace
the cover on the computer and plug in the power cord.
2 - 1
Page 24

SQM-242 Operating Manual
2.2 SQM-242 Driver Installation
1 Turn on the computer and start Windows. Windows will find new hardware and
prompt to Install Device Drivers.
2 If you are prompted for the location of the Device Drivers, insert the INFICON
CD-ROM and direct Windows to D:\SQM242 Card\SQM242_V100_DRIVERS
(assuming D is your CD drive).
3 When driver installation is complete, you may be prompted to restart your
computer.
4 Check the README.txt file in the \SQM242 Card\SQM242_V100_DRIVERS
folder of the INFICON CD-ROM for additional steps that are specific to your
version of Windows.
5 Verify that the card was installed properly in Device Manager. Right-click on My
Computer, then left-clicking on Properties. Click on the Device Manager tab
(Hardware tab in Windows 2000 or XP, then Device Manager). You should see
Sigma Instruments listed, with the SQM-242 cards in the sub folder.
If the card is not listed (or has a red x or yellow exclamation point), repeat the
installation procedures above carefully.
NOTE: Occasionally it may be necessary to completely uninstall and reinstall a
card. Highlight the improperly installed card in Device Manager and press
<Delete>. Next, run the "clean" program in the \SQM242
Card\SQM242_V100_DRIVERS folder of the INFICON CD-ROM. Reboot
the computer, then follow the steps above carefully.
2.3 Software Installation
SQM-242 Card programs are also on the INFICON CD-ROM. Insert the CD-ROM,
click the Windows Start button, and then select Run. Type D:\SQM242
Card\Setup.exe and click OK.
Accept the default installation prompts. When installation completes, you may be
prompted to restart your computer. This installer will install three programs:
SQM-242 CoDep, SQM-242 Monitor, and SQM-242 Multi.
To run the any software program, click Start, then Program, then Sigma
Instruments and select the program.
To verify the SQM-242 cards are properly installed, start SQM-242 CoDep. Select
the View menu, then Card Setup. If the card revision for each installed card is
greater than 0.00, then it is installed properly.
IPN 074-549-P1A
2 - 2
NOTE: If the version is shown as 0.00, then reinstall the Windows drivers as
explained in section 2.2. Pay particular attention to any Windows version
specific instructions in the README file.
Page 25
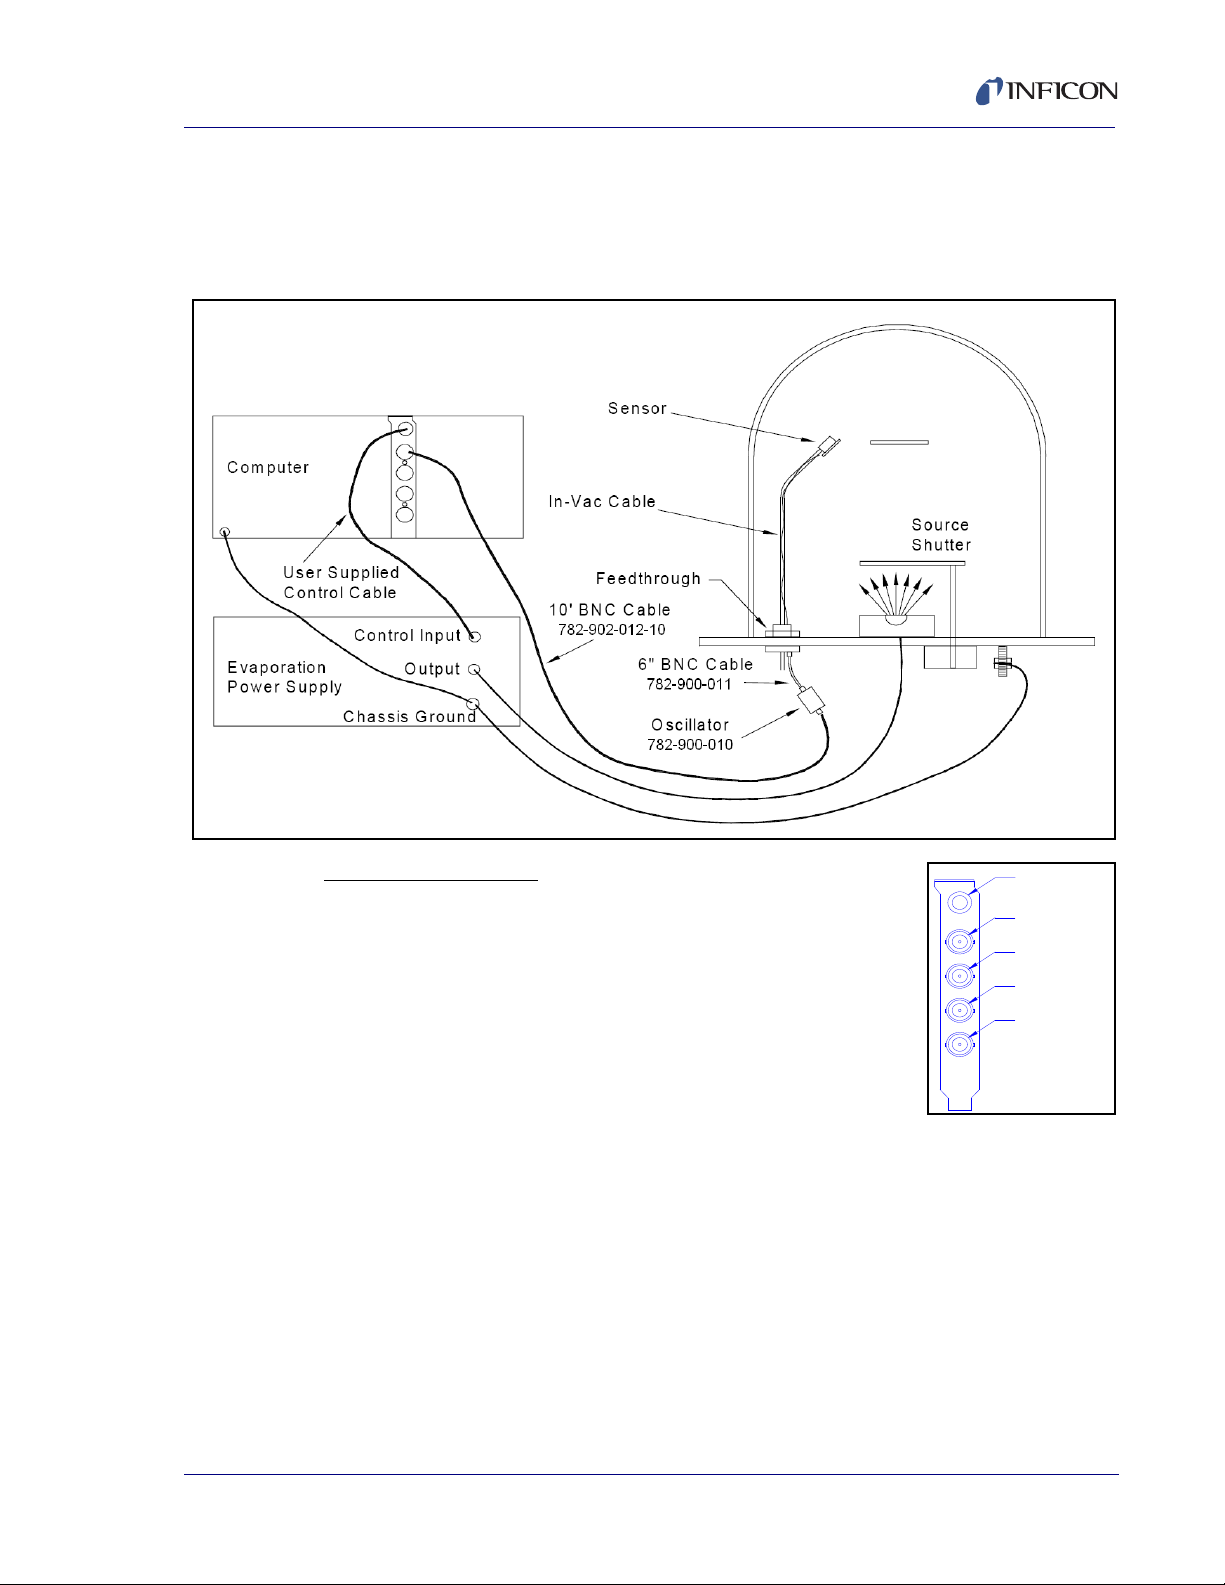
2.4 SQM-242 Card Connections
Sensor 1
Sensor 2
Sensor 3
Sensor 4
Power Supply
Control Outputs
The control output and sensor input connectors to the SQM-242 card are shown
below. Refer to this drawing in the subsequent hookup instructions.
Figure 2-3 SQM-242 Setup
SQM-242 Operating Manual
IPN 074-549-P1A
Sensor Connections
A BNC cable connects the SQM-242 sensor input to the
"instrument" connector on the remote oscillator. The
maximum length is 50 feet (15 meters).
To ensure proper operation of the SQM-242, use oscillators
manufactured by INFICON [PN 782-900-010].
The connection from the remote oscillator "feedthru"
connector to the vacuum chamber feedthrough is made using
a short 6 inch (15 cm) cable with BNC male to female
connectors [PN 782-902-011]. Inside the vacuum chamber, your in-vac cable must
be no longer than 36 inches (91.4 cm). It connects from the feed-through to the
crystal sensor.
NOTE: The SQM-242 will not work with INFICON ModeLock oscillators.
2 - 3
Page 26
SQM-242 Operating Manual
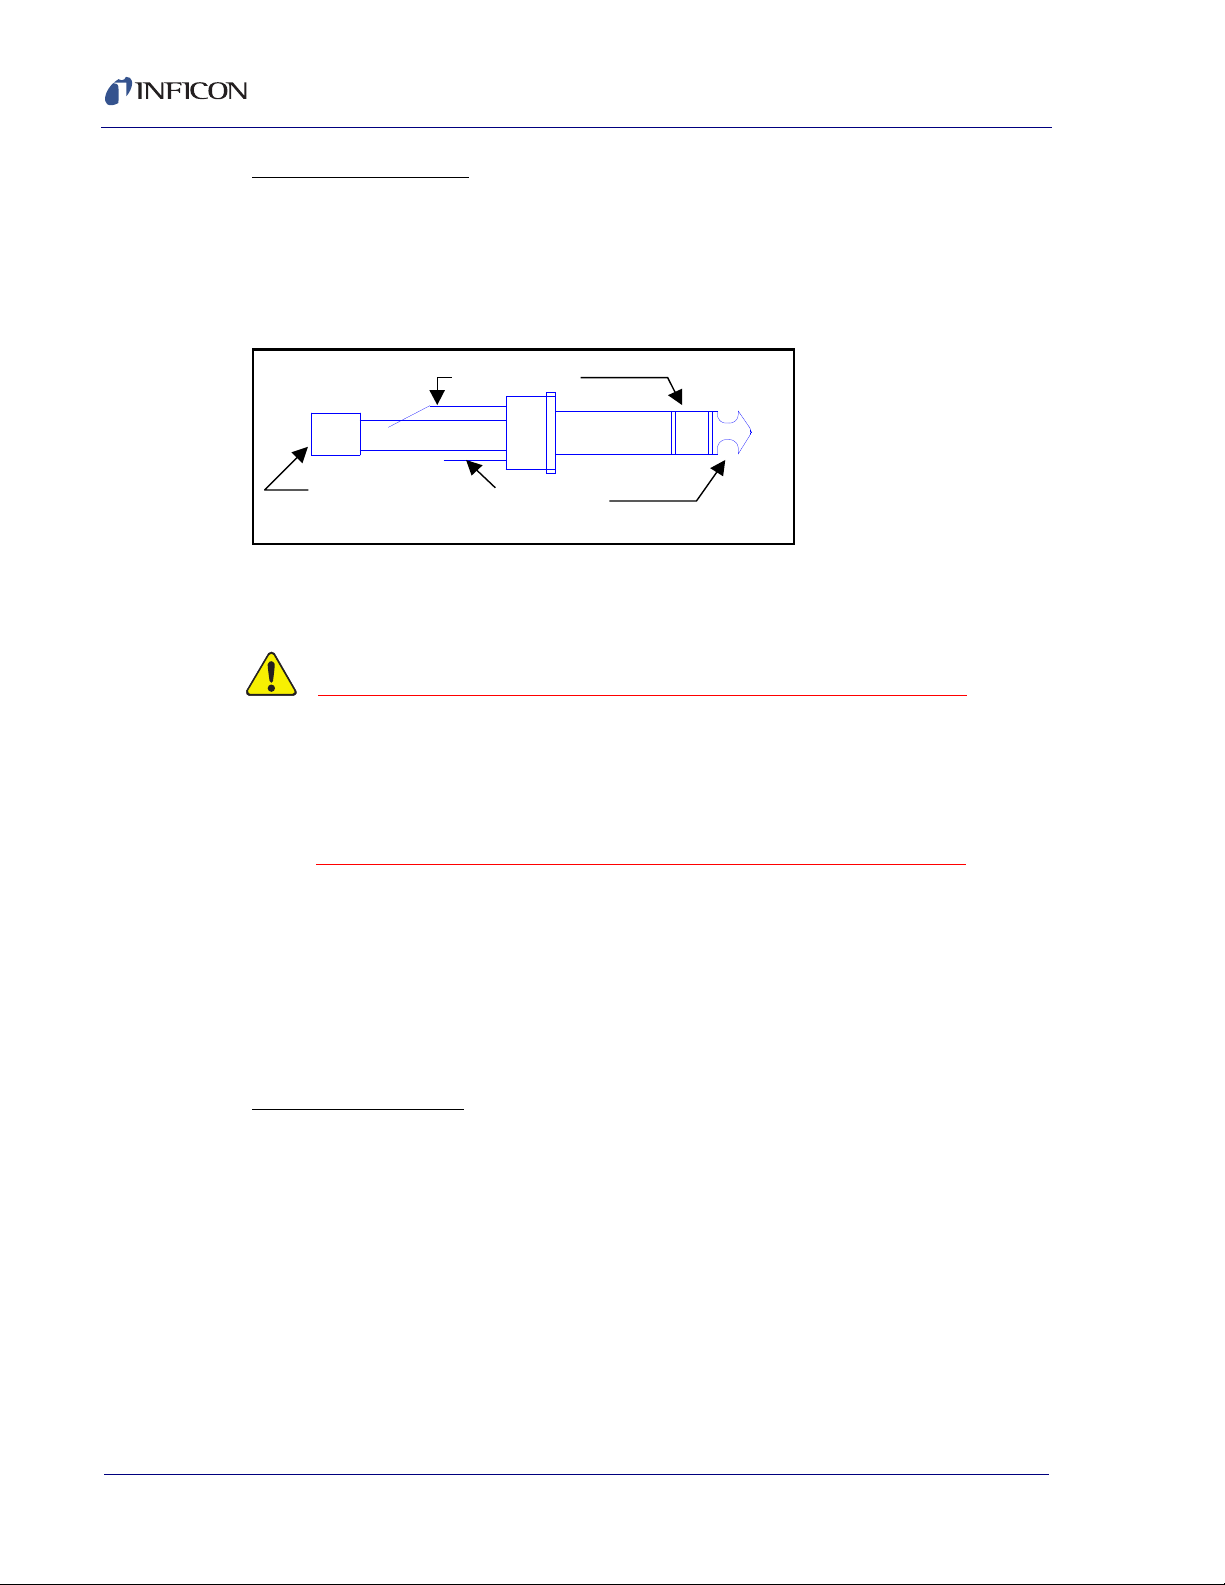
CAUTION
SLEEVE
Chan. 1 (Ring)
Chan. 2 (Tip)
Ground
(Sleeve)
Output Connections
The SQM-242 output connection is via a 1/4" Stereo Phone Jack. A standard 1/4"
Stereo Phone Plug is shown below (with outer collar removed to show the
contacts). Output 1 is on the ring, Output 2 is on the tip, and a common ground is
on the sleeve.
Figure 2-4 1/4" Stereo Phone Jack
Connect the SQM-242 output to your evaporation power supply, recorder, or other
equipment as described in the equipment’s operating manual.
Special care must be taken in connecting the SQM-242
card output to the input connector of your equipment.
Failure to understand and follow the equipment
manufacturer’s instructions can result in damage to the
equipment and/or SQM-242 card.
The SQM-242 output is 0 to +/- 10 V (dc). See section 3.3 of this manual for
instructions on setting the SQM-242 output Full Scale level to match your power
supply. If your equipment needs a 4-20 mA control signal, you must obtain a
voltage-to-current converter.
NOTE: If you are using the SQM-242 as a monitor only, no output connection is
needed.
Ground Connection
The chassis of all control components should be tied to a common earth ground
using a low resistance cable. This is particularly important in high noise E-Beam
systems.
IPN 074-549-P1A
2 - 4
Page 27
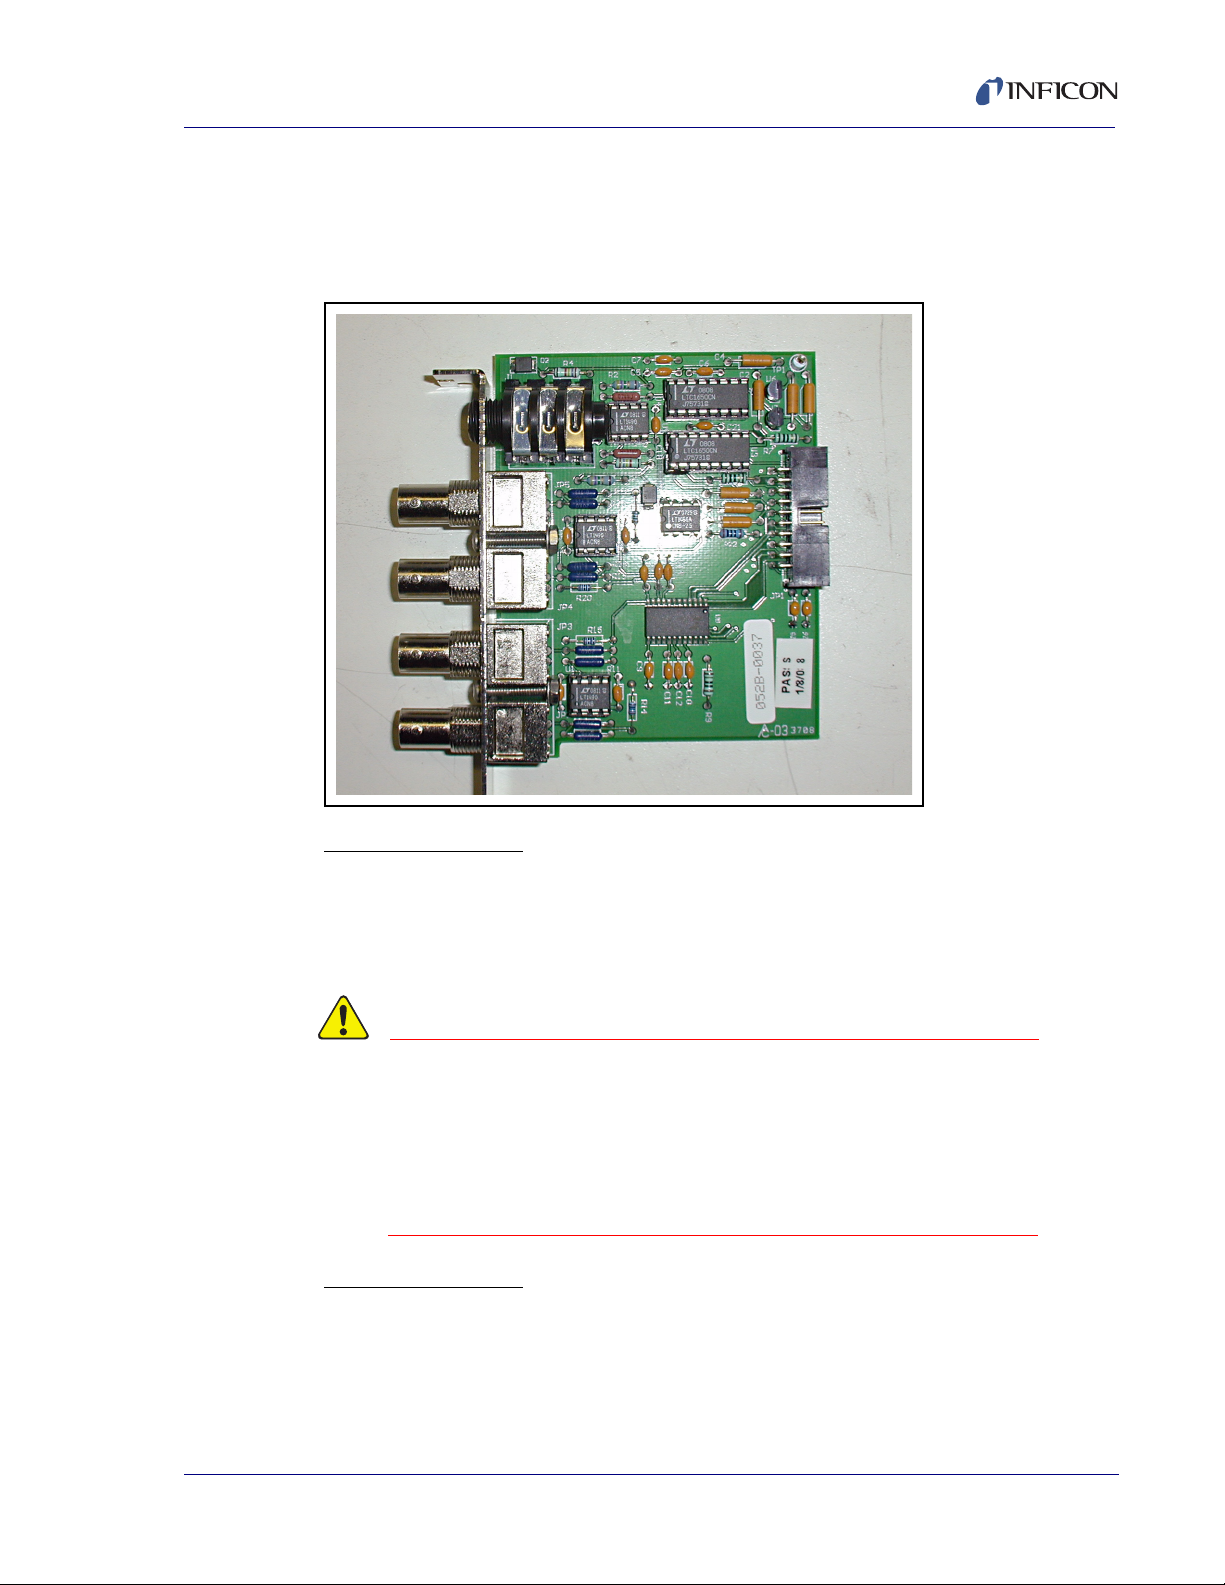
2.5 SAM-242 Card Connections
CAUTION
The input and output and connectors on the SAM-242 card are identical to those
on the SQM-242 card.
Figure 2-5 SAM-242 Card
SQM-242 Operating Manual
Input Connections
BNC cables connect the SAM-242 input to the signals to be measured. The
SAM-242 accepts input voltages within +/- 10 V (dc).
NOTE: You can not connect sensors to these inputs.
IPN 074-549-P1A
The BNC connector shield of each SAM-242 input is
connected to a common analog ground. Input signals to
the SAM-242 must be within +/-10 V (dc) and share a
common ground. Failure to observe this constraint can
result in damage to your equipment and/or the SAM-242
card,
Output Connection
The SAM-242 outputs are identical to the SQM-242. See the previous section for
hookup instructions.
2 - 5
Page 28

SQM-242 Operating Manual
2.6 Digital I/O
The SQM-242 card and SQM-242 software do not support the digital I/O required
to automatically open and close shutters, rotate source pockets, etc.
The optional SQS-242 Codeposition software adds this capability to the SQM-242
card. Using an inexpensive PLC, the SQS-242 software provides virtually unlimited
digital I/O capabilities.
Contact INFICON for more information on interfacing the SQM-242 card to your
system's digital I/O.
2 - 6
IPN 074-549-P1A
Page 29
3.1 Introduction
The SQM-242 CoDep program illustrates most of the capabilities of the SQM-242
card. It is intended as a learning tool for new users, and a programming example
for interfacing to user applications.
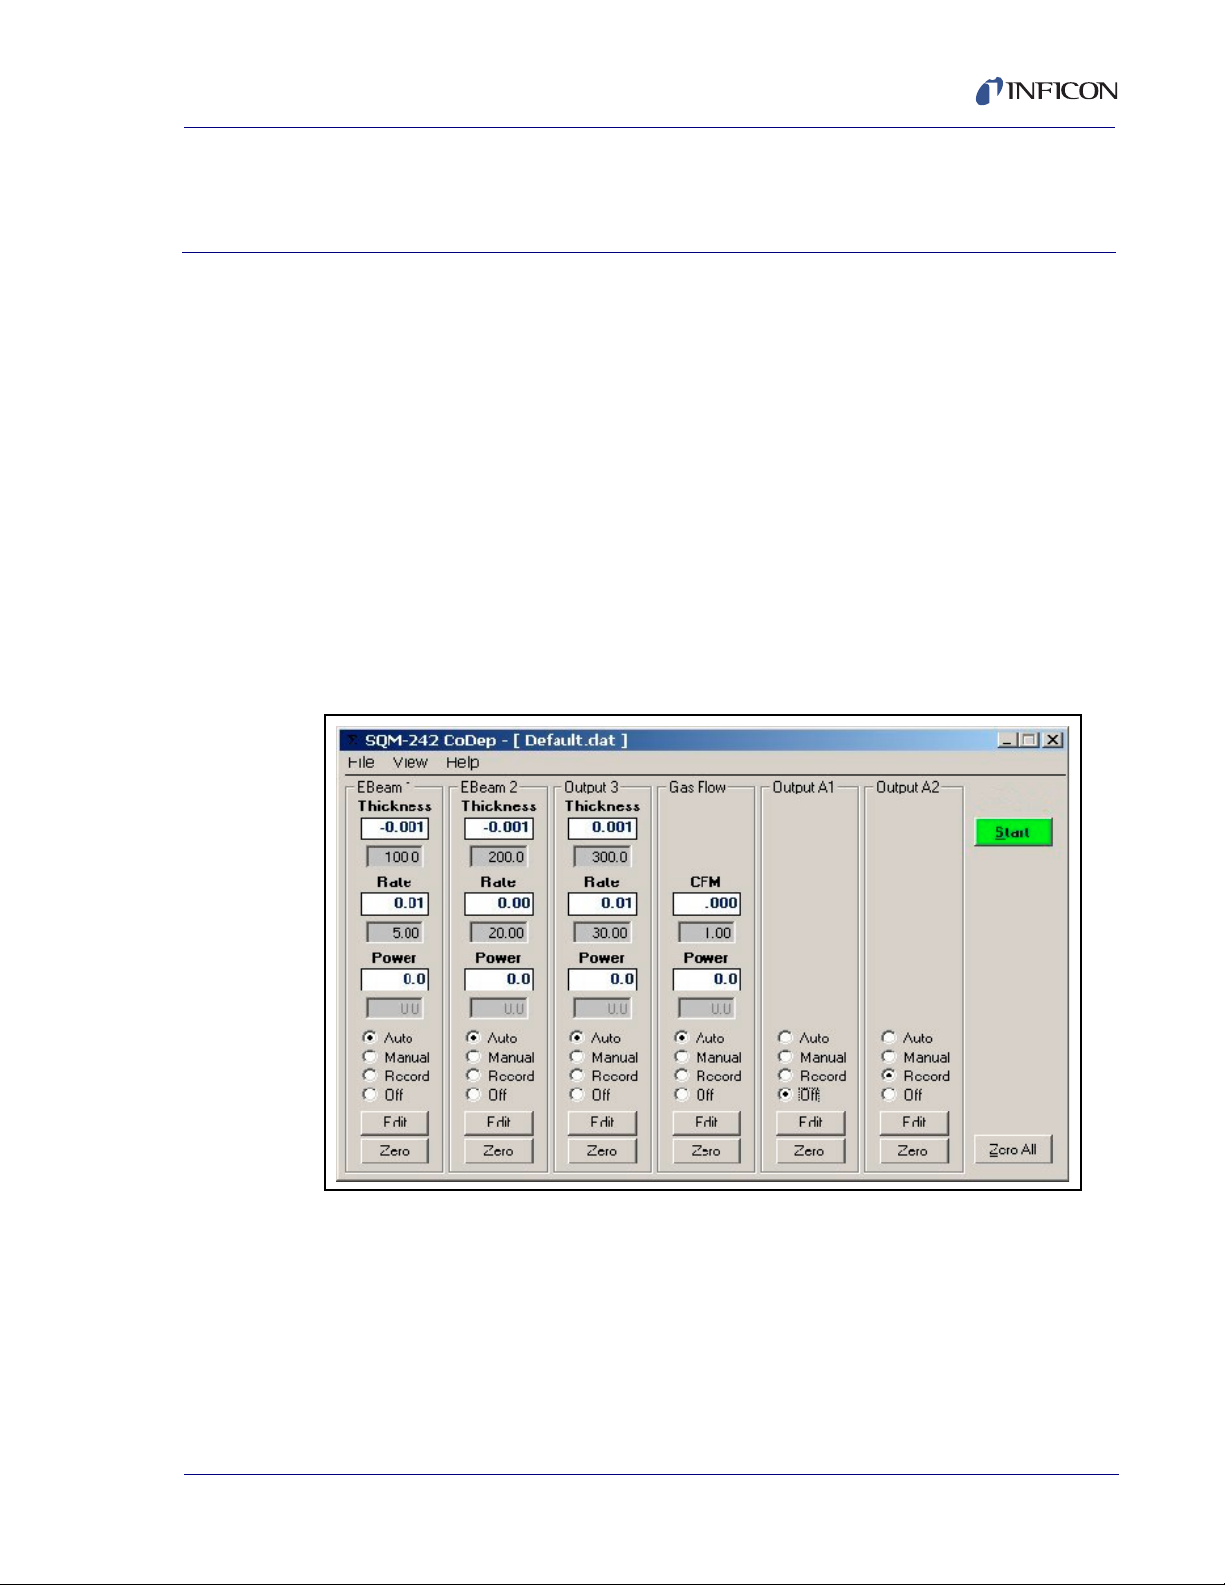
3.2 Main Dialog Box
With no cards installed (or with two SQM-242 cards and an SAM-242 card
installed) you will see the dialog box shown in Figure 3-1. The number of "output
frames" shown will change depending on the number of cards installed in your
system. For example, with only one SQM-242 card installed, the main dialog box
shows only two output frames.
SQM-242 Operating Manual
Chapter 3
SQM-242 CoDep
Figure 3-1 SQM-242 Codep Main Dialog Box
IPN 074-549-P1A
Each output frame corresponds to a physical output on an SQM-242 card. In Figure
3-1, the first three outputs are each configured to use quartz sensors to measure
rate and thickness.
The frame labeled "Gas Flow" is a little different. This output uses an analog input
on the SAM-242 card to control backfill gas. The SAM-242 card can use any analog
voltage for control. More about this feature later.
3 - 1
Page 30

SQM-242 Operating Manual
Output A1 above is turned off, while Output A2 is used as a recorder output. The
output labels are easily edited to provide descriptive names. Dialog boxes within
each output frame will change, depending on the function of that output.
Outputs configured for quartz sensor inputs, like the first three in the sample dialog
box, display rate and thickness information. The first display is the Thickness
Measurement for the material (in kÅ). Immediately below the Thickness
Measurement display is the Thickness Setpoint setting. You can edit the Thickness
Setpoint at any time. When the Thickness Reading reaches the Thickness
Setpoint, the deposition will stop.
NOTE: To adjust a Setpoint, click on the setting and type a new setting. Press
<Enter> to send the setting without moving to another field. To move to
another field, use the <Tab> key or your mouse. Each time you move to
another field, the setting is updated.
Below the thickness displays are the Rate Reading and Rate Setpoint displays (in
Å/s). In Auto mode, the SQM-242 control loop continuously adjusts the output
power to maintain the deposition Rate Reading at the desired Rate Setpoint.
Below the rate displays are the output Power Reading and manual Power Setpoint.
The Power Reading displays the current output power (in % Full Scale). In Manual
mode, the Power Setpoint can be edited to manually adjust output power.
The option buttons control the function of each output. As mentioned previously,
Auto mode uses a PID control loop to control rate. Manual mode, allows you to
manually adjust the output power. That can be useful for material preconditioning
or error conditions.
The Record button configures the output as an analog recorder. A recorder output
provides a signal that is proportional to thickness, rate, power, or analog voltage.
Finally, the Off button sets the output to 0 volts and hides the displays.
Start/Stop . . . . . . . . . . . . . . . . . . . . When Start is displayed, starts SQM-242
readings and PID output control. When Stop
is displayed, stops readings and sets the
power outputs to zero. When Stop is
displayed, a Hold button is also visible.
Hold/Resume . . . . . . . . . . . . . . . . . Clicking Hold sets all output power levels to
zero, and changes the button legend to
Resume. Clicking Resume continues
deposition without zeroing thickness.
Zero All . . . . . . . . . . . . . . . . . . . . . . Sets all material (i.e., output) thickness
readings to zero.
Zero . . . . . . . . . . . . . . . . . . . . . . . . . Sets the selected material thickness reading
to zero.
IPN 074-549-P1A
3 - 2
Edit . . . . . . . . . . . . . . . . . . . . . . . . . Displays a dialog box with additional settings
for an output.
Page 31

3.3 Edit: Auto/Manual Mode
When Edit is clicked while Auto or Manual mode is selected, a dialog box is
displayed which contains additional output control settings.
NOTE: The type of dialog box displayed depends on whether the output is
configured as a control output (Auto/Manual/Off), or as a Recorder output.
See the next section for information on recorder outputs.
These controls are common to most dialog boxes in the program:
OK . . . . . . . . . . . . . . . . . . . . . . . . . . Saves the settings in the dialog box, sends
Cancel . . . . . . . . . . . . . . . . . . . . . . . Closes the dialog box without saving the
Update . . . . . . . . . . . . . . . . . . . . . . . Saves the settings in the dialog box, sends
SQM-242 Operating Manual
them to the SQM-242 card, and closes the
dialog box.
settings or sending them to the SQM-242
card.
them to the SQM-242 card, but does not
close the dialog box.
Figure 3-2 Output Edit Dialog Box
IPN 074-549-P1A
Input. . . . . . . . . . . . . . . . . . . . . . . . . Selects the sensor(s) or analog input used as
an input to the output’s PID control loop.
Click Sensors to configure the loop for quartz sensor inputs. If more than one
sensor is selected, their averaged rate and thickness readings are used by the PID
control loop and displayed on the main dialog box.
If an analog input is selected, quartz sensors are disabled. Only a single analog
input can be selected. Analog inputs extend deposition control to non-quartz
sensor inputs.
3 - 3
Page 32

SQM-242 Operating Manual
Perhaps you want to control a backfill gas during deposition. You can use an
analog input to measure pressure from a manometer, and the control output to
drive a gas flow valve. You can still use one or more quartz sensors to measure
and control deposition of your EBeam or thermal power supply.
In another example, you might want to control deposition rate by controlling
temperature. You can assign an analog input to a control output measure and
control temperate, then use a quartz sensor as a final thickness setpoint monitor.
If you select a sensor or analog input that is already assigned to another output, an
error message will be displayed when you try to update the configuration. You will
have the choice of abandoning the change, or overriding the previous
configuration. Your choice could leave a control output with no inputs. In that case,
output power is fixed at 0%.
NOTE: The sensor or analog input selected does not have to be on the same
SQM-242 or SAM-242 card as the control output.
Full Scale . . . . . . . . . . . . . . . . . . . . The output voltage that corresponds to 100%
output power. Full scale values to +/-10 volts
are possible. The full scale output voltage is
a function of your power supply input
specifications.
Max Power . . . . . . . . . . . . . . . . . . . The maximum output power allowed for an
output, in percent of full power. This limits the
maximum % of Full Scale voltage that will be
sent to the source supply.
NOTE: In Simulate mode at least 55%
power is required to simulate
deposition. This simulates a
minimum power that might be
required to vaporize a material.
Slew Rate . . . . . . . . . . . . . . . . . . . . The maximum % Full Scale power change,
per second, allowed on an output during PID
control.
P Term . . . . . . . . . . . . . . . . . . . . . . . The proportional term sets the gain of the
control loop. High gains yield more
responsive, but potentially unstable, loops.
Try a value of 25, then gradually
increase/decrease the value to respond as
desired to step changes in the rate setpoint.
I Term . . . . . . . . . . . . . . . . . . . . . . . The integral term controls the time constant
of the loop. A small I term, say .5 to 1
seconds, will smooth the response and
minimize overshoot to step changes.
IPN 074-549-P1A
3 - 4
Page 33

D Term . . . . . . . . . . . . . . . . . . . . . . . The derivative term causes the loop to
Name . . . . . . . . . . . . . . . . . . . . . . . . It may be helpful to give an output a more
3.4 Edit: Recorder Mode
When Recorder mode is selected for an output, the output is not controlled by the
PID loop. Instead, the output supplies a voltage that is proportional to an input
value.
Figure 3-3 Recorder Edit Dialog Box
SQM-242 Operating Manual
respond quickly to changes. Use 0 or a very
small value to avoid oscillations.
meaningful name—perhaps the material
being deposited or the evaporation supply
being controlled.
Input. . . . . . . . . . . . . . . . . . . . . . . . . Selects the sensor, analog input, or control
output that is being measured. Only one
input can be selected.
IPN 074-549-P1A
Output . . . . . . . . . . . . . . . . . . . . . . . The recorder output voltage can vary from
0 V to +/-10 V. Output (Full Scale) establishes
the measured value on the Input that will
generate a Full Scale (+/-10 V) output. In the
sample above, a measured rate of 10 Å/s will
generate a 10 V recorder output. If you select
1000 kÅ, then a measured thickness of 1000
kÅ will generate a 10 V output to the
recorder.
3 - 5
Page 34

SQM-242 Operating Manual
Input Reading . . . . . . . . . . . . . . . . . Displays the measured value of the selected
Output Reading . . . . . . . . . . . . . . . The output voltage currently supplied to the
3.5 File Menu
Open . . . . . . . . . . . . . . . . . . . . . . . . Selects a setup (.DAT) file to be used for thin
Save As . . . . . . . . . . . . . . . . . . . . . . Saves the current setup to disk. It can
input. The units of the input reading are
determined by the type of measurement
(rate, thickness, power, or voltage) selected
for the recorder output.
recorder by the recorder output.
film deposition.
replace the information in the current file or
be saved under a different name. Multiple
setups can be saved as different files. This is
convenient for storing different
configurations, materials, rates, etcetera.
Exit. . . . . . . . . . . . . . . . . . . . . . . . . . Exits the SQM-242 program. Before closing
3.6 View Menu
3.6.1 View Menu: Readings
Selecting the View menu, then Readings, displays a grid of all sensor and analog
inputs. It also provides a convenient place to view the overall input/output
configuration of your system. See Figure 3-4.
Figure 3-4 Input Readings
the program, you are prompted to save
changes. Select Yes to overwrite the current
setup (.DAT) file, no to abandon any
changes, or Cancel to return to the program.
IPN 074-549-P1A
3 - 6
Unlike the main dialog box, which may show the average of several sensors
assigned to an output, this dialog box displays raw input readings. The size of the
grid is adjusted to display only the components installed in your system.
Page 35

In the sensor grid, the Life column displays the % life remaining for each sensor,
based on the sensor Min/Max values entered in the Setup dialog box.
In the analog input grid, two readings are displayed. Volts shows the measured
voltage on the analog input, while Units displays the reading in the units displayed
on the main dialog box (i.e., CFM). The next section explains how to define analog
input units.
The last column shows the function assigned to each input-output control, setpoint
monitor, or unassigned. If an input is assigned to a control loop, that output is listed.
An input assigned as a setpoint monitor (see the next section) shows Monitor. If
an input is assigned as both a control input and a setpoint monitor, only the control
function is listed. Unassigned inputs show None.
3.6.2 View Menu: Input Setup
The Input Setup dialog box configures each input on the SQM-242 and SAM-242
cards. See Figure 3-5.
Inputs are numbered consecutively, starting with Card 1 (Sensors 1 to 4), then
Card 2 (Sensors 5 to 8), etcetera. The SAM-242 analog input card is shown as
Analog 1 to 4.
SQM-242 Operating Manual
Figure 3-5 Input Setup Dialog Box
IPN 074-549-P1A
3 - 7
Page 36

SQM-242 Operating Manual
Substrate
Substrate
Tooling
Over 100%
Tooling
Sensors Frame . . . . . . . . . . . . . . . . Settings in this frame control a sensor’s
calculation of rate and thickness. They also
allow a sensor to be assigned as a Final
Thickness monitor, independent of any
output control assignment.
Density . . . . . . . . . . . . . . . . . . . . . . The density of the material measured by this
quartz sensor, in grams per cubic centimeter.
Material density can be found in Table A-1
and numerous handbooks.
Z-Ratio. . . . . . . . . . . . . . . . . . . . . . . Z-Ratio compensates for the mechanical
stress a material causes to the quartz crystal.
Z-Ratio has an effect only during the last 70%
of crystal life. If you cannot find the Z-Ratio of
a material, set the value to 1 and change
crystals when the crystal Life approaches
70%. See Table A-1 for known values of
some materials.
Tooling . . . . . . . . . . . . . . . . . . . . . . Adjusts for measured deposition rates that
differ from the actual substrate deposition
rate. If the sensor sees only 50% of the
substrate rate, set the value to 200. This
multiplies the sensor reading by 2. Use
Figure 3-6 as a general guard for
approximating tooling factor.
Figure 3-6 Tooling Factor Approximation
IPN 074-549-P1A
Under 100%
3 - 8
Page 37

SQM-242 Operating Manual
Sensor 1 Controls
Material 1 Rate
Sensor 2 Controls
Material 2 Rate
Sensor 3 Monitors
CoDeposited Material
Monitor . . . . . . . . . . . . . . . . . . . . . . Monitor sensors halt deposition when their
Thickness setpoint is reached.
Figure 3-7 Sensor Setup
Often sensors are configured to tightly control the deposition rate of a material,
such as Sensor 1 & 2 above. However, you might also use a monitor sensor near
the substrate, to more accurately monitor the final thickness of the co-deposited
material.
Setpoint . . . . . . . . . . . . . . . . . . . . . . The material thickness (in kÅ) measured by a
monitor sensor that will halt deposition.
Analog . . . . . . . . . . . . . . . . . . . . . . . The SAM-242 analog input card measures
DC voltages in the +/-10 volt range. These
voltages may represent temperature, flow, or
any other process variable. The analog
frame allows you to modify the display to
show values in the desired units, using a
linear (y = mx + b) transformation.
IPN 074-549-P1A
Assume you have a temperature transmitter
that sends 0 V at 0°C and 10 V at 100°C. You
want to control temperature to 200°F (it’s an
example!). Set the analog input Gain to 18,
Offset to 32, and Units to Deg F (F = 9/5C +
32). The SQM-242 will display setpoints and
measurements associated with the analog
input in degrees F.
To leave the analog input display in Volts, set
Gain = 1 and Offset = 0.
3 - 9
Page 38

SQM-242 Operating Manual
Gain . . . . . . . . . . . . . . . . . . . . . . . . . The gain term for transforming voltage to
measured units. This is the m term in
y = mx + b.
Offset. . . . . . . . . . . . . . . . . . . . . . . . The offset term for transforming voltage to
measured units. This is the b term in
y = mx + b.
Units . . . . . . . . . . . . . . . . . . . . . . . . The units that you wish to display for the
analog input.
Monitor . . . . . . . . . . . . . . . . . . . . . . An analog input can also act as a monitor to
stop deposition. For example, an analog
signal from an optical monitor could stop
deposition when a certain voltage is reached.
A voltage input from a pressure transducer
might also prevent deposition until a certain
vacuum is reached.
Setpoint. . . . . . . . . . . . . . . . . . . . . . The voltage measured by a monitor input that
will halt deposition. Analog setpoints are
entered in Volts, not calculated units!
3.6.3 View Menu: Card Setup
This dialog controls the most basic functions of the SQM-242 card. It also provides
useful installation and troubleshooting information.
Simulate . . . . . . . . . . . . . . . . . . . . . Normally the SQM-242 card uses the quartz
Card 1, Card 2, Analog. . . . . . . . . . Shows the firmware revision of each installed
crystals as inputs for controlling the source
outputs. The SAM-242 card uses analog
input voltages for control. Simulate mode
simulates these inputs. No SQM-242 or
SAM-242 card needs to be installed for the
simulate mode.
IPN 074-549-P1A
card. A value of 0.00 indicates that the card
is not seen by the software, and is probably
not installed properly in Windows. See
Chapter 7, Troubleshooting and
Maintenance.
3 - 10
Page 39

SQM-242 Operating Manual
Frequency . . . . . . . . . . . . . . . . . . . . The frequency values for the quartz crystal
sensors used as inputs to the SQM-242.
Sensor readings outside the Max/Min values
cause a crystal fail error. Values 1 MHz to
10 MHz are permitted, but 6 MHz crystals are
most common.
Min/Max values are also used to calculate
the % Life remaining on the sensor dialog
box. For 6 MHz crystals, set the Max value to
the highest possible new crystal frequency
(typically 6.1 MHz). Set the Initial frequency
to the nominal new crystal frequency
(6 MHz). Set Min Frequency to the lowest
useable crystal frequency (typically 5 MHz).
Keep in mind that some materials cause
premature crystal failure.
Period . . . . . . . . . . . . . . . . . . . . . . . Sets the measurement period between
0.2 seconds (5 readings per second) and
2 seconds. A longer period gives higher
reading accuracy, especially in low rate
applications.
Filter. . . . . . . . . . . . . . . . . . . . . . . . . Sets the number of readings used in the
reading filter. A low setting gives rapid
response to process changes, high settings
give smoother readings.
Log to File . . . . . . . . . . . . . . . . . . . . Enables data logging to disk. Enter a
filename without path to save data in the
application directory. Enter a full path to save
data in another directory. Data is saved in
comma delimited format easily imported
import into any spreadsheet.
IPN 074-549-P1A
3 - 11
Page 40

SQM-242 Operating Manual
This page is intentionally blank.
3 - 12
IPN 074-549-P1A
Page 41

4.1 Introduction
The SQM-242 Monitor program is a version of SQM-242 CoDep that has been
streamlined for monitor-only applications. With SQM-242 Monitor you enter sensor
Density, Tooling, and Z-Ratio (Z-Factor) parameters, then click Start to begin taking
readings.
Figure 4-1 SQM-242 Monitor Main Dialog Box
SQM-242 Operating Manual
Chapter 4
SQM-242 Monitor
Since this is a monitor-only program, there are no settings for output control. The
Setup dialog box contains only monitor-related functions. Simulate mode is not
available because it would provide no additional information.
Figure 4-2 Monitor Setup Dialog Box
IPN 074-549-P1A
Capabilities to save setup parameters and log data to the hard disk are identical to
those of SQM-242 CoDep.
4 - 1
Page 42

SQM-242 Operating Manual
This page is intentionally blank.
4 - 2
IPN 074-549-P1A
Page 43

5.1 Introduction
The SQM-242 Multi program extends the capabilities of the SQM-242 CoDep
program to include up to six SQM-242 cards. With the SQM-242 Multi program, you
can monitor up to twenty four sensors and control up to 12 source outputs.
Figure 5-1 SQM-242 Multi Main Dialog Box
SQM-242 Operating Manual
Chapter 5
SQM-242 Multi
IPN 074-549-P1A
On startup, the program displays the firmware revision of each card that is properly
installed. If an SQM-242 is installed, but no revision (e.g., Card 1: 2.00) is
displayed, then consult the card installation section of this manual (refer to
section 2.1, SQM-242 Card Installation, on page 2-1).
Operation of the SQM-242 Multi program is very similar to SQM-242 CoDep. Refer
to the previous chapter for descriptions of the parameter settings and readings text
boxes (refer to Chapter 3, SQM-242 CoDep).
5 - 1
Page 44

SQM-242 Operating Manual
5.2 Operation
Send All. . . . . . . . . . . . . . . . . . . . . . Sends all of the stored parameters to the
Show Sensors / Show Outputs . . . Toggles the card reading area between
Read/Stop . . . . . . . . . . . . . . . . . . . . Starts and stops the SQM-242 card(s) from
SQM-242 card(s) in preparation for a Read
command. Normally you will click Send All to
initialize the card, then make individual
Sensor and Output setting changes as
needed. Current settings are stored in an INI
file in the application directory on exit from
the program.
displaying individual sensor readings, and
the average of all sensors assigned to an
output.
measuring and controlling deposition. When
the card is stopped, all outputs are set to
zero.
Mode . . . . . . . . . . . . . . . . . . . . . . . . Alternates between reading sensors and
simulating sensor readings. Simulate mode
is useful for training purposes, since no
sensors (or even an SQM-242 card!) need to
be installed.
In Simulate mode, sensors will not indicate a
rate reading until the output power reaches at
least 50%. Also, we introduce some noise
into the readings in Simulate to better mimic
an actual deposition process.
Init . . . . . . . . . . . . . . . . . . . . . . . . . . Enter card initialization values, then press
the Init button to send the values to the
SQM-242 card(s). This must be done before
sending any other settings. The values will
be saved on exit from the program.
Zero . . . . . . . . . . . . . . . . . . . . . . . . . Sets the thickness reading of the selected
sensor to zero. You can select a specific
sensor to zero all sensors on a card, or all
sensors on all cards using the Card/Sensor
dropdown boxes. First select the sensor to
be zeroed, then click Zero.
IPN 074-549-P1A
5 - 2
Page 45

SQM-242 Operating Manual
Map Sensors . . . . . . . . . . . . . . . . . . Assigns each sensor to an output. If a sensor
is assigned to Monitor, then it displays rate
and thickness, but does not contribute to the
control of any output to rate setpoint. If a
single sensor is assigned to an output, and
the output mode is set to PID, then that
sensor serves as the "measured rate" input
to the PID loop. If multiple sensors are
assigned to an output, then the average of all
assigned sensors is used as the "Measured
rate" input to the PID loop. If multiple sensors
are assigned to an output and a sensor fails,
it is automatically excluded from the average.
Material . . . . . . . . . . . . . . . . . . . . . . Sends the Density, Z-Ratio (Z-Factor), and
Tooling parameters to the selected sensor(s).
Manual/PID . . . . . . . . . . . . . . . . . . . Sets the output mode for the selected
output(s). In PID mode, output power is
controlled by the output Loop settings, to
achieve the desired Rate setpoint.
In Manual Power mode, output power is fixed
at the Power setting. To change the output
power in ManPwr mode, enter a new Power
value then click Set Power. Alternates Sends
the Density, Z-Ratio and Tooling parameters
to the selected sensor(s).
Loop. . . . . . . . . . . . . . . . . . . . . . . . . Sends the PID and rate setpoint parameters
to the SQM-242 card(s).
FullScale . . . . . . . . . . . . . . . . . . . . . Sends the Full Scale Volts, Maximum Power,
and Slew Rate parameters to the SQM-242
card(s).
IPN 074-549-P1A
5 - 3
Page 46

SQM-242 Operating Manual
This page is intentionally blank.
5 - 4
IPN 074-549-P1A
Page 47

SQM-242 Operating Manual
Function
Calls
Properties
Methods
Events
SQM242a DLL
Any
Windows
Program
RS-232
Ethernet
ActiveX
SQM242a Class
RS-232
2 Control Outputs
(per card)
4 Sensor Inputs
(per card)
Digital I/O
(PLC)
SQS-242
Deposition
Program
SQM242
PCI Card
(up to six)
Chapter 6
Communications
6.1 Introduction
The diagram below illustrates basic concepts for interfacing to the SQM-242 card.
Figure 6-1 Communications Diagram
IPN 074-549-P1A
Communications with the SQM-242 card are through a 32 bit DLL, SQM242a.DLL,
placed in the Windows system directory. This is a standard DLL, which does not
require registration.
A description of each DLL function is listed later in this Chapter. The Visual Basic,
C, and LabVIEW programs on the CDROM demonstrate the syntax for calling the
DLL.
You can also use the optional SQS-242 deposition control program as the user
interface. This program provides multi-layer processes, graphing, data logging,
and digital I/O. It can be controlled from your application by sending just a few
ASCII text commands. This is an excellent option if you have an application that
already communicates with a stand alone deposition controller via RS-232.
Contact INFICON for more information regarding the optional SQS-242 deposition
control program.
6 - 1
Page 48

SQM-242 Operating Manual
If you have the SQS-242 deposition control program, first run the SQS-242
program, then start the SQS242 Comm program, and go to the Utility tab. Select
ActiveX, then Version, and click Send. You will see the Version 3.XX response from
the SQS-242 program (including header and checksum characters). The same
ASCII commands are used to control the SQS-242 program from a different
computer via RS-232 or Ethernet.
6.2 DLL Functions
In the function descriptions below, "long" indicates a 32 bit integer, "double"
indicates a double precision real. Array parameters require a pointer to the first
element of the array (standard C calling convention).
NOTE: These function definitions are for SQM242A.DLL, which supports up to
6 SQM-242 cards and the SAM-242 card. Contact INFICON for
information on interfacing to the older SQM242.DLL.
Sif142Startup2 (long Mode, long CardStatus (0 to 7))
Loads the DLL and initializes the card. Must be called with Mode=0 before any
other function. The card status parameter is an array that returns card installation
status information
Mode . . . . . . . . . . . . . . . . . . . . . . . . -1 unloads the DLL, any other value loads
the DLL.
CardStatus(0) . . . . . . . . . . . . . . . . . . DLL and card installation status. Values >900
are errors.
CardStatus (1 to 6) . . . . . . . . . . . . . . Firmware revision of card 1 to 6. Zero is no
card found.
Card Status(7) . . . . . . . . . . . . . . . . . Firmware revision of SAM-242 card.
Sif142Init (double Xfmax, double Xfmin, double Xinit,
double Period)
Initializes the measurement engine. Should be called before readings are taken.
Xfmax . . . . . . . . . . . . . . . . . . . . . . . . Maximum crystal frequency (10 MHz Max).
Any measurement greater than Xfmax
results in a Crystal Failure.
Xfmin . . . . . . . . . . . . . . . . . . . . . . . . Minimum crystal frequency (1 MHz Min). Any
measurement less than Xfmin results in a
Crystal Failure.
Xinit . . . . . . . . . . . . . . . . . . . . . . . . . Initial frequency of a new crystal. Usually
either 6.00 MHz or 5.00 MHz. Must be
between Xfmax and Xfmin.
IPN 074-549-P1A
6 - 2
Page 49

SQM-242 Operating Manual
Period . . . . . . . . . . . . . . . . . . . . . . . . Sets the period of the measurement system
between 0.1 and 2 Seconds.
Sif142Simulate (long Mode)
Sets the operating mode. Normal mode requires SQM-242 card(s), sensors, and a
deposition power supply for proper operation. In simulate mode, no SQM-242 card
is needed. The DLL simulates the frequency readings and power output required
for PID loop control. Note that in this mode the initial sensor frequency is fixed at
5.95 MHz and at least 50% output power is required to start simulating deposition.
Mode . . . . . . . . . . . . . . . . . . . . . . . . 1 turns on simulate mode,
0 turns on normal mode.
Sif142StartMeas ()
Starts the card measuring frequency and zeros the sensor thickness reading.
Sif142ZeroSensor (long SensorNum)
Sets a sensor (0 to 23) thickness reading to zero.
Sif142Zero2 (long OutputNum)
Sets a control output (0 to 13) thickness reading to zero by setting each assigned
sensor thickness to zero.
Sif142Material (long Sensor, double Density, double
Zfact, double Tooling)
Sets up the material-specific parameters for each of the sensors.
Sensor . . . . . . . . . . . . . . . . . . . . . . . A bit weighted value of which sensor(s) the
parameter is for. For example, to set the
sensor two (of 0 to 23) place 100 in the
lowest three bits. Send 111 in the lowest
IPN 074-549-P1A
Density . . . . . . . . . . . . . . . . . . . . . . . Sets the density of the material. Valid values
Zfact . . . . . . . . . . . . . . . . . . . . . . . . . Z-Ratio (Z-Factor) of the material. This is a
three bits to set sensors 0, 1 and 2.
are from 0.4 to 99.99 gm/cc.
unitless number, and can be found in
Appendix A, Material Table. Values are from
0.5 to 25.
Tooling: . . . . . . . . . . . . . . . . . . . . . . Accounts for the difference in deposition rate
at the sensor vs. the substrate. Has a range
from 0 to 9.99, representing 0 to 999%.
6 - 3
Page 50

SQM-242 Operating Manual
Sif142GetMaterial (double SensorParams (0 to 23, 0 to 2),
double SystemParams (0 to 4)
Read material parameters: density, Z-Ratio, and tooling (0 to 23, 0 to 2) and system
parameters: max freq, min freq, init freq, period, norm/sim (0 to4)
Sif142FullScale (long Output, double FullScaleVolts,
double MaxPwr, double SlewRate)
Sets the source output operating parameters.
Output . . . . . . . . . . . . . . . . . . . . . . . The output these parameters are for, 0 to 13.
FullScaleVolts. . . . . . . . . . . . . . . . . . Maximum voltage the output is scaled to.
This is the output at 100% power. Values
from -10 to +10 are valid.
MaxPwr . . . . . . . . . . . . . . . . . . . . . . Maximum power that the loop is allowed to
output, expressed as 0.0 to 1.0 (representing
0% to 100%)
SlewRate: . . . . . . . . . . . . . . . . . . . . Maximum rate of change that the output can
change, expressed as (Percent of full scale x
0.01 / Second).
Sif142Auto (long Output)
Exits manual power control and starts the control loop running on the indicated
output channel.
Output . . . . . . . . . . . . . . . . . . . . . . . 0-11, indicating the output to place in PID
control.
Sif142Loop2 (double Rate, double P, double I, double D,
long Output)
Sets the control loop parameters for an output. The sensors specified in the
Sif142MapSensors function are averaged to provide the input parameters to the
PID loop.
Rate . . . . . . . . . . . . . . . . . . . . . . . . . Specifies the rate that we wish to control to,
from 0 to 999.9 Angstroms/Second.
P. . . . . . . . . . . . . . . . . . . . . . . . . . . . Proportional (gain) term of the PID loop. A
unitless number from 0 to 9999.
I . . . . . . . . . . . . . . . . . . . . . . . . . . . . Integral term, from 0 to 99.9, expressed in
seconds.
D. . . . . . . . . . . . . . . . . . . . . . . . . . . . Derivative term, from 0 to 99.9, expressed in
seconds.
IPN 074-549-P1A
6 - 4
Output . . . . . . . . . . . . . . . . . . . . . . . The output (0 to 13) the parameters apply to.
Page 51

SQM-242 Operating Manual
From the user entered PID parameters, and the error history, a power output
setting is calculated using:
Sif142SetPower (long Output, double Power)
Sets the control voltage value in manual mode. If an output was in Auto mode, turns
off PID control and places the output in Manual mode.
Output. . . . . . . . . . . . . . . . . . . . . . . . Specifies which output, 0 to 13.
Power . . . . . . . . . . . . . . . . . . . . . . . . Power is between 0.0 and 1.0, representing
0 to 100% of full scale.
Sif142MapSensors (long SensLoop(0 to 23))
An array that associates each sensor (0 to 23) with an output (0 to 13) for PID
control. An output value of -1 for a sensor causes the sensor to continue to monitor
deposition, but have no effect on output control.
SensLoop () . . . . . . . . . . . . . . . . . . . Array (0 to 23) of sensor to output
assignments (0 to 13).
Sif142MapAnSensors (long AnLoop(0 to 3))
An array that associates each analog input (0 to 3) with an output (0 to 13) for PID
control. An output value of -1 for an input causes the input to continue to monitor
voltage, but have no effect on output control.
AnLoop () . . . . . . . . . . . . . . . . . . . . . Array (0 to 3) of analog input to output
assignments (0 to 13).
Sif142GetReadings (double SensorArray(0 to 23, 0 to 2),
double OutputArray (0 to 13))
Fills two arrays with measurement data. In the second dimension of the
SensorArray the elements are Rate (Å/s), Thickness (Å), and Frequency (Hz).
Negative frequency values indicate a sensor error. The OutputArray element is
IPN 074-549-P1A
output power, 0 to 1.
If a 0 is returned from this function, there are no new readings available. A non zero
value means that there is new data, with the returned value indicating the number
of readings in the buffer. The buffer is 10 readings long. To flush it, keep reading
until there is no new data.
6 - 5
Page 52

SQM-242 Operating Manual
Sif142GetAnReadings (double AnalogArray(0 to 3), double
OutputArray (0 to 13))
Fills two arrays with measurement data. The AnalogArray is voltage. The
OutputArray is filtered power.
If a 0 is returned from this function, there are no new readings available. A non zero
value means that there is new data, with the returned value indicating the number
of readings in the buffer. The buffer is 10 readings long. To flush it, keep reading
until there is no new data.
Sif142GetPower (double PowerArray(0 to 13))
Fills the array with the current output powers. Unlike the Sif142GetReadings
OutputArray, the value is an instantaneous unbuffered value.
6.3 Sample Files
On the INFICON CDROM in D:\SQM242 Card\SQM242_V100_SAMPLES.There
are sample interface files for use in C, Visual Basic, or LabVIEW. These files are
meant to act as means to aid you in creating your own software and to allow you
to interface to SQM-242 card with other devices in your operation.
Figure 6-2 LabVIEW VI Example Main Dialog Box
IPN 074-549-P1A
6 - 6
NOTE: Before using the LabVIEW demo, it may be best to familiarize yourself with
operation of the SQM-242 CoDep program.
Page 53

SQM-242 Operating Manual
To run the LabVIEW demo, click "Load DLL", "Use Card" and then set the Sensor
and Output parameters as desired. Click "Start Readings" to display readings. Be
sure to click "Unload DLL" before stopping the LabVIEW program. Otherwise, a
Windows error will occur, and LabVIEW may shut down. LabVIEW 6 or higher is
required.
IPN 074-549-P1A
6 - 7
Page 54

SQM-242 Operating Manual
This page is intentionally blank.
6 - 8
IPN 074-549-P1A
Page 55

Troubleshooting and Maintenance
CAUTION
7.1 Troubleshooting Guide
If the SQM-242 fails to function as expected, or appears to have diminished
performance, the following Symptom/Cause/Remedy charts may be helpful.
The SQM-242/SAM-242 card(s) do not have any user
serviceable components.
Refer all maintenance to qualified INFICON personnel.
SQM-242 Operating Manual
Chapter 7
IPN 074-549-P1A
7 - 1
Page 56

SQM-242 Operating Manual
7.1.1 Troubleshooting the SQM-242
Table 7-1 General Troubleshooting
SYMPTOM CAUSE REMEDY
1. Crystal fail message is
always on.
a. Sensor not connected. a. Verify proper sensor
connections.
b. SQM-242 malfunctioning. b. If available, insert a known
working SQM-242, or other
QCM, in place of suspect
one; if SQM-242 is confirmed
bad, contact INFICON
service department.
c. Defective cable from
feedthrough to oscillator.
c. Use an Ohm meter or
DMM to check electrical
continuity or isolation as
appropriate.
d. Poor electrical contact in
the sensor, feedthroughs, or
in-vacuum cable.
d. Use an Ohm meter or
DMM to check electrical
continuity or isolation as
appropriate.
e. Failed crystal/no
crystal/defective crystal.
f. Two crystals placed into the
crystal holder.
e. Replace crystal with a new
INFICON crystal.
f. Remove one of the
crystals.
g. Frequency of crystal out of
range.
2. Noisy signal. a. Distance from sensor head
to the oscillator is longer than
40 in. (101.6 cm).
b. Mechanical/electric noise
sources located near the
SQM-242/cables.
g. Verify that the crystal
frequency is within the
required range, use
INFICON crystals. Set the
desired range in the
software.
a. Replace cables to
preserve the maximum
allowable length.
b. Reroute cables to reduce
noise pickup (1 ft away from
high power conducting lines
makes a sizable reduction in
the amount of noise), keep all
ground wires short with large
surface area to minimize
ground impedance.
IPN 074-549-P1A
7 - 2
Page 57

Table 7-1 General Troubleshooting
SYMPTOM CAUSE REMEDY
SQM-242 Operating Manual
3. Control voltage output
does not function properly.
4. Frequency reading is
unstable or drifting.
a. DAC board damaged from
applying voltage to the
control voltage output.
b. Reversed polarity of
control voltage relative to that
accepted by the source
power supply.
c. Improper control cable
fabrication.
a. Temperature (of the
crystal) is changing. An
AT-cut crystal frequency may
drift as much as 10 Hz/°C.
b. Humidity (level on the
crystal) is changing. Moisture
being absorbed or exuded
from the crystal surface.
a. Ensure cable connection
to the DAC board does not
have a potential across the
contacts, contact INFICON
service department.
b. Verify source output
polarity of the DAC and the
required input polarity of the
source power supply,
reconfigure the SQM-242 if
necessary.
c.Check for correct cable
wiring.
a. Control the temperature of
the chamber. Check watering
cooling for flow and
temperature. Check source
to crystal distance (12" is
ideal)./
b. Control the humidity of the
chamber.
c. "Unbalanced" or damaged
coaxial cable.
c. Check cables for any sign
of damage. Replace cable if
found. Perform continuity test
on cables.
IPN 074-549-P1A
7 - 3
Page 58

SQM-242 Operating Manual
Table 7-1 General Troubleshooting
SYMPTOM CAUSE REMEDY
5. Poor rate control. a. Control loop parameters
improperly selected.
b. Electron beam sweep
frequency "beating" with the
SQM-242's measurement
frequency.
c. Inadequate resolution.
NOTE: QCM resolution is affected by material density and measurement period. Low
density materials cause little frequency change per angstrom of thickness; hence
low resolution. Increasing the measurement period significantly increases QCM
resolution.Increasing the filter value only increases the display resolution.
Measurement Resolution @ Density = 1 g·cm
a. Test to ensure a stable rate
is possible in manual mode.
Refer to the instruction
manual section on tuning
control loop parameters.
b. Adjust the sweep
frequency so it is not a
multiple of the SQM-242’s
measurement frequency.
c. Low density materials
cause little frequency change
per angstrom of thickness;
hence low resolution.
Increase the measurement
period.
−3
7.1.2 Troubleshooting Sensors
NOTE: Many sensor head problems may be diagnosed with a DMM (Digital
Multi-Meter). Disconnect the short oscillator cable from the feedthrough
and measure the resistance from the center pin to ground. If the reading is
less than 10 megohms, the source of the leakage should be found and
corrected. Likewise, with the vacuum system open check for center
conductor continuity, a reading of more than 1 ohm from the feedthrough
to the oscillator indicates a problem. Cleaning contacts or replacing the
in-vacuum cable may be required.
7 - 4
IPN 074-549-P1A
Page 59

SQM-242 Operating Manual
NOTE: A somewhat more thorough diagnosis may be performed with the optional
Crystal Sensor Emulator, 760-601-G1. See section 7.3 on page 7-16 for a
discussion of its use and diagnostic capabilities.A more detailed
troubleshooting guide is shipped with the sensor. Refer to that manual for
more detailed information in some cases
Table 7-2 Troubleshooting Sensors
SYMPTOM CAUSE REMEDY
.
1. Large jumps of thickness
reading during deposition.
a. Mode hopping. a. Mode hopping is a
byproduct of active
oscillation with a heavily
damped crystal. Temperature
stabilization is key in
diminishing this. Replace the
crystal.
b. Stress causes film to peel
from crystal surface.
b. Replace crystal or use
high performance
RunSaver™ crystal; consult
factory.
c. Particulate or "spatter"
from molten source striking
crystal.
c. Thermally condition the
source thoroughly before
deposition, use a shutter to
protect the crystal during
source conditioning.
d. Material build up,
scratches or foreign particles
on the crystal holder seating
d. Clean and polish the
crystal seating surface on the
crystal holder.
surface (improper crystal
seating.)
e. Small pieces of material
fell on crystal (for crystal
e. Check the crystal surface
and blow it off with clean air.
facing up sputtering
IPN 074-549-P1A
situation.)
f. Small pieces of magnetic
material being attracted by
the sensor magnet and
contacting the crystal
(sputtering sensor head.)
f. Check the sensor cover's
aperture and remove any
foreign material that may be
restricting full crystal
coverage.
7 - 5
Page 60

SQM-242 Operating Manual
Table 7-2 Troubleshooting Sensors
SYMPTOM CAUSE REMEDY
2. Crystal ceases to oscillate
during deposition before it
reaches the end of its normal
life.
a. Crystal struck by
particulate or spatter from
molten source.
a. Thermally condition the
source thoroughly before
deposition, use a shutter to
protect the crystal during
source conditioning.
b. Material on crystal holder
b. Clean crystal holder.
partially masking crystal
cover aperture.
c. Existence of electrical
short or open condition.
c.Using an ohm meter or
DMM, check for electrical
continuity in the sensor
cable, connector, contact
springs, connecting wire
inside sensor, and
feedthroughs.
d. Thermally induced
d. See 2C above.
electrical short or open
condition.
NOTE: Crystal life is highly dependent on process conditions of rate, power radiated from
source, location, material, and residual gas composition.
3. Crystal does not oscillate
or oscillates intermittently
(both in vacuum and in air.)
a. Intermittent or poor
electrical contact (contacts
oxidized.)
b. Leaf springs have lost
retentivity (ceramic retainer,
center insulator.)
c. RF interference from
sputtering power supply.
d. Cables not connected, or
connected to wrong sensor
input.
a. Use an Ohm meter or
DVM to check electrical
continuity, clean contacts.
b. Carefully bend leaves to
approx. 45°.on ceramic
retainer and 60° inside the
sensor head.
c. Verify earth ground, use
ground strap adequate for
RF ground, change location
of the computer and cabling
away from RF power lines.
d. Verify proper connections,
and inputs relative to
programmed sensor
parameter.
IPN 074-549-P1A
7 - 6
Page 61

Table 7-2 Troubleshooting Sensors
SYMPTOM CAUSE REMEDY
SQM-242 Operating Manual
4. Crystal oscillates in
vacuum but stops oscillation
after open to air.
5. Thermal instability: large
changes in thickness reading
during source warm-up
(usually causes thickness
reading to decrease) and
after the termination of
deposition (usually causes
thickness reading to
increase.)
a. Crystal was near the end
of its life; opening to air
causes film oxidation which
increases film stress.
b. Excessive moisture
accumulates on the crystal.
a. Inadequate cooling
water/cooling water
temperature too high.
b. Excessive heat input to the
crystal.
c. Crystal not seated properly
in holder.
a. Replace crystal.
b. Turn off cooling water to
sensor prior to venting, flow
warm water through sensor
while chamber is open.
a. Check cooling water flow
rate, be certain that cooling
water temperature is less
than 30°C; refer to
appropriate sensor manual.
b. If heat is due to radiation
from the evaporation source,
move sensor further away
from source and use silver
crystals for better thermal
stability; install radiation
shield.
c. Clean or polish the crystal
seating surface on the crystal
holder.
d. Crystal heating caused by
high energy electron flux
d. Use a sputtering sensor
head.
(often found in RF
sputtering.)
e. Poor thermal transfer
(Bakeable.)
IPN 074-549-P1A
f. Use Al or Au foil washer
between crystal holder and
sensor body.
7 - 7
Page 62

SQM-242 Operating Manual
Table 7-2 Troubleshooting Sensors
SYMPTOM CAUSE REMEDY
6. Poor thickness
reproducibility.
a. Variable source flux
distribution.
a. Move sensor to a more
central location to reliably
sample evaporant, ensure
constant relative pool height
of melt, avoid tunneling into
the melt.
b. Sweep, dither, or position
where the electron beam
strikes the melt has been
changed since the last
deposition.
b. Maintain consistent source
distribution by maintaining
consistent sweep
frequencies, sweep
amplitude and electron beam
position settings.
c. Material does not adhere
to the crystal.
c. Make certain the crystal
surface is clean; avoid
touching crystal with fingers,
make use of an intermediate
adhesion layer.
d. Cyclic change in rate. d. Make certain source's
sweep frequency is not
"beating" with the SQM-242
measurement frequency.
7. Large drift in thickness
(greater than 200 Å for a
density of 5.00 g/cc) after
termination of sputtering.
a. Crystal heating due to poor
thermal contact.
b.External magnetic field
interfering with the sensor's
magnetic field (sputtering
sensor.)
c. Sensor magnet cracked or
demagnetized (sputtering
sensor.)
a. Clean or polish the crystal
seating surface on the crystal
holder.
b.Rotate sensor magnet to
proper orientation with
external magnetic field, refer
to the sputtering sensor
manual IPN 074-157.
c. Check sensor magnetic
field strength, the maximum
field at the center of the
aperture should be 700
gauss or greater.
IPN 074-549-P1A
7 - 8
Page 63

SQM-242 Operating Manual
7.1.3 Troubleshooting Computer Communications
Table 7-3 Troubleshooting Computer Communications
SYMPTOM CAUSE REMEDY
1. Communications cannot
be established between the
host computer and the
SQM-242.
a. Card not found by
software.
b. Driver not installed
properly.
a. Card not jumpered
properly.
b. Confirm the operating
system is an accepted OS.
If autorun driver install
feature does not work, the
driver can be installed from
the device manager
manually.
c. Driver not
communicating.
c. Previous installation
attempts can cause comm
issues. Perform the
SQM242 clean.exe
procedure.
NOTE: To perform this procedure, you do not need to uninstall the SQM-242
software, or any other INFICON software. Be sure you are logged on with
administrator privileges. You will need the SQM242clean software to perfom
this procedure.
If you previously tried to install the card, but it did not work:
1. In Control Panel remove/uninstall any SQM-242 cards.
2. Run the "clean" program (SQM-242 clean.exe).
3. Search in Regedit for any occurrences of WINDRVR or WINDRIVER.
4. If any are found, delete them. If you can’t, you need higher privileges.
5. Search in \Windows\Inf\OEM*.INF files for “Sigma” and delete any that are found.
6. Restart the computer and follow the next steps for a clean install.
7. Install the card and start the computer. You should get a "New Hardware Found"
IPN 074-549-P1A
message.
8. If not, the card is defective, or not installed or jumpered properly.
9. When prompted for a driver, point windows to the INFICON CD-ROM.
10. Windows should find the SQM-242 Card driver and install it.
11. Restart the computer and verify that SQM-242 card(s) are shown in Control Panel.
(Steps 12-15 are not always needed, but it doesn’t hurt).
12. Select Start, Run, type WDREGINS, click OK.
13. A DOS window will flash very briefly. Restart the computer.
14. If prompted for a WINDRVR driver, point Windows to the CDROM drivers again.
15. Restart the computer and load the SQM-242 software.
7 - 9
Page 64

SQM-242 Operating Manual
CAUTION
7.2 Replacing the Crystal
Always use clean nylon lab gloves and plastic tweezers
for handling the crystal (to avoid contamination which
may lead to poor adhesion of the film to the electrode).
Do not rotate the ceramic retainer assembly after it is
seated (as this will scratch the crystal electrode and
cause poor contact).
Do not use excessive force when handling the ceramic
retainer assembly since breakage may occur.
NOTE: Certain materials, especially dielectrics, may not adhere strongly to the
crystal surface and may cause erratic readings.
NOTE: Thick deposits of some materials, such as SiO, Si, and Ni will normally peel
off the crystal when it is exposed to air, as a result of changes in film stress
caused by gas absorption. When you observe peeling, replace the
crystals.
7.2.1 Front Load
Follow the procedure below to replace the crystal in the Front Load sensor: (see
Figure 7-1)
1 Gripping the crystal holder with your fingers, pull it straight out of the sensor
body.
2 Gently pry the crystal retainer from the holder (or use the Crystal Snatcher; see
Figure 7-6 on page 7-15).
3 Turn the retainer over and the crystal will drop out.
4 Install a new crystal, with the patterned electrode face up.
5 Push the retainer back into the holder and replace the holder in the sensor
body.
IPN 074-549-P1A
7 - 10
Page 65

Figure 7-1 Front Load Crystal Sensor (Exploded)
Front Load Crystal Holder
(IPN 750-172-G1)
Front Load Standard
Crystal Sensor Body
(IPN 750-207-G1)
Crystal (IPN 008-010-G10)
Fully Coated Face (Gold)
Finger Spring Contact
(IPN 750-171-P1)
Crystal Retainer
(IPN 007-023)
In-Vacuum Cable
To X IU
Water Tubes
SQM-242 Operating Manual
7.2.2 Cool Drawer
IPN 074-549-P1A
Follow the procedure below to replace the crystal in a Next Generation Cool
Drawer™ sensor:
1 Using your thumb and index fingers, gently squeeze the sides of the retainer at
the mid section then lift it up, away from the drawer, as shown in Figure 7-2.
2 Hold the drawer by the handle and turn it upside down to remove the spent
crystal.
3 Install a new crystal in the drawer. Observe its orientation. The pattern
electrode should face upward as shown in Figure 7-3.
7 - 11
Page 66

SQM-242 Operating Manual
Contact Spring
Orientation
Notch
Handle
Retainer
Crystal
Drawer
4 Hold the retainer by its sides. Align its orientation notch with the drawer then
gently and evenly push the retainer down until it snaps firmly into the drawer.
see Figure 7-3. Never push down (or pull up) on the contact spring, doing so
may permanently damage it.
5 Inspect the whole assembly. The retainer should be even and engage the
drawer at all four corners.
Figure 7-2 Cool Drawer - removing the crystal
Figure 7-3 Cool Drawer - replacing the crystal
IPN 074-549-P1A
7 - 12
Page 67

7.2.3 Bakeable Sensor
Crystal Holder and
Retainer Spring
IPN 750-218-G1
Crystal IPN 008-010-G10
Fully Coated Face (Gold)
Crystal Retainer IPN 007-064
Clamping Spring IPN 007-094
Contact IPN 007-099
Insulator IPN 007-103
Spreader Bar
IPN 007-267-P2
Shoulder Washer
IPN 007-268-P1
Two Required
Shoulder Washer
IPN 007-269-P1
Cam Mechanism
IPN 007-095
Cover IPN 007-101
For the Bakeable sensor, the procedure is the same as the Front Load sensor
except that you must first unlock the cam assembly by flipping it up. Once the
crystal has been replaced, place a flat edge of the holder flush with the cam
mechanism and lock it in place with the cam. See Figure 7-4.
Figure 7-4 Bakeable Crystal Sensor
SQM-242 Operating Manual
IPN 074-549-P1A
7 - 13
Page 68

SQM-242 Operating Manual
Body Assembly
IPN 750-619-G1
In-Vacuum Cable Assembly
(29 in.) IPN 007-044
Ceramic Retainer
IPN 007-023
Crystal
IPN 008-009-G10
(Silver)
Crystal Holder
IPN 007-049
Sensor
Front Cover
IPN 007-047
7.2.4 Sputtering Sensor
Observe the general precautions for replacing crystals and follow the instructions
below to replace the crystal in a sputtering sensor.
1 Grip the body assembly with your fingers and pull it straight out to separate it
from the water-cooled front cover. (You may have to disconnect the sensor
cable in order to separate the parts.) See Figure 7-5.
2 Pull the crystal holder straight out from the front of the body assembly.
3 Remove the ceramic retainer from the crystal holder by pulling it straight out
with the crystal snatcher (see section 7.2.5 on page 7-15).
4 Turn the crystal holder over so that the crystal drops out.
5 Install a new crystal into the crystal holder with the patterned electrode facing
the back and contacting the leaf springs on the ceramic retainer.
6 Put the ceramic retainer back into the crystal holder and put the holder into the
body assembly of the sensor.
7 Align the position of the body assembly so that the connector matches with the
notch on the front cover of the sensor. Snap the two parts together. Reconnect
the sensor cable if it has been disconnected.
Figure 7-5 Sputtering Crystal Sensor
IPN 074-549-P1A
7 - 14
Page 69

7.2.5 Crystal Snatcher
Use the crystal snatcher, supplied with the sensor, as follows:
1 Insert crystal snatcher into ceramic retainer (1) and apply a small amount of
pressure. This locks the retainer to the snatcher and allows the retainer to be
pulled straight out (2). See Figure 7-6.
2 Reinsert the retainer into the holder after the crystal has been replaced.
3 Release the crystal snatcher with a slight side-to-side motion.
Figure 7-6 Use of the Crystal Snatcher
SQM-242 Operating Manual
IPN 074-549-P1A
7 - 15
Page 70

SQM-242 Operating Manual
CAUTION
Female
BNC
Connector
Female
Microdot
Connector
Sensor
Cover
Connector
Thin Film
Controller
Crystal Interface
Unit (Oscillator)
Sensor Head
A
B
C
7.3 Crystal Sensor Emulator IPN 760-601-G2
NOTE: 760-601-G2 is fully compatible with all Thin Film Deposition Controllers.
The Crystal Sensor Emulator option is used in conjunction with the Thin Film
Deposition Controller to rapidly diagnose problems with the Deposition Controller's
measurement system. See Figure 7-7.
Figure 7-7 Crystal Sensor Emulator
The Crystal Sensor Emulator may be attached at various points in the
measurement system, from the oscillator to the sensor head. It provides a known
good monitor crystal with known good electrical connections. Using the emulator
and the controller in a systematic manner provides a fast means of isolating
measurement system, cable, or sensor problems. See Figure 7-8.
Figure 7-8 Crystal Sensor Emulator Attachment Points
This product is designed as a diagnostic tool, and is not
intended for use in vacuum. Do not leave the Crystal
Sensor Emulator installed in the vacuum system during
processing.
IPN 074-549-P1A
7 - 16
Page 71

7.3.1 Diagnostic Procedures
The following diagnostic procedures employ the Crystal Sensor Emulator to
analyze a constant Crystal Fail message. The symptom is a Crystal Fail message
that is displayed by the SQM-242 software even after the monitor crystal has been
replaced with a new good monitor crystal.
7.3.1.1 Measurement System Diagnostic Procedure
1 Refer to Figure 7-8 on page 7-16. Remove the six-inch BNC cable from the
Feed-Through at point A.
2 Connect the Crystal Sensor Emulator to the 6 inch BNC cable at Point A.
If the Crystal Fail message disappears after approximately five seconds,
the measurement system is working properly. Re-install the six-inch BNC
cable to the Feed-Through. Go to section 7.3.1.2.
If the Crystal Fail message remains, continue at step 3.
3 Disconnect the six-inch BNC cable from the Oscillator and from the Emulator.
4 Visually inspect the six-inch BNC cable to verify that the center pins are seated
properly.
SQM-242 Operating Manual
5 Use an Ohm meter to verify the electrical connections on the six-inch BNC
cable.
There must be continuity (<0.2 ohms after accounting for resistance of
ohmmeter leads) between the center pins.
There must be isolation (>10 megohms) between the center pins and the
connector shield.
There must be continuity between the connector shields.
Replace the six-inch BNC cable if it is found to be defective and repeat Step 2
of this procedure.
IPN 074-549-P1A
6 If the six-inch BNC cable is not defective, re-connect the six-inch cable to the
oscillator and to the Crystal Sensor Emulator. If the Crystal Fail message
remains, contact INFICON.
7 - 17
Page 72

SQM-242 Operating Manual
7.3.1.2 Feed-Through Or In-Vacuum Cable
Diagnostic Procedure
1 Refer to Figure 7-8 on page 7-16. Remove the In-Vacuum cable from the
Sensor Head at point B.
2 Connect the Crystal Sensor Emulator to the In-Vacuum cable.
If the Crystal Fail message disappears after approximately five seconds,
the Feed-Through and In-Vacuum Cable are working properly. Re-install
the In-Vacuum cable to the Sensor Head. Go to section section 7.3.1.3 on
page 7-19.
If the Crystal Fail message remains, continue at step 3.
3 Disconnect the In-Vacuum cable from the Feed-Through and the Emulator.
Disconnect the six-inch BNC cable from the Feed-Through.
4 Using an Ohm Meter, verify electrical continuity from the BNC center pin on the
Feed-Through to the Microdot center pin on the Feed-Through. A typical value
would be less than 0.2 ohms.
5 Verify electrical isolation of the center pin on the Feed-Through from the
electrical ground (Feed-Through body). A typical value would be in excess of
10 megohms.
If the Feed-Through is found to be defective, replace the Feed-Through, re-attach
the BNC and In-Vacuum cables, and repeat this procedure starting at Step 2,
otherwise continue at step 6.
6 Verify electrical continuity from center pin to center pin on the In-Vacuum cable.
7 Verify that the center pin of the In-Vacuum cable is electrically isolated from the
In-Vacuum cable shield.
If the In-Vacuum cable is found to be defective, replace the In-Vacuum cable.
Re-attach the BNC and In-Vacuum cables, and repeat this procedure starting at
Step 2, otherwise continue at step 8.
8 Connect the In-Vacuum Cable to the Feed-Through.
9 Verify electrical continuity from the center pin on the BNC connector of the
Feed-Through to the center pin on the un-terminated end of the In-Vacuum
cable.
10 Verify electrical isolation from the center pin to electrical ground (Feed-Through
body).
If the Feed-Through/In-Vacuum cable system is found to be defective, look for
defective electrical contacts at the Feed-Through to In-Vacuum cable connection.
Repair or replace the Feed-Through as necessary. Re-attach the BNC and
In-Vacuum cables and repeat this procedure starting at step 2. Otherwise, continue
at step 11.
IPN 074-549-P1A
7 - 18
Page 73

11 Connect the six-inch BNC cable to the Feed-Through and disconnect it from the
oscillator.
12 Verify electrical continuity from the center pin of the Microdot connector on the
Feed-Through to the un-terminated end of the six-inch BNC cable.
13 Verify electrical isolation from the center pin to electrical ground (Feed-Through
body).
If the Feed-Through/six-inch BNC cable system is found to be defective, look for
defective contacts at the Feed-Through to BNC cable connection. Repair or
replace the Feed-Through as necessary, re-attach the BNC cable to the XIU and
In-Vacuum cable to the Crystal head and repeat this procedure starting at step 2.
7.3.1.3 Sensor Head Or Monitor Crystal
Diagnostic Procedure
NOTE: The procedure is for use with front load style sensor heads.
1 Remove the Crystal Cover from the Sensor Head.
2 Refer to Figure 7-7 on page 7-16. Connect the Crystal Sensor Emulator to the
Sensor Head at Point C. Note that this only works on a Front Load style sensor
head.
SQM-242 Operating Manual
If the Crystal Fail message disappears after approximately 5 seconds the
Sensor Head is operating properly. Re-insert the Crystal Cover into the
Sensor Head.
If the Crystal Fail message remains, continue at step 3.
3 Disconnect the In-Vacuum cable from the Sensor Head and the Feed-Through.
Remove the Crystal Sensor Emulator from the Sensor Head.
4 Using an Ohm meter, verify the electrical connections on the Sensor Head.
Verify there is electrical continuity from the center pin contact on the
Microdot connector on the Sensor Head to the leaf spring contact in the
IPN 074-549-P1A
If the Sensor Head is found to be defective, contact INFICON to have the Sensor
Head repaired.
Sensor Head. Take care not to apply to much pressure on the center pin of
the microdot connector as it may become damaged.
There must be electrical isolation between the center pin of the Microdot
connector and the Sensor Head body.
7 - 19
Page 74

SQM-242 Operating Manual
5 Connect the In-Vacuum Cable to the Sensor Head.
Verify there is continuity (<0.2 ohm) from the leaf spring contact in the
Sensor Head to the center pin on the un-terminated end of the In-Vacuum
cable.
Verify there is isolation (>10 megohm) between the leaf spring contact and
the In-Vacuum cable shield.
If the Sensor Head or the In-Vacuum cable system is found to be defective, look for
defective contacts at the In-Vacuum cable to Sensor Head connection, repair or
replace the Sensor Head as necessary. Re-attach the In-Vacuum cable to the
Feed-Through and repeat this procedure starting at step 2.
6 Ensure that the leaf springs in the Sensor Head and those in the ceramic
retainer are bent to an angle of approximately 60 degrees and 45 degrees from
flat, respectively.
7.3.1.4 System Diagnostics Pass But
Crystal Fail Message Remains
If the system is operating properly yet the Crystal Fail message is still displayed,
perform the following tasks.
1 On the Ceramic Retainer verify that the center rivet is secure. Repair or replace
the ceramic retainer as necessary.
2 Inspect the inside of the Crystal Holder for build-up of material. Clean or replace
the Crystal Holder as necessary.
After verifying the Sensor Head contacts, the Sensor Head/In-Vacuum cable
connection and the ceramic retainer contacts, re-assemble the system. If the
Crystal Fail message remains, replace the monitor crystal with a new monitor
crystal. Verify that the monitor crystal works properly by inserting it into a known
good measurement system. If you continue to experience problems, contact
INFICON.
IPN 074-549-P1A
7 - 20
Page 75

7.3.2 Sensor Cover Connection
The Crystal Sensor Emulator can be used to verify the measurement system for
INFICON Thin Film Deposition Controllers and Monitors.
However, the Crystal Sensor Emulator's Sensor Cover Connector is compatible
with some sensor heads, and is incompatible with others. This is discussed in the
following sections.
7.3.2.1 Compatible Sensor Heads
The Sensor Cover Connection will fit the sensor heads shown in Table 7-4.
Table 7-4 Compatible Sensor Heads
Sensor Head Part Number
Front Load Single Sensor Head SL-XXXXX
Front Load Dual Sensor Head DL-AEXX
7.3.2.2 Incompatible Sensor Heads
SQM-242 Operating Manual
The Sensor Heads for which the Crystal Sensor Emulator's Sensor Cover
Connector will not fit are shown in Table 7-5.
Table 7-5 Incompatible Sensor Heads
Sensor Head Part Number
Front Load UHV Bakeable Sensor Head BK-AXX
Cool Drawer Single Sensor Head CDS-XXXXX
Sputtering Sensor Head 750-618-G1
CrystalSix Sensor Head 750-446-G1
Cool Drawer Dual Sensor Head CDD-XXXX
Crystal12 Sensor Head XL12-XXXXXX
IPN 074-549-P1A
RSH-600 Sensor Head 15320X-XX
NOTE: The Crystal Sensor Emulator’s Sensor Cover will not fit the crystal holder
opening of the older style INFICON transducers that have the soldered
finger springs.
7 - 21
Page 76

SQM-242 Operating Manual
7.3.3 Emulator Specifications
Dimensions
1.58 in. diameter x 1.79 in.
(40.13 mm diameter x 45.47 mm)
Temperature Range
0 to 50
Frequency
760-601-G2: 5.5 MHz ± 1 ppm at room temperature
Materials
o
C
304 Stainless Steel, Nylon, Teflon
tin, and lead.
®
, brass. Some internal components contain zinc,
IPN 074-549-P1A
7 - 22
Page 77

SQM-242 Operating Manual
Density g cm
3
D
1
T
x
T
m
-------
=
8.1 Importance of Density, Tooling and Z-Ratio
The quartz crystal microbalance is capable of precisely measuring the mass added
to the face of the oscillating quartz crystal sensor. The SQM-242’s knowledge of
the density of this added material allows conversion of the mass information into
thickness. In some instances, where highest accuracy is required, it is necessary
to make a density calibration as outlined in section 8.2.
Because the flow of material from a deposition is not uniform, it is necessary to
account for the different amount of material flow onto the sensor compared to the
substrates. This factor is accounted for in the tooling parameter in material grid.
The tooling factor can be experimentally established by following the guidelines in
section 8.3 on page 8-2.
If the Z-Ratio is not known, it could be estimated from the procedures outlined in
section 8.4 on page 8-2.
Chapter 8
Calibration
8.2 Determining Density
NOTE: The bulk density values retrieved from Table A-1 are sufficiently accurate
for most applications.
Follow the steps below to determine density value.
1 Place a substrate (with proper masking for film thickness measurement)
adjacent to the sensor, so that the same thickness will be accumulated on the
crystal and substrate.
2 Set density to the bulk value of the film material or to an approximate value.
IPN 074-549-P1A
3 Set Z-Ratio to 1.000 and tooling to 100%.
4 Place a new crystal in the sensor and make a short deposition
(1000-5000 Å).
5 After deposition, remove the test substrate and measure the film thickness with
either a multiple beam interferometer or a stylus-type profilometer.
6 Determine the new density value with equation [1]:
[1]
8 - 1
Page 78

SQM-242 Operating Manual
Tooling (%) TF
i
T
m
T
x
-------
=
where:
= Initial density setting
D
1
= Thickness reading on SQM-242
T
x
= Measured thickness
T
m
7 A quick check of the calculated density may be made by programming the
SQM-242 with the new density value and observing that the displayed
thickness is equal to the measured thickness, provided that the SQM-242's
thickness has not been zeroed between the test deposition and entering the
calculated density.
NOTE: Slight adjustment of density may be necessary in order to
achieve T
= Tm.
x
8.3 Determining Tooling
1 Place a test substrate in the system's substrate holder.
2 Make a short deposition and determine actual thickness.
3 Calculate tooling from the relationship shown in equation [2]:
where
T
= Actual thickness at substrate holder
m
= Thickness reading in the SQM-242 software
T
x
= Initial tooling factor
TF
i
4 Round off percent tooling to the nearest 0.1%.
5 When entering this new value for tooling into the program, T
calculations are done properly.
NOTE: It is recommended that a minimum of three separate evaporations be
made when calibrating tooling. Variations in source distribution and other
system factors will contribute to slight thickness variations. An average
value tooling factor should be used for final calibrations.
will equal Tx if
m
[2]
IPN 074-549-P1A
8.4 Laboratory Determination of Z-Ratio
8 - 2
A list of Z-values for materials commonly used are available in Table A-1. For other
materials, Z can be calculated from the following formula:
Page 79

SQM-242 Operating Manual
Z
d
qq
d
ff
------------
1
2
---
=
Z 9.378 105d
ff
-
1
2
---
=
where:
= density (g/cm3) of deposited film
d
f
= shear modulus (dynes/cm2) of deposited film
µ
f
= density of quartz (crystal) (2.649 gm/cm3)
d
q
= shear modulus of quartz (crystal) (3.32 x 10¹¹ dynes/cm2)
µ
q
The densities and shear moduli of many materials can be found in a number of
handbooks.
[3]
[4]
Laboratory results indicate that Z-values of materials in thin-film form are very close
to the bulk values. However, for high stress producing materials, Z-values of thin
films are slightly smaller than those of the bulk materials. For applications that
require more precise calibration, the following direct method is suggested:
1 Establish the correct density value as described in section 8.2 on page 8-1.
2 Install a new crystal and record its starting frequency, F
frequency will be displayed on the main dialog box.
. The starting
co
3 Make a deposition on a test substrate such that the percent crystal life display
will read approximately 50%, or near the end of crystal life for the particular
material, whichever is smaller.
4 Stop the deposition and record the ending crystal frequency F
IPN 074-549-P1A
5 Remove the test substrate and measure the film thickness with either a multiple
beam interferometer or a stylus-type profilometer.
6 Using the density value from step 1 and the recorded values for F
adjust the Z-Ratio value in thickness equation [5] to bring the calculated
thickness value into agreement with the actual thickness. If the calculated value
of thickness is greater than the actual thickness, increase the Z-Ratio value. If
the calculated value of thickness is less than the actual thickness, decrease the
Z-Ratio value.
.
c
and Fc,
co
8 - 3
Page 80

SQM-242 Operating Manual
T
f
Zq10
4
2zp
--------------------
1
F
co
--------
ATan zTan
F
co
F
q
-----------
1
F
c
-----
ATan zTan
F
c
F
q
---------
–
=
where:
= thickness of deposited film (kÅ)
T
f
= starting frequency of the sensor crystal (Hz)
F
co
= Final frequency of the sensor crystal (Hz)
F
c
= Nominal blank frequency = 6045000 (Hz)
F
q
z = Z-ratio of deposited film material
= Specific acoustic impedance of quartz = 8765000 (MKS units)
Z
q
p = density of deposited film (g/cc)
For multiple layer deposition (for example, two layers), the Z-value used for the
second layer is determined by the relative thickness of the two layers. For most
applications the following three rules will provide reasonable accuracies:
[5]
If the thickness of layer 1 is large compared to layer 2, use material 1 Z-value
for both layers.
If the thickness of layer 1 is thin compared to layer 2, use material 2 Z-value for
both layers.
If the thickness of both layers is similar, use a value for Z-Ratio which is the
weighted average of the two Z values for deposition of layer 2 and subsequent
layers.
8.5 Tuning the Control Loop
The function of the control loop parameters is to match the instrument’s reaction to
an error (between the measured deposition rate and the desired rate) to the time
related characteristics of the deposition source and its power supply. There are
three adjustable parameters; P(proportional), I(integral) and D(derivative) used to
accomplish this. It is convenient to think of sources as falling into two categories
"fast" or "slow". The tuning parameters are affected by source level, rate, sweep
range or beam density, tooling and source condition.
NOTE: If you do not know if the source is fast or slow, it is straight forward to
measure the delay. Using manual power, establish a rate and allow it to
become steady. Increase the source power a few percent (~5% if
possible). Allow the source to again stabilize. If the delay time is greater
than 1 second characterize the source as "slow". Typically, thermal
evaporation sources are considered "slow" and E-beam sources are
considered "fast."
IPN 074-549-P1A
8 - 4
Page 81

SQM-242 Operating Manual
The proportional gain(P) parameter sets the rate at which the control voltage
changes in response to an error signal (see Figure 8-1). Any error in the rate
causes the source control voltage to ramp to a new value. When the source control
voltage increases or decreases to the correct value, the value required to achieve
the desired rate, the error goes to zero and the output remains constant.
Figure 8-1 Proportional Gain
The integral time constant(I) is defined as the time difference between the actual
start of a change in rate and the time at which 63% of the rate step is achieved (see
Figure 8-2.) It instructs the controller on how much attention to pay to the schedule
of the thickness profile. If we don’t care what happened in the past and we want
zero rate error right now, we don’t want any Integral feedback. To accomplish that
we set the integral time constant to its maximum value, which tells the controller to
ignore any past error unless it lasts for a very long time.
Figure 8-2 Time Constant
IPN 074-549-P1A
8 - 5
Page 82

SQM-242 Operating Manual
The derivative time constant(D) is utilized to compensate for slow responding
sources such as boats and induction heated sources. This value is defined as the
time difference between a change in % power and the start of an actual change in
rate (see Figure 8-3.) The Derivative Time constant instructs the controller on how
much attention to pay to the rate of change of a error. A value of zero tells the
controller to ignore the rate of change of the error. A large value tells the controller
that the source is slow and it is going to be hard to get it going and hard to stop it.
So if the rate starts to fall off, give it power, or if the target is quickly approaching,
begin to decrease the power.
Figure 8-3 Dead Time
8.5.1 Fast Source
In general, fast sources are: all electron beam types (unless a hearth liner is
used), some very small filament sources and sputtering sources. If the source
response has been characterized as "FAST", as suggested in the NOTES in
section 8.5, a integrating type control loop should be established.
With fast sources, the I and D terms can typically be set to 0.1. If satisfactory
control cannot be established using only P, the source is probably not a "fast"
source. The response of a system with too little controller gain (its P value is too
large) is characterized as over damped as shown in Figure 8-4. Decrease the P
value until the system oscillates as is shown by the under damped curve. Proper
control is established by an intermediate value that approximates the critically
damped curve.
IPN 074-549-P1A
8 - 6
Page 83

Figure 8-4 Example of Over Damped Curve
8.5.2 Slow Source
A slow source, for the purpose of this discussion, is a deposition source that has
more than a one second delay (lag) between the control voltage change (into the
source’s power supply) and the measurement system’s ability to sense that change
has taken place. In very slow systems such as large filament boats, the P term may
have to be set low to maintain stability where the rate smoothly levels off but
remains below the target value. In this case, you will need to adjust the integral time
constant. This parameter works in reverse meaning the smaller the value the larger
the effect. So, slightly decrease this parameter then watch the rate graph. The rate
should ramp up to the target without overshoot. If the ramp takes too long then
slowly decrease the Integral Time again and repeat these steps until you are
satisfied with the control. Most thermal sources are slow sources. For slow
sources, the D term is more involved. As illustrated in Figure 8-5, the derivative
time constant (D) is the time delay between a change in the source’s power setting
and a noticeable change in deposition rate.
SQM-242 Operating Manual
Figure 8-5 Example of Delay Setting
IPN 074-549-P1A
8 - 7
Page 84

SQM-242 Operating Manual
8.5.3 Loop Tuning Procedure
NOTE: Please keep in mind, control loop tuning is a trial and error process and
there is no "best" procedure to accomplish this task.
1 Set System Parameters: In the SQM-242 Co-dep software, set a Period of
0.25 seconds as a good starting point. Set Tooling parameters to 100% for now.
Initially set the Rate Filter to 1.00 (no filter) to see the noise of the system.
Simulate should be OFF. Keep in mind that Simulate mode is a tool for testing
process layers. It is not likely to match the control response of your vacuum
system.
2 Create a One-Layer Test Process: In View >> Input setup, input the Z-Ratio
and density of the material you are depositing. On the main dialog box, set the
desired rate and leave the other parameters at their default values.
3 Test the Setup: Set the power to manual mode, then press Start. Slowly
increase the power to 10%, and verify that your power supply output is about
10% of full scale. Continue to increase power until a rate near your desired rate
is achieved. Again, verify that the power supply output agrees with the
SQM-242 Power (%) reading. If the readings don’t agree, check your wiring and
verify that the Edit>>Output menu, Full Scale voltage agrees with your power
supply’s input specifications. Log the data for a few minutes. Plot the data, if the
system has significant short term noise at a fixed power (maybe >10%), the
control loop will be very difficult to adjust, especially at low rates. It is better to
eliminate the source of the noise before attempting to set the PID values.
4 Select a Filter Alpha: On the View >> Card Setup menu, slowly decrease the
filter Alpha from 1to a lower value until the rate display noise is minimized. If
you set Alpha too low, the display will lag the true system response and may
hide significant problems. A value of 0.5 equally weights the current reading
and the previous filtered readings.
5 Determine Open Loop Gain: Record the Power reading at the desired rate as
DR. Slowly lower the power until the Rate (Å/s) reading is just at (or near)
PWR
zero. Record the zero rate Power reading as PWR
0R.
6 Determine Open Loop Response Time: Calculate 1/3 of your desired rate
(RATE
the power until Rate (Å/s) matches RATE
response to an input change. Quickly adjust Power (%) to PWR
time for the Rate (Å/s) reading to reach RATE
several times to get an average response time. Twice the measured time is the
step response time, TIME
evaporation, 5 to 20 seconds for thermal evaporation.
1/3), and 2/3 of the desired rate (RATE2/3) for this layer. Slowly increase
1/3. Get ready to record the loop’s
DR. Measure the
2/3. You may want to do this
SR. TIMESR is typically 0.2 to 1 second for E-Beam
7 Set PID Values: Set the power to zero. In the Edit>>Output menu set P=25,
I= TIME
menu and select Auto to move to Auto (PID control) mode and observe the
Power graph. The power should rise from 0%, and stabilize near PWR
SR, D=0. Set Max. Pwr to ~20% higher than PWRDR. Exit the output
DR with
IPN 074-549-P1A
8 - 8
Page 85

SQM-242 Operating Manual
little ringing or overshoot. If there is more than about 10% overshoot, lower the
P Term. If the time to reach PWR
DR is very slow, increase the P Term. A lower
I Term will increase response time, a higher value will eliminate ringing and
setpoint deviations. Unless you have a very slow source, It is unlikely you will
need any D Term. If you do have a slow source you will need to determine the
response time from when you adjust power to when a change in rate occurrs.
Continue to adjust P & I values, alternating between Manual Power 0% and
Auto mode until steady-state response is smooth and the step response is
reasonably controlled. You don’t need to totally eliminate ringing during this
step if the steady-state response is smooth; preconditioning will minimize step
changes. Typical I values for thermal systems are 4 to 10; Ebeam I values are
0.5 to 2. It’s impossible to predict P values, but it is best to select the lowest
value that provides adequate rate control.
Ebeam systems may require additional steps to limit the control loop’s
response during arcing. First, be sure Max. & Min. power are set to limit the
output to reasonable values for this material and rate. Slew Rate can further
limit too-aggressive power changes. Remember that slew rate is % of full scale
per second. At rates below 10 Å/s, a slew rate of 1-2% per second is common.
Finally, decreasing the filter Alpha will limit the PID response to occasional
large noise spikes, such as from arcing.
IPN 074-549-P1A
8 - 9
Page 86

SQM-242 Operating Manual
This page is intentionally blank.
8 - 10
IPN 074-549-P1A
Page 87

9.1 Basics
M
f
M
q
-------
F
F
q
-----------=
T
f
KF
d
f
----------------=
SQM-242 Operating Manual
Chapter 9
Measurement and Control Theory
The Quartz Crystal deposition Monitor, or QCM, utilizes the piezoelectric sensitivity
of a quartz monitor crystal to added mass. The QCM uses this mass sensitivity to
control the deposition rate and final thickness of a vacuum deposition. When a
voltage is applied across the faces of a properly shaped piezoelectric crystal, the
crystal is distorted and changes shape in proportion to the applied voltage. At
certain discrete frequencies of applied voltage, a condition of very sharp
electro-mechanical resonance is encountered. When mass is added to the face of
a resonating quartz crystal, the frequency of these resonances are reduced. This
change in frequency is very repeatable and is precisely understood for specific
oscillating modes of quartz. This heuristically easy to understand phenomenon is
the basis of an indispensable measurement and process control tool that can easily
detect the addition of less than an atomic layer of an adhered foreign material.
In the late 1950’s it was noted by Sauerbrey
frequency, DF = F
frequencies, F
and Fq respectively, is related to the change in mass from the
c
added material, M
, of a quartz crystal with coated (or composite) and uncoated
q-Fc
, as follows:
f
1,2
and Lostis3 that the change in
[6]
where M
is the mass of the uncoated quartz crystal. Simple substitutions lead to
q
the equation that was used with the first “frequency measurement” instruments:
[7]
IPN 074-549-P1A
where the film thickness, T
, is proportional (through K) to the frequency change,
f
DF, and inversely proportional to the density of the film, d
2
N
atdq/Fq
; where dq (= 2.649 gm/cm3) is the density of single crystal quartz and Nat
. The constant, K =
f
(=166100 Hz cm) is the frequency constant of AT cut quartz. A crystal with a
starting frequency of 6.0 MHz will display a reduction of its frequency by 2.27 Hz
when 1 angstrom of Aluminum (density of 2.77 gm/cm
3
) is added to its surface. In
this manner the thickness of a rigid adlayer is inferred from the precise
measurement of the crystal’s frequency shift. The quantitative knowledge of this
1.G. Z. Sauerbrey, Phys. Verhand .8, 193 (1957)
2.G. Z. Sauerbrey, Z. Phys. 155
3.P. Lostis, Rev. Opt. 38
,206 (1959)
,1 (1959)
9 - 1
Page 88

SQM-242 Operating Manual
effect provides a means of determining how much material is being deposited on a
substrate in a vacuum system, a measurement that was not convenient or practical
prior to this understanding.
9.1.1 Monitor Crystals
No matter how sophisticated the electronics surrounding it, the essential device of
the deposition monitor is the quartz crystal. The quartz crystal shown in Figure 9-1
has a frequency response spectrum that is schematically shown in Figure 9-2. The
ordinate represents the magnitude of response, or current flow of the crystal, at the
specified frequency.
Figure 9-1 Quartz Resonator
The lowest frequency response is primarily a “thickness shear” mode that is called
the fundamental. The characteristic movement of the thickness shear mode is for
displacement to take place parallel to the major monitor crystal faces. In other
words, the faces are displacement antinodes as shown in Figure 9-3. The
responses located slightly higher in frequency are called anharmonics; they are a
combination of the thickness shear and thickness twist modes. The response at
about three times the frequency of the fundamental is called the third
quasiharmonic. There are also a series of anharmonics slightly higher in frequency
associated with the quasiharmonic.
The monitor crystal design depicted in Figure 9-1 is the result of several significant
improvements from the square crystals with fully electroded plane parallel faces
that were first used. The first improvement was to use circular crystals. This
increased symmetry greatly reduced the number of allowed vibrational modes. The
second set of improvements was to contour one face of the crystal and to reduce
the size of the exciting electrode. These improvements have the effect of trapping
the acoustic energy. Reducing the electrode diameter limits the excitation to the
central area. Contouring dissipates the energy of the traveling acoustic wave
before it reaches the edge of the crystal. Energy is not reflected back to the center
where it can interfere with other newly launched waves, essentially making a small
crystal appear to behave as though it is infinite in extent. With the crystal’s
vibrations restricted to the center, it is practical to clamp the outer edges of the
crystal to a holder and not produce any undesirable effects. Contouring also
IPN 074-549-P1A
9 - 2
Page 89

SQM-242 Operating Manual
5.981 MHz 15 ohm
6.153 MHz 50 ohm
6.194 MHz 40 ohm
6.333 MHz 142 ohm
6.337 MHz 105 ohm
6.348 MHz 322 ohm
6.419 MHz 350 ohm
17.792 MHz 278 ohm
17.957 MHz 311 ohm
18.133 MHz 350 ohm
Log of relative intensity (Admittance)
Frequency (in MHz)
1
10
1
100
1
1000
6 7 17 18
reduces the intensity of response of the generally unwanted anharmonic modes;
hence, the potential for an oscillator to sustain an unwanted oscillation is
substantially reduced.
Figure 9-2 Frequency Response Spectrum
The use of an adhesion layer has improved the electrode-to-quartz bonding,
reducing “rate spikes” caused by micro-tears between the electrode and the quartz
as film stress rises. These micro-tears leave portions of the deposited film
unattached and therefore unable to participate in the oscillation. These free
portions are no longer detected and the wrong thickness consequently inferred.
The “AT” resonator is usually chosen for deposition monitoring because at room
temperature it can be made to exhibit a very small frequency change due to
temperature changes. Since there is presently no way to separate the frequency
change caused by added mass (which is negative) or even the frequency changes
caused by temperature gradients across the crystal or film induced stresses, it is
IPN 074-549-P1A
essential to minimize these temperature-induced changes. It is only in this way that
small changes in mass can be measured accurately.
9 - 3
Page 90

SQM-242 Operating Manual
displacement node
X
X
X
2
1
3
E
M
f
M
q
-------
TcTq–
T
q
----------------------
F
F
c
-----------==
Figure 9-3 Thickness Shear Displacement
9.1.2 Period Measurement Technique
Although instruments using equation [7] were very useful, it was soon noted they
had a very limited range of accuracy, typically holding accuracy for DF less than
0.02 F
where T
and the bare crystal respectively. The period measurement technique was the
outgrowth of two factors; first, the digital implementation of time measurement, and
second, the recognition of the mathematically rigorous formulation of the
proportionality between the crystal’s thickness, I
= 1/F
oscillator, or reference oscillator, not affected by the deposition and usually much
higher in frequency than the monitor crystal. This reference oscillator is used to
generate small precision time intervals which are used to determine the oscillation
period of the monitor crystal. This is done by using two pulse accumulators. The
first is used to accumulate a fixed number of cycles, m, of the monitor crystal. The
second is turned on at the same time and accumulates cycles from the reference
oscillator until m counts are accumulated in the first. Since the frequency of the
reference is stable and known, the time to accumulate the m counts is known to an
accuracy equal to ± 2/F
. In 1961 it was recognized by Behrndt4 that:
q
and Tq are the periods of oscillation of the crystal with film (composite)
c
. Electronically the period measurement technique uses a second crystal
q
where Fr is the reference oscillator’s frequency. The
r
, and the period of oscillation, Tq
q
[8]
IPN 074-549-P1A
9 - 4
4.K. H. Behrndt, J. Vac. Sci. Technol. 8, 622 (1961)
Page 91

SQM-242 Operating Manual
T
f
Natd
q
dfFcZ
------------------
arctan Z tan
FqFc–
F
q
-------------------------
=
monitor crystal’s period is (n/Fr)/m where n is the number of counts in the second
accumulator. The precision of the measurement is determined by the speed of the
reference clock and the length of the gate time (which is set by the size of m).
Increasing one or both of these leads to improved measurement precision.
Having a high frequency reference oscillator is important for rapid measurements
(which require short gating times), low deposition rates and low density materials.
All of these require high time precision to resolve the small, mass induced
frequency shifts between measurements. When the change of a monitor crystal’s
frequency between measurements is small, that is, on the same order of size as
the measurement precision, it is not possible to establish quality rate control. The
uncertainty of the measurement injects more noise into the control loop, which can
be counteracted only by longer time constants. Long time constants cause the
correction of rate errors to be very slow, resulting in relatively long term deviations
from the desired rate. These deviations may not be important for some simple films,
but can cause unacceptable errors in the production of critical films such as optical
filters or very thin layered superlattices grown at low rates. In many cases the
desired properties of these films can be lost if the layer to layer reproducibility
exceeds one, or two, percent. Ultimately, the practical stability and frequency of the
reference oscillator limits the precision of measurement for conventional
instrumentation.
9.1.3 Z-match Technique
After learning of fundamental work by Miller and Bolef 5, which rigorously treated
the resonating quartz and deposited film system as a one-dimensional continuous
acoustic resonator, Lu and Lewis
1972. Advances in electronics taking place at the same time, namely the
micro-processor, made it practical to solve the Z-match equation in “real-time”.
Most deposition process controllers/monitors sold today use this sophisticated
equation that takes into account the acoustic properties of the resonating quartz
and film system as shown in equation [9].
IPN 074-549-P1A
where Z=(d
quq/dfuf
1/2
)
is the acoustic impedance ratio and uq and uf are the shear
moduli of the quartz and film, respectively. Finally, there was a fundamental
understanding of the frequency-to-thickness conversion that could yield
theoretically correct results in a time frame that was practical for process control.
To achieve this new level of accuracy requires only that the user enter an additional
material parameter, Z, for the film being deposited. This equation has been tested
6
developed the simplifying Z-Match® equation in
[9]
5.J. G. Miller and D. I. Bolef, J. Appl. Phys. 39, 5815, 4589 (1968)
6.C. Lu and O. Lewis, J Appl. Phys. 43
, 4385 (1972)
9 - 5
Page 92

SQM-242 Operating Manual
for a number of materials, and has been found to be valid for frequency shifts
equivalent to F
and equation [8] was valid only to ~0.05F
9.1.4 Active Oscillator
The SQM-242 relies on the use of an active oscillator circuit, Specifically the type
schematically shown in Figure 9-4. This circuit actively keeps the crystal in
resonance, so that any type of period or frequency measurement may be made. In
this type of circuit, oscillation is sustained as long as the gain provided by the
amplifiers is sufficient to offset losses in the crystal and circuit and the crystal can
provide the required phase shift. The basic crystal oscillator’s stability is derived
from the rapid change of phase for a small change in the crystal’s frequency near
the series resonance point, as shown in Figure 9-6 on page 9-7.
Figure 9-4 Active Oscillator Circuit
= 0.4Fq. Keep in mind that equation [7] was valid to only 0.02Fq
f
.
q
9 - 6
The active oscillator circuit is designed so the crystal is required to produce a phase
shift of 0 degrees, which allows it to operate at the series resonance point. Longand short-term frequency stabilities are a property of crystal oscillators because
very small frequency changes are needed to sustain the phase shift required for
oscillation. Frequency stability is provided by the quartz crystal even though there
are long term changes in electrical component values caused by temperature or
aging or short-term noise-induced phase jitter.
As mass is added to a crystal, its electrical characteristics change. Figure 9-5 on
page 9-7 is the same plot as Figure 9-6 overlaid with the response of a heavily
loaded crystal.
IPN 074-549-P1A
Page 93

SQM-242 Operating Manual
Figure 9-5 Heavily Loaded Crystal
The crystal has lost the steep slope displayed in Figure 9-6. Because the phase
slope is less steep, any noise in the oscillator circuit translates into a greater
frequency shift than that which would be produced with a new crystal. In the
extreme, the basic phase/frequency shape is not preserved and the crystal is not
able to provide a full 90 degrees of phase shift.
Figure 9-6 Crystal Frequency Near Series Resonance Point
IPN 074-549-P1A
The impedance, |Z|, is also noted to rise to an extremely high value. When this
happens it is often more favorable for the oscillator to resonate at one of the
anharmonic frequencies. This condition is sometimes short lived, with the oscillator
switching between the fundamental and anharmonic modes, or it may continue to
oscillate at the anharmonic. This condition is known as mode hopping and in
addition to annoying rate noise can also lead to false termination of the film
because of the apparent frequency change. It is important to note that the
SQM-242 will frequently continue to operate under these conditions; in fact there
is no way to tell this has happened except that the film’s thickness is suddenly
apparently thinner by an amount equivalent to the frequency difference between
the fundamental and the anharmonic that is sustaining the oscillation.
9 - 7
Page 94

SQM-242 Operating Manual
Output
Input
------------------
K
p
L–sexp
T
1
s1+
-------------------------------=
9.1.5 Control Loop Theory
The instrumental advances in measurement speed, precision and reliability would
not be complete without a means of translating this improved information into
improved process control. For a deposition process, this means keeping the
deposition rate as close as possible to the desired rate. The purpose of a control
loop is to take the information flow from the measurement system and to make
power corrections that are appropriate to the characteristics of the particular
evaporation source. When properly operating, the control system translates small
errors in the controlled parameter, or rate, into the appropriate corrections in the
manipulated parameter, power. The controller’s ability to quickly and accurately
measure and then react appropriately to the small changes keeps the process from
deviating very far from the set point.
The controller model most commonly chosen for converting error into action is
called PID. In the PID, P stands for proportional, I stands for integral and D stands
for derivative action. Certain aspects of this model will be examined in detail a little
further on. The responsiveness of an evaporation source can be found by
repetitively observing the system response to a disturbance under a particular set
of controller settings. After observing the response, improved controller parameters
are estimated and then tried again until satisfactory control is obtained. Control,
when it is finally optimized, essentially matches the parameters of the controller
model to the characteristics of the evaporation source.
Techniques for calculating optimum source control parameters can be classified by
the type of data used for tuning. They fall into basically three categories:
Closed Loop Methods
Open Loop Methods
Frequency Response Methods
Of these categories, the open loop methods are considered superior. They are
considered superior because of the ease with which the necessary experimental
data can be obtained and because of the elimination (to a large extent) of trial and
error when the technique is applied. The important response characteristics are
determined as shown in Figure 9-7.
In general, it is not possible to characterize all processes exactly; some
approximation must be applied. The most common is to assume that the dynamic
characteristics of the process can be represented by a first-order lag plus a dead
time. The Laplace transform for this model (conversion to the s domain) is
approximated as:
[10]
IPN 074-549-P1A
9 - 8
Page 95

SQM-242 Operating Manual
Ms Kc1
1
T
i
s
------- T
d
s++
Es=
Three parameters are determined from the process reaction curve. They are the
steady state gain, K
, the dead time, L, and the time constant, T1. Several methods
p
have been proposed to extract the required parameters from the system response
as graphed in Figure 9-7. These are: a one point fit at 63.2% of the transition (one
time constant); a two point exponential fit; and a weighted least-square-exponential
fit. From the above information a process is sufficiently characterized so that a
controller algorithm may be customized.
Figure 9-7 Response of Process To An Open Loop Step Change
(At t=0 Control Signal is Increased)
A controller model used extensively is the PID type, shown in Laplace form in
equation [11].
[11]
IPN 074-549-P1A
Where
M(s) = manipulated variable or power
= controller gain (the proportional term)
K
c
= integral time
T
i
= derivative time
T
d
E(s) = process error
Figure 9-8 represents the controller algorithm and a process with first order lag plus
a dead time. The process block implicitly includes the dynamics of the measuring
devices and the final control elements, in our case the evaporator power supply.
9 - 9
Page 96

SQM-242 Operating Manual
Kc1
1
Tis
------- Tds++
K
p
L–sexp
T1s1+
-------------------------------
Rs
Es
S
Cs
setpoint error
[controller] [process]
+
deposition
rate
ISE e
2
tdt=
IAE e tdt=
ITAE t e tdt=
R(s) represents the rate setpoint. The feedback mechanism is the error generated
by the difference between the measured deposition rate, C(s), and the rate set
point, R(s).
Figure 9-8 PID Controller Block Diagram
The key to using any control system is to choose the proper values of Kc, Td and
T
. Optimum control is a somewhat subjective quantity as noted by the presence of
i
several mathematical definitions as shown below.
The Integral of the Squared Error (ISE) is a commonly proposed criterion of
performance for control systems.
It can be described as:
[12]
where error = e = setpoint minus the measured rate. The ISE measure is relatively
insensitive to small errors, but large errors contribute heavily to the value of the
integral. Consequently, using ISE as a criterion of performance will result in
responses with small overshoots but long settling times, since small errors
occurring late in time contribute little to the integral.
The Integral of the Absolute Value of the error (IAE) has been frequently proposed
as a criterion of performance:
[13]
This criterion is more sensitive to small errors, but less sensitive to large errors,
than ISE.
Graham and Lathrop
Error (ITAE) as an alternate criterion of performance:
7
introduced the Integral of Time multiplied by the Absolute
[14]
IPN 074-549-P1A
9 - 10
7.Graham, D., and Lanthrop, R.C., “The Synthesis of Optimum Transient Response: Criteria and
Standard Forms, Transactions IEEE, vol. 72 pt. II, November 1953.
Page 97

SQM-242 Operating Manual
K
c
1.36 KpLT
1
0.947–
=
T
i
1.19T
1
LT
1
0.738
=
T
d
0.381T
1
LT
1
0.995
=
ITAE is insensitive to the initial and somewhat unavoidable errors, but it will weight
heavily any errors occurring late in time. Optimum responses defined by ITAE will
consequently show short total response times and larger overshoots than with
either of the other criteria. It has been found that this criteria is generally most
useful for deposition process control.
The most satisfactory performance criterion for deposition controllers is the ITAE.
There will be overshoot, but the response time is quick, and the settling time is
short. For all of the above integral performance criteria, controller tuning relations
have been developed to minimize the associated errors. Using manually entered
or experimentally determined process response coefficients, ideal PID controller
coefficients can be readily calculated for the ITAE criteria as shown below.
[15]
[16]
[17]
For slow systems, in order to help avoid controller windup (windup is the rapid
increase in control signal before the system has the chance to respond to the
changed signal), the time period between manipulated variable (control voltage)
changes is lengthened. This allows the system to respond to the previous controller
setting change, and aggressive controller settings can be used. A secondary
advantage is that immunity to process noise is increased since the data used for
control is now comprised of multiple readings instead of a single rate
measurement, taking advantage of the mass integrating nature of the quartz
crystal.
With process systems that respond quickly (short time constant) and with little to
no measurable dead time, the PID controller often has difficulty with the deposition
process noise (beam sweep, fast thermal shorts of melt to crucible, etc.). In these
situations a control algorithm used successfully is an integral/reset type of
IPN 074-549-P1A
controller. This type of controller will always integrate the error, driving the system
towards zero error. This technique works well when there is little or no dead time.
If this technique is used on a process with measurable lag or dead time, then the
control loop will tend to be oscillatory due to the control loop over-compensating
the control signal before the system has a chance to respond.
9 - 11
Page 98

SQM-242 Operating Manual
This page is intentionally blank.
9 - 12
IPN 074-549-P1A
Page 99

A.1 Introduction
CAUTION
The following Table A-1 represents the density and Z-ratio for various materials.
The list is alphabetical by chemical formula.
SQM-242 Operating Manual
Appendix A
Material Table
Some of these materials are toxic. Please consult the
material safety data sheet and safety instructions before
use.
An * is used to indicate that a Z-ratio has not been established for a given material.
−3
A value of 1.000 is defaulted in these situations. Density is given in g·cm
Table A-1 Material Table
Formula Density Z-Ratio Material Name
Ag 10.500 0.529 Silver
AgBr 6.470 1.180 Silver Bromide
AgCl 5.560 1.320 Silver Chloride
Al 2.700 1.080 Aluminum
Al
2O3
Al
4C3
AIF
3
AIN 3.260 *1.000 Aluminum Nitride
IPN 074-549-P1A
AlSb 4.360 0.743 Aluminum Antimonide
As 5.730 0.966 Arsenic
As
2Se3
Au 19.300 0.381 Gold
B 2.370 0.389 Boron
3.970 0.336 Aluminum Oxide
2.360 *1.000 Aluminum Carbide
3.070 *1.000 Aluminum Fluoride
4.750 *1.000 Arsenic Selenide
.
B
203
B
C 2.370 *1.000 Boron Carbide
4
BN 1.860 *1.000 Boron Nitride
Ba 3.500 2.100 Barium
BaF
2
1.820 *1.000 Boron Oxide
4.886 0.793 Barium Fluoride
A - 1
Page 100

SQM-242 Operating Manual
Table A-1 Material Table (continued)
Formula Density Z-Ratio Material Name
BaN2O
6
3.244 1.261 Barium Nitrate
BaO 5.720 *1.000 Barium Oxide
BaTiO
BaTiO
3
3
5.999 0.464 Barium Titanate (Tetr)
6.035 0.412 Barium Titanate (Cubic)
Be 1.850 0.543 Beryllium
BeF
2
1.990 *1.000 Beryllium Fluoride
BeO 3.010 *1.000 Beryllium Oxide
Bi 9.800 0.790 Bismuth
Bi
Bi
Bi
Bi
BiF
2O3
2S3
2Se3
2Te3
3
8.900 *1.000 Bismuth Oxide
7.390 *1.000 Bismuth Trisulphide
6.820 *1.000 Bismuth Selenide
7.700 *1.000 Bismuth Telluride
5.320 *1.000 Bismuth Fluoride
C 2.250 3.260 Carbon (Graphite)
C 3.520 0.220 Carbon (Diamond)
C
8H8
1.100 *1.000 Parlyene (Union Carbide)
Ca 1.550 2.620 Calcium
CaF
2
3.180 0.775 Calcium Fluoride
CaO 3.350 *1.000 Calcium Oxide
CaO-SiO
CaSO
4
CaTiO
3
CaWO
4
2.900 *1.000 Calcium Silicate (3)
2
2.962 0.955 Calcium Sulfate
4.100 *1.000 Calcium Titanate
6.060 *1.000 Calcium Tungstate
Cd 8.640 0.682 Cadmium
CdF
2
6.640 *1.000 Cadmium Fluoride
CdO 8.150 *1.000 Cadmium Oxide
CdS 4.830 1.020 Cadmium Sulfide
CdSe 5.810 *1.000 Cadmium Selenide
CdTe 6.200 0.980 Cadmium Telluride
Ce 6.780 *1.000 Cerium
CeF
CeO
3
2
6.160 *1.000 Cerium (III) Fluoride
7.130 *1.000 Cerium (IV) Dioxide
Co 8.900 0.343 Cobalt
IPN 074-549-P1A
A - 2
 Loading...