


NIRCal 5.5
Operation Manual
11593588 en
Imprint
Product Identification: Operation Manual, NIRCal 5.5 11593588 en
Publication date: 04.2013, Version A
BÜCHI Labortechnik AG
Meierseggstrasse 40
Postfach
CH-9230 Flawil 1
E-Mail: quality@buchi.com
BUCHI reserves the right to make changes to the manual as deemed necessary in the interest of experience; especially in respect to structure, illustrations and technical depth.
This manual is copyright. Information from it may not be reproduced, distributed, or used for competitive purposes, nor made available to third parties. The manufacture of any component with the aid of this manual without prior written agreement is also prohibited.
Table of Contents
1 Introduction .................................................................................................................................. |
10 |
|
1.1....... |
Introduction to NIR.......................................................................................................... |
10 |
1.1.1 |
Spectroscopy.................................................................................................................. |
10 |
1.1.2 |
Chemometrics ................................................................................................................ |
11 |
1.1.3 |
Cluster calibration........................................................................................................... |
12 |
1.1.4 |
Quantitative calibration ................................................................................................... |
14 |
1.2....... |
Introduction to NIRCal .................................................................................................... |
18 |
1.2.1 |
General ........................................................................................................................... |
18 |
1.2.2 |
Starting NIRCal............................................................................................................... |
19 |
1.2.3 |
NIRCal Project................................................................................................................ |
20 |
1.2.4 |
Spectra Overview ........................................................................................................... |
20 |
1.2.5 |
Properties Overview ....................................................................................................... |
21 |
1.2.6 |
Calibration Validation Methods....................................................................................... |
22 |
1.2.7 |
Calibration Methods........................................................................................................ |
22 |
1.2.8 |
Calibrations Overview .................................................................................................... |
23 |
1.2.9 |
Matrices Overview .......................................................................................................... |
24 |
1.2.10 |
Data ................................................................................................................................ |
24 |
1.2.11 |
Selections ....................................................................................................................... |
25 |
1.2.12 |
Graphics ......................................................................................................................... |
27 |
1.2.13 |
Protocols......................................................................................................................... |
29 |
2 Tutorials31 |
|
|
2.1....... |
Qualitative....................................................................................................................... |
31 |
2.1.1 |
Qualitative Tutorial.......................................................................................................... |
31 |
2.1.2 |
Flow Chart Qualitative .................................................................................................... |
31 |
2.1.3 |
Selecting the Calibration Method ................................................................................... |
32 |
2.1.4 |
Selecting the Calibration and Validation Spectra ........................................................... |
32 |
2.1.5 |
Selecting the Calibration Wavelengths........................................................................... |
32 |
2.1.6 |
Selecting the Calibration Properties ............................................................................... |
33 |
2.1.7 |
Applying Data Pretreatments ......................................................................................... |
33 |
2.1.8 |
Performing a calibration (calculation) ............................................................................. |
33 |
2.1.9 |
Primary Principal Components ....................................................................................... |
33 |
2.1.10 |
Secondary Principal Components .................................................................................. |
34 |
2.1.11 |
Judging the Calibration................................................................................................... |
34 |
2.1.12 |
Save Calibration - Lifecycle ............................................................................................ |
34 |
2.1.13 |
SIMCA ............................................................................................................................ |
35 |
2.2....... |
Quantitative .................................................................................................................... |
35 |
2.2.1 |
Quantitative Tutorial ....................................................................................................... |
35 |
2.2.2 |
Flow Chart ...................................................................................................................... |
35 |
2.2.3 |
Selecting the Calibration Method ................................................................................... |
36 |
2.2.4 |
Selecting the Calibration and Validation Spectra ........................................................... |
36 |
2.2.5 |
Selecting the Calibration Wavelengths........................................................................... |
36 |
2.2.6 |
Selecting the Calibration Properties ............................................................................... |
37 |
2.2.7 |
Applying Data Pretreatments ......................................................................................... |
37 |
2.2.8 |
Performing a calibration (calculation) ............................................................................. |
37 |
2.2.9 |
Primary Principal Components ....................................................................................... |
38 |
2.2.10 |
Secondary Principal Components .................................................................................. |
38 |
2.2.11 |
Judging the Calibration................................................................................................... |
38 |
2.2.12 |
Save Calibration - Lifecycle ............................................................................................ |
39 |
2.2.13 |
Create a Quantitative Calibration with Cross Validation ................................................ |
39 |
3 Chemometrics .............................................................................................................................. |
41 |
|
3.1....... |
Calibration Methods........................................................................................................ |
41 |
3.1.1 |
Principal Component Analysis: PCA .............................................................................. |
41 |
3.1.2 |
Cluster: CLU ................................................................................................................... |
46 |
3.1.3 |
SIMCA ............................................................................................................................ |
49 |
3.1.4 |
Transform Cluster to SIMCA .......................................................................................... |
50 |
3.1.5 |
Multiple Linear Regression: MLR ................................................................................... |
53 |
|
|
|
NIRCal 5.5 Manual, Version A |
3 |
|
NIRCal 5.5 Software Manual |
|
|
3.1.6 |
Principal Component Regression: PCR ......................................................................... |
54 |
3.1.7 |
Partial Least Squares Regression: PLS ......................................................................... |
54 |
3.2....... |
Calibration Validation Methods....................................................................................... |
55 |
3.2.1 |
Validation Set (VS) ......................................................................................................... |
55 |
3.2.2 |
Cross Validation (CV) ..................................................................................................... |
55 |
3.3....... |
Selections ....................................................................................................................... |
69 |
3.3.1 |
Calibration Method Selection ......................................................................................... |
69 |
3.3.2 |
Validation Method Selection........................................................................................... |
70 |
3.3.3 |
Data Sets ........................................................................................................................ |
70 |
3.3.4 |
Edit Data Sets Dialog ..................................................................................................... |
71 |
3.3.5 |
Spectra Data Set ............................................................................................................ |
72 |
3.3.6 |
Wavelength Data Set ..................................................................................................... |
78 |
3.3.7 |
Properties Data Set ........................................................................................................ |
82 |
3.3.8 |
PC Data Set.................................................................................................................... |
85 |
3.4....... |
Calibration Wizard .......................................................................................................... |
86 |
3.4.1 |
Calibration Wizard .......................................................................................................... |
86 |
3.5....... |
Pretreatments ................................................................................................................. |
89 |
3.5.1 |
Pretreatments ................................................................................................................. |
89 |
3.5.2 |
Available Pretreatments ................................................................................................. |
91 |
3.5.3 |
Normalization.................................................................................................................. |
92 |
3.5.4 |
Offset ............................................................................................................................ |
100 |
3.5.5 |
Smoothing .................................................................................................................... |
105 |
3.5.6 |
Derivatives.................................................................................................................... |
107 |
3.5.7 |
Transformation ............................................................................................................. |
113 |
3.5.8 |
Filter.............................................................................................................................. |
118 |
3.6....... |
Primary PCs ................................................................................................................. |
120 |
3.7....... |
Adjusting Primary PCs (Calculation Parameters) ........................................................ |
123 |
3.8....... |
Secondary PCs............................................................................................................. |
124 |
3.8.1 |
Secondary PCs for qualitative Calibration.................................................................... |
124 |
3.8.2 |
Secondary PCs for quantitative Calibration ................................................................. |
127 |
3.9....... |
Secondary PC Selection .............................................................................................. |
129 |
3.9.1 |
Secondary PC Selection using NIR-Explorer ............................................................... |
129 |
3.9.2 |
Secondary PC Selection using Edit Data Sets Dialog ................................................. |
130 |
3.10..... |
PCs (Factor Selection Wizard) ..................................................................................... |
131 |
3.11..... |
Blow Up Limits.............................................................................................................. |
131 |
3.11.1 |
Blow Up limits quantitative calibration .......................................................................... |
131 |
3.11.2 |
Blow Up limits qualitative calibration ............................................................................ |
132 |
3.12..... |
Outlier Detection........................................................................................................... |
133 |
3.13..... |
Q-Value ........................................................................................................................ |
136 |
3.14..... |
Change X-Unit Wavelength / Wavenumber ................................................................. |
136 |
3.15..... |
Convert and Import spectra from other instruments to DB .......................................... |
136 |
3.15.1 |
Procedure of Spectra Import ........................................................................................ |
137 |
3.15.2 |
Procedure of Spectra Conversion: ............................................................................... |
137 |
3.15.3 |
Explanation of the Spectra Converter .......................................................................... |
139 |
3.16..... |
Calibration Handling ..................................................................................................... |
140 |
3.16.1 |
Calibrations without Lifecycle ....................................................................................... |
141 |
3.16.2 |
Calibrations with Lifecycle ............................................................................................ |
141 |
3.16.3 |
Project Handling ........................................................................................................... |
145 |
3.17..... |
Protocols....................................................................................................................... |
145 |
3.17.1 |
Calibration Protocol Qualitative .................................................................................... |
145 |
3.17.2 |
Calibration Protocol Quantitative.................................................................................. |
152 |
3.17.3 |
Calibration Protocol Quantitative CV............................................................................ |
157 |
3.17.4 |
Prediction Protocol ....................................................................................................... |
162 |
3.18..... |
Matrices ........................................................................................................................ |
168 |
3.18.1 |
How to display matrices ............................................................................................... |
168 |
3.18.2 |
Calibration Residual Limits ........................................................................................... |
169 |
3.18.3 |
Calibration Residual Limits with Blow Up ..................................................................... |
169 |
3.18.4 |
Calibration Score Limits ............................................................................................... |
170 |
3.18.5 |
Cluster per Property ..................................................................................................... |
170 |
3.18.6 |
Consistency .................................................................................................................. |
170 |
3.18.7 |
Correlation Spectra....................................................................................................... |
171 |
3.18.8 |
Correlation Wavelength ................................................................................................ |
171 |
|
|
|
4 |
|
NIRCal 5.5 Manual, Version A |

|
|
Table Of Contents |
3.18.9 |
Creator.......................................................................................................................... |
171 |
3.18.10 |
CV C-Set PRESS ......................................................................................................... |
172 |
3.18.11 |
CV Group Index............................................................................................................ |
172 |
3.18.12 |
CV Leverages............................................................................................................... |
172 |
3.18.13 |
CV Predicted Property.................................................................................................. |
172 |
3.18.14 |
CV Property Residuum................................................................................................. |
173 |
3.18.15 |
CV Regression Coefficients[1] ..................................................................................... |
173 |
3.18.16 |
CV Regression Coefficients[1] Mean ........................................................................... |
173 |
3.18.17 |
CV Regression Coefficients[1] Sdev ............................................................................ |
173 |
3.18.18 |
CV Regression Coefficients[1] t-test ............................................................................ |
174 |
3.18.19 |
CV Regression Coefficients[1] Variance to final Calib ................................................. |
174 |
3.18.20 |
CV SECV...................................................................................................................... |
175 |
3.18.21 |
CV Spectra Residuals .................................................................................................. |
175 |
3.18.22 |
CV V-Set PRESS ......................................................................................................... |
175 |
3.18.23 |
C-Set BCAP-PRES....................................................................................................... |
175 |
3.18.24 |
C-Set BIAS ................................................................................................................... |
176 |
3.18.25 |
C-Set Mean Property.................................................................................................... |
176 |
3.18.26 |
C-Set Mean Spectrum .................................................................................................. |
176 |
3.18.27 |
C-Set PRESS ............................................................................................................... |
176 |
3.18.28 |
C-Set Property Dependencies...................................................................................... |
177 |
3.18.29 |
C-Set Regression Coefficient ....................................................................................... |
177 |
3.18.30 |
C-Set Regression Intercept .......................................................................................... |
178 |
3.18.31 |
C-Set Regression Slope ............................................................................................... |
178 |
3.18.32 |
C-Set SEE (SEC) ......................................................................................................... |
178 |
3.18.33 |
C-Set Spectra Residuum Limits ................................................................................... |
179 |
3.18.34 |
C-Set Spectra Residuum Max ...................................................................................... |
179 |
3.18.35 |
C-Set Spectra Residuum Min ....................................................................................... |
180 |
3.18.36 |
C-Set Spectra Residuum MinMax ................................................................................ |
180 |
3.18.37 |
C-Set Std Orig Property ............................................................................................... |
180 |
3.18.38 |
C-Set Std Pred Property............................................................................................... |
180 |
3.18.39 |
C-Set X-PRESS............................................................................................................ |
180 |
3.18.40 |
Durbin-Watson Factor Statistics................................................................................... |
181 |
3.18.41 |
Eigenvalue.................................................................................................................... |
182 |
3.18.42 |
Instrument..................................................................................................................... |
183 |
3.18.43 |
Leverages..................................................................................................................... |
183 |
3.18.44 |
Loadings or Principal Components .............................................................................. |
183 |
3.18.45 |
Original Property........................................................................................................... |
184 |
3.18.46 |
Original Spectra............................................................................................................ |
185 |
3.18.47 |
PCs or Factor ............................................................................................................... |
185 |
3.18.48 |
PCR B-Matrix................................................................................................................ |
186 |
3.18.49 |
Predicted Property........................................................................................................ |
186 |
3.18.50 |
Pretreated Property ...................................................................................................... |
187 |
3.18.51 |
Pretreated Spectra ....................................................................................................... |
187 |
3.18.52 |
Property ........................................................................................................................ |
188 |
3.18.53 |
Property Adjacency ...................................................................................................... |
188 |
3.18.54 |
Property Box Center ..................................................................................................... |
189 |
3.18.55 |
Property Box Center Uniformity.................................................................................... |
189 |
3.18.56 |
Property Box Radii........................................................................................................ |
189 |
3.18.57 |
Property F-Test backward ............................................................................................ |
189 |
3.18.58 |
Property F-Test forward ............................................................................................... |
190 |
3.18.59 |
Property Interference.................................................................................................... |
190 |
3.18.60 |
Property missing Values............................................................................................... |
190 |
3.18.61 |
Property Nearest Neighbor........................................................................................... |
190 |
3.18.62 |
Property Residuum....................................................................................................... |
191 |
3.18.63 |
Property Score Diffusion .............................................................................................. |
191 |
3.18.64 |
Property Score Disorder ............................................................................................... |
192 |
3.18.65 |
Property Score Extension............................................................................................. |
192 |
3.18.66 |
Property Wavelength Regression................................................................................. |
192 |
3.18.67 |
Quant Calib. Statistics .................................................................................................. |
192 |
3.18.68 |
Q-Values....................................................................................................................... |
193 |
3.18.69 |
Real time ...................................................................................................................... |
194 |
3.18.70 |
Reconstructed Spectra ................................................................................................. |
195 |
NIRCal 5.5 Manual, Version A |
5 |
|
NIRCal 5.5 Software Manual |
|
|
3.18.71 |
Residuals ...................................................................................................................... |
195 |
3.18.72 |
Regression Coefficients [1] .......................................................................................... |
195 |
3.18.73 |
Regression Coefficients / Property Spectra (CLU)....................................................... |
195 |
3.18.74 |
Sample ......................................................................................................................... |
196 |
3.18.75 |
Scores .......................................................................................................................... |
196 |
3.18.76 |
Score Adjacency........................................................................................................... |
198 |
3.18.77 |
SEP Generalized Cross Validation............................................................................... |
198 |
3.18.78 |
Spectra ......................................................................................................................... |
198 |
3.18.79 |
Spectra Property Index................................................................................................. |
199 |
3.18.80 |
Spectra Radii ................................................................................................................ |
199 |
3.18.81 |
Spectra Residuals ........................................................................................................ |
200 |
3.18.82 |
Spectra Residuals too big ............................................................................................ |
200 |
3.18.83 |
Spectra Residuum ........................................................................................................ |
200 |
3.18.84 |
Spectrum Nearest Neighbor......................................................................................... |
201 |
3.18.85 |
Spectrum Nearest Neighbor Index ............................................................................... |
202 |
3.18.86 |
Time.............................................................................................................................. |
202 |
3.18.87 |
V-Set BCAP-PRES....................................................................................................... |
202 |
3.18.88 |
V-Set BIAS ................................................................................................................... |
203 |
3.18.89 |
V-Set PRESS ............................................................................................................... |
203 |
3.18.90 |
V-Set Regression Coefficient ....................................................................................... |
204 |
3.18.91 |
V-Set Regression Intercept .......................................................................................... |
205 |
3.18.92 |
V-Set Regression Slope ............................................................................................... |
205 |
3.18.93 |
V-Set SEE (SEP).......................................................................................................... |
205 |
3.18.94 |
V-Set Spectra Residuum Max ...................................................................................... |
206 |
3.18.95 |
V-Set Spectra Residuum Min ....................................................................................... |
206 |
3.18.96 |
V-Set Std Orig Property................................................................................................ |
206 |
3.18.97 |
V-Set Std Pred Property............................................................................................... |
207 |
3.18.98 |
V-Set X-PRESS............................................................................................................ |
207 |
3.18.99 |
Wavenumber ................................................................................................................ |
207 |
3.18.100 |
X-PRESS...................................................................................................................... |
207 |
3.18.101 |
Y-Scores ....................................................................................................................... |
208 |
3.18.102 |
y-loadings ..................................................................................................................... |
208 |
3.19..... |
NIRCal Configuration Options ...................................................................................... |
209 |
3.19.1 |
Configuration Dialog ..................................................................................................... |
209 |
3.19.2 |
General ......................................................................................................................... |
209 |
3.19.3 |
Journal .......................................................................................................................... |
210 |
3.19.4 |
Calibration Defaults ...................................................................................................... |
212 |
3.19.5 |
Tables ........................................................................................................................... |
213 |
3.19.6 |
2D-Plots ........................................................................................................................ |
213 |
3.19.7 |
3D-Plots ........................................................................................................................ |
215 |
3.19.8 |
System Modules ........................................................................................................... |
217 |
3.19.9 |
Calibration Protocols .................................................................................................... |
217 |
3.19.10 |
Directories .................................................................................................................... |
218 |
3.19.11 |
Cluster Prediction Protocol ........................................................................................... |
219 |
3.20..... |
Menu commands .......................................................................................................... |
220 |
3.20.1 |
File menu...................................................................................................................... |
220 |
3.20.2 |
Edit menu ..................................................................................................................... |
229 |
3.20.3 |
View menu.................................................................................................................... |
230 |
3.20.4 |
Workspace.................................................................................................................... |
241 |
3.20.5 |
Project .......................................................................................................................... |
242 |
3.20.6 |
Calibration .................................................................................................................... |
245 |
3.20.7 |
Wizard .......................................................................................................................... |
247 |
3.20.8 |
Modules ........................................................................................................................ |
248 |
3.20.9 |
Windows ....................................................................................................................... |
253 |
3.20.10 |
Help .............................................................................................................................. |
254 |
3.21..... |
Context menu (right mouse) ......................................................................................... |
255 |
3.21.1 |
Add Selection to Set ..................................................................................................... |
255 |
3.21.2 |
Alpha-Blending ............................................................................................................. |
255 |
3.21.3 |
Anti-Aliasing.................................................................................................................. |
255 |
3.21.4 |
Autorotate ..................................................................................................................... |
255 |
3.21.5 |
Choose [x][y] Independent ........................................................................................... |
256 |
3.21.6 |
Choose [xy] Independent ............................................................................................. |
256 |
|
|
|
6 |
|
NIRCal 5.5 Manual, Version A |

|
|
Table Of Contents |
3.21.7 |
Clear Selection ............................................................................................................. |
256 |
3.21.8 |
Colors ........................................................................................................................... |
256 |
3.21.9 |
Copy Plot to Clipboard ................................................................................................. |
256 |
3.21.10 |
Copy Selection To ........................................................................................................ |
256 |
3.21.11 |
Edit Selection................................................................................................................ |
257 |
3.21.12 |
Export Table ................................................................................................................. |
257 |
3.21.13 |
Fix Table Titles ............................................................................................................. |
257 |
3.21.14 |
Flip X-Axis .................................................................................................................... |
257 |
3.21.15 |
Flip Y-Axis .................................................................................................................... |
257 |
3.21.16 |
Invert Selection............................................................................................................. |
257 |
3.21.17 |
Load Selection from Set ............................................................................................... |
257 |
3.21.18 |
Large Plots ................................................................................................................... |
257 |
3.21.19 |
Mouse Select................................................................................................................ |
257 |
3.21.20 |
Mouse Select Lasso ..................................................................................................... |
257 |
3.21.21 |
Mouse X-Axis Select .................................................................................................... |
258 |
3.21.22 |
Mouse Zoom................................................................................................................. |
258 |
3.21.23 |
Number format.............................................................................................................. |
258 |
3.21.24 |
Open data as ................................................................................................................ |
258 |
3.21.25 |
Plot Defaults ................................................................................................................. |
259 |
3.21.26 |
Plot Settings ................................................................................................................. |
259 |
3.21.27 |
Regression Draw Line .................................................................................................. |
259 |
3.21.28 |
Regression Copy Equation........................................................................................... |
259 |
3.21.29 |
Remove Selection from ................................................................................................ |
259 |
3.21.30 |
Snap to Y-Grid.............................................................................................................. |
259 |
3.21.31 |
Snap to X-Grid.............................................................................................................. |
259 |
3.21.32 |
Show Plane .................................................................................................................. |
260 |
3.21.33 |
Show Labels ................................................................................................................. |
260 |
3.21.34 |
Show Line..................................................................................................................... |
260 |
3.21.35 |
Show Selection Colors ................................................................................................. |
260 |
3.21.36 |
Show Cycle Colors ....................................................................................................... |
260 |
3.21.37 |
Show Property Colors .................................................................................................. |
260 |
3.21.38 |
Transpose Data ............................................................................................................ |
260 |
3.21.39 |
Turbo Mode .................................................................................................................. |
260 |
3.21.40 |
Undo Last Pretreatment ............................................................................................... |
260 |
3.21.41 |
Undo Sequence of Pretreatments ................................................................................ |
260 |
3.21.42 |
View Fit ......................................................................................................................... |
261 |
3.21.43 |
Visibility......................................................................................................................... |
261 |
3.22..... |
Toolbar ......................................................................................................................... |
261 |
3.22.1 |
Calibration Toolbar ....................................................................................................... |
261 |
3.22.2 |
Database Toolbar ......................................................................................................... |
262 |
3.22.3 |
File & Edit Toolbar ........................................................................................................ |
262 |
3.22.4 |
Lifecycle........................................................................................................................ |
263 |
3.22.5 |
Modules ........................................................................................................................ |
263 |
3.22.6 |
Options Toolbar ............................................................................................................ |
263 |
3.22.7 |
Pretreatments Toolbar.................................................................................................. |
263 |
3.22.8 |
Pretreatments Advanced Toolbar................................................................................. |
264 |
3.22.9 |
Pretreatments Minibar Toolbar ..................................................................................... |
264 |
3.22.10 |
Pretreatments Gap2 ..................................................................................................... |
265 |
3.22.11 |
Project Toolbar ............................................................................................................. |
265 |
3.22.12 |
Search Import Export Toolbar ...................................................................................... |
266 |
3.22.13 |
Window Toolbar............................................................................................................ |
266 |
3.22.14 |
Wizard Toolbar ............................................................................................................. |
266 |
3.22.15 |
Wizard Workspace ....................................................................................................... |
266 |
3.22.16 |
Zoom & Select Toolbar................................................................................................. |
267 |
4 Appendix..................................................................................................................................... |
269 |
|
4.1....... |
Keyboard Shortcuts ...................................................................................................... |
269 |
4.2....... |
Tips and Tricks ............................................................................................................. |
270 |
4.3....... |
Conventions / Terminology........................................................................................... |
273 |
4.3.1 |
Temporary Settings ...................................................................................................... |
274 |
4.3.2 |
Permanent Settings ...................................................................................................... |
274 |
NIRCal 5.5 Manual, Version A |
7 |

NIRCal 5.5 Software Manual |
|
|
4.4....... |
Characteristic absorbance table................................................................................... |
274 |
5 Software installation.................................................................................................................. |
277 |
|
5.1....... |
Software installation ..................................................................................................... |
277 |
5.1.1 |
Important Notes ............................................................................................................ |
277 |
5.1.2 |
System requirements.................................................................................................... |
277 |
5.1.3 |
Other requirements....................................................................................................... |
277 |
5.1.4 |
Installation procedure ................................................................................................... |
277 |
5.2....... |
Software update ........................................................................................................... |
281 |
5.3....... |
Software licenses ......................................................................................................... |
281 |
5.3.1 |
Software Registration ................................................................................................... |
281 |
5.3.2 |
Activating the License .................................................................................................. |
283 |
8 |
NIRCal 5.5 Manual, Version A |

Welcome
Dear NIRCal user,
NIRCal is recognized as a reliable, comprehensive but also easy to use chemometric software package. It offers a wide variety of tools for method development and optimization.
The NIR spectroscopic technology and the range of applications develops continuously, just as new requirements from users and regulatory authorities. NIRCal is designed
to fulfill those requirements today and in the future.
NIR spectroscopy is a powerful technology, which gives insight in product development projects and sound process understanding enabling optimization of processes and quality. NIRCal is designed to support all those tasks. Through high quality plots and informative workspaces, the analyst gets comprehensive overview of the system under study.
Much of the power in multivariate methods like PCA and PLS lies in the information one can get from interpretation of the models. This manual not only describes the functionality of NIRCal but teaches the user how to interpret the models to ensure the maximum return on your investment in NIR technology.
Should you come across any feature which needs improvement or extension, please do not hesitate to contact us. Your feedback helps us to continuously improve our software and is highly appreciated. Please send an e-mail to: info@buchi.com.
Every effort has been made at BUCHI to ensure that the information in this documentation is correct. BÜCHI Labortechnik AG accepts no responsibility for errors or omissions.
Information in this document is subject to change without notice and does not represent a commitment on the part of BÜCHI Labortechnik AG.
The software and/or files may be used or copied only in accordance with the terms of the license agreement.
BÜCHI Labortechnik AG, CH-9230 Flawil, Switzerland, March 2013.
Explanation of the used safety notes:
NOTE
Information on technical requirements. Non-compliance can lead to faults, inefficiency and production losses.
This manual is stored under: C:\Program Files\Buchi\NIRSolutions\NIRCal Manual.pdf"
NIRCal 5.5 Manual, Version A |
9 |

NIRCal 5.5 Software Manual
1 Introduction
1.1 Introduction to NIR
1.1.1 Spectroscopy
Light is a fast time dependent sequence of electric and magnetic fields propagating in space. Light can be characterised with physical properties, like:
frequency:
wavelength:
wavenumber:
velocity of propagation:
energy:
A summary of the electromagnetic spectrum can be seen in the Picture below. NIR lies between the visible and middle infrared range. With this light, the molecular vibrations are activated, similar to the infrared range.
Most of the molecule vibrations take place at a characteristic frequency which lies between 1012 to 1014 Hz. The osculating molecule interacts with the electrical field or light when the frequencies are the same.
Hz Infrared Light
Not only are the basic vibrations absorbed with very high degree of excitation in the infrared range, but also frequencies 2 or 3 times higher. The harmonic frequencies are absorbed with a lower degree of excitation and lie in the near infrared range.
Using an infrared spectrum, the characterisations of molecules is possible. In the NIR spectra region mainly the overtones and combination tones of -CH, -OH and -NH groups are absorbed, so NIR is suitable mainly for organic substances.
The absorption bands are very broad and they often overlap, which can cause problems by direct interpretation of the spectra. The most often used evaluation method in spectroscopy, the Lambert-
10 |
NIRCal 5.5 Manual, Version A |
Introduction
Beer Law:
has just limited validity in the NIR spectroscopy. The application of chemometrics for the evaluation of NIR spectra is a must.
Advantages of NIR spectroscopy
The relative low degree of absorption coefficient of overtones and combination vibrations causes a low degree of absorbance in the NIR region. Solids have a high degree of reflected light and liquids can be measured for path lengths of several mm.
no sample preparation is necessary.
The materials for the optics can be quartz, glass or sapphire, which are
cheap and robust.
1.1.2 Chemometrics
NIR spectra are generally characterised by very broad peaks and a multitude of oscillation superpositions. Visual evaluation is therefore all but impossible.
Differences in the spectra of similar substances often consist merely of a slight shift or small change in shape of the wide absorption bands. For this reason, NIR spectra are basically evaluated with the aid of mathematical methods, which is why such significance is attached to the chemometric software. Chemometric is the application of mathematical, statistical procedures for processing, evaluating and interpreting large amounts of chemical data (e.g. NIR spectra). The function of the chemometric software in NIR spectroscopy is to find a statistical correlation between the spectral data and the known (e.g. by laboratory analysis) property values of the samples used for the calibration.
If this correlation is systematic, it is possible to predict desired parameters of unknown samples (e.g. identity, quality, quantity) by recording the spectrum and subsequent evaluation by calculation.
The Büchi NIR spectrometer systems allow several hundred intensity values (reflectance / transmittance) of the measured NIR spectral region to be included in the calibration. In order to be able to draw maximum benefit from the measured region, the Principal Component Analysis (PCA) is applied.
The Principal Component Analysis for qualitative calibration allows the identification of different substances or similar product qualities. There are 2 ways to use PCA:
Cluster calibrations and the
SIMCA method
For quantitative analyses, three different calculation procedures have been implemented:
Multiple Linear Regression (MLR),
Principal Component Regression (PCR) and
Partial Least Squares Regression (PLS).
These methods can be tested with a user made selection of independent validation samples or by using each sample for the calibration in cross validation.
Chemometrics is the science of relating measurements made on a chemical system or process to the state of the system via application of mathematical or statistical methods. [International Chemometrics Society (ICS)]
NIRCal 5.5 Manual, Version A |
11 |

NIRCal 5.5 Software Manual
1.1.3 Cluster calibration
Qualitative calibrations are used for identification of different chemical substances and for separation of different qualities of the same substances. The possible applications include identification of:
substances with very different chemical characteristics;
chemically similar substances;
acceptable and rejectable qualities of a given substance.
The possible methods are Cluster or SIMCA. Both methods use PCA with the difference that Cluster method is always used for a group of similar substances, while for each substance a calculation is performed with SIMCA.
Choosing the Calibration Samples
Verifying substances in the laboratory often means, ascertaining if a sample can be assigned to a specific category (property); e.g., when checking incoming raw materials in a pharmaceutical company to see if the incoming raw material is the product that was expected or not. The question can be answered efficiently by recording an NIR-spectrum of the raw material and analyzing the spectrum with a qualitative calibration. The raw material can be correctly identified that it belongs to the expected category or falsely identified that it does not belong to the expected category.
To obtain a useful, qualitative calibration, first, calibration samples should be measured that cover all expected allowable variations of the quality of the product. For each property, several samples must be collected to cover variations such as different particle size, temperature, moisture or supplier. To obtain a representative set of spectra, we recommend measuring samples from at least five to fifteen different batches of each product that have been collected over a period of at least 6 months. This will ensure that all variations within a product will be represented in a calibration. Collecting samples can speed up the building of a proper calibration. But only stable and unchanged substances can be used.
Only samples that have been tested with reference analysis should be used for the calibration. The combinations will be chosen randomly or with an adequate experimental design. Two thirds of these samples are composed to be the basic calculation data for the calibration. The remaining third is used for testing the calibration.
NOTE
When selecting the spectra in the calibrationand validation-set, it is important to assign all spectra of one sample either to the calibration or to the validation set.
Calculating the Qualitative Calibration
The spectra of different substances show the physical and chemical characteristics of each substance.
Not all spectral differences are associated with the searched differences. “False“ differences arise, for example through a varying presentation of the sample because of different particle size or other noninteresting but allowable variations of the substance. Such “false“ differences can be reduced or partly eliminated with the help of appropriate data pretreatments during the calculation.
12 |
NIRCal 5.5 Manual, Version A |
Introduction
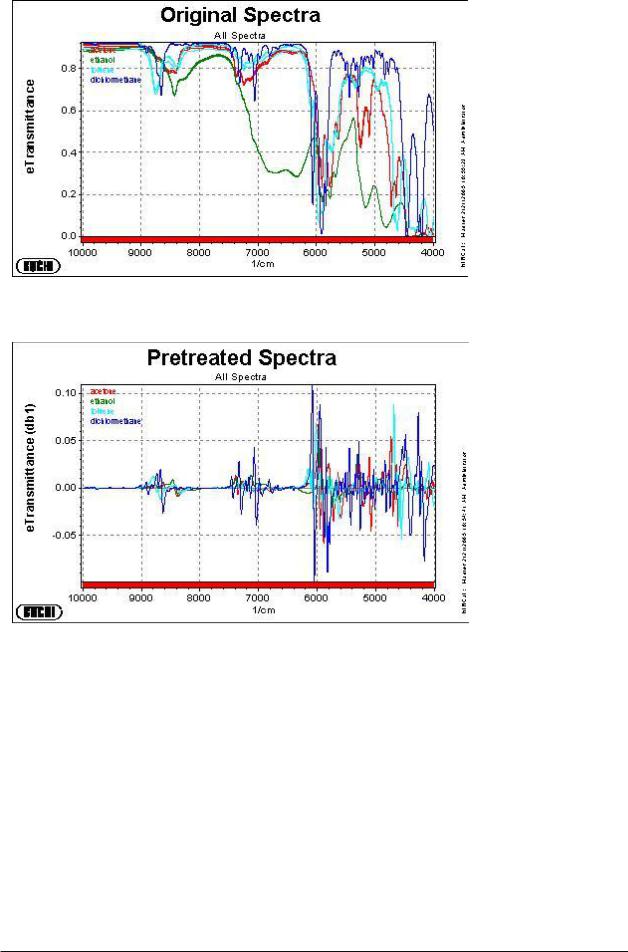
Figure.1: Solvent spectra (acetone, ethanol, toluene and dichlor-methane), measured through glass cuvettes with measurement option liquid. The slight shifts (light scattering) are not of interest and should be reduced with data pretreatments.
Figure.2: Spectra out of figure 1 after data pretreatment (here: 1st derivation)
Systematic differences of the four solvents are clear and reproducible
For the actual calibration, the Cluster calibration using PCA has been used. This means a calculation of a new illustration of the spectral information with the target to show the main differences in the data set. Spectra appear after the calculation in the new illustration as points in a 2D or 3D Plot.*
The calculation can be performed automatically by the Calibration Wizard. According to the required input by the Wizard concerning measurement method and dedicated calibration type, different calibrations are calculated and sorted by a specific quality attribute (Q-Value). For an optimal result, the wavelength selection, the data pretreatments and the optimal number of PCs must be chosen adequately. This is automatically done by the software.
Good qualitative calibrations can be recognised as the single spectra are found in well separated tolerance regions -Clusters- where each represent only one of the possible categories (properties).
NIRCal 5.5 Manual, Version A |
13 |
NIRCal 5.5 Software Manual
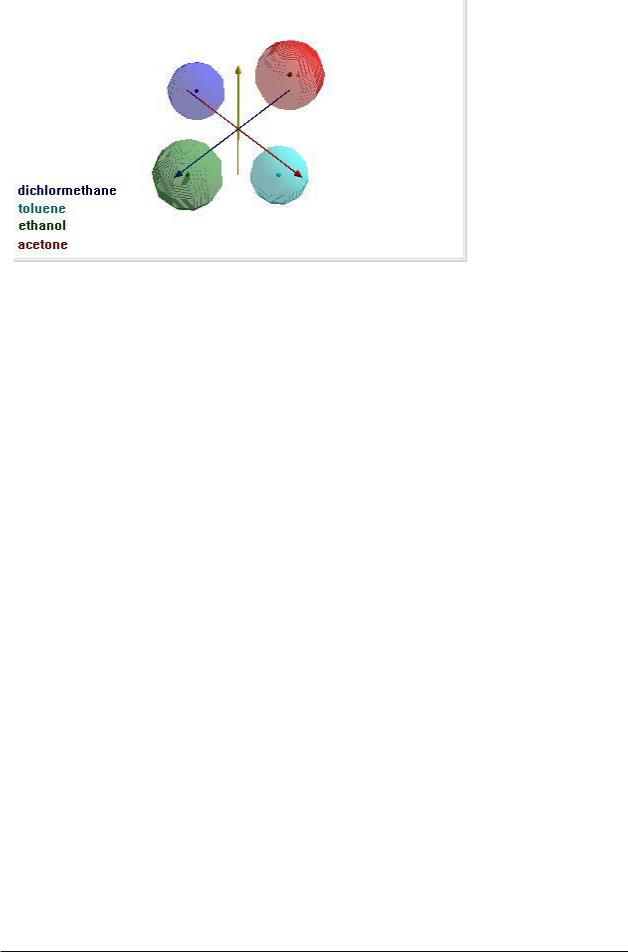
Figure 3: After transformation with the PCA, the spectra appear as points assorted in clusters, which are well separated from each other.
* In case of many different categories (properties) more than three delineation axes are required to show all important differences. It is not necessarily the case, that the first three axes are the most important ones.
Inspection of the Qualitative Calibration
The attributes of a good calibration are:
all tolerance regions of the single categories (Clusters) are cohesive;
all tolerance regions are convex and engaged consistently;
all calibration and validation spectra are within a valid range and assigned correctly;
all other substance spectra can not be predicted false with a certain calibration;
Q-Value is closest possible to 1.
Application of a qualitative calibration and interpretation of the results
During the application of a qualitative calibration, it is determined whether a new measured spectrum can be associated with a calibrated category.
A measured spectrum is identified as OK when these three criteria are fulfilled:
the residual is smaller than the allowed limit;
the distance is within the allowed tolerance (the spectrum is in a known cluster),
the identity of the measured substance (substance-ID entry) matches the identity of a substance used to build up the calibration model.
1.1.4 Quantitative calibration
NIR Spectra can be seen as fingerprints, which are characteristic for a certain substance. When investigating a substance mixture, different fingerprints are superposed within a complex spectrum. The concentration rate of the substances is present in the spectra, but cannot be seen. Target of a quantitative calibration is, to calculate applicable filters that establish the coherence of the measured intensities and the concentrations of the single components.
The quantitative calibration serves as the determination of parameters such as concentration (e.g. water content, blending ratio, hydroxyl number, etc.) or physical properties (e.g. density, viscosity).
Choosing the calibration samples
As a basis for the calibration work a set of reference data is used for which the interesting concentrations have been determined with the referring lab method. For each component (property) at least 15 samples must be used.
14 |
NIRCal 5.5 Manual, Version A |

Introduction
Important:
For the choice of the reference samples, all components of the mixture (and eventually varying parameters like temperature) must be considered, even components not being calibrated. For complex compositions, like foodstuffs, the requested amount of samples might be quite high.
The choice of calibration samples must be carried out very carefully. Spot test samples taken from the production process might not meet the demands, because the reference values typically show small variations around a nominal value. Suitable calibration samples should whenever possible be chosen with the aid of an experimental design or specially produced. The consistent and independent distribution has to be checked in any case.
Suggestions:
Figure 1: The distribution of the reference values is checked with the help of 2D plots.
The NIR calibration range should cover at least 20 times the error range of the reference method. For example for H2O determination, the range of error of ± 0.2% leads to a minimum NIR-calibration range of 4% around an expected mean value. Otherwise the error of the reference method has a high influence on a calibration. In order to avoid extrapolation for the NIR calibration, select the calibration range slightly wider than the working range.
Working range: concentration range of a parameter that usually is measured in a product;
Calibration range: for the calibration, the concentration range must be set broader than the working range.
As a rule of thumb; 60 samples should ideally cover the calibration range homogeneously. 2/3 of all samples are used for calibration, 1/3 of all samples are used for validation. Spectra of the same sample must remain together and be put either in the calibration set or the validation set. For the calibration set it is recommended to use at least 10 samples per parameter to be determined.
Spectra with the minimum and maximum concentration values (extreme values) must always be selected as calibration spectra.
NIRCal 5.5 Manual, Version A |
15 |

NIRCal 5.5 Software Manual
An incorrect distribution of the samples with two separated concentration ranges should be avoided. Either an independent calibration should be generated for each range or additional samples, covering the missing range, should be measured.
For reference measurement, the probe and reference material need to be absolutely clean. This is valid for the measurement of calibration spectra as well as for the measurement of application spectra. The measuring option and measurement conditions should be identical for generation of both, the calibration and routine application use. For quantitative measurements, the fibre optics probe should be in a fixed position.
The samples should not be measured with increasing or decreasing concentrations, but randomly distributed concentration.
The accuracy of the laboratory method has a huge influence on the quality of the NIR calibration. It is important to use the most accurate laboratory method (not the weight loss with IR quick drying for moisture determination, but the drying oven method or better the water determination by titration according to Karl Fisher).
The time between the laboratory determination and collecting the NIR spectra should be as short as possible.
Calculating the Quantitative Calibration
The suggested calculation methods are called PCR (principal component regression) and PLS (partial least squares regression). The algorithms mostly lead to similar results.
The choice of the relevant wavelength ranges and data pretreatments can improve the result of the calibration. With the applied data pretreatments unimportant spectral variations can be suppressed or the coherence between intensities and concentrations can be simplified. For example it is recommended to convert reflectance spectral data into absorbance data that depend directly on the concentration values (according the Beer-Lambert law, which is limited valid for liquids in NIR). The difficulties in choosing the data pretreatments are that they always have combined influence and that the effects depend on the applied order. Theoretical considerations take a back seat in the practice. Often the model can be optimised by trying different variations, that are calculated.
Concentration = Bo + B1*Amplitude1 + B2*Amplitude2 + ..... |
+ Bn*Amplituden [1], |
These establish the coherence between the measured amplitudes and the searched concentrations. This equation is strongly simplified, a detailed explanation is shown in chapter "Calibration Methods" Link : Principal component regression (PCR) & Partial least squares regression (PLS)
16 |
NIRCal 5.5 Manual, Version A |

Introduction
The choice of parameters and calculation methods can be done automatically by using the Calibration Wizard.
Figure 2: For the review of a quantitative calibration the prediction values according to equation [1] are compared with the reference values. In an ideal case, the corresponding points are lying on the 45° calibration curve through the zero point both for the calibration and validation samples.
Inspection of the quantitative calibration
Precision
Accuracy
Regression coefficients, r
Q-Value
the SEC and SEP provide the magnitude of the standard deviation for the calibration set and the independent validation set. The two values should be as small as possible, but they are likely to be comparable with the standard deviation of the conventional laboratory method. With an acceptable calibration, the two values are also roughly equal (Consistency: »100)
the V-Set Bias provides information on the average deviation of the predicted values from the true values. This value gives information on a systematic deviation of the calibration and therefore should be as close to zero as possible. The C-Set Bias is zero by definition.
show how well the predicted values (NIR values) match the reference values (original property values) on average.
for optimisation, different parameters are integrated in this quality factor. The Q-Value lies between 0 ( = inoperative calibration) and 1 ( = ideal calibration)
Possible reasons for bad calibration results
Outliers can be recognised for the differently calculated calibrations as big differences between predicted values and reference values appear.
Remedy: Outliers must be erased from the calibration as well as the validation set. This always must be combined with a careful clarification of the reason for the appearance of the Outlier.
To find out if a reference value or the measured spectra must be regarded as an Outlier, the score plots should be reviewed (Graphics / Scores / 2D-Scatter).
NIRCal 5.5 Manual, Version A |
17 |

NIRCal 5.5 Software Manual
In case spectra breaking ranks, show clearly deviating Scores and Residuals (Graphics / Spectra / Residuals), these spectra are real outlier and should be eliminated from the calibration / validation.
In case there are big differences between the reference values and the predicted values, but the Scores of the referring spectra do not have particular deviations with high probability, the Outliers appear because of false reference value. The lab determination should be repeated.
Group of samples with systematically deviations: this effect can be seen from time to time when samples are evaluated their reference values have been determined in laboratories not using exactly the same reference methods. Here only an alignment of the reference methods can help.
Significantly different results depending on the chosen classification of the samples into the calibration and validation set: the number of used samples is too small, for instance because of not considered, hidden properties.
Remedy: Selective completion of the master data set that all possible variations flow into the calculation.
Application of a quantitative calibration and interpretation of the results
During the application of a quantitative calibration, the referring concentration values of the measured spectrum are calculated according to equation [1] and indicated.
These calculations always lead to a result, even when performing faulty measurements. (e.g. sample of completely different, not calibrated substance class). The calculation of the concentration is therefore enlarged with two further checks:
the concentration values found must be within the original calibration range, a warningand action-limit can be adjusted as well.
make sure that the new measured spectrum matches the calibration spectra and that the Residual is within the allowed limit. A warning appears, when the residual of the measured spectra is bigger than the maximum allowed residual. Results of the spectra with Residual outlier are not taken for the average calculation of multiple measurements.
1.2Introduction to NIRCal
1.2.1 General
The work flow for typical NIR Application with Büchi NIRWare is:
1.Create an Application in NIRWare Application Designer for reference measurements
2.Data Acquisition Spectra collection with NIRWare Operator NIRSpectroscopy
3.Assign Property value to spectra with NIRWare Sample Manager Spectra + Reference Analysis
4.Calibration build mathematical models with NIRCal 5 Correlation known Spectra <- -> Concentrations / Identity
5.Copy and modify the Application for routine measurements
6.Assign the created calibration to the routine application
7.Use the mathematical models/calibrations within an Application in the NIRWare Operator for
Predictions
unknown Spectra -> Concentrations / Identity
In case a calibration after the first trial is not delivering the correct results, the steps 3-7 should be repeated, the calibration should be expanded with new samples and tested again.
All data (like spectra, property value, projects, calibrations, etc) are saved in the NIRWare Database.
18 |
NIRCal 5.5 Manual, Version A |

Introduction
NOTE
To be able to take full profit from all the possibilities of the NIRCal chemometric software, a Buchi training is highly recommended.
1.2.2 Starting NIRCal
Windows 7: Start / All Programs / BUCHI / NIRSolutions /NIRCal
Windows 8: Write “NIRCAl” in the main screen and navigate to programs
Icon:
To use NIRCal Log On with User name and Password.
User rights and setup is managed with the NIRWare Suite "Security Designer". Please refer to the corresponding documentation within the SW-Manual for NIRWare.
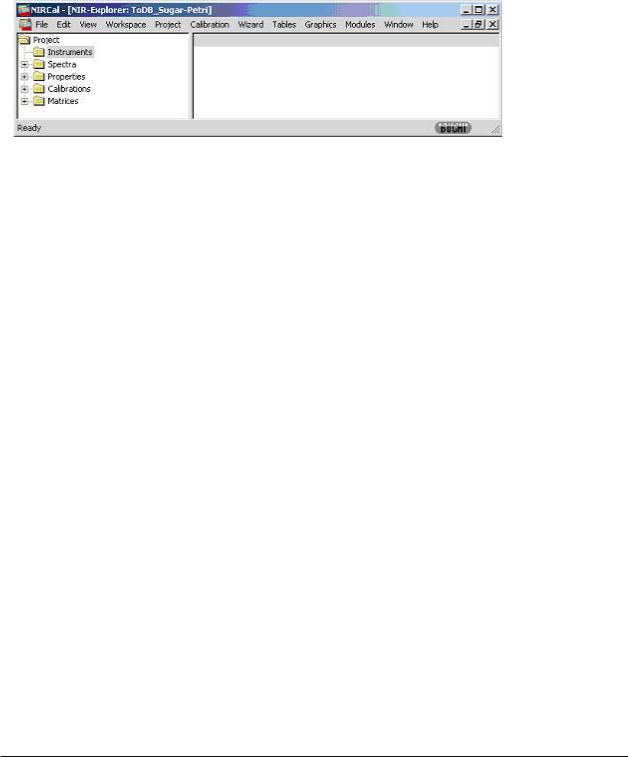
NIRCal opens an empty project.
NIRCal 5.5 Manual, Version A |
19 |
NIRCal 5.5 Software Manual
1.2.3 NIRCal Project
NIRCal stores the imported spectra and their properties , which belong together in a project.
A project contains:
spectra: the imported spectra as they were measured;
properties, the property names with their values, which belongs to the loaded spectra and can not be modified in NIRCal;
the calibrations, which have the information about the used data selections and the calculated results;
matrices, which have all chemometric results of the active calibration.
Note: Instruments is not used in NIRCal 5 anymore.
Related Topics for Spectra import:
Search and Import Spectra from NIRWare Database
Import Spectra from File
Convert and Import spectra from other instruments to DB
Use NIRCal for any type of Data
NOTE
It is possible to import and export spectra between NIRWare databases within the Software "NIRWare Management Console - Administrative Tools"
1.2.4 Spectra Overview
All spectra measured or imported into this project can be seen here.
Items marked with a yellow pen can be edited by pressing F2 or a double click.
20 |
NIRCal 5.5 Manual, Version A |

Introduction
Explanation of the symbols (right window):
 Spectra belonging to the C-Set
 Spectra belonging to the V-Set
 Spectra in unused Set = U-Set (these spectra are not used for calibration nor for the validation of a calibration
 Spectra in C- and V-Set at the same time. Overlapping is not allowed.
Red color indicates selection. These spectra for example can be assigned to the user set and be plotted separately.
1.2.5 Properties Overview
All properties in this project can be seen here.
Items marked with a yellow pen can be edited by pressing F2 or a double click.
NIRCal 5.5 Manual, Version A |
21 |

NIRCal 5.5 Software Manual
Min/Max represents the calibration range for quantitative properties. For qualitative properties Min/Max is shown as 0/1.
1.2.6 Calibration Validation Methods
To be able to judge the performance of a calibration a set of independent validation samples is necessary.
Validation Set (VS)
Normally all spectra within a project are divided into 2 sets with a suggested ratio of 2/3 to 1/3. The two sets should be completely independent from each other.
C-Set (Calibration Set)
V-Set (Validation Set)
Spectra in the V-Set are not used for the calibration, the V-Set spectra are used like unknown samples to judge the quality of the calibration (internal validation set). Only the C-Set spectra are involved in the loading calculation.
Enough spectra of the sample should be available.
VS can be used for all calibration methods.
Cross Validation (CV)
Cross validation (CV) uses all samples as the calibration set for quantitative calibrations except one sample (or a small group of samples) which is left out.
Validation is accomplished by predicting the left out samples and by systematically varying the selection of left out samples. The procedure is time consuming because for each selection a calibration has to be calculated. The method is especially useful when the total number of samples is small (< 50 samples).
Full cross validation (FCV) means that n-calibrations are calculated so that one spectrum has been left out and all other are in a calibration.
Limitations
only available for PCR and PLS;
needs at least 2 CV groups or at least 4 C-Set spectra for one-leave-out (full cross validation; FCV);
will delete the V-Set spectra selection, in case it is not empty.
1.2.7 Calibration Methods
Qualitative Calibrations / Identification
Target is to identify the membership of a sample to a property group. The property groups can be chemically completely different or similar to the same substance.
Both implemented method are using PCA:
Cluster Analysis CLU
SIMCA
Quantitative Calibrations
Target is to determine the concentration value such as content in %, OH-value or physical parameters like density, viscosity.
In NIRCal implemented algorithms are:
Principal component regression PCR
Partial least squares regression PLS
Multiple linear regression MLR
PCR, PLS, PCA (CLU) and SIMCA are principal components based methods, MLR and also library search with spectra comparison are spectra based methods.
22 |
NIRCal 5.5 Manual, Version A |
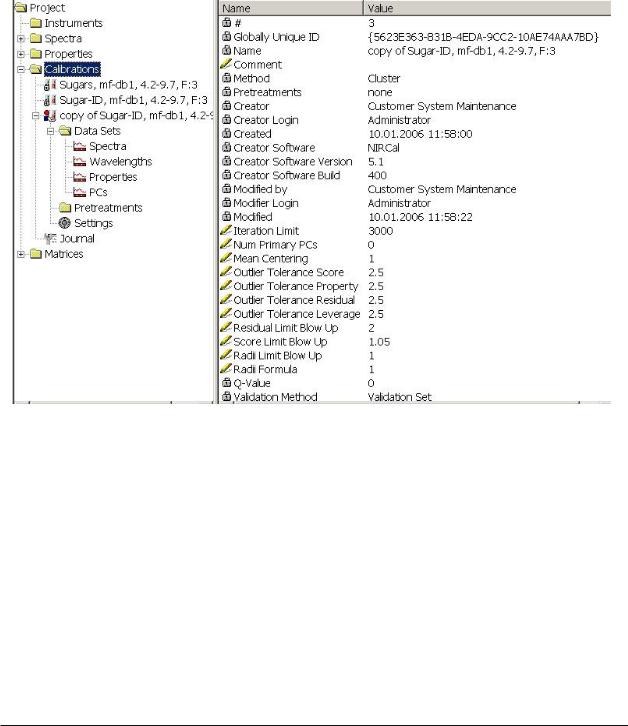
|
|
Introduction |
|
Calibration |
Inputs are the measured spectra with their properties and with the reference |
|
|
values together with the calibration data selection. |
|
|
Outputs are the calibration for the properties together with the validation for |
|
|
the validation set (V-Set) spectra or the result of Cross Validation (CV). |
|
Application |
Inputs are the calibration and a measured spectrum. |
|
|
Outputs are the predicted property value(s), calibration limits or hitlist; spectral |
|
|
residuals. |
1.2.8 Calibrations Overview
All calibrations calculated in this project can be seen here.
Items marked with a yellow pen can be edited by pressing F2 or a double click.
 New (active) calibration, not yet stored in the database
 Stored calibration not in “Edit” mode (availability for “Edit” mode depends on Lifecycle status)
 Stored calibration in “Edit” mode
NIRCal 5.5 Manual, Version A |
23 |
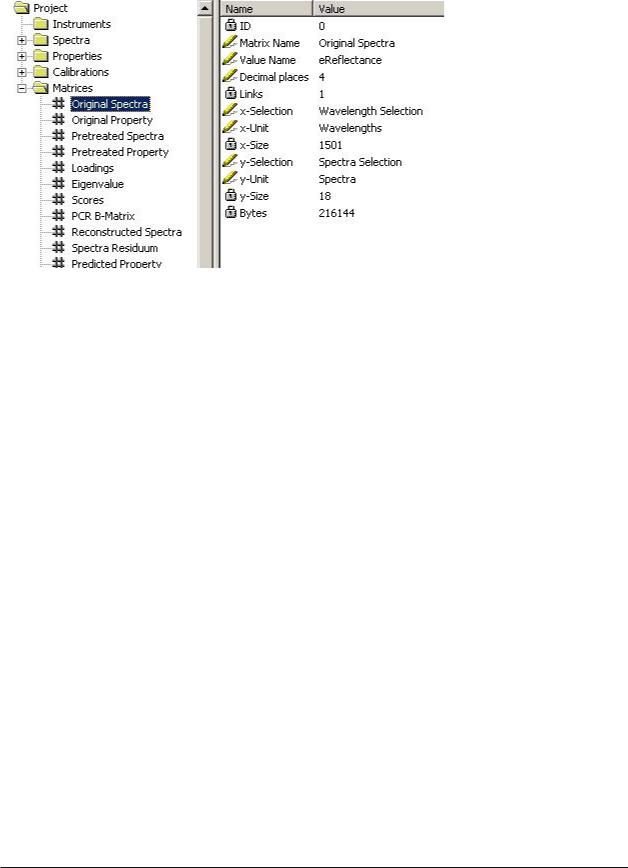
NIRCal 5.5 Software Manual
1.2.9 Matrices Overview
The matrices shown here depend on the selected calibration and validation method. Items marked with a yellow pen can be edited by pressing F2 or a double click.
1.2.10 Data
Raw data like spectra and property values are loaded from the NIRWare Database.
Spectra and property values, loaded from the database, are not modifiable in NIRCal anymore. Pretreatments never change the original spectra.
These data are stored in a NIRCal Project. Each project has a first calibration, which has an organiser function and this can not be deleted. Calibration specific data like selections (Spectra, Wavelength, Pretreatments,Principal Components) are stored for each calibration separately together with the selected chemometric methods calculated data. Approved calibrations, which are released for the application according the Lifecycle procedure, can be used in the NIRWare Operator.
Link: Calibration Handling according to the Lifecycle.
The main and intermediate data are stored in matrices (e.g. Original Spectra - and Original Property matrices), which are available in table or graphic form. Intermediate data e.g. Scores and Loadings are calculated on demand by the active calibration settings.
Matrices can be exported to MATLAB as .dat files or to EXCEL as xlm files.
MATLAB : NIR-Explorer / Matrices / “Loadings” / PopUp Menu / Export.
EXCEL: NIR-Explorer / Matrices / “Loadings” / PopUp Menu / Table. In the Table PopUp Menu / Export Table…
Link: Matrices
NIRCal 5 can work as Fileand as Database - oriented software.
With NIRCal it is possible to import data from files and to store data to files. NIRCal 5.4 downward compatibility of spectra and properties is supported to NIRCal 5.2 as .nir, .ncf and JCAMP-DX file. In NIRCal 5.2 the NIRCal 5.4 files can be imported with: File/ Import/ Spectra.
The loaded spectra can be also stored in the database. A spectra conversion from the older NIRCal 4 data or from other software is possible in this way. The following data types can be imported:
Projects in format ".nir";
Spectra with properties in format ".nsf, .bmp, .dat, .csv, .spc, .dx, .jdx, .jcm, .nir "
BCAP-Series in format ".S??" (Spectra file)
24 |
NIRCal 5.5 Manual, Version A |

Introduction
It is not possible to import data from NIRCal 4 ".ncf" format, because ncf-files do not include spectral data.
It is important to take care of the compatibility of the spectra from different instruments!
Link: Convert and Import..in NIRWare DB.
1.2.11 Selections
Data selections are needed to group the data before the calculation of a calibration. For each calibration the selections can be different.
Calibration method selection
Choose the method according to the target of the application.
For quantitative applications there are MLR, PCR or PLS and for qualitative application Cluster or SIMCA are available.
Validation method selection
To test the validity of a calibration internal test samples are used in the validation mode: VS. For quantitative calibration the Cross Validation: CV is available.
The default method is VS: Validation Set, where the V-Set spectra should be selected by the user. You can also use the spectra selection wizard.
Data Sets Selection
Spectra Selection
The selection can be made in NIR-Explorer:
|
All Spectra |
|
not modifiable, determined through the number of imported spectra. |
|
|
|
|
||
|
|
|
|
|
|
User Spectra |
|
mainly used for visual comparison, any selection is acceptable, this selection |
|
|
|
|
has no correlation with the C-, V- or U-Set spectra. |
|
|
Calibration |
|
spectra selected for the calibration: C-Set, about 2/3 of all spectra for VS |
|
|
Spectra |
|
mode. |
|
|
Validation Spectra |
|
spectra selected for the validation: V-Set (1/3 for VS). |
|
|
Outlier Spectra |
|
result of the "Outlier Detection" wizard for the statistical residual, score, |
|
|
|
|
property value and leverage outliers in C- and / or V -Set |
|
Each of these sets, except of "All Spectra", can be edited by the user.
NIRCal 5.5 Manual, Version A |
25 |

NIRCal 5.5 Software Manual
Select spectra for the calibration (Calibration Spectra = C-Set) and for the validation of the calibration (Validation Spectra = V-Set). The C-Set will be used for the calculation of the calibration, the V-Set is used as an internal test of the calibration.
The same spectra should not be defined as C-Set and V-Set Spectra at the same time. If so then the spectra will be marked with a question symbol in the spectra overview and following message appears, that easily allows to remove the spectra set overlap automatically:
Link: Chemometrics / Selections / Spectra Data Set
Wavelengths selection:
All Wavelengths: the measured wavelength/ wavenumber range and the number of wavelength / wavenumber data points, which is determined by the used instrument and by the resolution;
Calibration Wavelengths: only the selected range will be taken into account for the calculation
and later for the application.
Link: Chemometrics / Selections / Wavelength Data Set
Properties selection:
All Properties: number of properties belonging to the imported spectra;
Calibration Properties: only the selected properties will be taken into account for the calculation and later for the application. Normally all or several will be selected for Cluster calibration, only one should be selected for quantitative and for SIMCA calibration method.
Link: Chemometrics / Selections / Properties Data Set
Principal Components Selection:
All PCs: the number of primary principal components used for the calibration, they are used for the spectra reconstruction and for the Residual calculation;
Calibration PCs: only the selected PCs will be taken into account for the calculation and later for the application, they are used in quantitative calibration for the property value calculation or in qualitative calibration for the property separation and for the allowed tolerance area
calculation.
Link: Chemometrics / Primary Principal Components & Secondary Principal Components
Pretreatments selection:
The measured spectra can be modified before the calculation with several pretreatments or different combinations of them.
NOTE
The original spectra are still the same and will not be modified.
The list of in NIRCal 5 implemented pretreatments indicates the huge flexibility of the software. The pretreatments used in the calibration will be applied in the application also.
26 |
NIRCal 5.5 Manual, Version A |
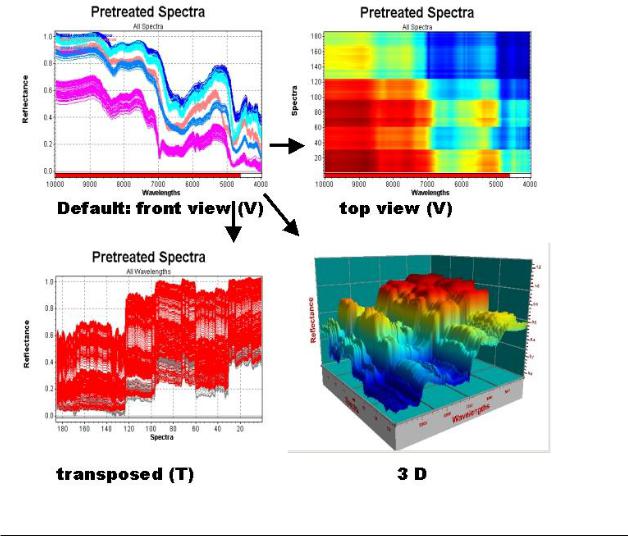
Introduction
Blow Up Parameter:
The allowable limits are calculated with a default blow up limit. These limits can be adjusted by the user:
for quantitative calibrations the scores and residual blow up limits;
for qualitative calibrations the scores, residual and radii blow up limits and the radii calculation formula.
Link: Chemometrics / Blow Up Limits
Outlier detection limit
To calculate the statistical outliers the limit can be edited by the user or can be calculated according the T-distribution for the actual calculation.
Link: Chemometrics / Outlier Detection
1.2.12 Graphics
All data that is available in table format can be plotted graphically as well.
In NIRCal 5 there are 1, 2 and 3 dimensional plots available.
The 1D scatter plot is new in NIRCal 5: it shows only one selected line or column of a matrix. This scatter plot can be used for selections.
The pop-up menu "Options/Show line" or the keyboard shortcut "W " can change the point to a line.
Each 2D plot can be shown as a front view (this is normally the default adjustment), top view and transposed.
NIRCal 5.5 Manual, Version A |
27 |
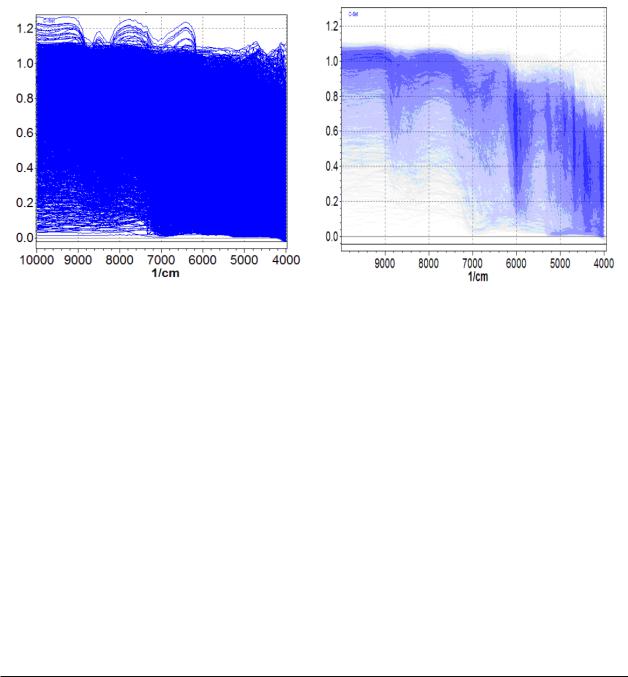
NIRCal 5.5 Software Manual
The plots can show different selections, while the selection plotted is always visible on the subtitle.
The use of modern rendering techniques, such as Anti-Aliasing and Alpha-Blending (new hardware accelerated features of newer graphic cards), allows to eliminate jagged edges and stair-stepped lines. NIRCal applies these features to improve the graphical performance.
Anti-Aliasing (hotkey: a) eliminates jagged edges and stair-stepped lines. This can be switched on permanently under: Edit / Options / 2 D Plot. Opening the 2 D plots is quicker with Anti-Aliasing using new graphic cards, but can be slower with an older driver.
Alpha-Blending (hotkey: b) allows a partial transparency with steps of 1, 1/2, 1/4, 1/8. 1/32, 1/64 (by pressing b several times) and helps to look through huge amount of data. The Alpha-Blending level can only be seen from the data color intensity: the more often the point is drawn, the brighter the color. Each NIRCal rendering can be stopped immediately by pressing the ESC key.
Anti-Aliasing and Alpha-Blending are very useful for huge amount of spectra especially for 2-D spectra plots (original, pretreated and residuum); Score plots (vs. PC or vs. Scores) and calibration curve (original vs. Predicted).
On the left side the common drawing style is used, where no details can be seen. Anti-aliasing and alpha-blending (right side) allow to look through a huge amount of data and to detect hidden structures.
Note: In case a one dimensional matrix - which is a vectoris plotted, the subtitel is "All One". "One" indicates the first selected "dimension" and not the value of the vector!
The colors are also selection dependent.
The plots can be opened as Table with the keyboard shortcut "G".
On each plot the X- and Y-axis can be flipped using the pop-up menu: Option/ Flip X-Axis (x) and Option/ Flip Y-Axis (y).
2D combined scatter plots: beside the standard 2D plots it is possible to combine matrices, even if they have only with one dimension matching. This can be created manually in the NIR-Explorer selecting the two matrices and opening in pop-up menu the "2D-Combined Scatter".
There are several plot combinations available in NIRCal 5: under: View.
These plot combinations, which are fixed, can help to make the data selections easier (spectra, wavelengths, properties, PCs) with useful graphics.
The dependency plots can help to find hidden correlation between spectra and different users, or time, or instruments.
The users can create own plot combinations and can save them under: Workspace.
28 |
NIRCal 5.5 Manual, Version A |

Introduction
1.2.13 Protocols
The term "protocol" in NIRCal means report.
Calibration Protocol
The calibration protocol is an important validation document, which contains all information about a calibration, like the user specific data selection and the results of the chemometrical calculations applied for the C- and V-Set spectra in the project. The calibration protocol is stored within the calibration.
Link: Calibration protocol
Validation Protocol
The prediction protocol is an in important validation document, which contains the results of a prediction of a calibration applied for other spectra, mainly not existing in the project. The prediction protocols help to find out possible interfering substances for the qualitative calibrations.
Link: Prediction protocol
NIRCal 5.5 Manual, Version A |
29 |
 Loading...