


1

CONTENTS
1.INTRODUCTION
1.1Introduction
1.2General Applications and Benefits
1.3Identification
2.HARDWARE
3.SOFTWARE DESCRIPTION
3.1Operating Software
3.2TVS-1100 Software
3.3Software Installation
3.ELECTRICAL AND SYSTEM REQUIREMENTS
4.1Electrical and Safety Specifications
4.2System Requirements
2

SECTION 1: INTRODUCTION
1.1Introduction
TVS-1100 is a hot wire anemometer system for measuring air temperature and velocity using single sensor technology. The device is connected to a PC through an USB port for communication between the software and the device. The system is capable of measuring temperatures from –20 oC to 130 oC and flows from 0 to 10000 ft/min. It can accommodate up to 32 channels. The standard calibration is from 0 to 1200 lfm, the high speed calibration is from 0 to 10,000 lfm. The air temperature at which velocity is calibrated is from ambient to 85 oC. An attempt to measure flows in temperatures higher than 85 oC, would give erroneous data, even though it can read temperatures up to 120 oC.
1.2General Applications and Benefits
Heat sink manufacturers, IC houses, board designers, and other electronic manufacturers are increasingly becoming interested in evaluating the thermal performance of their product under different airflow conditions. The reduction of electronic component sizes and increase in their power dissipation has forced the electronic community to be more aware of the thermal performance of their products. The hotter the devices, the shorter their life span and the greater the likelihood of a malfunction. The challenge in these units is the reduction in the spacing between boards, thereby the requirement of small size sensors to measure air flow measurement. Of utmost importance is the measurement of air flow and temperature at the same point to minimize errors introduced as a result of temperature gradients. The conventional hot wire systems measure these two
3

quantities using two independent sensors and, in most situations this can introduce errors in excess of 40% due to temperature gradients and radiation coupling between the two sensors.
1.3Identification
The TVS-1100 is identified by OE followed by 5 digits (i.e., OE12345) located on the bottom of the unit.
4

SECTION 2: HARDWARE DESCRIPTION
The device is housed in an electronic box that accepts commands from the software through the USB communication port, and reports the data back to the system. It includes the circuitry for temperature and velocity sensors. Figure 1 shows the rear view of the TVS-1100 box.
Note: Please read the Manual before operating the system.
Figure 1 - Rear view of the TVS-1100
The function and description of ports and connectors on the rear panel are as follows:
1.Power – This is the location for connecting the power supply to the system.The external power supply provided with the system plugs in here.
5
2.USB Port (COM Port) – The TVS-1100 is attached to the serial port of the PC with a straight cable through this port. TVS-1100 comes with a 6 feet long standard USB cable.
3.Port# - Sensors are attached to the TVS-1100 through these ports. The order of attachment is immaterial, since each individual sensor has a sensor ID card that enables the system to find its calibration constants from a text file located in the PC C directory using its serial identification number.
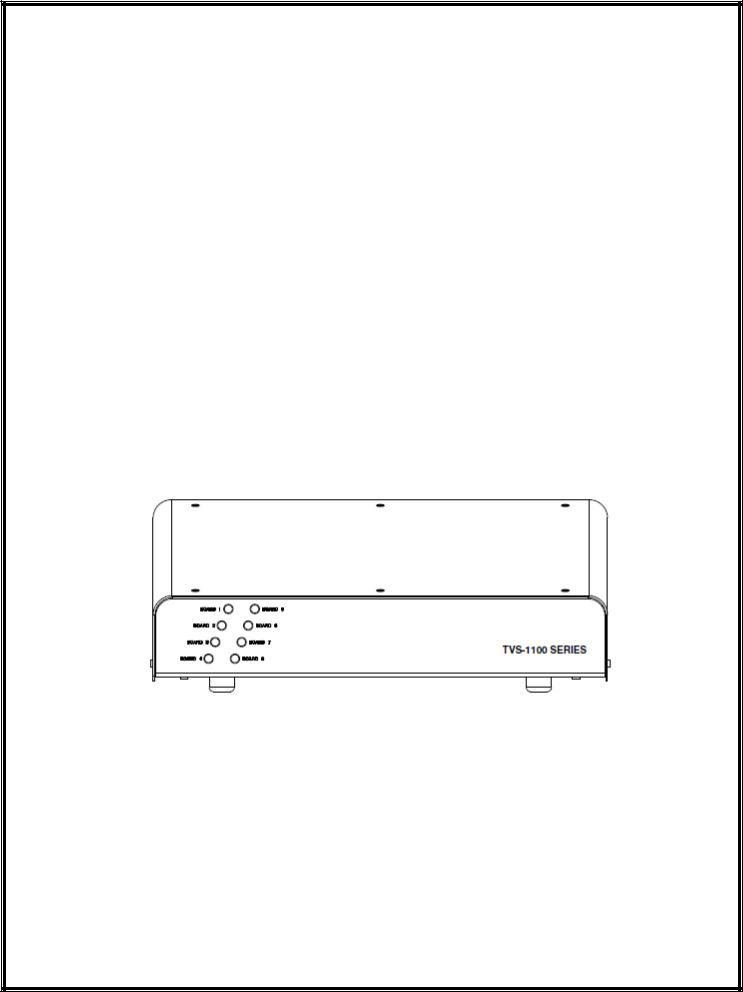
Figure 2 shows the front view of the TVS-1100. It has 8 LEDs associated with up to 8 daughter cards. For every daughter card installed, there is one LED lit up.
Figure 2 - Front view of the TVS-1100
6

SECTION 3: SOFTWARE DESCRIPTION
3.1Introduction
TVS-1100 software is a graphical user interface that communicates with the TVS-1100 box through the PC USB port. This software enables the user to set the different parameters and run the software to acquire the data.
THEORY OF OPERATION:
Data acquisition is comprised of cycles dictated by the duration set by the user in minutes. Each cycle consists of a selected number of temperature measurements followed by a selected number of velocity measurements. The selected number is set by the user. The cycles will continue until the time elapsed is greater than the duration. The user has the option to check the availability of the sensors and select which of those sensors he wants to collect data. Software also allows the user to save temperature and velocity raw data into text files that can be opened in ExcelTM using tab delimited. The software has different controls and is described bellow:
3.2TVS-1100 Software
Figure 3 and 4 show the TVS-1100 software user interface when it is running.
7
 Loading...