


 Loading...
®
PQ Log
PC Software for 1740 Series
Users Manual
June 2006
© 2006 Fluke Corporation, All rights reserved.
All product names are trademarks of their respective companies.
Table of Contents
Title |
Page |
Introduction........................................................................................................ |
1 |
Logging Functions......................................................................................... |
1 |
Activities You Can Do with PQ Log............................................................. |
2 |
System Requirements .................................................................................... |
2 |
Installing PQ Log .......................................................................................... |
2 |
Preparing the Logger for Use............................................................................. |
3 |
Establishing a Connection to the Logger....................................................... |
3 |
Setting Up Logger for a P Type Job .............................................................. |
5 |
Logging Power Quality Data ............................................................................. |
9 |
Downloading Logged Data to the PC ................................................................ |
9 |
Viewing Live Readings ..................................................................................... |
11 |
Advanced (Optional) Logger Settings ............................................................... |
11 |
Settings – User Preferences ........................................................................... |
11 |
Settings for Medium Voltage Networks........................................................ |
13 |
Defining Interharmonics (A function only)................................................... |
14 |
Sequential Logging Jobs................................................................................ |
15 |
Analyzing Logged Data ..................................................................................... |
16 |
Timeplot Display ........................................................................................... |
16 |
EN 50160 (for Europe).................................................................................. |
16 |
PQ Log Feature Reference................................................................................. |
18 |
Tool Bar......................................................................................................... |
18 |
The Main Toolbar ..................................................................................... |
19 |
Toolbar for Timeplot:................................................................................ |
19 |
Toolbar for ONLINE Test......................................................................... |
20 |
Toolbar for Measurement Value List ....................................................... |
21 |
Toolbar for Voltage, Current Cumulative Frequency ............................... |
22 |
Toolbar for Events (UNIPEDE DISDIP Table)....................................... |
22 |
Toolbar for Data List of All Events .......................................................... |
22 |
Logger Menu ................................................................................................. |
25 |
Setting up a Logger - Interharmonics (A) ................................................. |
26 |
Reset.......................................................................................................... |
26 |
Information about the Logger ................................................................... |
27 |
Online Data from Logger .......................................................................... |
28 |
Analysis ......................................................................................................... |
28 |
Graphical Summary .................................................................................. |
29 |
i |
|

PQ Log
Users Manual
Voltage Cumulative Frequency (A Only) ................................................ |
30 |
Current Cumulative Frequency (A Only)................................................. |
31 |
Symbol Bar for the Cumulative Frequency Display ................................. |
33 |
Events........................................................................................................ |
41 |
Table Summary ......................................................................................... |
42 |
Statistical Values (A Only) ....................................................................... |
44 |
Most Critical Values (A Only).................................................................. |
44 |
Settings .......................................................................................................... |
45 |
SettingsGeneral....................................................................................... |
45 |
Limit Value Level File .............................................................................. |
47 |
Limit Value Level File – Voltage Harmonics........................................... |
51 |
Limit Value Level File – Interharmonics.................................................. |
52 |
Limit Value Level File - Signaling Voltages ............................................ |
52 |
Application Oriented Analysis File........................................................... |
53 |
Colors ........................................................................................................ |
54 |
Print Diagram without Background .......................................................... |
54 |
Curve Width.............................................................................................. |
54 |
Language................................................................................................... |
54 |
Export........................................................................................................ |
55 |
Window Menu ............................................................................................... |
55 |
Appendix A........................................................................................................ |
56 |
Abbreviations, Symbols ................................................................................ |
56 |
General ...................................................................................................... |
56 |
Index
ii
List of Tables
Table |
Title |
Page |
1. |
System Requirements............................................................................................. |
2 |
2. |
Available Parameters for Version P ....................................................................... |
36 |
3. |
Available Parameters for Version A -Voltage, Current ......................................... |
36 |
4. |
Available Parameters for Version A - Power, Energy ........................................... |
37 |
iii

PQ Log
Users Manual
iv
List of Figures
Figure |
Title |
Page |
1. |
Start Menu.............................................................................................................. |
3 |
2. |
Preparing a Logger Job .......................................................................................... |
4 |
3. |
Problem in Connection Message............................................................................ |
4 |
4. |
Serial Port Settings................................................................................................. |
5 |
5. |
Current Setup Menu ............................................................................................... |
6 |
6. |
Time Setting Menu................................................................................................. |
7 |
7. |
Summary Screen .................................................................................................... |
8 |
8. |
Warning Message Before Sending Setup Information........................................... |
8 |
9. |
Successful Saving Confirmation Message ............................................................. |
9 |
10. |
Selecting an Analysis Time Period ........................................................................ |
10 |
11. |
Timeplot Display.................................................................................................... |
10 |
12. |
General Settings Menu........................................................................................... |
12 |
13. |
Potential Transformer............................................................................................. |
13 |
14. |
Current Transformer............................................................................................... |
14 |
15. |
Set up Logger for Function A ................................................................................ |
15 |
16. |
Timeplot Display.................................................................................................... |
16 |
17. |
PQ Log Table Summary......................................................................................... |
17 |
18. |
Harmonics Graph ................................................................................................... |
18 |
19. |
Information About the Connected Logger ............................................................. |
27 |
19. |
Logger Graphical Summary Screen ....................................................................... |
29 |
20. |
Voltage Parameters ................................................................................................ |
31 |
21. |
Current Harmonics ................................................................................................. |
32 |
22. |
Application Oriented Channel Selection................................................................ |
34 |
23. |
UNIPEDE DISDIP Table....................................................................................... |
42 |
24. |
Enter your title here................................................................................................ |
42 |
25. |
Selecting Parameters .............................................................................................. |
45 |
26. |
General Settings Menu........................................................................................... |
46 |
v

PQ Log
Users Manual
vi
PQ Log
PC Software for 1740 Series
Introduction
The Fluke 1740 Series Loggers monitor power quality and locate disturbances in low and medium voltage distribution networks. The “Logger” in this manual refers to either of the Models 1744 or 1745.
The Logger measures up to 3 voltages and 4 currents. Logged values are saved in your choice of sequential averaging periods. You graphically or numerically evaluate measured values with PQ Log Software.
PQ Log is the PC application software for 1740 Series Loggers. PQ Log is compatible with MS Windows NT, 2000 and XP. PQ Log prepares the Logger for use, and receives downloaded data from the Logger. You transfer logged data to a PC for graphical and tabular evaluation, export to a spreadsheet, or generation of reports for printing.
Logging Functions
Models 1744 and 1745 have two types of logging functions: logging function A (Advanced) and logging function P (Power). Function A is the full set of parameters, and function P provides logging capability optimized for load studies and basic power logging. Function P contains every parameter in Function A except voltage and current harmonics and interharmonics. Model 1743 operates only with logging function P.
Logging function parameters:
•RMS Voltage of each phase (average, min, max)
•RMS Current of each phase and neutral (average, min, max)
•Voltage events (dips, swells, interruptions)
•Power (kW, kVA, kVAR, Power Factor, Cosine φ )
•Energy, total energy
•Flicker (Pst – short term, and Plt – long term)
•Voltage thd (Total Harmonic Distortion)
•Current thd
•Current CF (Crest Factor)
•Voltage harmonics to the 50th (not in P function)
•Voltage interharmonics (not in P function)
1

PQ Log
Users Manual
•Mains signaling voltage
•V Unbalance (Positive sequence/negative sequence harmonics)
•Line (mains) frequency
Activities You Can Do with PQ Log
The activities that you can do with PQ Log are:
•Prepare the Logger for use, connected to the Logger, or in advance
•Monitor live data from the Logger
•Download recorded logged data to the PC
•View, print, and export timeplots of all channels
•Application-oriented analysis (sets of parameters to graph to achieve different typical analysis tasks)
•Perform harmonic studies
•Perform statistical analysis
•Generate data tables
•Print tables, graphs, and comprehensive, formatted reports
•Export data to an ASCII file
•Upgrade the Logger’s Firmware (operating software) when a new release is available on the Fluke website
•Perform standardized analysis of measured values according to the European standard EN 50160
System Requirements
Table 1 shows the minimum computer requirements for PQ Log.
Table 1. System Requirements
PC Configuration for PQ Log |
Necessary |
Recommended |
|
|
|
Free hard disk space |
10 MB |
>50 MB |
|
|
|
CD-ROM drive |
} |
|
|
|
|
Monitor |
800 x 600 pixels |
1024 x 768 pt |
|
|
|
Serial interface, or a serial-to-USB interface |
|
|
adapter and the USB adapter manufacturer’s |
} |
|
driver software for the adapter |
|
|
|
|
|
Windows NT, 2000, XP or later version |
} |
|
Color printer |
|
} |
|
|
|
Installing PQ Log
Insert the Logger’s product CD into the CD-ROM drive. If your CD-ROM drive is configured for Autorun, the installation starts automatically. If not, run the Launch.exe program on the CD-ROM. Follow the instructions on the screen to install PQ Log in your choice of language.
2
PC Software for 1740 Series
Preparing the Logger for Use
Preparing the Logger for Use
PQ Log and this manual refer to logging (recording) sessions as Jobs. A Job is a package of Logger settings that configures a Logger for a recording session. In addition to saving the setups in the Logger, you can save setups as template files on the PC for later recall. The following instructions take you through the Logger setup process.
W X Warning
To avoid electrical shock or damage to the equipment, read and follow the safety warnings and cautions in the 1744/1743 or 1745 Users Manual before you make any connections to the Logger.
Establishing a Connection to the Logger
Connect the Logger to a power supply and to the PC’s serial interface using the original serial cable provided with the Logger before you proceed. If you are using a serial-to- USB converter cable, install the drivers that are shipped with the converter cable first, then connect the original Logger serial cable and adapter to your USB connector.
Note
The red serial cable shipped with the Logger is a special cable – it is a nullmodem cable, with the TX and RX lines crossed. This allows the Logger to work with a modem or a PC.
To establish a connection to the Logger:
1.Start up your PC.
2.Start PQ Log by selecting the PQ Log program icon  from Start/Programs/Fluke/PQ Log. The PQ Log Start Menu appears:
egd001.bmp
Figure 1. Start Menu
3.Click on the Set up button next to ”Set up a logger for function P – basic power logging”.
4.Verify that a screen similar to the one shown below appears. This means the PC and Logger are communicating properly.
3
PQ Log
Users Manual
egd002.bmp
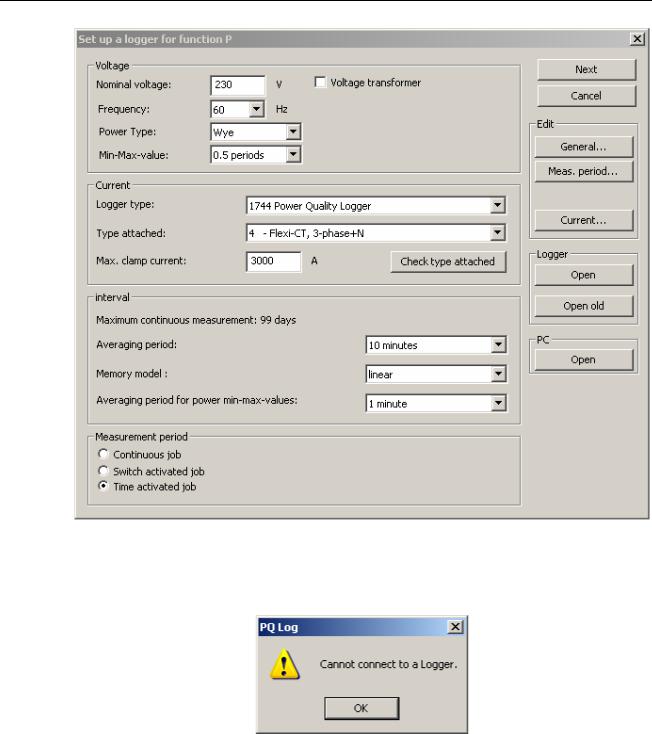
Figure 2. Preparing a Logger Job
5.If the following screen appears, there is a problem with the connection to the Logger.
egd003.bmp
Figure 3. Problem in Connection Message
6.If your PC is not connecting to the Logger, find the serial port that connects to the Logger by trying them sequentially. You will find this setting under Settings/General Settings. The following picture shows the communication settings portion of the General Settings menu.
4

PC Software for 1740 Series
Preparing the Logger for Use
egd004.bmp
Figure 4. Serial Port Settings
Setting Up Logger for a P Type Job
If PQ Log is connected to the Logger, the Logger automatically identifies the Logger type and the current probe type attached. To set up P type Logger Job:
1.Make sure the PC is communicating with the Logger. Starting from step 3 above, set up the Logger parameters for the job as follows, starting from the top of the “Set up for Logger” function P menu.
2.Enter the Nominal Voltage. This can be a phase-to-neutral voltage or a phase-to- phase voltage.
3.Select 50 Hz or 60 Hz from the Frequency pull-down menu.
4.Select the Power Type from the pull-down menu. This is where you set up the Logger for Delta (3-wire) or Wye (star or 4-wire), or other power configurations from a list of choices.
5.Select the Min-Max-value from the pull-down list. This determines the averaging period of min/max capture for rms voltage levels for later display. Some standards require certain min/max averaging periods. The shortest setting is ½- cycle, which is the most sensitive for measuring the absolute highs and lows that occur within an overall averaging period for measurements. (You choose averaging period for measurements in in Figure 2.)
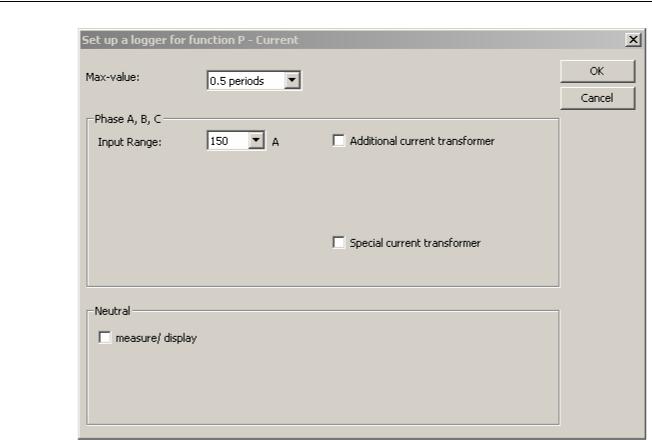
6.Click on the Current button on the right side of the menu. The Current menu appears.
5
PQ Log
Users Manual
egd005.bmp
Figure 5. Current Setup Menu
7.Select the current Min-Max-value from the pull-down list. This is an independent setting for averaging period just for current. You will use the effects of this setting later during the analysis of the data when you choose to see the voltage at the time max current happened.
8.If you are using Flexi-Set current probes, you have a choice of sensitivity ranges. Select the one you want from the pull-down list.
9.(Optional) Choose Measure or Calculate to determine how PQ Log will derive the data it displays for neutral current. Sometimes it is useful to choose Calculate even if the neutral current probe is connected around the neutral feeder. This is the case when you want to measure power the same way a revenue power meter does it, if the power meter uses a calculated neutral.
10.Click OK and you are back to the Setup for Logger function P menu. Select the Averaging Period from the pull-down list. Notice how different settings affect the available logging time. If you select 1 s, the available logging time is shortest, but you get the most detailed data. Choose the setting that is required for the power quality standards you want your data to comply with, or the one that gives you the most detailed data for the time period of your logging session.
11.Select whether you want the Logger to quit logging when its memory is full (Linear), or keep logging continuously by overwriting the oldest data with new data (Circular).
12.(Optional) Choose the averaging period for min/max power measurements from the pull-down list.
13.Select how you want to control the start and stop times of the logging session:
6
PC Software for 1740 Series
Preparing the Logger for Use
•Continuous job – The Logger starts logging as soon as it receives the setup information you are completing now
•Switch-activated job – The Logger starts logging when you press the START button on the front of the Logger, and stops when you press it again
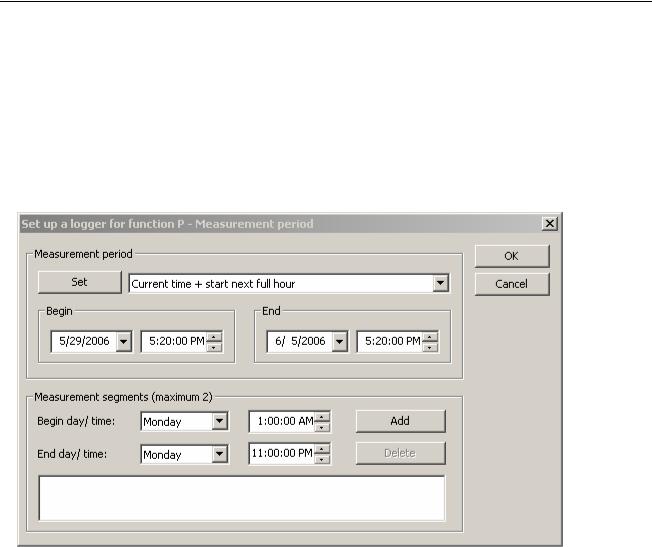
•Time-activated job – The Logger waits until a programmed time to start logging, and stops when the programmed stop time occurs. If you select Time activated job, you need to fill in the start and stop times in the following menu. This menu appears when you select the Time activated job radio button
egd006.bmp
Figure 6. Time Setting Menu
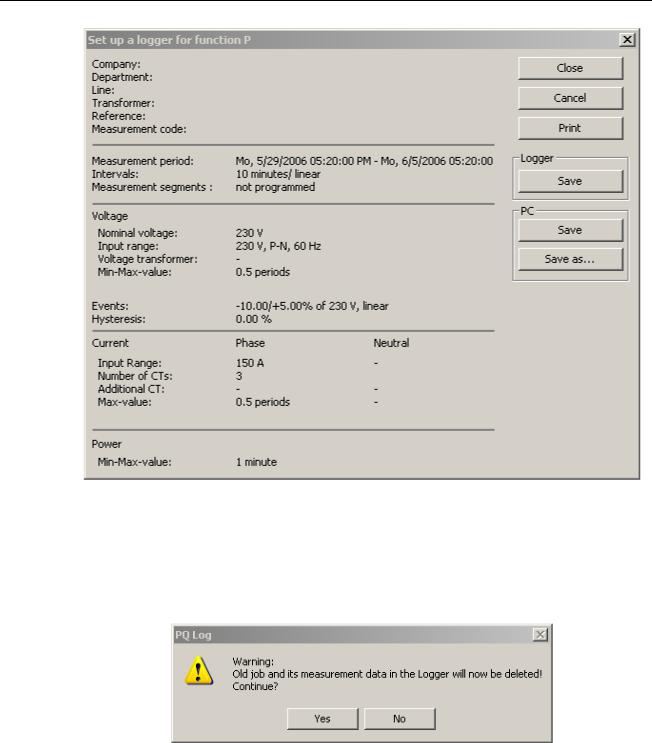
14.Click the Next button. The confirmation screen appears, which allows you to review the settings you are about to load into the Logger or save as a template to a file on the PC.
7
PQ Log
Users Manual
egd007.bmp
Figure 7. Summary Screen
15.Once you are satisfied that the settings are correct, save these settings to a template for later recall by clicking on the PC Save or Save As button. To write the setup data to the Logger, click on the Logger Save button. If you want to make sure you are not about to delete any important data, download the data before you send the job setup information to the Logger.
egd008.bmp
Figure 8. Warning Message Before Sending Setup Information
16.Click on the Yes (Continue) button. A message tells you that the settings have been saved successfully.
8

PC Software for 1740 Series
Logging Power Quality Data
egd009.bmp
Figure 9. Successful Saving Confirmation Message
Note
If you have checked the box Automatic time synchronization in the Settings/General menu, the date and time of the PC clock is transferred to the Logger every time you write setups to the Logger.
Logging Power Quality Data
W X Warning
To avoid electrical shock or damage to the equipment, read and follow the safety warnings and cautions in the 1744/1743 or 1745 Users Manual before you make any connections to the Logger.
Once you have saved the Logger setup data in the Logger, disconnect the Logger from the PC, and attach the voltage leads and current probes to the distribution system to be measured as described in the Logger’s Users Manual. The Logger settings and the recorded data are retained in the Logger’s memory when the power is disconnected from the Logger.
How you start and stop the logging session depends on how you set the Measurement Period buttons – continuous job, switch activated job, or time activated job.
Downloading Logged Data to the PC
After completion of the measurement or when the job is active, you can transfer logged data stored in the Logger to the PC. This action does not disrupt the ongoing logging activity, so you can do it anytime.
To download the logged data to the PC:
1.Connect the Logger to the serial port of your PC. Select the menu Logger>Read Results or click  button from tool bar.
2.Specify the name and path for the logged data file.
3.Click Save. PQ Log transfers measurement data from Logger to the PC. You will see progress bars on the screen as the data is transferred from the Logger to the PC.
4.The data transfer can take seconds or minutes, depending on the Baud rate and the amount of data.
5.Once the data has downloaded to the PC, you choose a time period from the downloaded data to store in the data file for analysis. Selecting a time period shorter than the logging period does not delete any data. See Figure 10 for an example how this time period selection appears. Refer to the section “Analyzing
9

PQ Log
Users Manual
Logged Data” for how to use the timeplot, and how to analyze the data in the data file in general.
egd009a.bmp
Figure 10. Selecting an Analysis Time Period
egd010.bmp
Figure 11. Timeplot Display
10
PC Software for 1740 Series
Viewing Live Readings
Viewing Live Readings
You can view live readings to gain assurance that the data being logged is going to be useful, and the settings and current probe range is correct. To view live readings:
1.Connect the PC to the Logger while the logging is active.
2.Click on the  icon or select “Online data from the Logger” from the Logger menu. A strip chart display shows data from any channel you select to view.
You can monitor nearly all parameters, although Flicker (Plt) and min/max-values are not available. Flicker (Pst) shows 5-second values. For all other parameters, 200 ms values are displayed.
There is a stripchart on the screen which is updated in about 1-second intervals, depending on the data transmission speed and the PC response time. PQ Log maintains about 17 minutes of stripchart data in memory, and then writes over older values.
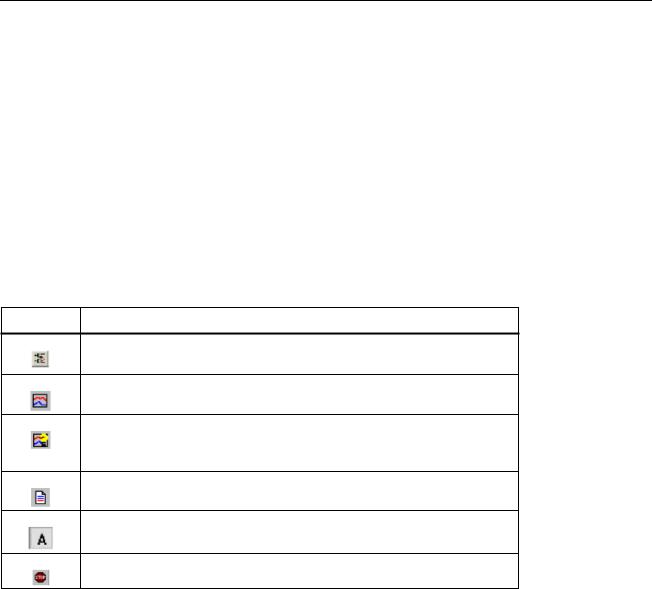
The buttons for time and y-axis scaling are:
Buttons |
Descriptions |
Scales the Y-axis according to the extreme values. This is useful if the curve leaves the visible area of the diagram during test
Allows you to add or delete additional parameters to or from the diagram
Activates the application oriented analysis. This feature groups parameters to view based on the particular problem you are trying to resolve. For more details refer to “PQ Log Feature Reference” section
Presents recorded data in a table format. The table is not updated automatically
Toggles the auto scroll function (the diagram is scrolled automatically if active)
Suspends the ONLINE display of data
Note
As long as the Online test is active, no communication to Logger is possible because the serial port is occupied. You can print the stripchart by selecting File>Print document from the menu bar.
Advanced (Optional) Logger Settings
The preceding setup procedures are the minimum necessary to carry out a logging session. Other Logger settings that you can specify are explained below.
Settings – User Preferences
The settings menu presents choices for the following:
•Setting of limits (thresholds) for events
•Selection of an “Application oriented analysis” template
•Choice of colors for timeplot traces
•Your choice of language
11
PQ Log
Users Manual
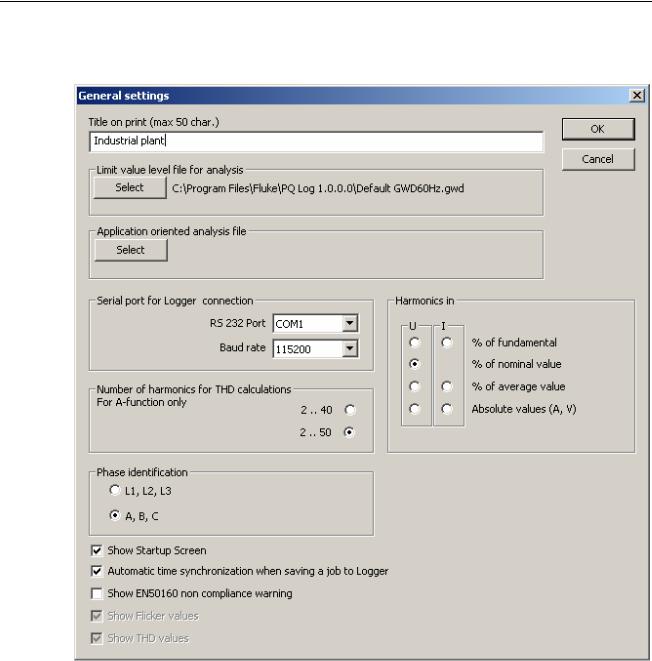
In the Settings Menu under General, the following screen presents you with choices for the following:
egd011.bmp
Figure 12. General Settings Menu
•Title to print on the automatic report
•Serial port and baud rate
•Calculation method for harmonics readings (A function only)
•Number of harmonic orders included in thd calculation (40 or 50) (A function only)
•Phase identification (display of ”L1, L3, and L3” or ”A, B, and C”)
•A way to turn off automatic display of the Startup Screen when PQ Log is started
•Turning on or off automatic transfer of the PC’s internal real-time time/date setting to the Logger’s internal real-time clock every time settings for a new job are written to the Logger
12
PC Software for 1740 Series
Advanced (Optional) Logger Settings
•A way to turn on or off display of a warning message that a logging period is not in conformance with the European EN 50160 standard
•Turning on or off flicker and thd values during data analysis
Settings for Medium Voltage Networks
When preparing a Logger for use, you can enter ratios for voltage and current, resulting in the calculation and display of primary side values. For example, in 14 kV delta power network, the primary side of a Potential Transformer (PT) might be at 14 kV potential, and the secondary side might be at 100 V potential. There might be a Current Transformer (CT) with a ratio of 1000 A to 5 A. For the Logger to display readings in the 14 kV and 1000 A range:
1.In the ”Set up a logger for function P or A” screen, check the box for ”Voltage transformer” at the top of the screen. Entry boxes for Primary and Secondary appear. Make the voltage entries as shown:
egd012.bmp
Figure 13. Potential Transformer
2.Open the Current menu. Check the box for Current Transformer, and enter the current primary and secondary as shown:
13
Loading...