


 BROOKFIELD
 YR-1
YR-1


Rheometer
Operating Instructions
Manual No. M02-215-B0412
SPECIALISTS IN THE
MEASUREMENT AND
CONTROL OF VISCOSITY
with offices in: Boston • Chicago • London • Stuttgart • Guangzhou
BROOKFIELD ENGINEERING LABORATORIES, INC.
11 Commerce Boulevard, Middleboro, MA 02346 USA
TEL 508-946-6200 |
or 800-628-8139 (USA excluding MA) |
FAX 508-946-6262 |
INTERNET http://www.brookfieldengineering.com |
Brookfield Engineering Labs., Inc. |
Page 1 |
Manual No. M02-215-B0412 |
|
|
|

|
|
Table of Contents |
|
I. |
INTRODUCTION............................................................................................................................................................................. |
5 |
|
|
I.1 |
Components........................................................................................................................................................................ |
7 |
|
I.2 |
Utilities................................................................................................................................................................................... |
8 |
|
I.3 |
Specifications....................................................................................................................................................................... |
9 |
|
I.4 |
Installation......................................................................................................................................................................... |
10 |
|
I.5 |
Safety Symbols and Precautions................................................................................................................................ |
11 |
|
I.6 |
Key Functions................................................................................................................................................................... |
11 |
|
I.7 |
Cleaning.............................................................................................................................................................................. |
12 |
II. |
GETTING STARTED WITH EZ-YIELD SOFTWARE........................................................................................................... |
13 |
|
|
II.1 |
EZ-Yield Overview........................................................................................................................................................... |
13 |
|
II.2 |
EZ-Yield Quick Start........................................................................................................................................................ |
13 |
|
II.3 |
Test Parameter Description......................................................................................................................................... |
14 |
|
II.4 |
Toolbar and Menu Options.......................................................................................................................................... |
18 |
|
II.5 |
Data Page........................................................................................................................................................................... |
22 |
|
II.6 |
Graphs Page...................................................................................................................................................................... |
24 |
|
II.7 |
Options Toolbar............................................................................................................................................................... |
25 |
|
II.8 |
Data Legend Toolbar...................................................................................................................................................... |
26 |
III. RUNNING TEST PROGRAMS IN STAND-ALONE MODE.............................................................................................. |
28 |
||
|
III.1 |
Autozero............................................................................................................................................................................ |
28 |
|
III.2 |
The Default Screen........................................................................................................................................................ |
29 |
|
III.3 |
Running A Program....................................................................................................................................................... |
29 |
|
III.4 |
Data Output..................................................................................................................................................................... |
33 |
|
III.5 |
Printing A Program........................................................................................................................................................ |
34 |
|
III.6 |
Test Results....................................................................................................................................................................... |
36 |
IV. EXAMPLES........................................................................................................................................................................................ |
39 |
||
|
IV.1 |
Example Application: Body Wash Gel with Bath Beads.................................................................................... |
39 |
|
IV.2 |
Example Application: Skin Care Cream.................................................................................................................. |
40 |
|
IV.3 |
Example Application: Ketchup.................................................................................................................................. |
41 |
|
IV.4 |
Torque vs. Time for Various Products...................................................................................................................... |
42 |
APPENDIX A - Spindle and Model Codes................................................................................................................................... |
44 |
||
APPENDIX B - Speeds........................................................................................................................................................................ |
45 |
||
APPENDIX C - Calibration Procedures......................................................................................................................................... |
46 |
||
APPENDIX D - Calculations.............................................................................................................................................................. |
50 |
||
APPENDIX E - Communications.................................................................................................................................................... |
52 |
||
APPENDIX F - Model S Laboratory Stand................................................................................................................................... |
54 |
||
APPENDIX H - DVE-50 Probe Clip.................................................................................................................................................. |
56 |
||
APPENDIX G - Instrument Dimensions....................................................................................................................................... |
57 |
||
APPENDIX I - Fault Diagnosis and Troubleshooting............................................................................................................... |
58 |
||
APPENDIX J - Online Help and Other Resources...................................................................................................................... |
62 |
||
APPENDIX K - Warranty Repair and Service................................................................................................................................ |
63 |
||
Brookfield Engineering Labs., Inc. |
Page 3 |
Manual No. M02-215-B0412 |
I.INTRODUCTION
The yield point is the point at which a material begins to flow. The associated properties are the yield stress and yield strain. The yield stress is the critical shear stress, applied to the sample, at which the material begins to flow as a liquid. The yield strain is the deformation, resulting from the applied stress, at which the flow starts.
Many materials are designed to have a yield point, so that the behavior of their products satisfies various customer needs. Foods often have yield points. Ketchup, in particular, must flow out of a bottle when shaken or squeezed, but then solidify on the targeted food, such as french fries. Shaking or squeezing the bottle stresses the ketchup so that it flows; after the ketchup settles on the fries, its structure rebuilds so the ketchup “sits” in place rather than flowing off the fries like water. Puddings have yield points, as well. The “body” of the pudding appeals to consumers – it is solid at rest, yet it’s easily spooned out of its cup and is easy to eat. Thus, the yield behavior of many foods contributes to the food texture that we like.
Many paints have low yield stresses. Many latex house paints, for example, are easily stirred or poured. Brushingorsprayingprovidesenoughstresssothatthepaintflowseasilyandsmoothly over a painted wall. However, a thin layer of applied paint that is allowed to rest undisturbed on the surface, regains its structure quickly so that there is very little unsightly “dripping” afterwards. The smooth appearance of the painted surface is very appealing to the homeowner.
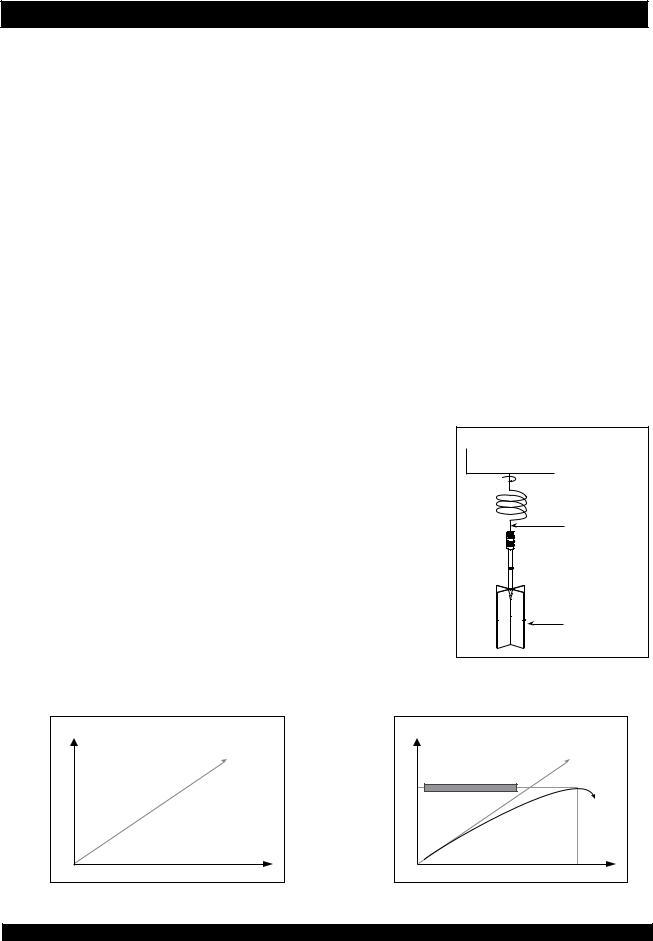
The operating principle of the YR-1 Rheometer is to drive a spindle through a calibrated spiral spring connected to a motor drive shaft (see Figure I-1). The vaned spindle is immersed in the test material. The resistance of the material to movement ismeasuredbyobservingincreasingtorquevaluesastheYR-1 motorrotates. Theamountofshaft rotationismeasured bythe deflection of the calibrated spiral spring inside the instrument. Spring deflection is measured with a rotary transducer.
Ifthevanespindledidnotmoveatall,thedatawouldlooklike the graph in Figure I-2. The data often looks like the graph in Figure I-3 because there usually is some deformation of the test material due to the increasing force imparted by the vane
 Motor
Motor
Calibrated
 Spiral Spring
Drive
Shaft
Vane
Spindle
Figure I-1
TORQUE |
TIME |
Figure I-2 |
TORQUE |
Maximum Torque Value |
|
|
|
TIME |
|
Figure I-3 |
Brookfield Engineering Labs., Inc. |
Page 5 |
Manual No. M02-215-B0412 |

spindle. The maximum torque value is the yield point. The straight line in Figure I-3 is a repeat of what was shown in Figure I-2. An algorithm in the YR-1 firmware converts the maximum torque value into a yield stress value.
TheshearstressmeasurementrangeoftheYR-1(inPascals)isdeterminedbythesizeandshape of the vane spindle, and the full scale torque range of the calibrated spring.
There are four basic spring torque series offered by Brookfield:
Model |
dyne-cm |
Spring Torque |
milli Newton - m |
||
1/4RVYR-1 |
1,796 |
0.1796 |
RVYR-1 |
7,187 |
0.7187 |
HBYR-1 |
57,496 |
5.7496 |
5XHBYR-1 |
287,480 |
28.7480 |
The shear stress measurement range for the three standard (or supplied) vane spindles at each spring torque is as follows:
|
|
SHEAR STRESS |
SPINDLE |
TORQUE RANGE |
RANGE (Pa) |
V-71 |
1/4 RV |
.125-1.25 |
V-72 |
1/4 RV |
.5-5 |
V-73 |
1/4 RV |
2.5-25 |
V-71 |
RV |
.5-5 |
V-72 |
RV |
2-20 |
V-73 |
RV |
10-100 |
V-71 |
HB |
4-40 |
V-72 |
HB |
16-160 |
V-73 |
HB |
80-800 |
V-71 |
5xHB |
20-200 |
V-72 |
5xHB |
80-800 |
V-73 |
5xHB |
400-4000 |
Table I-1
The equivalent units of measurement in the SI system are calculated using the following con-
versions: |
|
SI |
|
CGS |
|
Shear Stress: |
1 |
= |
|||
Pascal or 1 Newton/m2 |
10 dyne/cm2 |
||||
Torque: |
1 |
Newton-m |
= |
107 dyne-cm |
Brookfield Engineering Labs., Inc. |
Page 6 |
Manual No. M02-215-B0412 |

I.1 Components
Refer to Figure I-1 below which shows the fully assembled YR-1 Rheometer.
YR-1
Viscometer
Model S
Lab Stand
Shipping
Cap
Base
Figure I-1: YR-1 Rheometer
Note that a temperature probe is optional. Two vane spindles are included with the instrument.
Additional vane spindles are available for purchase and are listed at the end of this section.
Brookfield Engineering Labs., Inc. |
Page 7 |
Manual No. M02-215-B0412 |

The following items are included in your instrument kit:
Item |
Part Number |
|
Quantity |
|
YR-1 Rheometer |
varies, e.g., RVYR1-115 |
|
1 |
|
|
(115 Volt YR-1 with RV |
|
|
|
|
spring torque) |
|
|
|
Model S Laboratory Stand |
MODEL S |
|
|
1 |
Spindle Set with Case |
SSVANE |
|
|
1 |
|
Included Spindles: |
|
|
|
|
|
Length |
Diameter |
|
|
V-72 |
1.706 in. |
.853 in. |
1 |
|
V-73 |
.998 in. |
.499 in. |
1 |
Power Cord |
DVP-65 for 115V or |
|
1 |
|
|
DVP-66 for 230V |
|
|
|
Temperature Probe (optional) |
DVP-94Y |
|
|
1 |
Carrying Case |
DVE-7Y |
|
|
1 |
EZ-Yield Software Disk (3-1/2”) |
YR1-4AY |
|
|
1 |
Interconnecting Cable to PC |
DVP-80 |
|
|
1 |
Operating Manual |
M02-215 |
|
|
1 |
Pleasechecktobesurethatyouhavereceivedallcomponents,andthatthereisnodamage. If you are missing any parts, please notify Brookfield Engineering or your local Brookfield agent immediately. Any shipping damage must be reported to the carrier.
Optional spindles available for use with the YR-1 Rheometer include, note that the choiceofthevanespindledependsinpartonthesamplesizeavailableandanticipated range of yield stress to be measured:
Item |
Part Number |
Length |
Diameter |
V-71 Spindle |
V-71 |
2.708 in. |
1.354 in. |
V-74 Spindle |
V-74 |
.463 in. |
.232 in. |
V-75 Spindle |
V-75 |
.632 in. |
.316 in. |
I.2 Utilities
Input Voltage: |
115 VAC or 230 VAC |
Input Frequency: |
50/60 Hz |
Power Consumption: |
30 VA |
Power Cord Color Code: |
|
Brookfield Engineering Labs., Inc. |
Page 8 |
Manual No. M02-215-B0412 |

Hot (live) |
United States |
Outside United States |
Black |
Brown |
|
Neutral |
White |
Blue |
Ground (earth) |
Green |
Green/Yellow |
I.3 Specifications |
|
|
Speeds: |
Pre Shear |
0.01 to 200 rpm |
|
Zero |
0.01 to 0.5 rpm |
|
Yield Test |
0.01 to 5 rpm |
Time Intervals: |
100 msec - 1000 msec |
|
Weight: |
Gross Weight |
23 lbs. 10.5 kg. |
|
Net Weight |
20 lbs. 9 kg. |
|
Carton Volume |
1.65 cu. Ft. 0.05 m3 |
Temperature sensing range: |
-100°C to 300°C (-148°F to 572°F) |
|
Analog Torque Output: |
0 |
- 1 Volt DC = 0 - 100% Torque |
Analog Temperature Output: |
0 |
- 4 Volts DC = -100°C to +300°C |
RS232 Compatible Serial Port for use with an attached printer or PC.
Centronics Compatible Parallel Port for use with an attached printer.
Torque Accuracy: |
±1.0% of full scale range |
Torque Repeatability: |
±0.2% |
Temperature Accuracy: |
±1 °C : -100°C to +149°C |
|
±2 °C : +150°C to +300°C |
Operating Environment: |
0 °C to 40 °C temperature range (32 °F to 104 °F) |
|
20% - 80% R.H.: non-condensing atmosphere |
Electrical Certifications:
Conforms to CE Standards:
BSEN 61326: Electricalequipmentformeasurement,controlandlaboratoryuse-EMC requirements
BSEN 61010-1: Safety requirements for electrical equipment, for measurement, control and laboratory use.
Brookfield Engineering Labs., Inc. |
Page 9 |
Manual No. M02-215-B0412 |

NOTICE TO CUSTOMERS:
This symbol indicates that this product is to be recycled at an appropriate collection center.
Users within the European Union:
Please contact your dealer or the local authorities in charge of waste management on how to dispose of this product properly. All Brookfield offices and our network of representatives and dealers can be found on our website: www.brookfieldengineering.com
Users outside of the European Union:
Please dispose of this product according to your local laws.
I.4 Installation
1.Assemble the Model S Laboratory Stand (refer to assembly instructions inAppendix F).
2.Connect the RTD probe to the socket on the rear panel of the YR-1.
3.The Rheometer must be leveled. The level is adjusted using the two leveling screws on the base. Adjust so that the bubble level on top of the YR-1 is centered.
Note: Check level periodically during use.
4.Remove the white shipping cap, which secures the spindle coupling nut on the Rheometer to the pivot cup.
5.Make sure that the AC power switch at the rear of the YR-1 is in the OFF position. Connect the power cord to the socket on the back panel of the instrument and plug it into the appropriate AC line.
TheAC input voltage and frequency must be within the appropriate range as shown on the nameplate of the viscometer.
Note: The YR-1 must be earth grounded to ensure against electronic failure!!
6.Turn the power switch to the ON position and allow the YR-1 to warm up for 10 minutes before performing the autozero.
7.If appropriate, attach the interconnecting cable to the serial port to connect the YR-1 to a PC or printer.
8.If appropriate, attach the interconnecting cable to the parallel port to connect the YR-1 to a printer.
9.If appropriate, attach the interconnecting cable to the analog (serial) port to connect the YR-1 to a chart recorder.
Brookfield Engineering Labs., Inc. |
Page 10 |
Manual No. M02-215-B0412 |
I.5 Safety Symbols and Precautions
Safety Symbols
The following explains safety symbols which may be found in this operating manual.
Indicates hazardous voltages may be present.
Refer to the manual for specific warning or caution information to avoid personal injury or damage to the instrument.
Precautions
If this instrument is used in a manner not specified by the manufacturer, the protection provided by the instrument may be impaired.
This instrument is not intended for use in a potentially hazardous environment.
In case of emergency, turn off the instrument and then disconnect the electrical cord from the wall outlet.
The user should ensure that the substances placed under test do not release poisonous, toxic or flammable gases at the temperatures which they are subjected to during the testing.
I.6 Key Functions
The following explains the functions of the control keys on the face of the YR-1 Yield Rheometer.
ENTER
ESC
UP ARROW
Used to scroll UP(in an increasing direction) through the menu and program selections.
DOWN ARROW
Used to scroll DOWN (in a decreasing direction) through the menu and program selections.
ENTER
Used to accept or activate the current selection.
ESCAPE
Used to cancel an operation or return to a previous screen.
Note: Selections are indicated as flashing text on the screen display.
Figure I-2: YR-1 Keypad
Brookfield Engineering Labs., Inc. |
Page 11 |
Manual No. M02-215-B0412 |

I.7 Cleaning
Make sure the instrument is in a decent working environment (dust-free, moderate temperature , low humidity, etc).
Make sure the instrument is on a level surface.
Hands/fingers must be clean and free of residual sample. Not doing so may result in deposit build-up on the upper part of the shaft and cause interference between the shaft and the pivot cup.
Be sure to remove the spindle from the instrument prior to cleaning. Severe instrument damage may result if the spindle is cleaned in place.
Instrument and Keypad: |
Cleanwithadry,non-abrasivecloth. Donotusesolvents |
|
or cleaners. |
Immersed Components (spindles): |
Spindles are made of stainless steel. Clean with a non- |
|
abrasive cloth and solvent appropriate for sample mate- |
|
rial. |
When cleaning, do not apply excessive force, which may result in bending the spindles.
Brookfield Engineering Labs., Inc. |
Page 12 |
Manual No. M02-215-B0412 |

II.GETTING STARTED WITH EZ-YIELD SOFTWARE
This section explains how to create a test program for the YR-1 Rheometer. There are no test programs stored in instrument memory when theYR-1 is shipped from Brookfield. Therefore, you will need to use the EZ-Yield Software to create test programs. Once a test program has been downloaded from your PC to the YR-1, you will be able to run tests by following the instructions in Section III.
Brookfield EZ-Yield software is a 32-bit Windows program supplied with every YR-1 Yield Rheometer.
II.1 EZ-Yield Overview
EZ-Yield provides the following features:
•EZ-Yield allows you to easily create a yield test and download it to one of the ten (10) memory locations in theYR-1 Rheometer. These programs are retained in memory so that the YR-1 can be disconnected from the PC and used in remote locations (e.g., in a Q.C. laboratory, the production floor, etc.). Test programs can be saved and printed from the host PC.
•EZ-Yield collects all the data from a yield test, in addition to the final Yield Stress. These data can be saved, printed and graphed using the software.
II.2 EZ-Yield Quick Start
1.Ensure the YR-1 is powered “on” and ready to accept test programs.
2.Ensure the appropriate serial (RS-232) cable (Brookfield Part # DVP-80) is connected to the serial port of the YR-1 and a serial port (COM port) on the host PC.
3.Start the EZ-Yield software in one of the following manners:
•Click on its associated icon.
•ClicktheWindowsStart button. Select Run. Enter the name of the program, “ezyield. exe”, (including the path) and click OK to execute EZ-Yield.
4.Once EZ-Yield is running, set the COM Port setting on the toolbar to the appropriate COM port.
5.Set the Instrument setting on the toolbar to “YR-1”.
6.Click on the Test Parameters tab beneath the toolbar. Select the appropriate values for all the test parameters listed at the left of the Test Parameter page. See Section II.3 for more information regarding how to select Test Parameters. Save the test parameters if desired by clicking the Save button or by clicking Save on the File menu.
7.Click the Download button on the toolbar or click Download Program in the Utility menu.
8.Ensure the appropriate spindle is attached to the YR-1 and that the sample is properly prepared.
Brookfield Engineering Labs., Inc. |
Page 13 |
Manual No. M02-215-B0412 |

9.Click the down arrow on the Run button or click Run Program on the Utility menu. Select the program number you wish to run - in this case, the program number specified in the list of test parameters.
10.After a few seconds, the Graphs page is automatically displayed, signaling that the test has begun. Once all the optional preparation steps are complete, the YR-1 begins sending data to the EZ-Yield software and displaying it on the graph and in the data table on the Data page.
11.When the test is complete, a dialog box appears asking you to save the data just acquired.
II.3 Test Parameter Description
Figure II-1
Use this page to create, load, save, and print test parameters that are downloaded into one of the memory locations in theYR-1 Rheometer. The file name (including path) of the test parameters currently loaded is displayed at the top of the page.
Click on the entry field to edit the information in that field. The fields with downward pointing arrows on the right require that you click that arrow to make a selection from the drop down list.
When a field is selected, the text on the right of the page, in the Parameter Descriptions box, changestogiveinformationappropriatetothefieldselected. SeeSection II.3 - Test Parameter Description - for more information regarding each of the test parameters.
The Pre-Shear, Zero, and Wait Time steps are optional. Clicking the check box to the left of
Brookfield Engineering Labs., Inc. |
Page 14 |
Manual No. M02-215-B0412 |

these fields until the check mark appears enables these parameters. Clicking the check box to the left of these fields until the check mark disappears disables these parameters.
Clicking the New button (or selecting New from the File menu) sets all parameters to their default values.
All open, save, and print operations selected while this page is displayed will open, save, and print test parameters, but NOT data.
II.3.1 Program Number
This is the number of the memory slot in theYR-1 Rheometer to which the test parameters will be loaded. There are ten (10) slots, numbered from 0 through 9.
II.3.2 Program Name
Thisdescriptiveuser-suppliednameisloadedintothememoryslotintheYR-1Rheometerwith
thetestparameters. Amaximumoften(10)alphanumericcharactersmaybeusedforthisname.
II.3.3 Spindle
Spindle Number
A two (2) digit code representing the spindle number used for the test must be selected. See AppendixAfor more information regarding spindles for use with the YR-1 Rheometer. Selection of the appropriate spindle code is important to ensure correct stress calculations.
Primary

 Immersion
Mark
Secondary

 Immersion
Mark
Figure II-2
Immersion Mark
Eachvanespindlehastwo(2)immersionmarks. Theprimaryimmersionmarkislocatedonthe spindle shaft. Normally, the spindle should be inserted so that the sample reaches this mark. If the sample container is too small to allow the spindle to be inserted to this mark, the secondary
Brookfield Engineering Labs., Inc. |
Page 15 |
Manual No. M02-215-B0412 |

immersionmarkmaybeused. Thismarkappearshalfwaydownthebladesofthevanespindles. See Appendix A for more information regarding spindles and immersion marks.
Note: Selection of the appropriate immersion mark is important to ensure correct stress calculations.
II.3.4 Pre-Shear Information
An optional, Pre-Shear step can be included in the test parameters. If the Pre-Shear box is checkedontheTestParameterpageoftheEZ-Yieldsoftware,apre-shearstepwillbeperformed before running the actual test. The user must supply the speed and duration of the pre-shear step. See Appendix B for a complete list of pre-shear speeds.
Pre-shearing is the shearing of sample before measuring its yield properties. This process breaksdownthesample’sstructure. Itisparticularlyusefuliftheinvestigatorwantstoeliminate previous shear history (e.g., bumping, transferring) of the sample before testing and observe the structural rebuilding of the sample. This may simulate the following: ketchup pumped out of a bottle will rebuild after it comes to rest on the French Fries. There are materials whose measured yield stress will be lower after pre-shearing than if tested without pre-shearing. This may be used to compare the rate at which different materials rebuild. The yield stress measured inapre-shearedsampleisthe“dynamicyield”,whiletheyieldstressmeasuredforanoriginally undisturbed material is the “static yield”.
Zeroing is, of course, a necessary step after pre-shearing is performed on the sample and is highly recommended for every test.
II.3.5 Zero
An optional, but highly recommended, torque Zero step can be included in the test parameters. If the Zero box is checked on the Test Parameter page of the EZ-Yield software, the rheometer will rotate the spindle in the appropriate direction until 0% torque is achieved.
This may be necessary because the spindle sometimes twists a small amount during insertion into the sample. This results in a small, although possibly significant, torque applied to the sample. Slow zeroing speeds are used to eliminate this initial torque and minimize effects on the sample’s structure before the test is started.
Zeroing is an essential step after pre-shearing.
This gives a consistent starting point for each test. Aspeed for the step must be supplied in the appropriate box. Faster speeds achieve a “zero” quicker but may cause a more variable starting point. See Appendix B for a complete list of zero step speeds.
Brookfield Engineering Labs., Inc. |
Page 16 |
Manual No. M02-215-B0412 |

II.3.6 |
Wait Time |
An optional Wait step can be included in the test parameters. If the Wait Time box is checked on the Test Parameters page of the EZ-Yield software, there will be a time delay of the amount specified just before the actual test run begins. During this delay, the motor shaft will be at zero (0) RPM.
Wait Time is the time the sample is allowed to rest between the completion of zeroing and the start of the yield measurement. Some samples rebuild structure more slowly than others after shearing, such as during handling, pouring sample into a beaker, etc. Certain low-viscosity paints may also have a low yield stress. Waiting 30 seconds, for example, after immersing the spindle may allow the sample to rebuild, producing a more consistent test method.
II.3.7 Run Speed
Run Speed is the motor speed for the YR-1 at which the material is tested. It is common for materialstoappearstifferwhentestedathigherspeeds. Thatis,theslopeofthestress-vs.-strain curve increases with increasing speed. This is because the material structure has less time in which to react to dissipate the applied stress. Increasing the speed will, in most cases, increase the yield stress measured by the instrument. Most yield tests are conducted at relatively low speeds (<1 rpm) to minimize any inertial effects when using vane spindles. See Appendix B for a complete list of run speeds.
II.3.8 Base Increment
Base Increment istheamountoftimeinmillisecondsbetweendatapointsusedfortakingtorque (stress) readings. The software automatically calculates base increment values. Smaller base increment values are used during faster speed tests to ensure that data are taken fast enough to properly determine the yield point. Larger base increment values are used during slower speed testsbecausethesetestsareexpectedtotakelongerandthelongertimebetweendatapointshelps prevent typical data files from becoming very large. However, the user may still wish to set this value to suit the required need after some familiarity is gained with the material being tested.
The % torque data are used to determine when a yield point is reached. The rigid line incremental torque value is automatically calculated by the EZ-Yield software and depends on the Run Speed selected. Although this value is calculated, it can be altered if there is a compelling need to do so. If the Base Increment has been manually altered for any reason, selecting a new Run Speed automatically resets the Base Increment to its optimum value.
II.3.9 Torque Reduction
Torque Reduction is the reduction in torque, occurring at the defined yield point, based on comparison to a rigid (solid) sample. That is, the material yields or begins to break down and, as a result, the measured incremental torque begins to decrease. Avalue of 100% for this parameter
Brookfield Engineering Labs., Inc. |
Page 17 |
Manual No. M02-215-B0412 |

causes the test to stop as soon as there are no torque increases during a base time increment. Some users may wish to see a drop in torque after the yield point. Setting this parameter to values greater than 100% allows data to be collected after the yield point by the EZ-YieldTM software so the decrease in torque may be more easily visualized.
II.3.10 Low and High Yield Limits
These values (in Pa) can be used as a Quality Control tool. If the resulting yield stress from a test falls outside these limits, an appropriate message is displayed and printed with the results. Entering zero (0) for both these parameters disables this QC feature.
II.4 Toolbar and Menu Options
Note: All functions shown on the toolbar can also be accessed from the menu above the toolbar.
II.4.1 New
Selecting New (using the New button or the New option in the File menu) displays the Test Parameters page with default values in each field. Use this function before creating a new test program.
II.4.2 Open
SelectingOpen (usingtheOpen button or the Open option in the File menu)displaystheOpen File dialog box.
Figure II-3
Brookfield Engineering Labs., Inc. |
Page 18 |
Manual No. M02-215-B0412 |

The Open File dialog box automatically displays files of the type it thinks the user requires; i.e., if the Test Parameters page was displayed, the file types displayed are test parameter files (*.BYT) and if the Data or Graph pages were displayed, the file types displayed are data files (*.DB). Regardless of the file types initially displayed, either type of file can be loaded by selecting the desired type at the bottom of the Open File dialog using the Files of Type drop down list.
II.4.3 Save
Selecting Save (using the Save button or the Save option in the File menu) displays the Save File dialog box.
Figure II-4
The Save File dialog box automatically displays files of the type it thinks the user requires (i.e. If the Test Parameters page was displayed, the file types displayed are test parameter files (*.BYT)andiftheData or Graph pagesweredisplayed,thefiletypesdisplayedaredatafiles.). Regardless of the file types initially displayed, either type of file can be saved by selecting the desired type at the bottom of the Save File dialog using the Files of Type drop down list.
Brookfield Engineering Labs., Inc. |
Page 19 |
Manual No. M02-215-B0412 |

II.4.4 Print
Selecting Print (using the Print button or the Print option in the File menu) displays a Print Preview window. Once this window is displayed, clicking the Print button sends the report to the selected printer. The functions of the buttons on the toolbar are described below:
|
Figure II-5 |
Zoom To Fit |
Displays a complete page of the report in the window. Text and |
|
graphics are shrunk so that a complete page will fit on the screen. |
Zoom To 100% |
Increases the size of all text and graphics so that they are displayed |
|
at 100% of their actual size. |
Zoom To Width |
Displays a page so that the complete width of the page fits on the |
|
screen. |
First Page |
Displays the first page of the report. |
Previous Page |
Displays the previous page of the report. |
Next Page |
Displays the next page of the report. |
Last Page |
Displays the last page of the report. |
Printer Setup |
Displays the standard Windows Print Setup dialog box. From this |
|
dialog box, a target printer can be chosen and its settings can be |
|
altered before printing. |
Brookfield Engineering Labs., Inc. |
Page 20 |
Manual No. M02-215-B0412 |
 Loading...