


 BROOKFIELD
 DV2T
DV2T


Viscometer
Operating Instructions
Manual No. M13-167-B0614
SPECIALISTS IN THE
MEASUREMENT AND
CONTROL OF VISCOSITY
with offices in: Boston • Chicago • London • Stuttgart • Guangzhou
BROOKFIELD ENGINEERING LABORATORIES, INC.
11 Commerce Boulevard, Middleboro, MA 02346 USA
TEL 508-946-6200 or 800-628-8139 (USA e xcluding MA) FAX 508-946-6262 INTERNET http://www.brookfieldengineering.com

|
|
|
|
Table of Contents |
|
I. INTRODUCTION.......................................................................................... |
5 |
||||
I.1 Components............................................................................................................... |
6 |
||||
I.2 |
Utilities........................................................................................................................ |
|
|
8 |
|
I.3 |
Specifications.............................................................................................................. |
8 |
|||
I.4 |
Installation................................................................................................................... |
9 |
|||
I.5 |
Safety Symbols and Precautions............................................................................... |
11 |
|||
I.6 |
Key Functions............................................................................................................ |
11 |
|||
I.7 |
Cleaning.................................................................................................................... |
|
12 |
||
II. GETTING STARTED................................................................................ |
13 |
||||
II.1 Power Up................................................................................................................. |
|
13 |
|||
II.2 AutoZero.................................................................................................................. |
|
13 |
|||
II.3 |
Status Bar................................................................................................................ |
14 |
|||
II.4 |
Navigation................................................................................................................ |
15 |
|||
II.5 Home Screen........................................................................................................... |
16 |
||||
|
|
II.5.1 |
Configure Viscosity Test............................................................................. |
16 |
|
|
|
II.5.2 |
Load Test.................................................................................................... |
18 |
|
|
|
II.5.3 |
View Results .............................................................................................. |
19 |
|
|
|
II.5.4 |
Manage Files.............................................................................................. |
19 |
|
|
|
II.5.5 |
External Mode............................................................................................. |
19 |
|
II.6 |
Range...................................................................................................................... |
|
|
19 |
|
II.7 |
Out of Range........................................................................................................... |
20 |
|||
II.8 |
Printing..................................................................................................................... |
|
|
21 |
|
III. MAKING VISCOSITY MEASUREMENTS.............................................. |
23 |
||||
III.1 |
|
Quick Start.............................................................................................................. |
23 |
||
III.2 |
|
Preparations for Making Measurements................................................................. |
23 |
||
III.3 |
|
Selecting a Spindle/Speed...................................................................................... |
24 |
||
III.4 |
|
Multiple Data Points................................................................................................ |
25 |
||
III.5 |
|
Selecting Data Collection........................................................................................ |
25 |
||
III.6 |
|
End Condition......................................................................................................... |
28 |
||
III.7 |
Additional Test Parameters..................................................................................... |
29 |
|||
III.8 |
|
Running a Test........................................................................................................ |
32 |
||
III.9 |
|
Results |
.................................................................................................................... |
|
34 |
III.10 |
Data Averaging..................................................................................................... |
36 |
|||
IV. SETTINGS.............................................................................................. |
39 |
||||
IV.1 |
Device Setup.......................................................................................................... |
39 |
|||
IV.2 |
User Settings.......................................................................................................... |
42 |
|||
IV.3 |
Global Settings....................................................................................................... |
44 |
|||
IV.4 Admin Functions..................................................................................................... |
49 |
||||
|
|
IV.4.1 |
Log In and Log Out.................................................................................. |
49 |
|
|
|
IV.4.2 |
Users and Access.................................................................................... |
50 |
|
IV.4.3 |
Set Time and Date................................................................................... |
52 |
IV.4.4 |
Backup and Import.................................................................................. |
52 |
IV.4.5 |
Default Path............................................................................................. |
53 |
IV.4.6 |
Settings Reset......................................................................................... |
53 |
IV.4.7 |
Device Reset........................................................................................... |
53 |
IV.4.8 |
Calibration Reminder............................................................................... |
54 |
IV.4.9 |
Save Audit Trail........................................................................................ |
54 |
V. PG FLASH SOFTWARE.......................................................................... |
55 |
|
Appendix A: Cone/Plate Viscometer Setup........................................................ |
58 |
|
Appendix B: Viscosity Ranges......................................................................... |
62 |
|
Appendix C: Variables in Viscosity Measurement................................................ |
66 |
|
Appendix D: Spindle Entry Codes and SMC/SRC Values..................................... |
68 |
|
Appendix E: Spindle Entry Codes and Range Coefficients................................... |
71 |
|
Appendix F: Calibration Procedures................................................................. |
73 |
|
Appendix G: The Brookfield Guardleg............................................................... |
80 |
|
Appendix H: Speed Selection.......................................................................... |
82 |
|
Appendix I: Laboratory Stand.......................................................................... |
83 |
|
Appendix J: DVE-50A Probe Clip..................................................................... |
86 |
|
Appendix K: Screen Protector......................................................................... |
87 |
|
Appendix L: Fault Diagnosis and Troubleshooting.............................................. |
89 |
|
Appendix M: Instrument Dimensions................................................................ |
91 |
|
Appendix N: Online Help and Additional Resources............................................ |
92 |
|
Appendix O: Warranty Repair and Service........................................................ |
93 |
|
Viscosity Test Report.......................................................................... |
Tear out page |
|

I.INTRODUCTION
The Brookfield DV-II Viscometer series has been the leading industrial viscometer since it was first introduced in 1985. Brookfield has continued to develop and improve the DV-II to provide the best value in the market for both quality control and research customers. The Brookfield DV2T Viscometer continues in this tradition of innovation, quality and value. The incorporation of a full color graphical touch screen display has allowed for a new and improved user interface which preserves the single speed data collection methods while making all of the advanced features of the DV2T readily available.
The Brookfield DV2T Viscometer measures fluid viscosity at given shear rates. Viscosity is a measure of a fluid’s resistance to flow. You will find a detailed description of the science of viscosity in the Brookfield publication “More Solutions to Sticky Problems”, a copy of which was included with your DV2T.
This manual covers the DV2T Viscometer and the DV2T Extra Viscometer. The DV2T Extra is a special package that includes several optional features to maximize the utility of the DV2T. The DV2T Extra includes: Ball Bearing Suspension (not included in LV versions), EZ-Lock spindle connection, Model Q Lab Stand, and RheocalcT Software. These differences are detailed in the Components section of the manual. All references to the viscometer in this manual will be made as DV2T. All of the optional features of the DV2T Extra may be added individually to the DV2T Viscometer.
•TheDV2Toffersexceptionalversatilityinmodesofcontrol,allowingchoiceoftraditional standalone operation and automatic operation through programs downloaded from the PC or with complete control by PC using Brookfield RheocalcT Software.
•The DV2T can be used as a traditional Brookfield viscometer for collection of single speed viscosity data through the easy to use touch screen; just select the spindle and speed and read the value from the display. [See Section II: Getting Started]
•The Brookfield PG Flash Software can be used to program the DV2T to control all aspects of the test and data collection without the need for the operator to monitor the instrument; just start the program and return to the printed test data (printer is optional). [See Section V: PG Flash Software]
•The Brookfield RheocalcTSoftware will perform all control and data collection functions of the DV2T from the PC while also providing a platform for advanced data collection and analysis.
In any of these modes of control, the DV2T will provide the best in viscosity measurement and control.
The principal of operation of the DV2T is to drive a spindle (which is immersed in the test fluid) throughacalibratedspring. Theviscousdragofthefluidagainstthespindleismeasuredbythe spring deflection. Spring deflection is measured with a rotary transducer. The measurement range of a DV2T (in centipoise or milliPascal•seconds) is determined by the rotational speed of the spindle, the size and shape of the spindle, the container the spindle is rotating in, and the full scale torque of the calibrated spring.
There are four basic spring torque series offered by Brookfield:
Model |
Spring Torque |
|
dyne•cm |
milliNewton•m |
|
DV2TLV |
673.7 |
0.0673 |
DV2TRV |
7,187.0 |
0.7187 |
DV2THA |
14,374.0 |
1.4374 |
DV2THB |
57,496.0 |
5.7496 |
The higher the torque calibration, the higher the measurement range. The measurement range for each torque calibration may be found in Appendix B.
Brookfield Engineering Labs., Inc. |
Page 5 |
Manual No. M13-167-B0614 |

All units of measurement are displayed according to either the CGS system or the SI system.
1.Viscosity appears in units of centipoise (cP), Poise (P), milliPascal-seconds (mPa•s) or Pascal-seconds (Pa•s) on the DV2T Viscometer display or centistokes (cSt) or millimeter squared per second (mm2/sec).
2.Shear Stress appears in units of dynes/square centimeter (D/cm2) or Newtons/ square meter (N/m2)/or Pascals (Pa).
3.Shear Rate appears in units of reciprocal seconds (1/sec).
4.Torque appears in units of dyne-centimeters or Newton-meters (shown as percent “%” in both cases) on the DV2T Viscometer display.
5.Density appears in units of grams/cubic centimeter (g/cm3) or kilograms/cubic meter (kg/m3).
Note: TochangeCGStoSIunitsonthedisplay-seeSectionIV.3:GlobalSettings.
The equivalent units of measurement in the SI system are calculated using the following conversions:
Viscosity: |
|
SI |
|
CGS |
1 mPa•s |
= 1 cP |
|||
Shear Stress: |
1 |
Newton/m2 |
= |
10 dyne/cm2 |
Torque: |
1 |
Newton•m |
= |
107 dyne•cm |
References to viscosity throughout this manual are done in CGS units. The DV2T Viscometer provides equivalent information in SI units.
I.1 Components
Please check to be sure that you have received all components, and that there is no damage. If you are missing any parts, please notify Brookfield Engineering or your local Brookfield agent immediately. Any shipping damage must be reported to the carrier.
Components |
Part Number |
Quantity |
|
|
|
|
|
|
|
DV2T |
DV2T Extra |
|
|
|
|
DV2T Viscometer |
varies |
1 |
1 |
Model G Laboratory Stand |
MODEL G |
1 |
ø |
Model Q Laboratory Stand |
MODEL Q |
ø |
1 |
Spindle Set with Case |
varies |
1 |
1 |
DV2TLV set of four spindles |
SSL |
or |
|
DV2TRV set of six spindles (#2 - #7) |
SSR |
or |
|
DV2THA / HB set of six spindles (#2 - #7) |
SSH |
|
|
For Cone/Plate versions: a spindle wrench (SP-23), one cone spindle (CPA-XXZ), a sample cup (CPA-44YZ) replace the spindle set.
Power Cord |
DVP-65 |
1 |
1 |
DVP-65 for 115 |
|
or |
|
DVP-66 for 230 |
DVP-66 |
|
|
RTD Temperature Probe |
DVP-94Y |
1 |
1 |
Guard Leg |
B-20Y |
1 |
1 |
DV2TLV |
|
or |
|
DV2TRV |
B-21Y |
|
|
Carrying Case |
DVE-7Y |
1 |
1 |
PG Flash Software |
CD-PROGA |
1 |
1 |
RheocalcT Software |
DVP-202AY |
ø |
1 |
USB Flash Drive |
GV-1044 |
1 |
1 |
Screen Cloth w/case |
GV-1045 |
1 |
1 |
Stylus |
GV-1043 |
1 |
1 |
Operating Manual |
M13-167 |
1 |
1 |
Shipping Cap |
N/A |
1 |
1 |
Screen Protector Kit |
GV-1019 |
1 |
1 |
Brookfield Engineering Labs., Inc. |
Page 6 |
Manual No. M13-167-B0614 |

COMPONENT DIAGRAM
DV2T
Viscometer
Model G
Laboratory Stand
Bubble |
|
|
|
|
|
|
|
Spindle Set |
|
|
|
|
|
|
|
|
|||
Level |
|
|
|
|
|
|
|||
|
|
|
|
|
|
|
|
||
Shipping |
|
|
|
|
|
|
|
||
|
|
|
|
|
|
|
|||
|
|
|
|
|
|
|
|||
Cap |
|
|
|
|
|
|
|
||
|
|
|
|
|
|
|
|||
Guard Leg |
|
|
|
|
|
|
|
||
|
|
|
|
|
|
|
|||
|
|
|
|
|
|
|
|||
|
|
|
|
|
|
|
|||
|
|
|
|
|
|
|
|||
|
|
|
|
|
|
|
|
|
|
LV Spindle Set shown above
|
|
|
|
Leveling Screw |
|
|
|
|
|
Cone/Plate Option |
Wrench |
Temperature Probe |
||
|
|
|
|
Temperature Probe Clip |
|
Toggle Switch for |
|
||
|
Electronic Gap |
|
||
|
Tension Bar |
|
||
|
Cone Spindle |
|
||
|
Sample Cup |
Temperature Probe |
||
Figure I-1
Brookfield Engineering Labs., Inc. |
Page 7 |
Manual No. M13-167-B0614 |

I.2 Utilities |
|
|
|
Input Voltage: |
Universal Power Supply (90-264 VAC) |
||
Input Frequency: |
50/60 Hz |
|
|
Power Consumption: |
150 VA |
|
|
Power Cord Color Code: |
United States |
Outside United States |
|
Hot (live) |
|||
Black |
Brown |
||
Neutral |
White |
Blue |
|
Ground (earth) |
Green |
Green/Yellow |
|
Main supply voltage fluctuations are not to exceed ±10% of the nominal supply voltage.
I.3 Specifications
Speeds: |
0.1 - 200 RPM |
|
|
Weight: |
Gross Weight: |
23 lbs. |
10.5 kg. |
|
Net Weight: |
20 lbs. |
9 kg. |
|
Carton Volume: |
1.65 cu. ft. |
0.05 m3 |
Carton Dimensions: 22 in. (56 cm) W x 11 in. (28 cm) L x 22 in. (56 cm) H Temperature Sensing Range: -100˚C to 300˚C (-148˚F to 572˚F)
USB A Port for use with an attached PC.
USB B Port (x3) for use with a USB Flash Drive.
Viscosity Accuracy: |
±1.0% of full scale range |
|
The use of accessory items will have an effect on the |
|
measurement accuracy. See Appendix B. |
Viscosity Repeatability: |
±0.2% of Full Scale Range |
Temperature Accuracy: |
±1°C | -100°C to +149°C |
|
±2°C | +150°C to +300°C |
Operating Environment: |
0°C to 40°C temperature range (32°F to 104°F) |
|
20% - 80%R.H.: non-condensing atmosphere |
Ball Bearing Option:
If you ordered the ball bearing suspension system with your new instrument please note the following:
1)Theball bearing suspension in yourBrookfield instrument isnotedontheserial tag on the back of the head by the letter “B” in the part number (the ninth digit; for example: XDV2THBTB00U00).
2)Whenattachinganddetachingthespindle,itisnotnecessarytoliftthecoupling where the spindle connects to the instrument.
3)TheOscillationCheckexplainedinSectionIV.1:DeviceSetup,doesnotpertain to this instrument.
Brookfield Engineering Labs., Inc. |
Page 8 |
Manual No. M13-167-B0614 |

Electrical Certifications:
Conforms to CE Standards:
BSEN 61326: Electrical equipment for measurement, control and laboratory use - EMC requirements
BSEN 61010-1: Safety requirements for electrical equipment, for measurement, control and laboratory use
Notice to customers:
This symbol indicates that this product is to be recycled at an appropriate collection center.
Users within the European Union:
Please contact your dealer or the local authorities in charge of waste management on how to dispose of this product properly. All Brookfield offices and our network of representatives and dealers can be found on our website: www.brookfieldengineering.com
Users outside of the European Union:
Please dispose of this product according to your local laws.
I.4 Installation
Note: “IQ,OQ,PQ”,anabbreviatedguidelinedocumentforinstallation,operationand performance validation for your DV2T digital viscometer can be downloaded fromourwebsitewww.brookfieldengineering.com. AmoredetailedIQ,OQ,PQ procedure is available for purchase from Brookfield or your authorized dealer.
1)Assemble the Model G Laboratory Stand (refer to assembly instructions inAppendix I).
2)Put the viscometer on the stand.
3)Connect the RTD probe to the socket on the rear panel of the DV2T.
4)The Viscometer must be leveled. The level is adjusted using the two leveling screws on the base. Adjust the leveling screws so that the bubble level on the front of the DV2T is centered within the circle.
Note: Check level periodically during use.
5)Remove the shipping cap which secures the coupling nut on the Viscometer to the pivot cup. For Cone/Plate Models, hold the Sample Cup and swing the tension bar away from the bottom of the cup. Lower the cup and remove the foam insert. (Save for future shipments.)
6)Optional: Install the screen protector per the instructions on the package (and also shown inAppendix K). Failure to properly install the screen protector may result in touch screen malfunction. Additional installation help can also be found on our YouTube channel: www.youtube.com/user/BrookfieldEng
The AC input voltage and frequency must be within the appropriate range as shown on the nameplate of the viscometer (see Section I.2).
Brookfield Engineering Labs., Inc. |
Page 9 |
Manual No. M13-167-B0614 |

7)Make sure that the AC power switch at the rear of the DV2T is in the OFF position. Connect the power cord to the socket on the back panel of the instrument and plug it into the appropriate AC line. For Cone/Plate Models, be sure that the toggle switch, used to activate the electronic gap, is to the left position. (Left when facing the viscometer.)
Note: The DV2T must be earth grounded to ensure against electronic failure!!
8)Turn the power switch to the ON position and allow the viscometer to warm up for 10 minutes before performing autozero.
9)For Cone/Plate models, refer to Appendix A.
10)If appropriate, connect USB cable (DVP-202) to USB port for connection of DV2T to PC or printer.
11)Review Read Me file. The Read Me file contains notes on the DV2T Firmware. This file can be found on the CD that contains the PG Flash Software.
Temperature
Probe
USB A
USB B
Power Input
On/Off
Switch
Figure I-2
Brookfield Engineering Labs., Inc. |
Page 10 |
Manual No. M13-167-B0614 |
I.5 Safety Symbols and Precautions
Safety Symbols
The following explains safety symbols which may be found in this operating manual.
Indicates hazardous voltages may be present.
Refer to the manual for specific warning or caution information to avoid personal injury or damage to the instrument.
Precautions
If this instrument is used in a manner not specified by the manufacturer, the protection provided by the instrument may be impaired.
Thisinstrumentisnotintendedforuseinapotentiallyhazardousenvironment.
Incaseofemergency,turnofftheinstrumentandthendisconnecttheelectrical cord from the wall outlet.
The user should ensure that the substances placed under test do not release poisonous, toxic or flammable gases at the temperatures which they are subjected to during the testing.
I.6 Key Functions
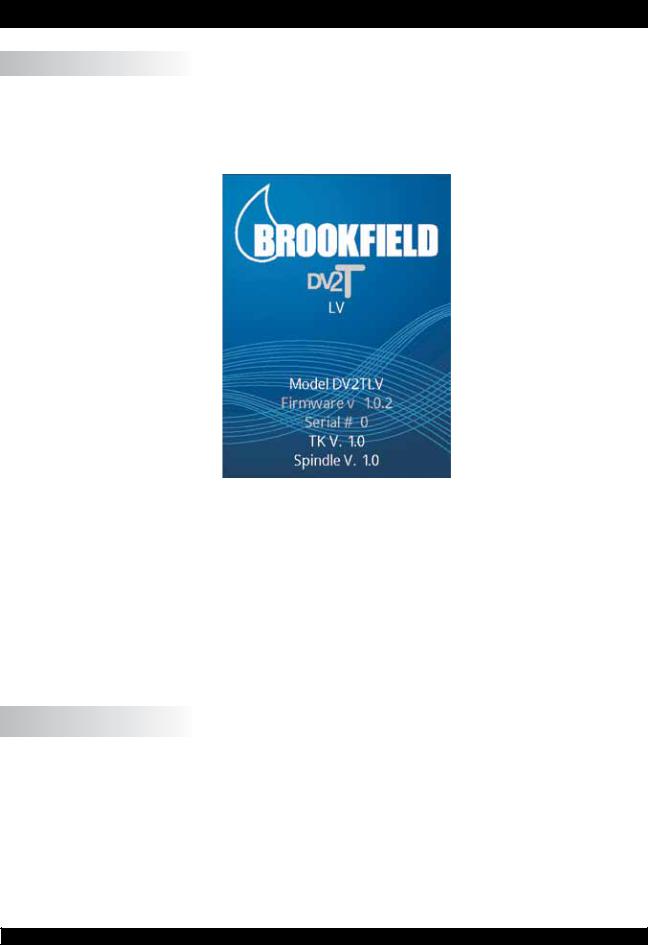
The DV2T Viscometer utilizes a touch screen display and interface. The user will provide all input to the viscometer through the touch screen. Figure I-3 details the different types of information and actions available.
 Status Bar
 Title Bar
 Test Name
 Data Fields
 More/Less Bar
 Command Keys
Figure I-3
Brookfield Engineering Labs., Inc. |
Page 11 |
Manual No. M13-167-B0614 |
Status Bar: The Status Bar provides information relating to the date and time (as configuredbytheuser)andvariousconnectionstotheDV2TViscometer.
Test Name: The Test Name identifies the name of the currently loaded test.
Title Bar: The Title Bar identifies the activity to be conducted in the current view and includes any navigation icons that are relevant.
Data Fields: The Data Fields include measurement results and test parameters.
More/Less Bar: TheMore/LessBarinformstheuserwhenmoreDataFieldsareavailable and when the number of Data Fields can be reduced.
Command Keys: The Command Keys indicate action that can be taken. These keys will vary from view to view depending on what actions are relevant.
I.7 Cleaning
Make sure that the instrument is in a clean, dry working environment (dust-free, moderate temperature, low humidity, etc.).
Make sure the instrument is on a level surface.
Hands/fingers must be clean and free of sample residue. Not doing so may result in deposit build up on the upper part of the shaft and cause interference between the shaft and the pivot cup.
Be sure to remove the spindle from the instrument prior to cleaning. Note left-handed thread. Severe instrument damage may result if the spindle is cleaned in place.
Instrument and Display: |
Cleanwithadry,non-abrasivecloth. Donotusesolvents |
|
or cleaners. The instrument housing is manufactured |
|
from polycarbonate ABS. Clean instrument housing |
|
with mild soap and water. Do not apply solvent to the |
|
instrument! |
Immersed Components (spindles): Spindles are made of stainless steel. Clean with a non-abrasiveclothandsolventappropriateforsample material.
When cleaning, do not apply excessive force, which may result in bending spindles.
Brookfield Engineering Labs., Inc. |
Page 12 |
Manual No. M13-167-B0614 |
II. GETTING STARTED
II.1 Power Up
The DV2T will go through a Power Up sequence when the power is turned on. The
Viscometer will issue a beep, present a blue screen, and finally show the DV2T About screen for 5 seconds. The About screen is shown below and includes several critical parameters about the viscometer including; viscometer torque (LV, RV, HA, HB, or other), firmware version number, model number (DV2TLV for example) and the serial number.
Figure II-1
TheAbout screen can also be accessed through the Settings Menu  (see Section IV.1).
The DV2T Viscometer will automatically transition from the About screen to the AutoZero screen.
TIP: WhencontactingBrookfieldoryourauthorizedBrookfielddealerfortechnicalsupport or repair services, please record the information on the About screen and include this detail in your email.
II.2 AutoZero
The DV2T Viscometer must perform anAutoZero prior to making viscosity measurements. This process sets the zero reading for the measurement system. The AutoZero will be performedeverytimetheinstrumentisturnedon. Additionally,youmayperformanAutoZero
at any time through the Settings Menu  (see Section IV.1).
The AutoZero screen will be presented automatically, after the About screen, during a power up.
Brookfield Engineering Labs., Inc. |
Page 13 |
Manual No. M13-167-B0614 |

Figure II-2
The operator must ensure that the viscometer is level (see Section I.4) and remove any attached spindle or coupling. When the Next button is pressed, the viscometer will operate for approximately 13 seconds. After the AutoZero is complete and the operator presses the Next button, the viscometer will transition to the Configure Viscosity Test screen. If the AutoZero was performed from the Settings Menu, then the viscometer will return to the Settings Menu.
TIP: Do not touch the viscometer during the AutoZero process to ensure the best zero value.
II.3 Status Bar
The DV2T Viscometer will display a status bar at the top of the screen at all times.
This status bar will indicate: time of day, date, and connection status for a variety of connection devices. The status icons are defined as:
USBIcon1,2,3: The DV2T Viscometer can store data and tests to USB storage device (USB B) such as a USB Flash Drive. TherearethreeUSBports. Theseportsarerepresented as 1, 2 and 3 based on the order of connection.
Printer Icon: |
TheDV2TViscometercancommunicatetoalabelprinter |
|
for printing test results (see Section II.8). |
ComputerIcon: TheDV2TViscometercancommunicatewithacomputer through the USB A port. Communication is supported with Brookfield RheocalcT software.
Brookfield Engineering Labs., Inc. |
Page 14 |
Manual No. M13-167-B0614 |
II.4 Navigation
The DV2TViscometer uses a touch screen display. Navigation of the instrument features is done using a variety of Data Fields, Arrows, Command Keys and Navigation Icons.
The operating system has been designed for intuitive operation and employs color to assist the user in identifying options.
Data Fields require that the user touch the screen to initiate the data entry / selection process. These fields are normally outlined in black. They may also include a blue arrow.
Blue Arrows indicate that options exist for a
Data Field. The user may be required to press anywhere in the Data Field or they may have to press the Blue Arrow specifically.
Command Keys are buttons which direct the DV2TtoperformaspecificactionsuchasSAVE adatasetorSTOPaprogram. CommandKeys arepresentedinavarietyofcolors. Thesekeys are normally found at the bottom of the screen.
Navigation Icons are normally found in theTitle Bar to the left and right. These buttons will take you to specific areas of the operating system.
Navigation Icons are shown below. |
|
|
Home Menu |
Perform data entry from a scroll |
|
list |
||
|
||
Log In (will only be available if the |
Sortfilesaccordingtocreatedate |
|
administrator has activated user |
|
|
log in) |
|
|
Settings Menu |
Sort files according to alphabet |
|
|
||
Service Menu (only available for |
Choose from additional options |
|
authorized Brookfield service |
|
|
centers) |
|
|
Lock Out (during a test) |
Back(return to previousscreen) |
|
|
||
Remove Lock (during a test) |
Up (return to previous level in |
|
the file structure) |
||
Perform data entry using a number |
|
|
pad |
|
Brookfield Engineering Labs., Inc. |
Page 15 |
Manual No. M13-167-B0614 |

II.5 Home Screen
The DV2T Home screen can be accessed by using the Home Icon . The Home screen shows the Main Menu functions and provides access to User Log In and Settings (see
Section II.4).
Figure II-3
Configure Viscosity Test: Create and Run viscosity tests.
Load Test: Load a test that has previously been saved or created with PG Flash software. Tests may be loaded from internal memory or a USB Flash Drive.
View Results: LoadResults(savedtestdata)thathavepreviouslybeensaved. Results may be loaded from internal memory or a USB Flash Drive.
Manage Files: Manage the file system in the internal memory or on a USB Flash Drive for test programs and saved data. Create new folder structures, delete files, rename files and move files.
External Mode: Direct the DV2T to communicate with Brookfield Rheocalc T Software for complete viscometer control.
Each of the Main Menu items are detailed in the following sections of the manual.
II.5.1 Configure Viscosity Test
ViscositymeasurementsaremadeontheDV2TViscometerthroughtheConfigureViscosity Test function. The user is presented with Configure Viscosity Test at the conclusion of the
AutoZero function or by selection on the Home Menu  .
.
AllelementsrelatedtothemeasurementofviscosityareselectedwithinConfigureViscosity Test. Tests that are created can be saved to the internal memory of the DV2T Viscometer or onto a connected USB Flash Drive. Tests can be loaded from memory by selecting Load
Test from the Home Screen  .
.
TIP: Many aspects of Configure Viscosity Test can be limited when User ID and Log In functions are implemented (see Section IV.4.2).
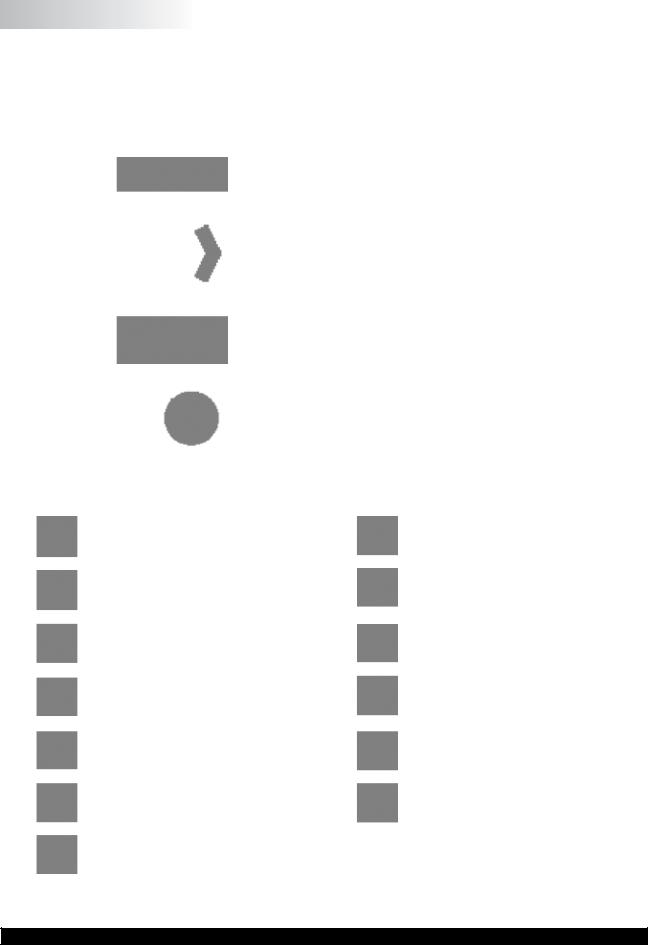
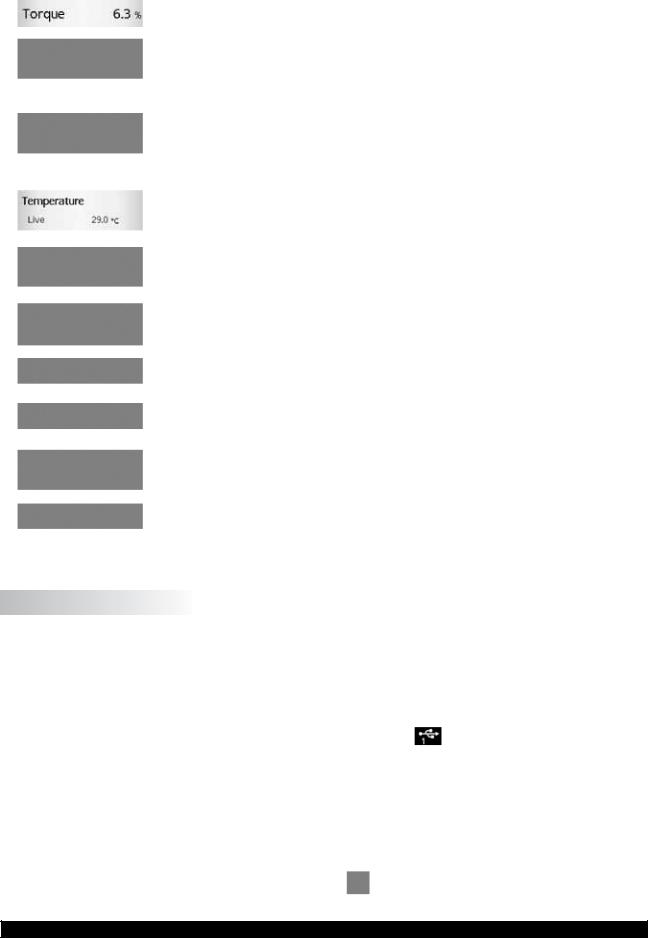
The basic Configure Viscosity Test view is shown in Figure II-4. This view includes the StatusBar(SectionII.3),TitleBar(whichincludestheHomeandSettingsicons),testname, test parameters, the More/Less bar, and Command Keys (see Section II.4).
Brookfield Engineering Labs., Inc. |
Page 16 |
Manual No. M13-167-B0614 |
 Status Bar
 Title Bar
 Test Name
 Test Parameters
 More/Less Bar
 Command Keys
Figure II-4
The user can see the name of any test that has been loaded through the LoadTest function. In Figure II-4, the file name is listed as Unsaved Test, indicating that the current test has not been saved.
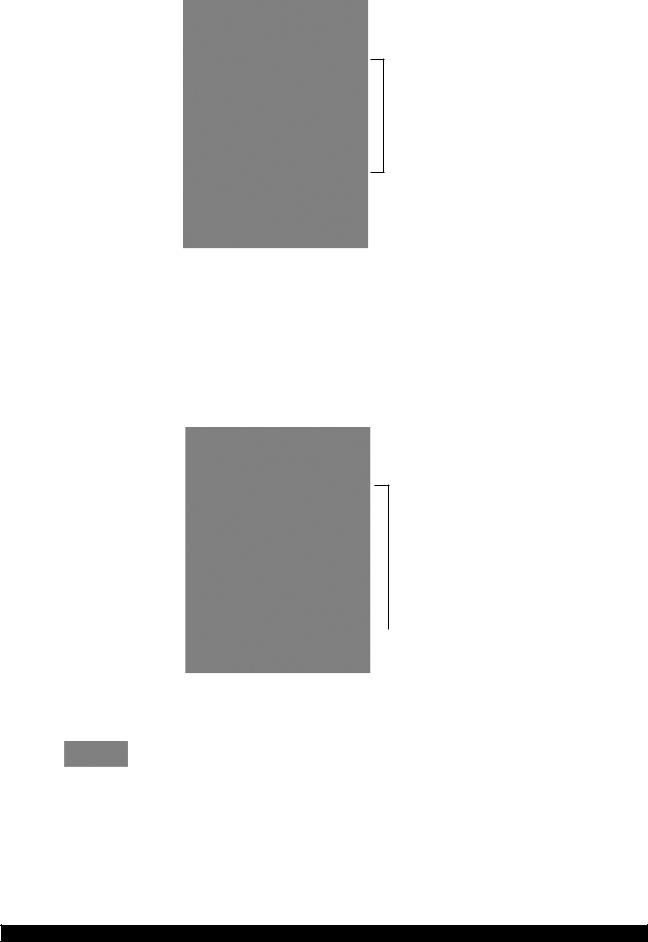
The More/Less bar is seen just below the test parameters. In Figure II-4, this bar includes a down arrow, which indicates that more information is available. Figure II-5 shows the additional information that can be accessed. The More/Less bar, in this view, now has an up arrow indicating that the additional information can be hidden.
 Status Bar
 Title Bar
 DataFields
 More/Less Bar
 Command Keys
Figure II-5
The Command Keys include Clear, Save and Run.
Clear: Clear all data that has been entered into the test parameters and restore the values to the factory default.
 Save: Save the current test.
 Run: Run the current test.
The Test Parameter area includes many elements of the viscosity test as well as live measurements of Torque % and Temperature. Temperature data will only be displayed if a Brookfield temperature probe is connected to the DV2T Viscometer.
Brookfield Engineering Labs., Inc. |
Page 17 |
Manual No. M13-167-B0614 |
Torque: |
A live signal from the viscometer. |
Spindle: |
The currently selected spindle. All viscosity, shear |
|
rate,andshearstresscalculationswillbemadebased |
|
onthisspindle. Thespindlenumbermaybechanged |
|
by pressing the blue arrow. |
Speed: |
The currently selected speed of rotation. The |
|
viscometer will operate at this speed once the RUN |
|
commandkeyispressed. Thespeedmaybechanged |
|
by pressing the blue arrow. |
Temperature: |
Alive signal from the viscometer when a temperature |
|
probe is attached (Brookfield part number DVP-94Y |
|
or SC4-61Y). |
End Condition: |
Specify the condition that will end the test. |
Data Collection: Specify the amount of data to be collected during the test.
Instructions: |
Create a message that the user will see when the |
|
test begins. |
Reports: |
Define how the data will be viewed when the test is |
|
complete. |
QC Limits: |
Define the limits for acceptable measurement data. |
Density: |
Definethedensityofthetestsample. Thisinformation |
|
will be used when kinematic viscosity units are |
|
selected for display (see Section IV.3). |
II.5.2 Load Test
Test programs that are created (Configure Viscosity Test) can be saved to the internal memory of the DV2T or to a USB Flash Drive. These files can be reloaded into the DV2T for immediate use through the Load Test function. A file that is placed onto a USB Flash
Drive can be loaded onto any DV2T Viscometer.
Within the Load Test function, the user can access the internal memory of the viscometer
or any USB Flash Drive that is connected to a USB port |
. The viscometer will point to |
the USB Flash Drive according to the order in which it is connected. The first USB Flash
Drive that is connected will be referred to as #1 on both the Load Test screens and the Status Bar (see Section II.3). You can have as many as three USB Flash Drives connected to the DV2T at any time.
Test files that are displayed on the screen can be sorted by date of creation or by alpha/ numeric. This sorting is selected by pressing the Navigation Icon  or
or  .
.
TIP: You can use the Manage Files function |
to move Test files from internal memory |
to a USB Flash Drive. |
|
Brookfield Engineering Labs., Inc. |
Page 18 |
Manual No. M13-167-B0614 |

II.5.3 View Results
Test results (data files) can be saved to the internal memory of the DV2T or to a USB Flash Drive. Theses files can be reloaded into the DV2T for review, analysis, or printing through the View Results function. A file of Test Results that is saved onto a USB Flash Drive can be viewed on any DV2T Viscometer.
Within the View Results function, the user can access the internal memory of the DV2T
Viscometer or any USB Flash Drive that is connected to a USB port |
. The viscometer |
will point to the USB Flash Drive according to the order in which it is connected. The
first USB Flash Drive that is connected will be referred to as #1 on both the View Results screen and the Status Bar. You can have as many as three USB Flash Drives connected to the DV2T at any time.
Results files that are displayed on the screen can be sorted by date of creation or by alpha/ numeric. This sorting is selected by pressing the Navigation Icon  or
or  .
.
TIP: You can use the Manage Files function |
to move Results files from internal |
memory to a USB Flash Drive. |
|
II.5.4 Manage Files
Result Files and Test Files can be managed in the internal memory or on USB Flash Drives from the Manage Files function. Folder structures can be added or changed to assist with data management. Files may be copied, moved, renamed or deleted. Access to this function can be limited when User ID and Log In functions are implemented (see Section IV.4.2).
Filesthataredisplayedonthescreencanbesortedbydateofcreationorbyalpha/numeric. This sorting is selected by pressing the Navigation Icon  or
or  .
.
II.5.5 External Mode
The DV2T Viscometer can be controlled from a computer through the use of optional Brookfield Software RheocalcT. The viscometer must be placed into external control
mode from the Main Menu |
. The viscometer must be connected to the computer with |
a USB A cable (DVP-202). |
|
TIP: The Status Bar will indicate a proper connection to the computer by displaying the
Computer Icon  .
.
TheDV2TwilldisplayExternalModewhenconfiguredforoperationwiththecomputer. This display includes a Return button that will reset the viscometer to stand alone operation.
II.6 Range
The DV2T Viscometer will calculate the measurement range for a specific spindle and speed combination. This information is displayed on the screen while selecting the spindle number as shown in Figure II-6. The Range is also shown in the Running Viscosity Test view during the measurement. Viscosity will be displayed in the unit of measure specified
in Settings  and is set to centipoise (cP) from the factory.
Brookfield Engineering Labs., Inc. |
Page 19 |
Manual No. M13-167-B0614 |

 Range
Range
Figure II-6
TIP: The Range value is the same as the AutoRange available on earlier Brookfield viscometer models.
II.7 Out of Range
TheDV2TViscometerwillgiveonscreenindicationswhenthemeasurementisoutofrange of the instrument. When the %Torque reading exceeds 100% (over range), the display of %Torque, Viscosity, and Shear Stress will be EEEE (see Figure II-7). If the %Torque value is between 0 - 9.9%, the data field label will flash. When the %Torque is below zero (negative values), the display of Viscosity and Shear Stress will be ----.
TIP: Brookfield recommends collecting data only when the %Torque reading is between 10 - 100%.
Figure II-7
Brookfield Engineering Labs., Inc. |
Page 20 |
Manual No. M13-167-B0614 |
Measurement data should not be collected when the %Torque reading is out of range. The out of range condition can be resolved by either changing the speed (reduce speed when reading is out of range: high) or changing the spindle (increase the spindle size when the reading is out of range: low).
TIP: When comparing data, the test method is critical. Be sure that you know the proper spindle and speed required for the test method. If readings are out of range, this condition should be reported as the test result.
II.8 Printing
The DV2T Viscometer can communicate to a Dymo Label Writer 450 Turbo label printer. This printer can be purchased from Brookfield (Part No. GV-1046). The communication to the printer is by USB (cable provided with the printer). When the printer is connected to the DV2T, the printer icon will be visible in the status bar.
The DV2T Viscometer can configure the print out for several formats of paper/labels. These various paper/label stocks are available from Brookfield.
1.GV-1049-10 SHIPPING LABEL 2.31 X 4IN. 300 P/ROLL (PKG of 10)
2.GV-1048-10 ADDRESS LABEL 1.13 X 3.5IN. 350 P/ROLL (PKG of 10)
3.GV-1047-10 CONTINUOUS PAPER 2.25IN. WD. X 300FT. LG (PKG of 10)
Figure II-8
Brookfield Engineering Labs., Inc. |
Page 21 |
Manual No. M13-167-B0614 |

Printer format is detailed below:
Data Label (Small)
Data Label (Large)
TIP: When printing to a label, if the data set includes more than one point, only the last point will be printed.
Data Continuous
Brookfield Engineering Labs., Inc. |
Page 22 |
Manual No. M13-167-B0614 |

III. MAKING VISCOSITY MEASUREMENTS
III.1 Quick Start
The DV2T Viscometer uses the same methodology for viscosity measurements as the
Brookfield Dial Reading Viscometers and DV series of Digital Viscometers. If you have experience with other Brookfield equipment, this section will give you quick steps for taking a viscosity reading. If you have not used a Brookfield Viscometer before, skip this section and go to Section III.2 for a detailed description.
A)Assemble and level viscometer (Section I.4).
B)Turn power on.
C)Autozero the viscometer (Section II.2).
D)The DV2T will display the Configure Viscosity Test Screen. In this screen, select spindle and speed. Confirm that Data Collection is set to Single Point and that End Condition is set to Time 00:00:00.
E)Introducethespindleintothesampleandattachthespindletothecouplingnut.
NOTE: Left-hand thread. If equipped with EZ-Lock, use the appropriate procedure to connect the spindle (see Section III.3).
F)Press the Run button. The screen will change to the Running Viscosity Test
Screen.
G)When you are ready to record the measurement result, press the Stop Test button. The screen will change to the Results Table.
H)Record the % torque and viscosity.
I)To run another test, press Configure Test. To return to the Home Screen, press the Home Icon.
III.2 Preparations for Making Measurements
A)VISCOMETER: The DV2T should be turned on, leveled and autozeroed. The level is adjusted using the two feet on the bottom of the base and confirmed using the bubble level on the front of the head. Adjust the feet until the bubble is inside the center target.
Set the level prior to autozero and check the level prior to each measurement.
The proper level is essential for correct operation of the DV2T.
B)SAMPLE: The fluid to be measured (sample) must be in a container. The standard spindles supplied with the DV2T [LV (1-4), RV (2-7), or HA/HB (2-7)] are designed to be used with a 600 mL low form Griffin beaker (or equivalent container with a diameter of
8.25 cm). The same applies to the optional RV1, HA/HB1, and Vane spindles. Many otherspindlesystemsaresuppliedfromBrookfieldwithspecificsamplechamberssuch as the Small Sample Adapter, UL Adapter and Thermosel.
Brookfield recommends that you use the appropriate container for the selected spindle. You may choose to use an alternate container for convenience, however, this may have an effect on the measured viscosity. The DV2T is calibrated considering the specified container. Alternate containers will provide results that are repeatable but may not be “true”.
The LV (1-4) and RV (1-7) spindles are designed to be used with the guardleg attached.
Measurements made without the guardleg will provide repeatable results but may not provide “true” results.
When comparing data with others, be sure to specify the sample container and presence/absence of the guardleg.
Brookfield Engineering Labs., Inc. |
Page 23 |
Manual No. M13-167-B0614 |
Many samples must be controlled to a specific temperature for viscosity measurement.
When conditioning a sample for temperature, be sure to temperature control the container and spindle as well as the sample.
Please see our publication, “More Solutions to Sticky Problems”, for more detail relating to sample preparation.
III.3 Selecting a Spindle/Speed
The DV2T has the capability of measuring viscosity over an extremely wide range. For example, the DV2TRV can measure fluids within the range of 100-40,000,000 cP. This range is achieved through the use of several spindles over many speeds. See Appendix
B for details.
The process of selecting a spindle and speed for an unknown fluid is normally trial and error. An appropriate selection will result in measurements made between 10-100 on the instrument % torque scale. Two general rules will help in the trial and error process.
1)Viscosity range is inversely proportional to the size of the spindle.
2)Viscosity range is inversely proportional to the rotational speed.
In other words: to measure high viscosity, choose a small spindle and/or a slow speed. If the chosen spindle/speed results in a reading above 100%, then reduce the speed or choose a smaller spindle.
Experimentationmayrevealthatseveralspindle/speedcombinationswillproducesatisfactory results between 10-100%. When this circumstance occurs, any of the spindles may be selected.
Non-Newtonianfluidbehaviorcanresultinthemeasuredviscosityandyieldstresschanging if the spindle and/or speed is changed. See our publication, “More Solutions to Sticky Problems”, for more details.
When viscosity data must be compared, be sure to use the same test methodology: namely the same instrument, spindle, speed, container, temperature and test time.
DV2TLV Viscometers are provided with a set of four spindles andanarrowguardleg;DV2TRVViscometerscomewithaset of six spindles and a wider guardleg; DV2THAand DV2THB Viscometerscomewithasetofsixspindlesandno guardleg. (See Appendix G for more information on the guardleg.)
The spindles are attached to the viscometer by screwing them onto the coupling nut on the lower shaft (see Figure III-1). Note that the spindles have a left-hand thread. The lowershaftshouldbesecuredandslightlyliftedwithonehand while screwing the spindle to the left. The face of the spindle nut and the matching surface on the lower shaft should be smoothandcleantopreventeccentricrotationofthespindle.
Spindles can be identified by the number on the side of the spindle coupling nut.
The motor should be OFF whenever spindles are beingremovedorattached.
Figure III-1
Brookfield Engineering Labs., Inc. |
Page 24 |
Manual No. M13-167-B0614 |

If your instrument has the EZ-Lock system, the spindles are attached as follows:
Withonehandholdthespindle,whilegentlyraisingthespringloaded outer sleeve to its highest position with the other hand, as shown in Figure III-2. Insert the EZ-Lock Spindle Coupling so that the bottom of the coupling is flush with the bottom of the shaft, and lower the sleeve. The sleeve should easily slide back down to hold the spindle/coupling assembly in place for use. [Spindles can be identified by entry code; look for the number on the side of the EZ-Lock spindle coupling.]
The motor should be OFF whenever spindles are being removed or attached.
Note: Keep the EZ-Lock Spindle Coupling and outer sleeve as clean as possible and free from debris that could become lodged inside the adapter.
Figure III-2
III.4 Multiple Data Points
The majority of viscosity and yield stress measurements are made at the quality control level and often consist of a single data point. The test is conducted with one spindle at one speed. The data point is a useful bench mark for the go/no-go decision in a production setting. The DV2T can be used for single point measurement.
Many fluids exhibit a characteristic change in viscosity and yield stress with a change in applied force. This non-Newtonian flow behavior is commonly seen in paints, coatings and food products as a decrease in viscosity as shear rate increases or an increase in yield stress as a rotational speed increases. This behavior cannot be detected or evaluated with the single point measurement.
Non-Newtonian flow is analyzed through the collection of viscosity data over a range of shear rates and the generation of a graph of viscosity versus shear rate (a rheogram).
This information will allow for a more complete characterization of a fluid and may help in formulation and production of a product. The DV2T is capable of collecting multiple data points for comprehensive analysis of flow behavior when using test programs created with PG Flash Software (see Section V).
Moreinformationonflowbehavior,shearrateandrheogramsisavailableinourpublication,
“More Solutions to Sticky Problems”.
III.5 Selecting Data Collection
TheDV2TViscometeroffersseveraloptionsfordatacollection. TheDataCollectionsetting is shown in Configure Viscosity Test directly under the Temperature display. The factory setting is Single Point (see Figure III-3). Pressing the blue arrow, in this field, will present the Data Collection screen (see Figure III-4).
Brookfield Engineering Labs., Inc. |
Page 25 |
Manual No. M13-167-B0614 |

Figure III-3
Figure III-4
Single Point: Collect only a single data point when the End Condition is met.
Single Point Averaging: Specify an amount of time over which to average measured data. Collect a single data point when the End Condition is met. This data point is an averaged value. If the time for averaging is shorter than the total time for the step, then the average will be performed for the specified time at the end of the test.
Example 1: The End Condition is Time with a value of 1 minute and 30 seconds, the Single Point Averaging Duration is 30 seconds, the single data point collected from this step will be an average of the data measured from 1 minute to 1 minute 30 seconds.
Brookfield Engineering Labs., Inc. |
Page 26 |
Manual No. M13-167-B0614 |

Multi Point: Collect multiple data points based on time. The Data Interval is specified in
Hours:Mins:Secs. If the End Condition is set to Time, then the total number of points will be calculated and displayed in the Data Collection screen. If the End Condition is not based on time then it is possible that the step will conclude prior to a data point being collected. If you want a data point at the conclusion of the step regardless of the time interval, you can check the check box in the Data Interval screen.
Example 2: End Condition is Time = 2 minutes, Multi Point Data Interval is 10 seconds.
Total points collected will be 12 with the last data point taken in the last second of the step.
Example 3: End Condition is set to Viscosity = 200 cP, Multi Point Data Interval is 10 seconds. During the test the total time required to reach 200 cP is 65 seconds. Total points collected will be 6 with the last data point taken at
60 seconds, 5 seconds before the test is finished.
Example 4: End Condition is set to Viscosity = 200 cP, Multi Point Data Interval is 10 seconds. Check the check box to Also Collect Single Point at Step End. During the test, the total time required to reach 200 cP is 65 seconds. Total points collected will be 7 with the last data point taken at 65 seconds, 5 seconds after point #6 taken at 60 seconds.
Multi Point Averaging: Specify an amount of time over which to average measured data. Collect multiple data points based on time until the End
Condition is met. Each data point is an averaged value. If the Averaging Duration is shorter than the Data Interval for the step, then the average will be performed for the specified time at the end of the Data Interval. The total number of points to be collected will be displayed if the End Condition is set to Time. If the End Condition is not based on time, then it is possible that the step will conclude prior to a data point being collected. If you want a data point at the conclusion of the step regardless of the time interval, you can check the check box in the Data
Interval screen.
Example 5: End Condition is Time = 2 minutes, Multi Point Data Interval is 10 seconds. Averaging Duration is 5 seconds. Total points collected will be 12 with the last data point taken in the last second of the step. Each data point will be an average of the data measured in the last 5 seconds of each Data Interval.
Example 6: End Condition is set to Viscosity = 200 cP, Multi Point Data Interval is 10 seconds. Averaging Duration is 5 seconds. During the test, the total time required to reach 200 cP is 63 seconds. Total points collected will be 6 with the last data point taken at 60 seconds, 3 seconds before the test is finished. Each data point will be an average of the data measured in the last 5 seconds of each Data Interval.
Example 7: End Condition is set to Viscosity = 200 cP, Multi Point Data Interval is 10 seconds. Averaging Duration is 5 seconds. Check the check box to Also
Collect Single Point at Step End. During the test, the total time required to reach 200 cP is 65 seconds. Total points collected will be 7 with the last data point taken at 65 seconds, an average of the 5 seconds after point #6.
Example 8: End Condition is set to Viscosity = 200 cP, Multi Point Data Interval is 1 minute. Averaging Duration is 20 seconds. Check the check box to Also
Brookfield Engineering Labs., Inc. |
Page 27 |
Manual No. M13-167-B0614 |

Collect Single Point at Step End. During the test, the total time required to reach 200 cP is 10 minutes 40 seconds. Total points collected will be 11 with the last data point taken at 10 minutes 40 seconds, an average of the last 20 seconds of the step.
No Data: End Condition is met and no data is collected.
III.6 End Condition
ThecompletionofatestisdefinedbytheEndCondition. EachtimethatyouenterConfigure Viscosity Test, the End Condition will be set to the last value used. The End Condition parameter or values can be changed by pressing the End Condition button.
Within the End Condition screen, the currently selected End Condition parameter and values are displayed. The End Condition can be changed by pressing the blue down arrow within the parameter field. Six End Conditions are available: Time, # of Points, # of
Revolutions, Torque, Viscosity, Temperature (see Figure III-5).
Figure III-5
Time: The test will complete when the specified amount of time has elapsed. Time is entered in Hours, Minutes, and Seconds.
Hours: 0-99
Minutes: 0-59
Seconds: 0-59
A time of zero hours, minutes and seconds may be selected. With this End Condition, the DV2T will operate at the selected speed until the operator selects
Stop Test. Data will be collected according to the Data Collection setting (see Section III.5).
TIP: An End Condition of zero Time can be useful when measuring a new material. During the test, the speed can be changed without ending and
Brookfield Engineering Labs., Inc. |
Page 28 |
Manual No. M13-167-B0614 |

then rerunning the test (see Section III.8). This method can allow you to quickly evaluate the spindle selection to determine the best speeds for testing.
#of Points: The test will complete when the specified number of data points has been collected. Data is collected according to the Data Collection setting (see
Section III.5). The range of data points is: 1 – 9,999.
#of Revolutions: The test will complete when the specified number of revolutions of the
spindlehasoccurred. DataiscollectedaccordingtotheDataCollection setting (see Section III.5). The range for number of revolutions is:
1 – 9,999.
Torque: The test will complete when the specified Torque value is measured. Data is collected according to the Data Collection setting (see Section III.5). The range of values for the measured Torque is: -10.0 – 100.0.
Viscosity: The test will complete when the specified Viscosity value is measured. Data is collected according to the Data Collection setting (see Section III.5). The range of measured Viscosity is 0 – 10,000,000,000 cP.
Note: The Viscosity End Condition should be selected in consideration of the Range provided by the spindle and speed selected. Check the Range value by selecting Spindle in Configure Viscosity Test. If you choose a Viscosity End Condition greater than the Range of the spindle and speed settings, then the value shown in the End Condition field will be EEEE. In this case, the end condition will never be achieved.
Temperature: ThetestwillcompletewhenthespecifiedTemperaturevalueismeasured towithintheindicatedTolerance. TheTolerancespecifieshowclosethe measured temperature should be to the specified temperature value to consider the target reached. Temperature is measured through the use of a connected Brookfield temperature probe (DVP-94Y, CPA-44ZPY cup, SC4-XXRPY chamber). Data is collected according to the Data
Collection setting (see Section III.5).
Temperature: -100 – 300°C
Tolerance: 0.0 – 9.9°C
TIP: Asmall tolerance value will require a much longer time to reach the End Condition.
TIP: If using PG Flash to create a test program, consider using a larger Tolerance value for the End Condition and then use a second step for thermal equilibrium (End Condition Time). This two step method can reduce the variability in test time caused by variations in temperature sensors.
III.7 Additional Test Parameters
The Configure Viscosity Test screen includes a More/Less Bar. When pressed, the More
Bar will present several additional Test Parameters including: QC Limits, Instructions, Reports, and Density. These parameters are always available and active regardless of the position of the More / Less Bar.
Brookfield Engineering Labs., Inc. |
Page 29 |
Manual No. M13-167-B0614 |
 Loading...