

BROOKFIELD
Operation Manual
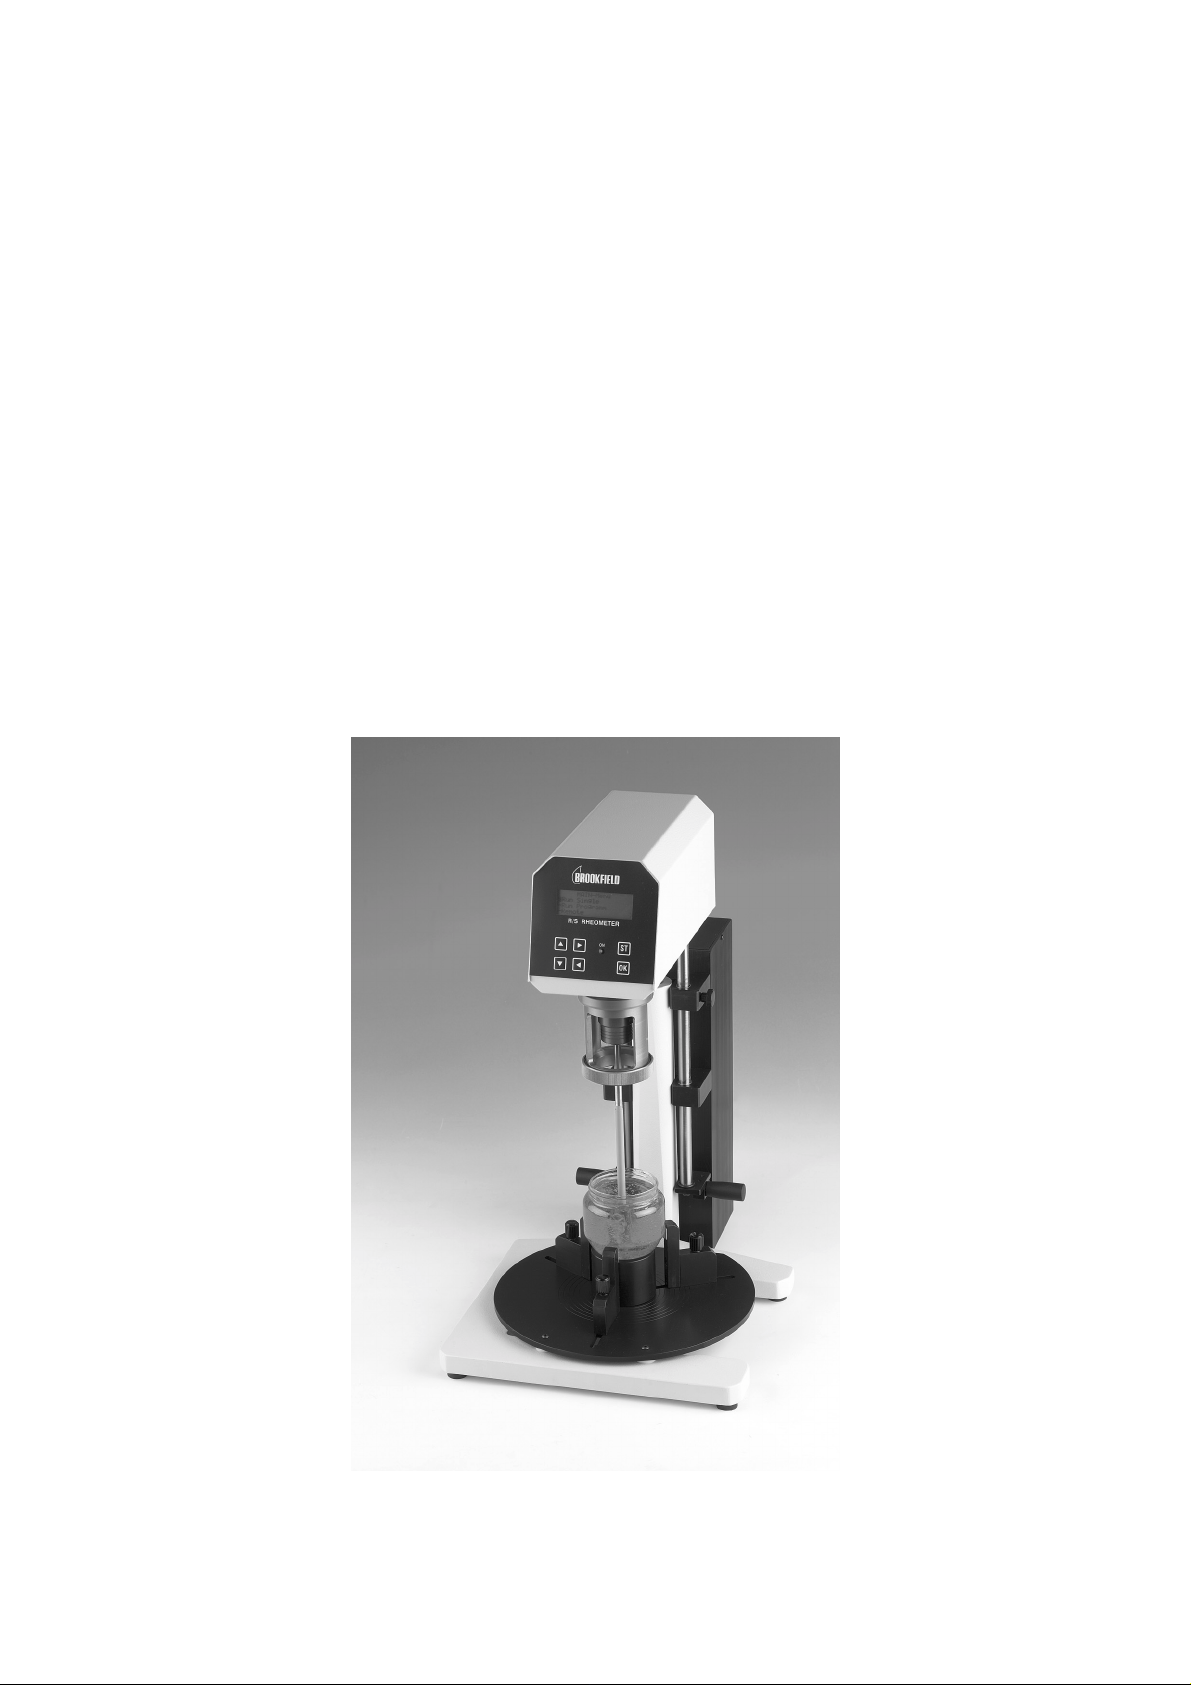
R/S SST2000
Soft Solid Tester
1 of 9
\\Bvserver\Data\RS Information\SSTManu al.doc

BROOKFIELD
Operating The SST2000 Soft Solids Tester
Running a sample using software control
1. In Measure/Analysis click Load Program File and select the required test
method.
2. Centre the sample on the base plate and fix in place with the clamps.
3. Lower the instrument head by pushing down on the “periscope handles” so
that the vane enters the sample to the required depth.
4. Click Start, enter the required filename for the results and click OK.
5. Enter any other details relating to batch numbers, customer, operator etc. and
click OK.
The measurement will start.
Standard graphing functions and results overlay procedures are covered in the
Rheo2000 software manual and the onboard Help file.
Soft Solids Analysis Functions
Clicking on Soft Solids Analysis opens the analysis functions for soft solids testing.
The Soft Solids Analysis Functions enable the quantification of properties of tested
materials using regression analyses and peak-value identifications:
Yield / Modulus
The peak value within the data range is reported as Yield Point values for Stress
and Torque. The Strain and Angular Displacement at the yield point are also
reported.
A regression is performed on the range defined in Configuration and the
gradient of the stress vs. strain curve is reported as Modulus. The regression
coefficient, B, and the standard deviation, S, is also reported.
Creep
Two regressions are performed on the creep data to obtain:
Instantaneous Response: A regression is performed on the range defined in Configuration to obtain values for instantaneous Compliance, Strain and angular Displacement.
Viscous Response: A regression is performed on the range defined in
Configuration to obtain Creep Viscosity. The intercept on the y axis (strain,
Displacement or Compliance) is then divided by the maximum value (last data
point) of the creep curve to obtain Elastic Index
2 of 9
\\Bvserver\Data\RS Information\SSTManu al.doc

BROOKFIELD
T
A
T
Configuration
Modulus: The upper and lower limits of the range for the modulus regression is
defined here as percentages of the peak value. A typical range is 20% to 70%
but these should be altered to accommodate longer or shorter linear regions.
Creep: The number of points for the regressions for Instantaneous Response
and Viscous Response are entered here. Typical values are 5 points and 20
points respectively.
Running a sample in Stand-Alone mode.
Running a one-off test
1. When flashing cursor is on Run Single press OK.
2. Select the measuring system in use
3. Scroll the cursor down to the selected test method: Yield Test or Creep Test.
For Yield Test:
4. Set Rate (rotational rate in rpm), Nr. Of MP (the number of measuring points
to be taken) and Time (the total time of the test).
5. Input any required identification for the data file eg batch number, operator
etc. and press OK
6. Press ST to Start the test.
The display will then show the current and peak values for stress (in Pascals) and
torque (in milliNewtonmetres):
For a Creep Test:
4. Set Stress (the applied stress in Pascals), Nr. Of MP (the number of measuring
points to be taken) and Time (the total time of the test).
5. Input any required identification for the data file eg batch number, operator
etc. and press OK
6. Press ST to Start the test
The display will then show the Angular Position and Instantaneous Angle (in
milliradians), Time (in seconds) and Creep Rate (in milliradians per second):
Stress (Pa): 00000
Peak: 00000
orque (mNm): 00.00
ngle (mrad): 0000
Inst. Angle: 0000
ime (s): 0000
3 of 9
\\Bvserver\Data\RS Information\SSTManu al.doc

BROOKFIELD
Editing and Running Programs
As detailed in the RS Rheometer operation manual, stand-alone programs can be
written under the Utilities → Edit Programs menu for the SST2000 to facilitate fast
test turnaround.
4 of 9
\\Bvserver\Data\RS Information\SSTManu al.doc

BROOKFIELD
Getting Started In Soft Solids Testing
Two test methods are most often used to evaluate soft solids with the SST2000: The
Constant Rate Test and The Creep Test.
The Constant Rate Test
For products like: Stiff pastes, slurries, set gels, waxes.
Properties measured: Yield stress or torque, equilibrium stress strain at yield, rigidity
modulus.
Description: In the constant rate test the vane is rotated at a constant low rotational
rate (typically 0.1 to 0.5 rpm) and torque or stress is measured against time, rotational
angle or strain.
Example method: Constant rotation at 0.2 rpm, linear data collection, 60 data points
over 60 seconds. A V30-15 vane (30mm high by 15mm across) is used in an open
configuration (see Setting Up Vanes).
Typical results plots:
CR Test on mayonnaise with
stress (Tau, in Pascals) plotted
against strain (Gamma, unitless).
The peak value gives us yield
stress. The gradient of
stress/strain upcurve indicates gel
rigidity, a steeper curve: a stiffer
gel and vice-versa.
5 of 9
\\Bvserver\Data\RS Information\SSTManu al.doc

BROOKFIELD
ess
Mayonnaise shows a distinct gel breakdown after the peak yield point. Other
samples, such as some pastes and slurries may not peak but equilibrate at an
equilibrium stress plateau:
CR test on toothpaste.
Equilibrium str
The Creep Test
For products like: More mobile gels and lumpy products : custard, gravies and
sauces, jams and marmalades.
Properties measured: Instantaneous compliance/strain, low shear viscosity/creep
rate, elasticity index.
Description: A single stress/torque is applied at time t=0 and maintained on the
sample over a period of time, usually between one and five minutes. The degree of
subsequent movement in the sample, is recorded against time in the form of angular
displacement (in radians), strain (unitless) or compliance (strain divided by applied
stress – in m2/N).
Example method: A constant stress of 1250Pa is applied over a period of 120
seconds. 60 data points are collected over this period.
Equilibrium stress is an
indication of low shear viscosity
or “consistency”.
6 of 9
\\Bvserver\Data\RS Information\SSTManu al.doc

BROOKFIELD
Typical results plot:
Creep test on fruit conserve.
Angular displacement (Phi,
radians) is plotted against time.
Short timescale response relates
to elastic behaviour and long
timescale response relates to
viscous behaviour. So a high
initial angular displacement
indicates a flexible “wobbly” gel
structure while a steep gradient at
long timescales means a product
that creeps easily, that is, it has a
low low-shear viscosity.
A Few Tips To Get You Started
It is important to operate the SST2000 at torque values that are within the SST2000’s
reliable range of 30%0 (3% or 1.5mNm) to 1000%0 (100% or 50mNm). In creep
testing the minimum recommended applied torque is 75%0 (3.75mNm).
If you prefer to work in stress values then these torques equate to the following for
our standard vanes:
Constant Rate Test Creep Test (recommended minimum)
V30-15 121 Pa to 4040 Pa 303 Pa
V40-20 51 Pa to 1700 Pa 128 Pa
V80-40 6.4 Pa to 213 Pa 16 Pa
Vane selection
The first consideration in vane selection is the working torque ranges just mentioned.
The next consideration relates to vane-to-container diameter ratios. The vane
measuring method works best when these ratios are lower than 0.75. Low
vane/container ratios allows us to measure samples with large particulates dispersed
throughout and we can also apply low strains to our sample while still operating at
angular displacements well within the instrument range.
Ideally, the vane should be immersed in a sample of a depth twice that of the vane
height. This is, however, very often not practical but the user should at least ensure
ample clearance between the lower end of the vane and the base of the container,
especially when measuring large-particle suspensions.
7 of 9
\\Bvserver\Data\RS Information\SSTManu al.doc

BROOKFIELD
Container Dimensions
For yield point measurements the container dimensions are largely irrelevant. For
creep tests and strain or modulus measurements in constant rate tests the container
diameter does come into effect, especially with higher diameter ratios, and must
therefore be entered into the measuring system setup details in the Meas-Editor utility
program. For diameter ratios of less than 0.2 minor changes in the container size,
design or positioning can be more or less ignored for most applications.
Setting Up Vanes In Measuring System Editor
Before you can use a vane it’s details must be set up in Meas-Editor.
1. Open Meas-Editor
2. Click New
3. Enter the name of the vane (eg V80-40) and select Type → Vane.
4. Enter the factors K-Gamma and Tau_Prom that were supplied with the vane.
5. Enter the radius of the vane ( Radius i ) and the radius of the container
( Radius o ).
6. Click Save.
7. Repeat as necessary and close Meas-Editor.
8 of 9
\\Bvserver\Data\RS Information\SSTManu al.doc

Vane Constants For The Soft Solids Tester
BROOKFIELD
Stress Constant: τ
All standard vanes supplied for the Soft Solids Tester have a height (H) to diameter
(D) ratio of 2:1. A stress constant is required for each vane to convert torque in
Newton metres to shear stress in Pascals. This constant is calculated as follows:
The constants for our standard vanes are as follows:
These are now pre-loaded in our software. If you do not have these vanes available in
Block Editor or on your instrument then please load them using Meas-Editor for
software driven setups, or Utilities → Measuring Systems for stand-alone setups.
Strain / Rate Constant: K-Gamma
The constant K-Gamma converts the rotational rate or position into shear rate / strain
values. It’s value is dependent upon the ratio of container-to-vane diameter. The
vanes pre-loaded into your software (eg V40-20-3to1) assume a ratio of 3:1. If you
use vane/container combinations that don’t match this you will need to set up a new
measuring system in Meas-Editor or Utilities → Measuring Systems. You can
calculate out the required value using:
τ
ττ
Vane Diameter (m) Height (m)
V30-15 0.015 0.030 4.043
V40-20 0.020 0.040 1.706
V80-40 0.040 0.080 0.2132
Prom.
τ
prom
−
3
1
ττττ-prom
−
4
10 1
=+
D
π
H
3
D
02094
.
Kgamma
−=
1
where b is the ratio of inner to outer diameters, or select an appropriate value from the
following table:
Container to Vane Diameter Ratio K-Gamma
1.5 to 1 0.3763
2 to 1 0.2792
3 to 1 0.2355
4 to 1 0.2234
5 to 1 0.2181
Infinite sea 0.2094
9 of 9
2
b
−
\\Bvserver\Data\RS Information\SSTManu al.doc
 Loading...