

,QHTXDOLW\*UDSKLQJ
IRUWKH7,3OXV
Getting Started
Start here
How To…
Start and quit Inequality Graphing
Define an inequality or equation
Shade the inequality intersection or union
Examples
Defining an inequality or equation in the Y= editor
Defining an inequality or equation in the X= edit or
Exploring non-linear functions with Pol-trace
More Infor m a t ion
Storing Coordinates Warning Messages
Error Recovery Customer Support
10/23/01 © 2000, 2001 Texas Instruments

Important Information
Texas Instruments makes no warranty, either expressed or
implied, including but not limited to any implied warranties of
merchantability and fitness for a particular purpose, regarding
any programs or book materials and makes such materials
available solely on an “as-is” basis.
In no event shall Texas Instruments be liable to anyone for
special, collateral, incidental, or consequential damages in
connection with or arising out of the purchase or use of these
materials, and the sole and exclusive liability of Texas
Instruments, regardless of the form of action, shall not exceed
the purchase price of this product. Moreover, Texas Instruments
shall not be liable for any claim of any kind whatsoever against
the use of these materials by any other party.
This graphing product application (APP) is licensed. See the
terms of the license agreement
.
Copyright © 2000, 2001 Texas Instruments Incorporated.
Inequality Graphing for the TI-83 Plus Page 2
What is Inequality Graphing?
The Inequality Graphing application for the TI-83 Plus gives you
new features for graphing equations and inequalities and
evaluating the relationship between them. Using the Inequality
Graphing application, you can
enter inequalities using relation symbols
•
graph inequalities and shade the union and intersection
•
regions
enter inequalities (vertical lines only) in an X=editor
•
trace points of interest (such as intersections) between
•
relations
store (x,y) coordinate pairs to lists for viewing and optimizing
•
functions for linear programming
Inequality Graphing is available in two different versions, English
only and international. The international version contains the
English version and also supports Dutch, French, German,
Portuguese, and Spanish. To run Inequality Graphing in a
language other than English, you must have the corresponding
language localization application installed and running on your
calculator. Language localization applications are available for
download free of charge in TI’s online store at epsstore.ti.com
.
Inequality Graphing for the TI-83 Plus Page 3

Where to Find Installation Instructions
You can find detailed instructions on installing Flash applications
at education.ti.com/guides
.
Inequality Graphing for the TI-83 Plus Page 4
Getting Started
1. Press to display the list of
applications on your calculator.
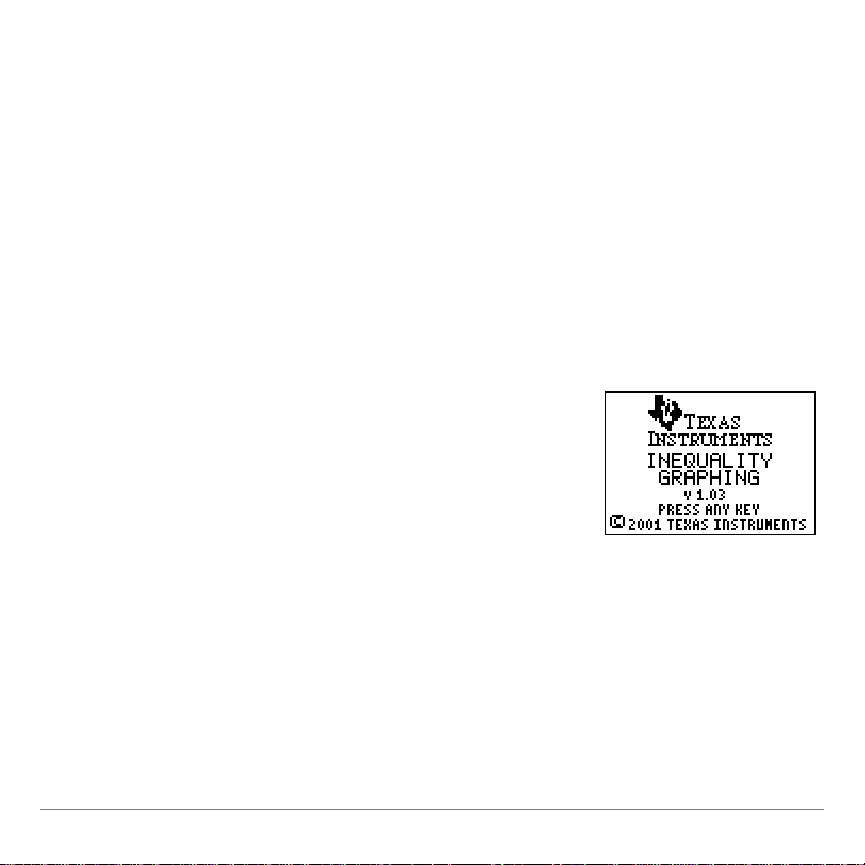
2. Select
Inequal
(or
Inequalz
in the
international version).
The Inequality Graphing splash screen is
displayed.
Getting Started is a fast-paced introduction that shows you some
of the Inequality Graphing application’s features.
Maximize profit, P = 3X + 2Y, for quantities of two products, X
and Y, given the following constraints on materials and time:
X
0, Y |0
|
Y + X
3X + Y
10
15
{
Inequality Graphing for the TI-83 Plus Page 5
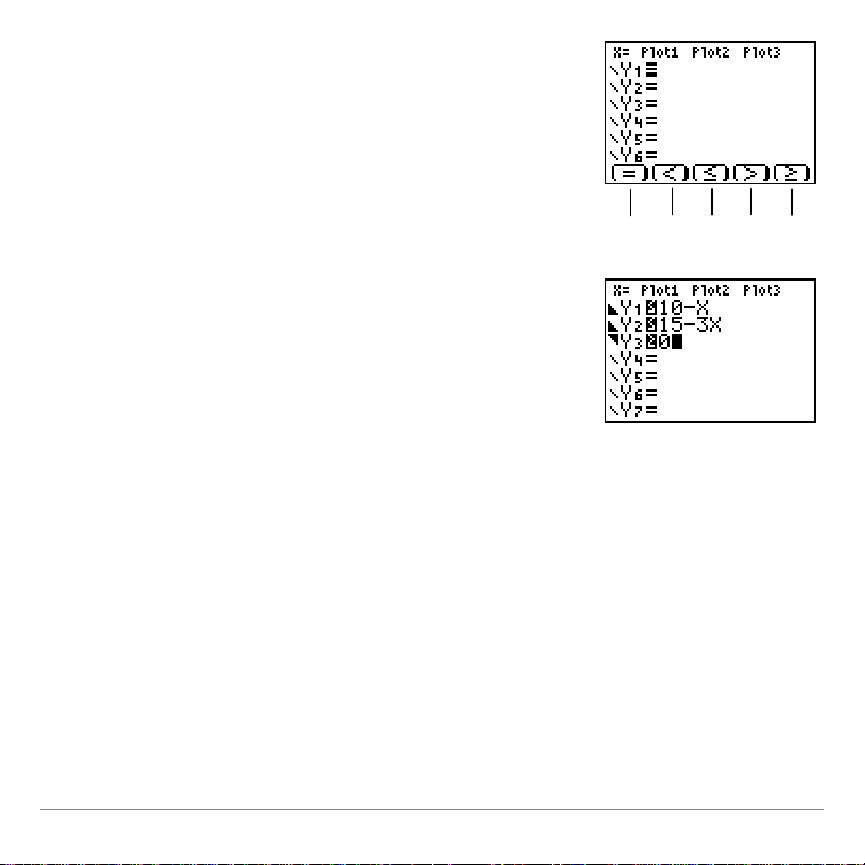
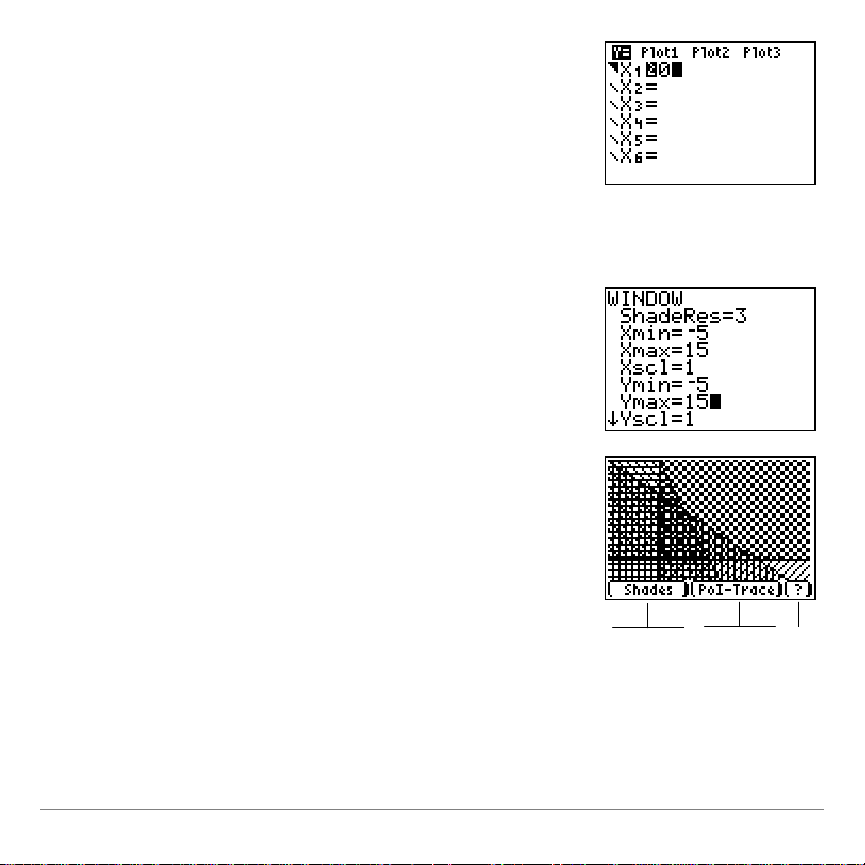
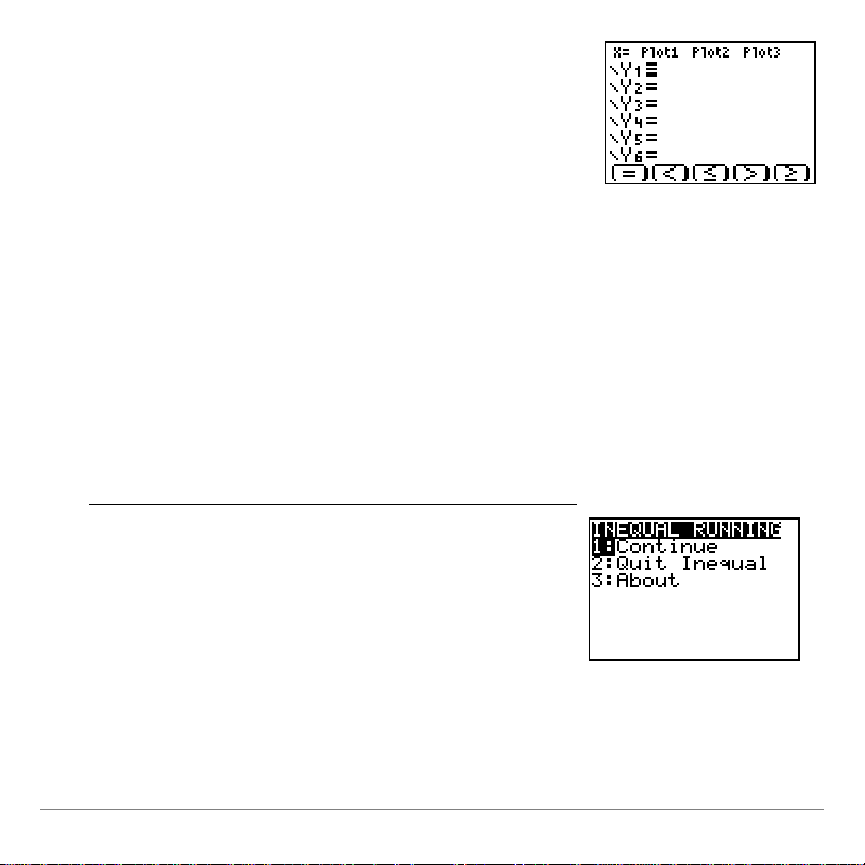
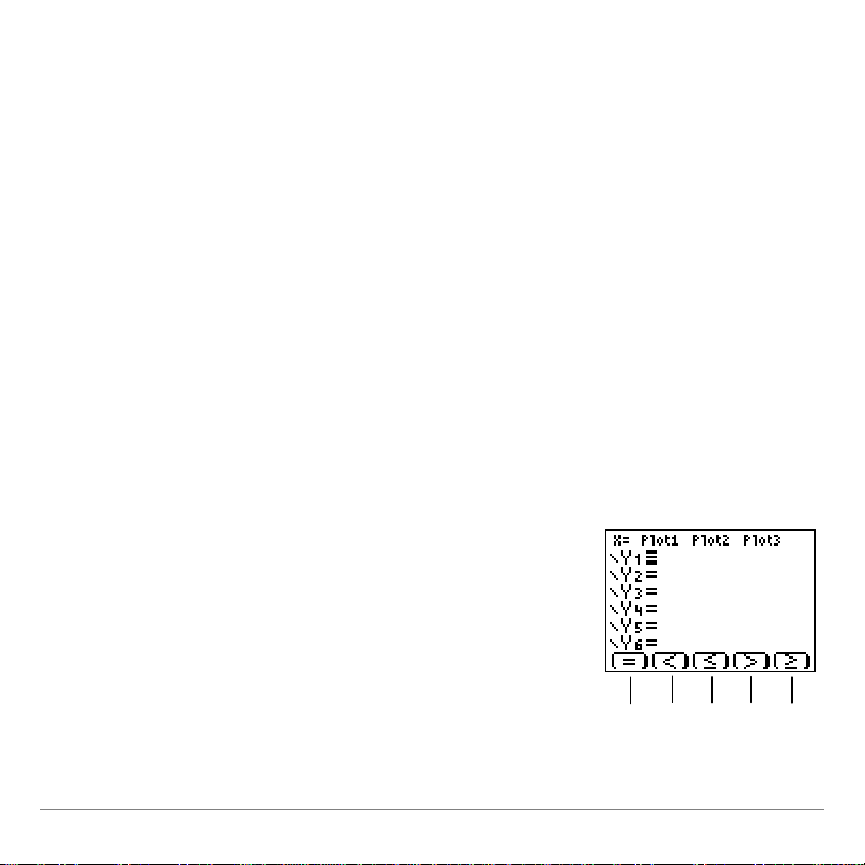
3. Press any key. The
Y= Editor
screen is
displayed.
Note that placing the cursor on = for any
Y-variable displays the new relation symbols
at the bottom of the s creen.
Press
plus ^–
b
to insert a
relation symbol.
^ _ ` a b
4. Press
`
to select .
5. Move the cursor to the right of the
relation symbol.
6. Press
À Ê ¹ to store
10Nx
to
Y
1
.
7. Enter the relations for
Y
2
and
Y
3
, as
shown.
Inequality Graphing for the TI-83 Plus Page 6
8. Move the cursor to X=(in the top left
corner).
9. Press
Í to access the X=editor.
10. Press b to select .
11. Press Ê to store the value to
X
1
.
12. Press p to set up the graphing
window.
13. Change the
Xmin, Xmax, Ymin
, and
Ymax
settings as shown.
14. Press s to graph the selected
X
n
and
Y
n
variables.
Shades, PoI-Trace and ? (help) options
display when the graph is drawn.
Press
plus
^Nb
to select an
option.
^
or
_ `
or
a b
Inequality Graphing for the TI-83 Plus Page 7
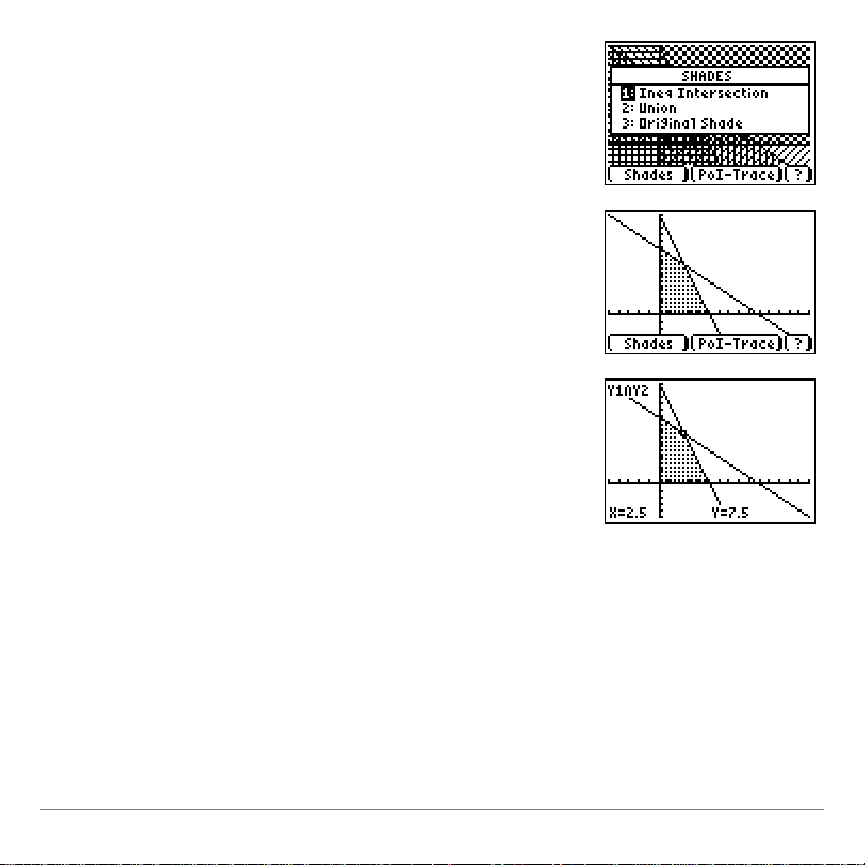
15. Press
ãF1ä
to display the
SHADES
menu.
16. Select
1:Ineq Intersection
.
Inequality Graphing draws the graph
again, shading the intersection region
of the inequalities.
17. Press
`
to select the
PoI-Trace option. The first point of
interest is displayed.
The coordinates of the point of interest are
displayed at the bottom of the screen. The
X-variables and Y-variables that are a part of
the intersection are displayed in the top left
corner (in this case
Y
1
and
Y
2
).
Press
}
or to move from one
X
n
or
Y
n
to
the next. Press ~or |to move from one
point to another along the same
X
n
or
Y
n
.
Inequality Graphing for the TI-83 Plus Page 8
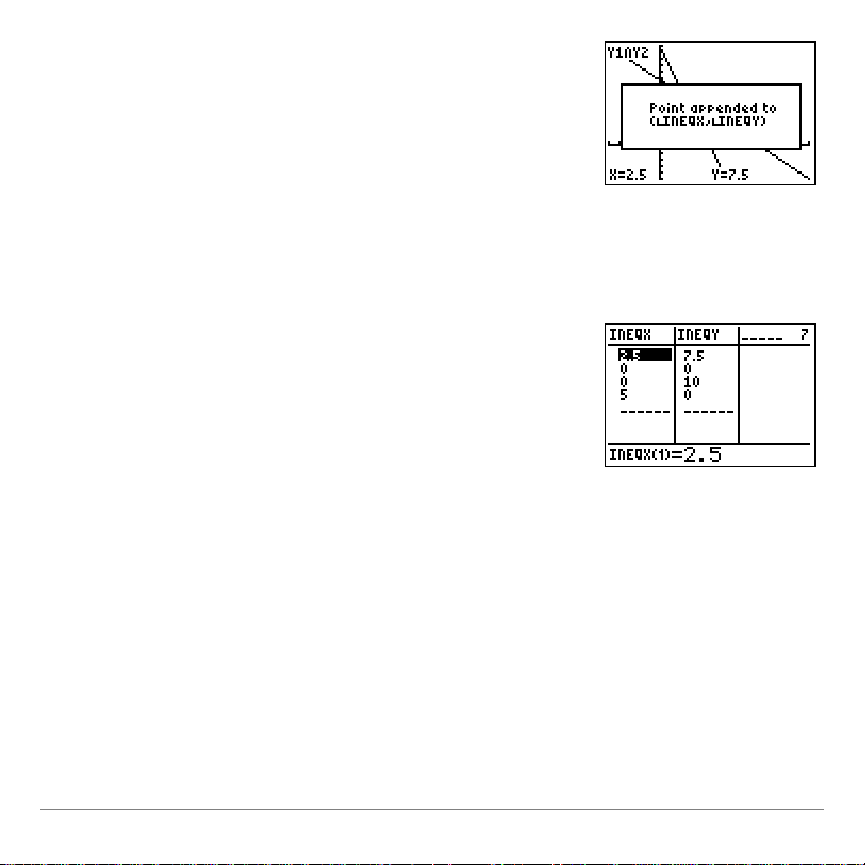
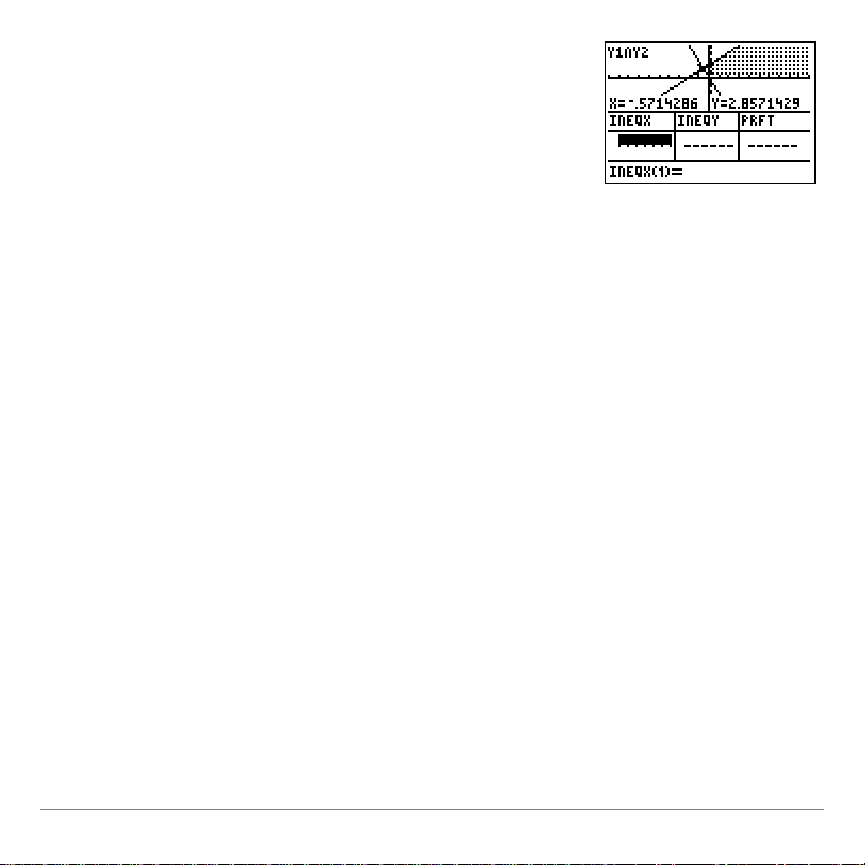
18. Press
;
to append the coordinates
for the point at your cursor position to
the lists
L
INEQX
(x-coordinate) and
L
INEQY
(y-coordinate).
19. Press any key to continue.
20. Find and store the remaining points
that bound the shaded region.
21. Press .
22. From the
Edit
menu, select
1:Edit
.
Inequality Graphing for the TI-83 Plus Page 9
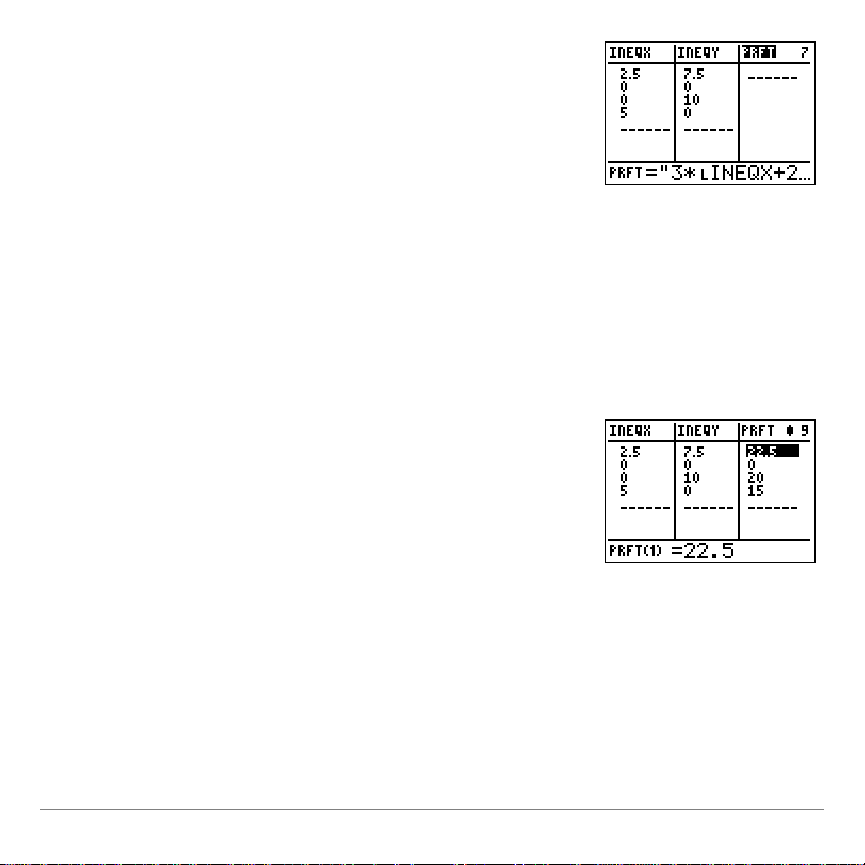
23. Insert a new list named
PRFT
.
24. Add the formula for maximum profit,
"3 * LINEQX + 2 * LINEQY":
Press
ƒ
ã"ä
 ¯ y 9
.
Scroll to LINEQX.
Press
Í
to select it.
Press
à Á ¯ y 9
.
Scroll to LINEQY.
Press
Í
to select it.
Press
ƒ
ã"ä
.
The highest value in
PRFT
provides the
corresponding x (
L
INEQX
) and y (
L
INEQY
)
values to maximize the profit.
Inequality Graphing for the TI-83 Plus Page 10
Starting and Quitting the Inequality Graphing
Note
To select a menu option, press the number or letter
corresponding to the option or press to highlight the option,
then press
E
.
Note
Quitting the application does not delete it from your calculator. To
delete the application, see Deleting Inequality Graphing from the
TI-83 Plus.
1. Press
to display the list of
applications on your calculator.
2. Select
Inequal
(or
Inequalz
in the
international version). The Inequality
Graphing information screen is
displayed.
Application
The Inequality Graphing application works only in function mode.
If your calculator is not in function mode, the application changes
the mode.
To run the Inequality Graphing application efficiently, your
calculator should have at least 600 bytes of free RAM.
Inequality Graphing for the TI-83 Plus Page 11
3. Press any key. The
Y= Editor
screen is
displayed with the cursor on the =for
Y
1
.
Choose
To
1:Continue
Leave the Inequality Graphing
application active
2:Quit Inequal
Deactivate the Inequality
Graphing application
3:About
View the About screen that
displays the application name
and version number
If the Inequality Graphing application is already running on your
calculator, the above screens will not be displayed when you
select
Applications
Inequal
(or
Inequalz
menu. Instead, the following screen is displayed,
giving you options to quit the application or to continue (leave it
running).
Select one of the following options:
in the international version) from the
Inequality Graphing for the TI-83 Plus Page 12

A Word About AppVars
The Inequality Graphing application creates two application
variables (AppVars) when you run it. These AppVars are used to
store data specific to this application and to make graphing
faster.
INEQVAR requires 237 bytes of free RAM. The Inequality
•
Graphing application requires INEQVAR to function correctly.
If your calculator does not have at least 237 bytes of free
RAM, you cannot run the Inequality Graphing application.
POILIST requires 317 bytes of free RAM. The Inequality
•
Graphing application does not require POILIST to function
correctly. However, if your calculator does not have an
additional 317 bytes of free RAM so that POILIST can be
created, performance will be much slower.
INEQVAR and POILIST are automatically deleted from the
calculator’s memory when you quit Inequality Graphing normally
(from the
quit by the system, (for example, if you delete the application
manually, or if you transfer files while the application is running
and the calculator is defragmented) the AppVars remain on the
calculator, but are no longer active.
menu option). If Inequality Graphing is forced to
Quit
Inequality Graphing for the TI-83 Plus Page 13

Y= Editor and X= Editor
When you place the cursor over the equality symbol on the
Y= editor, you immediately see some of the features the
Inequality Graphing application offers. A set of relation options is
displayed across the bottom of the screen. You can use any
inequality symbol (>, <,
(These options are displayed only when the cursor is over the
relation symbol.)
The Inequality Graphing application has an X=editor to
complement the Y=editor. You access it from the Y=editor and
you can move between the two editors as much as you like. A
highlighted
or Y= in the top left corner of the screen reminds
X=
you that you defined and selected equations or inequalities on
the other editor.
On the X= editor, an expression must evaluate to a real number.
You can use any constant function of
whether they are equations or inequalities.
) as well as the equality symbol.
|, {
to define vertical lines,
X
Inequality Graphing for the TI-83 Plus Page 14
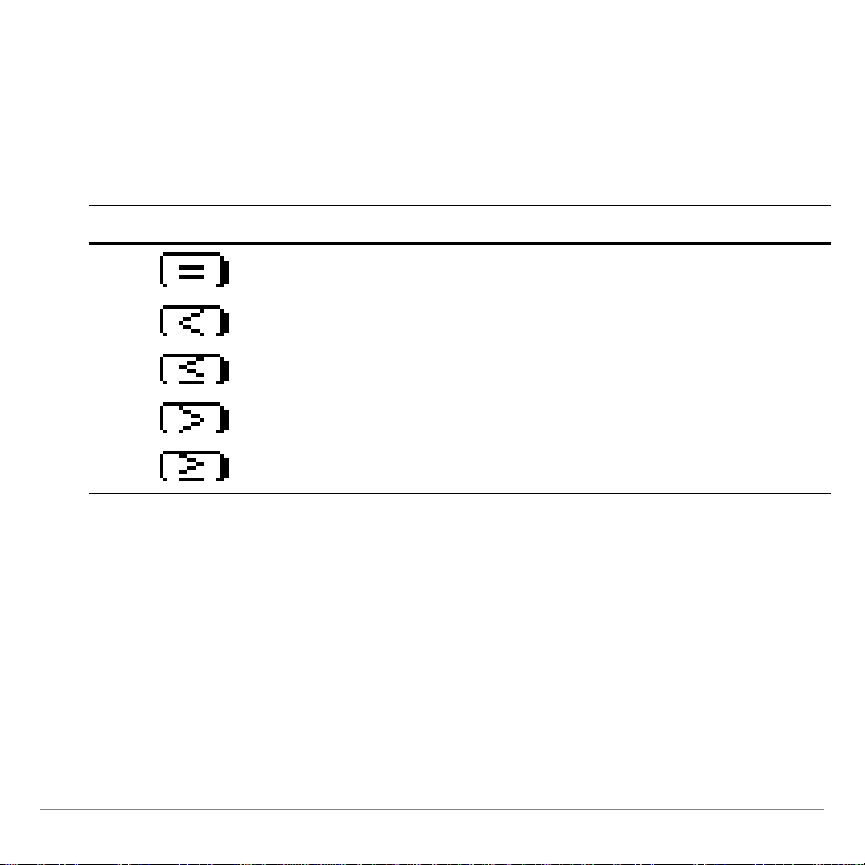
Relation Symbols
Relation Symbol
Keystrokes
^
_
`
a
b
To change a relation symbol, place the cursor on the symbol for
that
Y
appropriate symbol.
Graph Styles
In the Y=editor, the graph style for inequalities corresponds to
the inequality and automatically changes when you select the
symbol. You cannot change this graph style. The graph style for
equations remains unchanged. You can change the graph style
to one of the seven standard TI
or
í
or
n
and use the keystrokes below to select the
X
n
83 Plus options: ç, è, é, ê, ë, ì,
-
Inequality Graphing for the TI-83 Plus Page 15
In the X=editor, all graph styles are automatically selected and
Note
When you quit the Inequality Graphing application normally, all
inequality graph styles are changed to the thin line graph style (ç).
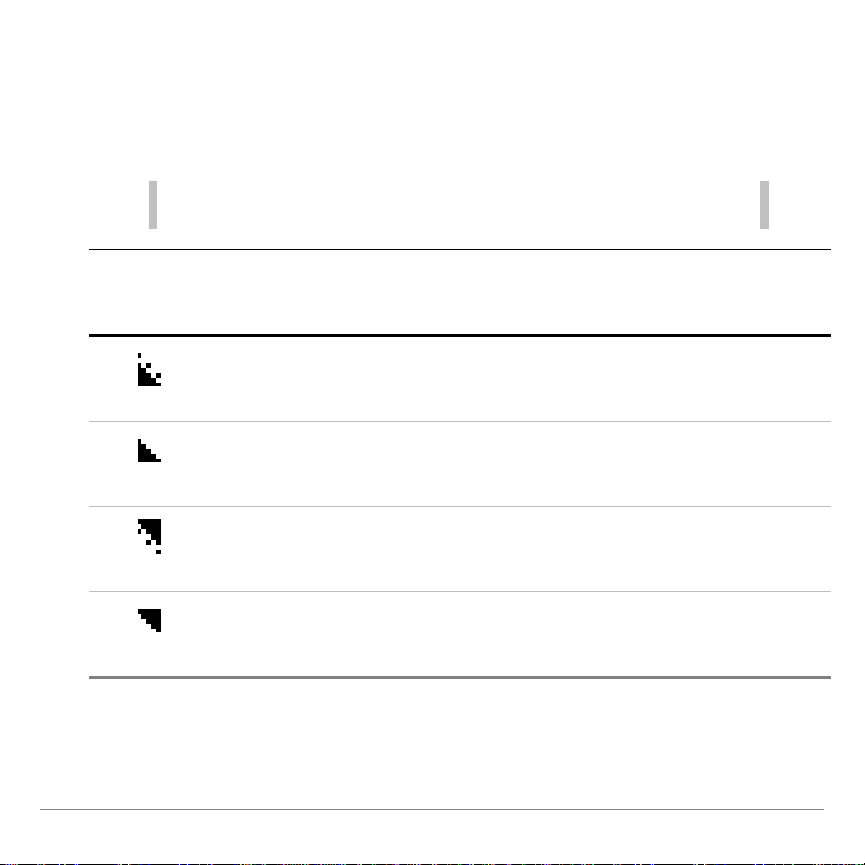
Inequality
Graph
Style
Relation
Symbol
Definition
Result
<
Less than
Graph is shaded below the line,
but the line is not included in the
solution, so it appears “dotted”
Less than or
equal to
Graph is shaded below the line
and the line is included in the
solution
>
Greater than
Graph is shaded above the line,
but the line is not included in the
solution, so it appears “dotted”
Greater than
or equal to
Graph is shaded above the line
and the line is included in the
solution
cannot be changed. Inequalities have a graph style that
corresponds to the inequality; equations have the thin line graph
style (
ç).
Inequality Graphing for the TI-83 Plus Page 16
Defining an Inequality or Equation
1. Place the cursor on the = symbol for
Y
1
.
The cursor is automatically placed over the
=
symbol for
Y
1
when you first access the Y=
editor. The relation symbol displays only
when the cursor is on a relation symbol.
Press
plus ^–
b
to insert a
relation symbol.
^ _ ` a b
To define an inequality or equation in the Y=editor or X=editor,
select the relation symbol, move the cursor to the right, and
enter the inequality or equation. You do not have to change the
relation symbol
before
Notice that when a
to be included in the graph. To select or deselect a
place the cursor on the relation symbol and press
you type the inequality or equation.
or
Y
n
is defined, it is automatically selected
X
n
Y
Í.
or
,
X
n
n
Example:
Y
1
-
Y
2
> 0
Y
3
Define the following in the Y= editor:
2X + 4
5X
Inequality Graphing for the TI-83 Plus Page 17
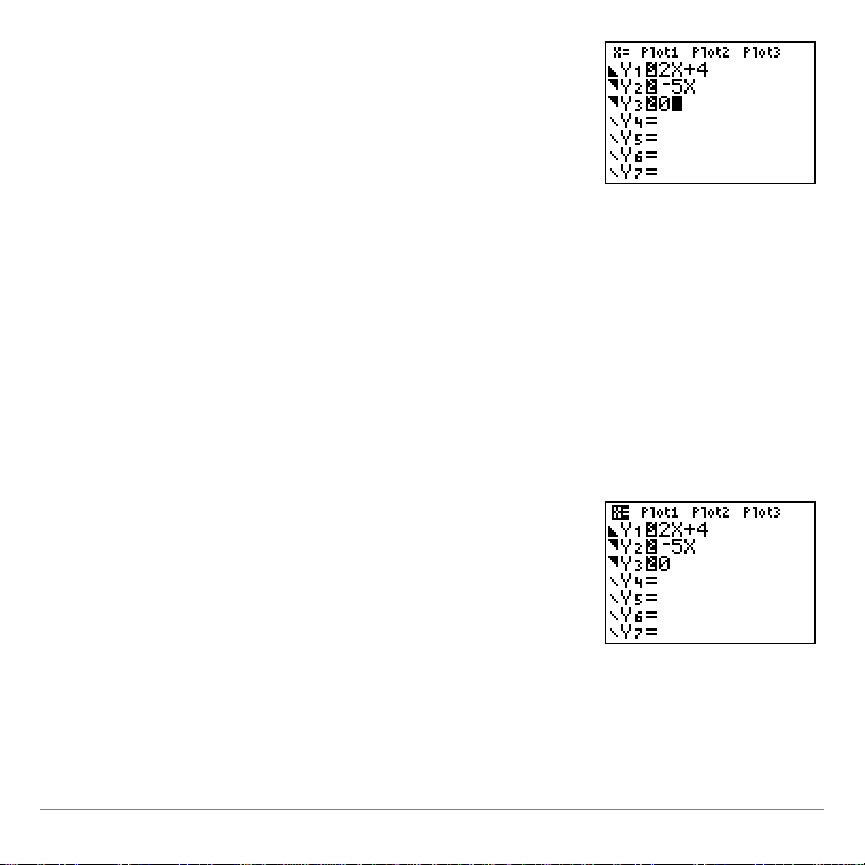
2. Press
`
to change =to
.
3. Move the cursor to the right of the
relation symbol.
4. Press Á Ã ¶ to store
2x+4
to
Y
1
.
5. Move the cursor to the next Y-variable
and enter the remaining inequalities, as
shown.
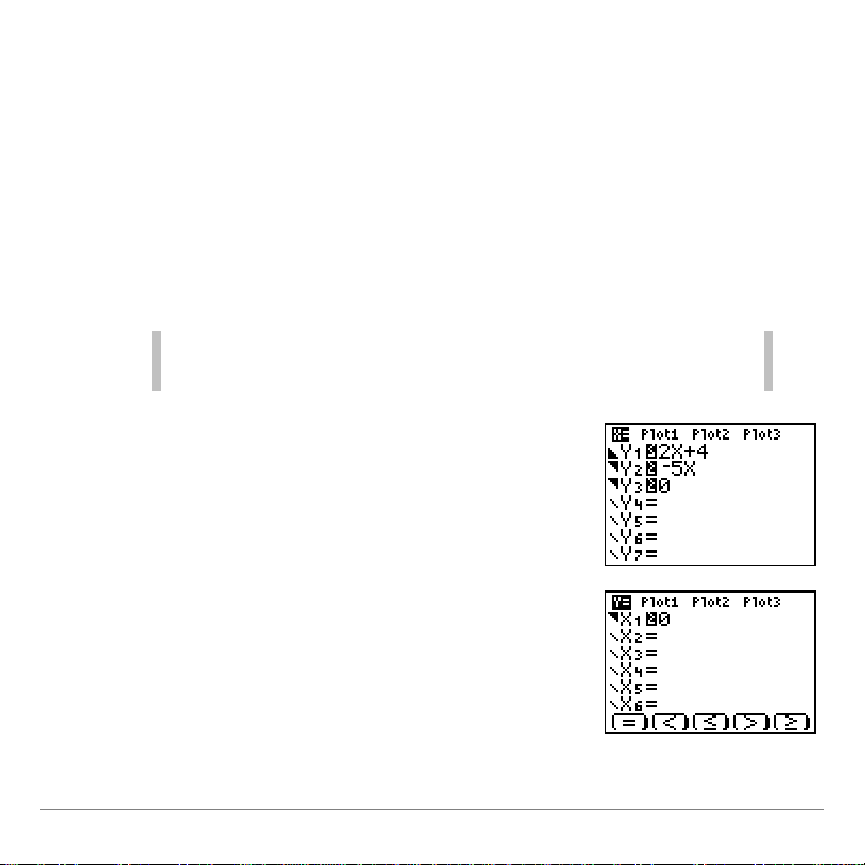
1. Move the cursor to theX= symbol in the
top left corner of the screen.
Example:
X
1
Define the following in the X=editor:
0
Inequality Graphing for the TI-83 Plus Page 18

2. Press
Í
to display the X=editor
screen. The cursor is automatically
placed on the = symbol for
X
1
.
3. Press
b
to change =to .
4. Move the cursor to the right of the
relation symbol.
5. Press Êto store the value to
X
1
.
Inequality Graphing for the TI-83 Plus Page 19
Graphing
Note
p, r, q
, and
y /
work the same in Inequality
Graphing as in normal graphing.
1. Check the Y=editor and the X=editor to
be sure that the relations you want to
include on the graph are selected.
Place the cursor on the relation symbol and
press
Í
to select or deselect a
Y
n
or
X
n
.
The Inequality Graphing application graphs the selected
inequalities and/or equations from the Y=editor first, then it
graphs the selected inequalities and/or equations from the
X=editor. When the graphs are displayed, three options appear
at the bottom of the screen:
These options are additional features of the Inequality Graphing
application and are discussed later in this section.
Shades, PoI-Trace
, and ?(Help).
Inequality Graphing for the TI-83 Plus Page 20

2. Press
s
to graph the selected
relations.
Shades, PoI-Trace and ? (help) options
display when the graph is drawn.
Press
plus ^–
b
to select an
option.
^
or
_ `
or
a b
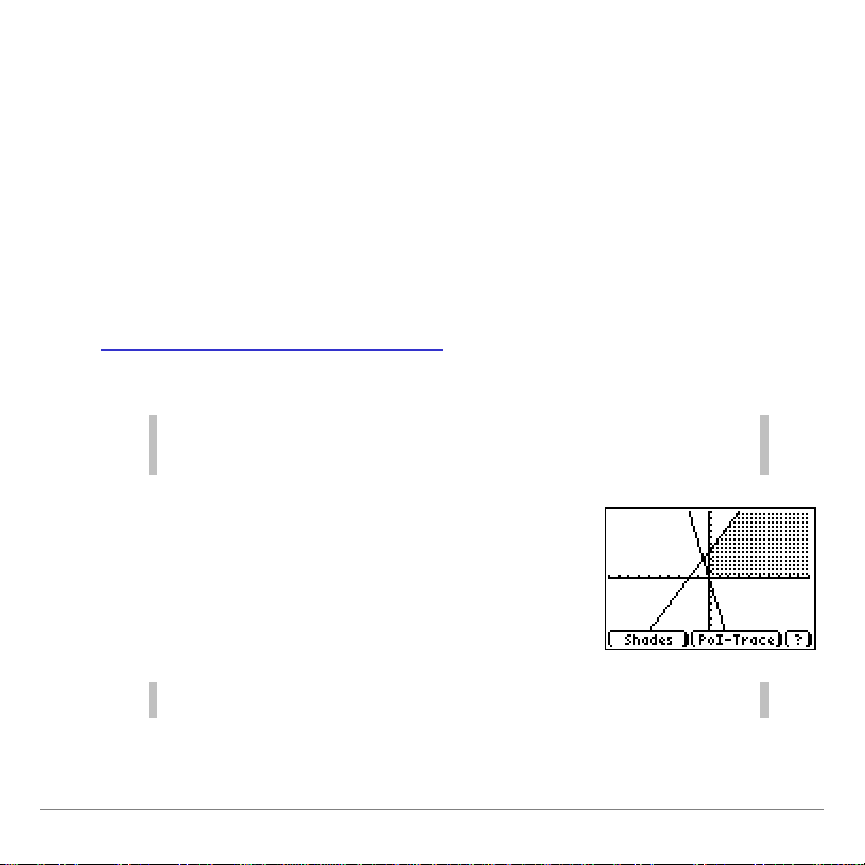
Shading the Inequality Intersection or Union
Now that the selected inequalities and/or equations are graphed,
you can further view their relationship to each other by displaying
their inequality intersection or union. The graphs of all of the
relations remain on the screen and their intersection or union
regions are shaded.
The new graph is not intended to exactly represent the
intersection or union solution, but to help you visualize the
solution.
If you have selected a graph style for a Y-variable on the
Y=editor (when the relation symbol is
), it may not be displayed
=
when you graph the intersection or union of the relations. The
following table shows what happens to each of the graph styles.
Inequality Graphing for the TI-83 Plus Page 21

Graph
style
Definition
What happens when you graph
intersection and union
ç
Thin line
Unchanged
è
Thick line
Converted to thin line
ê
Shade below
Converted to thin line and warning message
displayed: Above or Below not supported
é
Shade above
Converted to thin line and warning message
displayed: Above or Below not supported
ì
Trace
Unchanged
ë
Trace with
trailing line
Unchanged
í
Dotted line
Unchanged
1. Press ^ to display the
Shades
menu.
The default option selected in this menu
corresponds to the type of shading that was
displayed before you selected the Shades
feature.
Inequality Graphing for the TI-83 Plus Page 22

2. The following graphing options are
available:
1:Ineq
Intersection
Shades the intersection of
the selected inequalities
2:Union
Shades the union of the
selected inequalities and/or
equations
3:Original
Shade
Displays the original graph
of all of the selected
inequalities and/or equations
Note
You can pause/resume or stop drawing the graph at any time:
Press
Í
to pause/resume drawing.
Press
É
to stop drawing.
Press
s
to redraw the graph..
Inequality Graphing for the TI-83 Plus Page 23

Note
When Shades, PoI-Trace, and ? (Help) are displayed on the
screen, you can hide them and display them again:
Press
Í
to hide the options.
Press
s
to display the options.
When you shade the intersec t ion of a graph
that includes both inequalities and
equations, a dialog box displays to remind
you that the application is only shading the
intersections of the inequalities.
If you graph an equation with the shade style
set to shade above (é) or below (ê) the
equation, the shading will not be displayed
when you shade the inequality intersection
or union. Use the relation symbols (<, {, >,
|
) to ensure that all inequalities are shaded
properly.
Inequality Graphing for the TI-83 Plus Page 24

Exploring Graphs with TRACE
You can use the TI-83 Plus
TRACE
feature
to move the cursor from one plotted point
to the next along a relation. Because the
Inequality Graphing application is running,
the
Y
n
displayed in the top left corner
includes the relation symbol.
See section 3–18 in the TI-83 Plus
guidebook education.ti.com/guides for
detailed information about the
TRACE
feature.
Exploring Graphs with PoI-Trace (Point of Interest Trace)
When you select PoI-Trace, the Inequality Graphing application
displays the points of interest (“intersections” of all lines, dotted
or solid). Use the arrow keys to move from one
another and from one point of interest to another on the same
or
window range (
as detailed below. If an X-coordinate lies outside of the
X
n
Xmin
and
), that point of interest will not be
Xmax
found.
or
Y
n
to
X
n
Y
n
Inequality Graphing for the TI-83 Plus Page 25
The Xand Y coordinates for the intersection are displayed at the
Note
If one or more Y-variables contains a list, you will not be able to
trace points of interest for the graph.
Press ` to trace points of interest.
The first point of interest is displayed.
Note
At any time, you can press Éto stop the solver.
bottom of the screen. The
X
n
and
values for the intersection
Y
n
are displayed in the top left corner. The intersection symbol is
used when both relations are represented by solid lines (i.e.,
Y1©©Y2
by a dotted line, the
(i.e.,
). For points of interest where the relation is represented
Y1, Y2
).
X
n
and
values are separated by a comma
Y
n
The PoI-Trace feature was designed for linear functions. It may
not find all points of interest for non-linear functions. See
Exploring Non-linear Functions
to learn how to find these points
of interest.
Inequality Graphing for the TI-83 Plus Page 26

The X and Y coordinates are displayed at
the bottom of the screen. The top left
corner shows that the point lies at the
intersection of
Y
1
and
Y
2
.
1. Press ~or |to move to the next point
of interest on the same
Y
n
or
X
n
.
—or—
Press }or to move to a point of
interest on another
Y
n
or
X
n
.
Press
to exit the PoI-Trace
mode.
Inequality Graphing for the TI-83 Plus Page 27

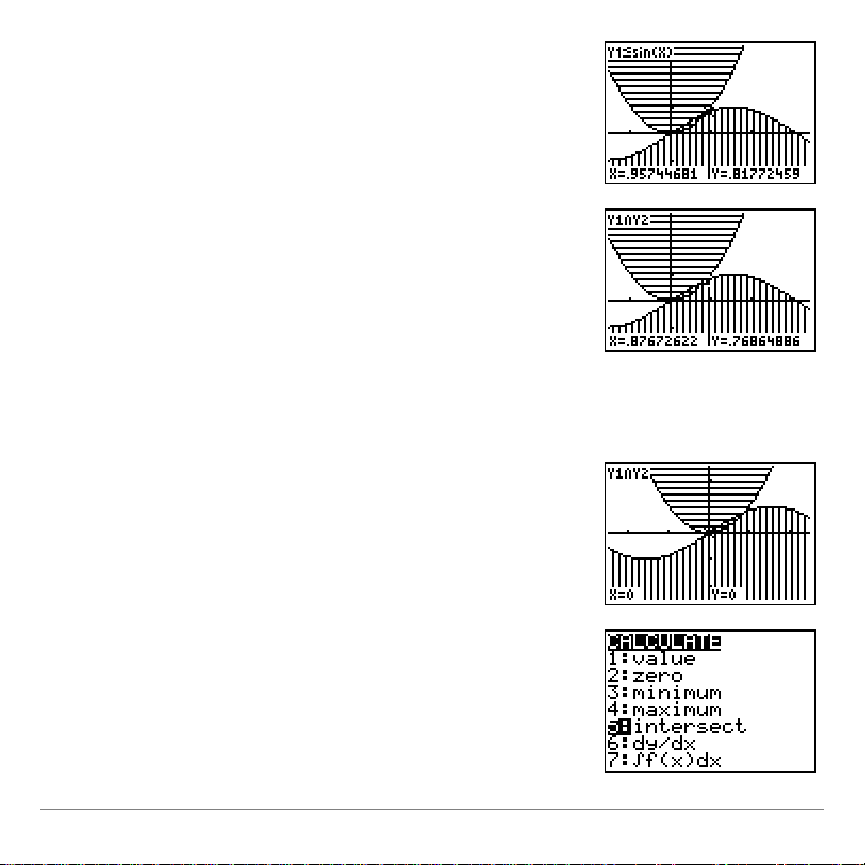
Exploring Non-linear Functions with PoI-Trace
1. Press ` to activate the
PoI-Trace mode. Coordinates for the
first point of interest are displayed.
2. Press
r. You are no longer in
PoI-Trace mode.
3. Move the cursor close to the other point
of interest.
When a non-linear function intersects another function or
relation, only one point of interest can be calculated. If that point
is not the one you want, you can find the other point using one of
the following methods.
The following examples use these relations:
sin x
{
Y
1
2
x
|
Y
2
Method 1
Inequality Graphing for the TI-83 Plus Page 28
4. Press
Í
. The window shifts and the
graph is redrawn.
5. Press
a
to return to PoI-Trace
mode. The exact coordinates of the
point of interest are displayed.
1. Press
`
to activate the
PoI-Trace mode. Coordinates for the
point of interest are displayed.
2. Press
y /
to display the
CALCULATE
screen.
3. Select
5:intersect
.
Method 2
Inequality Graphing for the TI-83 Plus Page 29
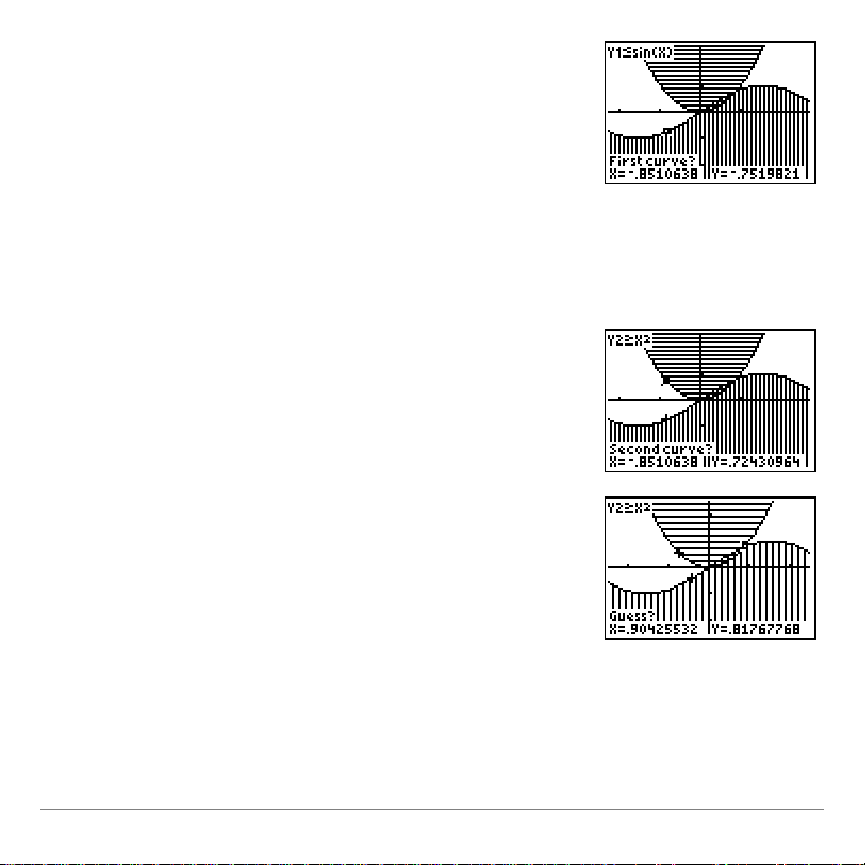
4. The cursor moves to a point on one of
the curves and displays
First curve?
If
want to find an intersection point on this
curve, press
Í
.
If you do not want to find an
intersection point on this curve, move
the cursor to the correct curve and
press
Í
.
5. Repeat step 3 for the second curve.
6. Now the screen displays
Guess?
Move
the cursor as close to the intersection
point as you can and press
Í
.
Inequality Graphing for the TI-83 Plus Page 30
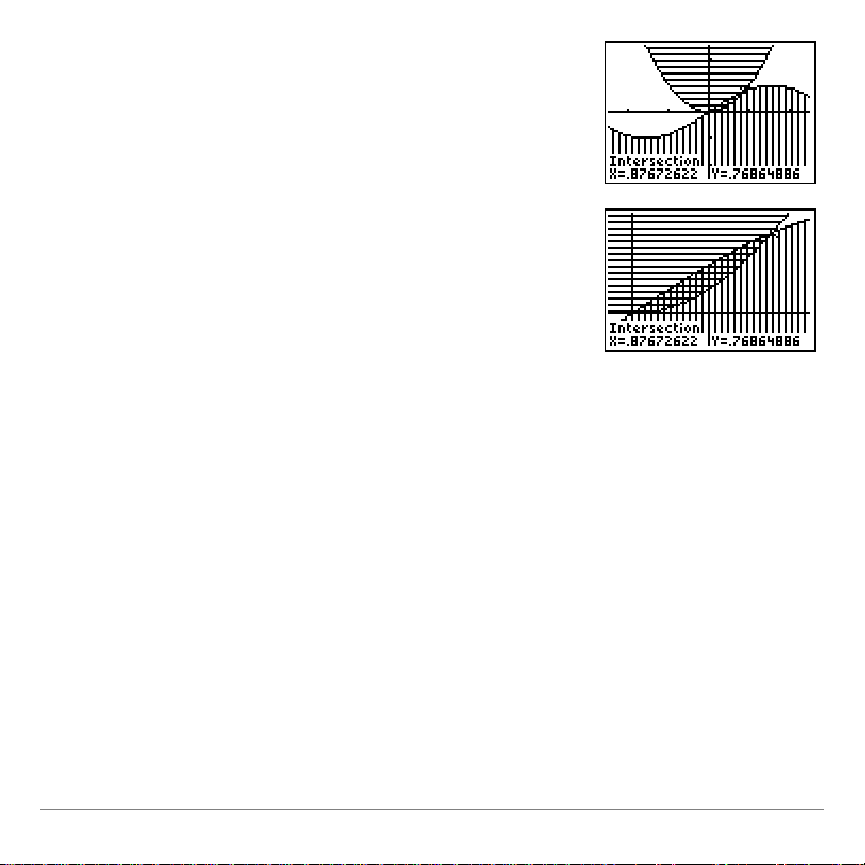
The exact intersection point that is
closest to where you placed the cursor
is displayed.
Graph of intersection (zoomed in)
Storing Coordinates of Points
You can store coordinates of points to lists so that you can use
them in evaluations. The points are automatically stored in
INEQX
L
(for x-values) and
INEQY
L
(for y-values). If these lists
already exist, new values are appended to the existing lists
explained later in this section, you can press
clear all values from
INEQX
L
and
INEQY
L
to
.)
. (As
INEQX
L
and
INEQY
L
are placed in the calculator’s list editor,
unless the list editor is full.
Inequality Graphing for the TI-83 Plus Page 31
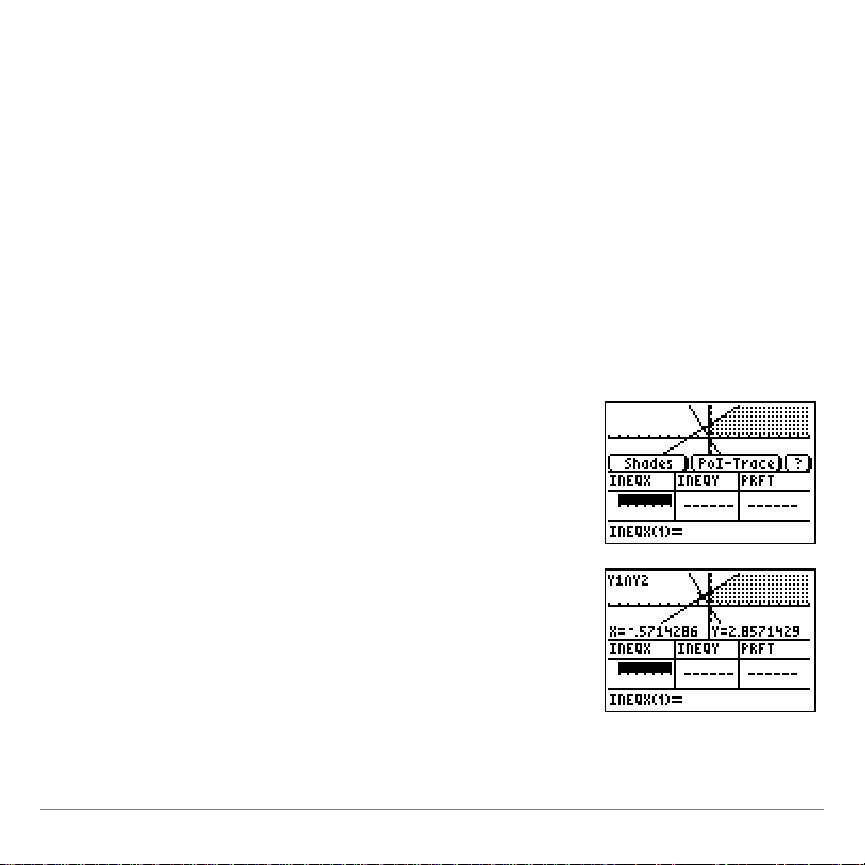
Storing points is not limited to the PoI-Trace mode or to points of
1. Press
`
to select PoI-Trace.
The first point found is displayed.
interest. If you can see the cursor on the screen, you can store
any point. You can also manually add values to
INEQY
L
contain only real numbers
, although there is one specific limitation:
.
INEQX
L
and
both lists must
Both lists must contain the same number of elements for
Inequality Graphing to store points to them.
The following example shows both the graph and the stat list
editor. The calculator mode is set to
Horiz
(horizontal split
screen).
Inequality Graphing for the TI-83 Plus Page 32

2. Press
¿ to store the coordinates to
L
INEQX
and
L
INEQY
.
If (
L
INEQX
,
L
INEQY
) already contains the
point you want to store, a message
displays. Press any key to clear the
message.
To clear all elements from
L
INEQX
and
L
INEQY
1. Press .
2. Select 2: Clear (
L
INEQX
,
L
INEQY
).
Inequality Graphing for the TI-83 Plus Page 33
Pressing
changes the lists in
the following ways:
•
Changes them to real lists if they
previously contained complex numbers
•
Detaches any formulas attached to the
lists
Pressing
.does not delete the
lists from the calculator, but deletes all of
the elements in the lists.
Inequality Graphing for the TI-83 Plus Page 34

Getting Help
1. Press b to select ?(help)
2. The following help options are
available:
Pressing Does This
¿
Appends the point of
interest coordinates to
the list pair (
INEQX,INEQY
)
Clears all elements in the
list pair (
INEQX, INEQY
)
^
—or—
_
Displays the
SHADES
dialog box
`
—or—
a
Accesses the point of
interest trace mode
The Inequality Graphing application has a help feature for the
graph mode. This help feature is only displayed on the graphed
screen.
Inequality Graphing for the TI-83 Plus Page 35

:LQGRZ6HWWLQJV
The Inequality Graphing application adds a
new shading resolution variable to the
Window settings called ShadeRes.
ShadeRes determines how far apart the
shading lines are when the graph is drawn.
Valid values are 3–8, with 3 making the
shading lines closest together and 8
making them farthest apart. The default
value for ShadeRes is 3.
Inequality Graphing for the TI-83 Plus Page 36

FnOn (Function On) and FnOff (Function Off) Commands
You can select or deselect all X-variables and Y-variables using
the
FnOn
or
FnOff
command:
1. Press
2. Select
y N.
to select all X-variables and Y-variables.
FnOn
—or—
Select
to deselect X-variables and Y-variables.
FnOff
You can also select or deselect individual Y-variables (you
cannot select or deselect individual X-variables):
1. Press
2. Select
3. Press
4. Select
5. Select
y N.
FnOn or FnOff
.
Y-VARS
1: Function
.
.
.
6. Select the Y-variable to turn on.
7. Press
Í.
Inequality Graphing for the TI-83 Plus Page 37

System Integration
The Inequality Graphing application is integrated in to the system
except in the following situation:
When you access the Y-variables from outside the Y=editor,
such as in the table editor or the home screen, they are treated
as equations rather than inequalities.
Example:
In the Inequality Graphing application Y=editor,
Y
2X+4
|
1
On the home screen,
3
(where x=10 due to the default
= 72
Y
1
Window setting)
Xmax
Inequality Graphing for the TI-83 Plus Page 38

Deleting Inequality Graphing from the TI-83 Plus
To delete the application from your calculator:
1. Press
y L
2. Select
2:Mem Mgmt/Del…
.
3. Use †or }to select
4. Use †or }to select
5. Press
6. Select
7. Press
8. Press
9. Select
.
{
.
2:Yes
y 5
y L
2:Mem Mgmt/Del…
to defragment the calculator.
.
10. Use †or }to select
11. Use †or }to select
12. Press
{
.
13. Use †or }to select
A:Apps…
Inequal
.
B:AppVars…
INEQVAR
POILIST
.
.
14. Press
Inequality Graphing for the TI-83 Plus Page 39
{
.

Inequality Graphing Warning and Error
Message
Description
Duplicate point
You have selected coordinates to store to
L
INEQX
and
L
INEQY
that have already been stored.
List Editor full
The list editor already contains the maximum of 20 lists.
L
INEQX
and
L
INEQY
will be stored on your calculator, but will
not appear in the list editor.
List mismatch
L
INEQX
and
L
INEQY
contain different numbers of elements.
Select one of the following options:
1:Cancel
¿
to cancel storing the points.
2:Clear (INEQX,INEQY
to delete all elements from
L
INEQX
and
L
INEQY
and store the selected point coordinates.
(LINEQX, LINEQY)
must be real lists
L
INEQX
or
L
INEQY
(or both) are complex lists. Press
to clear the lists so that you can store the
selected point coordinates.
(LINEQX, LINEQY)
already full
The lists
L
INEQX
and
L
INEQY
contain 999 elements. Delete
some elements or clear the lists so that you can store the
selected point coordinates.
Messages
Inequality Graphing Warning Messages
Inequality Graphing for the TI-83 Plus Page 40
Message
Description
No points found in
this window
One of the following situations exist:
•
There are no points of interest (“intersection” points) at
all.
•
The points of interest exist outside of the current
window. Press
p
and change
Xmin
and/or
Xmax
to change the current window.
•
The solver is not able to find the points of interest for
non-linear relations. See Exploring Non-linear Functions
with Pol-Tracefor details on how to find these points of
interest.
PoI not available
for lists
The PoI-Trace feature is not available when one or more of
the Y-variables contains a list.
Shading
intersection of
inequalities only
One or more of the selected X-variables and Y-variables is
an equation. The Inequality Graphing application shows the
intersections of the inequalities even though equations are
graphed.
Need at least two
inequalities
At least two inequalities must be defined and selected in
order to shade the inequality intersection.
Need at least two
relations
At least two relations (equations or inequalities) must be
defined and selected to shade the union.
Inequality Graphing for the TI-83 Plus Page 41

Inequality Graphing Error Messages
Message
Description
ERR: MEMORY
600 Bytes Free
RAM Needed
1: Quit Inequal
The calculator does not have enough free RAM to create
the INEQVAR AppVar. Delete some items to free at least
600 bytes of RAM.
Conflicting APPS
1: Quit Inequal
2: Quit Apps listed
below
One or more applications that are currently running use the
same resources as the Inequality Graphing application. To
run the Inequality Graphing application, you must quit the
conflicting application(s).
ERR: INEQVAR
1:Overwrite
2:Quit Inequal
An AppVar named INEQVAR already exists, but it is not
related to this application.
Select one of the following options:
1:Overwrite
to overwrite the current AppVar.
2:Quit Inequal
to quit the application.
Inequality Graphing will not run without the correct version
of INEQVAR. You must either rename the existing AppVar
or let Inequality Graphing overwrite it.
ERR: Data Type
1: Quit
2: Goto
An X-variable (in the X=editor) evaluates to a number that is
not real.
Select one of the following options:
1: Quit
to restore the previous value for that X-variable.
2: Goto
to change the X-variable so that it evaluates to a
real number.
Inequality Graphing for the TI-83 Plus Page 42

Message
Description
ERR: Divide by 0
1:Quit
2:Goto
You have entered an expression on the Y=Editor or
X=Editor that is divided by zero.
Select one of the following options:
1:Quit
to restore the previous value for that X-variable.
2:Goto
to change the expression so that it evaluates to a
real number.
Inequality Graphing for the TI-83 Plus Page 43

Error Recovery Instructions
Low Battery Condition
Do not attempt a Flash download if the low-battery message
appears on the calculator. Low battery indication is shown on the
initial screen. If you receive this error during an installation,
change the batteries before trying again.
Archive Full
This error occurs when the TI-83 Plus does not have sufficient
memory to store the application. You must delete an application
and/or archived variables from the TI-83 Plus in order to make
room for another application. You can back up an application to
your computer by using the
in TI-GRAPH LINK™ for the TI-83 Plus. Once saved, you can
reload it to the TI-83 Plus later using the
Software
menu in TI-GRAPH LINK.
Link > Receive Flash Software
Link > Send Flash
menu
Inequality Graphing for the TI-83 Plus Page 44

Communication Error
This error indicates the Flash Installer is unable to communicate
with the TI-83 Plus. The problem is usually associated with the
TI-GRAPH LINK cable and its connection to the TI-83 Plus
and/or to the computer. Make sure the cable is firmly pushed in
to the calculator and the computer.
If this does not correct the problem, try a different
TI-GRAPH LINK
to get this error, please contact TI-Cares
cable and reboot your computer. If you continue
Customer Support for
é
assistance.
Validation Error
Either this calculator does not have a certificate to run the
application, or electrical interference caused a link to fail. Try to
install the application again. If you continue to receive this error,
contact TI-Cares
.
Inequality Graphing for the TI-83 Plus Page 45

Checksum Error
The Flash installer was not able to verify that the application was
fully installed. Exit the installer and try to install the application
again. If this problem persists, contact TI-Cares
.
Other Errors
See pages B-6 through B-10 in the TI-83 Plus guidebook
education.ti.com/guides
or contact TI-Cares
for information about the specific error
.
Miscellaneous
Verify Maintenance Upgrade Version and Serial Number
1. Press
2. Select
The version number has the format
y L.
1:ABOUT
.
. The serial number
x.yy
appears on the line beneath the product ID number.
Inequality Graphing for the TI-83 Plus Page 46

Check Amount of Flash Application Free Space
1. Press y L.
2. Select
2:MEM MGMT/DEL...
The English only version of Inequality Graphing requires at least
16,535 bytes of ARC FREE to load the application. The
international version requires 33,070 bytes of ARC FREE to load
the application. For more information about memory and
memory management, refer to the TI-83 Plus guidebook.
The TI-83 Plus Guidebook is available in electronic format at
education.ti.com/guides
.
Inequality Graphing for the TI-83 Plus Page 47

Texas Instruments (TI) Support and Service Information
For general information
E-mail:
Phone:
ti-cares@ti.com
1-800-TI-CARES (1-800-842-2737)
For US, Canada, Mexico, Puerto Rico, and
Virgin Islands only
Home page:
education.ti.com
For technical questions
Phone
: 1-972-917-8324
For product (hardware) service
Customers in the US, Canada, Mexico, Puerto Rico, and Virgin
Islands:
Always contact TI Customer Support before
returning a product for service.
All other customers:
Refer to the leaflet enclosed with your
product (hardware) or contact your local TI
retailer/distributor.
Inequality Graphing for the TI-83 Plus Page 48

End-User License Agreement
Calculator Applications
IMPORTANT - Read this agreement (“Agreement”) carefully before installing the software program(s) and/or
calculator application(s). The software program(s) and/or calculator program(s) and any related
documentation (collectively referred to as the Program) are licensed, not sold, by Texas Instruments
Incorporated (TI) and/or any applicable licensors (collectively referred to as Licensor). By installing or
otherwise using the Program, you agree to be bound by the terms of this license. If the Program was
delivered to you on diskette(s) or CD and you do not agree with the terms of this license, return this package
with all its contents to the place of purchase for a full refund of any license fee paid. If the Program was
delivered to you over the Internet and you do not agree with the terms of this license do not install or use the
Program and contact TI for instructions on obtaining a refund of any license fee paid.
Specific details of the license granted depend upon the license fee you paid and are set forth below. For purposes of
this Agreement, a site (“Site”) consists of one entire physical campus of an educational institution accredited by an
association recognized by the U.S. Department of Education or the State Board of Education, or by their equivalents
in other countries. All additional terms of the Agreement apply regardless of the license granted.
SINGLE USER LICENSE
If you paid a license fee for a Single User License, Licensor grants to you a personal, non-exclusive, non-transferable
license to install and use the Program on a single computer and calculator. You may make one copy of the Program
for backup and archival purposes. You agree to reproduce all copyright and proprietary notices shown in the Program
and on the media. Unless otherwise expressly stated in the documentation, you may not duplicate such
documentation.
EDUCATIONAL MULTIPLE USER LICENSE
If you paid a license fee of an Educational Multiple User License, Licensor grants you a non-exclusive, nontransferable license to install and use the Program on the number of computers and calculators specified for the
license fee you paid. You may make one copy of the Program for backup and archival purposes. You agree to
reproduce all copyright and proprietary notices shown in the Program and on the media. Except as expressly stated
herein or in the documentation, you may not duplicate such documentation. In cases where TI supplies the related
documentation electronically you may print the same number of copies of the documentation as the number of
computers/calculators specified for the license fee you paid. All the computers and calculators on which the Program
is used must be located at a single Site. Each member of the institution faculty may also use a copy of the Program
on an additional computer/calculator for the sole purpose of preparing course materials.
EDUCATIONAL SITE LICENSE
If you paid a license fee for an Educational Site License, Licensor grants you a non-exclusive, non-transferable
license to install and use the Program on all institution, teacher, or student owned, leased or rented computers and
calculators located or used at the Site for which the Program is licensed. Teachers and students have the additional
right to use the Program while away from the Site. You may make one copy of the Program for backup and archival
purposes. You agree to reproduce all copyright and proprietary notices shown in the Program and on the media.
Except as expressly stated herein or in the documentation, you may not duplicate such documentation. In cases
Inequality Graphing for the TI-83 Plus Page 49

where TI supplies the related documentation electronically you may print one copy of such documentation for each
computer or calculator on which the Program is installed. Each member of the institution faculty may also use a copy
of the Program on an additional computer/calculator for the sole purpose of preparing course materials. Students
must be instructed to remove the Program from student owned computers and calculators upon the end of their
enrollment in the institution.
Additional Terms:
WARRANTY DISCLAIMER AND DAMAGES EXCLUSIONS AND LIMITATIONS
Licensor does not warrant that the Program will be free from errors or will meet your specific requirements. Any
statements made concerning the utility of the Program are not to be construed as express or implied warranties.
LICENSOR MAKES NO CONDITIONS OR WARRANTIES, EITHER EXPRESS OR IMPLIED, INCLUDING BUT
NOT LIMITED TO ANY IMPLIED CONDITIONS OR WARRANTIES OF MERCHANTABILITY, FITNESS FOR A
PARTICULAR PURPOSE, OR NON-INFRINGEMENT REGARDING THE PROGRAM AND MAKES THE
PROGRAM AVAILABLE ON AN "AS IS" BASIS.
Although no warranty is given for the Program, the media, if the Program was delivered to you on diskette(s) or CD,
will be replaced if found to be defective during the first ninety (90) days of use, when the package is returned postage
prepaid to TI. THIS PARAGRAPH EXPRESSES LICEN SOR'S MAXIMUM LIABILITY AND YOUR SOLE AND
EXCLUSIVE REMEDY FOR DEFECTIVE MEDIA.
LICENSOR SHALL NOT BE RESPONSIBLE FOR ANY DAMAGES CAUSED BY THE USE OF THE PROGRAM,
OR SUFFERED OR INCURRED BY YOU OR ANY OTHER PARTY INCLUDING BUT NOT LIMITED TO SPECIAL,
INDIRECT, INCIDENTAL OR CONSEQUENTIA L DAMAGES, EVEN IF LICENSOR HAS BEEN ADVISED OF THE
POSSIBILITY OF SUCH DAMAGES. IN JURISDICTIONS WHICH ALLOW TEXAS INSTRUMENTS TO LIMIT ITS
LIABILITY, TI’S LIABILITY IS LIMITED TO THE APPLICABLE LICENSE FEE PAID BY YOU.
Because some states or jurisdictions do not allow the exclusion or limitation of incidental or consequential damages
or limitation on how long an implied warranty lasts, the above limitations or exclusions may not apply to you.
GENERAL
This Agreement will immediately terminate if you fail to comply with its terms. Upon termination of this Agreement,
you agree to return or destroy the original package and all whole or partial copies of the Program in your possession
and so certify in writing to TI.
The export and re-export of United States original software and documentation is subject to the Export Administration
Act of 1969 as amended. Compliance with such regulations is your responsibility. You agree that you do not intend to
nor will you, directly or indirectly, export, re-export or transmit the Program or technical data to any country to which
such export, re-export or transmission is restricted by any applicable United States regulation or statute, without the
proper written consent or license, if required of the Bureau of Export Administration of the United States Department
of Commerce, or such other governmental entity as may have jurisdiction over such export, re-export or transmission.
Inequality Graphing for the TI-83 Plus Page 50

If the Program is provided to the U.S. Government pursuant to a solicitation issued on or after December 1, 1995, the
Program is provided with the commercial license rights and restrictions described elsewhere herein. If the Program is
provided to the U.S. Government pursuant to a solicitation issued prior to December 1, 1995, the Program is provided
with "Restricted Rights" as provided for in FAR, 48 CFR 52.227-14 (JUNE 1987) or DFAR, 48 CFR 252.227-7013
(OCT 1988), as applicable.
Manufacturer is Texas Instruments Incorporated, 7800 Banner Drive, M/S 3962, Dallas, Texas 75251.
Inequality Graphing for the TI-83 Plus Page 51

Page Reference
This PDF document contains electronic bookmarks designed for easy onscreen navigation. If you decide to print this document, please use the page
numbers below to find specific topics.
Important Information............................................................................................. 2
What is Inequality Graphing?................................................................................. 3
Where to Find Installation Instructions................................................................... 4
Getting Started.......................................................................................................5
Starting and Quitting the Inequality Graphing Application.................................... 11
A Word About AppVars........................................................................................ 13
Y= Editor and X=Editor.........................................................................................14
Graphing .............................................................................................................. 20
Window Settings .................................................................................................. 36
FnOn (Function On) and FnOff (Function Off) Commands................................. 37
System Integration............................................................................................... 38
Deleting Inequality Graphing from the TI-83 Plus................................................ 39
Inequality Graphing Warning and Error Messages..............................................40
Error Recovery Instructions.................................................................................. 44
Texas Instruments (TI) Support and Service Information.................................... 48
End-User License Agreement.............................................................................. 49
Inequality Graphing for the TI-83 Plus Page 52
 Loading...