

Page 1

DataSite Electronic Flow Meter and
Remote Terminal Unit
Catalog Numbers 1758-FLO301, 1758-FLO302, 1758RTU201, 1758-RTU202
Software User Manual FRN 1.30
Page 2
Important User Information
WARNING
IMPORTANT
ATTENTION
SHOCK HAZARD
BURN HAZARD
Solid state equipment has operational characteristics differing from those of electromechanical equipment. Safety Guidelines for the Application,
Installation and Maintenance of Solid State Controls (publication SGI-1.1
http://literature.rockwellautomation.com
) describes some important differences between solid state equipment and hard-wired electromechanical
devices. Because of this difference, and also because of the wide variety of uses for solid state equipment, all persons responsible for applying this
equipment must satisfy themselves that each intended application of this equipment is acceptable.
In no event will Rockwell Automation, Inc. be responsible or liable for indirect or consequential damages resulting from the use or application of this
equipment.
The examples and diagrams in this manual are included solely for illustrative purposes. Because of the many variables and requirements associated
with any particular installation, Rockwell Automation, Inc. cannot assume responsibility or liability for actual use based on the examples and
diagrams.
No patent liability is assumed by Rockwell Automation, Inc. with respect to use of information, circuits, equipment, or software described in this
manual.
Reproduction of the contents of this manual, in whole or in part, without written permission of Rockwell Automation, Inc., is prohibited.
Throughout this manual, when necessary, we use notes to make you aware of safety considerations.
available from your local Rockwell Automation sales office or online at
Identifies information about practices or circumstances that can cause an explosion in a hazardous environment, which may
lead to personal injury or death, property damage, or economic loss.
Identifies information that is critical for successful application and understanding of the product.
Identifies information about practices or circumstances that can lead to: personal injury or death, property damage, or
economic loss. Attentions help you identify a hazard, avoid a hazard, and recognize the consequence.
Labels may be on or inside the equipment, such as a drive or motor, to alert people that dangerous voltage may be present.
Labels may be on or inside the equipment, such as a drive or motor, to alert people that surfaces may reach dangerous
temperatures.
Allen-Bradley, Datasite, Rockwell Automation, and TechConnect are trademarks of R ockwell Automation, Inc.
Trademarks not belonging to Rockwell Automation are property of their respective companies.
Page 3

Preface
Read this preface to familiarize yourself with the rest of the manual. It provides
information concerning:
• who should use this manual
• the purpose of this manual
• related documentation
• conventions used in this manual
Who Should Use this
Use this manual if you are responsible for designing, installing, programming,
or troubleshooting control systems that use DataSite controllers.
Manual
You should have a basic understanding of electrical circuitry and familiarity
with relay logic. If you do not, obtain the proper training before using this
product.
Purpose of this Manual
Related Documentation
Related publications for DataSite controllers
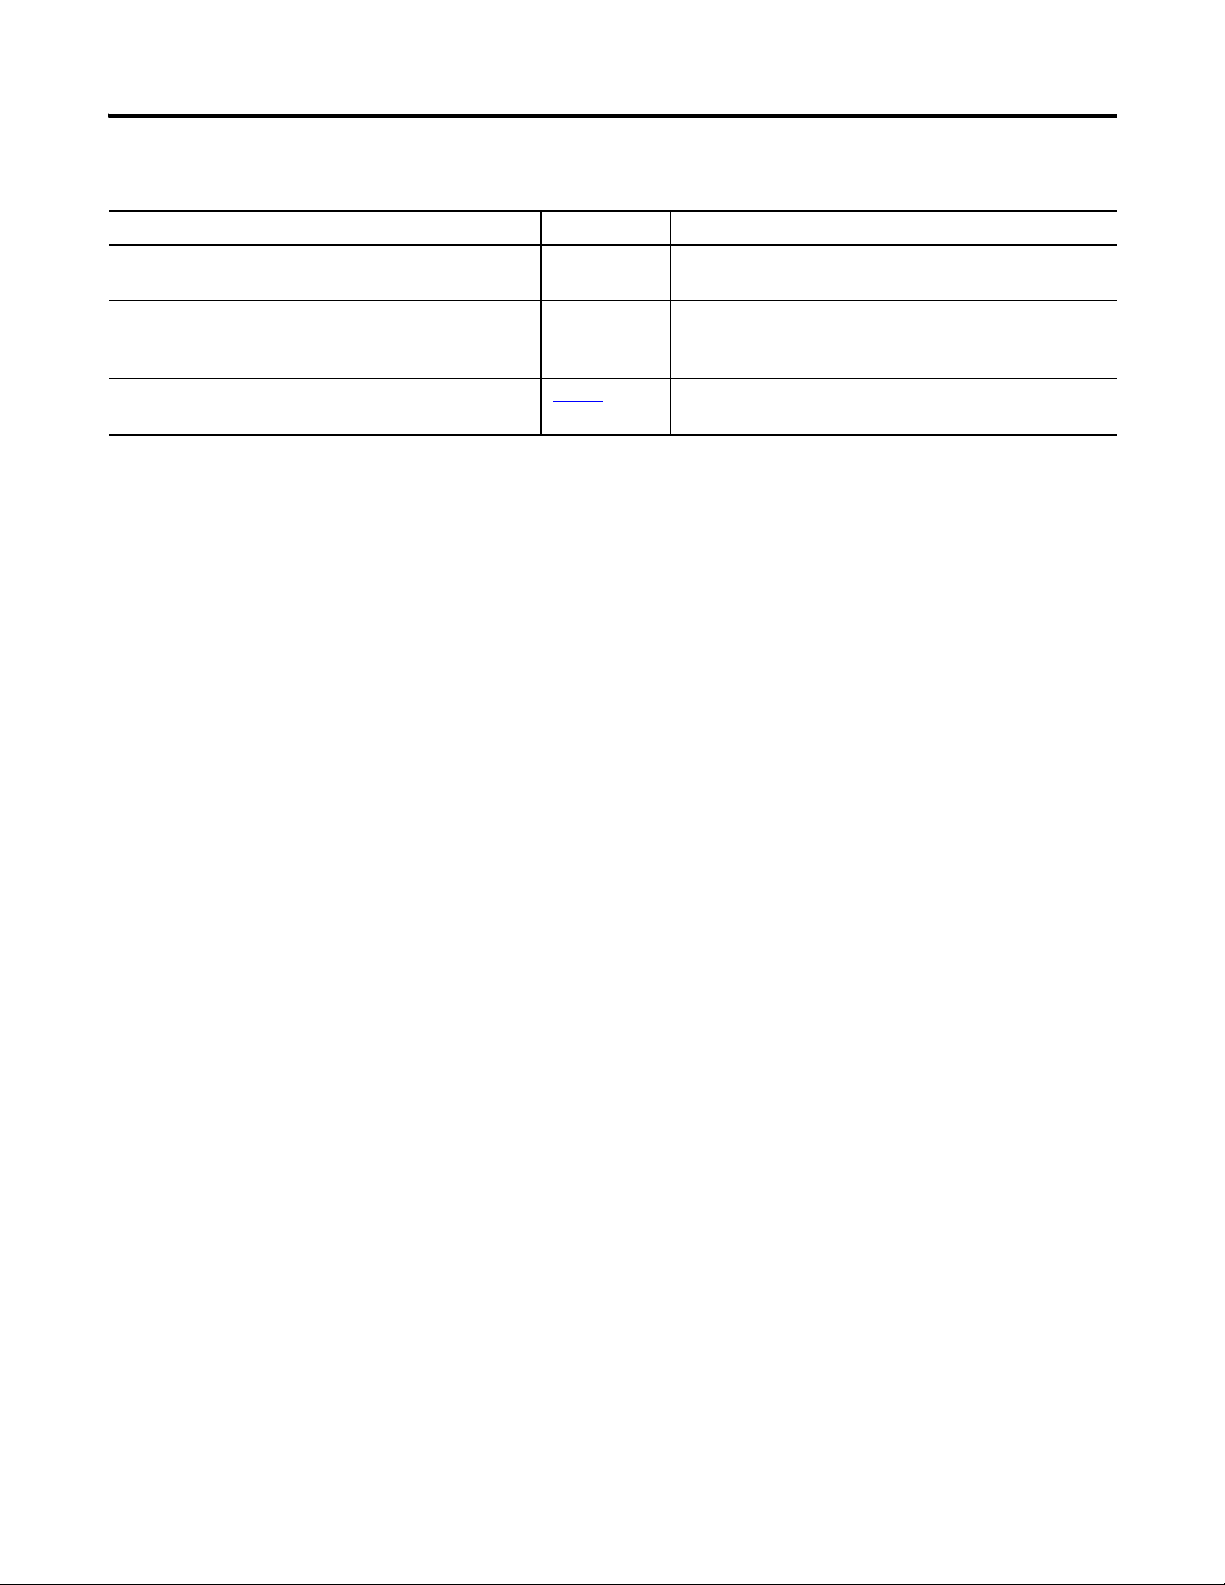
Pub. Title Pub. Number Description
DataSite Electronic Flow Meter and Remote Terminal Unit
Installation Instructions
DataSite Electronic Flow Meter and Remote Terminal Unit
Hardware User Manual
This manual is a reference guide for the software tools that accompany the
DataSite controller, namely DS Settings, DS FloConfig, and DS DNP3. These
tools can be used to configure and monitor the DataSite controller. This
manual describes the procedures you use to install and use the tools.
The publications listed in this table contain more information on the DataSite
controllers.
1758-IN001
1758-UM001
Information on how to install a DataSite controller.
Information on how to install and wire a DataSite controller.
Customized Function Blocks for DataSite Reference
Manual
DataSite Screen Builder user documentation available on
the DataSite CD and from http://www.isagraf.com
DataSite Workbench user documentation available on the
DataSite CD and from http://www.isagraf.com
Modbus Protocol Specifications available from
www.modbus.org
Allen-Bradley Programmable Controller Grounding and
Wiring Guidelines
Application Considerations for Solid-State Controls SGI-1.1
iii Publication 1758-UM002D-EN-P - October 2010
1758-RM001
— Information on using the DataSite Screen Builder to create
— Information on using the DataSite Workbench to develop
— Information about the Modbus protocol.
1770-4.1
Description of the customized function blocks used for
programming DataSite controllers using the DataSite
Workbench software.
graphical user interfaces.
multi-process control projects for use with DataSite
controllers.
In-depth information on grounding and wiring Allen-Bradley
programmable controllers.
A description of important differences between solid-state
programmable controller products and hard-wired
electromechanical devices.
Page 4
iv
Related publications for DataSite controllers (Continued)
Pub. Title Pub. Number Description
National Electrical Code - Published by the National Fire
Protection Association of Boston, MA.
Allen-Bradley Publication Index SD499 — A complete listing of current documentation, including
Allen-Bradley Industrial Automation Glossary AG-7.1
— An article on wire sizes and types for grounding electrical
equipment.
ordering instructions. Also indicates whether the
documents are available on CD-ROM or in multi-languages.
A glossary of industrial automation terms and
abbreviations.
Common Techniques Used in this Manual
The following conventions are used throughout this manual:
• Bulleted lists such as this one provide information, not procedural steps.
• Numbered lists provide sequential steps or hierarchical information.
• Italic type is used for emphasis.
Publication 1758-UM002D-EN-P - October 2010
Page 5

Preface
Who Should Use this Manual . . . . . . . . . . . . . . . . . . . . . . . . . . . . . . . . iii
Purpose of this Manual . . . . . . . . . . . . . . . . . . . . . . . . . . . . . . . . . . . . . iii
Related Documentation . . . . . . . . . . . . . . . . . . . . . . . . . . . . . . . . . . . . . iii
Common Techniques Used in this Manual. . . . . . . . . . . . . . . . . . . . . . iv
Table of Contents Chapter 1
DataSite Configuration Settings
Utility
(DS Settings)
Introduction . . . . . . . . . . . . . . . . . . . . . . . . . . . . . . . . . . . . . . . . . . . . . . 13
Hardware and Software Requirements . . . . . . . . . . . . . . . . . . . . . . . . . 14
Start DS Settings. . . . . . . . . . . . . . . . . . . . . . . . . . . . . . . . . . . . . . . . . . . 15
Create a New Project . . . . . . . . . . . . . . . . . . . . . . . . . . . . . . . . . . . . 16
Save a Project . . . . . . . . . . . . . . . . . . . . . . . . . . . . . . . . . . . . . . . . . . 16
Open a Project . . . . . . . . . . . . . . . . . . . . . . . . . . . . . . . . . . . . . . . . . 17
Close DS Settings. . . . . . . . . . . . . . . . . . . . . . . . . . . . . . . . . . . . . . . 17
Configure PC Communication Settings . . . . . . . . . . . . . . . . . . . . . . . . 18
Configure Controller Communication Settings . . . . . . . . . . . . . . . . . . 21
Configure Serial Port Settings . . . . . . . . . . . . . . . . . . . . . . . . . . . . . 22
Configure TCP/IP Settings. . . . . . . . . . . . . . . . . . . . . . . . . . . . . . . 25
Register IP Settings . . . . . . . . . . . . . . . . . . . . . . . . . . . . . . . . . . . . . 26
Lower the Power Consumption . . . . . . . . . . . . . . . . . . . . . . . . . . . 27
Display the Default Settings . . . . . . . . . . . . . . . . . . . . . . . . . . . . . . 28
Save the Controller Communication Settings. . . . . . . . . . . . . . . . . 29
Load the Controller Communication Settings . . . . . . . . . . . . . . . . 30
Upload the Controller Communication Settings from the Controller
31
Download the Controller Communication Settings to the Controller
32
Display the Device Information . . . . . . . . . . . . . . . . . . . . . . . . . . . 34
Close the Controller Communication Settings dialog box. . . . . . . 34
Settings. . . . . . . . . . . . . . . . . . . . . . . . . . . . . . . . . . . . . . . . . . . . . . . . . . 35
Understand the Scan Blocks . . . . . . . . . . . . . . . . . . . . . . . . . . . . . . 35
Open the Scan Settings Dialog Box . . . . . . . . . . . . . . . . . . . . . . . . 40
Edit a Scan Block. . . . . . . . . . . . . . . . . . . . . . . . . . . . . . . . . . . . . . . 41
Insert a Scan Block . . . . . . . . . . . . . . . . . . . . . . . . . . . . . . . . . . . . . 42
Delete a Scan Block . . . . . . . . . . . . . . . . . . . . . . . . . . . . . . . . . . . . . 42
Copy a Scan Block . . . . . . . . . . . . . . . . . . . . . . . . . . . . . . . . . . . . . . 43
Paste a Scan Block . . . . . . . . . . . . . . . . . . . . . . . . . . . . . . . . . . . . . . 43
Paste a Scan Block to Multiple Rows . . . . . . . . . . . . . . . . . . . . . . . 45
Use the Shortcut Menu . . . . . . . . . . . . . . . . . . . . . . . . . . . . . . . . . . 48
Load the Scan Settings. . . . . . . . . . . . . . . . . . . . . . . . . . . . . . . . . . . 48
Save the Scan Settings . . . . . . . . . . . . . . . . . . . . . . . . . . . . . . . . . . . 49
Upload the Scan Settings from the Controller . . . . . . . . . . . . . . . . 49
Download the Scan Settings to the Controller. . . . . . . . . . . . . . . . 49
Clear the Error Count . . . . . . . . . . . . . . . . . . . . . . . . . . . . . . . . . . . 49
Close the Scan Settings Dialog Box . . . . . . . . . . . . . . . . . . . . . . . . 49
Configuration Example . . . . . . . . . . . . . . . . . . . . . . . . . . . . . . . . . . . . . 50
Configure HART Settings . . . . . . . . . . . . . . . . . . . . . . . . . . . . . . . . . . . 55
Table of Contents
5 Publication 1758-UM002D-EN-P - October 2010
Page 6

6 Table of Contents
Open the HART Settings Dialog Box . . . . . . . . . . . . . . . . . . . . . . 55
Understand HART Commands . . . . . . . . . . . . . . . . . . . . . . . . . . . 57
Insert a HART Scan Block . . . . . . . . . . . . . . . . . . . . . . . . . . . . . . . 68
Edit a HART Scan Block . . . . . . . . . . . . . . . . . . . . . . . . . . . . . . . . 69
Delete a HART Scan Block. . . . . . . . . . . . . . . . . . . . . . . . . . . . . . . 71
Copy a HART Scan Block. . . . . . . . . . . . . . . . . . . . . . . . . . . . . . . . 71
Paste a HART Scan Block. . . . . . . . . . . . . . . . . . . . . . . . . . . . . . . . 71
Paste a HART Scan Block to Multiple Rows . . . . . . . . . . . . . . . . . 73
Use the Shortcut Menu . . . . . . . . . . . . . . . . . . . . . . . . . . . . . . . . . . 73
Load the HART Settings . . . . . . . . . . . . . . . . . . . . . . . . . . . . . . . . . 74
Save the HART Settings . . . . . . . . . . . . . . . . . . . . . . . . . . . . . . . . . 74
Upload the HART Settings from the Controller . . . . . . . . . . . . . . 75
Download the HART Settings to the Controller . . . . . . . . . . . . . . 75
Clear the Error Count . . . . . . . . . . . . . . . . . . . . . . . . . . . . . . . . . . . 75
Close the HART Settings Dialog Box . . . . . . . . . . . . . . . . . . . . . . 75
Configure Event Settings . . . . . . . . . . . . . . . . . . . . . . . . . . . . . . . . . . . . 76
Event Examples. . . . . . . . . . . . . . . . . . . . . . . . . . . . . . . . . . . . . . . . 77
Configure a System Event . . . . . . . . . . . . . . . . . . . . . . . . . . . . . . . . 79
Configure an Alarm Event . . . . . . . . . . . . . . . . . . . . . . . . . . . . . . . 80
Configure a Calendar Event . . . . . . . . . . . . . . . . . . . . . . . . . . . . . . 80
Configure a Time Event . . . . . . . . . . . . . . . . . . . . . . . . . . . . . . . . . 81
Upload Event Settings from the Controller . . . . . . . . . . . . . . . . . . 81
Download Event Settings from the Controller . . . . . . . . . . . . . . . 81
Save the Event Settings . . . . . . . . . . . . . . . . . . . . . . . . . . . . . . . . . . 82
Load the Event Settings . . . . . . . . . . . . . . . . . . . . . . . . . . . . . . . . . 82
Close the Event Settings Dialog Box . . . . . . . . . . . . . . . . . . . . . . . 82
Debug the Controller Programs . . . . . . . . . . . . . . . . . . . . . . . . . . . . . . 83
Open the Controller Debug Dialog Box . . . . . . . . . . . . . . . . . . . . 83
Toggle between Online and Offline Debugging . . . . . . . . . . . . . . 84
Set the Scan Time for the Online Debugging Mode . . . . . . . . . . . 85
Add a Register Group . . . . . . . . . . . . . . . . . . . . . . . . . . . . . . . . . . . 85
Delete a Register Group . . . . . . . . . . . . . . . . . . . . . . . . . . . . . . . . . 86
Rename a Register Group . . . . . . . . . . . . . . . . . . . . . . . . . . . . . . . . 86
Add Registers . . . . . . . . . . . . . . . . . . . . . . . . . . . . . . . . . . . . . . . . . . 86
Edit a Register . . . . . . . . . . . . . . . . . . . . . . . . . . . . . . . . . . . . . . . . . 88
Delete a Register . . . . . . . . . . . . . . . . . . . . . . . . . . . . . . . . . . . . . . . 88
Read the Controller-Run Parameters . . . . . . . . . . . . . . . . . . . . . . . 89
Clear Error Codes . . . . . . . . . . . . . . . . . . . . . . . . . . . . . . . . . . . . . . 90
Adjust the System Time. . . . . . . . . . . . . . . . . . . . . . . . . . . . . . . . . . 91
Close the Controller Debug Dialog Box . . . . . . . . . . . . . . . . . . . . 91
Initialize the Controller . . . . . . . . . . . . . . . . . . . . . . . . . . . . . . . . . . . . . 92
Open the Controller Initialize Dialog Box . . . . . . . . . . . . . . . . . . . 92
Switch Controller into Service Mode . . . . . . . . . . . . . . . . . . . . . . . 92
Initialize DataSite Workbench . . . . . . . . . . . . . . . . . . . . . . . . . . . . 94
Reset the Controller Communication Parameters . . . . . . . . . . . . . 94
Reset the Register Values. . . . . . . . . . . . . . . . . . . . . . . . . . . . . . . . . 95
Publication 1758-UM002D-EN-P - October 2010
Page 7

DataSite Flow Configuration
Utility
(DS FloConfig)
Table of Contents 7
Reset the DNP3 Parameters . . . . . . . . . . . . . . . . . . . . . . . . . . . . . . 95
Test the Communication. . . . . . . . . . . . . . . . . . . . . . . . . . . . . . . . . 96
Initialize the File System . . . . . . . . . . . . . . . . . . . . . . . . . . . . . . . . . 99
Display System Information . . . . . . . . . . . . . . . . . . . . . . . . . . . . . 101
Clear the Status Messages . . . . . . . . . . . . . . . . . . . . . . . . . . . . . . . 102
Allocate Registers . . . . . . . . . . . . . . . . . . . . . . . . . . . . . . . . . . . . . . . . . 103
Read and Write Registers. . . . . . . . . . . . . . . . . . . . . . . . . . . . . . . . 103
Modbus Register for Signals . . . . . . . . . . . . . . . . . . . . . . . . . . . . . 104
Chapter 2
Introduction . . . . . . . . . . . . . . . . . . . . . . . . . . . . . . . . . . . . . . . . . . . . . 107
Hardware and Software Requirements . . . . . . . . . . . . . . . . . . . . . . . . 107
Start DS FloConfig. . . . . . . . . . . . . . . . . . . . . . . . . . . . . . . . . . . . . . . . 108
Create a New Project File . . . . . . . . . . . . . . . . . . . . . . . . . . . . . . . 108
Open a Project File . . . . . . . . . . . . . . . . . . . . . . . . . . . . . . . . . . . . 110
Open a Recent Project File . . . . . . . . . . . . . . . . . . . . . . . . . . . . . . 111
Close DS FloConfig. . . . . . . . . . . . . . . . . . . . . . . . . . . . . . . . . . . . 111
Configure PC Communication Settings . . . . . . . . . . . . . . . . . . . . . . . 112
Open the PC Communication Dialog Box. . . . . . . . . . . . . . . . . . 112
Set Up PC Communication. . . . . . . . . . . . . . . . . . . . . . . . . . . . . . 112
Configure FLO Communication Settings. . . . . . . . . . . . . . . . . . . . . . 115
Open the FLO Communication Dialog Box . . . . . . . . . . . . . . . . 115
Configure Serial Port Settings . . . . . . . . . . . . . . . . . . . . . . . . . . . . 116
Configure TCP/IP Settings. . . . . . . . . . . . . . . . . . . . . . . . . . . . . . 118
Lower Power Consumption . . . . . . . . . . . . . . . . . . . . . . . . . . . . . 119
Set the Resource Number (Optional) . . . . . . . . . . . . . . . . . . . . . . 119
Change the Communication Password. . . . . . . . . . . . . . . . . . . . . 120
Configure FLO RTC Settings . . . . . . . . . . . . . . . . . . . . . . . . . . . . . . . 121
Open the FLO RTC Dialog Box . . . . . . . . . . . . . . . . . . . . . . . . . 121
Read the Real-Time Clock. . . . . . . . . . . . . . . . . . . . . . . . . . . . . . . 121
Calibrate the Real-Time Clock (RTC). . . . . . . . . . . . . . . . . . . . . . 122
Set the Contract Time . . . . . . . . . . . . . . . . . . . . . . . . . . . . . . . . . . 123
Record Flow Results for a Meter Run. . . . . . . . . . . . . . . . . . . . . . . . . 124
Display the Flow Results of a Meter Run. . . . . . . . . . . . . . . . . . . 124
Perform a Flow Calculation Test . . . . . . . . . . . . . . . . . . . . . . . . . 131
Display the Field Parameters of a Meter Run. . . . . . . . . . . . . . . . 132
Select the Measurement System . . . . . . . . . . . . . . . . . . . . . . . . . . 134
Enable a Meter Channel and Its Accumulation Calculation . . . . 135
Set the Flow Rate Calculation Interval . . . . . . . . . . . . . . . . . . . . . 136
Select the Gas Flow Calculation Standard (AGA3/AGA7) . . . . 136
Configure AGA3 Process Parameters . . . . . . . . . . . . . . . . . . . . . 137
Configure AGA7 Process Parameters . . . . . . . . . . . . . . . . . . . . . 139
Configure Field Signal Parameters for the AGA3 Standard . . . . 140
Configure Field Signal Parameters for the AGA7 Standard . . . . 143
Select an AGA8 Method . . . . . . . . . . . . . . . . . . . . . . . . . . . . . . . . 144
Acquire the Gas Component Parameter values . . . . . . . . . . . . . . 149
Publication 1758-UM002D-EN-P - October 2010
Page 8

8 Table of Contents
Configure the Historical Records . . . . . . . . . . . . . . . . . . . . . . . . . . . . 151
Configure the Daily Historical Records . . . . . . . . . . . . . . . . . . . . 152
Configure the Hourly Historical Records. . . . . . . . . . . . . . . . . . . 154
Load the Configuration from the PC . . . . . . . . . . . . . . . . . . . . . . 156
Save the Configuration to the PC . . . . . . . . . . . . . . . . . . . . . . . . . 156
Upload the Configuration from the Controller . . . . . . . . . . . . . . 156
Download the Configuration to the Controller . . . . . . . . . . . . . . 157
View Historical Records . . . . . . . . . . . . . . . . . . . . . . . . . . . . . . . . . . . 157
Sort Historical Records . . . . . . . . . . . . . . . . . . . . . . . . . . . . . . . . . 160
Configure Alarm Events . . . . . . . . . . . . . . . . . . . . . . . . . . . . . . . . . . . 161
Open the Alarm Config dialog box . . . . . . . . . . . . . . . . . . . . . . . 161
Enable an Alarm Configuration . . . . . . . . . . . . . . . . . . . . . . . . . . 163
Insert an Alarm Configuration . . . . . . . . . . . . . . . . . . . . . . . . . . . 164
Disable an Alarm Configuration . . . . . . . . . . . . . . . . . . . . . . . . . . 166
Delete an Alarm Configuration. . . . . . . . . . . . . . . . . . . . . . . . . . . 167
Load Alarm Configurations. . . . . . . . . . . . . . . . . . . . . . . . . . . . . . 167
Save Alarm Configurations . . . . . . . . . . . . . . . . . . . . . . . . . . . . . . 167
Upload Alarm Configurations. . . . . . . . . . . . . . . . . . . . . . . . . . . . 168
Download Alarm Configurations . . . . . . . . . . . . . . . . . . . . . . . . . 168
View Alarm Event Records . . . . . . . . . . . . . . . . . . . . . . . . . . . . . . . . . 169
Sort Alarm Event Records . . . . . . . . . . . . . . . . . . . . . . . . . . . . . . 171
Understand the Alarm Record Format. . . . . . . . . . . . . . . . . . . . . 172
View Event Records. . . . . . . . . . . . . . . . . . . . . . . . . . . . . . . . . . . . . . . 173
Sort Event Records . . . . . . . . . . . . . . . . . . . . . . . . . . . . . . . . . . . . 175
Understand the Event Record Format . . . . . . . . . . . . . . . . . . . . . 176
Calibrate the Meter Sensor. . . . . . . . . . . . . . . . . . . . . . . . . . . . . . . . . . 180
Open the Force Signals dialog box . . . . . . . . . . . . . . . . . . . . . . . . 180
Set Forced Values for Field Signals. . . . . . . . . . . . . . . . . . . . . . . . 180
Calibrate the Sensors . . . . . . . . . . . . . . . . . . . . . . . . . . . . . . . . . . . 183
Complete the Calibration. . . . . . . . . . . . . . . . . . . . . . . . . . . . . . . . 184
Initialize the Controller . . . . . . . . . . . . . . . . . . . . . . . . . . . . . . . . . . . . 185
Open the Controller Initialization dialog box . . . . . . . . . . . . . . . 185
Switch Controller into Service Mode . . . . . . . . . . . . . . . . . . . . . . 185
Reset the Communication Parameters . . . . . . . . . . . . . . . . . . . . . 189
Reset the Register Values. . . . . . . . . . . . . . . . . . . . . . . . . . . . . . . . 190
Reset the AGA Flow Parameters . . . . . . . . . . . . . . . . . . . . . . . . . 190
Rebuild the AGA Files . . . . . . . . . . . . . . . . . . . . . . . . . . . . . . . . . 193
Delete the DataSite Workbench Program . . . . . . . . . . . . . . . . . . 193
Clear the DNP3 Parameters . . . . . . . . . . . . . . . . . . . . . . . . . . . . . 193
Initialize the File System . . . . . . . . . . . . . . . . . . . . . . . . . . . . . . . . 194
Display System Information . . . . . . . . . . . . . . . . . . . . . . . . . . . . . 195
Clear Status Message . . . . . . . . . . . . . . . . . . . . . . . . . . . . . . . . . . . 195
Configure the Scan Settings . . . . . . . . . . . . . . . . . . . . . . . . . . . . . . . . . 196
Understand the Scan Blocks . . . . . . . . . . . . . . . . . . . . . . . . . . . . . 196
Open the Scan Settings Dialog Box . . . . . . . . . . . . . . . . . . . . . . . 200
Edit a Scan Block. . . . . . . . . . . . . . . . . . . . . . . . . . . . . . . . . . . . . . 201
Publication 1758-UM002D-EN-P - October 2010
Page 9

Table of Contents 9
Insert a Scan Block . . . . . . . . . . . . . . . . . . . . . . . . . . . . . . . . . . . . 202
Delete a Scan Block . . . . . . . . . . . . . . . . . . . . . . . . . . . . . . . . . . . . 202
Copy a Scan Block . . . . . . . . . . . . . . . . . . . . . . . . . . . . . . . . . . . . . 203
Paste a Scan Block . . . . . . . . . . . . . . . . . . . . . . . . . . . . . . . . . . . . . 203
Paste a Scan Block to Multiple Rows . . . . . . . . . . . . . . . . . . . . . . 205
Use the Shortcut Menu . . . . . . . . . . . . . . . . . . . . . . . . . . . . . . . . . 208
Load the Scan Settings. . . . . . . . . . . . . . . . . . . . . . . . . . . . . . . . . . 208
Save the Scan Settings . . . . . . . . . . . . . . . . . . . . . . . . . . . . . . . . . . 209
Upload the Scan Settings from the Controller . . . . . . . . . . . . . . . 209
Download the Scan Settings to the Controller. . . . . . . . . . . . . . . 209
Clear the Error Count . . . . . . . . . . . . . . . . . . . . . . . . . . . . . . . . . . 209
Close the Scan Settings Dialog Box . . . . . . . . . . . . . . . . . . . . . . . 209
Configure HART Inputs . . . . . . . . . . . . . . . . . . . . . . . . . . . . . . . . . . . 210
Open the HART Dialog Box . . . . . . . . . . . . . . . . . . . . . . . . . . . . 210
Understand HART Commands . . . . . . . . . . . . . . . . . . . . . . . . . . 212
Insert a HART Scan Block . . . . . . . . . . . . . . . . . . . . . . . . . . . . . . 223
Edit a HART Scan Block . . . . . . . . . . . . . . . . . . . . . . . . . . . . . . . 224
Delete a HART Scan Block. . . . . . . . . . . . . . . . . . . . . . . . . . . . . . 226
Copy a HART Scan Block. . . . . . . . . . . . . . . . . . . . . . . . . . . . . . . 226
Paste a HART Scan Block. . . . . . . . . . . . . . . . . . . . . . . . . . . . . . . 226
Paste a HART Scan Block to Multiple Rows . . . . . . . . . . . . . . . . 228
Use the Shortcut Menu . . . . . . . . . . . . . . . . . . . . . . . . . . . . . . . . . 229
Load the HART Settings . . . . . . . . . . . . . . . . . . . . . . . . . . . . . . . . 230
Save HART Settings . . . . . . . . . . . . . . . . . . . . . . . . . . . . . . . . . . . 230
Upload the HART Settings from the Controller . . . . . . . . . . . . . 230
Download the HART Settings to the Controller . . . . . . . . . . . . . 230
Clear the Error Count . . . . . . . . . . . . . . . . . . . . . . . . . . . . . . . . . . 231
DataSite DNP3 Configuration
Utility
(DS DNP3)
Chapter 3
Introduction . . . . . . . . . . . . . . . . . . . . . . . . . . . . . . . . . . . . . . . . . . . . . 233
DNP3 Features . . . . . . . . . . . . . . . . . . . . . . . . . . . . . . . . . . . . . . . 233
DNP3 Protocol Structure . . . . . . . . . . . . . . . . . . . . . . . . . . . . . . . 235
DNP3 Data Object Library. . . . . . . . . . . . . . . . . . . . . . . . . . . . . . 235
DNP3 Class Objects . . . . . . . . . . . . . . . . . . . . . . . . . . . . . . . . . . . 236
DNP3 Internal Indication (IIN) Sign . . . . . . . . . . . . . . . . . . . . . . 236
SDNP3 . . . . . . . . . . . . . . . . . . . . . . . . . . . . . . . . . . . . . . . . . . . . . . . . . 237
SDNP3 Network Structure . . . . . . . . . . . . . . . . . . . . . . . . . . . . . . 237
SDNP3 Data Scan Mode. . . . . . . . . . . . . . . . . . . . . . . . . . . . . . . . 239
SDNP3 Channel and Session . . . . . . . . . . . . . . . . . . . . . . . . . . . . 239
SDNP3 Data Objects . . . . . . . . . . . . . . . . . . . . . . . . . . . . . . . . . . 241
SDNP3 Data Points and Database . . . . . . . . . . . . . . . . . . . . . . . . 242
SDNP3 Session I/O Points . . . . . . . . . . . . . . . . . . . . . . . . . . . . . 243
Start DS DNP3. . . . . . . . . . . . . . . . . . . . . . . . . . . . . . . . . . . . . . . . . . . 244
Configure PC Communication Settings . . . . . . . . . . . . . . . . . . . . . . . 245
Configure the PC Communication . . . . . . . . . . . . . . . . . . . . . . . . 245
Configure DS DNP3 . . . . . . . . . . . . . . . . . . . . . . . . . . . . . . . . . . . . . . 248
Publication 1758-UM002D-EN-P - October 2010
Page 10

10 Table of Contents
Extension Modbus Protocol for
DataSite Controllers (1758-FLO)
Configure the DS DNP3 Database. . . . . . . . . . . . . . . . . . . . . . . . 248
Configure a DS DNP3 Channel . . . . . . . . . . . . . . . . . . . . . . . . . . 252
Download the Configuration file . . . . . . . . . . . . . . . . . . . . . . . . . 256
Upload the Configuration file . . . . . . . . . . . . . . . . . . . . . . . . . . . . 257
Save the Configuration file . . . . . . . . . . . . . . . . . . . . . . . . . . . . . . 257
Operation and Data Validation Example . . . . . . . . . . . . . . . . . . . . . . 258
Example . . . . . . . . . . . . . . . . . . . . . . . . . . . . . . . . . . . . . . . . . . . . . 258
Chapter 4
Modbus Register Definition . . . . . . . . . . . . . . . . . . . . . . . . . . . . . . . . 267
Modbus Register Range. . . . . . . . . . . . . . . . . . . . . . . . . . . . . . . . . 268
Modbus Registers for Physical I/O Hardware. . . . . . . . . . . . . . . 269
Modbus Registers used by the 1758-FLO Controllers . . . . . . . . 270
Modbus Registers for Contract Time . . . . . . . . . . . . . . . . . . . . . . 276
Modbus Registers for the Power Shutdown Time. . . . . . . . . . . . 277
Modbus Registers for Reading Gas Component Parameters . . . 277
Addresses Associated with the Extension Modbus Protocol Commands
281
Pass Code for User . . . . . . . . . . . . . . . . . . . . . . . . . . . . . . . . . . . . 281
Command List . . . . . . . . . . . . . . . . . . . . . . . . . . . . . . . . . . . . . . . . 282
Command Number 1: Correct the System Time . . . . . . . . . . . . . 283
Command Number 2: Set the Pass Code . . . . . . . . . . . . . . . . . . . 284
Command Number 3: Set the Device Name . . . . . . . . . . . . . . . . 285
Command Number 4: Read the Device Name . . . . . . . . . . . . . . 285
Command Number 5: Disable/Enable the Flow Calculation. . . 286
Command Number 6: Read the Disable/Enable Flow Calculation
Setting. . . . . . . . . . . . . . . . . . . . . . . . . . . . . . . . . . . . . . . . . . . . . . . 287
Command Number 7: Set the Transaction (Contract) Time. . . . 288
Command Number 8: Read the Transaction (Contract) Time . . 288
Command Number 9: Set Up the Input Signal Test . . . . . . . . . . 289
Command Number 10: Read the Input Signal Test. . . . . . . . . . . 290
Command Number 11: Disable/Enable the Accumulation
Calculation . . . . . . . . . . . . . . . . . . . . . . . . . . . . . . . . . . . . . . . . . . . 291
Command Number 12: Read Disable/Enable Setting for
Accumulation Calculation . . . . . . . . . . . . . . . . . . . . . . . . . . . . . . . 292
Command Number 13: Set the Input Parameters . . . . . . . . . . . . 292
Command Number 14: Read the Input Parameters . . . . . . . . . . 294
Command Number 15: Set the Alarm Range of Input Parameters .
295
Command Number 16: Read the Alarm Range of Input Parameters
297
Command Number 17: Set Up the Calculation Input Parameters . .
298
Command Number 18: Read the Calculation Input Parameter . 301
Command Number 19: Set Up the Gas Component Parameter. 303
Command Number 20: Read the Gas Component Parameter . . 307
Publication 1758-UM002D-EN-P - October 2010
Page 11

Enron Modbus Protocol for the
1758-FLO DataSite Controller
Table of Contents 11
Command Number 21: Reset Accumulation . . . . . . . . . . . . . . . . 308
Command Number 22: Get Daily History. . . . . . . . . . . . . . . . . . 309
Command Number 23: Get Hourly History . . . . . . . . . . . . . . . . 311
Command Number 24: Read Alarm Logs . . . . . . . . . . . . . . . . . . 313
Command Number 25: Read New Alarm Logs. . . . . . . . . . . . . . 314
Command Number 26: Read Event Logs . . . . . . . . . . . . . . . . . . 315
Command Number 27: Read New Event Logs . . . . . . . . . . . . . . 317
Command Number 28: Disable/Enable the Automatic Components
Analysis Instrument . . . . . . . . . . . . . . . . . . . . . . . . . . . . . . . . . . . . 318
Command Number 29: Read the Flag of Getting Gas Component
Parameters from the Gas Component Analyzer . . . . . . . . . . . . . 319
Command Number 30: Acknowledge Alarms . . . . . . . . . . . . . . . 319
Command Number 31: Acknowledge Events . . . . . . . . . . . . . . . 320
Chapter 5
Register Addresses . . . . . . . . . . . . . . . . . . . . . . . . . . . . . . . . . . . . . . . . 324
1758-FLO DataSite Variables . . . . . . . . . . . . . . . . . . . . . . . . . . . . . . . 324
Information Variables . . . . . . . . . . . . . . . . . . . . . . . . . . . . . . . . . . . . . 325
Short Integer Variables . . . . . . . . . . . . . . . . . . . . . . . . . . . . . . . . . 325
Long Integer Variables . . . . . . . . . . . . . . . . . . . . . . . . . . . . . . . . . 329
Floating Point Variables . . . . . . . . . . . . . . . . . . . . . . . . . . . . . . . . 329
Hourly and Daily History . . . . . . . . . . . . . . . . . . . . . . . . . . . . . . . 337
Event and Alarm Logs. . . . . . . . . . . . . . . . . . . . . . . . . . . . . . . . . . 339
Global Event Codes for Modbus
Protocols
Chapter 6
Global Event Codes. . . . . . . . . . . . . . . . . . . . . . . . . . . . . . . . . . . . . . . 343
Publication 1758-UM002D-EN-P - October 2010
Page 12

12 Table of Contents
Publication 1758-UM002D-EN-P - October 2010
Page 13

Chapter
IMPORTANT
DataSite Configuration Settings Utility (DS Settings)
This chapter provides information on the configuration settings utility,
DS Settings.
Use this tool to configure the 1758-RTU DataSite
controllers only.
1
Introduction
DS Settings is a configuration software for 1758-RTU DataSite controllers.
DS Settings provides the following functions:
• PC Communication Settings
This function lets you set up the communication mode and parameters
for the DataSite controller to be connected to the PC via the serial port
or the Ethernet (TCP/IP) port.
• Controller Communication Settings
This function lets you set up the controller parameters, such as serial
port parameters or Ethernet parameters, and low-power settings.
• Scan Settings
This function lets you configure Modbus master serial messages to
Modbus slave devices.
• Event Settings
This function lets you configure four types of real-time clock (RTC)
interruption events, namely system events, alarm events, calendar events
and time events.
13 Publication 1758-UM002D-EN-P - October 2010
• Controller Debug
This function lets you use test registers and retrieve data from the
DataSite controller for online or offline debugging of the user programs
you have written for the controller in DataSite Workbench.
• Controller Initialize
Page 14

14 DataSite Configuration Settings Utility (DS Settings)
This function lets you initialize the DataSite controller back to factory
defaults.
• HART Settings
This function lets you configure and send HART commands.
Hardware and Software Requirements
To install DS Settings, you need the following:
• an IBM-compatible PC with at least a 80486 microprocessor
(Pentium-166 and above),
• a CD-ROM drive,
• at least 70 MB of free hard disk space,
• at least 32 MB of memory (64 MB recommended),
• a VGA graphic card, and
• Windows NT 4.0, Windows 2000, or Windows XP Professional.
Publication 1758-UM002D-EN-P - October 2010
Page 15
DataSite Configuration Settings Utility (DS Settings) 15
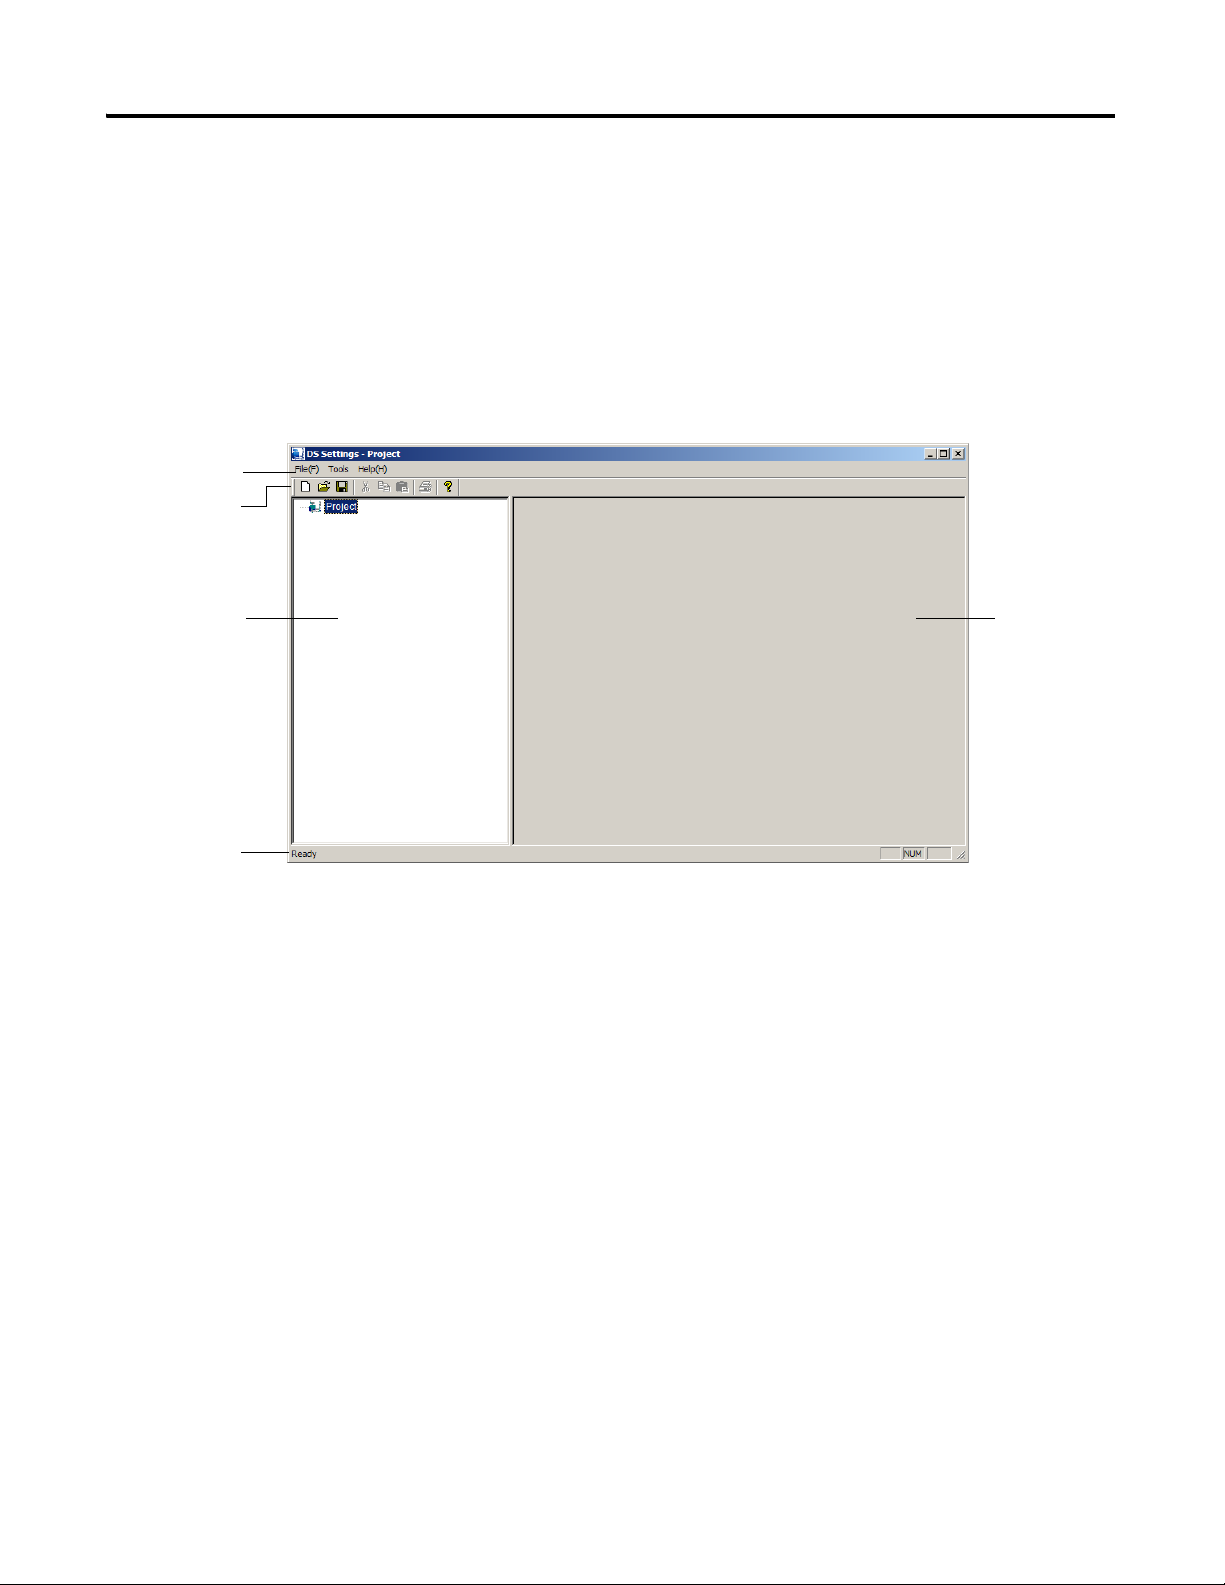
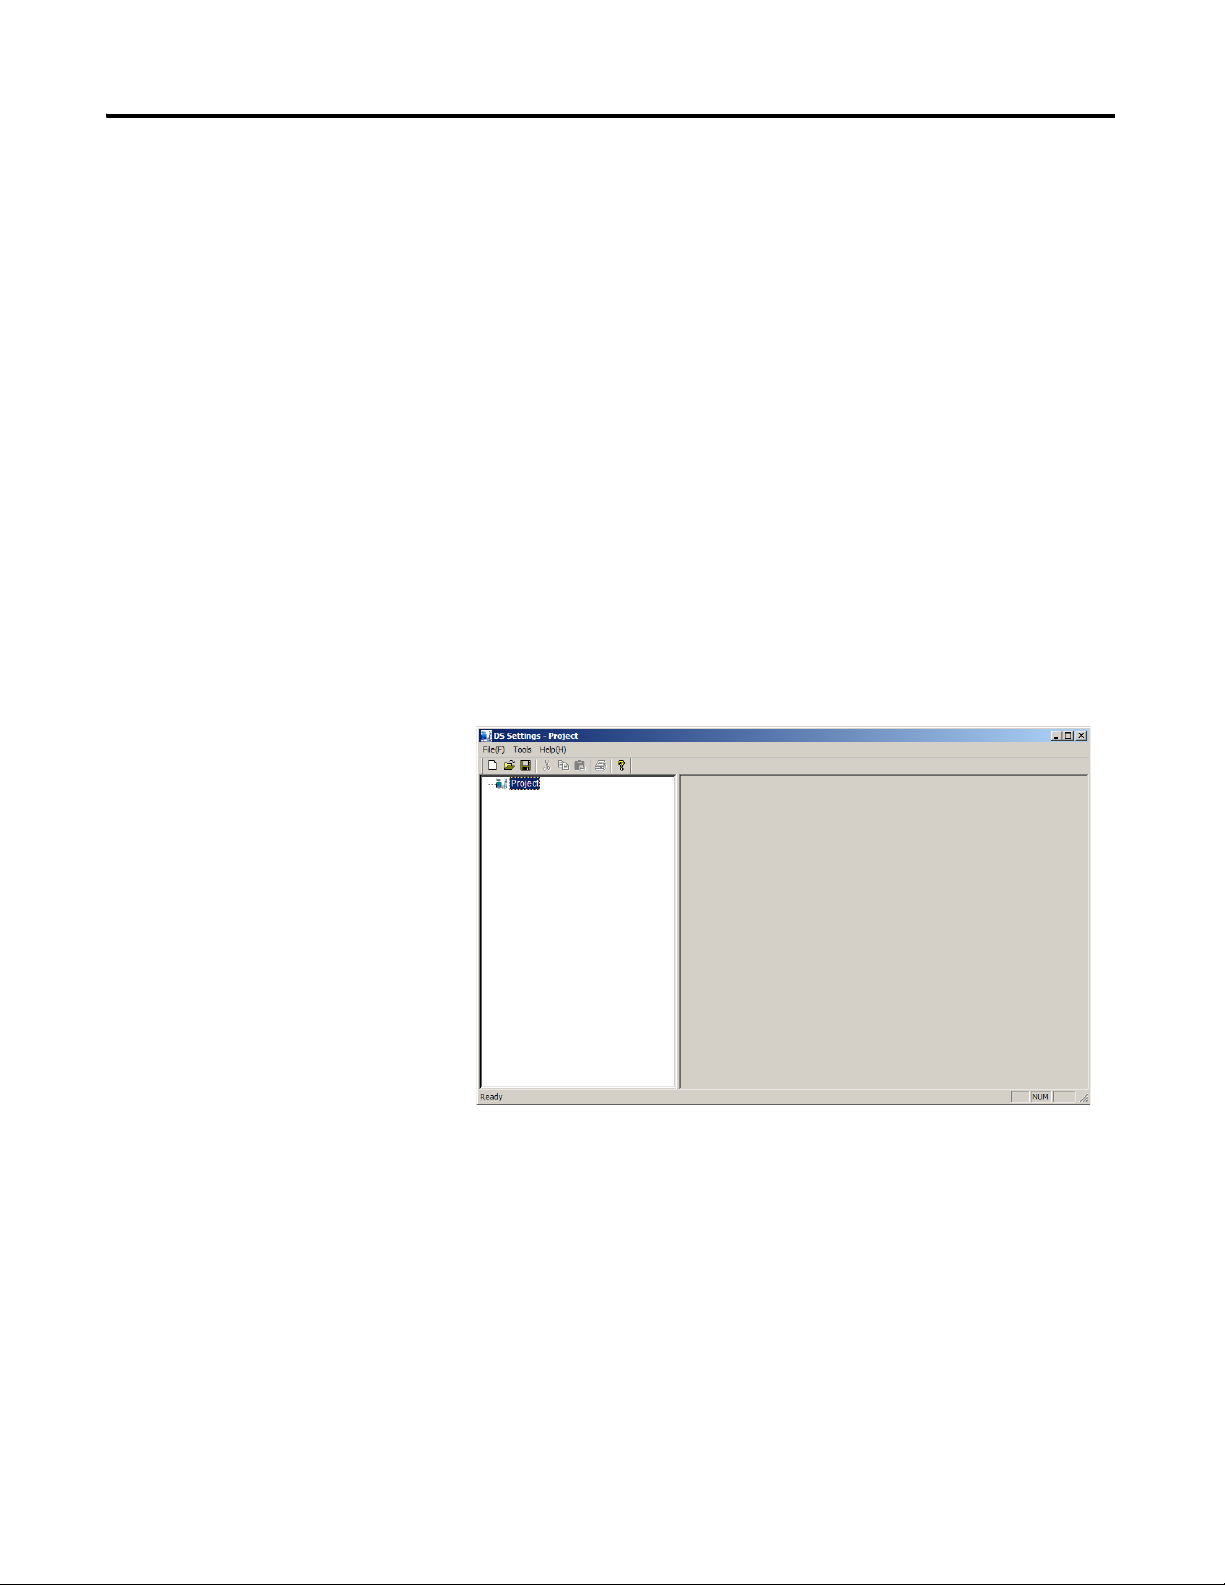
Project browser
Editor window
Status bar
Toolbar
Menu bar
Start DS Settings
Follow these steps to start DS Settings.
1. Start Microsoft Windows.
2. Click Start > Programs > Rockwell Software > DataSite Products >
DataSite Tools > DS Settings.
The DS Settings window appears. The default project file name is
Project.
Publication 1758-UM002D-EN-P - October 2010
Page 16
16 DataSite Configuration Settings Utility (DS Settings)
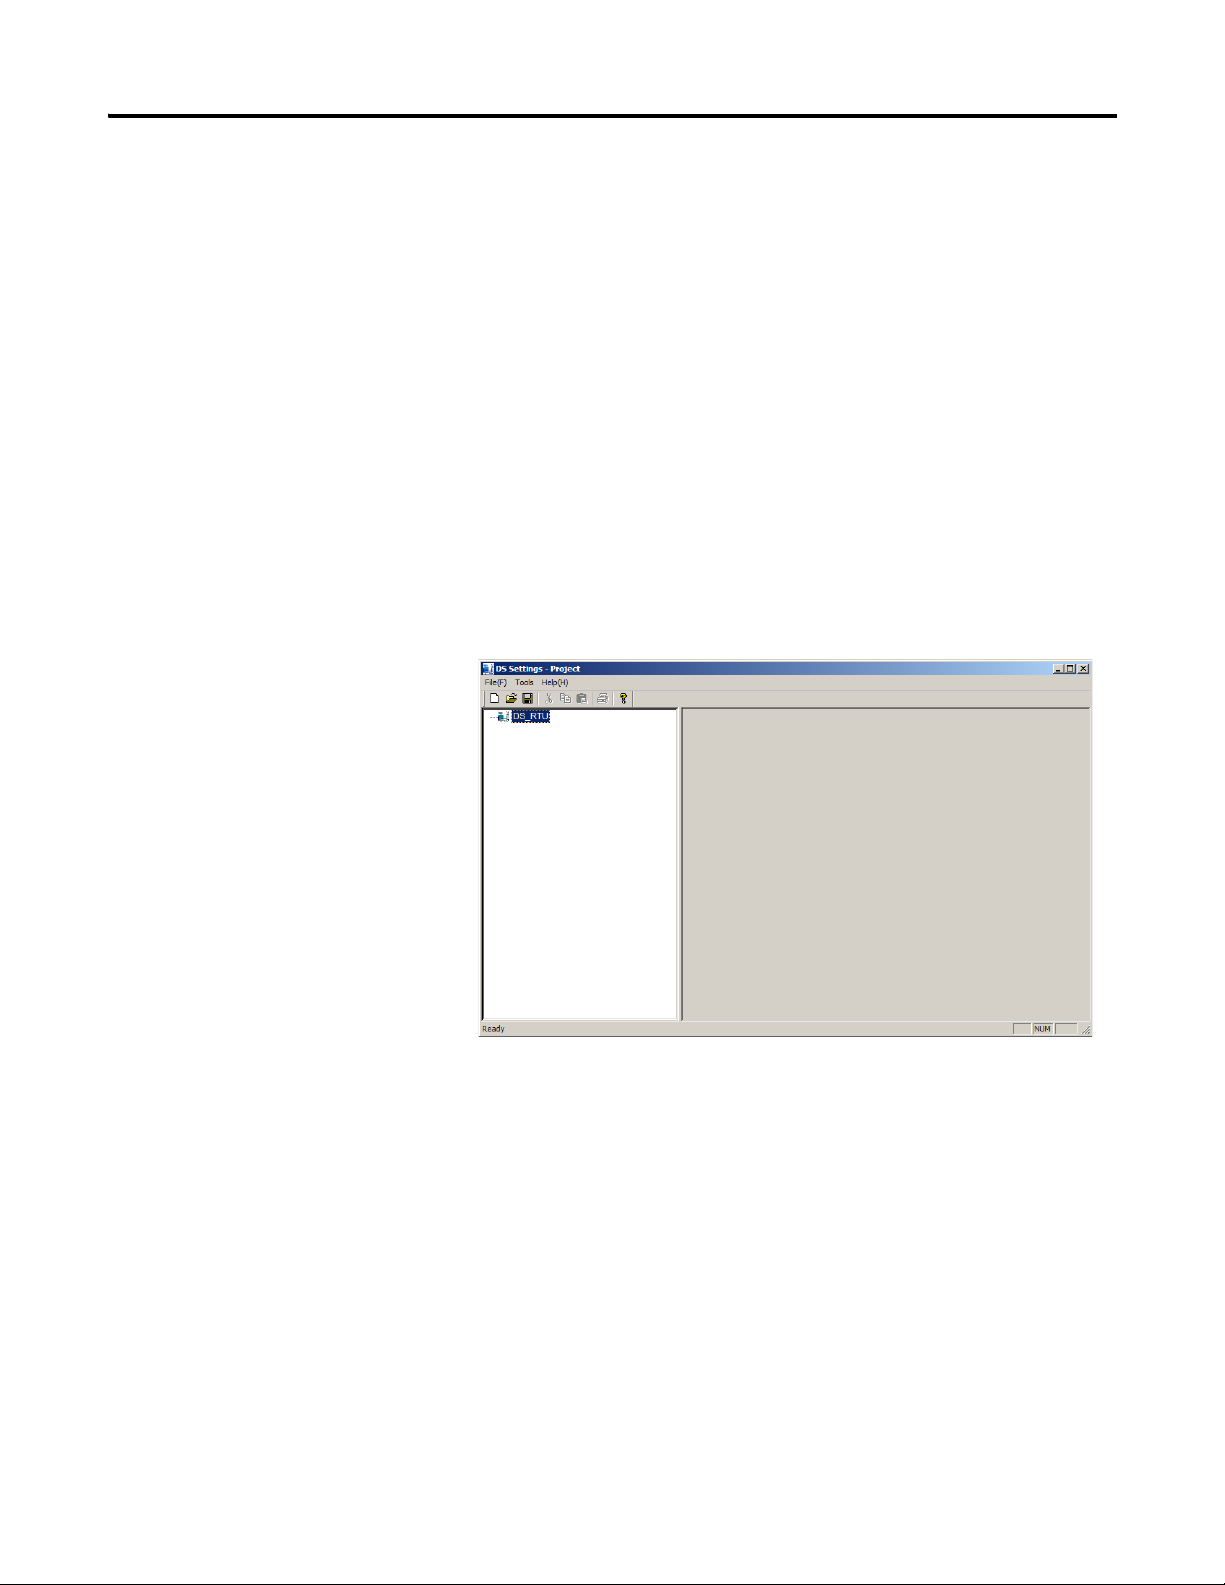
Create a New Project
Follow these steps to create a new project.
1. From the File menu, choose New Project.
2. Enter the project name, for example, DS_RTU.prj.
3. Click OK.
The New Project dialog box appears.
The new project file, DS_RTU.prj in this example, is created in
C:\Program Files\Rockwell Automation\DS Settings\DS Settings
Project.
The file is opened in the project browser.
Publication 1758-UM002D-EN-P - October 2010
Save a Project
Follow this step to save a project using its current file name.
• From the File menu, choose Save.
The project file, DS_RTU.prj is saved in the current location. In this
example, it is C:\Program Files\Rockwell Automation\DS Settings\DS
Settings Project.
Follow these steps to save the project into a different file.
1. From the File menu, choose Save As.
Page 17
DataSite Configuration Settings Utility (DS Settings) 17
The Save As dialog box appears.
2. Browse to the location you want to store the project file in and enter the
new file name.
3. Click Save.
Open a Project
Follow these steps to open a project.
1. From the File menu, choose Open.
2. Browse to the location of the project file you want.
3. Select the project file and click the Open button.
The DS Settings window appears.
Close DS Settings
Follow this step to close DS Settings.
• From the File menu, choose Exit.
Publication 1758-UM002D-EN-P - October 2010
Page 18
18 DataSite Configuration Settings Utility (DS Settings)
Configure PC Communication Settings
The DataSite controller can be connected to the PC via the serial port or the
Ethernet (TCP/IP) port. Use PC Communication Settings to set up the
communication mode and parameters for this connection.
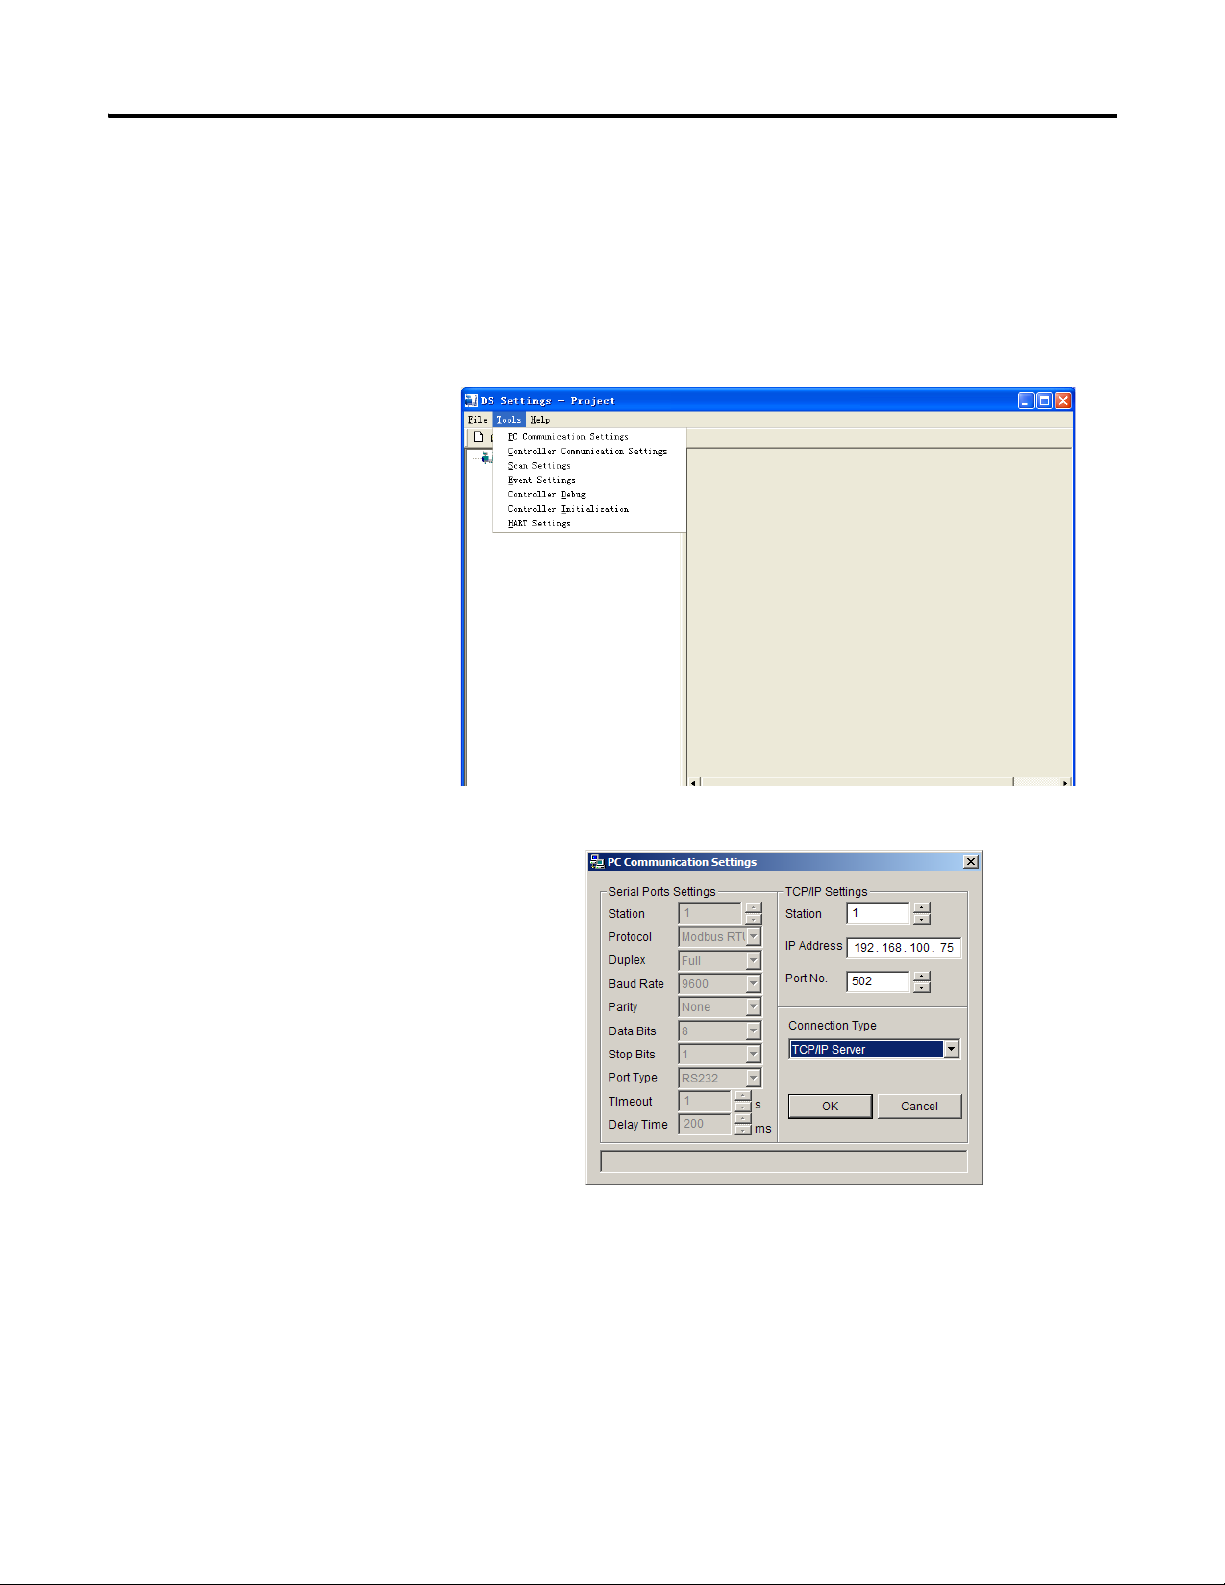
Follow these steps to configure PC Communication settings:
1. From the Tools menu, choose PC Communication Settings.
The PC Communication Settings dialog box appears.
2. From the Connection Type pull-down menu, choose the type of
communication port used between the PC and the DataSite controller:
• For Ethernet communication mode, choose TCP/IP Server.
• For Serial port communication mode, choose your PC’s COM port
from one of the COM ports (COM1…COM10).
Publication 1758-UM002D-EN-P - October 2010
Page 19
DataSite Configuration Settings Utility (DS Settings) 19
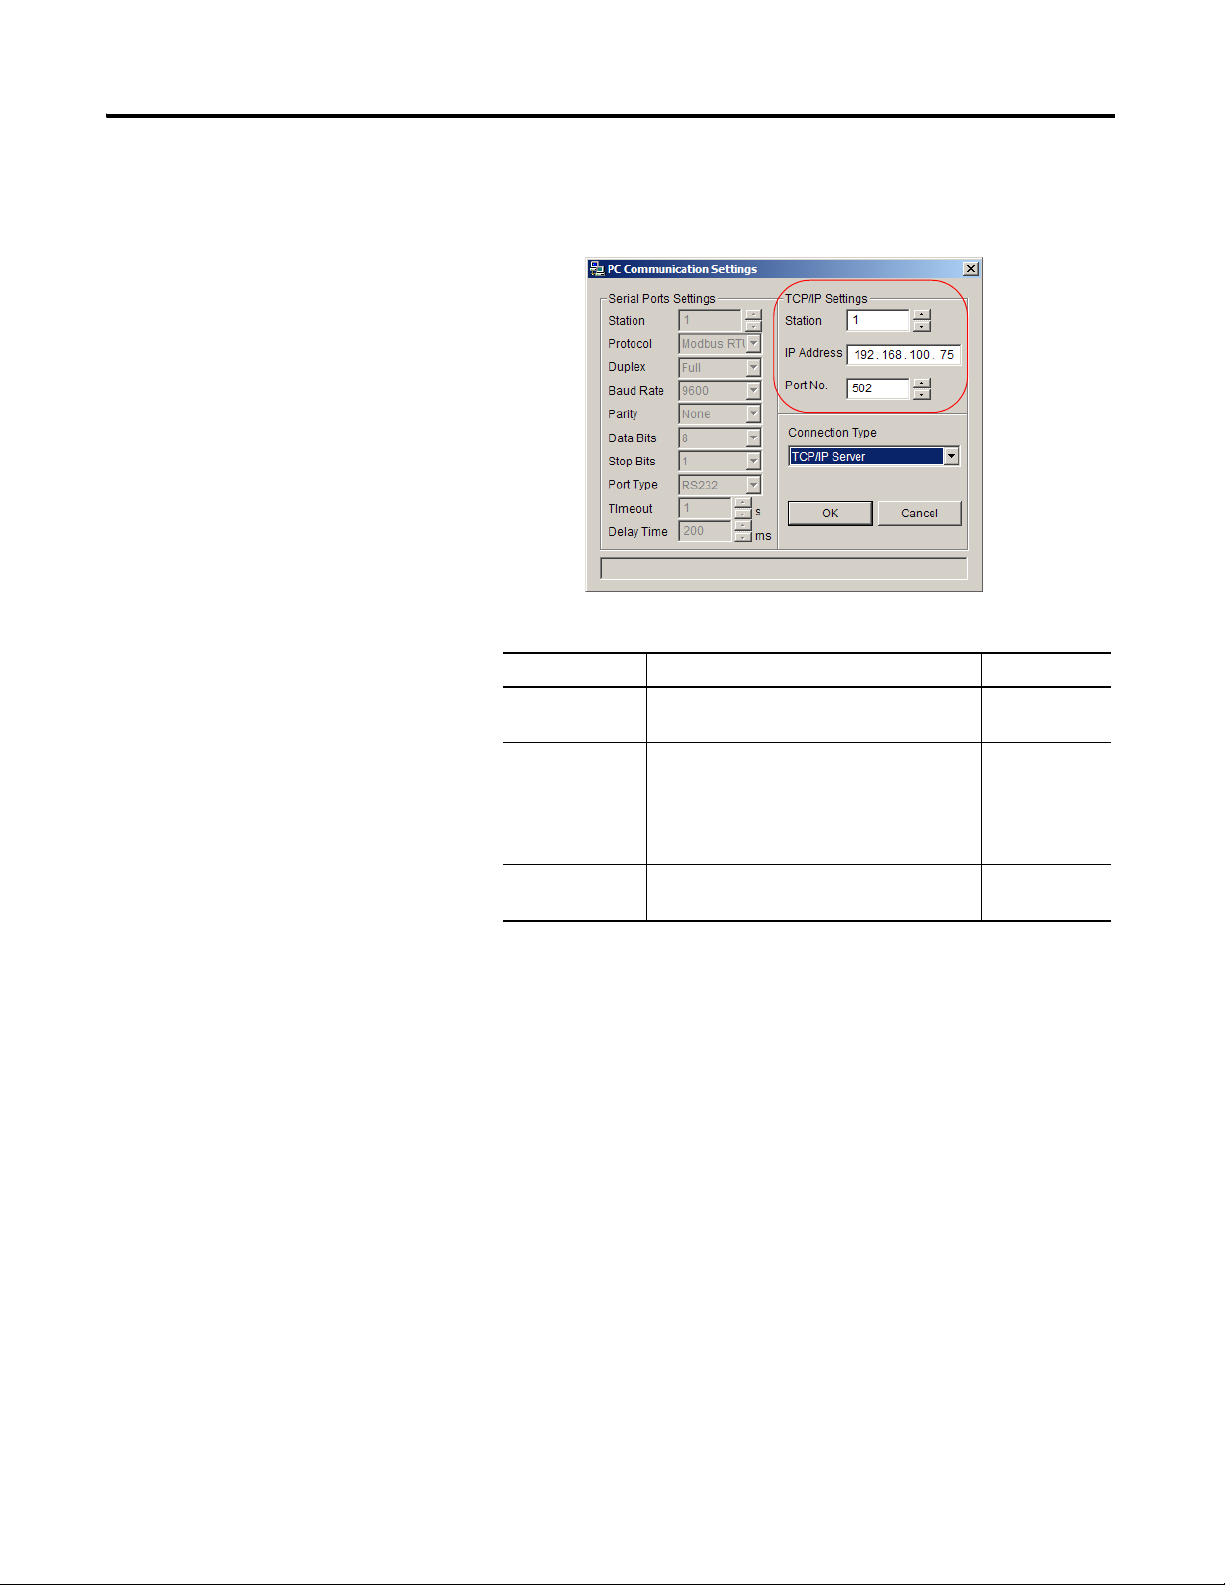
3. If you have chosen TCP/IP Server, set up the parameters for the
TCP/IP connection.
Parameters for TCP/IP Communication
Parameter Description Default Value
Station number Station corresponding to the DataSite
controller communication Ethernet port.
1
IP address IP address corresponding to the Ethernet
communication port of the DataSite
controller. The address is in the format,
xxx.xxx.xxx.xxx, made up of four octets with
each octet ranging between 0 and 255.
Port no. Port corresponding to the DataSite
controller.
192.168.100.75
502
Publication 1758-UM002D-EN-P - October 2010
Page 20
20 DataSite Configuration Settings Utility (DS Settings)
TIP
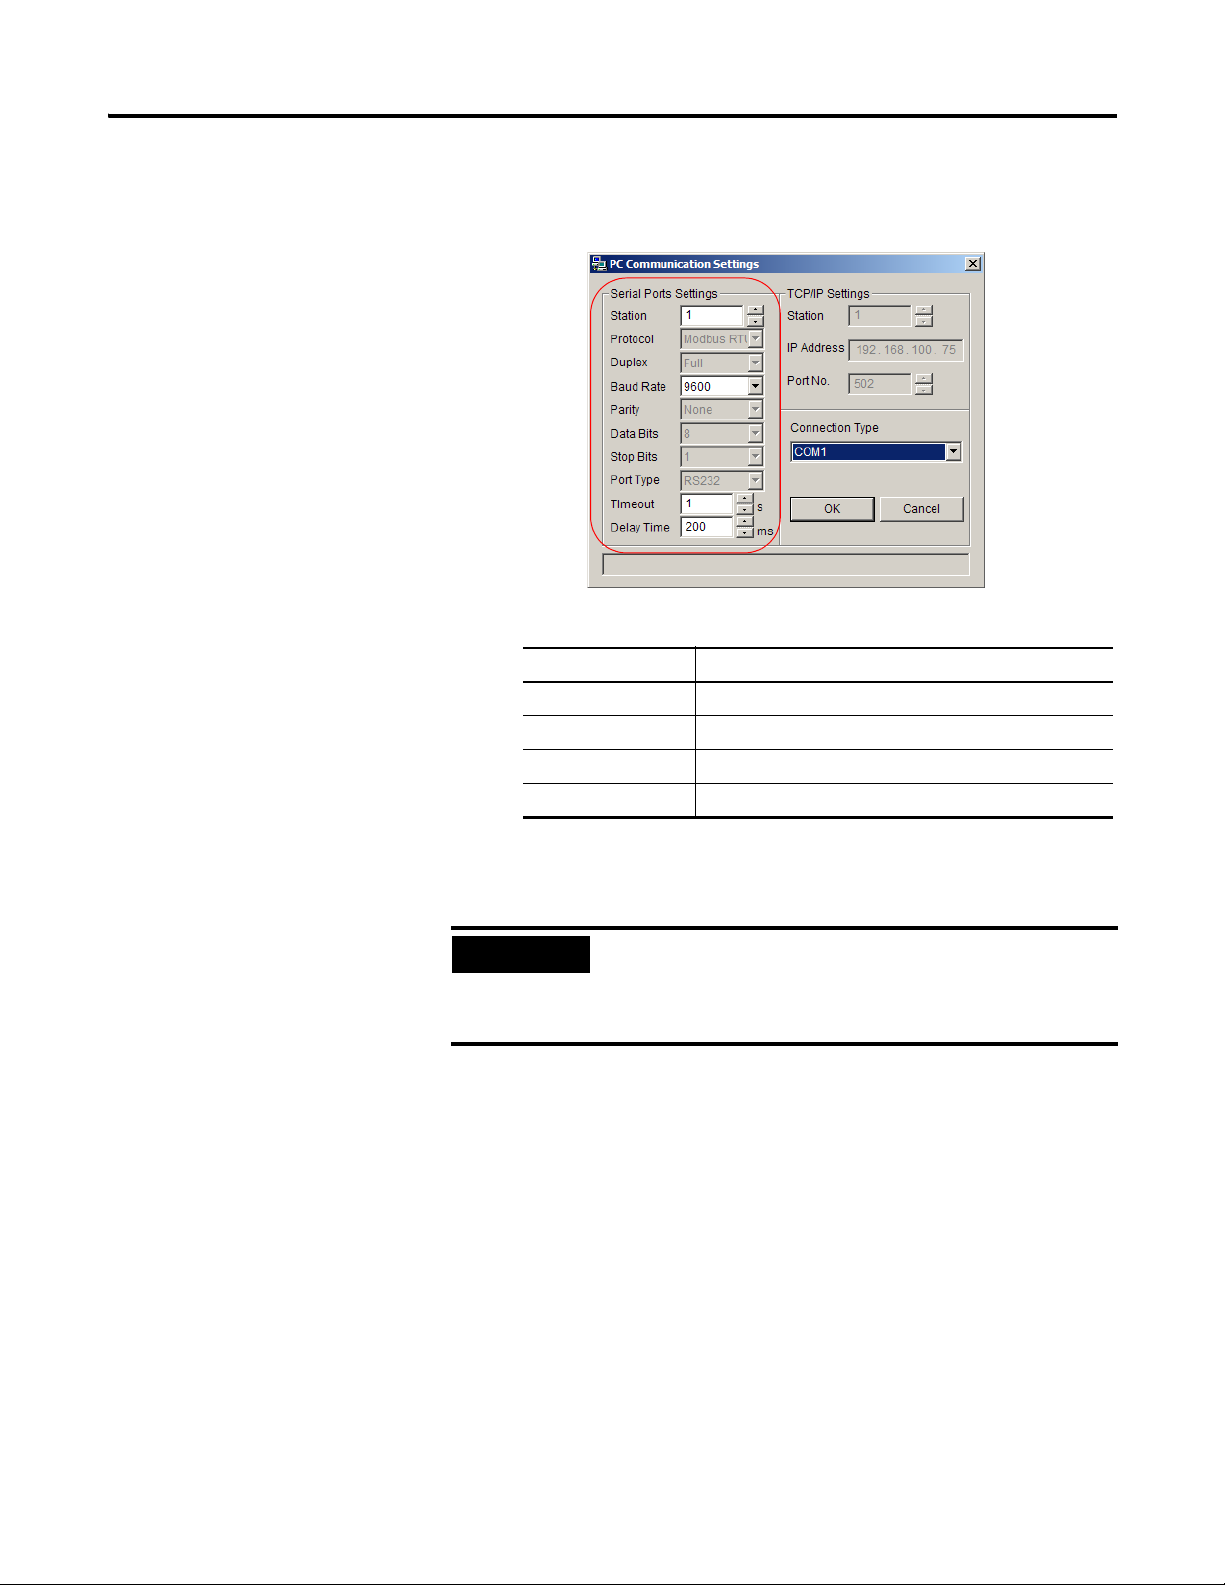
4. If you have chosen a COM port, set up the parameters for the serial port
connection.
Parameters for Serial Port Communication
Parameter Value range
Station number 1…247
Baud rate (bps) 2400, 4800, 9600, 14400, 19200, 38400, 56000, 57600
Timeout (1 s) 1…10
Delay time (1 ms) 0…3000
5. To confirm the PC settings and close the window, click OK.
To cancel the configuration and close the window, click Cancel.
When you click OK, the system will automatically save the
PC settings into a default file. The file name is
PC Communication Parameter.cfg, located in the current
project directory.
Publication 1758-UM002D-EN-P - October 2010
Page 21
DataSite Configuration Settings Utility (DS Settings) 21
TIP
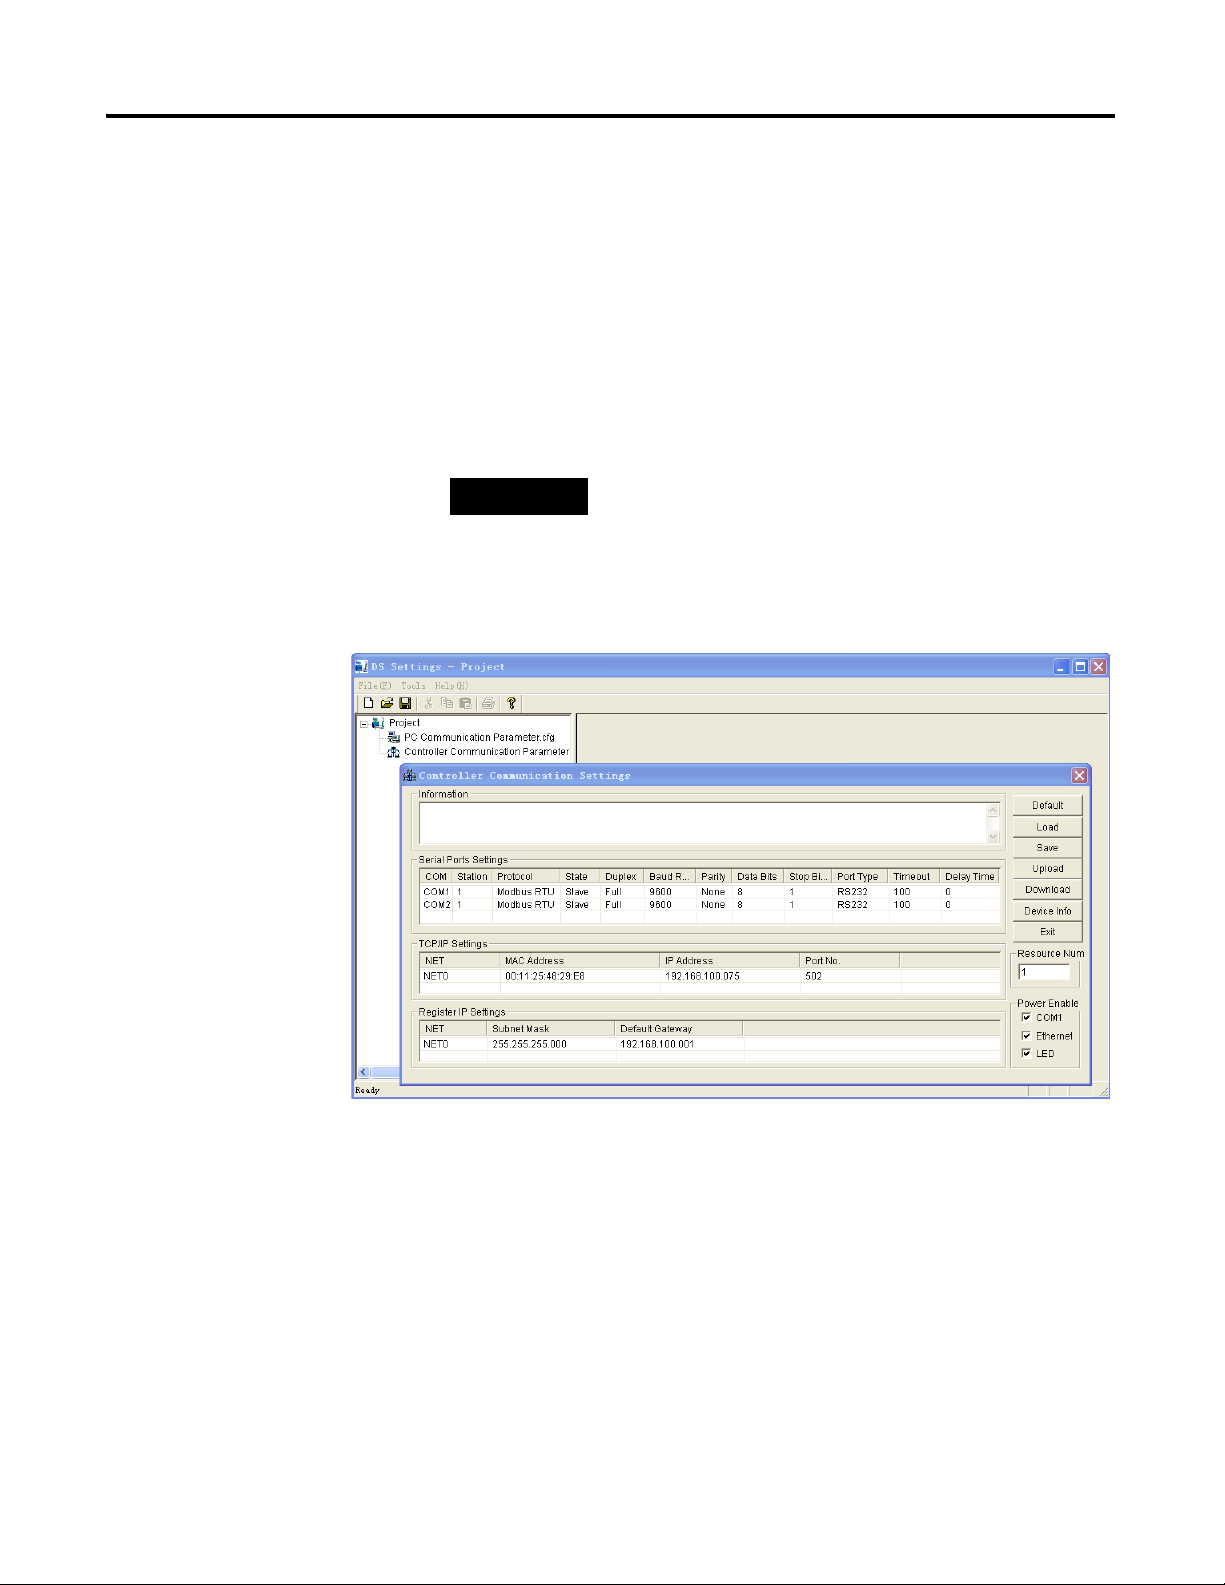
Configure Controller Communication Settings
Use Controller Communication settings to set controller parameters, such as
serial port parameters or Ethernet parameters, and low-power settings.
Follow this step to open the Controller Communication Settings dialog box.
• From the Tools menu, choose Controller Communication Settings.
The Controller Communication Settings dialog box appears.
The file, Controller Communication Parameter.esy, located in the
current project directory, is displayed in the project browser file pane.
You can also double-click the
Controller Communication Parameter.esy file in the project
browser file pane to open the PC Communication Settings
picture.
The Information box displays a status message after each software
operation. For example, if a file is loaded successfully, the message,
"Load from file successful" appears in the Information box.
Publication 1758-UM002D-EN-P - October 2010
Page 22
22 DataSite Configuration Settings Utility (DS Settings)
TIP
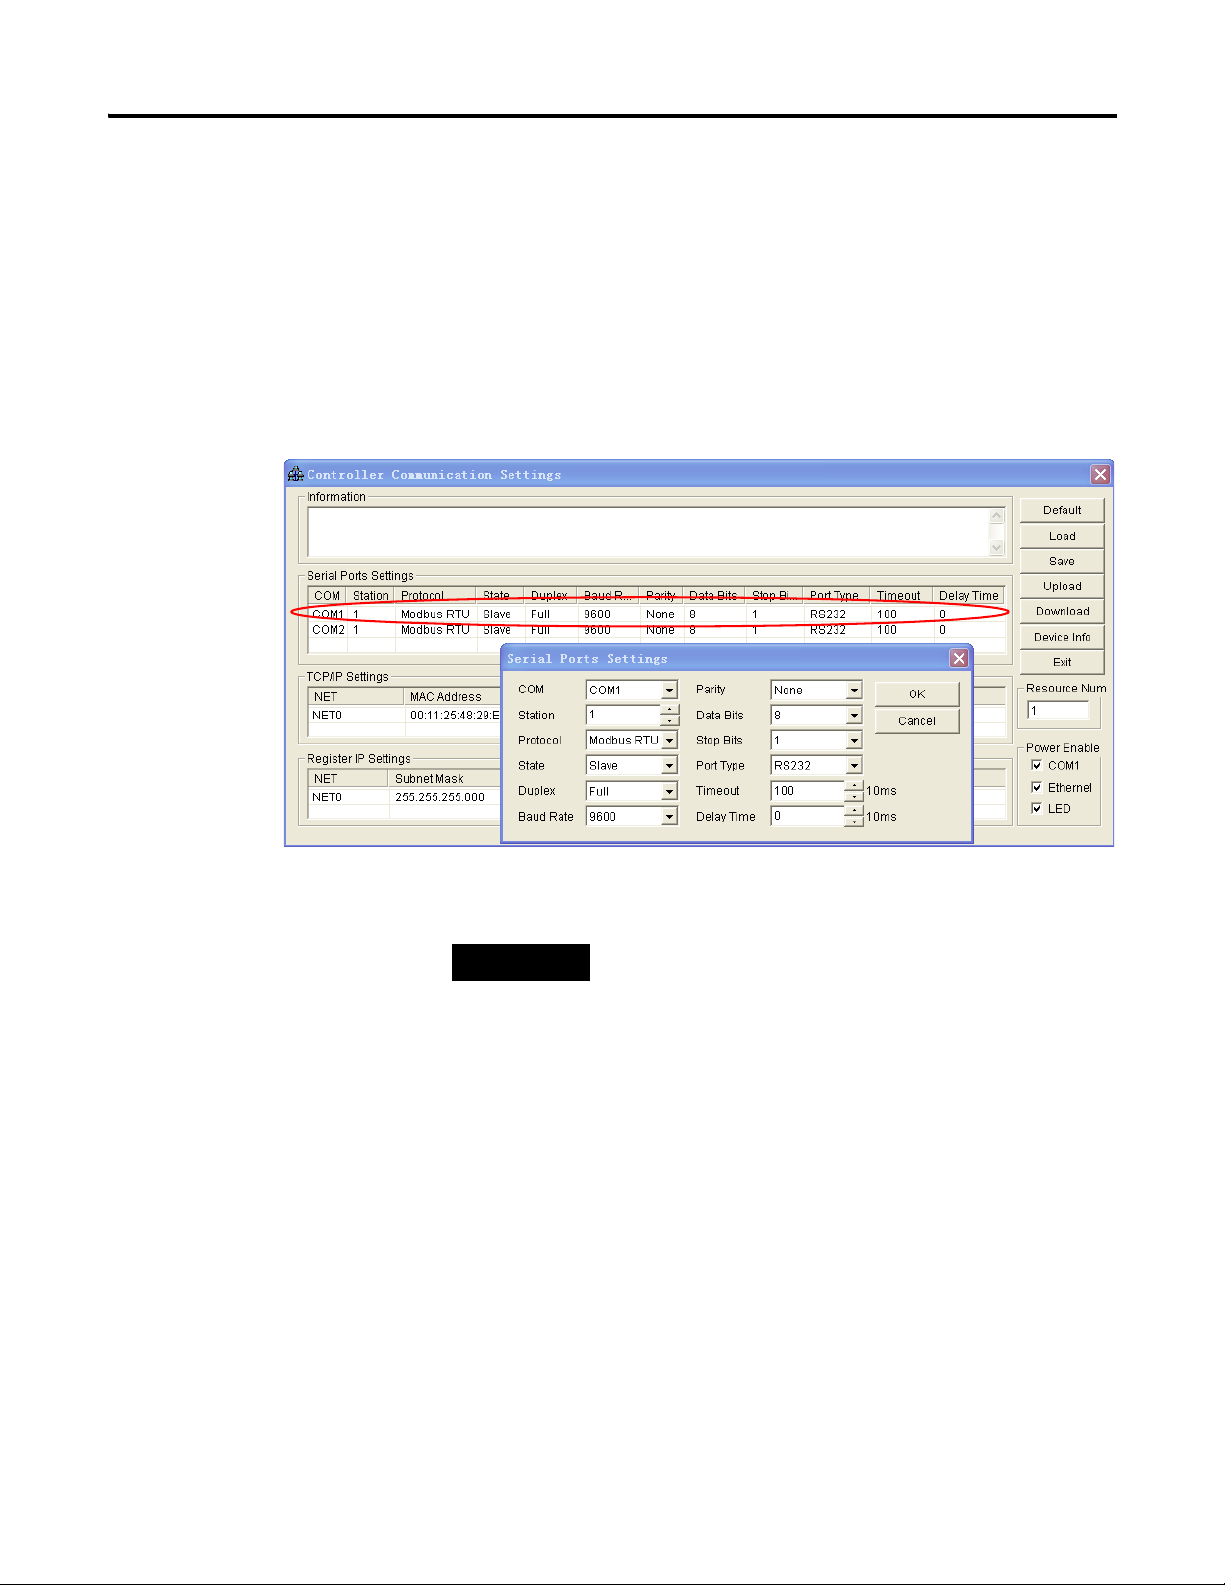
Configure Serial Port Settings
Follow these steps to configure the serial port.
1. In the Serial Ports Settings box, double-click the row for the serial port
you want to configure.
The Serial Ports Settings dialog box appears.
2. Set up the parameters of the selected serial port.
You can also select another serial port from the COM
pull-down menu, and set up the parameters for that port.
Publication 1758-UM002D-EN-P - October 2010
Page 23

DataSite Configuration Settings Utility (DS Settings) 23
This table shows the options and/or value range available for each
parameter.
Serial port parameters
Parameter Parameter Options or Value Range
COM COM1, COM2
Station 1…247
Protocol Modbus RTU, Modbus ASC, DS Workbench (only for
COM2), None
Master/Slave state Master, Slave
Duplex Full, Half
Baud rate 2400, 4800, 9600, 14400, 19200, 38400, 56000, 57600
Parity Even, Odd, None
Data bits 7, 8
Stop bits 1, 2
Port type RS232, RS485
Timeout (in units of 10 ms) 1…1000
Delay time (in units of 10 ms) 0…300
3. To save the settings and close the Serial Ports Settings dialog box, click
OK.
To close the dialog box without saving the settings, click Cancel.
4. Click Download.
The new settings are applied to the DataSite controller.
The following sections provide more information on some of the parameters
for the serial port.
Protocol
When customizing the communication protocol, it is recommended that you
set the protocol as "None". You can then use flags in DataSite Workbench to
program the customized communication protocol. The flags corresponding to
each serial port are shown in the following table:
Flags in DataSite Workbench for serial ports
Flag Description
US1_RX US1 receiving task for US1 customized protocol
US2_RX US2 receiving task for US2 customized protocol
Publication 1758-UM002D-EN-P - October 2010
Page 24

24 DataSite Configuration Settings Utility (DS Settings)
TIP
Master/Slave State
The serial port scan block can be configured in the master state to acquire data
from the slave serial communication equipment connected in a certain time
interval. In the slave state, the DataSite controller can receive commands from
the host, generate and return response message. For more information, see the
Configuration Example
Timeout
In the master state, timeout is the maximum length of waiting time after a
command is sent. No new commands are sent while waiting for a response. If
no response is received after timeout, an error message box will be displayed to
inform you. You will then be prompted to send a new command.
on page 50.
Verify the protocol setting. If you set the protocol as
"None", the scan and the trigger scan function blocks will
not run properly even if the Master/Slave state is set
correctly.
Timeout is not applicable in other states.
Delay Time
In the master state, delay time is the maximum length of waiting time for the
next send command after one send/receive cycle is completed. This setting
can help prevent communication errors caused by a slower response of the
slave communication equipment connected.
In the slave state, delay time is the maximum length of waiting time for a
response to be returned after a command is received. This setting can help
prevent communication errors caused by a slower response of the master
communication equipment.
Publication 1758-UM002D-EN-P - October 2010
Page 25
DataSite Configuration Settings Utility (DS Settings) 25
TIP
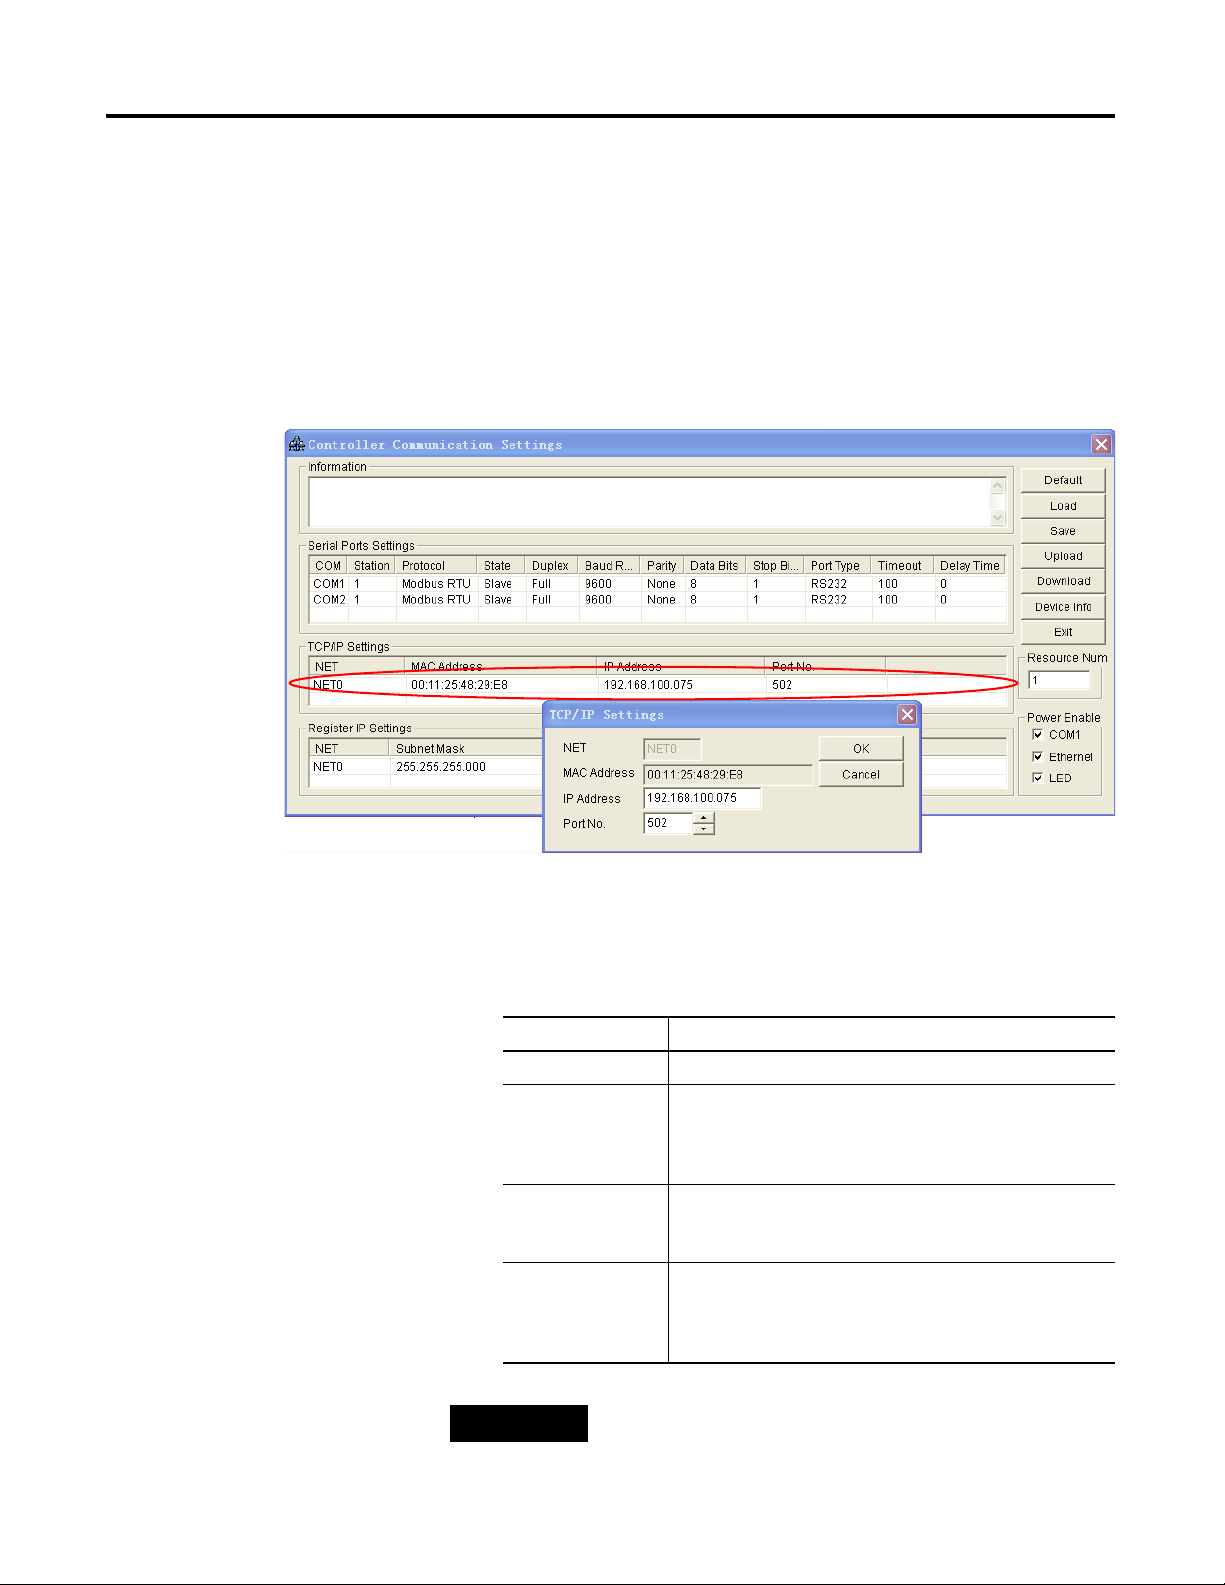
Configure TCP/IP Settings
Follow these steps to configure the Ethernet port.
1. In the TCP/IP Settings box, double-click the row for the TCP/IP port
you want to configure.
The TCP/IP Settings dialog box appears.
2. Set up the parameters of the selected TCP/IP port.
This table shows the value range for each parameters.
TCP/IP port parameters
Parameter Parameter Value Range
NET (Ethernet card) NET0
MAC address xx:xx:xx:xx:xx:xx
6 integers in hexadecimal format. For example,
00:00:BC:60:61:D0. The MAC address is read-only.
IP address xxx.xxx.xxx.xxx
4 octets with each octet ranging from 0…255.
Port no. 502
The port number of DS Settings TCP/IP port is defined as
502 when the PC is connected to the DataSite controller.
If you change the IP address, the DataSite controller will
cycle power automatically.
Publication 1758-UM002D-EN-P - October 2010
Page 26
26 DataSite Configuration Settings Utility (DS Settings)
3. To save the settings and close the TCP/IP Settings dialog box, click OK.
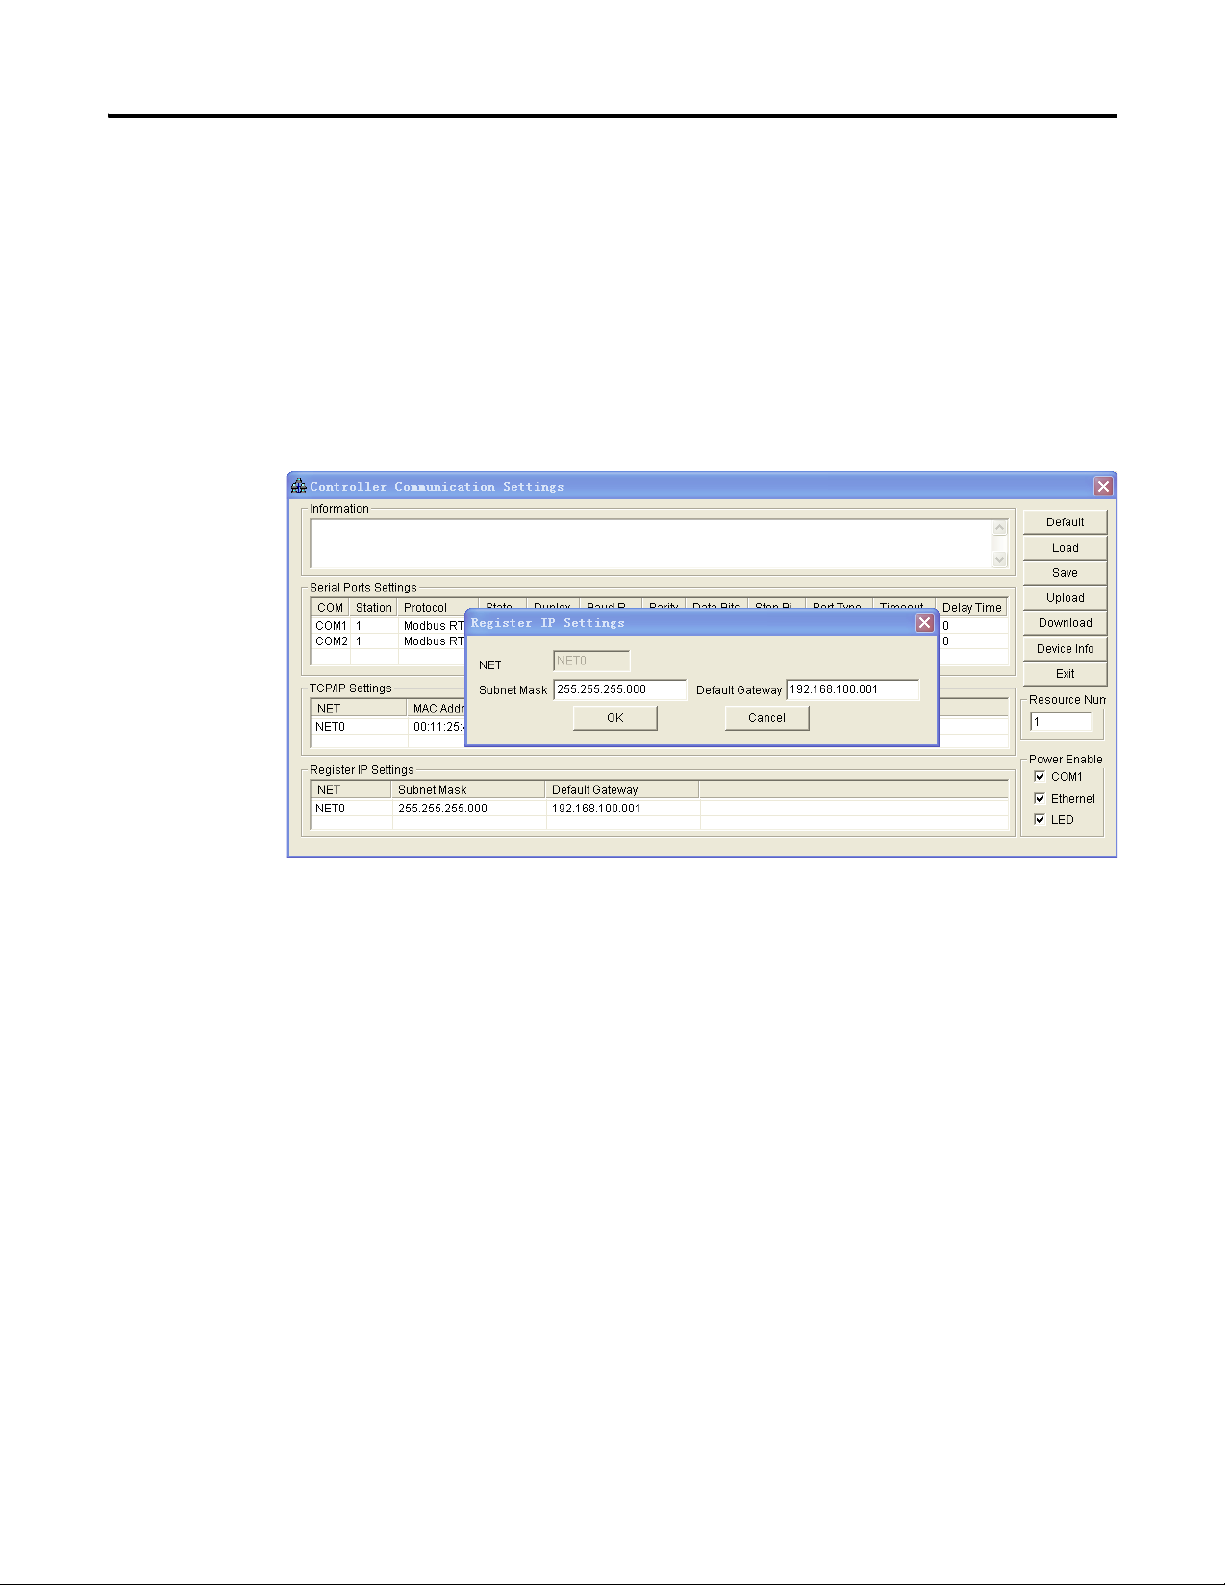
Register IP Settings
The subnet mask and default gateway settings allow you to determine the
DataSite controllers that you want to establish communication with in the
network. This allows you to manage your network more efficiently.
To close the dialog box without saving the settings, click Cancel.
Publication 1758-UM002D-EN-P - October 2010
Page 27
DataSite Configuration Settings Utility (DS Settings) 27
IMPORTANT
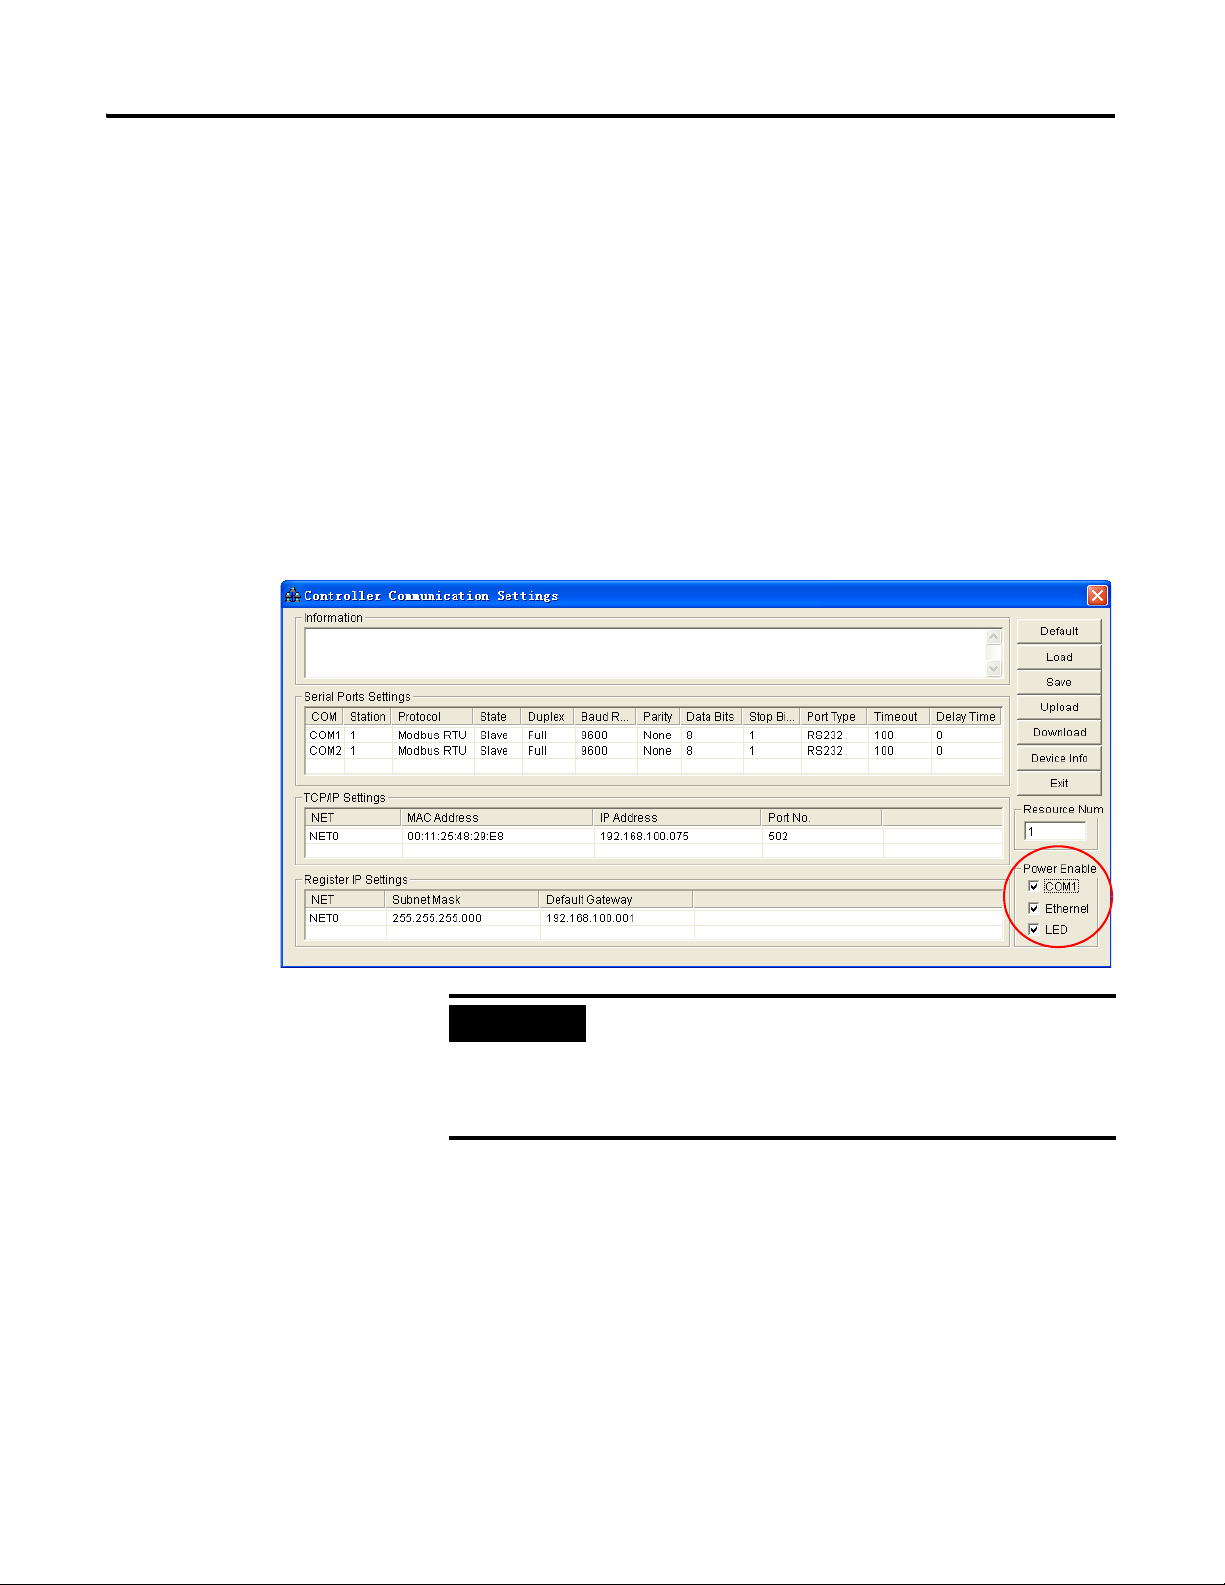
Lower the Power Consumption
The options in the Power Enable group allow you to shut the power supply to
some parts of the DataSite controller to lower power consumption.
Follow these steps to lower power consumption.
1. Under Power Enable in the Controller Communication Settings dialog
box, clear the check boxes for the parts that can go to sleep:
• COM1 port
• Ethernet port
• LED indicators
If you are still using a port, do not clear its check box under
Power Enable. Otherwise, communication may be
interrupted. For example, when the DataSite controller is
communicating via the Ethernet port, do not shut the
power supply of the Ethernet port.
2. Click Download.
The settings are applied to the DataSite controller.
Publication 1758-UM002D-EN-P - October 2010
Page 28

28 DataSite Configuration Settings Utility (DS Settings)
Display the Default Settings
Follow this step to display default values.
• Click Default.
The message, "Default settings enabled." appears in the Information
box.
Serial Port Settings (Factory Default)
Parameter Name Parameter Value
Station 1
Master/Slave state Slave
Duplex Full
Baud rate (bps) 9600
Parity None
Data bits 8
Stop bits 1
Port type RS232
Timeout (10ms) 100
Delay time (10 ms) 0
Ethernet Port Settings (Factory Default)
Parameter Name Parameter Value
Ethernet card NET0
IP address 192.168.100.075
Basic port no. 502
Registration IP Address (Factory Default)
Parameter Name Parameter Value
Subnet mask 255.255.255.0
Default gateway 192.168.100.001
Power Enable Settings (Factory Default)
Parameter Name Parameter Value
COM1 (On-Off) Enable
LED (On-Off) Enable
Ethernet (On-Off) Enable
Publication 1758-UM002D-EN-P - October 2010
Page 29
DataSite Configuration Settings Utility (DS Settings) 29
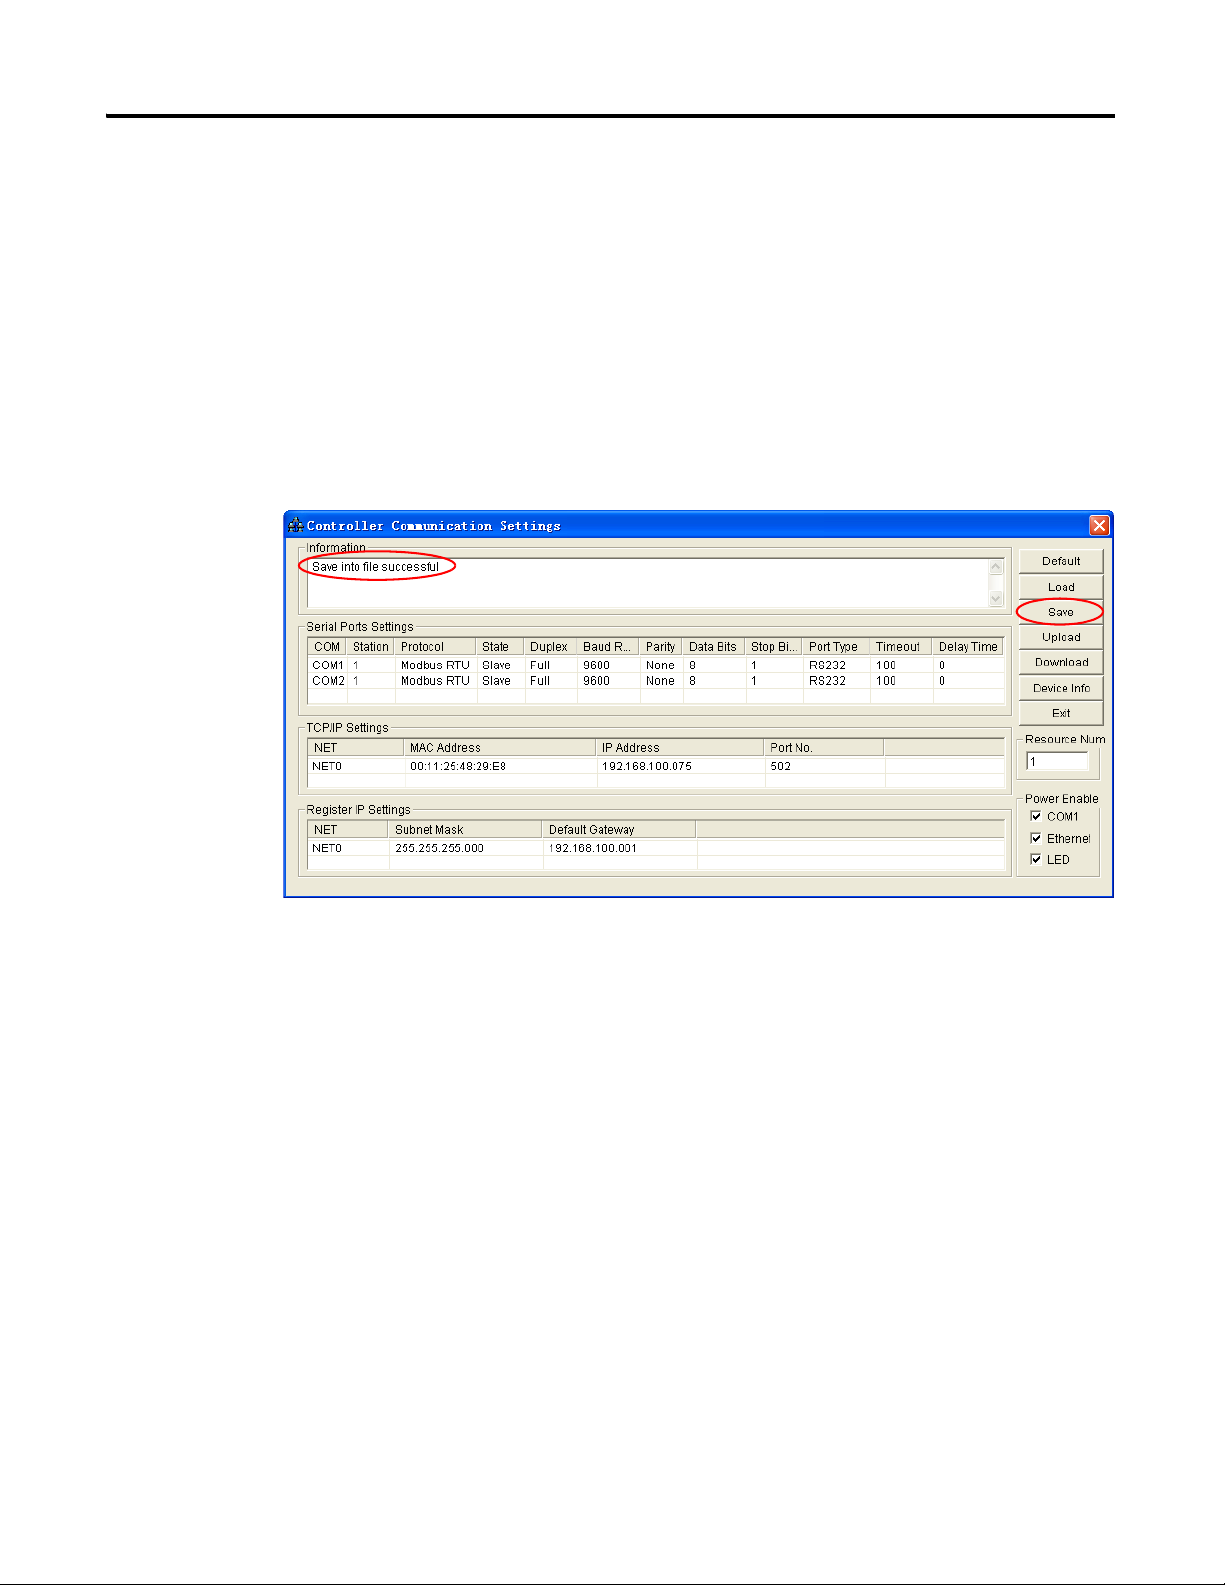
Save the Controller Communication Settings
Follow this step to save the settings you have made.
• Click Save.
The controller parameter configuration is saved into the file,
Controller Communication Parameter.esy.
If the file is saved successfully, the message "Save into file successful"
will appear in the Information box.
Publication 1758-UM002D-EN-P - October 2010
Page 30
30 DataSite Configuration Settings Utility (DS Settings)
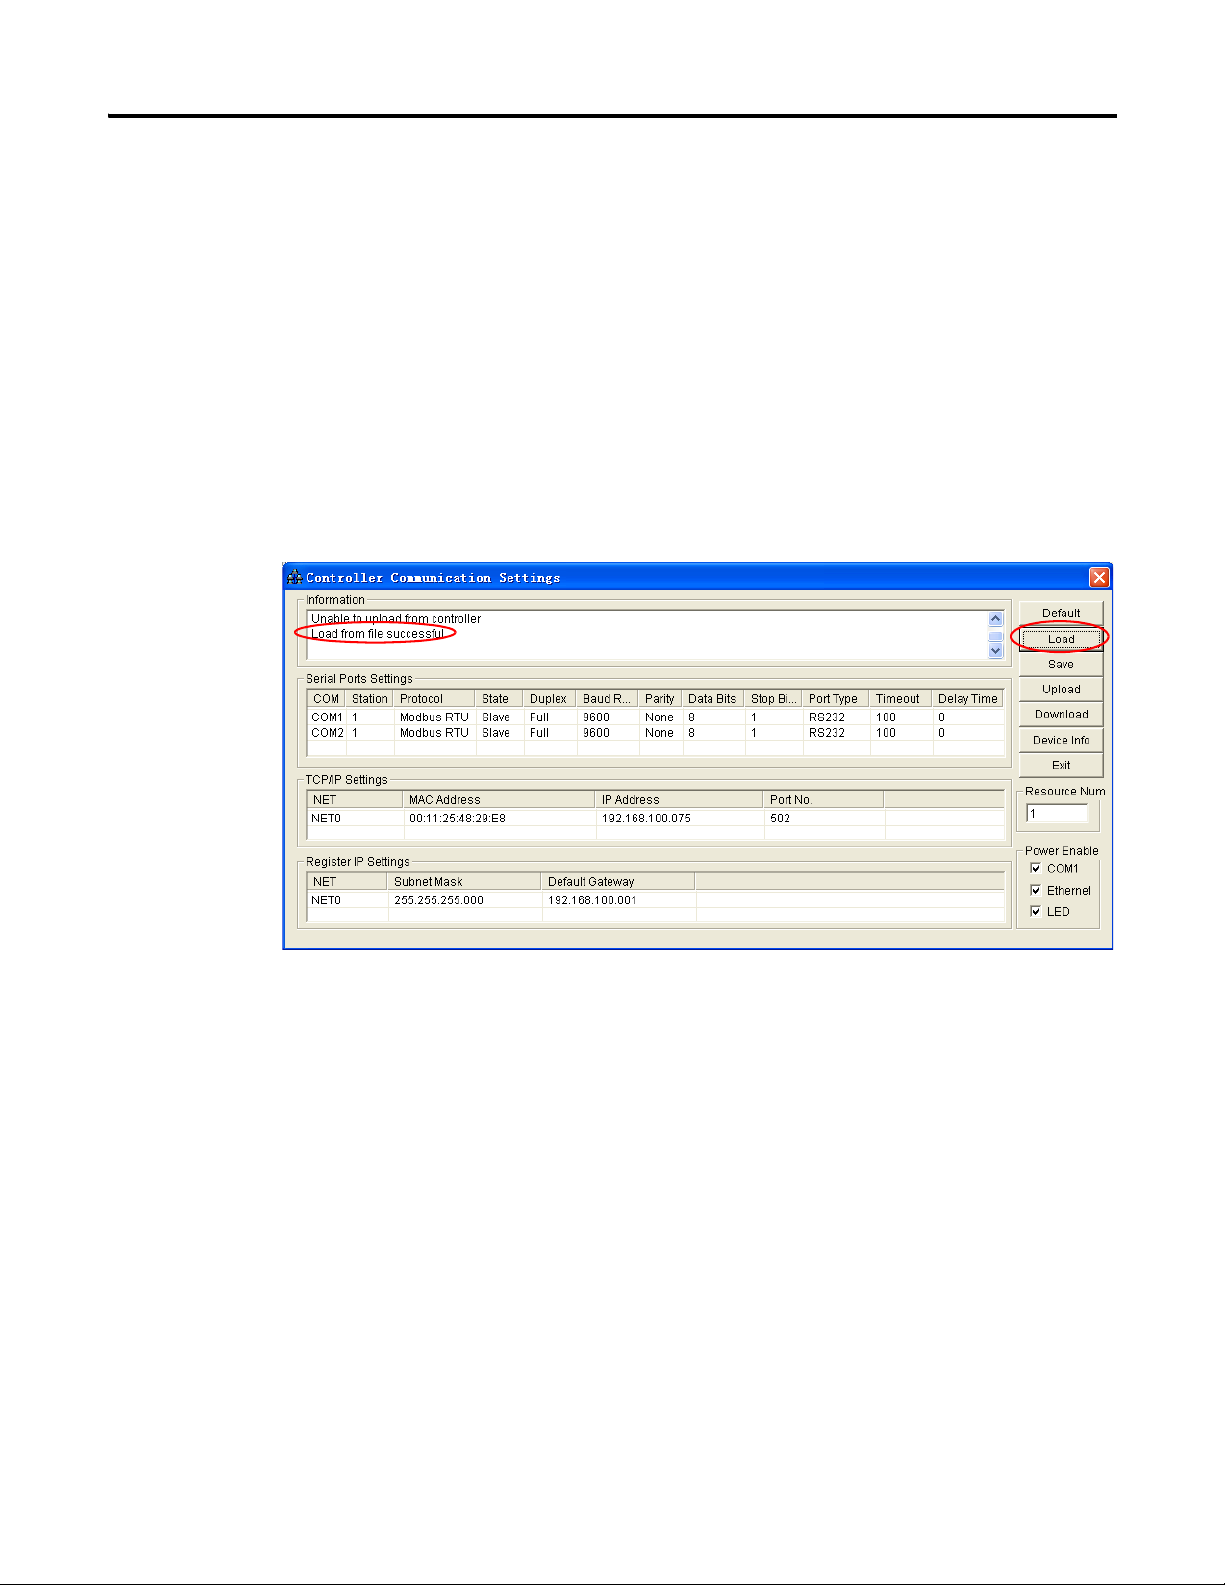
Load the Controller Communication Settings
Follow this step to load the settings. This will load the last saved configuration
of the DataSite controller parameters.
• Click Load.
Alternatively, you may double-click the file, Controller Communication
Parameter.esy, from the file pane of the project browser or choose
Controller Communication Settings from the Tools menu.
If the file is loaded successfully, the message "Load from file successful"
will appear in the Information box.
Publication 1758-UM002D-EN-P - October 2010
Page 31

DataSite Configuration Settings Utility (DS Settings) 31
Upload the Controller Communication Settings from the Controller
Follow this step to upload (read) the controller parameter settings from the
controller.
• Click Upload.
If the settings are uploaded successfully, the message "Upload from
controller successful" will appear in the Information box.
Publication 1758-UM002D-EN-P - October 2010
Page 32

32 DataSite Configuration Settings Utility (DS Settings)
IMPORTANT
Download the Controller Communication Settings to the Controller
Follow these steps to download (write) the controller parameter settings to the
controller.
1. Set up system parameters.
2. Click Download.
When connecting via a certain serial port of the controller,
see COM2 as shown.
3. Change the baud rate of COM2 to 19200, and then click Download.
The message "Download to controller successful" appears.
4. Click Upload.
Publication 1758-UM002D-EN-P - October 2010
Page 33

DataSite Configuration Settings Utility (DS Settings) 33
The message "Unable to upload from controller" appears.
This indicates that the COM2 baud rate of the controller has been
changed to 19200.
5. Click Exit to close the Controller Communication Settings dialog box.
6. Open the PC Communication Settings dialog box.
7. Change the baud rate of the serial port on the PC to 19200.
8. Click OK.
The PC Communication Settings dialog box is closed.
9. Open the Controller Communication Settings dialog box again.
Publication 1758-UM002D-EN-P - October 2010
Page 34

34 DataSite Configuration Settings Utility (DS Settings)
10. Click Upload to upload the controller communication settings again.
You may encounter a similar scenario when you connect to the Ethernet port
of the controller and change its setting, such as the IP address.
Display the Device Information
Follow this step to display the device information of the DataSite controller.
The message "Upload from controller successful" appears.
• Click Device Info.
The device information of the DataSite controller appears in the
Information box.
Publication 1758-UM002D-EN-P - October 2010
Close the Controller Communication Settings dialog box
Follow this step to close the Controller Communications Settings dialog box.
• Click Exit.
Page 35

DataSite Configuration Settings Utility (DS Settings) 35
TIP
Settings
For integrated modules such as the DataSite controller, the master ports can
directly read/write parameters by accessing the fixed Modbus registers. We
need to set scan blocks of US1 and US2 only when we want to access other
pieces of equipment connected with the two serial ports (COM1, COM2).
Use Scan Settings to match the register addresses of the 1758 controller with
those of the serially connected equipment.
A custom function block that can be triggered in the user
program to provide Modbus Master read/write functions is
also available. For more information, see the DataSite
Customized Function Blocks Reference Manual,
1758-RM001
.
Understand the Scan Blocks
Every scan block corresponds to a scan task. The maximum number of scan
tasks is 128. This table lists the description of each item in a scan block.
Scan block parameters and their descriptions
Scan Block Parameter Description
Block type Scan block data category
Module Addr Modbus slave station number of serial communication
equipment connected with COM1 or COM2.
Signal type Signal register category
Scan time Read/Write interval
Master Register Register address where data is saved in the controller,
decided by the user.
Slave Register You can set the read/write data register address of the
slave communication equipment according to the parameter
form of the slave communication equipment register.
Reg_Num The number of read/write data registers.
Err_Cnt The number of times the scan block fails to communicate.
Err_State Scan block communication state.
If the Err_State value is 1, it means the communication has
failed. A value of 0 indicates that the communication is OK.
Remark User comments.
You can enter a note or a tip for the scan block. Note that
this field will not be downloaded to the DataSite controller.
Publication 1758-UM002D-EN-P - October 2010
Page 36

36 DataSite Configuration Settings Utility (DS Settings)
Block Type
The block type indicates the category of scan block data.
Scan block types and their descriptions
Name Function
US1 block 1758-RTU controller Read-write data of the serial
US2 block 1758-RTU controller Read-write data of the serial
Empty block Scan block configuration end flag
Scan blocks are configured in sequence, and every block has a corresponding
number. The maximum number of block numbers is 128.
When the type of a block is Empty Block, its subsequent block configuration
is invalid.
equipment connected with the serial port COM1.
equipment connected with the serial port COM2.
Module Addr
For 1758-RTU controller, this means the Modbus slave station number of the
serial communication equipment connected with COM1 or COM2.
The range of the Modbus slave station number is 1…247.
Signal Type
The signal type indicates the category of register read/write signal, and its
contents.
Signal types and functions
Signal Type Function Modbus Command
Read_Coil register Read 00001…04096 register 1
Read_State register Read 10001…14096 register 2
Read_Hold register Read 40001…49999 register 3
Read_Input register Read 30001…31024 register 4
Write_1Coil register Write 00001…04096 register 5
Write_1Hold register Write 40001…49999 register 6
Publication 1758-UM002D-EN-P - October 2010
Write_nCoil register Write 00001…04096 register 15
Write_nHold register Write 40001…49999 register 16
Page 37

DataSite Configuration Settings Utility (DS Settings) 37
When the address of the master or slave register does not map to the signal,
the following error will appear.
Scan Time
Scan time refers to the read-write time interval of a scan block. You can use
the trigger scan function for COM port by programming the function block
COM_MSG in DataSite Workbench.
The following units of time are available. Note that ms represents
milliseconds, s seconds, m minutes, and h hours:
• 50 ms
• 500 ms
• 5 s
• 50 s
• 5 m
• 50 m
• 5 h
• 50 h
Publication 1758-UM002D-EN-P - October 2010
Page 38

38 DataSite Configuration Settings Utility (DS Settings)
The scan time is equal to the value multiplied by the unit selected. For
example, if the value entered is "3" and the unit selected is "500 ms", then the
scan time is 3 x 500 ms = 1500 ms as shown in the following dialog box. This
means that the current scan block will be executed every 1500 ms.
Scanning starts when the DataSite controller is powered, and it continues
according to the scan time you have set.
Master Register
This is the start address of the register on the DataSite controller. Data is saved
into the master register starting from this address. The address range is
determined by the signal type.
Slave Register
This is the start address of the register on the slave equipment for reading data
from and writing data to. The controller will read data from or write data to the
slave equipment from this address. The address range is determined by the
signal type.
Reg_Num
The number of read/write data registers that follow the start register address
of the master register and the slave register. For example, if Reg_Num is 10,
the Master Start_Register is 40001 and the Slave Start_Register is 41001, this
means there are 10 master registers with register addresses running sequentially
from 40001…40010, and 10 slave registers with register addresses
41001…41010.
Publication 1758-UM002D-EN-P - October 2010
Remark
This field lets you enter a note or a tip for the scan block. This information can
be saved onto the PC but unlike other parameters, it will not be downloaded to
the DataSite controller. The maximum string length for this field is 90
characters.
Page 39

DataSite Configuration Settings Utility (DS Settings) 39
Err_Cnt and Err_State
These two parameters do not require user configuration. If you set up a scan
block successfully, two columns for these parameters will be added in the scan
block list automatically.
The Err_Cnt value represents the number of times the scan block fails to
communicate with the slave device. After the scan block is configured, if there
is no connection with the slave device or if communication fails, this value will
be incremented by 1 after each scan cycle.
This value is an indication of the status and efficiency of the communication.
For example, if the value keeps incrementing, this means that the
communication has failed. This could be due to a faulty physical connection
between the DataSite controller and the slave device, or due to incorrect
parameter settings. In addition, a low value indicates a more efficient
communication.
If the Err_State value is 1, it means the communication has failed. A value of 0
indicates that the communication is OK.
Publication 1758-UM002D-EN-P - October 2010
Page 40

40 DataSite Configuration Settings Utility (DS Settings)
TIP
Open the Scan Settings Dialog Box
Follow these steps to open the Scan Settings dialog box.
• From the Tools menu, choose Scan Settings.
The Scan Settings dialog box appears. The file, Scan Block
Parameter.scn, located in the current project directory, is displayed on
the project browser file pane.
You can also double-click the Scan Block Parameter.scn file
in the project browser file pane to open the Scan Settings
dialog box.
Publication 1758-UM002D-EN-P - October 2010
Page 41

DataSite Configuration Settings Utility (DS Settings) 41
Edit a Scan Block
Follow these steps to edit a scan block.
1. In the Scan Settings dialog box, double-click the scan block you want to
edit.
The Edit dialog box appears.
2. Enter the values for the scan block parameters.
See the table Scan block parameters and their descriptions
on page 35.
3. To save the changes and close the Edit dialog box, click OK.
To close the Edit dialog box without saving, click Cancel.
Publication 1758-UM002D-EN-P - October 2010
Page 42

42 DataSite Configuration Settings Utility (DS Settings)
Insert a Scan Block
Follow these steps to insert a scan block.
1. In the Scan Settings dialog box, select a scan block.
2. Click Insert.
An Invalid scan block is created and inserted above the block you
selected in Step 1.
3. Double-click the block to edit it.
4. To save the changes and close the Edit dialog box, click OK.
To close the Edit dialog box without saving, click Cancel.
Delete a Scan Block
Follow these steps to delete a scan block.
1. Select the block you want to delete.
2. Click Delete.
A dialog box prompting you to confirm the deletion appears.
3. To confirm the deletion, click OK.
To cancel the deletion, click Cancel.
Publication 1758-UM002D-EN-P - October 2010
Page 43

DataSite Configuration Settings Utility (DS Settings) 43
Copy a Scan Block
Follow these steps to copy a scan block.
1. Select the block you want to copy.
2. Click Copy.
The selected scan block is copied.
Paste a Scan Block
Follow these steps to paste a block.
1. Select the block you want to copy and paste.
2. Click Copy to copy the block.
Publication 1758-UM002D-EN-P - October 2010
Page 44

44 DataSite Configuration Settings Utility (DS Settings)
TIP
3. Select the row you want to paste the copied block to.
You can only select an empty row that is right after the
selected block, or a row that already contains a block.
4. Click Paste to paste the copied block.
Publication 1758-UM002D-EN-P - October 2010
Page 45

DataSite Configuration Settings Utility (DS Settings) 45
If you are pasting over a row that already contains a block, the following
dialog box appears.
Click Yes to overwrite the block, or No to cancel the pasting.
Paste a Scan Block to Multiple Rows
The Multi_Paste function allows you to paste a copied block to multiple rows.
Follow these steps to paste a copied block to multiple rows.
1. Select the block you want to copy and paste.
2. Click Copy to copy the block.
Publication 1758-UM002D-EN-P - October 2010
Page 46

46 DataSite Configuration Settings Utility (DS Settings)
3. Select the first row you want to paste the copied block to.
4. Click Multi_Paste.
The Multi_Paste dialog box appears.
5. In the Multi_Paste dialog box:
To increment the module ID of the pasted block by 1, select the check
box for Address of module increase.
Publication 1758-UM002D-EN-P - October 2010
To increment the Master Start_register address of the pasted block by 1,
select the check box for Address of Master_Reg increase.
In the Paste number box, enter the number of blocks you want to paste.
Page 47

DataSite Configuration Settings Utility (DS Settings) 47
In this example, if the following settings are made:
the result will be this:
If you are pasting over a row that already contains a block, the following dialog
box appears:
Publication 1758-UM002D-EN-P - October 2010
Page 48

48 DataSite Configuration Settings Utility (DS Settings)
Use the Shortcut Menu
You can also use the shortcut menu for Insert, Delete, Copy and Paste
functions.
Follow this step to use the shortcut menu.
• Right-click the row you want to apply the function to.
The shortcut menu appears.
Here is an example.
Publication 1758-UM002D-EN-P - October 2010
Load the Scan Settings
This function enables you to load the scan settings from the file buffer.
This allows you to verify the configuration while the DataSite controller is
offline.
Follow this step to load previously saved scan settings.
• Click Load.
The last saved Scan Block Parameter configuration is loaded from the
file, Scan Block Parameter.scn and the message, "Load from file
successful", appears in the left corner of the status bar.
Page 49

DataSite Configuration Settings Utility (DS Settings) 49
Save the Scan Settings
This function saves the scan settings into a file buffer on the PC.
Follow this step to save scan settings.
• Click Save.
The settings are written to the file, Scan Block Parameter.scn and the
message, "Save into file successful", appears in the left corner of the
status bar.
Upload the Scan Settings from the Controller
Follow this step to upload (read) scan settings from the DataSite controller.
The controller needs to be online before you can upload the settings.
• Click Upload.
Download the Scan Settings to the Controller
Follow this step to download (write) scan settings to the DataSite controller.
The controller needs to be online before you can download the settings.
• Click Download.
Clear the Error Count
Follow this step to clear the error count in the scan blocks.
• Click Clear Err_Cnt.
Close the Scan Settings Dialog Box
Follow this step to close the Scan Settings dialog box.
• Click Exit.
Publication 1758-UM002D-EN-P - October 2010
Page 50

50 DataSite Configuration Settings Utility (DS Settings)
44679
DataSite controller
COM1
Master Station as 1
00100...00103
DataSite controller
COM1
Slave Station as 2
00001...00004
RS232
100 ms timing
Read-coil
Configuration Example
By configuring a scan block as a US1 or US2 block, we can read from and
write to the equipment connected with the DataSite controller.
For example, we can take two DataSite controllers connected via RS232 serial
communication, with COM1 of one DataSite controller as the master station,
and COM1 of the other controller as the slave station. The master station can
read/write the slave station’s signal via the serial communication between the
two stations.
The following subsections provide you with one way of configuring the
DataSite controllers in this example.
Step 1: Configure the Controller Communications Settings for the Modbus
Master Station
Publication 1758-UM002D-EN-P - October 2010
Page 51

DataSite Configuration Settings Utility (DS Settings) 51
Step 2: Configure the Controller Communications Settings for the Modbus
Slave Station
Publication 1758-UM002D-EN-P - October 2010
Page 52

52 DataSite Configuration Settings Utility (DS Settings)
Publication 1758-UM002D-EN-P - October 2010
Page 53

DataSite Configuration Settings Utility (DS Settings) 53
Step 3: Configure Scan Settings for the Modbus Master Station
Publication 1758-UM002D-EN-P - October 2010
Page 54

54 DataSite Configuration Settings Utility (DS Settings)
TIP
Step 4: Read Master registers to verify communication between Master
station and Slave station
00001…00004 are the DO signal registers of the slave
DataSite controller, and 00100…00103 are the configured
slave registers corresponding to DO signal registers of the
slave DataSite controller.
Publication 1758-UM002D-EN-P - October 2010
Page 55

DataSite Configuration Settings Utility (DS Settings) 55
TIP
TIP
Configure HART Settings
Use HART Settings to configure and send HART command messages.
Customized function blocks that can be triggered in the
user program to provide HART read/write functions are
also available. For more information, see the DataSite
Customized Function Blocks Reference Manual,
1758-RM001
.
Open the HART Settings Dialog Box
Follow this step to open the HART Settings dialog box.
• From the Tools menu, choose HART Settings.
The HART Settings dialog box appears. The file,
HART Block Parameter.hrt, located in the current project directory is
displayed on the project browser file pane.
You can also double-click the HART Block Parameter.hrt
file in the project browser file pane to open the HART
Settings dialog box.
Publication 1758-UM002D-EN-P - October 2010
Page 56

56 DataSite Configuration Settings Utility (DS Settings)
This table provides a description of the column headers in the HART Settings
dialog box.
Description of HART block parameters
Header Description
NO. Serial number of each HART scan block.
HART Channel Channel for the HART interface module to send commands to. The
effective range is 0…2.
•The HART0 channel supports multi-branched HART scan, and the
data of up to 13 pieces of HART equipment can be scanned.
•The HART1 and HART2 channels are point-to-point scan, and not
only do they support HART protocol communication, they also
support standard 4…20 mA signals.
Address Communication address of the HART equipment. The effective
range is 0…15.
Publication 1758-UM002D-EN-P - October 2010
Page 57

DataSite Configuration Settings Utility (DS Settings) 57
IMPORTANT
Description of HART block parameters (Continued)
Header Description
Command HART command to be sent to the HART equipment. The effective
value of each HART command is as follows:
•Read Unique Identifier: 0
•Read Primary Variable:1
•Read P. V. Current And Percent Of Range: 2
•Read Dynamic Variable And P. V. Current: 3
•Read Transmitter Variables: 15
•Read Primary Variable Output Information: 33
•Reset Configuration Changed Flag: 38
•Read additional Transmitter Status: 48
•Read Transmitter Variable Information: 54
Scan Time Time cycle of scanning HART equipment data.
Effective range is 50 ms…50 hours.
Send Register Register for storing command data.
Effective range is 40003…49999 for 1758-RTU controllers and
40003…47999 for 1758-FLO controllers.
Return Register Register for storing command response data.
Effective range is 40003…49999 for 1758-RTU controllers and
40003…47999 for 1758-FLO controllers.
Unit Register Register for storing the unit of HART equipment data returned.
Effective range is 40003…49999 for 1758-RTU controllers and
40003…47999 for 1758-FLO controllers.
HART State Addr Register for storing HART equipment state returned.
Effective range is 40003…49999 for 1758-RTU controllers and
40003…47999 for 1758-FLO controllers.
Err_Cnt Number of times an error occurs.
After the HART scan block is configured, if there is no connection
with the slave device or if communication fails, this value will be
incremented by 1 after each scan cycle. This value is updated
whenever Upload is clicked.
Err_State Error state of HART scan block configuration.
If the Err_State value is 1, it means the communication has failed.
A value of 0 indicates that the communication is OK.
HART scan data blocks are configured in sequence and
each block has a corresponding number. The maximum
number of modules is 128.
When one data block is an empty block, all the blocks
configured after this empty data block will be invalid.
Publication 1758-UM002D-EN-P - October 2010
Page 58

58 DataSite Configuration Settings Utility (DS Settings)
Here is an example of a HART configuration list:
Understand HART Commands
Some of the variables read from HART equipment are 32-bit floating-point
values. Every floating-point value is stored in two continuous data registers.
The higher 16 bits of this value will be stored in the register with a higher
address and the lower 16 bits of this value will be stored in the register with a
lower address. For example, if a 32-bit double precision IEEE floating point
number, such as 1234.5678 is to be stored, two registers, such as register 40108
and register 40109 can be combined to store the number. In hexadecimal,
1234.5678 is 449A 552B. The DataSite controller will store 449A in register
40109 and 522B in register 40108.
Registers Used in HART Commands
The following table lists the number of registers used in each HART command
for the four register types, namely Send, Return, Unit and HART state.
Number of registers used in each HART command
Command Description Number of registers
Send register Return register Unit register HART state
register
0 Read Unique Identifier 0 10 0 2
1 Read Primary Variable 0212
2 Read P. V. Current And Percent Of Range 0402
3 Read Dynamic Variable And P. V. Current 0 10 4 2
15 Read Transmitter Variables 0 10 0 2
33 Read Primary Variable Output Information 4 12 4 2
35 Write Primary Variable Range Values 9002
38 Reset Configuration Changed Flag 0002
40 Enter/Exit Fixed Primary Variable Current
Mode
4002
44Write Primary Variable Units 1002
Publication 1758-UM002D-EN-P - October 2010
Page 59

DataSite Configuration Settings Utility (DS Settings) 59
Number of registers used in each HART command (Continued)
Command Description Number of registers
Send register Return register Unit register HART state
register
48 Read additional Transmitter Status 0 13 0 2
54 Read Transmitter Variable Information 1 10 2 2
59 Write Number Of Response Preambles 1002
If the number of registers is 0 in any command, you do not have to enter a
register address.
The register range is 40003…49999 for 1758-RTU controllers, and
40003…47999 for 1758-FLO controllers.
Description of HART Commands
The following table provides a description of each HART command and the
registers that it uses.
Description of HART commands
Command 0
Purpose Read the equipment identifier.
This command must be configured for each HART device in order
for the other commands to work.
Send register Not used
Return register +0 = manufacturer ID code, 8-bit unsigned integer
+1 = manufacturer equipment type code, 8-bit unsigned integer
+2 = forerunner character number, 8-bit unsigned integer
+3 = global command revision level, 8-bit unsigned integer
+4 = transmitter revision level, 8-bit unsigned integer
+5 = software revision level, 8-bit unsigned integer
+6 = hardware revision level, 8-bit unsigned integer
+7 = equipment function flags, 8-bit unsigned integer
+8, 9 = Device Identification Number (double), 24-bit unsigned
integer
Unit register Not used
HART state register +0 = state 0
+1 = state 1
Command 1
Purpose Read primary variable (P. V.)
Send register Not used
Return register +0, 1 = P. V. (float point)
Publication 1758-UM002D-EN-P - October 2010
Page 60

60 DataSite Configuration Settings Utility (DS Settings)
Description of HART commands (Continued)
Unit register +0 = unit
HART state register +0 = state 0
Command 2
Purpose Read primary variable current and percentage of span
Send register Not used
Return register +0, 1 = P. V. current mA (float point)
Unit register Not used
HART state register +0 = state 0
Command 3
Purpose Read dynamic variables and primary variable current
Send register Not used
+1 = state 1
+2, 3 = P. V. percentage (float point) Purpose
+1 = state 1
Return register +0, 1 = Primary Variable current (float point)
+2, 3 = Primary Variable value (float point)
+4, 5 = Secondary Variable value (float point)
+6, 7 = Tertiary Variable value (float point)
+8, 9 = Fourth Variable value (float point)
Unit register +0 = Primary Variable unit code, 8-bit unsigned integer
+1 = Secondary Variable unit code, 8-bit unsigned integer
+2 = Tertiary Variable unit code, 8-bit unsigned integer
+3 = Fourth Variable Unit code, 8-bit unsigned integer
HART state register +0 = state 0
+1 = state 1
Note Not all equipment return primary, secondary, tertiary and fourth
variables. If the equipment does not support them, zero is written
into the value and units unit code for that variable.
Command 15
Purpose Read Transmitter Variables
Send register Not used
Return register +0 = alarmselect code
+1 = transfer function code, 8-bit unsigned integer
+2 = P. V. range units code, 8-bit unsigned integer
Publication 1758-UM002D-EN-P - October 2010
+3, 4 = upper range value (float point)
+5, 6 = lower range value (float point)
+7, 8 = damping value (second) (float point)
+10 = private-label distributor code, 8-bit unsigned integer
Page 61

Description of HART commands (Continued)
Unit register Not used
HART state register +0 = state 0
Command 33
Purpose Read appointed transmitter variables
Send register +0 = variable 0 code, 8-bit unsigned integer
Return register +0, 1 = Variable 0 value (float point)
Unit register +0 = Variable 0 unit code, 8-bit unsigned integer
DataSite Configuration Settings Utility (DS Settings) 61
+1 = state 1
+1 = variable 1 code, 8-bit unsigned integer
+2 = variable 2 code, 8-bit unsigned integer
+3 = variable 3 code, 8-bit unsigned integer
+2, 3 = Variable 1 value (float point)
+4, 5 = Variable 2 value (float point)
+6, 7 = Variable 3 value (float point)
+1 = Variable 1 unit code, 8-bit unsigned integer
+2 = Variable 2 unit code, 8-bit unsigned integer
+3 = Variable 4 unit code, 8-bit unsigned integer
HART state register +0 = state 0
+1 = state 1
Command 35
Purpose Write Primary Variable Range Values
Send register +0 = Primary Variable 0 code, 8-bit unsigned integer
+1, 2 = Primary Variable upper range value (float point)
+3, 4 = Primary Variable lower range value (float point)
Return register Not used
Unit register Not used
HART state register +0 = state 0
+1 = state 1
Command 38
Purpose Reset Configuration Changed Flag
Send register Not used
Return register Not used
Unit register Not used
HART state register +0 = state 0
+1 = state 1
Command 40
Purpose Enter/Exit Fixed Primary Variable Current Mode
Publication 1758-UM002D-EN-P - October 2010
Page 62

62 DataSite Configuration Settings Utility (DS Settings)
Description of HART commands (Continued)
Send register +0, 1 = Actual fixed Primary Variable current level, units of
Return register Not used
Unit register Not used
HART state register +0 = state 0
Command 44
Purpose Write Primary Variable Units
Send register +0 = Primary Variable units code, 8-bit unsigned integer
Return register Not used
Unit register Not used
HART state register +0 = state 0
Command 48
milliamperes (float point)
+1 = state 1
+1 = state 1
Purpose Read Additional Transmitter Status
Send register Not used
Return register +0, 2 = device specific status, 8-bit unsigned integer
+3 = Operational modes, 8-bit unsigned integer
+4, 5 = Analog outputs saturated, 24-bit unsigned integer
+6, 7 = Analog outputs fixed, 24-bit unsigned integer
+8, 13 = Device-specific status, 8-bit unsigned integer
Unit register Not used
HART state register +0 = state 0
+1 = state 1
Command 54
Purpose Read Transmitter Variable Information
Send register +0 = Code for transmitter variable to be zeroed, 8-bit unsigned
integer
Return register +0 = Return code for transmitter variable to be zeroed, 8-bit
unsigned integer
+1, 2 = Transmit variable sensor serial number, 24-bit unsigned
integer
+3 = Transmit variable limits units code,8-bit unsigned integer
+4, 5 = Transmit variable upper limit (float point)
Publication 1758-UM002D-EN-P - October 2010
+6, 7 = Transmit variable lower limit (float point)
+8, 9 = Transmit variable damping value (seconds) (float point)
+10, 11 = Transmit variable minumum span (float point)
Page 63

Description of HART commands (Continued)
Unit register +0 = Transmit variable code, 8-bit unsigned integer
HART state register +0 = state 0
Command 59
Purpose Write Number of Responses Preambles
Send register +0 = Number of preambles to be sent with the Response message
Return register Not used
Unit register Not used
HART state register +0 = state 0
DataSite Configuration Settings Utility (DS Settings) 63
+1 = Transmit variable limits units code, 8-bit unsigned integer
+1 = state 1
from the Slave to the Master, 8-bit unsigned integer, between 5
and 20
+1 = state 1
Variable and Command
Each piece of HART equipment is designed differently. For example, when
you use command 3 to read variables from HART equipment, the four
dynamic variables returned may have different meanings, and not all four
variables may be valid. Refer to the documentation for the HART equipment
for more information. See also the table, Description of HART commands
.
Response Message
The response message of a piece of HART equipment contains the Err Num
and Err State values. The Err Num value indicates the number of times
communication with the HART equipment has failed. The Err State value
indicates whether communication with the HART equipment is a success or
failure. An Err State value of 0 means that communication with HART
equipment is successful. An Err State value of 1 means that the
communication with HART equipment has failed.
You can also read the response code from the HART equipment. It is stored
as two bytes in the state register which you have configured in the HART scan
block. If bit 7 in the first byte is 1, this byte is bit-mapped and all the
communication errors are displayed in this byte. If bit 7 in the first byte is 0,
this byte is not bit-mapped and the meaning is determined by the value of bit 6
through bit 0.
Publication 1758-UM002D-EN-P - October 2010
Page 64

64 DataSite Configuration Settings Utility (DS Settings)
The following tables list the definition of the first two bytes of the response
code according to the HART protocol.
First byte when bit 7 = 1 (Communication Error)
Bit Value Description
6 hex C0 Parity error
5 hex A0 Overrun error
4 hex 90 Framing error
3 hex 88 Checksum error
2 hex 84 0 (reserved)
1 hex 82 Rx buffer overflow
0 hex 81 Overflow (undefined)
First byte when bit 7 = 0 (Command Response)
Bit Description
(1)
0
(1)
1
(1)
2
(1)
3
(1)
4
(1)
5
(1)
6
No command-specific error
(Undefined)
Invalid selection
Passed parameter too large
Passed parameter too small
Too few data bytes received
Device-specific command error (rarely used)
7 In write-protect mode
8 This bit can mean any of the following:
•Update failure—Returned real-time data has not changed since last read from field device.
•Warning: Update failure—Real-time data returned has not changed since last read.
•Warning: Set to nearest possible value—Command is accepted but limitations of the field device has caused data sent to
be rounded or truncated.
•Warning: Update in progress—Results of a command are excluded from its status because the command is still in the
process of being completed.
•Warning: External input is not set to 4…20 mA temperature.
•Warning: Time is corrupt.
•Warning: Units and 4/20 points set to new sensor limits.
9 This bit can mean any of the following:
•Lower range value too high—Lower range value is greater than the upper sensor limit.
•Applied process too high—Process applied to the field device is too high.
•Not in proper current mode—Field device is not in fixed current mode, or the current has not been set to the correct value.
•Not in proper analog output mode—Field device is not in fixed analog output mode, or the analog output has not been set
to the correct value.
Publication 1758-UM002D-EN-P - October 2010
Page 65

First byte when bit 7 = 0 (Command Response) (Continued)
Bit Description
9
(Continued)
•Invalid module type code—Selected module type code is not valid.
•Invalid flange type code—Selected flange type code is not valid.
•Frequency set point too high—Value entered for the frequency set point is too high.
•Density high limit too high—Value entered for the density high limit is too high.
•Selected totalizer cannot be reset—Totalizer selected for display and tertiary variable cannot be reset.
•Invalid page—Page requested is not supported.
•Invalid level units.
•Filter auto-adjust error.
•Maximum zeroing time is too large.
•DI too high—Value of the first density data is too high.
•Not in reference or sample mode.
•Invalid date.
•Invalid alarm relay HOLD default code.
•Frequency too high.
DataSite Configuration Settings Utility (DS Settings) 65
10 This bit can mean any of the following:
•Lower range value too low—Lower range value is less than the lower sensor limit.
•Applied process too low—Process applied to the field device is too low.
•Multidrop not supported—Field device does not support multidrop.
•Invalid range code—Range code selected is not valid.
•Calibration location not set to user—Before this command can be accepted, the calibration location must be set to User.
•Invalid configuration for special calibration—Configuration is not set properly for special calibration.
•Invalid liner material code—Liner material code selected is not valid.
•Frequency set point too low—Value entered for the frequency set point is too low.
•Density high limit too low—Value entered for the density high limit is too low.
•Invalid address—Address for this field device is not valid.
•Trim location not set to user—Before this command can be accepted, trim location must be set to User.
•Invalid body type code.
•Invalid volume units.
•Invalid density units.
•Maximum zeroing time is too small.
•DI too low—Value of the first density data is too low.
•Instrument in reference mode.
•Invalid analog output type code.
•Invalid automatic temperature compensation code.
•Invalid alarm relay configuration code.
•Frequency too low.
•Invalid low/high millivolt code
Publication 1758-UM002D-EN-P - October 2010
Page 66

66 DataSite Configuration Settings Utility (DS Settings)
First byte when bit 7 = 0 (Command Response) (Continued)
Bit Description
11 This bit can mean any of the following:
•Upper range value too high—Upper range value is greater than the upper sensor limit.
•Excess correction attempted—Correction attempted is outside of the permissible limits of the field device.
•In multidrop mode—When in multidrop mode, this command cannot be performed. The analog output is deactivated and
cannot be used when the polling address is set to a value within the range of 1…15.
•Invalid sensor type code—Sensor type code selected is not valid.
•Invalid sensor material code—Sensor material code selected is not valid.
•Invalid base volume units code—Base volume units code selected is not valid.
•Invalid base flow units code—Base flow units code selected is not valid.
•Flow rate set point too high—Value entered for the flow rate set point is too high.
•Density low limit too high—Value entered for the density low limit is too high.
•Access denied—Access to this part of the memory is not allowed.
•Invalid transmitter variable code.
•Invalid item number.
•Invalid wetted material code.
•Standard deviation too large.
•D2 too high—Value of the second density data is too high.
•Instrument in sample mode.
•Invalid calibration point.
•Flow rate factor too high.
•Invalid analog output HOLD code.
12 This bit can mean any of the following:
•Upper range value too low—Upper range value is less than the lower sensor limit.
•Invalid characterization—Characterization of the sensor is not valid.
•Invalid number of wires—Number of wires on the sensor is not valid.
•Invalid calibration point units code—Units code sent with the calibration point is not valid.
•Invalid calibration location code—Calibration location code selected is not valid.
•Invalid base time units code—Base time units code selected is not valid.
•Flow rate set point too low—Value entered for the flow rate set point is too low.
•Incorrect format—Format of the parameter entered is not correct.
•Density low limit too low—Value entered for the density low limit is too low.
•Write to ROM attempted—Writing of data to read-only memory is attempted.
•Invalid units code.
•Invalid sensor connection code.
•Invalid trim points units code—Units code sent with the trim point is not valid.
•Invalid trim location code—Trim location code selected is not valid.
•Invalid base mass time units.
•Invalid base volume time units.
•Standard deviation too small.
•Standard factor format.
Publication 1758-UM002D-EN-P - October 2010
Page 67

First byte when bit 7 = 0 (Command Response) (Continued)
Bit Description
12
(Continued)
•D2 too low—Value of the second density data is too low.
•Invalid command number.
•Invalid density units and calibration point.
•Flow rate factor too low.
13 This bit can mean any of the following:
•Upper and lower range values out of limits—Upper and lower range values are outside of their limits.
•Range and sensor type not entered—Before characterization, range and sensor type need to be entered.
•Invalid number of bytes—The Number of Bytes parameter received in this command is not valid.
•Invalid meter option—Meter option selected is not valid.
•Special sensor not available—Calibration for special sensor is not available.
•Invalid transfer function code.
•Invalid strapping point number.
•Invalid base mass flow units.
•Invalid base volume flow units.
•Invalid trim point number.
•Invalid cutoff type code.
•Invalid security code.
•Invalid alarm relay delay time code.
DataSite Configuration Settings Utility (DS Settings) 67
15 This bit can mean any of the following:
•Invalid analog output number code.
•Invalid level value.
•Invalid alarm relay number code.
•Invalid buffer number code.
16 Access restricted
28 Invalid range units code.
32 Device is busy
64 Command not implemented
(1)
Bits 6…0 are decoded as an integer, and not bit-mapped.
Publication 1758-UM002D-EN-P - October 2010
Page 68

68 DataSite Configuration Settings Utility (DS Settings)
Second byte - when unused
Bit Description
7
6
5
4
3
2
1
0
Second byte - Field Device Status
Bit Value Description
7 hex 80 Field device malfunction
6 hex 40 Configuration changed
All bits 0 (when a communication error is reported in
the first byte).
5 hex 20 Cold start
4 hex 10 More status available
3 hex 08 Analog output current fixed
2 hex 04 Analog output saturated
1 hex 02 Nonprimary variable out of limits
0 hex 01 Primary variable out of limits
Insert a HART Scan Block
Follow these steps to insert a HART scan block.
1. In the HART Settings dialog box, select the row where you want to
insert the scan block to and click Insert. Alternatively, you can
double-click the row.
Note that you cannot insert data after an empty data block.
An Invalid scan block is inserted.
2. Double-click the block to edit.
Publication 1758-UM002D-EN-P - October 2010
Page 69

DataSite Configuration Settings Utility (DS Settings) 69
Edit a HART Scan Block
Follow these steps to edit a HART scan block.
1. Double-click the block you want to edit.
The Edit dialog box appears. The NO. box displays the serial number of
the current HART scan block.
Effective values of HART commands
Effective Value HART Commands Effective Value
0 Read Unique Identifier
1 Read Primary Variable
2. From the HART Channel pull-down menu, choose a channel for the
HART interface module to send commands to. The effective range is
0…2.
• The HART0 channel supports multi-branched HART scan, and the
data of up to 13 pieces of HART equipment can be scanned.
• The HART1 and HART2 channels are point-to-point scan, and not
only do they support HART protocol communication, they also
support data collection of 4…20 mA. You should set the HART
address as 0.
3. In the Address box, specify the communication address of the HART
equipment. The effective range is 0…15.
4. From the Command Num pull-down menu, choose the HART
commands to be sent to the HART equipment. This table shows the
effective value of each HART command.
2 Read P. V. Current And Percent Of Range
3 Read Dynamic Variable And P. V. Current
15 Read Transmitter Variables
33 Read Primary Variable Output Information
Publication 1758-UM002D-EN-P - October 2010
Page 70

70 DataSite Configuration Settings Utility (DS Settings)
IMPORTANT
TIP
Effective values of HART commands (Continued)
Effective Value HART Commands Effective Value
35 Write Primary Variable Range Values Only Use in HART TRIG block
38 Reset Configuration Changed Flag
40 Enter/Exit Fixed Primary Variable Current Mode Only Use in HART TRIG block
44 Write Primary Variable Units Only Use in HART TRIG block
48 Read additional Transmitter Status
54 Read Transmitter Variable Information
59 Write Number Of Response Preambles Only Use in HART TRIG block
5. In the Scan Time box, enter the number of units and select the time unit
Command 0 must be configured for each HART device in
order for the other commands to work.
to specify the time cycle of scanning HART equipment data.
For example, if you enter "1" for the number of units, and select
"(500 ms)" for the time unit, the scan time will be 1 x 500 ms = 500 ms.
This means that the current HART scan block will be executed every
500 ms.
6. In the Send Register box, define the register for storing command data.
7. In the Return Register box, define the register for storing command
response data.
8. In the Unit Register box, define the register for storing the unit of
HART equipment data returned.
9. In the HART State Addr box, define the register for storing the HART
equipment state returned.
The register range is 40003…49999 for 1758-RTU
controllers, and 40003…47999 for 1758-FLO controllers.
See Description of HART commands
on page 58 for more
information on the Send, Return, Unit, and HART State
Addr registers.
10. Click OK.
The Edit dialog box is closed and the settings are saved to the new
block.
Publication 1758-UM002D-EN-P - October 2010
Page 71

DataSite Configuration Settings Utility (DS Settings) 71
Delete a HART Scan Block
Follow these steps to delete a HART scan block.
1. Select the block you want to delete.
2. Click Delete.
A dialog box prompting you to confirm the deletion appears.
3. To confirm the deletion, click OK.
To cancel the deletion, click Cancel.
Copy a HART Scan Block
Follow these steps to copy a HART scan block.
1. Select the block you want to copy.
2. Click Copy.
Paste a HART Scan Block
Follow these steps to paste a HART scan block.
1. Select the block you want to copy and paste.
2. Click Copy to copy the block.
Publication 1758-UM002D-EN-P - October 2010
Page 72

72 DataSite Configuration Settings Utility (DS Settings)
TIP
3. Select the row you want to paste the copied block to.
You can only select an empty row that is right after the
selected block, or a row that already contains a block.
4. Click Paste to paste the copied block.
If you are pasting over a row that already contains a block, the following
dialog box appears.
Publication 1758-UM002D-EN-P - October 2010
Click Yes to overwrite the block, or No to cancel the pasting.
Page 73

DataSite Configuration Settings Utility (DS Settings) 73
Paste a HART Scan Block to Multiple Rows
Use the Multi_Paste function to paste a HART scan block to multiple rows.
This function works in the same way as the Multi_Paste function in the Scan
Settings dialog box. For details, see Paste a Scan Block to Multiple Rows
page 45.
on
Use the Shortcut Menu
You can also use the shortcut menu for Insert, Delete, Copy and Paste
functions.
Follow this step to use the shortcut menu.
• Right-click the row you want to apply the function to.
The shortcut menu appears.
Here is an example.
Publication 1758-UM002D-EN-P - October 2010
Page 74

74 DataSite Configuration Settings Utility (DS Settings)
Load the HART Settings
This function enables you to load the HART settings previously saved in a file
buffer on the PC. This allows you to verify the settings while the DataSite
controller is offline.
Follow this step to load HART settings from the file.
• Click Load.
If the settings are loaded successfully, the status bar will display the
message, "Load from file successful".
Publication 1758-UM002D-EN-P - October 2010
Save the HART Settings
Follow this step to save the HART settings into a file buffer on the PC.
• Click Save.
If the settings are saved successfully, the message, "Save into file
successful" will be displayed in the status bar. The settings are saved to
the file, HART Block Parameter.hrt, by default.
Page 75

DataSite Configuration Settings Utility (DS Settings) 75
Upload the HART Settings from the Controller
Follow this step to upload (read) HART settings from the DataSite controller.
The controller needs to be online before you can upload the settings.
• Click Upload.
Download the HART Settings to the Controller
Follow this step to download (write) HART settings to the DataSite controller.
The controller needs to be online before you can download the settings.
• Click Download.
Clear the Error Count
Follow this step to clear the error count in HART scan data block of
controller.
• Click Clear Err.
Close the HART Settings Dialog Box
Follow this step to close the HART Settings dialog box.
• Click Exit.
Publication 1758-UM002D-EN-P - October 2010
Page 76

76 DataSite Configuration Settings Utility (DS Settings)
TIP
Configure Event Settings
Use Event Settings to configure these four types of RTC interruption events.
• System events
• Alarm events
• Calendar events
• Time events
Configuring these events in the Event Settings dialog box is equivalent to
programming the corresponding function blocks in DataSite Workbench:
• System events: EV_SEC_CFG
• Alarm events: EV_CLK_CFG
• Calendar events: EV_CALE_CFG
• Time events: EV_TIME_CFG
For more information on using these function blocks, refer to the Customized
Function Blocks for DataSite Reference Manual, publication 1758-RM001
Follow this step to open the Event Settings dialog box.
• From the Tools menu, choose Event Settings.
.
The Event Settings dialog box appears. The file, Event Parameter.evt,
located in current project directory, is displayed on project browser file
pane.
Publication 1758-UM002D-EN-P - October 2010
You can also double-click the Event Parameter.evt file in
the project browser file pane to open the Event Settings
dialog box.
Page 77

DataSite Configuration Settings Utility (DS Settings) 77
Event Examples
For an illustration on how the Event Settings dialog box can be used to
configure an event, see the following examples.
Example for a System Event
Set and get a system event that occurs at one-second intervals.
1. In the Event Settings dialog box, select the Second Event check box.
Then, click Download. Another method is to use EV_SEC_CFG and
EV_RTC_SET to configure the second event.
2. Use EV_GET to read the RTC return value and check bit 0 for the
second event. Bit 0 will be set to ‘1’ when the second event occurs.
Publication 1758-UM002D-EN-P - October 2010
Page 78

78 DataSite Configuration Settings Utility (DS Settings)
Example for an Alarm Event
Set and get an alarm event at 8:30 a.m. every day.
1. In the Event Settings dialog box, select the Alarm Enable, Hour,
Minute, and Second check boxes. Enter the time in the Hour, Minute,
and Second boxes, and then click Download. Another method is to use
EV_CLK_CFG and EV_RTC_SET to configure the alarm event.
2. Use EV_GET to read the RTC return value and check bit 3 for the
alarm event. Bit 3 will be set to ‘1’ when the RTC event occurs.
Example for a Calendar Event
Set and get an event that occurs at 0 seconds, 0 minutes, 0 hours on the first
day of every month.
1. In the Event Settings dialog box, select the Calendar Enable check box
and click Month. Then, click Download. Another method is to use
EV_CALE_CFG and EV_RTC_SET to configure the event.
Publication 1758-UM002D-EN-P - October 2010
2. Use EV_GET to read the RTC return value and check bit 2 for the
second event. Bit 2 will be set to ‘1’ when the second event occurs.
Page 79

DataSite Configuration Settings Utility (DS Settings) 79
Example for a Time Event
Set and get an event that occurs at 0 seconds, 0 minutes of every hour.
1. Select the Time Enable check box and click Hour in the Event Settings
dialog box. Then, click Download. Another method is to use
EV_TIME_CFG and EV_RTC_SET to configure the event.
2. Use EV_GET to read the RTC return value and check bit 1 for the
second event. Bit 1 will be set to ‘1’ when the second event occurs.
Configure a System Event
Follow this step to configure a system event.
• To enable an event interruption with an interval of 1s, select the Second
Event check box.
When you select this check box, the system will provide an interruption
signal every second. You can program the EV_GET function block in
DataSite Workbench to retrieve the interruption signals according to
your application requirements.
Publication 1758-UM002D-EN-P - October 2010
Page 80

80 DataSite Configuration Settings Utility (DS Settings)
Configure an Alarm Event
Follow these steps to configure an alarm event.
1. Select the Alarm Enable check box.
2. Select the check box for the date/time attribute you want to set.
3. For each check box you have selected in step 2, enter the date/time
Alarm events are enabled.
value in the corresponding box.
The alarm event will be executed based on the frequency you set.
For example, if you set Month as 1, Day 20, Minute 3, and Second 5, the
alarm event will be executed annually at the third minute and fifth
second of every hour on January 20.
Configure a Calendar Event
Follow these steps to configure a calendar event.
1. Select the Calendar Enable check box.
Calendar events are enabled.
2. Select one of the options: Year, Month, Week.
The option you select determines how frequently the calendar event
routine will be executed.
• Year
Annually, on January 1, at 0 hours (midnight), 0 minutes, 0 seconds, a
corresponding calendar interruption task you have written in
DataSite Workbench is executed.
• Month
On the first day of every month at 0 hours (midnight), 0 minutes, 0
seconds, a corresponding calendar interruption task you have written
in DataSite Workbench is executed.
Publication 1758-UM002D-EN-P - October 2010
• Week
On the Monday of every week at 0 hours (midnight), 0 minutes, 0
seconds, a corresponding calendar interruption task you have written
in DataSite Workbench is executed.
Page 81

DataSite Configuration Settings Utility (DS Settings) 81
Configure a Time Event
Follow these steps to configure a time event.
1. Select the Time Enable check box.
Time events are enabled.
2. Select one of the options: Minute, Hour, Midday, Midnight.
The option you select determines how frequently the time event routine
will be executed.
• Minute
At 0 seconds of every minute, a corresponding time break task is
executed in the application program written by users.
• Hour
At 0 seconds, 0 minutes, hourly, a corresponding time break task is
executed in the application program written by users.
• Midday
At 0 seconds, 0 minutes, 12 hours (noon), daily, a corresponding time
break task is executed in the application program written by users.
• Midnight
At 0 seconds, 0 minutes, 0 hours (midnight), daily, a corresponding
time break task is executed in the application program written by
users.
Upload Event Settings from the Controller
Follow this step to upload (read) the event settings from the DataSite
controller. The controller needs to be online before you can upload the
settings.
• Click Upload.
Download Event Settings from the Controller
Follow this step to download (write) event settings to the DataSite controller.
The controller needs to be online before you can download the settings.
• Click Download.
Publication 1758-UM002D-EN-P - October 2010
Page 82

82 DataSite Configuration Settings Utility (DS Settings)
IMPORTANT
Save the Event Settings
Follow this step to save the event settings into the file, Event Parameter.evt, on
the PC.
Load the Event Settings
• Click Save.
If the settings are saved successfully, the message, "Save into file
successful" will appear in the status bar of the Event Settings dialog box.
If you have made any changes in the Event Settings dialog
box without saving them, the changes will be discarded
once the saved settings are loaded from the file.
Follow this step to load event settings from the file, Event Parameter.evt.
• Click Load.
If the settings are loaded from the file successfully, the message, "Load
from file successful" will appear in the status bar of the Event Settings
dialog box.
Close the Event Settings Dialog Box
Follow this step to close the Event Settings dialog box.
• Click Exit.
Publication 1758-UM002D-EN-P - October 2010
Page 83

DataSite Configuration Settings Utility (DS Settings) 83
Debug the Controller Programs
The Controller Debug function allows you to use test registers and retrieve
data from the DataSite controller for online or offline debugging of the user
programs you have written for the controller in DataSite Workbench.
Note that you can use this function to view a DataSite register value. Only
DataSite registers can be monitored. DataSite Workbench internal variables
cannot be monitored unless they are written into a DataSite register.
Open the Controller Debug Dialog Box
Follow this step to open the Controller Debug dialog box.
• From the Tools menu, choose Controller Debug.
The Controller Debug dialog box appears, and the file, Controller
Debug.rgf, located in the current project directory is displayed in the
project browser file pane.
Publication 1758-UM002D-EN-P - October 2010
Page 84

84 DataSite Configuration Settings Utility (DS Settings)
Toggle between Online and Offline Debugging
The Offline/Online button lets you toggle between online and offline
debugging for test registers in the DataSite controller.
Follow this step to toggle between online and offline debugging modes.
• Click Offline/Online.
Publication 1758-UM002D-EN-P - October 2010
Page 85

DataSite Configuration Settings Utility (DS Settings) 85
TIP
Set the Scan Time for the Online Debugging Mode
When you are debugging in the online mode, register data is refreshed at
regular intervals. You may change this interval according to your requirements.
Follow these steps to set the scan time.
1. Click Offline to go to the offline mode.
This value can only be set when you are in the offline
debugging mode.
2. In the scan time box, enter a value for the desired time interval.
The default interval is 100 ms.
3. Click Online to go to the online mode.
Add a Register Group
Follow these steps to add a group of registers.
1. Click New Group.
The New Group box appears.
2. Enter a name for the new group.
3. Click OK.
The new group is added and listed in the Register Group box.
Publication 1758-UM002D-EN-P - October 2010
Page 86

86 DataSite Configuration Settings Utility (DS Settings)
Delete a Register Group
Follow these steps to delete a group of registers.
1. In the Register Group box, select the group you want to delete.
2. Click Delete Group.
3. To confirm the deletion, click OK.
Rename a Register Group
Follow these steps to rename a register group.
You are prompted to confirm the deletion.
To cancel the deletion, click Cancel.
1. In the Register Group box, select the register group you want to rename.
2. Click Rename Group.
3. In the New text box, enter a new name for the group.
4. Click OK.
The new name appears in the Register Group box.
Add Registers
Follow these steps to add new registers.
1. In the Register Group box, select the group you want to add a register
to.
Publication 1758-UM002D-EN-P - October 2010
2. Click Add Register.
Page 87

DataSite Configuration Settings Utility (DS Settings) 87
The Add Register dialog box appears.
3. In the Start_Addr text box, enter the address for the register.
4. In the Reg_Cnt text box, enter the number of registers you want to add.
If you are adding more than one register, the Start_Addr value will be
the address for the first register. Subsequent registers will have
consecutive addresses.
5. From the Type pull-down menu, select a register type from the
following options:
• Unsigned 16 bit unsigned int
• Signed 16 bit signed int
• Float Point 32 bit float number
• Hexadecimal Hexadecimal form
• Binary binary form
• ASCII ASCII code form
• BOOL BOOL type
If the selected register type does not map to Start_Addr, this error
message appears. Click OK and reselect the register type.
6. Click Add.
If the register address you entered is invalid, this error message appears.
Click OK and re-enter the register address.
Publication 1758-UM002D-EN-P - October 2010
Page 88

88 DataSite Configuration Settings Utility (DS Settings)
IMPORTANT
Edit a Register
Follow these steps to edit a register.
1. In the Register Group box, select the group which contains the register
2. Select the register and click Edit Register. Alternatively, you can
3. In the Value text box, enter the new value for the register.
you want to edit.
double-click the register you want to edit.
The Edit dialog box appears.
4. From the Type pull-down menu, select the corresponding data type for
the register address.
5. Click OK.
The changes are saved.
Delete a Register
Follow these steps to delete a register.
There is no Undo function for the Delete Register action.
1. In the Register Group box, select the group which contains the register
you want to delete.
2. Select the register and click Delete Register.
The register is deleted.
Publication 1758-UM002D-EN-P - October 2010
Page 89

DataSite Configuration Settings Utility (DS Settings) 89
Read the Controller-Run Parameters
Operational parameters for the DataSite controller include Battery Voltage,
Controller Temperature, System Status, and System Clock.
Follow this step to read these parameters from the controller.
1. Click Read.
2. To read these parameters continuously, select the Read Continue check
box.
These parameters can be read by the application programs written using
DataSite Workbench.
Controller Temperature
This is the internal temperature of the controller.
Battery Voltage
This is the battery voltage of the controller. When the battery voltage is lower
than 2.0V, you need to replace the battery.
System Status
Publication 1758-UM002D-EN-P - October 2010
Page 90

90 DataSite Configuration Settings Utility (DS Settings)
All the states of controller are showed by a 16-bit code. For details, see the
following tables.
Error codes
Error Code Meaning
0x0001 Hardware register error
0x0002 Data FLASH error
0x0100 HART communication error
0x0200 US1 communication error
0x0400 US2 communication error
If more than one error occurs, an "OR" operation will be performed on the
codes. For example, if both US1 and US2 communication errors occur, the
error code will be 0600. If all errors occur, the code will be 0703.
Initialization state codes
Initialization State Code Meaning
0x0001 Test communication.
0x0002 Initialize communication parameters.
0x0004 Clear the DataSite Workbench application.
0x0008 Initialize registers.
0x0100 Initialize file system.
0x0200 Initialize DNP3.
If more than one initialization state exists, an "OR" operation will be
performed on the codes. For example, a code of 0x0102 means that test
communication and initialization of communication parameters are in
progress.
DS Workbench Status codes
DS Workbench Status Code Meaning
0001 DataSite Workbench is running.
0000 DataSite Workbench is stopped.
Clear Error Codes
Follow this step to clear the error codes of the controller.
Publication 1758-UM002D-EN-P - October 2010
• Click Clear Error
Page 91

DataSite Configuration Settings Utility (DS Settings) 91
Adjust the System Time
There are two ways of adjusting the system time of the DataSite controller.
If you want to synchronize the controller time with the system time of the host
computer to the DataSite controller, do the following.
• In the Debug dialog box, click Adjust Time.
The controller time will be synchronized with the PC Time.
If you need to set the controller time to a different value as the PC time, for
example, when you need to debug the controller, do the following.
1. In the Debug dialog box, click Set Time.
The Set Time dialog box appears.
2. Enter the date and time.
3. Click OK to write the new time into the controller.
Close the Controller Debug Dialog Box
Follow this step to close the Controller Debug dialog box.
• Click Exit.
Publication 1758-UM002D-EN-P - October 2010
Page 92

92 DataSite Configuration Settings Utility (DS Settings)
IMPORTANT
Initialize the Controller
Use the Controller Initialize function to initialize the DataSite controller.
Open the Controller Initialize Dialog Box
Follow this step to open the Controller Initialize dialog box.
• From the Tools menu, choose Controller Initialize.
The Controller Initialize dialog box appears.
Switch Controller into Service Mode
To initialize the controller, you must set the controller into the Service mode
first.
Follow these steps to set the controller into the Service mode.
1. Power down the DataSite controller.
2. Use a serial communication cable to connect one PC serial port with the
COM2 of the controller.
Only COM2 can be used.
Publication 1758-UM002D-EN-P - October 2010
Page 93

DataSite Configuration Settings Utility (DS Settings) 93
3. From the Tools menu, choose Controller Initialize.
4. Select the Connect Controller check box.
5. Power up the DataSite controller.
6. When "US Download!" appears in the Infomation box, clear the
Connect Controller check box.
The DataSite controller has successfully gone into the Service mode.
Publication 1758-UM002D-EN-P - October 2010
Page 94

94 DataSite Configuration Settings Utility (DS Settings)
Initialize DataSite Workbench
Follow these steps to clear DataSite Workbench in the DataSite controller.
1. Set the controller into the Service mode.
2. Select the DS Workbench Initialization check box.
3. Click Set.
4. Click Run, and exit the local connection.
Reset the Controller Communication Parameters
All settings will be downloaded into the controller.
Follow these steps to reset the controller communication parameters to their
default values.
1. Set the controller into the Service mode.
2. Select the System Initialize check box.
3. Click Set.
All settings will be downloaded into the controller.
Publication 1758-UM002D-EN-P - October 2010
4. Click Run, and exit the local connection.
Page 95

DataSite Configuration Settings Utility (DS Settings) 95
See Display the Default Settings on page 28 for the default values of the
controller communication parameters.
Reset the Register Values
Follow these steps to reset the register values in the controller to 0.
1. Set the controller into the Service mode.
2. Select the Register Initialize check box.
3. Click Set.
All settings will be downloaded into the controller.
4. Click Run, and exit the local connection.
Reset the DNP3 Parameters
Follow these steps to reset all the DNP3 parameters to their default values.
1. Set the controller into the Service mode.
2. Select the DNP3 Initialize check box.
3. Click Set.
Publication 1758-UM002D-EN-P - October 2010
Page 96

96 DataSite Configuration Settings Utility (DS Settings)
All settings will be downloaded into the controller.
4. Click Run, and exit the local connection.
Test the Communication
Follow these steps to obtain the communication settings of the DataSite
controller, such as baud rate of the serial port, and the IP address of the
Ethernet port.
1. Set the controller into the Service mode.
2. Select the Communication Test check box.
3. Click Set.
All settings will be downloaded into the controller.
Publication 1758-UM002D-EN-P - October 2010
Page 97

DataSite Configuration Settings Utility (DS Settings) 97
4. Click Run followed by Close.
Here the communication parameters of COM2 are set to be test
parameters. See this table.
COM2 communication test parameters
Parameter name Parameter value
Station 1
Protocol Modbus RTU
Master/Slave state Slave
Duplex Full
Baud rate (bps) 57600
Parity None
Data bits 8
Stop bits 1
Port type RS232
Timeout (10 ms) 100
Delay time (10 ms) 0
5. Start DS Settings, and choose PC Communication Settings from the
Tools menu. Set the PC baud rate as 57600.
Publication 1758-UM002D-EN-P - October 2010
Page 98

98 DataSite Configuration Settings Utility (DS Settings)
6. From the Tools menu, choose Controller Communication Settings.
Publication 1758-UM002D-EN-P - October 2010
When the upload is successfully completed, the communication settings
of controller are displayed.
7. To exit the Communication Test state, power down the DataSite
controller and then power it up again.
Page 99

DataSite Configuration Settings Utility (DS Settings) 99
Initialize the File System
The File System Initialization option lets you do the following:
• Clear all the parameter settings made in DS Settings, for example, Scan
block, HART scan block and PID block settings.
• Clear DNP3 settings
• Clear registers
This is equivalent to selecting the following check boxes:
• Register Initialization
• DNP3 Initialization
• DS Workbench inititialization
Follow these steps to initialize the file system.
1. Set the controller into the Service mode.
2. Select the File System Initialize check box.
A dialog box appears, prompting you to confirm the initialization.
3. Click Yes.
Publication 1758-UM002D-EN-P - October 2010
Page 100

100 DataSite Configuration Settings Utility (DS Settings)
Status messages corresponding to the file initialization appear in the
Information box.
4. Click Run, and exit the local connection.
Publication 1758-UM002D-EN-P - October 2010
 Loading...