

Page 1

BC-20
Auto Hematology Analyzer
Operator’s Manual
Page 2

Page 3

© 2012-2017 Shenzhen Mindray Bio-medical Electronics Co., Ltd. All rights Reserved.
For this Operator’s Manual, the issued Date is 2017-09.
Intellectual Property Statement
SHENZHEN MINDRAY BIO-MEDICAL ELECTRONICS CO., LTD. (hereinafter called
Mindray) owns the intellectual property rights to this Mindray product and this manual. This
manual may refer to information protected by copyright or patents and does not convey any
license under the patent rights or copyright of Mindray, or of others.
Mindray intends to maintain the contents of this manual as confidential information.
Disclosure of the information in this manual in any manner whatsoever without the written
permission of Mindray is strictly forbidden.
Release, amendment, reproduction, distribution, rental, adaptation, translation or any other
derivative work of this manual in any manner whatsoever without the written permission of
Mindray is strictly forbidden.
, , are the trademarks, registered or otherwise, of Mindray in
China and other countries. All other trademarks that appear in this manual are used only for
informational or editorial purposes. They are the property of their respective owners.
Responsibility on the Manufacturer Party
Contents of this manual are subject to changes without prior notice.
All information contained in this manual is believed to be correct. Mindray shall not be liable
for errors contained herein nor for incidental or consequential damages in connection with the
furnishing, performance, or use of this manual.
Mindray is responsible for the effects on safety, reliability and performance of this product,
only if:
all installation operations, expansions, changes, modifications and repairs of this product
are conducted by Mindray authorized personnel.
the electrical installation of the relevant room complies with the applicable national and
local requirements.
the product is used in accordance with the instructions for use.
I
Page 4

It is important for the hospital or organization that employs this equipment
to carry out a reasonable service/maintenance plan. Neglect of this may
result in machine breakdown or injury of human health.
Be sure to operate the analyzer under the situation specified in this manual;
otherwise, the analyzer will not work normally and the analysis results will
be unreliable, which would damage the analyzer components and cause
personal injury.
NOTE
This equipment must be operated by skilled/trained clinical professionals.
II
Page 5

Warranty
THIS WARRANTY IS EXCLUSIVE AND IS IN LIEU OF ALL OTHER WARRANTIES,
EXPRESSED OR IMPLIED, INCLUDING WARRANTIES OF MERCHANTABILITY OR
FITNESS FOR ANY PARTICULAR PURPOSE.
Exemptions
Mindray's obligation or liability under this warranty does not include any transportation or
other charges or liability for direct, indirect or consequential damages or delay resulting from
the improper use or application of the product or the use of parts or accessories not approved
by Mindray or repairs by people other than Mindray authorized personnel.
This warranty shall not extend to:
Malfunction or damage caused by improper use or man-made failure.
Malfunction or damage caused by unstable or out-of-range power input.
Malfunction or damage caused by force majeure such as fire and earthquake.
Malfunction or damage caused by improper operation or repair by unqualified or
unauthorized service people.
Malfunction of the instrument or part whose serial number is not legible enough.
Others not caused by instrument or part itself.
III
Page 6

Customer Service Department
EC-Representative:
Shanghai International Holding Corp. GmbH(Europe)
Address:
Eiffestraβe 80, Hamburg 20537, Germany
Tel:
0049-40-2513175
Fax:
0049-40-255726
Manufacturer:
Shenzhen Mindray Bio-Medical Electronics Co., Ltd.
Address:
Mindray Building, Keji 12th Road South, High-tech industrial park, Nanshan,
Shenzhen 518057,P.R.China
Website:
www.mindray.com
E-mail Address:
service@mindray.com
Tel:
+86 755 81888998
Fax:
+86 755 26582680
IV
Page 7

Table of Contents
1 Using This Manual ............................................................................................... 1-1
1.1 Introduction ............................................................................................................ 1-1
1.2 Who Should Read This Manual ............................................................................. 1-2
1.3 How to Find Information ........................................................................................ 1-3
1.4 Conventions Used in This Manual ......................................................................... 1-4
1.5 Terms Used in Software Operation ....................................................................... 1-5
1.6 Symbols ................................................................................................................. 1-6
2 Understanding Your Analyzer ............................................................................ 2-1
2.1 Introduction ............................................................................................................ 2-1
2.2 Product Description ............................................................................................... 2-2
2.3 Parameter .............................................................................................................. 2-3
2.4 Main Structure ....................................................................................................... 2-4
2.5 User Interface ...................................................................................................... 2-10
2.6 Reagents, Controls and Calibrators .................................................................... 2-12
3 Understanding the System Principles ............................................................... 3-1
3.1 Introduction ............................................................................................................ 3-1
3.2 Aspiration ............................................................................................................... 3-2
3.3 Dilution ................................................................................................................... 3-3
3.4 WBC/HGB Measurement ...................................................................................... 3-5
3.5 RBC/PLT Measurement ......................................................................................... 3-8
3.6 Wash .................................................................................................................... 3-11
4 Installing Your Analyzer ...................................................................................... 4-1
4.1 Introduction ............................................................................................................ 4-1
4.2 Installation Requirements ...................................................................................... 4-2
4.3 Connecting the System ......................................................................................... 4-5
4.4 Installing the Recorder Paper ................................................................................ 4-9
4.5 Precautions .......................................................................................................... 4-10
5 Operating Your Analyzer ..................................................................................... 5-1
5.1 Introduction ............................................................................................................ 5-1
5.2 Initial Checks ......................................................................................................... 5-2
5.3 Startup and Login .................................................................................................. 5-4
5.4 Daily Quality Control .............................................................................................. 5-6
5.5 Sample Preparation ............................................................................................... 5-7
5.6 Sample Analysis .................................................................................................. 5-10
5.7 Standby................................................................................................................ 5-19
5.8 Shutdown ............................................................................................................. 5-21
1
Page 8

Table of Contents
6 Reviewing Sample Results ................................................................................. 6-1
6.1 Introduction ............................................................................................................ 6-1
6.2 Table Review ......................................................................................................... 6-2
7 Using the QC Programs ...................................................................................... 7-1
7.1 Introduction ............................................................................................................ 7-1
7.2 L-J QC ................................................................................................................... 7-2
7.3 X-B QC Program ................................................................................................. 7-12
8 Calibrating Your Analyzer ................................................................................... 8-1
8.1 Introduction ............................................................................................................ 8-1
8.2 When to Calibrate .................................................................................................. 8-2
8.3 How to Calibrate .................................................................................................... 8-3
9 Customizing the Analyzer Software .................................................................. 9-1
9.1 Introduction ............................................................................................................ 9-1
9.2 System Setup ........................................................................................................ 9-2
9.3 Saving the Settings .............................................................................................. 9-18
10 Servicing Your Analyzer .................................................................................... 10-1
10.1 Introduction .......................................................................................................... 10-1
10.2 Maintaining Your Analyzer ................................................................................... 10-3
10.3 Self-Test ............................................................................................................. 10-10
10.4 Gain Calibration ................................................................................................. 10-11
10.5 Advanced Toolbox ............................................................................................. 10-12
10.6 Sample Probe Debug ........................................................................................ 10-13
10.7 Touch Screen Calibration .................................................................................. 10-14
10.8 Viewing Logs ..................................................................................................... 10-15
10.9 Checking the Analyzer Status ........................................................................... 10-17
11 Troubleshooting Your Analyzer ........................................................................ 11-1
11.1 Introduction .......................................................................................................... 11-1
11.2 Error Information and Handling ........................................................................... 11-2
12 Appendices ..........................................................................................................A-1
A Index ...................................................................................................................... A-1
B Specifications ........................................................................................................ B-1
C Communication ......................................................................................................C-1
2
Page 9

NOTE
Be sure to operate the analyzer strictly as instructed in this manual.
1 Using This Manual
1.1 Introduction
This chapter explains how to use your Operator's Manual of BC-20 Auto Hematology
Analyzer which is shipped with your instrument and contains reference information about the
BC-20 and procedures for operating, troubleshooting and maintaining the instrument. Read
this manual carefully before operating your analyzer and operate your analyzer strictly as
instructed in this manual.
1-1
Page 10

Using This Manual
1.2 Who Should Read This Manual
This manual contains information written for clinical laboratory professionals to :
learn about the BC-20 hardware and software;
set up system parameters;
perform daily operating tasks;
perform system maintenance and troubleshooting.
1-2
Page 11
Using This Manual
If you want to …
See …
learn about the intended use and parameters of BC-20
Chapter 2 Understanding
Your Analyzer
learn about the hardware and software of the BC-20
Chapter 2 Understanding
Your Analyzer
learn about how BC-20 works
Chapter 3 Understanding
the System Principles
learn about the installation requirements of the BC-20
Chapter 4 Installing Your
Analyzer
learn about how to define/adjust system settings
Chapter 9 Customizing the
Analyzer Software
learn about how to collect, prepare and analyze the
samples
Chapter 5 Operating Your
Analyzer
learn about how to use BC-20 perform your daily
operating tasks
Chapter 5 Operating Your
Analyzer
learn about how to review the saved analysis results
Chapter 6 Reviewing
Sample Results
learn about how to use the quality control programs of
BC-20
Chapter 7 Using the QC
Programs
learn about how to calibrate the BC-20
Chapter 8 Using the
Calibration Programs
learn about how to maintain/service the BC-20
Chapter 10 Maintaining
Your Analyzer
learn about how to solve the problems of the BC-20
Chapter 11
Troubleshooting Your
Analyzer
learn about the technical specifications of the BC-20
Appendix B Specifications
learn about the communication protocol of the BC-20
Appendix C
Communication
1.3 How to Find Information
This operator’s manual comprises 11 chapters and 3 appendices. Refer to the table below to
find the information you need.
1-3
Page 12

Using This Manual
Form
Meaning
[××]
all capital letters enclosed in [ ] indicate a key name
“××”
bold letters included in " " indicate text you can find on the
screen of the BC-20
××
italic letters indicate chapter titles, such as Chapter 1 Using This
Manual.
1.4 Conventions Used in This Manual
This manual uses certain typographical conventions to clarify meaning in the text:
All illustrations in this manual are provided as examples only. They may not necessarily
reflect your BC-20 setup or data displayed.
1-4
Page 13

Using This Manual
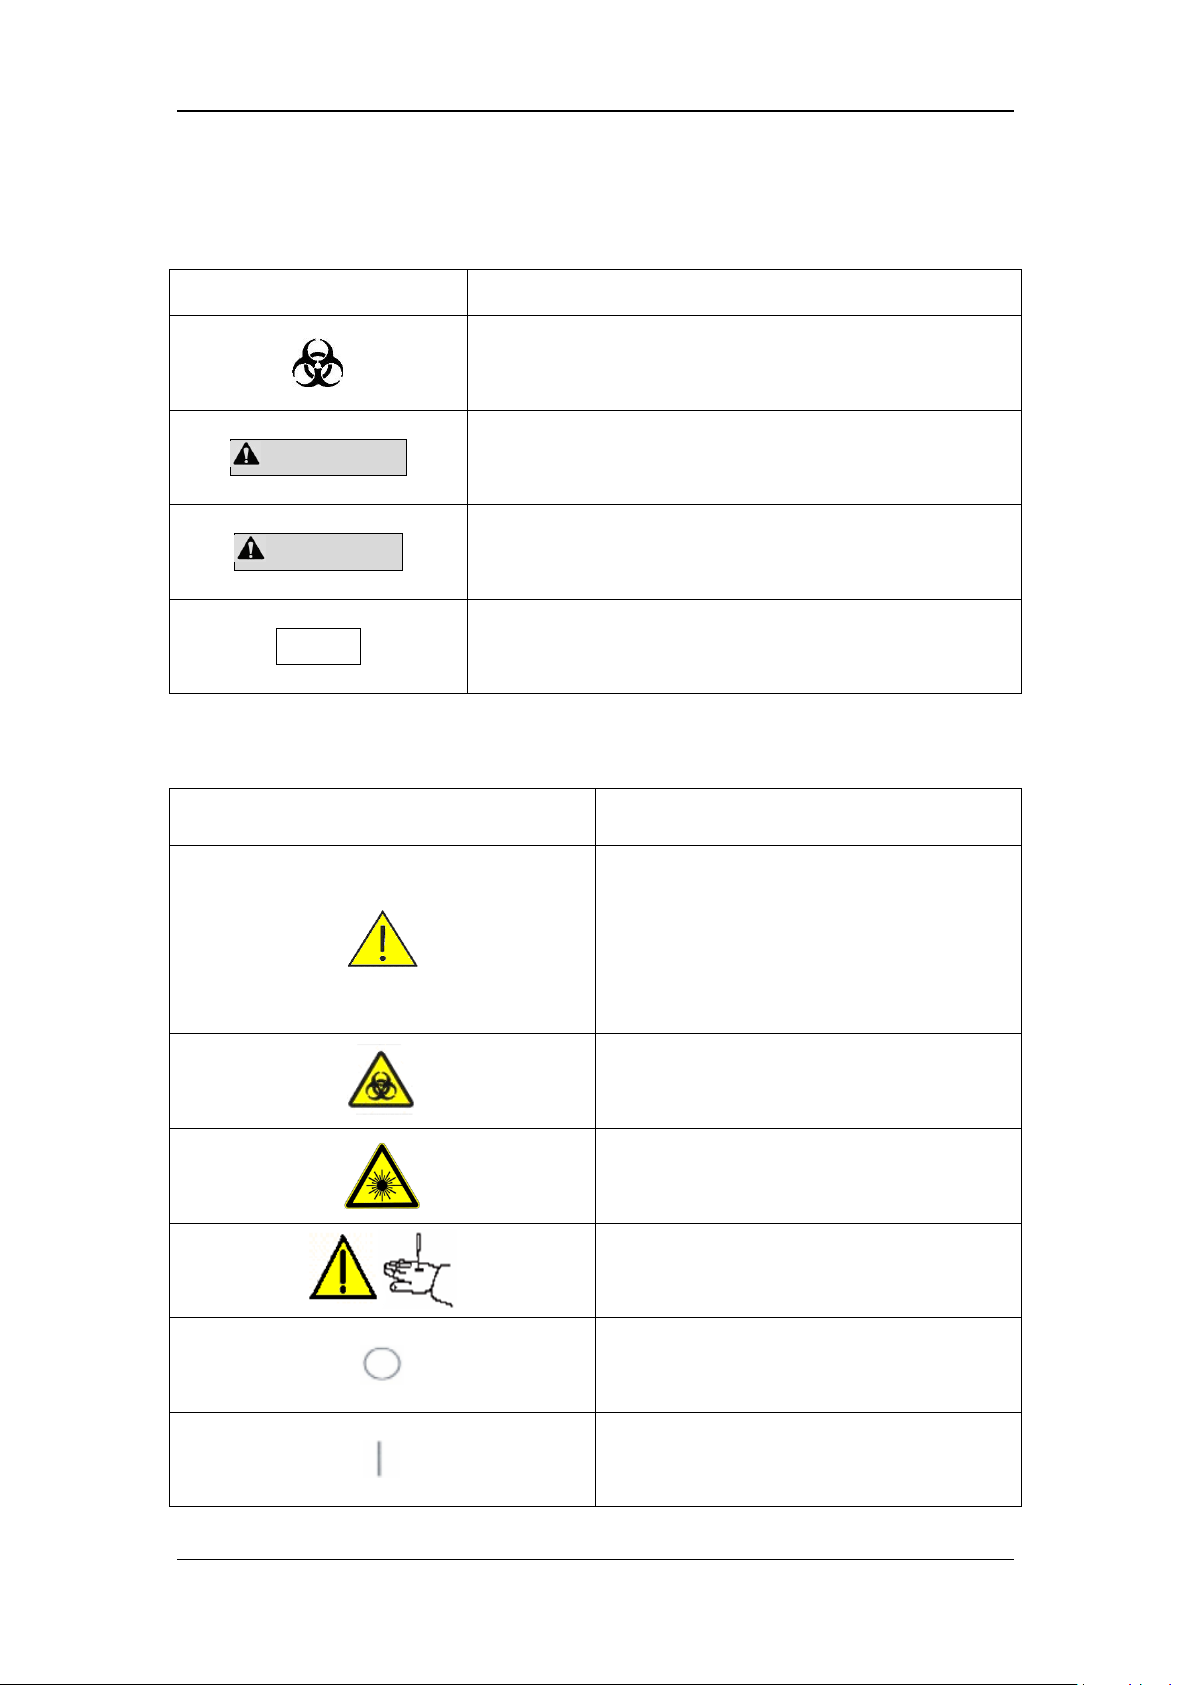
Symbols
Meaning
read the statement below the symbol. The statement is
alerting you to a potentially biohazardous condition.
WARNING
read the statement below the symbol. The statement is
alerting you to an operating hazard that can cause
personnel injury.
CAUTION
read the statement below the symbol. The statement is
alerting you to a possibility of analyzer damage or unreliable
analysis results.
NOTE
read the statement below the symbol. The statement is
alerting you to information that requires your attention.
1.5 Terms Used in Software Operation
1-5
Page 14
When you see...
It means...
read the statement below the symbol. The statement is
alerting you to a potentially biohazardous condition.
WARNING
read the statement below the symbol. The statement is
alerting you to an operating hazard that can cause
personnel injury.
CAUTION
read the statement below the symbol. The statement is
alerting you to a possibility of analyzer damage or unreliable
analysis results.
NOTE
read the statement below the symbol. The statement is
alerting you to information that requires your attention.
When you see...
It means...
Caution
Note: Indicates the need for the user to consult the
instructions for use for important cautionary
information such as warnings and precautions that
cannot, for a variety of reasons, be presented on
the medical device itself.
Biological risks
Warning, laser beam
The sample probe is sharp and potentially
biohazardous. Exercise caution when working
around it!
(Off) Power
(On) Power
1.6 Symbols
Symbols used in this manual:
Using This Manual
You may find the following symbols on package or the body of the instrument:
1-6
Page 15

Using This Manual
PROTECTIVE CONDUCTOR TERMINAL
Alternating current
In vitro diagnostic medical device
Serial number
Humidity limitation
Atmospheric pressure limitation
Temperature limit
Date of manufacture
Manufacturer
THE DEVICE IS FULLY CONFORMANCE
WITH THE COUNCIL DIRECTIVE
CONCERNING IN VITRO DIAGNOSTIC
MEDICAL DEVICES 98/79/EC.
THE FOLLOWING DEFINITION OF THE
WEEE LABEL APPLIES TO EU MEMBER
STATES ONLY: THE USE OF THIS SYMBOL
INDICATES THAT THIS PRODUCT SHOULD
NOT BE TREATED AS HOUSEHOLD
WASTE. BY ENSURING THAT THIS
PRODUCT IS DISPOSED OF CORRECTLY,
YOU WILL HELP PREVENT BRINGING
POTENTIAL NEGATIVE CONSEQUENCES
TO THE ENVIRONMENT AND HUMAN
HEALTH. FOR MORE DETAILED
INFORMATION WITH REGARD TO
1-7
Page 16

Using This Manual
RETURNING AND RECYCLING THIS
PRODUCT, PLEASE CONSULT THE
DISTRIBUTOR FROM WHOM YOU
PURCHASED THE PRODUCT.
AUTHORISED REPRESENTATIVE IN THE
EUROPEAN COMMUNITY
1-8
Page 17
Using This Manual
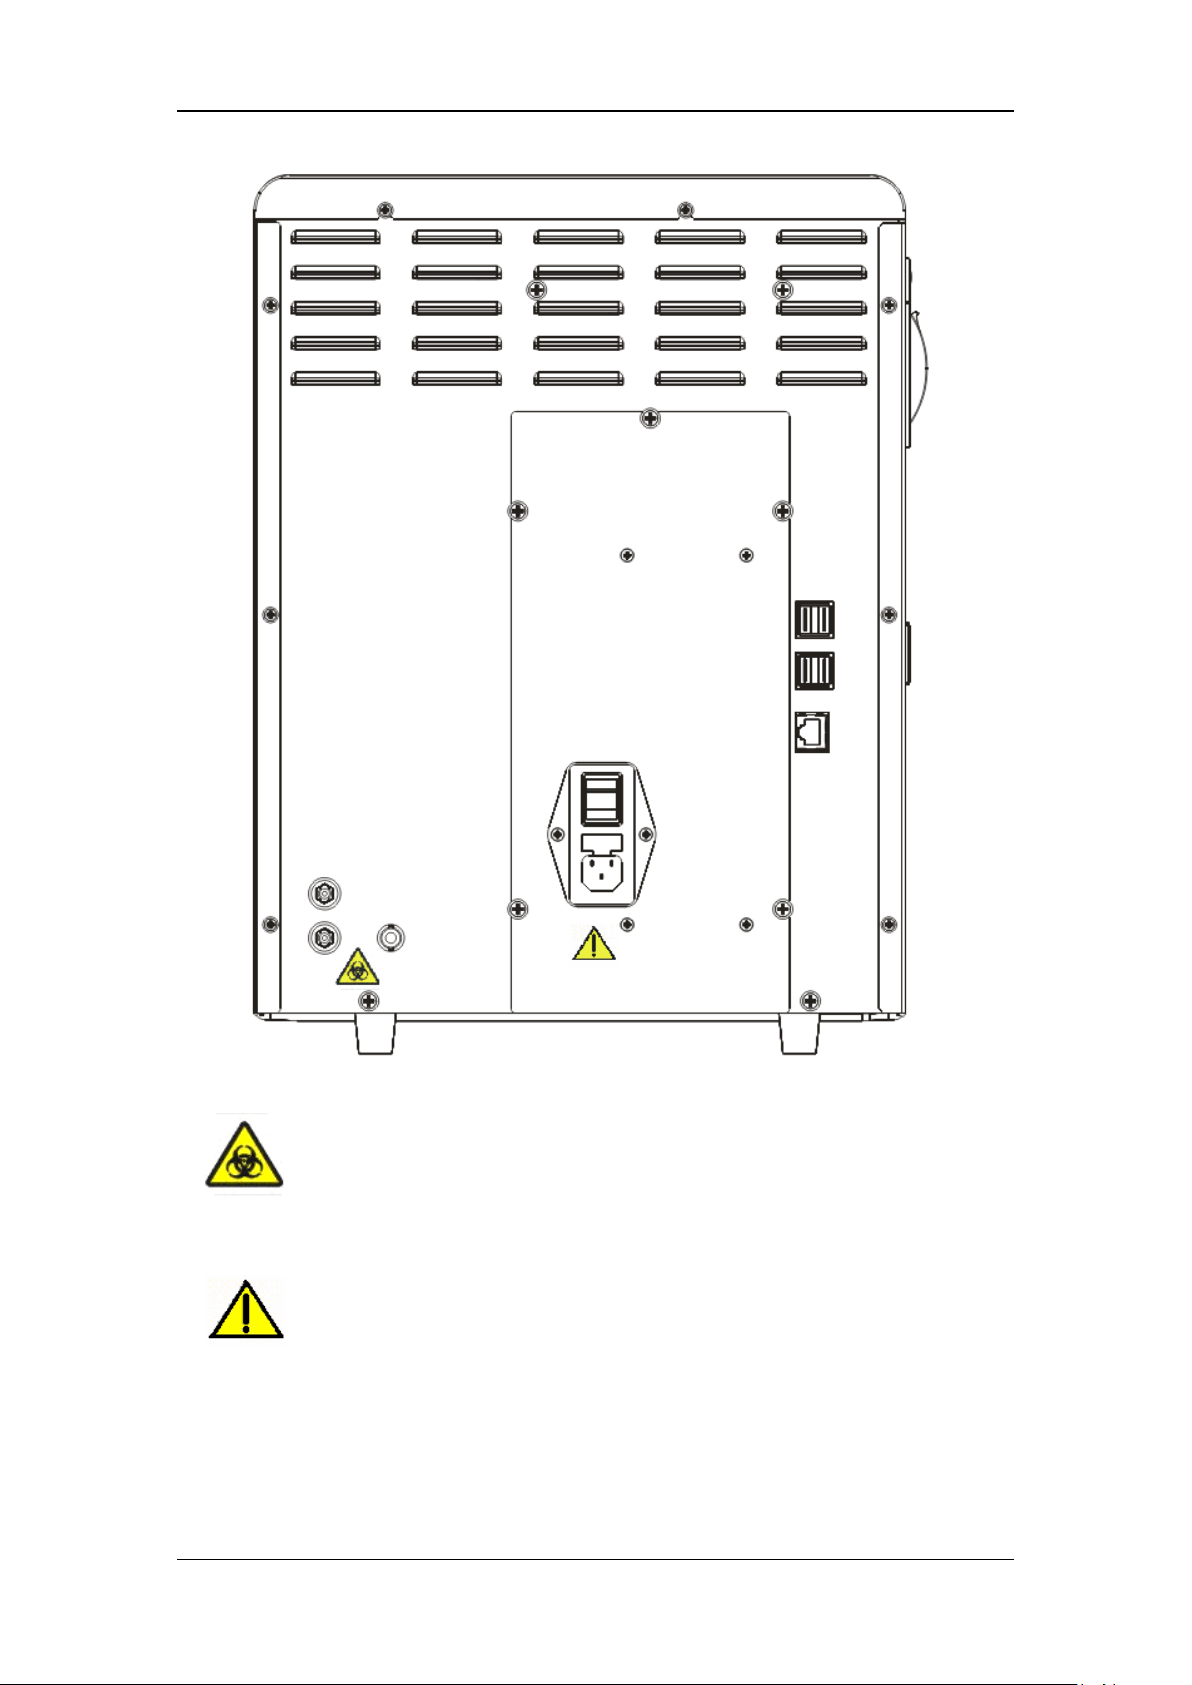
(1)
Biological risk.
(2)
Connect only to a properly earth grounded outlet.
To avoid electrical shock, disconnect power prior to maintenance.
To prevent fire, only use the fuse of specified type and rating.
1-9
Page 18

Using This Manual
(1)
Warning: the sample probe is sharp and potentially biohazardous. Exercise caution when
working around it!
(2)
Biological risk.
1-10
Page 19

Using This Manual
1-11
Page 20

Using This Manual
(1)
Warning: make sure that the protective cover is closed before operating the analyzer.
(2)
Warning
To avoid injury, do not place your hands anywhere near the the aspiration module
when the analyzer is working.
The sample probe is sharp and potentially biohazardous. Exercise caution when
working around it!
1-12
Page 21

2 Understanding Your Analyzer
2.1 Introduction
The BC-20 is a hematology analyzer and 3-part counter for In Vitro Diagnostic Use in clinical
laboratories.
2-1
Page 22

Understanding Your Analyzer
2.2 Product Description
2.2.1 Intended Use
BC-20 Auto Hematology Analyzer is a quantitative, automated hematology analyzer and
3-part differential counter for in Vitro Diagnostic Use in clinical laboratories.
The purpose of this analyzer is to identify the normal patient, with all normal
system-generated parameters, and to flag or identify patient results that require additional
studies.
2.2.2 Product Composition
Auto Hematology Analyzer (hereinafter called BC-20) system consists of the main unit
(analyzer), reagents, controls and calibrators, manuals, and accessories. Performance of the
system depends on the combined integrity of all components.
2-2
Page 23

Understanding Your Analyzer
NOTE
The purpose of this analyzer is to identify the normal patient, with all normal
system-generated parameters, and to flag or identify patient results that
require additional studies.
White Blood Cell count
WBC
Lymphocyte number
Lymph#
Mid-sized Cell number
Mid#
Granulocyte number
Gran#
Lmphocyte percentage
Lymph%
Mid-sized Cell percentage
Mid%
Granulocyte percentage
Gran%
Red Blood Cell count
RBC
Hemoglobin Concentration
HGB
Mean Corpuscular Volume
MCV
Mean Corpuscular Hemoglobin
MCH
Mean Corpuscular Hemoglobin
Concentration
MCHC
Red Blood Cell Distribution Width
Coefficient of Variation
RDW-CV
Red Blood Cells Distribution Width Standard Deviation
RDW-SD
Hematocrit
HCT
Platelet count
PLT
Mean Platelet Volume
MPV
Platelet Distribution Width
PDW
Plateletcrit
PCT
Platelet-Large Cell Ratio
P-LCR
White Blood Cell Histogram
WBC Histogram
Red Blood Cell Histogram
RBC Histogram
Platelet Histogram
PLT Histogram
2.3 Parameter
The analyzer is used for the quantitative determination of the following 20 parameters and
provides 3 histograms.
2-3
Page 24

Understanding Your Analyzer
1 ---- Touch screen
2 ---- Indicator
3 ---- Probe wipe block
4 ---- Sample probe
5 ---- [Aspirate] key
2.4 Main Structure
BC-20 Auto Hematology Analyzer consists of the main unit (analyzer) and accessories.
Figure 2-1 Front of the analyzer
2-4
Page 25

Understanding Your Analyzer
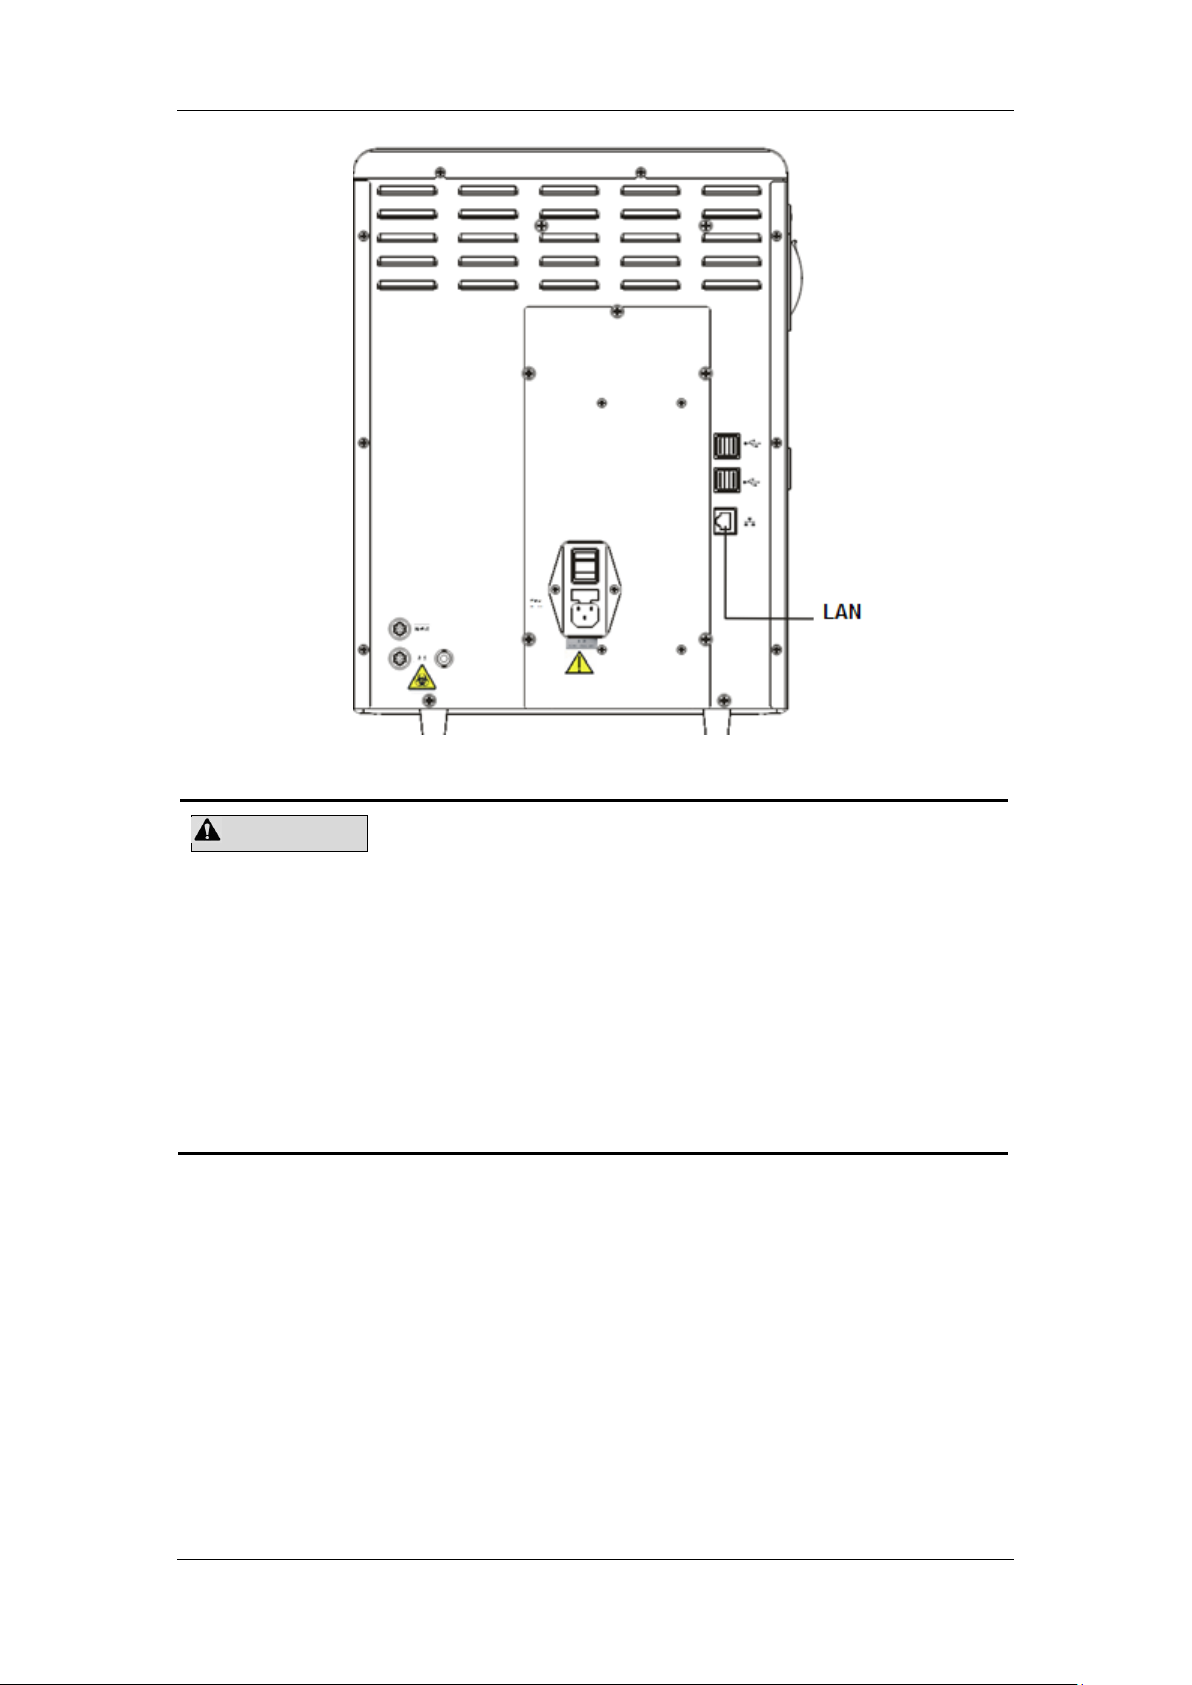
1 ---- USB port
2 --- Network interface
3 --- Power assembly
4 --- Waste sensor connector
5 --- Waste outlet
6 --- Diluent inlet
Figure 2-2 Back of the main unit
2-5
Page 26

Understanding Your Analyzer
1 --- [Aspirate] key
2 --- Start assembly
3 ---Syringe module
Figure 2-3 Inside of the analyzer (front cover removed)
2-6
Page 27
Understanding Your Analyzer
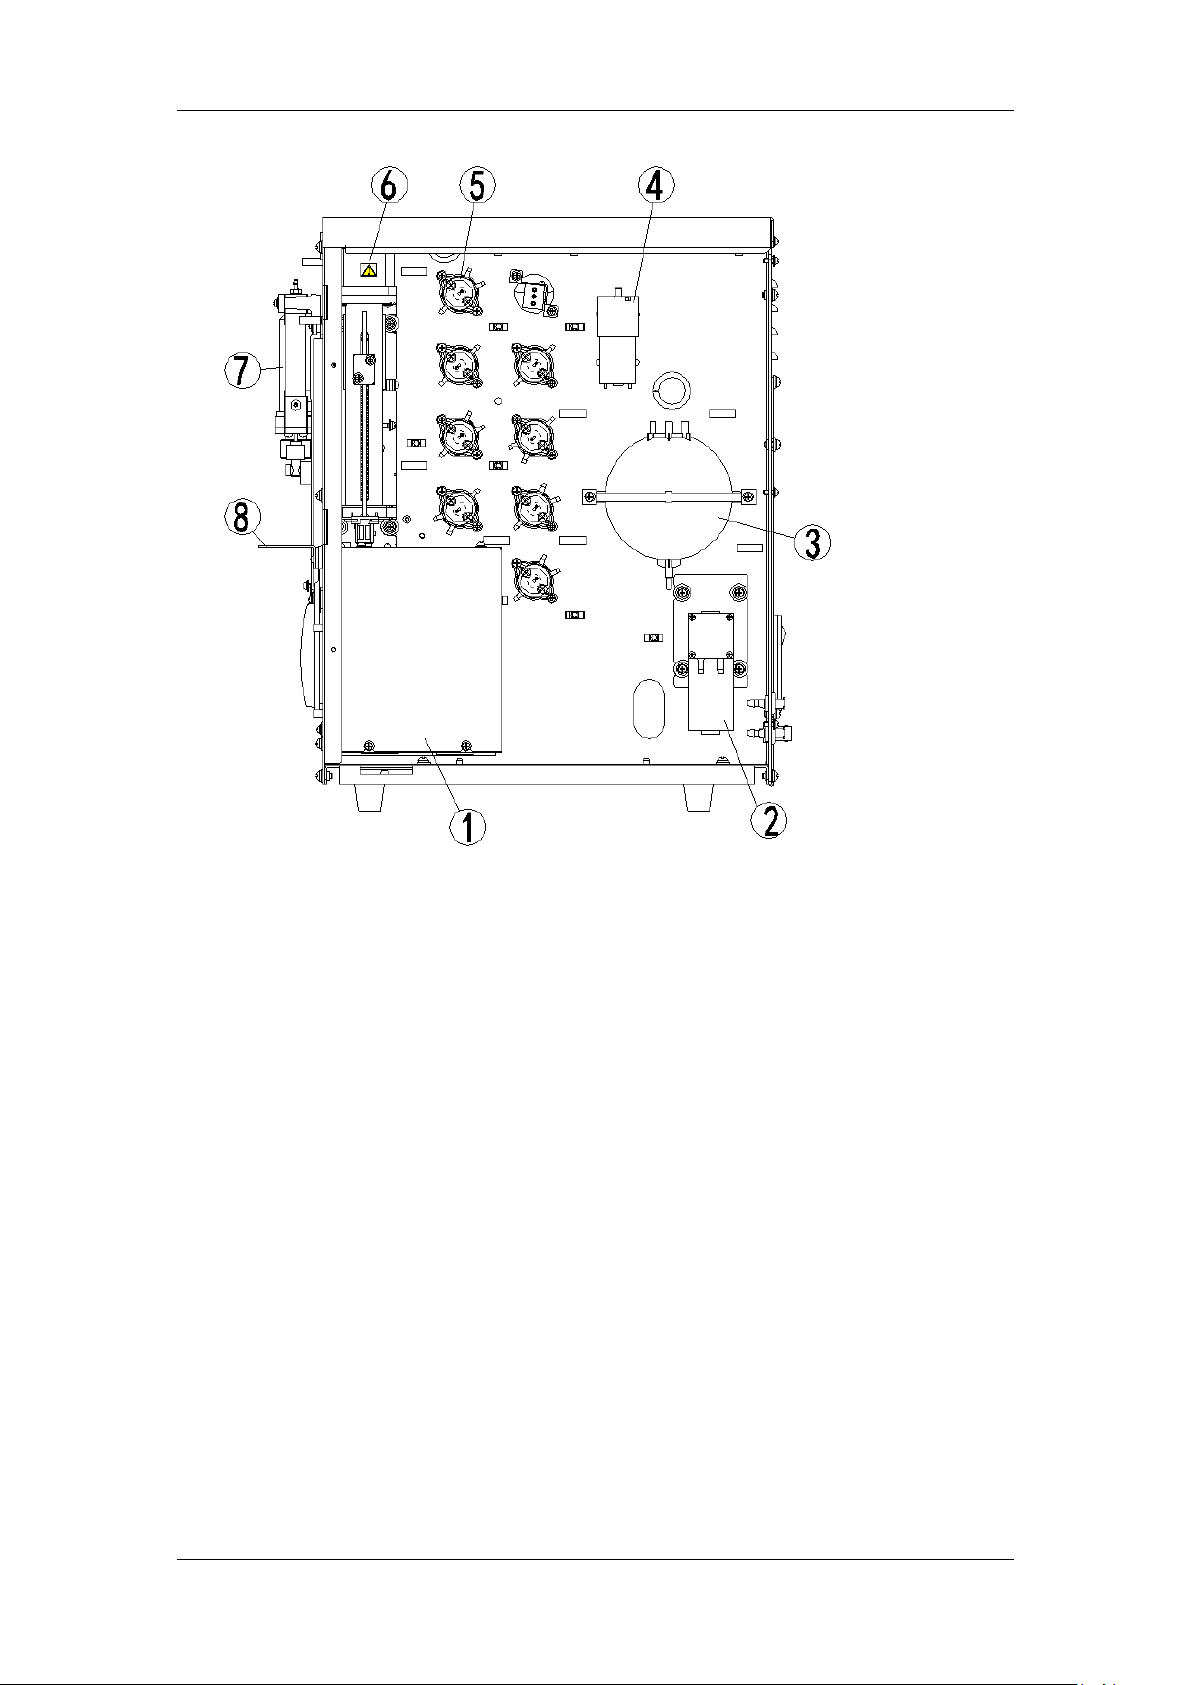
1 --- Baths
2 --- Waste pump
3 --- Vacuum chamber
4 --- Air pump
5 --- Valves
6 --- Syringe module
7 --- Aspiration module
8 --- Probe wipe block
Figure 2-4 Right side of the analyzer (right door open)
2-7
Page 28

Understanding Your Analyzer
1 --- Recorder
2 --- Left door
Figure 2-5 Left side of the analyzer
3 --- Lock latch of the side door
2.4.1 Touch Screen
The touch screen locates on the front of the main unit, which can be used to operate the
instrument and display information.
2.4.2 [Aspirate] Key
The [Aspirate] key is located behind the sample probe. You can press the key to start the
analysis, dispense diluent or perform reagent maintenance.
2.4.3 Indicator
The indicator may light in red, yellow and green to indicate current status of the system.
When the indicator stays in green, the analyzer is "Ready"; when it flickers in green, the
analyzer is running; when it stays in red, the analyzer encounters error and has stopped
running; when it flickers in red, the analyzer encounters error but is still running; and when it
stays in yellow, the analyzer is sleeping.
2.4.4 USB Ports
The analyzer has 4 USB ports to connect the keyboard, printer, barcode scanner, recorder,
2-8
Page 29
Understanding Your Analyzer
NOTE
When you purchase a wireless WiFi module by yourself, make sure
you comply the relevant local laws and regulations.
WiFi wireless network card, etc.. The analyzer supports software upgrade through USB.
2.4.5 Network Interface
A PC can be connected to the network interface located on the back of the analyzer for
automatic data transmission.
2.4.6 Peripherals
Keyboard (Optional)
A Keyboard can be connected to a USB port on the analyzer. You can use it to operate your
analyzer.
Mouse (Optional)
A mouse can be connected to a USB port on the back of the analyzer. You can use it to
operate your analyzer.
USB Printer (Optional)
A USB printer can be connected to a USB port on the back of the analyzer. You can use it to
print out reports or other interested information displayed on the screen.
Supported printers: HP LaserJet P1606dn.
Barcode scanner (Optional)
A barcode scanner can be connected to a USB port on the back of the analyzer. You can use
it to scan the barcode information into the analyzer.
WiFi wireless network card (Optional)
Supported WiFi wireless network card: NETGEAR® WNA3100M.
2-9
Page 30

Understanding Your Analyzer
2.5 User Interface
2.5.1 Screen
After the starting procedure, you will enter the "Sample Analysis" screen as shown in below
figure.
Figure 2-6 Sample Analysis screen
2-10
Page 31
Understanding Your Analyzer
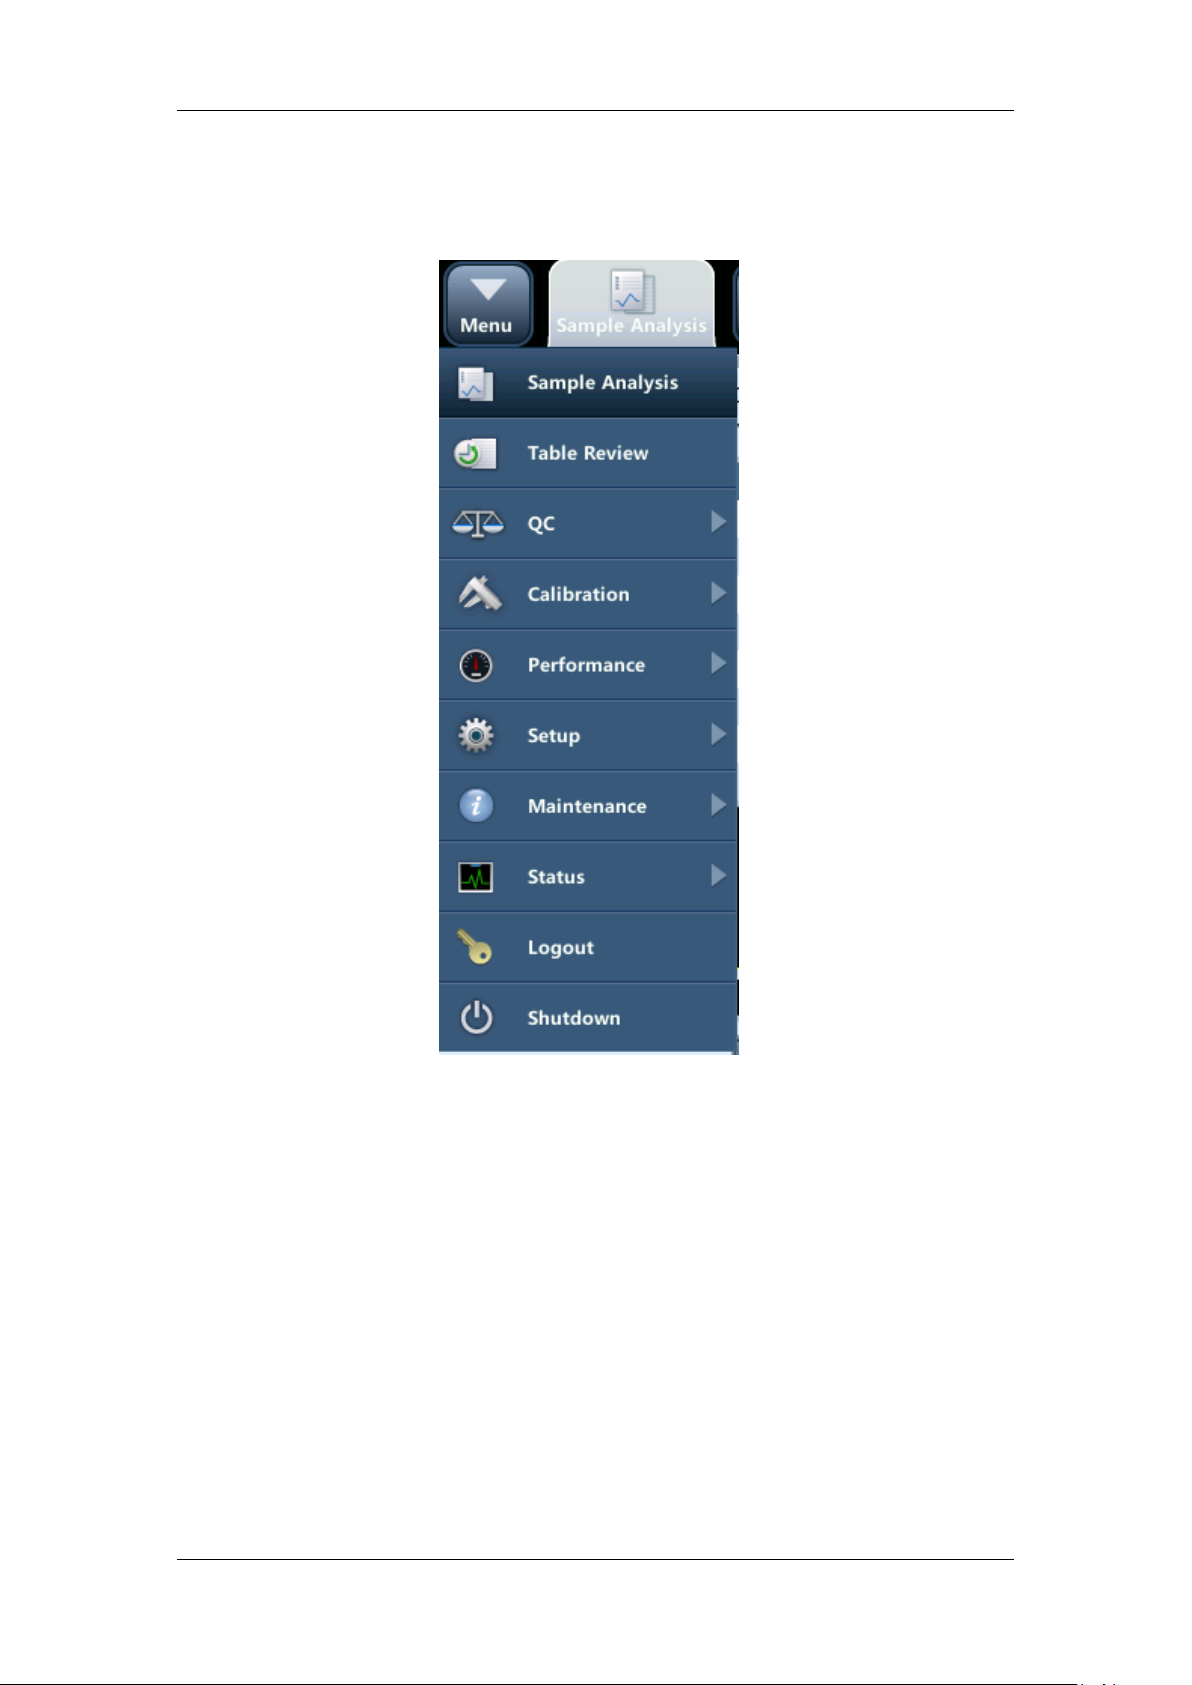
2.5.2 Menus
Tap the "Menu" button to display system menus.
Figure 2-7 System menu
Tap one of the 10 system menus to enter corresponding screen.
2-11
Page 32

Understanding Your Analyzer
WARNING
Be sure to dispose of reagents, waste, samples, consumables, etc.
according to government regulations.
The reagents are irritating to eyes, skin and diaphragm. Wear proper
personal protective instrument (e.g. gloves, lab coat, glasses, etc.) and
follow safe laboratory procedures when handling them and the contacted
areas in the laboratory.
If reagents accidentally spill on your skin or in your eyes, rinse the area with
ample amount of clean water, and seek medical attention immediately.
NOTE
Store and use the reagents as instructed by instructions for use of the
reagents.
When you have changed the diluent, lyse, run a background test to see if the
results meet the requirement.
Pay attention to the expiration dates and open-container stability days of all
the reagents. Be sure not to use expired reagents.
After installing a new container of reagent, keep it still for a while before
use.
Please adopt proper measurements to prevent the reagents from being
polluted.
2.6 Reagents, Controls and Calibrators
As the analyzer, reagents, controls and calibrators are components of a system, performance
of the system depends on the combined integrity of all components. You must only use the
Mindray-specified reagents (see Appendix B Specifications) which are formulated specifically
for the fluidic system of your analyzer in order to provide optimal system performance. Do not
use the analyzer with reagents from multiple suppliers. In such use, the analyzer may not
meet the performance specified in this manual and may provide unreliable results. All
references related to reagents in this manual refer to the reagents specifically formulated for
this analyzer.
Each reagent package must be examined before use. Product integrity may be compromised
in packages that have been damaged. Inspect the package for signs of leakage or moisture.
If there is evidence of leakage or improper handling, do not use the reagent.
2-12
Page 33

Understanding Your Analyzer
2.6.1 Reagents
M-30D Diluent
As an isotonic reagent and with specified conductivity, M-30D diluent provides stable
environment for hematology analysis.
M-20CFL Lyse
M-20CFL lyse is formulated to lyse red blood cells and transform the hemoglobin released
from red blood cell into hemoglobin complex. It is used for WBC count, WBC 3-part
differential and HGB determination.
Probe Cleanser
Probe Cleanser is used for the regular cleaning of the analyzer.
2.6.2 Controls and Calibrators
The analyzer uses following controls and calibrators: B30 Hematology Analyzer Control
(Impedance Method) and S30 Hematology Analyzer Control (Impedance Method).
B30 controls are suspension of simulated white cells, human erythrocytes and simulated
platelets in a medium containing stabilizers and preservatives. They are used for the quality
control of Mindray 3-DIFF BC series hematology analyzers; the QC program monitors and
evaluates the precision of the measurement parameters like WBC, RBC, HGB, MCV/HCT
and PLT.
S30 calibrators are suspension of simulated white cells, human erythrocytes and simulated
platelets in a medium containing stabilizers and preservatives. They are used to calibrate
some parameters (WBC, RBC, HGB, MCV/HCT and PLT) of Mindray hematology analyzers,
so as to build the metrological traceability of analysis results.
All references related to controls in this manual refer to the "controls" and "calibrators"
specifically formulated for this analyzer by Mindray. You must buy those controls and
calibrators from Mindray or Mindray-authorized distributors.
2-13
Page 34

Page 35

3 Understanding the System Principles
3.1 Introduction
The analyzer uses the electrical impedance method to determine the count and size
distribution of RBC, WBC and PLT; and uses the colorimetric method to determine HGB.
Based on the above data, the analyzer calculates other parameters.
3-1
Page 36

Understanding the System Principles
3.2 Aspiration
If you are to analyze a whole blood sample, present the sample to the analyzer directly, and
the analyzer will aspirate 9 μL of the whole blood sample.
If you are to analyze a capillary blood sample under the pre-dilute mode, you should first
manually dilute the sample (20 μL capillary sample needs to be diluted by 0.7 mL of diluent to
form a 1:36 dilution), and then present the pre-diluted sample to the analyzer, which will
aspirate 198uL of the sample.
3-2
Page 37

Understanding the System Principles
1:157.65
dilution
1:16058.6 dilution for
the RBC analysis
21.6ul
9ul of whole
blood sample
1.41ml of
diluent
1:305.5 dilution for the
WBC analysis
310ul of lyse
2.2ml of diluent
3.3 Dilution
Usually in blood samples, the cells are too close to each other to be identified or counted. For
this reason, the diluent is used to separate the cells so that they draw through the aperture
one at a time as well as to create a conductive environment for cell counting. Moreover, red
blood cells usually outnumber white blood cells by 1,000 times. For this reason, lyse need to
be added to the sample to eliminate the red blood cells before the WBC counting. Because
red blood cells usually have no nucleus, they are eliminated when the lyse breaks down their
cell walls. The analyzer provides whole blood mode and predilute mode for the analysis of
different sample types.
3.3.1 Whole Blood Mode
Figure 3-1 Whole blood mode dilution flow chart
As shown on Figure 3-1, under the whole blood mode, 9 μL of whole blood sample is
aspirated and diluted by 1.41mL of diluent, forming a 1:157.65 dilution. The dilution is then
divided into 2 parts: the first 21.6 μL is aspirated and diluted by about 2.2 mL of diluent to form
a 1:16058.6 dilution. This sample is used for RBC/PLT count and histogram output. The
remaining sample will be mixed with 0.31 mL of lyse to make a 1:305.5 diluted sample for
HGB, WBC count and the output of WBC histograms.
3-3
Page 38

Understanding the System Principles
1:257.34
dilution
1:16177.1 dilution for
RBC measurement
35ul
20ul of capillary
blood sample
1410ul of lyse
1:501.6 dilution for
WBC measurement
700ul of diluent
1:36 dilution
198ul
310ul of lyse
2.2ml of lyse
3.3.2 Predilute mode
Figure 3-2 Predilute mode dilution flow chart
As shown on the figure above, under the predilute mode, you must first manually mix 20 μL of
capillary blood with 0.7 mL of diluent to make a dilution of about 1:36. Then present the
dilution to the analyzer. The analyzer will aspirate 198uL of the dilution and add in 1.41 mL of
diluent to form a 1:257.34 dilution. The dilution is then divided into 2 parts: the first 35 μL is
aspirated and diluted by about 2.2 mL of diluent to form a 1:16177.1 dilution. This sample is
used for RBC/PLT count and histogram output. The remaining sample will be mixed with 0.31
mL of lyse to make a 1:501.6 diluted sample for HGB, WBC count and the output of WBC
histograms.
3-4
Page 39

Understanding the System Principles
3.4 WBC/HGB Measurement
3.4.1 Measurement Principle:
WBC measurement principle
The WBCs are counted by the impedance method. The analyzer aspirates certain volume of
sample, dilutes it with certain volume of conductive solution, and delivers the dilution to the
metering unit. The metering unit has a little opening which is called "aperture". An pair of
electrodes is positioned on both sides of the aperture to create a constant-current supply. As
cells are poor conductors, when each particle in the diluted sample passes through the
aperture under the constant negative pressure, a transitory change in the direct-current
resistance between the electrodes is produced. The change in turn produces a measurable
electrical pulse which is proportional to the particle size. And when the particles passes the
aperture in succession, a series of pulses are produced between the electrodes. The number
of pulses generated indicates the number of particles passed through the aperture; and the
amplitude of each pulse is proportional to the volume of each particle.
Each pulse is amplified and compared to the internal reference voltage channel, which only
accepts the pulses of a certain amplitude. All the collected pulses are thus classified based
on the reference voltage ranges of different channels, and the number of the pluses in the
WBC channel indicates the number of the WBC particles. The cell size distribution width is
represented by the number of particles falling in each channel.
Figure 3-3 Metering diagram
3.4.2 WBC-Related Parameters
White Blood Cell count
WBC# (109/L) is the number of erythrocytes, measured directly by counting the leukocytes
3-5
Page 40

Understanding the System Principles
100Lymph%
PGPMPL
PL
100
PGPMPL
PM
Mid%
100
PGPMPL
PG
Gran%
100
%#WBCLym
Lymph
100
WBC%Mid
#Mid
100
WBC%Gran
#Gran
NRBC100
100
WBC'WBC+=
passing through the aperture.
Sometimes there are nucleated red blood cells (NRBC) presenting in the sample. While the
lyse will not be able to break their nuclear membrane, these NRBCs will also be counted as
WBCs. Therefore when NRBCs are found during microscopic exam, follow below formula to
modify the WBC count:
In the formula, WBC′ is corrected WBC count result; WBC is the WBC count provided by the
analyzer; and NRBC indicates the number of NRBCs found when every 100 WBCs are
counted.
3-DIFF of WBC
Lyses and diluents change the sizes of each type of WBCs in various ways and at different
time. The WBCs are thus separated into 3 parts (from the largest size to the smallest):
lymphocytes, mid-sized cells (including monocytes, eosinophils, and basophils) and
granulocytes.
The analyzer then calculates the lymphocyte percentage (Lymph%), mid-sized cell
percentage (Mid%) and granulocyte percentage (Gran%) (all presented in %) based on the
WBC histograms and in accordance with below formulae:
In the formulae: PL indicates the number of cells falling in the lymphocyte region, PM the
number of cells falling in the mid-sized cell region, and PG the number of cells falling in the
granulocyte region. All three parameters are presented in 109/L.
When the three percentages are obtained, the analyzer automatically proceeds to calculate
the lymphocyte number (Lymph#), mid-sized cell number (Mid#) and granulocyte number
(Gran#) with below formulae, all parameters expressed in 109/L.
3-6
Page 41

Understanding the System Principles
ent PhotocurrSample
ocurrentBlank Phot
LnConstantHGB(g/L)
L/10nWBC
9
Lymph%, Mid% and Gran% are expressed in %, while WBC is in 109/L.
White blood cell histogram
Besides the count results, the analyzer also provides a WBC histogram which shows the
WBC size distribution, with the x-aixs representing the cell size (in fL) and the Y-axis
representing relative cell number (in 109/L). After each analysis cycle, you can either check
the WBC histogram in the analysis result area on the "Sample Analysis" screen or review
the histogram on the "Review" screen.
3.4.3 HGB Measurement
The HGB is determined by the colorimetric method. The diluted sample is delivered to the
WBC count bath where it is bubble mixed with a certain amount of lyse, which breaks red
blood cells, and converts hemoglobin to a hemoglobin complex. An LED is mounted on one
side of the bath and emits a beam of monochromatic light with 530~535nm central
wavelength. The light is received by an optical sensor mounted on the opposite side, where
the light signal is first converted to current signal and then to voltage signal. The voltage
signal is then amplified and measured and compared to the blank reference reading (reading
taken when there is only diluent in the bath), and the HGB (g/L) is measured and calculated
automatically. The whole measurement and calculation process is completed automatically.
You can review the results in the analysis result area on the "Sample Analysis" screen.
HGB is expressed in g/L.
3-7
Page 42

Understanding the System Principles
3.5 RBC/PLT Measurement
3.5.1 Impedance Method
RBCs/PLTs are counted by the electrical impedance method. The analyzer aspirates certain
volume of sample, dilutes it with certain volume of conductive solution, and delivers the
dilution to the metering unit. The metering unit has a little opening which is called "aperture".
An pair of electrodes is positioned on both sides of the aperture to creates a constant-current
supply. As cells are poor conductors, when each particle in the diluted sample passes
through the aperture under the constant negative pressure, a transitory change in the
direct-current resistance between the electrodes is produced. The change in turn produces a
measurable electrical pulse which is proportional to the particle size. And when the particles
passes the aperture in succession, a series of pulses are produced between the electrodes.
The number of pulses generated indicates the number of particles passed through the
aperture; and the amplitude of each pulse is proportional to the volume of each particle.
Each pulse is amplified and compared to the internal reference voltage channel, which only
accepts the pulses of a certain amplitude. All the collected pulses are thus classified based
on the reference voltage thresholds of different channels, and the number of the pluses in the
RBC/PLT channel indicates the number of the RBC/PLT particles. The cell size distribution
width is represented by the number of particles falling in each channel.
Figure 3-4 Metering diagram
3.5.2 RBC-Related Parameters
Red Blood Cell count
RBC (1012/L) is the number of erythrocytes, measured directly by counting the erythrocytes
passing through the aperture.
3-8
Page 43

Understanding the System Principles
L/10nRBC
12
10
MCVRBC
HCT
RBC
HGB
MCH
100
HCT
HGB
MCHC
Mean Corpuscular Volume
The analyzer calculates the mean cell volume (MCV, in fL) based on the RBC histogram.
HCT, MCH and MCHC
The hematocrit (HCT, %), mean corpuscular hemoglobin (MCH, pg) and mean corpuscular
hemoglobin concentration (MCHC, g/L) are calculated as follows:
where RBC is expressed in 1012/L, MCV is expressed in fL and HGB is expressed in g/L.
RDW-CV
Red Blood Cell Distribution Width - Coefficient of Variation (RDW-CV) is derived based on
RBC histogram. It is expressed in %, and indicates the variation level of RBC size
distribution.
RDW-SD
Red Blood Cells Distribution Width - Standard Deviation (RDW-SD, in fL) measures the width
of the 20% level (with the peak taken as 100%) on the RBC histogram, as shown in Figure
3-5..
Figure 3-5
Red blood Cell Histogram
Besides the count results, the analyzer also provides a RBC histogram which shows the RBC
size distribution, with the x-aixs representing the cell size (in fL) and the Y-axis representing
relative cell number (1012/L). After each analysis cycle, you can either check the RBC
histogram in the analysis result area on the "Sample Analysis" screen or review the
histogram on the "Review" screen.
3-9
Page 44

Understanding the System Principles
L/10nPLT
9
10000
MPVPLT
PCT
3.5.3 PLT-Related Parameters
Platelet count
PLT (109/ L) is measured directly by counting the platelets passing through the aperture.
Mean Platelet Volume
Based on the PLT histogram, this analyzer calculates the mean platelet volume (MPV, fL).
PDW
Platelet distribution width (PDW) is derived from the platelet histogram, and is reported as 10
geometric standard deviation (10 GSD).
PCT
The analyzer calculates the PCT (%) as follows:
where the PLT is expressed in 109/L and the MPV in fL.
Platelet-Large Cell Ratio
Based on the PLT histogram, this analyzer calculates the platelet-large cell ratio(P-LCR) (%).
Platelet Histogram
Besides the count results, the analyzer also provides a PLT histogram which shows the PLT
size distribution, with the x-aixs representing the cell size (in fL) and the Y-axis representing
relative cell number (in 109/L). After each analysis cycle, you can either check the PLT
histogram in the analysis result area on the "Sample Analysis" screen or review the
histogram on the "Review" screen.
3-10
Page 45

Understanding the System Principles
3.6 Wash
After each analysis cycle, each element of the analyzer is washed:
The sample probe is washed internally and externally with diluent;
The baths are washed with diluent;
Other elements of the fluidic system are also washed with diluent.
3-11
Page 46

Page 47

4 Installing Your Analyzer
CAUTION
Installation by personnel not authorized or trained by Mindray may cause
personal injury or damage your analyzer. Do not install your analyzer
without the presence of Mindray-authorized personnel.
4.1 Introduction
This chapter introduces how to install the BC-20. To ensure all system components function
correctly and to verify system performance, Mindray-authorized representatives will handle
the installation and initial software setup.
The analyzer is tested and packed with care before it is shipped from the factory. When you
receive your analyzer, carefully inspect the carton. If you see any signs of mishandling or
damage, contact Mindray Customer Service department or your local distributor immediately.
4-1
Page 48
Installing Your Analyzer
Voltage
Input power
Frequency
Analyzer
(100V-240V~) ±10%
≤180VA
(50/60Hz)±1Hz
WARNING
Make sure the analyzer is properly grounded.
Before turning on the analyzer, make sure the input voltage meets the
requirements.
When installing the instrument, ensure that the power switch is in close
proximity to the equipment and within easy reach of you.
CAUTION
Using pinboard may bring electrical interference and the analysis results
may be unreliable. Place the analyzer near the electrical outlet to avoid
using the pinboard.
Please use the original power cable shipped with the analyzer. Using other
electrical wire may damage the analyzer or lead to unreliable analysis
results.
4.2 Installation Requirements
Before installation, you should ensure that the following space, power, environmental and
fuse protection requirements are met.
4.2.1 Space Requirements
Check the site for proper space allocation. In addition to the space required for the analyzer
itself, arrange for:
at least 30 cm to both left and right sides;
at least 10 cm behind the analyzer;
enough room on or below the countertop to accommodate the reagent (for example
diluent) and waste containers.
the table (or the floor) where the analyzer is placed shall be able to withstand at least
40kg of weight.
4.2.2 Power Requirements
Fuse: 250V T3.15AH
4-2
Page 49

Installing Your Analyzer
Storage Environment
Working Environment
Ambient Temperature
-10℃~40℃
10℃~40℃
Relative Humidity
10%~90%
10%~90%
Atmospheric Pressure
50kPa~106kPa
70kPa~106kPa
WARNING
Do not place the analyzer in a flammable or explosive environment.
NOTE
If the ambient temperature is out of the specified operating range, the
analyzer will alarm you for abnormal ambient temperature and the analysis
results may be unreliable. When temperature errors are reported in the error
information area after analysis, see Chapter 11 Troubleshooting Your
Analyzer for solutions.
4.2.3 Environment Requirements
The environment shall be as free as possible from dust, mechanical vibrations, loud noises,
and electrical interference. Do not place the analyzer in direct sunlight or in front of a source
of heat or drafts. Please use a separate power socket; do not use the same socket with
devices like air conditioning, refrigerator and ultrasonic system, as they may interfere with the
proper operation of the analyzer. It is advisable to evaluate the electromagnetic environment
prior to operation of this analyzer. Do not place the analyzer near brush-type motors,
flickering fluorescent lights, and electrical contacts that regularly open and close. The
environment shall be well ventilated. Do not place the analyzer in direct sunlight. Connect
only to a properly earth grounded outlet. Only use this analyzer indoors.
4-3
Page 50

Installing Your Analyzer
WARNING
Installation by personnel not authorized or trained by Mindray may cause
personal injury or damage your analyzer. Do not install your analyzer
without the presence of Mindray-authorized personnel.
To prevent personal injury during the operation, keep your clothes, hairs
and hands from the moving parts like sample probe.
The sample probe tip is sharp and may contain biohazardous materials.
Exercise caution to avoid contact with the probe when working around it.
NOTE
To protect it from being damaged during transportation, the aspiration
module is fixed by cables ties and clamps before the analyzer is shipped out
of factory. Remove the cable ties and clamps before using the analyzer.
4.2.4 Moving and Installing the Analyzer
Moving and installation of the analyzer shall be conducted by Mindray-authorized personnel.
Do not move or install your analyzer without the presence of Mindray-authorized personnel.
4-4
Page 51
Installing Your Analyzer
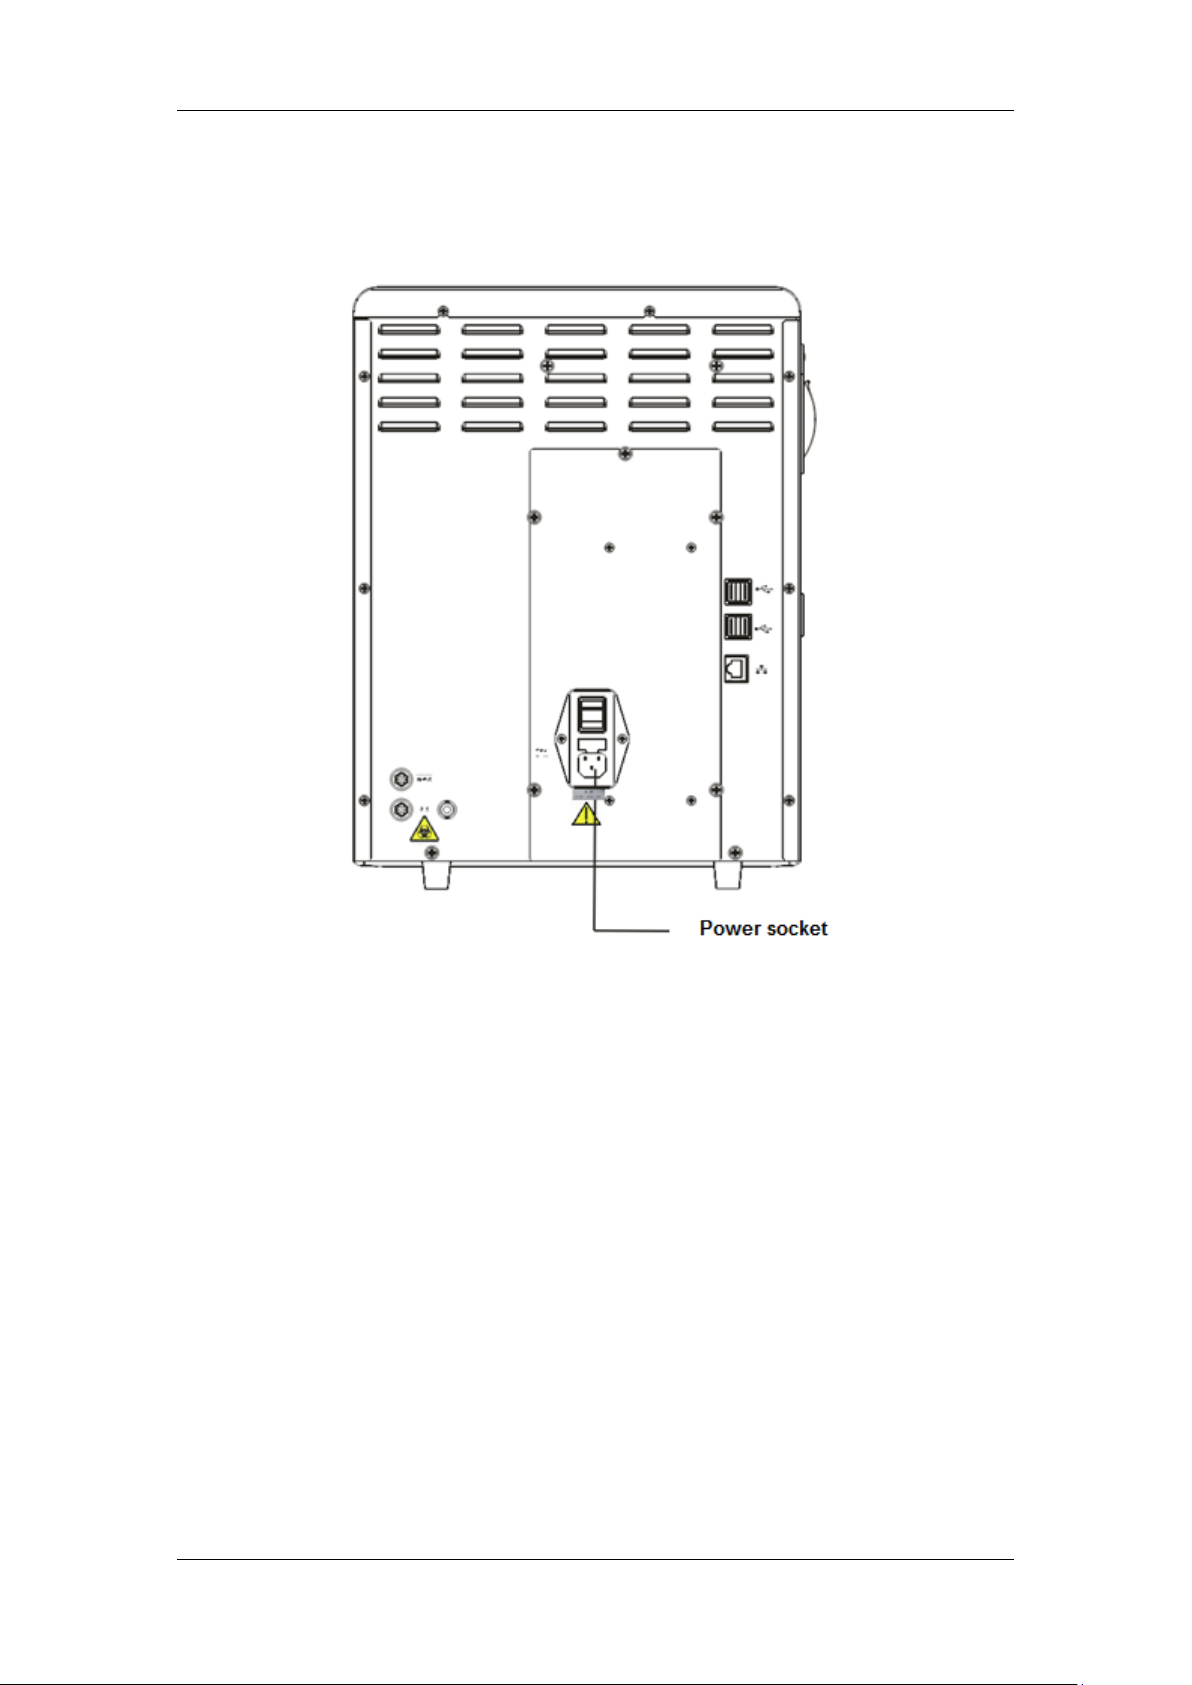
4.3 Connecting the System
Connect the power and the reagents as shown below. Make sure the connections are correct
and firm.
.
Figure 4-1 Connecting the analyzer to a power socket
4-5
Page 52
Installing Your Analyzer
WARNING
Be sure to dispose of reagents, waste, samples, consumables, etc.
according to government regulations.
The reagents are irritating to eyes, skin and diaphragm. Wear proper
personal protective equipment (e.g. gloves, lab coat, etc.) and follow safe
laboratory procedures when handling them and the contacted areas in the
laboratory.
If reagents accidentally spill on your skin or in your eyes, rinse the area with
ample amount of clean water; seek medical attention immediately.
Figure 4-2 Connecting the network port on the analyzer
4-6
Page 53

Installing Your Analyzer
Liquid ingression may damage the analyzer. Do not place any bottles on the
analyzer.
Use the manufacturer-specified reagents.
Let the reagents stand for a while before using them.
Never use expired reagents.
To prevent contamination, tighten the container caps when the installation
is finished.
Figure 4-3 Connecting reagents placed outside the analyzer
4-7
Page 54

Installing Your Analyzer
CAUTION
Make sure the diluent pipe and waste pipe are no longer than 1500mm.
The top of the waste container and the diluent container should be lower
than the countertop where the analyzer is placed.
Figure 4-4 Connecting reagents placed inside the analyzer
4-8
Page 55

Installing Your Analyzer
NOTE
Remove the protective paper in the recorder before installing recorder
paper.
1.
Use the latch at the upper right corner of the recorder door to pull the door open.
2.
Insert a new roll into the compartment with the paper end out of the recorder exit, as
shown below.
3.
Close the recorder door.
4.
Check whether the paper is installed correctly and the paper end is feeding from the top.
Figure 4-5 Installing recorder paper
CAUTION
Use only specified thermal recorder paper. Otherwise, it may cause damage
to the recorder head, or the recorder may be unable to print, or poor print
quality may result.
Never pull the recorder paper with force when a recording is in process.
Otherwise the recorder may be damaged.
Do not leave the recorder door open unless you are installing paper or
removing errors.
Improper installation of recorder paper may jam the paper and/or result in
blank printout.
Paper roll
4.4 Installing the Recorder Paper
Follow the procedure below to install the record paper.
4-9
Page 56

Installing Your Analyzer
4.5 Precautions
If the analyzer is kept in an environment with heavy dust for a long time, its performance
may be reduced.
It is recommended to clean and sterilize the outer surface the analyzer with 75%
ethanol.
The probe wipe block of the analyzer (see Figure 2-1 Front of the analyzer) shall be
wiped with 75% alcohol regularly.
Collect and prepare samples in accordance with the standard procedure of your
laboratory; otherwise it may result in inaccurate analysis results or damage to the
analyzer.
If any of the pipes or fluidic components are worn out, stop using the analyzer and
contact Mindray customer service department immediately for inspection or
replacement.
Make sure the tubings of the reagents (including diluent, lyse and waste) are not
pressed by heavy objects or bent over.
Use only Mindray-specified reagents; otherwise it may result in inaccurate results or
damage to the analyzer.
Pay attention to the expiration dates and open-container stability days of all the reagents.
Be sure not to use expired reagents. Otherwise it may result in inaccurate results.
4-10
Page 57

操作前的准备
Power on
Daily Quality
Control
Sample
Collection and
Handling
Run Sample
Shutdown
Initial checks
5 Operating Your Analyzer
5.1 Introduction
This chapter provides step-by-step procedures for operating your analyzer on a daily basis.
A flow chart indicating the common daily operating process is presented below.
5-1
Page 58
Operating Your Analyzer
All the samples, controls, calibrators, reagents, wastes and areas contacted
them are potentially biohazardous. Wear proper personal protective
equipment (e.g. gloves, lab coat, etc.) and follow safe laboratory procedures
when handling them and the contacted areas in the laboratory.
WARNING
Be sure to dispose of reagents, waste, samples, consumables, etc.
according to government regulations.
The reagents are irritating to eyes, skin and diaphragm. Wear proper
personal protective equipment (e.g. gloves, lab coat, etc.) and follow safe
laboratory procedures when handling them and the contacted areas in the
laboratory.
If reagents accidentally spill on your skin or in your eyes, rinse the area with
ample amount of clean water; seek medical attention immediately.
To prevent personal injury during the operation, keep your clothes, hairs
and hands from the moving parts like sample probe.
NOTE
Use the reagents specified by the manufacturer only. Store and use the
reagents as instructed by instructions for use of the reagents.
Check if the reagent tubings are properly connected before using the
analyzer.
After installing a new container of reagent, keep it still for a while before
use.
5.2 Initial Checks
Perform the following checks before turning on the analyzer.
Checking the waste container
Check and make sure the waste container (not supplied) is empty.
Checking tubing and power connections
Check and make sure the reagent, waste and pneumatic unit tubes are properly connected
and not bent.
Check and make sure the power cord of the analyzer is properly plugged into the power
5-2
Page 59

Operating Your Analyzer
outlet.
Checking recorder (optional) and printer (optional)
Check and make sure the printer and recorder are properly installed, and have enough paper.
5-3
Page 60

Operating Your Analyzer
1.
Place the power switch at the back of the analyzer in the "I" position. The switch will
light on.
2.
Make sure that the power indicator on the analyzer lights on.
3.
Enter your user ID and password in the login dialog box.
Figure 5-1 Login dialog box
4.
The analyzer will sequentially do the self-test and initialize the system.
5.3 Startup and Login
Power on the analyzer:
5-4
Page 61

Operating Your Analyzer
NOTE
When "Background abnormal" is reported during the startup process,
follow the corresponding troubleshooting instruction for the error in
Chapter 11 Troubleshooting to remove the error.
The system opens different function for the user according to the user level.
The user level depends on the user ID and the password when the user logs
in.
To switch to another user, tap the "Logout" button first. Enter the desired
user ID and password in the displayed login dialog box, and then tap "OK"
to log in.
If you failed to run the software continuously, please contact Mindray
Customer Service Department or your local distributor.
After startup, please make sure the date/time of the computer is correct.
The default user ID and password for administrator are both "Admin".
1-12 characters are allowed for user ID and password; Chinese characters
are not allowed.
5-5
Page 62

Operating Your Analyzer
5.4 Daily Quality Control
Before running any samples, run the controls to finish auto setup and ensure reliable results
of the analyzer. See Chapter 7 QC Programs for details.
5-6
Page 63

Operating Your Analyzer
CAUTION
Prepare samples following the recommend procedure of the manufacturer.
Always shake the samples as shown below to well mix it
Do not reuse disposable products such as collection tubes, test tubes,
capillary tubes and so on.
All the samples, controls, calibrators, reagents, wastes and areas contacted
them are potentially biohazardous. Wear proper personal protective
equipment (e.g. gloves, lab coat, etc.) and follow safe laboratory procedures
when handling them and the contacted areas in the laboratory.
WARNING
Do not contact the patients' sample blood directly.
5.5 Sample Preparation
The analyzer supports two sample types: whole blood sample (including capillary whole
blood sample) and predilute sample.
5-7
Page 64
Operating Your Analyzer
NOTE
Be sure to use clean EDTAK2 anticoagulant collection tubes, fused silica
glass/plastic test tubes, centrifugal tubes and borosilicate glass capillary
tubes.
Be sure to use the Mindray-specified disposable products including
evacuated blood collection tube, anticoagulant collection tubes and
capillary tubes etc.
CAUTION
To attain accurate analysis results, make sure the sample volume is no less
than 120uL.
NOTE
For the whole blood samples to be used for WBC differential, you shall store
them at the room temperature and run them within 8 hours after collection.
Samples stored in a refrigerator at the temperature of 2℃~8℃ must be
analyzed within 24 hours after collection. The refrigerated samples must be
kept at room temperature for at least 30 minutes before analysis.
Be sure to mix any sample that has been prepared for a while before running
it.
After the sample is prepared, be sure to wait for at least 5 minutes before
running it; and you must complete the analysis within 2 hours after its
collection.
5.5.1 Whole Blood Samples (Including Capillary Whole Blood
Samples)
Use clean EDTAK2 anticoagulant collection tubes to collect venous blood samples.
Mix the sample immediately according to your laboratory’s protocol.
5-8
Page 65

Operating Your Analyzer
1.
Tap the mode switching icon to switch the working mode from whole blood to "PD ".
2.
Tap the "Diluent" button on the top status bar, a message box will pop up.
Figure 5-2 "Diluent" dialog box
3.
Present a tube to the analyzer, and tap the [Aspirate] key on the analyzer to dispense
diluent (700μL).
During dispensing the diluent, a progress bar will display.
4.
If more portions of diluent are needed, repeat the procedure.
5.
Add 20μL of capillary blood to the centrifugal tube of diluent, close the tube cap and
shake the tube to mix the sample.
6.
After the prediluted sample is prepared, tap the “Cancel” button to exit dispensing the
diluent.
NOTE
You can also dispense 700μL of diluent by pipette into the tube.
Take methods to prevent the diluent from dust and volatilization; otherwise
the results may be unreliable.
After mixing the capillary sample with the diluent, be sure to wait at least for
3 minutes, and mix the sample again before running the sample.
Be sure to run the prediluted samples within 30 minutes after the dilution.
Be sure to mix any sample that has been prepared for a while before running
it. Do not use a vortex mixer for mixing, for the shaking be too violent and
cause hemolysis.
Be sure to evaluate predilute stability based on your laboratory’s sample
population and sample collection techniques or methods.
5.5.2 Prediluted Samples
5-9
Page 66

Operating Your Analyzer
CAUTION
Before running samples, make sure the analyzer background results are in
acceptable range.
5.6 Sample Analysis
Tap "Sample Analysis" to enter the sample analysis screen. Tap the "Mode" switching
button on the sample analysis screen to select from "WB" and "PD" modes.
5.6.1 Enter Sample Information
You can either enter the ID or the full information of samples.
You can skip the sample information entering procedure at this stage, but enter the
information based on sample ID or sample result saving time after analysis. For details,
check Chapter 6 Reviewing Sample Results.
Before entering sample information on the "Sample Analysis" screen, set up your desired
way for entering sample information on the "Setup→Auxiliary Setup" screen (see Chapter 9
Customizing the Analyzer Software).
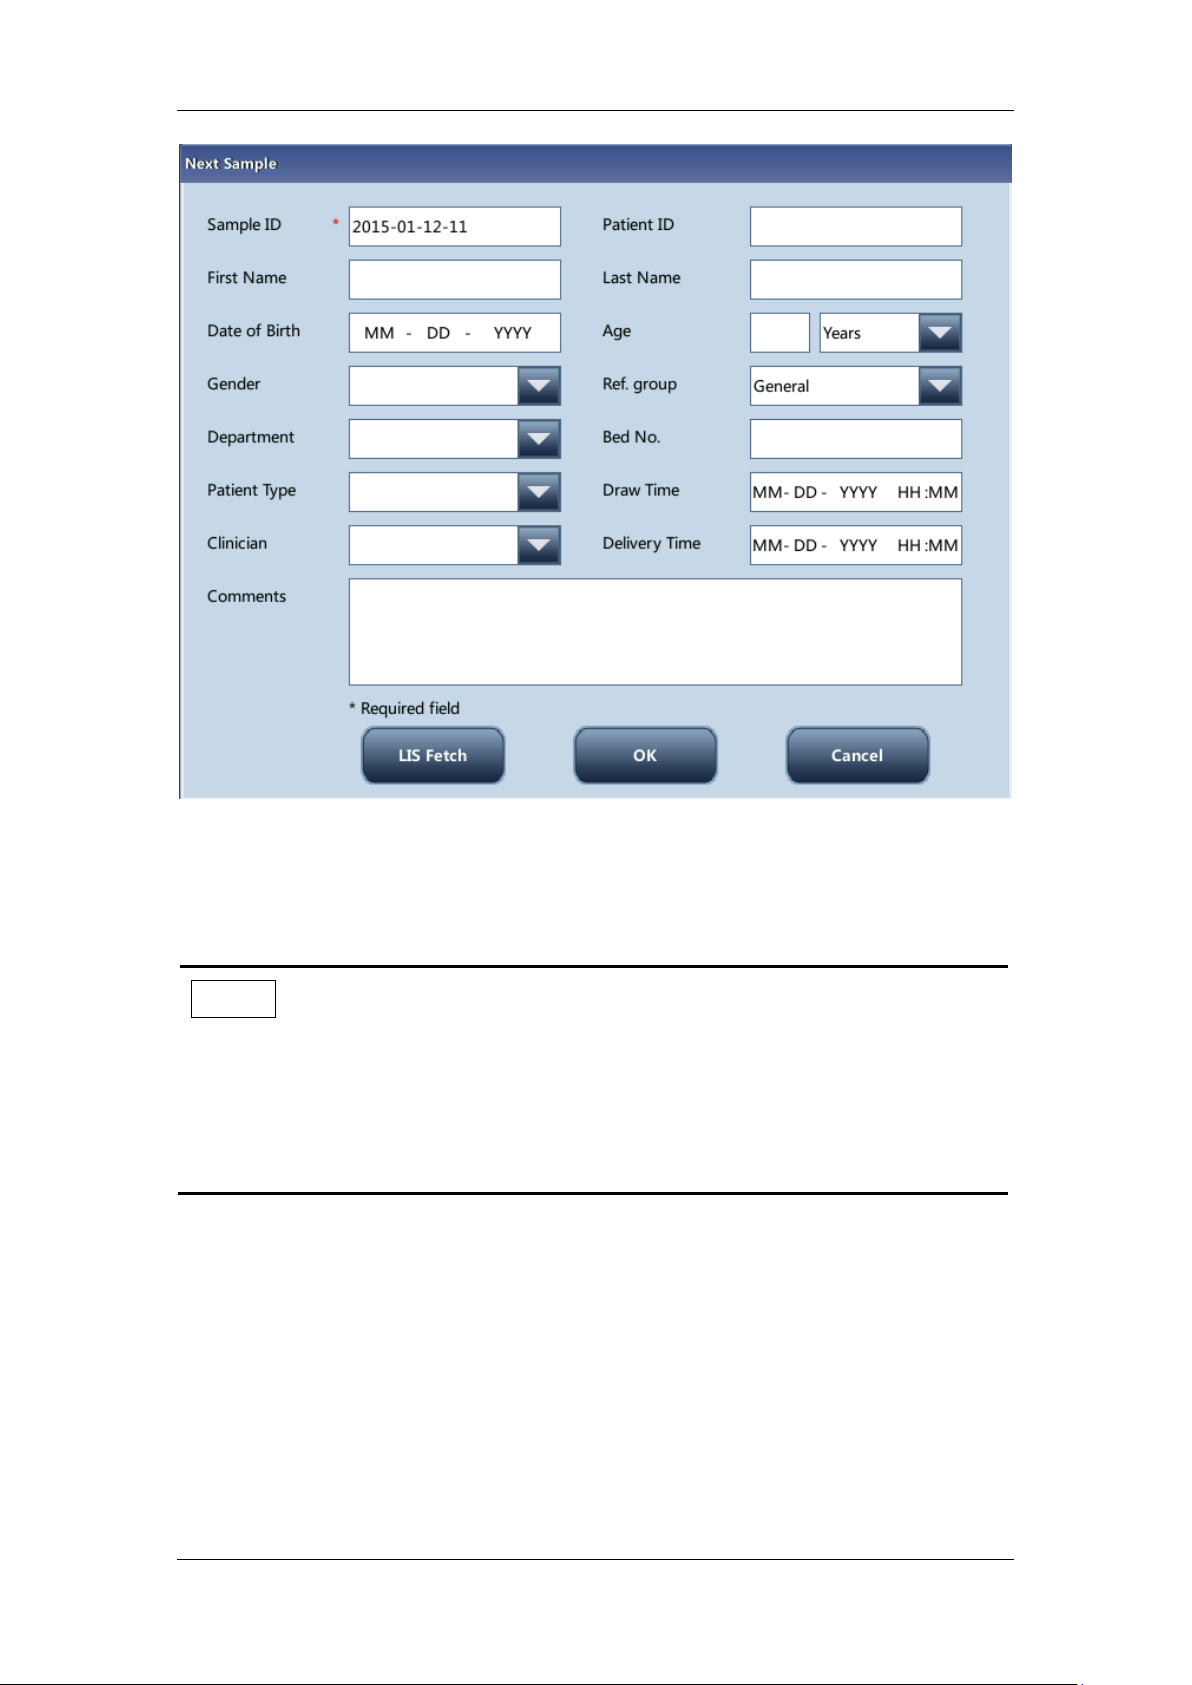
Enter all information
When you have set "Entry of next sample info" to "Enter all information", tap "Next
sample" on the "Sample Analysis" screen, and a dialog box pops up as follows. You can
enter full sample information for the next sample except for "Ref. group", for the system will
assign a matched group automatically.
5-10
Page 67
Operating Your Analyzer
NOTE
You can enter letters, digits and all other characters on the keyboard for
sample ID, only for [a-z][A-Z][0-9][-_].
1 to 20 characters are allowed. It cannot be left empty.
The sample ID must end with a digit; and it cannot only consist of "0".
Figure 5-3 Enter all information
Entering the sample ID
Enter the ID in the "Sample ID" box.
Entering the patient ID
Enter the patient ID to the "Patient ID" box.
Entering the patient name
Enter the patient name in the "Patient" box.
Entering the patient gender
Select the desired item (“Male”, “Female”, or null) from the "Gender" pull-down list. The
5-11
Page 68
Operating Your Analyzer
NOTE
When you enter the patient birth date, the system will automatically
calculate the patient age using the entered "Birth of Date" and current
"System Date" and display the result in the "Age" box and the age "Unit"
combo box, The "Age" box will then be greyed, and will become editable
again when the "Date of Birth" is cleared.
The patient birth date should be no later than current system date.
default option is "Unknown".
Entering the date of birth
Enter the birth date of the patient into the "Date of Birth" box, the birth date format being the
same of the system date.
Entering the patient age
The analyzer provides 5 ways for you to enter patient age – in years, in months, in days and
in hours. The first way is designed for the patients no younger than one year; the second for
the infant patients of one month to two year; the third for the neonatal of one week to ten
weeks; the fourth for the neonatal no older than one month, and the fifth for the neonatal no
older than 48 hours. You may choose one of the four ways to enter the patient age.
Select the desired item from the "Age"pull-down list (“Years”, "Month(s)”, “Weeks”,”Days”
and “Hours”), and you may enter the patient age in the box followed by the age unit.
Entering the patient type
Select "Outpatient", "Inpatient", "Medical Examination" or "STAT" from the "Patient Type"
pull-down list.
Entering the department name
You can either enter the department name in the "Department" box, or select the desired
department from the "Department" pull-down list (if there are previous entries saved in the
list).
Entering the bed number
Enter the bed number of the patient to the "Bed No." box.
Entering the draw time
Enter the time when the sample is collected into the "Draw Time" box.
Entering the delivery time
5-12
Page 69

Operating Your Analyzer
Enter the time when the sample is sent into the "Delivery Time" box.
Entering the clinician name
You can either enter the clinician name into the "Clinician" box, or select the desired clinician
from its pull-down list (if there are previous saved entries in the list)..
Entering the comments
Enter necessary information to the "Comments" box.
OK
When you have finished entering the sample information, tap "OK" to save the information
and return to the "Sample Analysis" screen.
Cancel
If you do not want to save the entered sample information, tap "Cancle" to return the
"Sample Analysis" screen without saving the changes.
Enter sample ID
When you have set "Entry of next sample info" to "Enter sample ID only", tap "Next
sample" on the "Sample Analysis" screen, and a dialog box pop up as follows.
Figure 5-4 Enter sample ID
Enter the ID in the "Sample ID" box. Tap the "OK" button to save the sample ID and close the
dialog box. The ID will be displayed in the "Next Sample" information area on the bottom of
the screen.
Edit current sample information
Tap the sample information area of the sample analysis screen or graph review screen, the
“Edit Info” dialog box will pop up. In this dialog box, you can edit the information of the
sample whose analysis is just completed. This function does not apply to background
5-13
Page 70

analysis and validated samples.
All the samples, controls, calibrators, reagents, wastes and areas contacted
them are potentially biohazardous. Wear proper personal protective
equipment (e.g. gloves, lab coat, etc.) and follow safe laboratory procedures
when handling them and the contacted areas in the laboratory.
WARNING
The sample probe tip is sharp and may contain biohazardous materials.
Exercise caution to avoid contact with the sharp sample probe when
working around it.
CAUTION
Do not reuse disposable products such as collection tubes, test tubes,
capillary tubes and so on.
Operating Your Analyzer
5.6.2 Running the Samples
5-14
Page 71

NOTE
Make sure that the sample probe is fully immersed into the sample and not
in contact with the tube bottom; otherwise the aspiration volume may be
insufficient, or the aspirated volume may not be accurate.
Make sure the sample probe tip does not touch the tube wall, otherwise the
blood sample may spill.
1.
Make sure the analyzer indicator shows that the analyzer is ready for sample analysis,
and the analysis mode is "WB" or "PD".
2.
Present a well mixed sample to the sample probe for aspiration.
3.
Press the [Aspirate] key to start sample analysis. When the analyzer indicator flickers in
green, the analyzer is running.
4.
The sample probe will automatically aspirate certain volume of the WB or PD samples.
When you hear the beeps, remove the sample tube. The probe will ascend and add the
aspirated sample to the count baths. The analyzer will automatically run the sample.
5.
When the analysis is finished, the result will be displayed in the analysis result area on the
screen. The sample probe returns to the original position and gets ready for the next
analysis.
6.
When "Auto print after sample analysis" is set to "On", the analyzer will automatically
print the analysis result report in the preset format; when "Auto Communicate" is set to
"On", the analyzer will automatically upload the eligible sample results as well as sample
and patient information to the LIS system.
7.
Repeat above steps to run other samples.
Sample Analysis
Do as follows to run samples:
Operating Your Analyzer
5-15
Page 72

Operating Your Analyzer
NOTE
If the analyzer detects clogging or bubbles during the analysis, the
corresponding error message will be displayed in the error message area
and the results of all related parameters will be invalidated. See Chapter 11
Troubleshooting Your Analyzer for solutions.
If the ambient temperature is out of the specified operating range, the
analyzer will alarm you for abnormal ambient temperature and the analysis
results may be unreliable. When temperature errors are reported in the error
information area after analysis, see Chapter 11 Troubleshooting Your
Analyzer for solutions.
5.6.3 Processing Analysis Results
Saving of analysis results
The analyzer automatically saves sample results. When the maximum number has been
reached, the newest result will overwrite the oldest.
Histogram flags
The system will flag abnormal histograms. Both WBC histogram and PLT histogram are
flagged for abnormal results.
WBC histogram flags
Abnormal WBC histograms will be flagged by one of the markings: R1, R2, R3, R4 and Rm.
The indications of the markings are as follows:
R1: indicates abnormality on the left side of the lymphocyte hump and possible presence
of platelet clump, giant platelet, nucleated red cell, lyse resistant RBC, high molecular
weight protein and lipoid debris in sample, or electrical noise.
R2: indicates abnormality between the lymphocyte hump and the mid-sized cell area,
possible presence of atypical/immature lymphocyte, plasma cell, blast cell in the sample,
eosinophilia or basophilia.
R3: indicates abnormality between the mid-sized cell area and the granulocyte hump,
possible presence of immature granulocyte, blast cell, left shift, immature monocyte or
eosinophilia.
R4: indicates abnormality on the right side of the granulocytes hump, possible presence
of immature granulocyte, blast cell, agglutinated white cell, or netrophilia.
Rm: indicates at least two R flags.
Editing the histogram (for administrators only)
Tap the WBC histogram to activate the editing function, and then you can edit the position of
the discriminator A or B. After the histogram is edited, the system will automatically
5-16
Page 73

re-calculate the differential results.
Flag type
Information
Meaning
WBC Flag
Leucopenia
Low WBC count
Leucocytosis
High WBC count
Granulocyte
decreased
Low granulocyte number
Granulocyte increased
High granulocyte number
WBC abnormal
NRBCs, abnormal/atypical lymphocytes,
immature or blast cells may present
Operating Your Analyzer
PLT histogram flags
Abnormal PLT histograms will be flagged by the marking Pm, PS, PL.
The indication of the marking is as follows:
Pm: indicates blur demarcation between the platelet area and red blood cell area and
possible presence of large platelet, platelet clump, small red blood cell, cell debris or
high molecular weight protein.
PS: small platelet possibly high notice.
PL: giant platelet possibly high notice.
Parameter flags
Table 1 Flags of abnormal blood cell differential or morphology
5-17
Page 74

Operating Your Analyzer
Lymphocyte
decreased
Low lymphocyte number
Lymphocyte increased
High lymphocyte number
Mid-size cell increased
High mid-sized cell number
Pancytopenia
Low WBC, RBC and PLT count
RBC Flag
RBC Distribution
Abnormal
Possible presence of microcytosis,
macrocytosis, anisocytosis, RBC agglutination
and diamorphologic histogram.
HGB Abn./Interfere?
HGB results may be abnormal or interference
may exist (for example, high WBC count)
Microcytosis
Small MCV
Macrocytosis
Large MCV
Anemia
Anemia
Erythrocytosis
High RBC count
PLT Flag
PLT Distribution
Abnormal
Possible presence of microcytosis, RBC debris,
large platelet and platelet coagulation.
Thrombopenia
Low PLT count
Thrombocytosis
High PLT count
NOTE
Abnormal parameter or histogram results of background check will not be
flagged. When the background results do not meet requirements, the
analyzer will alarm for abnormal background.
5-18
Page 75
Operating Your Analyzer
NOTE
On the “Status” screen, the analyzer cannot enter the standby status.
If it is the time for standby but the analyzer has an error, then only after the
error is removed will the auto-standby starts accordingly.
You can perform the operations not involving the analyzer when it is on
standby, such as communication and print etc.
Refer to Section 9.2.5 Maintenance Setup for how to edit waiting time before
entering standby mode.
Under stand-by mode, if there are unfinished printing or communication
tasks, the analyzer will go on processing them.
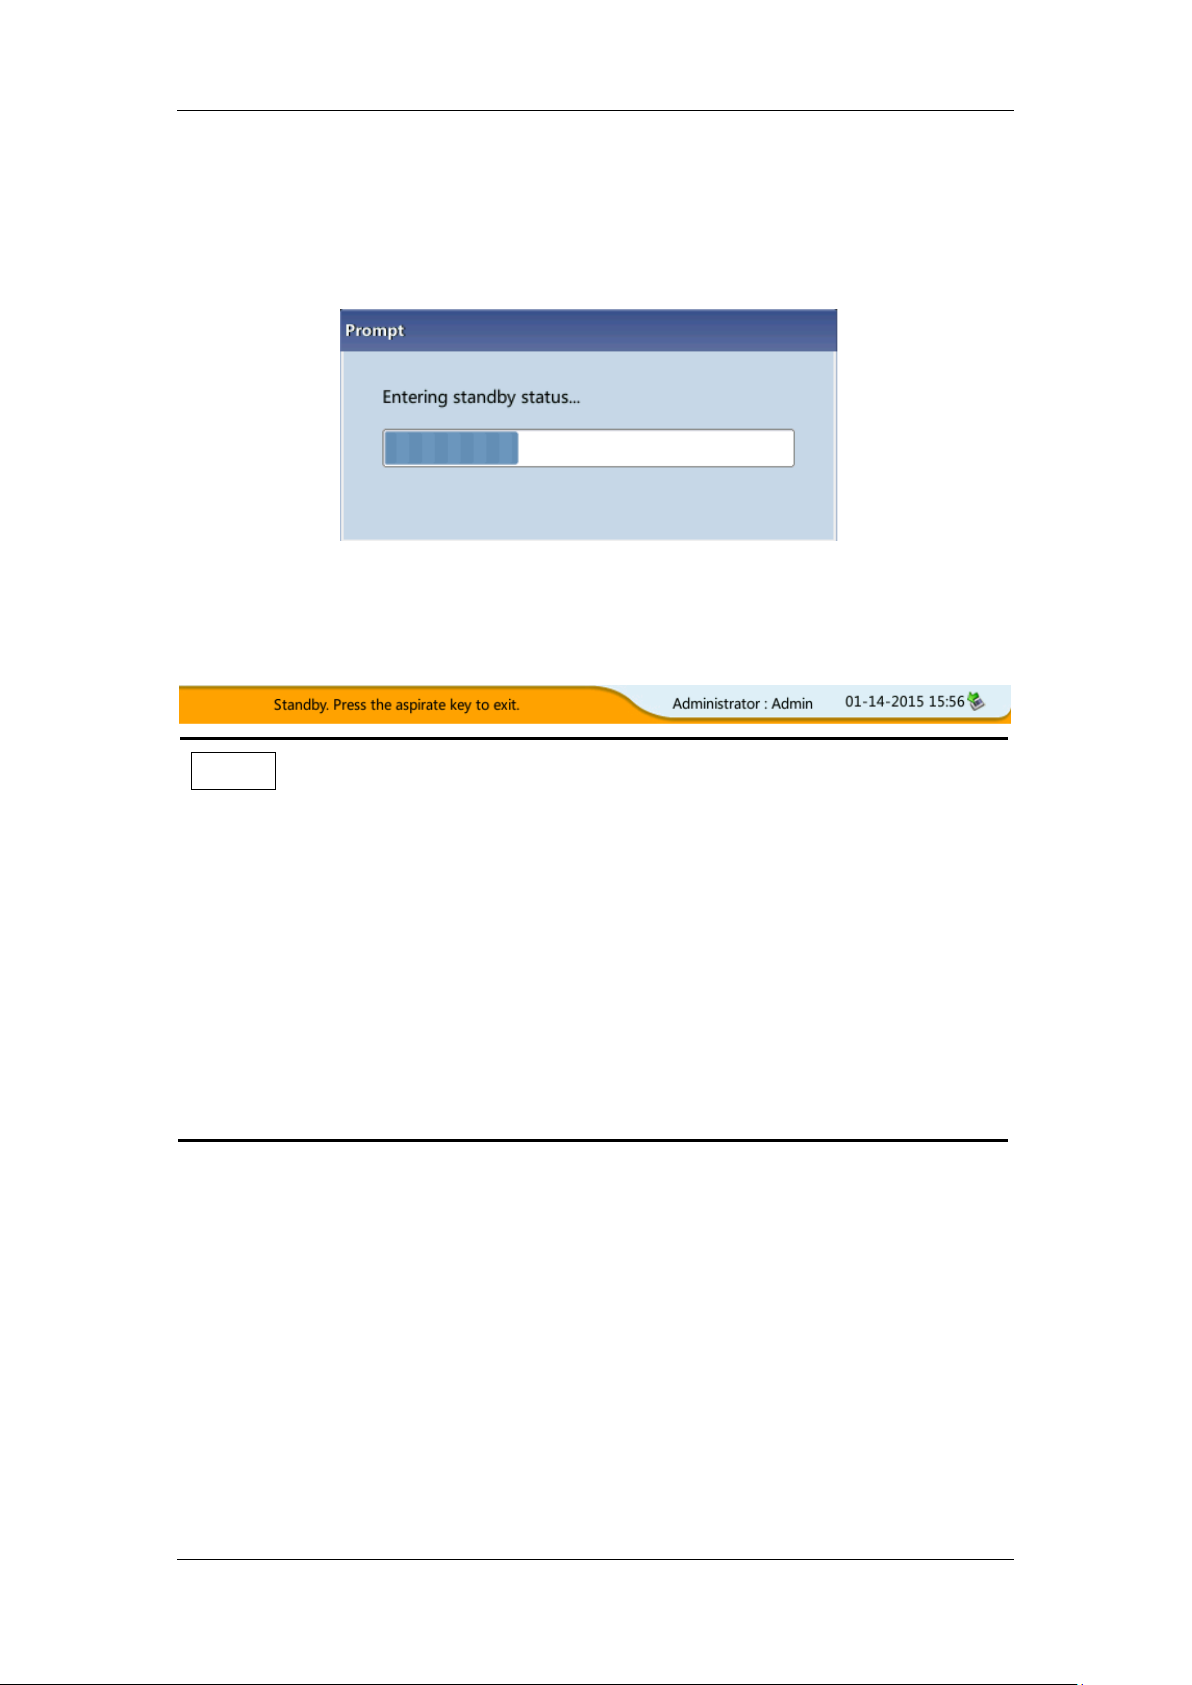
5.7 Standby
When the fluidics system stop working for 15 minutes (default, which can be set at the setup
screen. See Chapter 9 Customizing the Analyzer Software for details), then the analyzer will
enter the standby status automatically.
After entering the sleep mode, the bottom right of the screen displays "Standby. Press the
[Aspirate] key to exit. "
5-19
Page 76

Operating Your Analyzer
NOTE
Different maintenances will be performed by the analyzer automatically
when exiting the standby status, and the exiting time depends on how long
the analyzer was in the standby status.
If any error happens during the process of exiting the standby status, see
Chapter 11 Troubleshooting Your Analyzer for details to remove the error.
After exiting standby mode, the analyzer will return to the status before
standby. The analysis status icon on at the screen displays in green. The
indicator on the analyzer displays in green at the same time.
[Aspirate] key
Press the [Aspirate] key on the analyzer to exit the standby mode.
After canceling the standby mode, the progress bar will be closed automatically, the analyzer
will exit the standby mode.
5-20
Page 77

Operating Your Analyzer
All the samples, controls, calibrators, reagents, wastes and areas contacted
them are potentially biohazardous. Wear proper personal protective
equipment (e.g. gloves, lab coat, etc.) and follow safe laboratory procedures
when handling them and the contacted areas in the laboratory.
WARNING
The sample probe tip is sharp and may contain biohazardous materials.
Exercise caution to avoid contact with the sharp sample probe when
working around it.
NOTE
To ensure stable analyzer performance and accurate analysis results, be
sure to perform the "Shutdown" procedure to shut down the analyzer after it
has been running continuously for 24 hours.
Be sure to shut down the analyzer strictly as instructed below.
Do not force power off the analyzer during the "Shutdown" procedure.
If error that will affect shutdown occurs during the showdown process, the
analyzer will resume to its original status and report the error. See Chapter
11 Troubleshooting Your Analyzer for solutions.
1.
Tap the "Shutdown" button on the main menu, the shutdown dialog box shown as
follows will display:
Figure 5-5 Shutdown
5.8 Shutdown
Perform the "Shutdown" procedure to shut down the analyzer every day.
5-21
Page 78

Operating Your Analyzer
2.
Tap "OK", and follow the instruction to present probe cleanser to the sample probe, then
press the [Aspirate] key.
The sample probe automatically aspirates the probe cleanser; then the probe cleanser
maintenance starts. A progress bar will be displayed on the screen to indicate the probe
cleanser maintenance progress.
3.
When the shutdown procedure is finished, the screen will display "Please power off the
analyzer". Turn off the analyzer.
4.
Empty the waste container and dispose of the waste properly.
WARNING
Be sure to dispose of reagents, waste, samples, consumables, etc.
according to government regulations.
5-22
Page 79

NOTE
The sample result data must have proper backup in case of data lost caused
by hardware or software error.
6 Reviewing Sample Results
6.1 Introduction
After every analysis cycle, the analyzer automatically saves the analysis results into the
sample database. Totally 100,000 records (including parameter results and histograms) can
be saved.
You can either choose the "Table Review" mode to review the parameter results of all
samples saved in the sample and search databases; or the "Graph Review" mode to review
both the parameter results and the histograms of each sample.
6-1
Page 80

Reviewing Sample Results
6.2 Table Review
You can browse, review, search, edit and export previous saved data on the "Table Review"
screen. Tap "Table Review" to enter the "Table Review" screen.
Table area
The table area displays the list of the analyzed samples with basic information like sample ID
and sample state.
6-2
Page 81
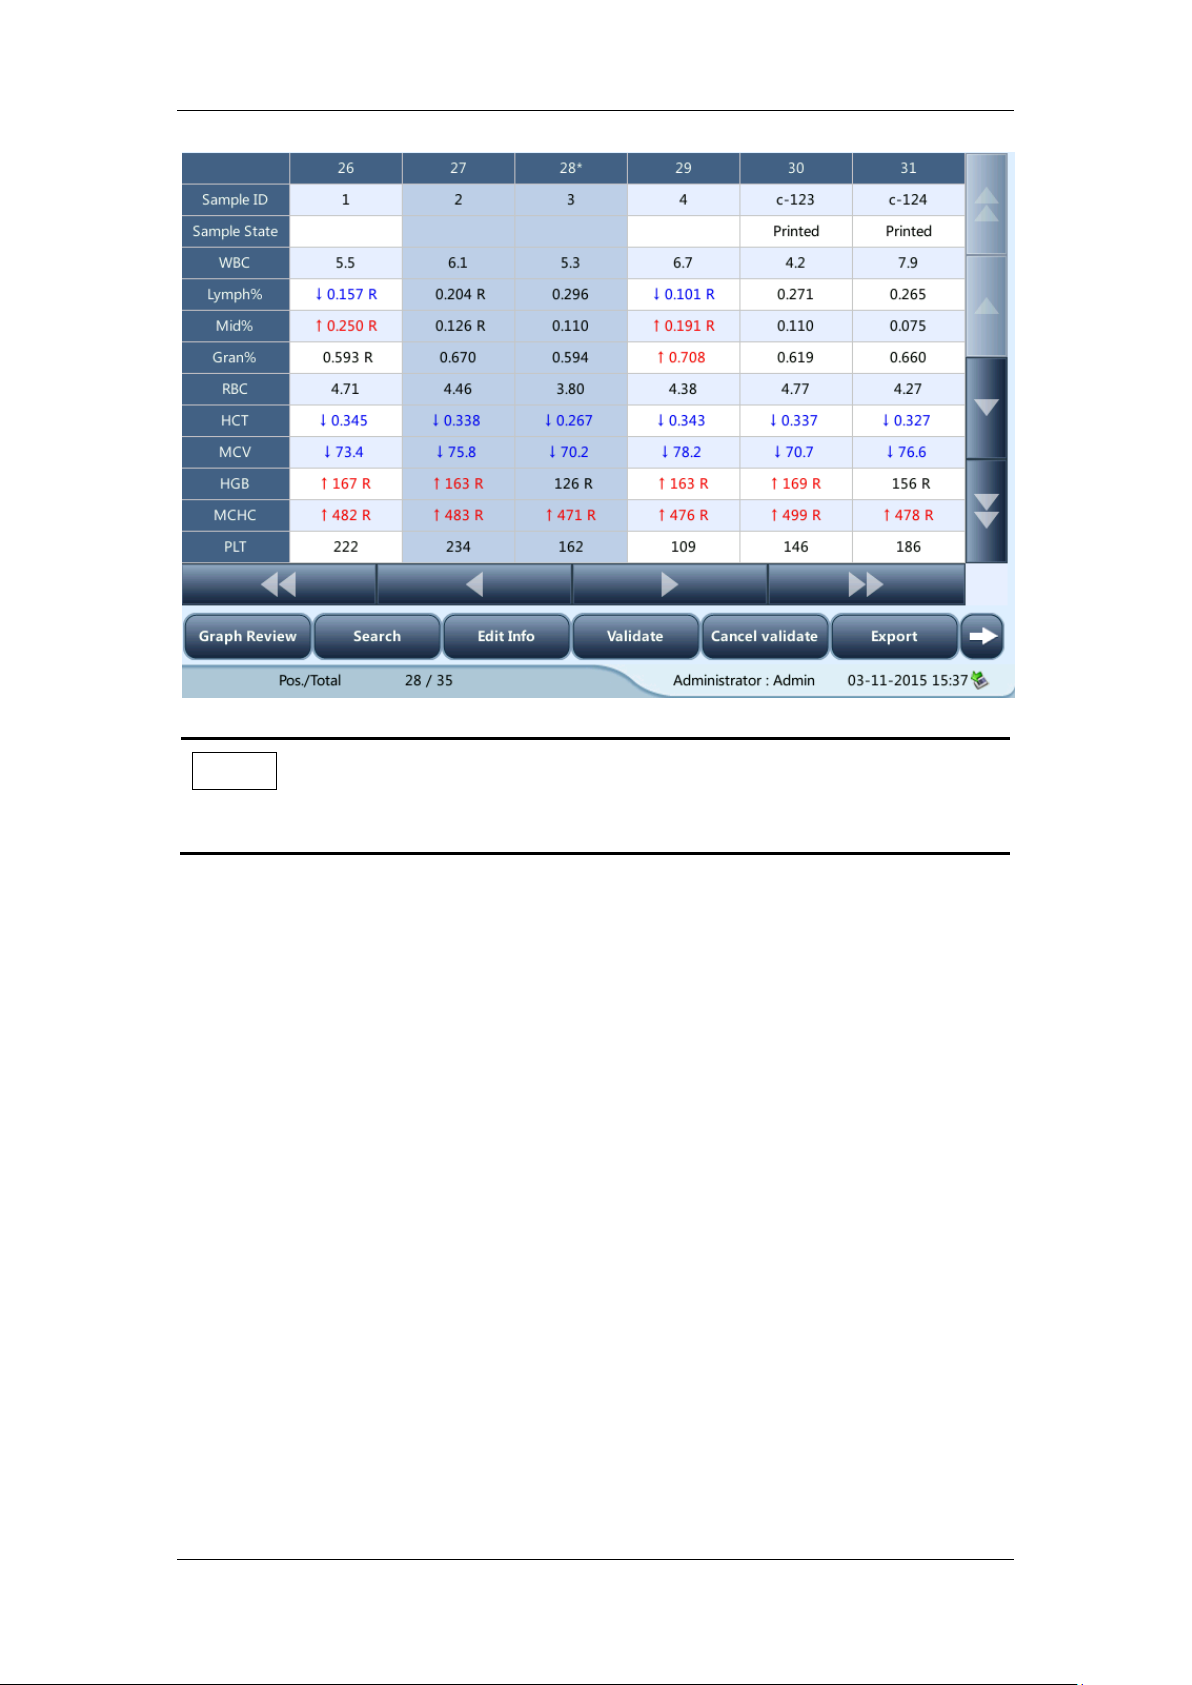
Reviewing Sample Results
NOTE
The latest sample record is on the utmost top of the table.
Graph review
You can either tap the "Graph Review" button on the "Table Review" screen or tap
"Previous" on the "Sample Analysis" screen to review the detailed results of each sample.
6-3
Page 82

Reviewing Sample Results
Tap the button to switch between the “Count” screen and the “Graph Review” screen.
Edit results
Tap the desired sample result and it will be highlighted. Tap the "Edit Result" button and the
following dialog box will display.
Modify the results and tap "OK" to save the changes. The information on the graph review
screen will be refreshed.
6-4
Page 83

Searching for sample
1.
Tap "Search", the following dialog box will display.
2.
Enter searching conditions into the edit boxes or select them from the pull-down lists.
3.
Tap "OK" to start search, the results will displayed in the table.
1.
Tap the desired sample result on the "Table Review" screen and it will be highlighted. Tap
the "Edit Info" button and the following dialog box will display.
2.
Modify the sample and patient information as necessary, and tap "OK" to save the
changes. The information on the table review screen will be refreshed.
Reviewing Sample Results
Edit information
6-5
Page 84

Reviewing Sample Results
Validate/Cancel validate (for administrators only)
Validate sample data
Select the sample record(s) to be validated on the “Table Review” screen, and then tap the
"Validate" button to validate. The "Sample State" of the record(s) will become "Validated".
Cancel validate
Select the validated sample record(s) on the "Table Review" screen, and then tap the
"Cancel validate" button. The text of "Validated" will disappear from the "Sample State".
6-6
Page 85

Export
1.
Tap "Export", the following dialog box will display.
2.
Select "Selected" or "All" in the "Export Range" area.
1.
Select sample(s) to be transmitted on the "Table Review" screen.
2.
Tap "Comm.", the following dialog box will display.
3.
Tap the "Selected" radio button.
4.
Tap "OK" to start transmitting specified results to the data management software.
Reviewing Sample Results
Communication
Transmit selected data
6-7
Page 86
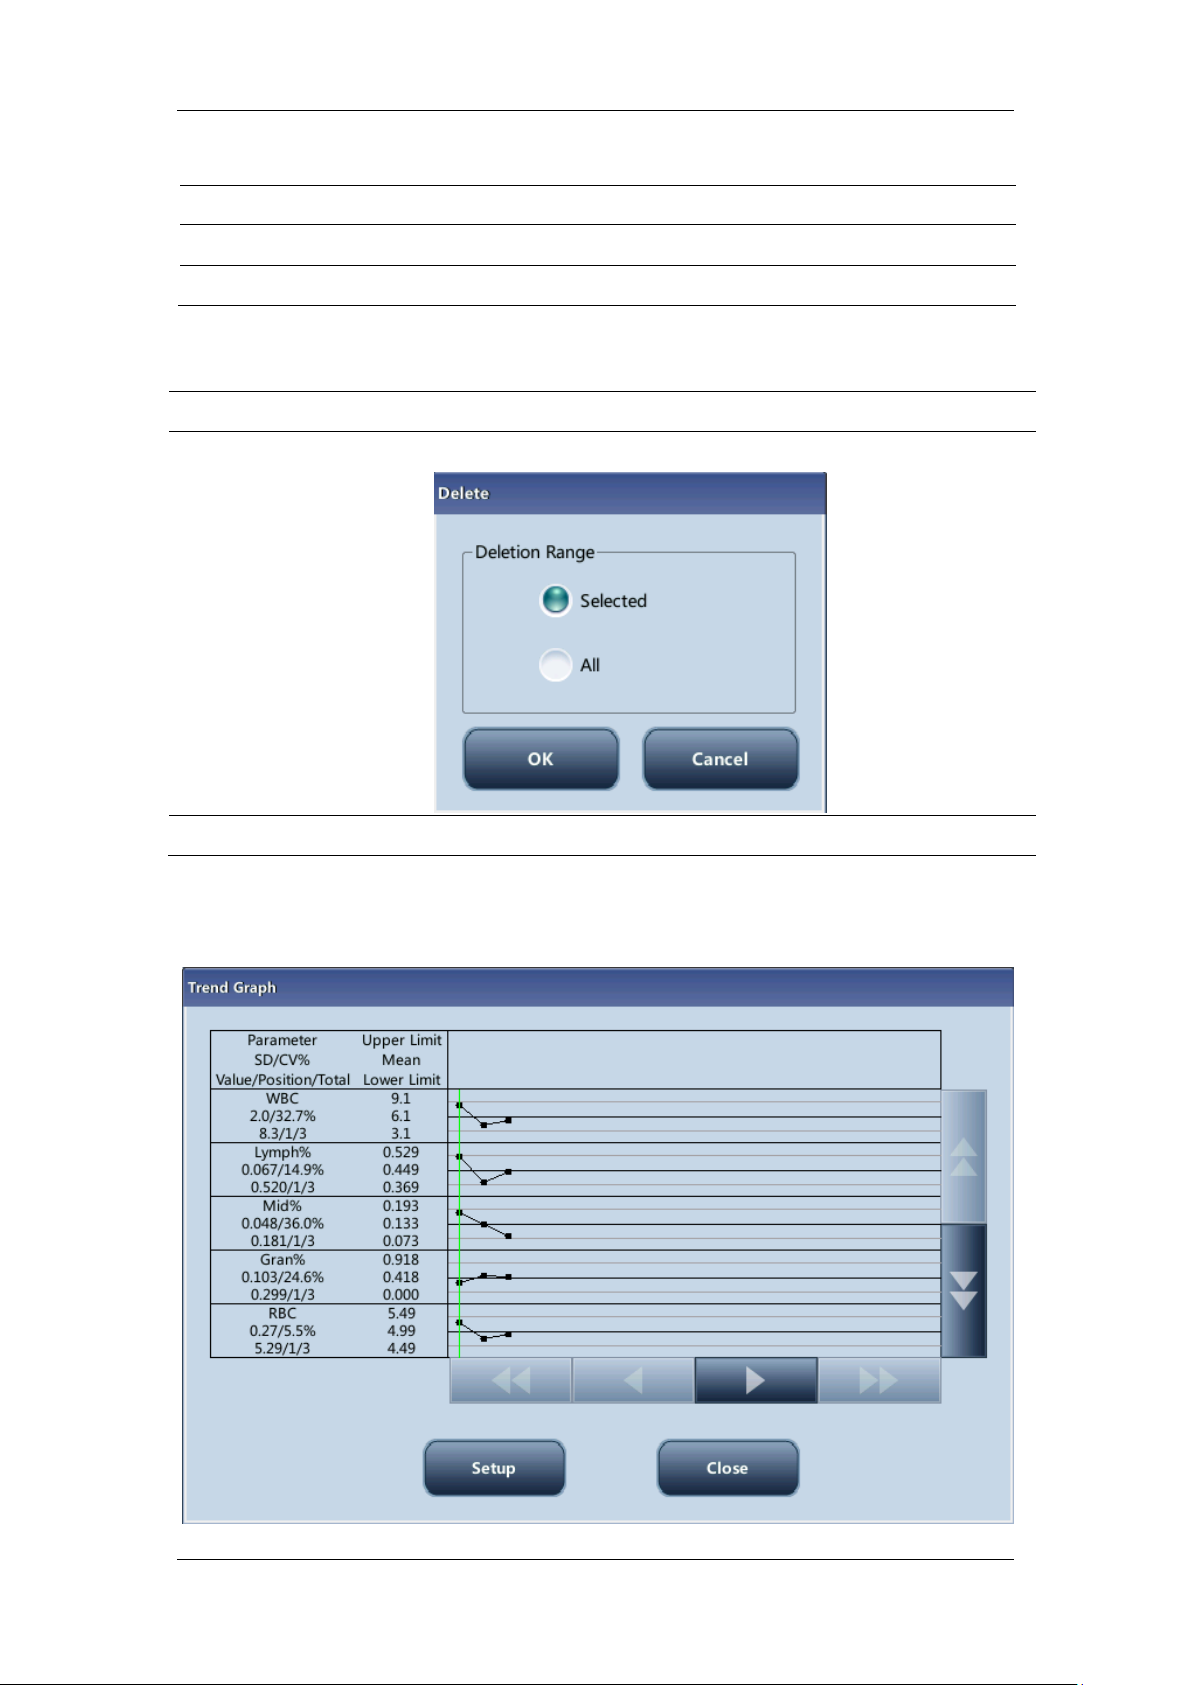
Reviewing Sample Results
1.
Tap "Comm.", the following dialog box will display.
2.
Tap the "All" radio button.
3.
Tap "OK" to start transmitting all results to the data management software.
1.
Select the sample record to be deleted.
2.
Tap the "Delete" button, the following dialog box will display.
3.
Tap "OK" to delete the record, and the dialog box will be closed.
Transmit all data
Delete (for administrators only)
Trend graph
Tap the "Trend Graph" button to see the trend graph of sample results.
6-8
Page 87

Reviewing Sample Results
NOTE
When a sample has been validated and printed, its "Sample State" will
display "Validated".
Print
Print reports as per the default report template
Select sample records to be printed, and then tap "Print" to print them. On the "Graph
Review" screen, the "Sample State" of the printed sample will become "Printed".
6-9
Page 88

Page 89

7 Using the QC Programs
NOTE
Use the controls and reagents specified by the manufacturer only. Store and
use the controls and reagents as instructed by their instructions for use.
7.1 Introduction
Quality Control (QC) consists of strategies and procedures that measure the precision and
stability of the analyzer. The results reflect the reliability of the sample results. QC involves
measuring materials with known, stable characteristics at frequent intervals.
Analysis of the results with statistical methods allows the inference that sample results are
reliable. Mindray recommends you run the QC program daily with low, normal and high level
controls. A new lot of controls should be analyzed in parallel with the current lot prior to their
expiration dates. This may be accomplished by running the new lot of controls twice a day for
five days using any empty QC file. The QC files calculate the mean, standard deviation and
coefficient of variation for each selected parameter. The instrument-calculated means of
these ten runs should be within the expected ranges published by the manufacturer.
This analyzer provides two QC programs: L-J QC and X-B QC.
7-1
Page 90
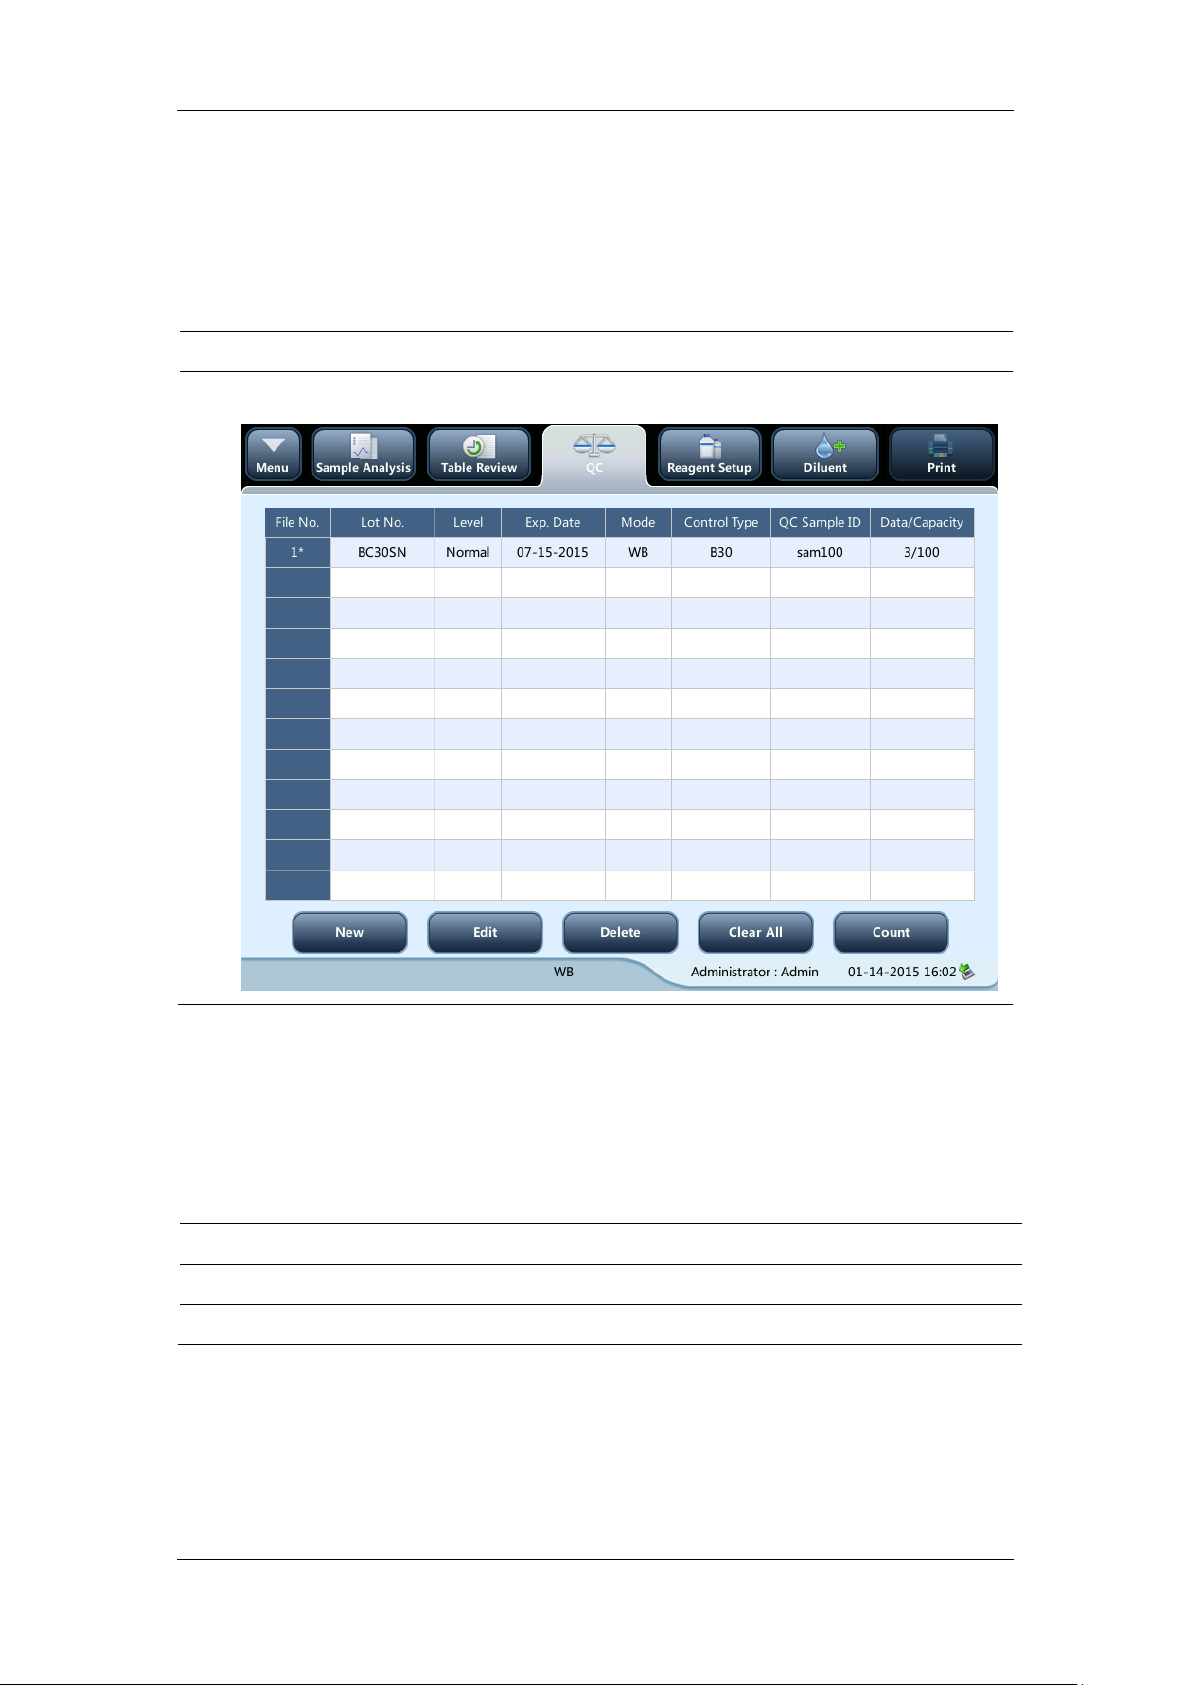
Using the QC Programs
1.
Tap the menu option "QC" > "L-J QC" > "Setup".
2.
Enter the L-J QC setup screen.
1.
Enter the L-J QC setup screen.
2.
Tap "New", or select a QC file without QC results, and then tap "Edit".
3.
Tap "Import File".
7.2 L-J QC
7.2.1 Editing L-J Settings (for Administrators Only)
Before running a new lot of controls, you must set up a QC file for each lot of controls.
You may set up QC information by any of the following two ways.
Reading the information provided by the manufacturer
Manual entry
Reading the information provided by the manufacturer
7-2
Page 91
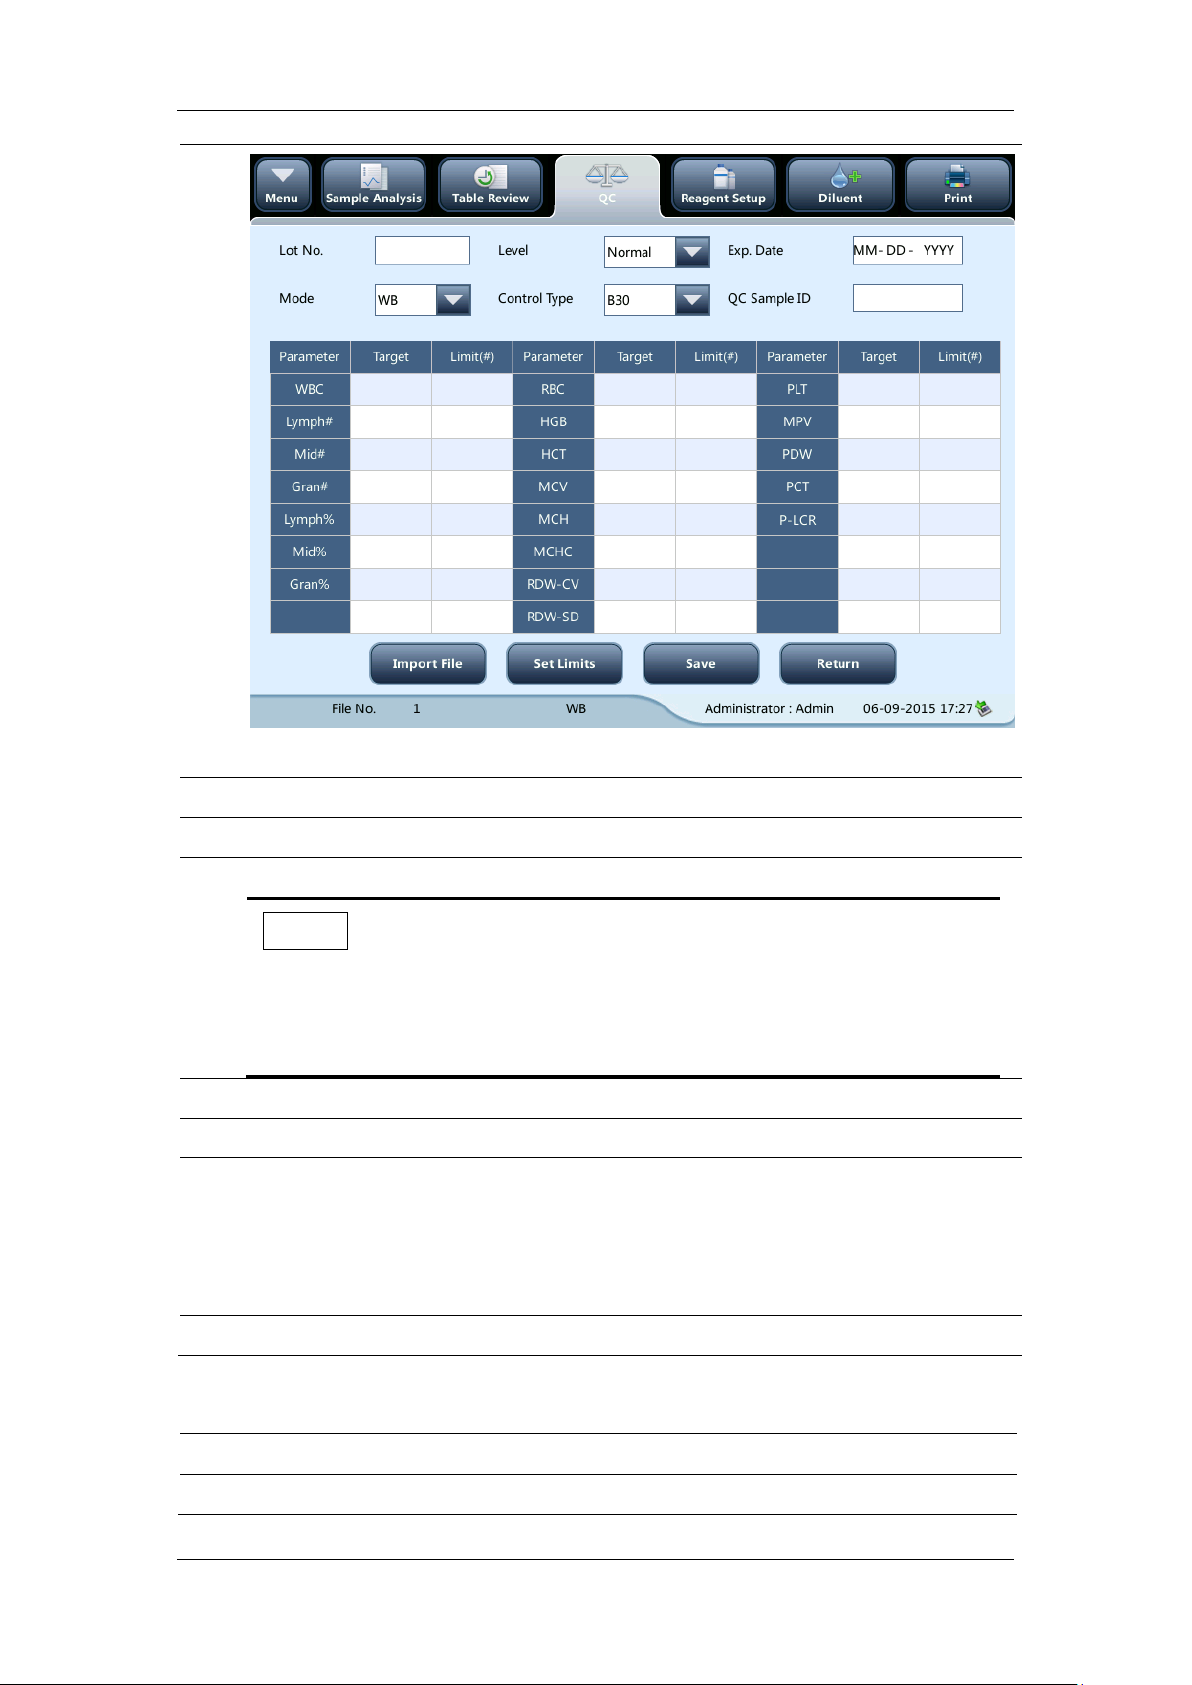
Using the QC Programs
4.
Select the QC file to be imported.
5.
Tap "OK" to close the dialog box and return to the L-J QC setup screen.
6.
Tap "OK" to read the selected QC information to the current QC file.
NOTE
The "Import target/limits" check box is selected by default. If it is
deselected, the operator must enter the target and limits of QC
parameters manually.
7.
Select the "Control type" from the pull-down list.
8.
Select the QC mode.
9.
Set QC sample ID: if you are used to analyzing control together with blood samples,
you can set a unique ID for the control. The analyzer will recognize the sample as
control when it reads the unique ID. After the analysis completes, the results will be
saved into the QC file of the QC sample ID.
10.
Tap other icons to switch screen and save the QC information.
1.
Enter the L-J QC setup screen.
2.
Tap "New", or select a QC file without QC results, and then tap "Edit".
Manual entry
7-3
Page 92

Using the QC Programs
3.
Enter the lot No. of the controls in the edit box manually.
NOTE
The lot No. shall not be empty and up to 16 digits can be entered.
You can enter characters, numbers, letters.
4.
Select the control level.
5.
Enter the expiration date of the lot.
6.
Select the "Control type" from the pull-down list.
7.
Select the QC mode.
8.
Set QC sample ID: if you are used to analyzing control together with blood samples,
you can set a unique ID for the control. The analyzer will recognize the sample as
control when it reads the unique ID. After the analysis completes, the results will be
saved into the QC file of the QC sample ID.
9.
Enter the target and limits in the edit boxes according to the package insert of the lot
of controls.
10.
Tap other icons to switch screen and save the QC information.
7-4
Page 93

Using the QC Programs
1.
Tap "Set Limits".
2.
Tap “By SD” to display the limits in the form of absolute value;
or tap “By CV” to display the limits in the form of percentage.
3.
Tap the “OK” button to save the settings.
CAUTION
Running QC sample with error present will lead to unreliable results. If
errors are reported during QC analysis, remove the errors first and then
continue with the analysis.
Sample agglutination may result in inaccurate analysis results. Check the
control samples to see if there is any agglutination, if yes, process the
samples according to your laboratory's protocols.
Setting limits
You can adjust the format of limits as per the following procedure:
7.2.2 Running Controls
You can select one of the two ways below to run controls:
Run controls under the "QC" screen.
Put controls together with normal samples, and run the controls under the sample
analysis screen.
Running controls under the "QC" screen
After editing the QC information, you can start QC analysis by one of the following ways
according to the selected QC mode.
Whole blood
Predilute
7-5
Page 94
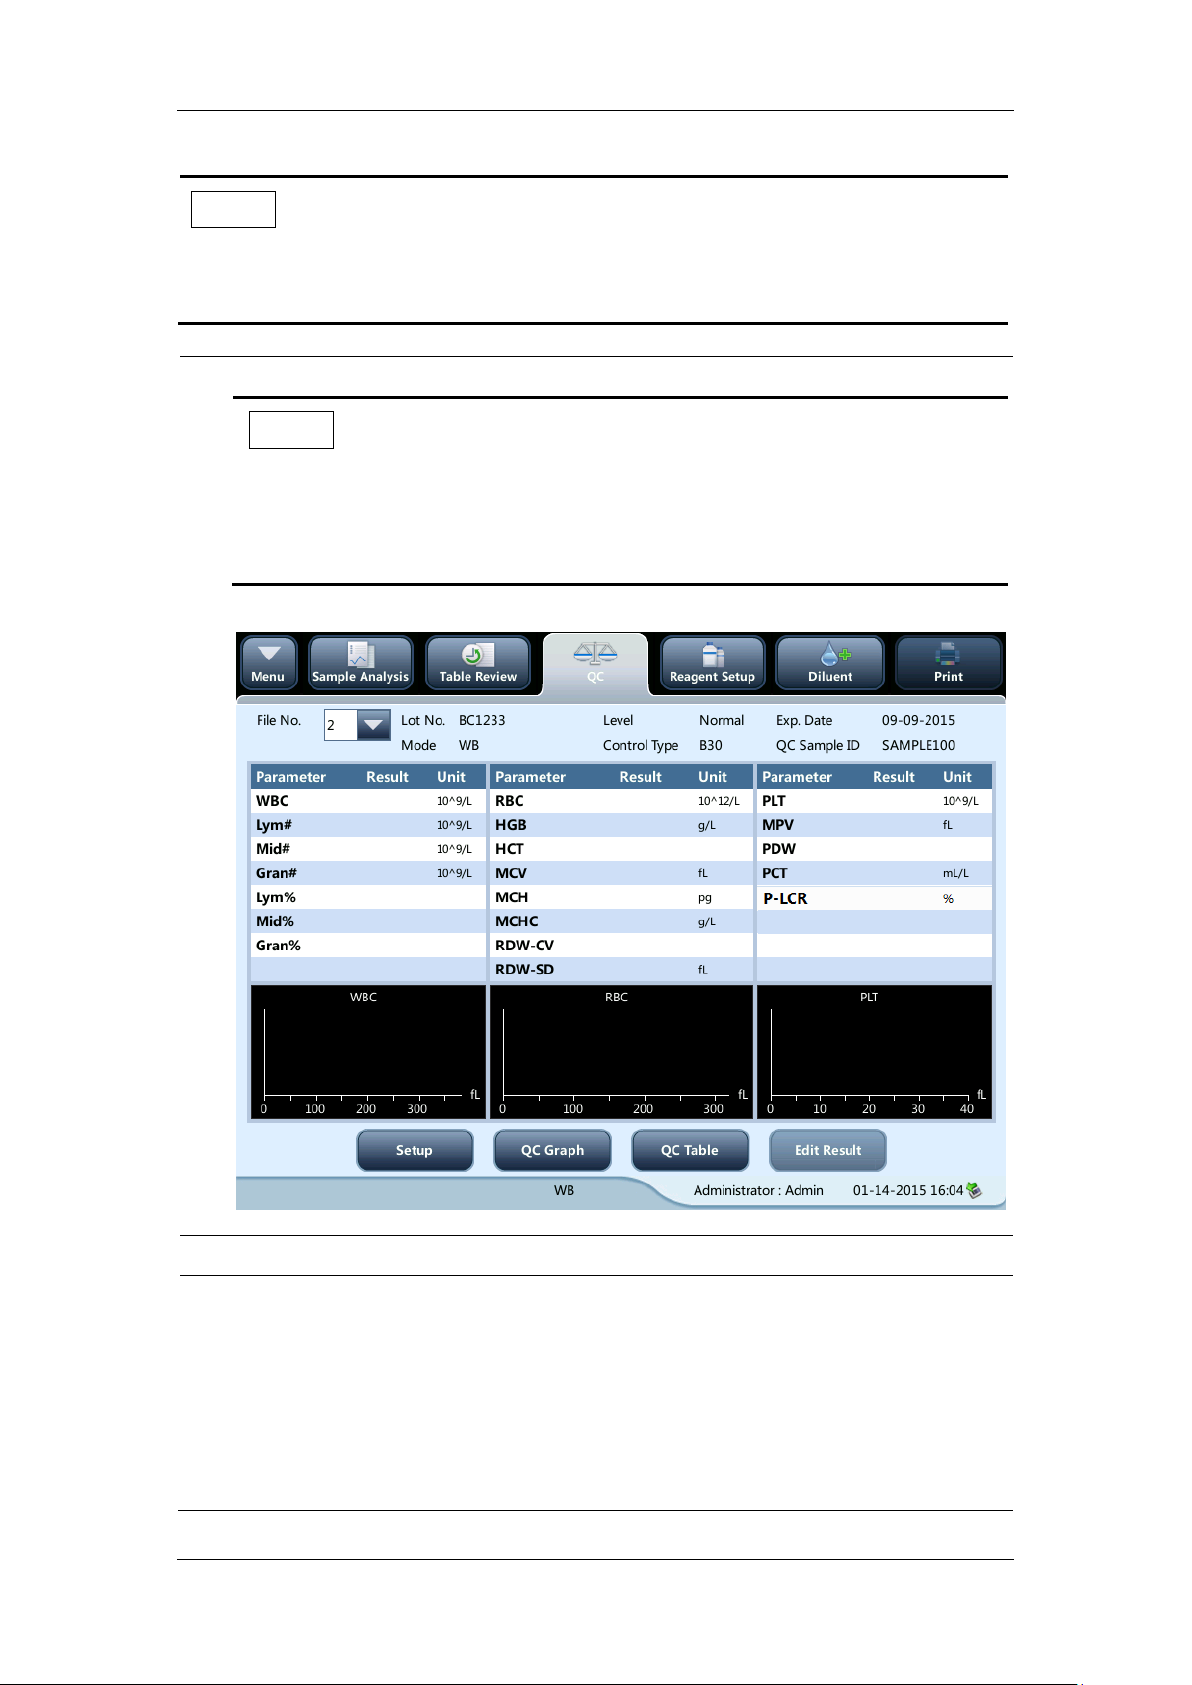
Using the QC Programs
NOTE
When switching mode from "PD" to "WB", a progress bar will be displayed
while the analyzer runs mode switching sequence.
1.
Tap "QC" > "L-J QC" > "Count" to enter the QC count screen.
NOTE
Be sure that the level of the control to be run is the same with the
current QC file, and the control is not expired.
The expiration date of expired controls is displayed in red.
2.
Prepare the control as instructed by instructions for use of the controls.
3.
Run QC analysis:
1) Make sure the analysis mode is "WB " or "PD" and the indicator of the analyzer is
green.
2) Shake the vial of sample as instructed by instructions for use of the control to mix the
sample thoroughly.
3) Present the control sample to the sample probe. Press the [Aspirate] key to start QC
7-6
Page 95
Using the QC Programs
run.
4) When you hear the beep, remove the control.
4.
When analysis finishes, the QC results will be displayed in the current screen and be
saved in the QC file automatically.
NOTE
Up to 100 QC results can be saved in each QC file.
5.
Do the above procedures to continue running QC analysis if necessary.
1.
Prepare the control as instructed by instructions for use of the controls.
2.
Refer to section 5.5 Sample Preparation for sample preparation under whole blood
and predilute modes.
3.
When it is ready to run a sample (i.e. the status icon and the analyzer indicator is
green), present the sample to the sample probe.
4.
When you hear the beep, remove the control.
5.
When analysis finishes, the QC results will be displayed in the current screen and be
saved in the QC file automatically.
NOTE
Up to 100 QC results can be saved in each QC file.
6.
Do the above procedures to continue running QC analysis if necessary.
Putting controls together with normal samples, and running the
controls under the sample analysis screen
After setting special "QC Sample ID" for a control under the QC setup screen, you can put
the control together with normal samples, and run it under the “Sample Analysis” screen.
When editing worklist or entering next sample information in the "Next Sample" dialog box
before daily analysis, enter the special "QC Sample ID" as "Sample ID".
Based on the QC mode selected, you can choose to run QC analysis from one of the
following ways:
Whole blood
Predilute
7-7
Page 96

Using the QC Programs
NOTE
When switching blood mode from "PD" to "WB", a progress bar will be
displayed while the analyzer runs mode switching sequence.
1.
Tap "Restore" on the "Edit Result" screen.
2.
Tap "OK" to restore the measurement values.
3.
Tap "OK" to close the dialog box and start to restore results.
1.
Tap "Graph" button on the "L-J QC Run" screen to enter the L-J QC graph screen.
Editing and saving results (for administrators only)
Tap "Edit Result" on the QC screen to edit results and tap "OK" to save the edited results.
The edited results will be marked with an "E".
Restoring results (for administrators only)
Operators of administrator access level can restore the edited results to the original
measurement results.
7.2.3 Reviewing L-J Results
After QC analysis, you can review the QC results in the following ways:
QC Graph
QC Table
X-B QC graph review
7-8
Page 97
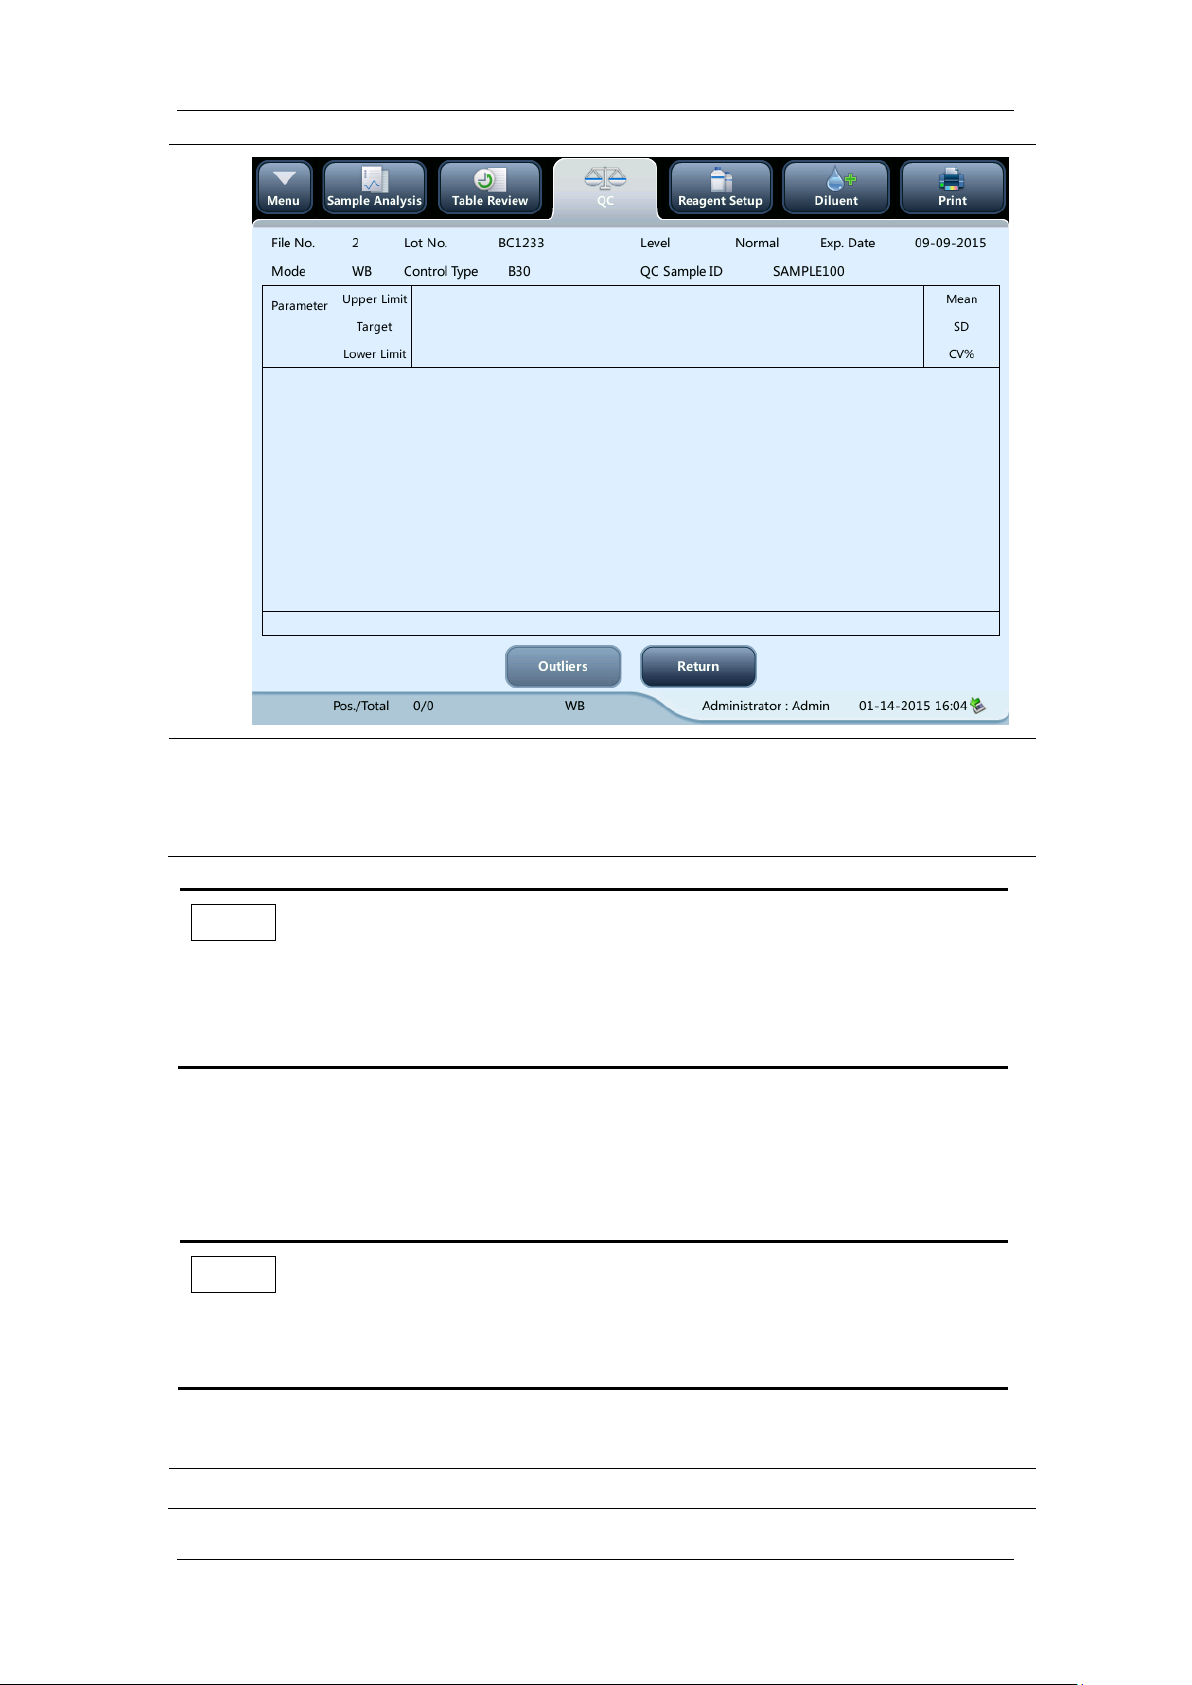
Using the QC Programs
2.
You can tap the arrow buttons on the right of the graph to browse graphs of the
parameters. You can tap the arrow buttons under the graph horizontally to browse all the
QC results.
NOTE
If a parameter target/limits of the QC files with QC results are modified and
saved, and the targets/limits of other parameters changes accordingly,
those changed data will be highlighted in yellow.
NOTE
The green vertical line and values of the corresponding QC points will not
be printed.
1.
Tap the "QC Table" button on the "L-J QC Run" screen to enter the L-J QC table screen.
Print
Tap the "Print" icon in the status bar to print information of the current QC file and the QC
graph of all parameters.
L-J QC table review
7-9
Page 98

Using the QC Programs
2.
You can tap the arrow buttons on the right of the QC table to browse all QC records. You
can tap the arrow buttons under the QC table to browse all the parameter results.
NOTE
If a parameter target/limits of the QC files with QC results are modified and
saved, and the targets/limits of other parameters changes accordingly,
those changed data will be highlighted in yellow.
1.
Tap "Delete", the following dialog box will display.
2.
Tap "Yes" to delete the selected records.
Delete (for administrators only)
7-10
Page 99

Using the QC Programs
NOTE
The operation will be recorded in the system log.
NOTE
If auto-communication is enabled and a sample is run during the
transmission of the QC data, then only when the QC data transmission
finished will the auto-communication of the sample result start.
The QC data saved in the process of transmission will not be transmitted.
1.
Insert a USB and then tap "Export".
2.
The system will detect the USB and export data automatically.
3.
The prompt "Export succeeded." will display.
Print
You can tap the "Print" icon in the status bar to print the QC table.
Transmission
To transmit QC data to external data management software or HIS/LIS/HIS, tap the "Comm."
button to transmit specified results to the data management software.
Export
To export QC information and results of the current QC file, do as follows:
7-11
Page 100

Using the QC Programs
1.
Tap the menu option "QC">"X-B QC">"Setup", the following screen will display.
2.
On the X-B QC setup screen, you may activate/deactivate X-B QC, set target/limits, and
configure the sample validity setup.
1.
In the “Sample number/group.” edit box, you may enter the amount of samples [within
the range 20(default) to 200] to be included in calculating for an X-B QC point.
7.3 X-B QC Program
7.3.1 Introduction
The X-B analysis is a weighted moving average analysis that uses values obtained from
patient samples. It uses the 3 red cell indices, MCV, MCH and MCHC to indicate the
hematology instrument performance.
It is recommended the X-B QC be activated when the sample volume of your laboratory is
greater than 100 samples per day. Effective use of X-B requires randomization of samples
and a normal cross section of patients to prevent skewing of indices. It observes the trend of
QC results in the reference range formed by the specified target and limits.
The analyzer implement X-B QC on the 3 parameters: MCV, MCH and MCHC, each group of
samples for X-B analysis consists of 20-200 sample results obtained from normal analysis of
both WB and PD modes. The analyzer can save up to 1,000 X-B QC results. When the saved
QC results have reached the maximum number, the newest result will overwrite the oldest.
7.3.2 Editing X-B Settings (for Administrators Only)
Editing X-B settings
7-12
 Loading...