

Page 1

EXO
User Manual
ADVANCED WATER QUALITY MONITORING PLATFORM
Item# 603789REF
Revision A
Page 2

e information contained in this manual is subject to
change without notice.
Eort has been made to make the information in
this manual complete, accurate, and current. e
manufacturer shall not be held responsible for errors or
omissions in this manual. Consult EXOwater.com for the
most up-to-date version of this manual.
Page 3

Table of Contents
1. Introduction
1.1 EXO1 Sonde Overview
1.2 EXO2 Sonde Overview
1.3 EXO Handheld Overview
1.4 EXO Sensors Overview and Specications
1.5 Conductivity/Temperature
1.6 Depth and Level
1.7 Dissolved Oxygen
1.8 fDOM
1.9 pH and ORP
1.10 Total Algae (Chlorophyll and Blue-green Algae)
1.11 Turbidity
2. Operation
2.1 Install Batteries
2.2 Install/Remove Sensors
2.3 Install/Remove Sensor Guard or Calibration Cup
2.4 Sonde States and LED Descriptions
2.5 Awake Sonde, Activate Bluetooth
Attach Sonde to Handheld
2.6 Field Cable
2.7 Bluetooth Wireless Communication
2.8 Install KOR Soware
Connect Sonde
2.9 USB
2.10 Bluetooth Link to PC
2.11 Data Collection Platform
2.12 Flow Cell
3. Handheld
3.1 Install Batteries
3.2 Power On/O Handheld
Attach Handheld to Sonde
3.3 Field Cable
3.4 Bluetooth Wireless Communication
Spot Sampling
3.5 View Live Data
3.6 Record Spot Sampling Data
3.7 Upload Data
3.8 GPS
4. KOR Software
4.1 Introduction to Navigation
4.2 Run Menu
4.3 Calibrate Menu
4.4 Deploy Menu
4.5 Sites Menu
4.6 Data Menu
4.7 Options Menu
4.8 Connections Menu
4.9 Help Menu
4.10 Data Files & File Locations
4.11 SDI-12
pg | 3
Page 4

5. Calibration
5.1 Introduction to Basic Procedure
5.2 Calibrating Conductivity/Temperature
5.3 Calibrating Dissolved Oxygen
5.4 Calibrating Depth
5.5 Calibrating pH
5.6 Calibrating ORP
5.7 Calibrating Turbidity
5.8 Calibrating Total Algae (Chlorophyll and Blue-green Algae)
5.9 Calibrating fDOM
5.10 Calibration Standards
5.11 Calibration Record Sheet
6. Maintenance
6.1 Sonde Storage, Short-term and Long-term
6.1 Sonde Maintenance
6.2 Install/Replace Sonde Batteries
6.3 Replace Sonde Bails
6.4 Update Sonde Firmware
6.5 Handheld Maintenance and Storage
6.6 Install/Replace Handheld Batteries
6.7 Update Handheld Firmware & KOR Soware on Handheld
6.8 Depth Sensor Storage and Maintenance
6.9 Standard Optical Sensors Maintenance and Storage
6.10 Conductivity/Temperature Sensor Maintenance and Storage
6.11 Dissolved Oxygen Sensor Storage, Maintenance and Rehydration
6.12 Sensor Cap Replacement
6.13 pH and ORP Sensor Storage, Maintenance and Rehydration
6.14 Sensor Module Replacement
6.15 Wiper Maintenance and Storage
6.16 Field Cable Maintenance and Storage
6.17 Antifouling Equipment Maintenance
Sacricial Anode
6.18 Connectors Maintenance and Storage
6.19 Flow Cell Maintenance
pg | 4
7. Health & Safety, Warranty, Service
7.1 Chemicals
Conductivity Solutions
pH Solutions
Zobell Solution
Turbidity Standard
Ultraviolet Light (fDOM Sensor)
7.2 Radio Frequency
7.3 Declarations of Conformity
7.4 Instrument Warranty
7.5 Instrument Cleaning & Packing Instructions
7.6 Recycling
Page 5
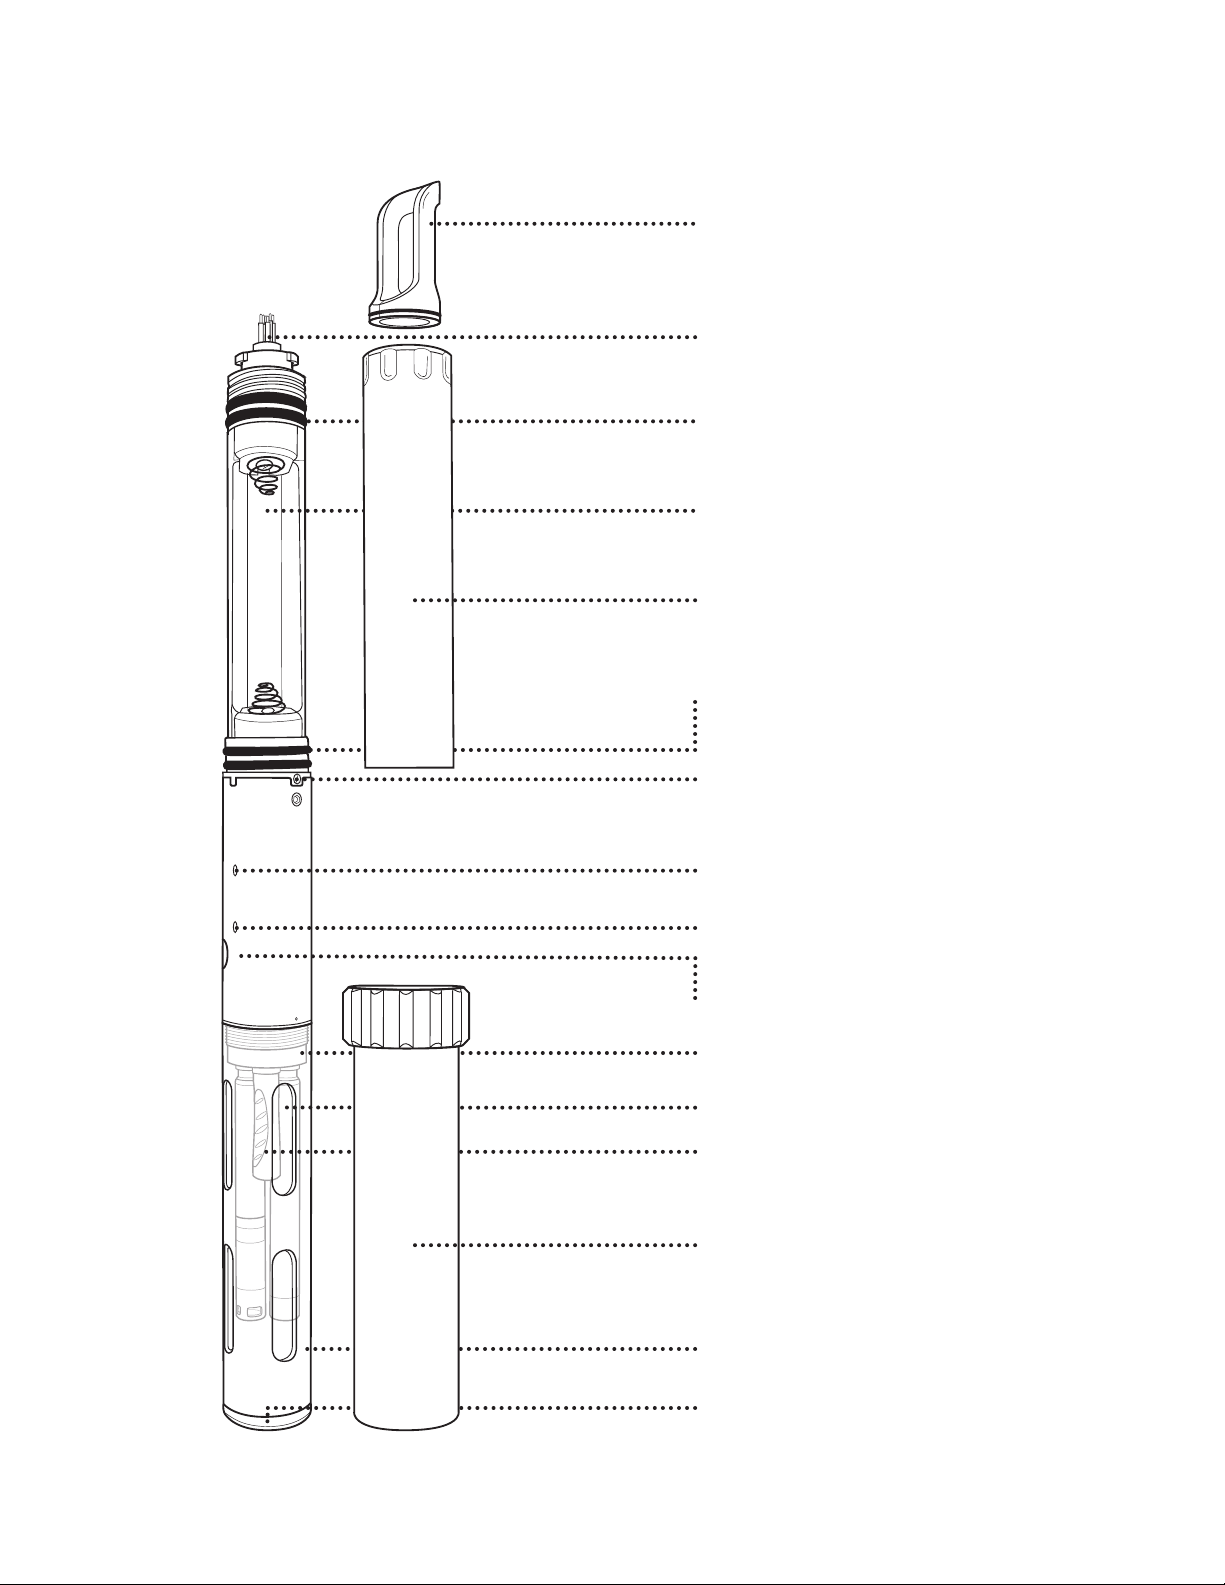
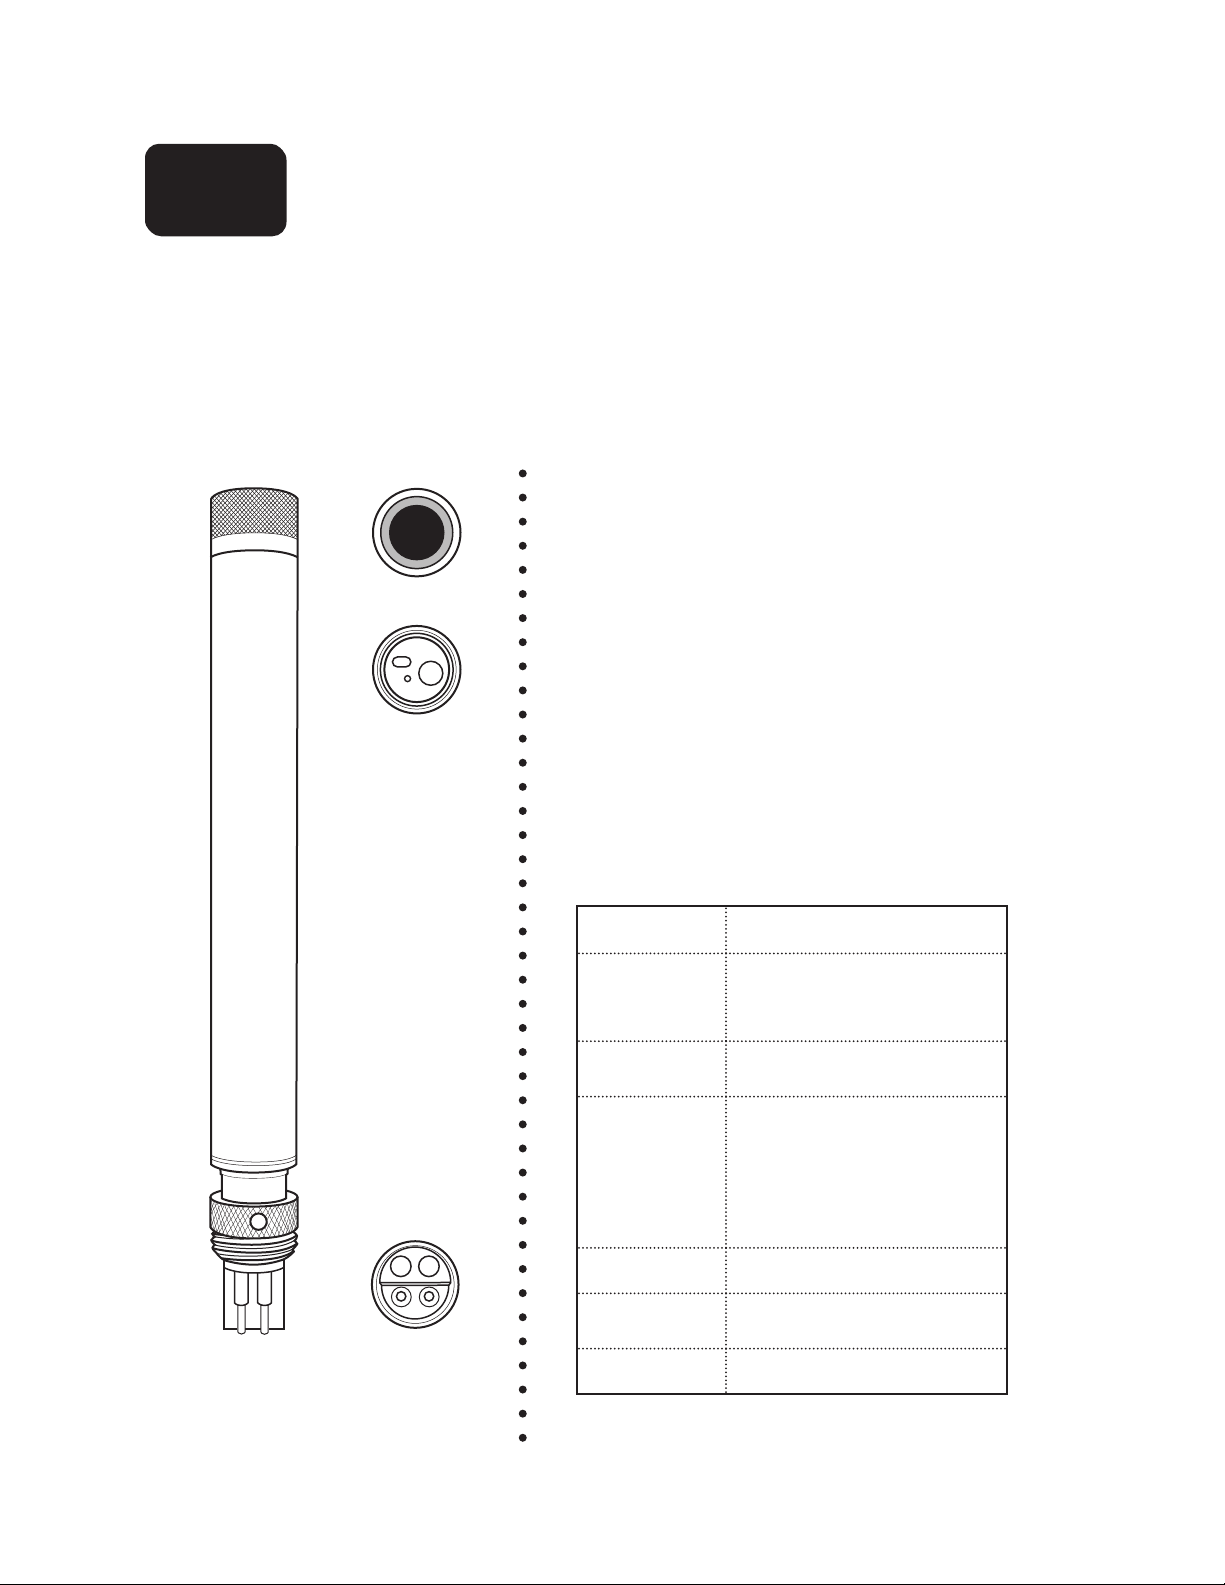
2.9
EXO 1 Sonde
1.1
Overview
e EXO1 sonde is a multiparameter instrument that collects water quality data. e sonde collects the
data with up to four user-replaceable sensors and an integral pressure transducer. Each sensor measures its
parameter via a variety of electrochemical, optical, or physical detection methods. Each port accepts any EXO
sensor and automatically recognizes its type. Depending on user-dened settings, the EXO1 will collect data
and store it onboard the sonde, transfer the data to a data collection platform (DCP), or relay it directly to
a user’s PC or EXO Handheld.
Users communicate with the sonde via a eld cable to an
EXO Handheld, Bluetooth® wireless connection to a PC or
EXO Handheld, or a USB connection (via communications
adapter) to a PC.
Specifications
Operating
Environment
Depth Rating
Medium
Material
Internal Logging
Memory Capacity
250 meters, 820 feet
Water
®
Xenoy
titanium, copper-nickel
alloy, 316 stainless steel
512 MB
, Lexan® , bronze,
Universal Sensor Ports
Software
Communications
Sonde
Adapters
Power
External
Internal
Temperature
Operating
Storage
Battery Life
Dimensions
Diameter
Length
Weight
Kor Interface Software
Bluetooth, Field Cable,
USB, RS-485;
USB, SDI -12/RS -232
9-16 VDC
2 D - size batteries
-5 to 50°C
+
-20 to
90 days typically
(see pg 78)
4.70 cm,1.85 in
64.77 cm, 25.50 in
1.65 kg, 3.63 lb
80°C
pg | 5
Page 6
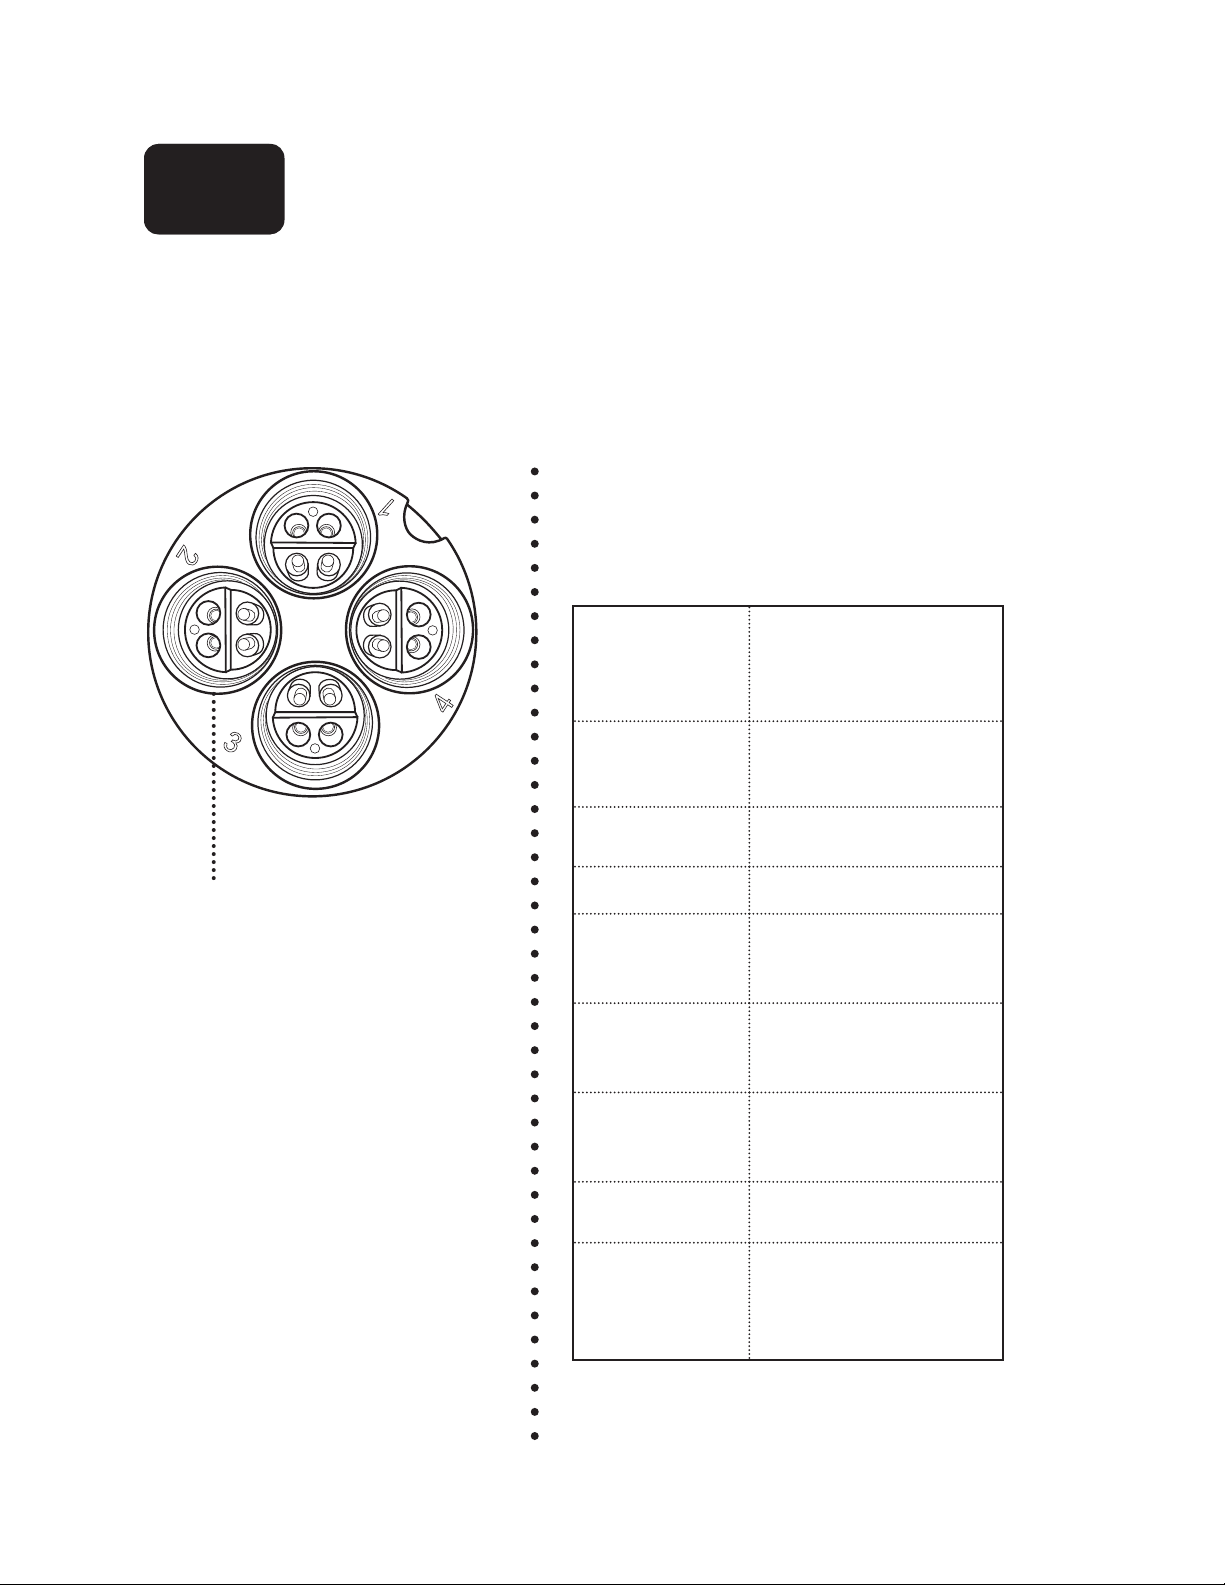
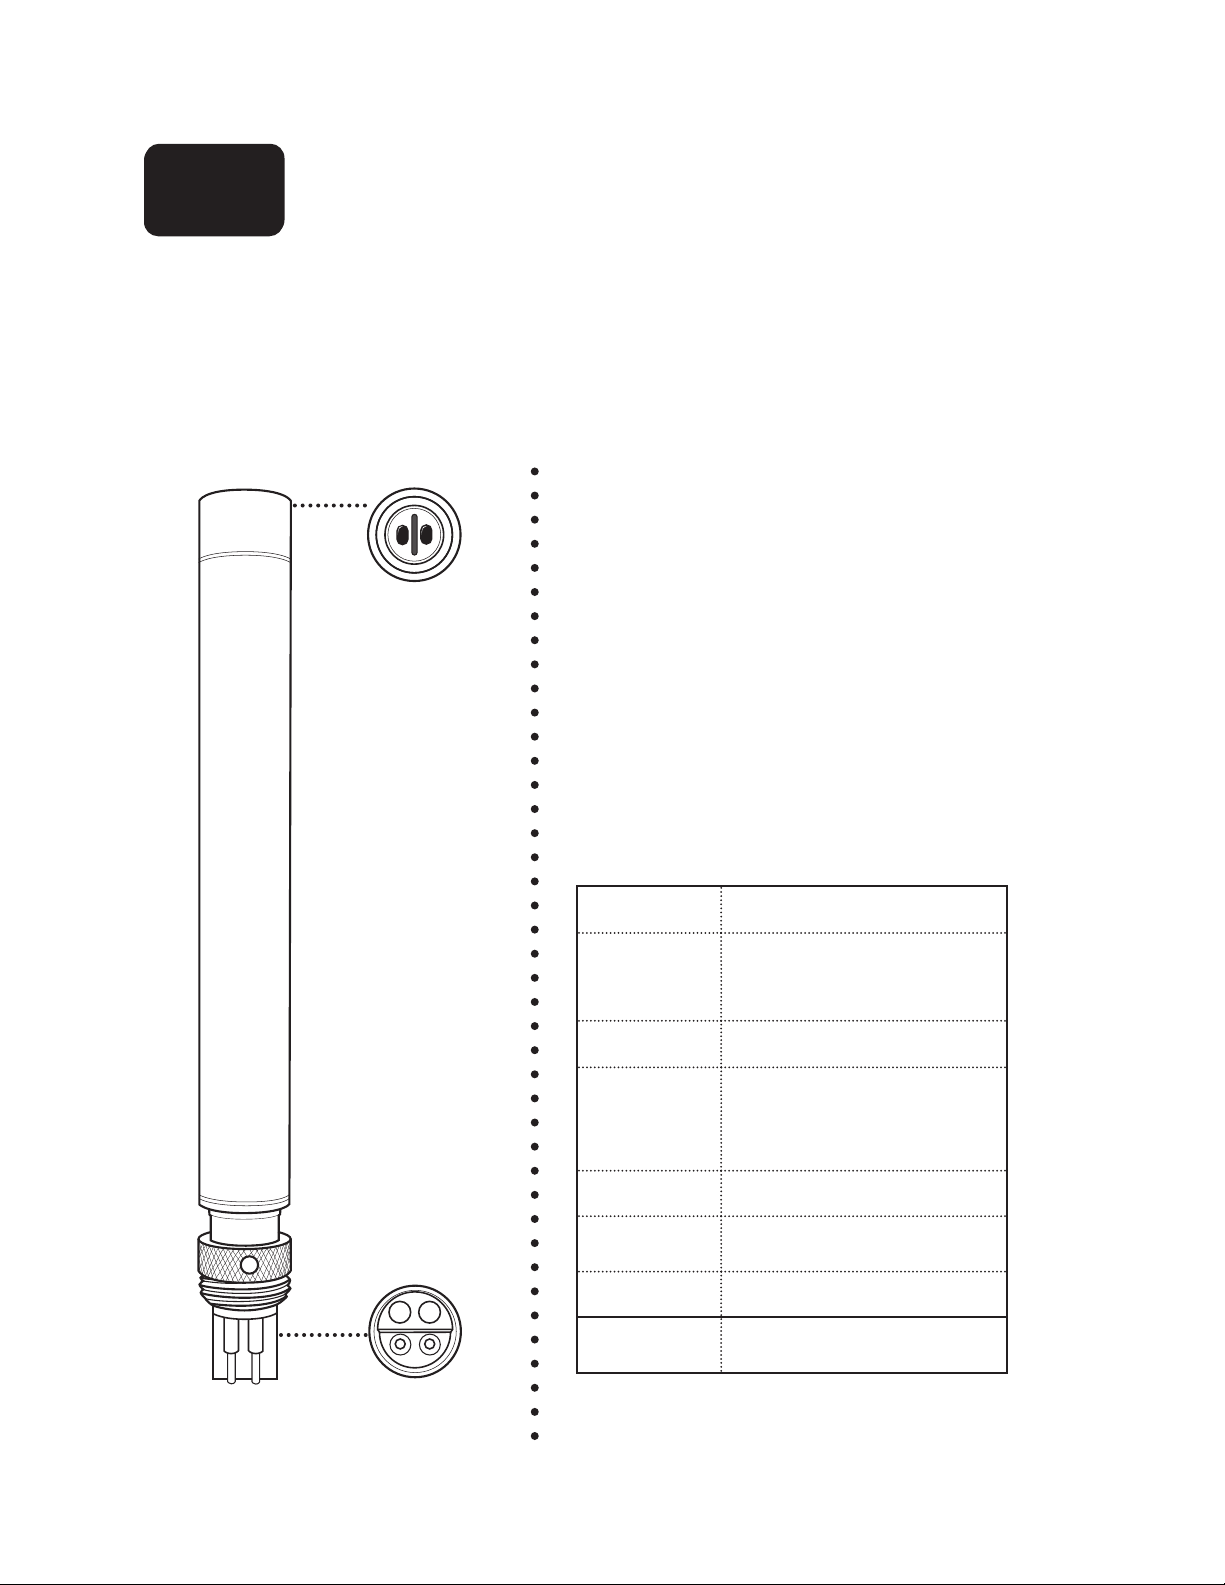
EXO1 Sonde
599501
Removable Bail
599473
6-Pin Cable Connector
Upper Battery
Compartment Seal
O-rings 599680
Battery Compartment
Battery Cover
Lower Battery
Compartment Seal
Pressure Transducer
Opening
Red LED Indicator
– Sonde
Status
Blue LED Indicator – Bluetooth
On/Off Magnetic Switch for
Power and Bluetooth
Bulkhead
Sensor
Port Plug
599475
Calibration Cup
599289
Sensor Guard
599333, 599563
pg | 6
Guard Weight
599471, 599365
Page 7
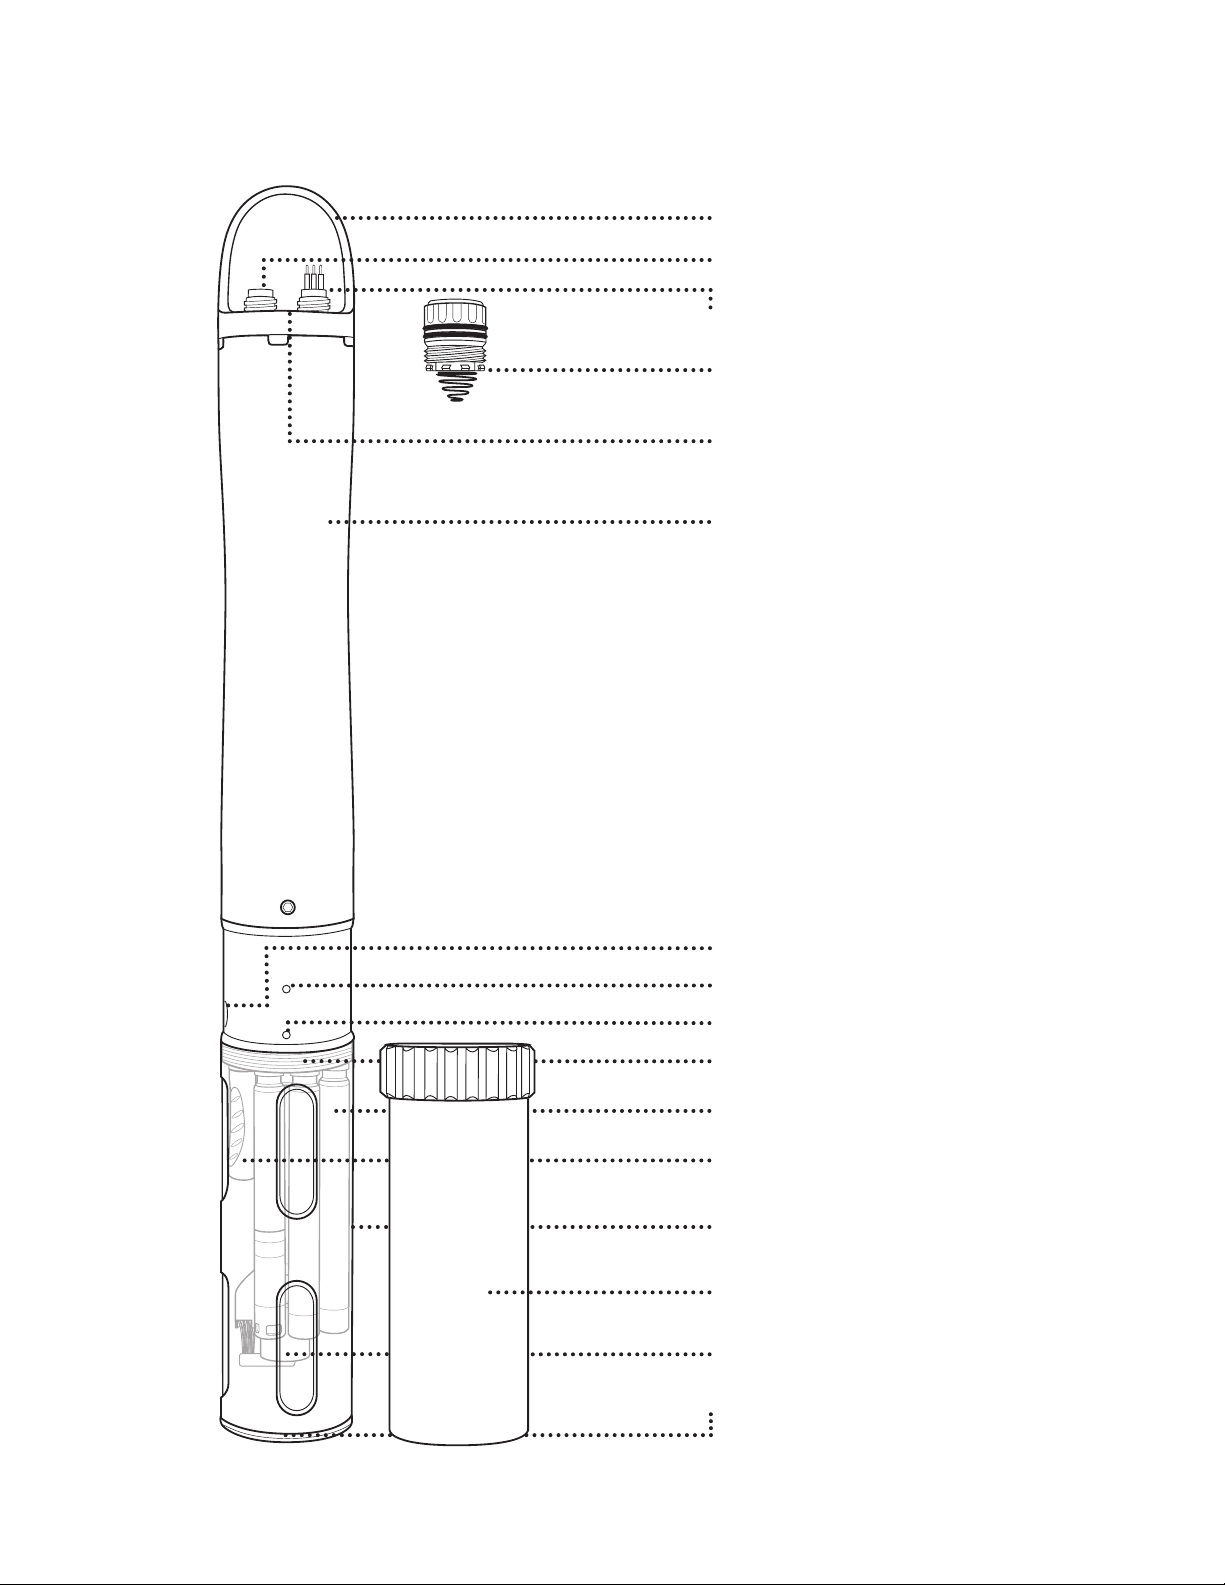
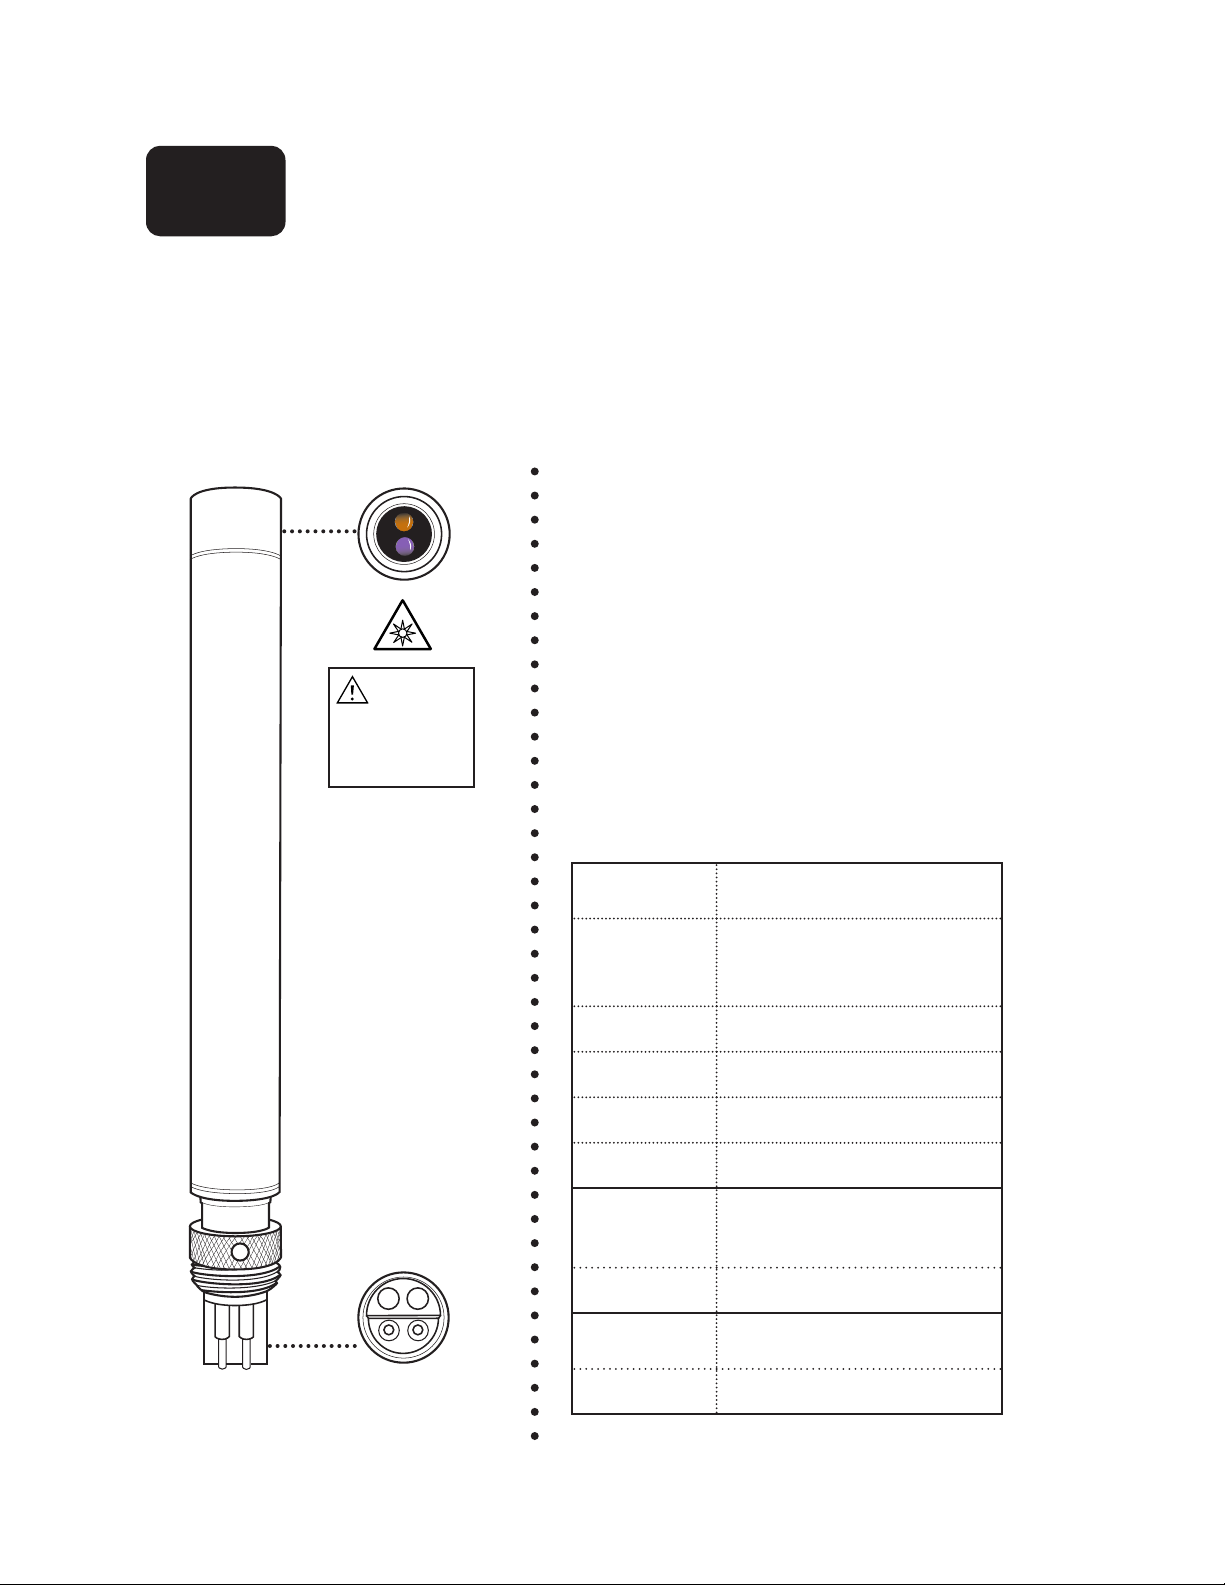
2.9
EXO2 Sonde
1.2
Overview
e EXO2 sonde is a multiparameter instrument that collects water quality data. e sonde collects the
data with up to six user-replaceable sensors and an integral pressure transducer. Each sensor measures its
parameter via a variety of electrochemical, optical, or physical detection methods. Each port accepts any EXO
sensor and automatically recognizes the type of sensor. Depending on user-dened settings, the EXO2 will
collect data and store it onboard the sonde, transfer the data to a data collection platform (DCP), or relay it
to a user’s PC or EXO Handheld via cable, USB connection, or Bluetooth connection.
In addition to six standard sensor ports, the EXO2 also has a bulkhead port for a central wiper (or an
additional sensor) and an auxiliary port on top of the sonde. is auxiliary port will allow the user to connect
the EXO2 to other EXO sondes.
Users communicate with the sonde via a eld cable to an
EXO Handheld, Bluetooth® wireless connection to a PC or
EXO Handheld, or a USB connection (via communications
adapter) to a PC.
Specifications
Operating
Environment
Pressure Transducer
Openings
Depth Rating
Medium
Material
Internal Logging
Memory Capacity
Software
250 meters, 820 feet
Water
Xenoy, Lexan, bronze,
titanium, copper-nickel
alloy, 316 stainless steel
512 MB
Kor Interface Software
Wiper/Sensor Port
Universal Sensor Ports
Communications
Sonde
Adapters
Power
External
Internal
Temperature
Operating
Storage
Battery Life
Dimensions
Diameter
Length
Weight
Bluetooth, Field Cable,
USB, RS-485;
USB, SDI -12/RS -232
9-16 VDC
4 D - size batteries
+
-5 to
-20 to
90 days typically
(see pg 80)
7.62 cm, 3.00 in
71.1 cm, 28.00 in
2.65 kg, 5.83 lb
50°C
+
80°C
pg | 7
Page 8
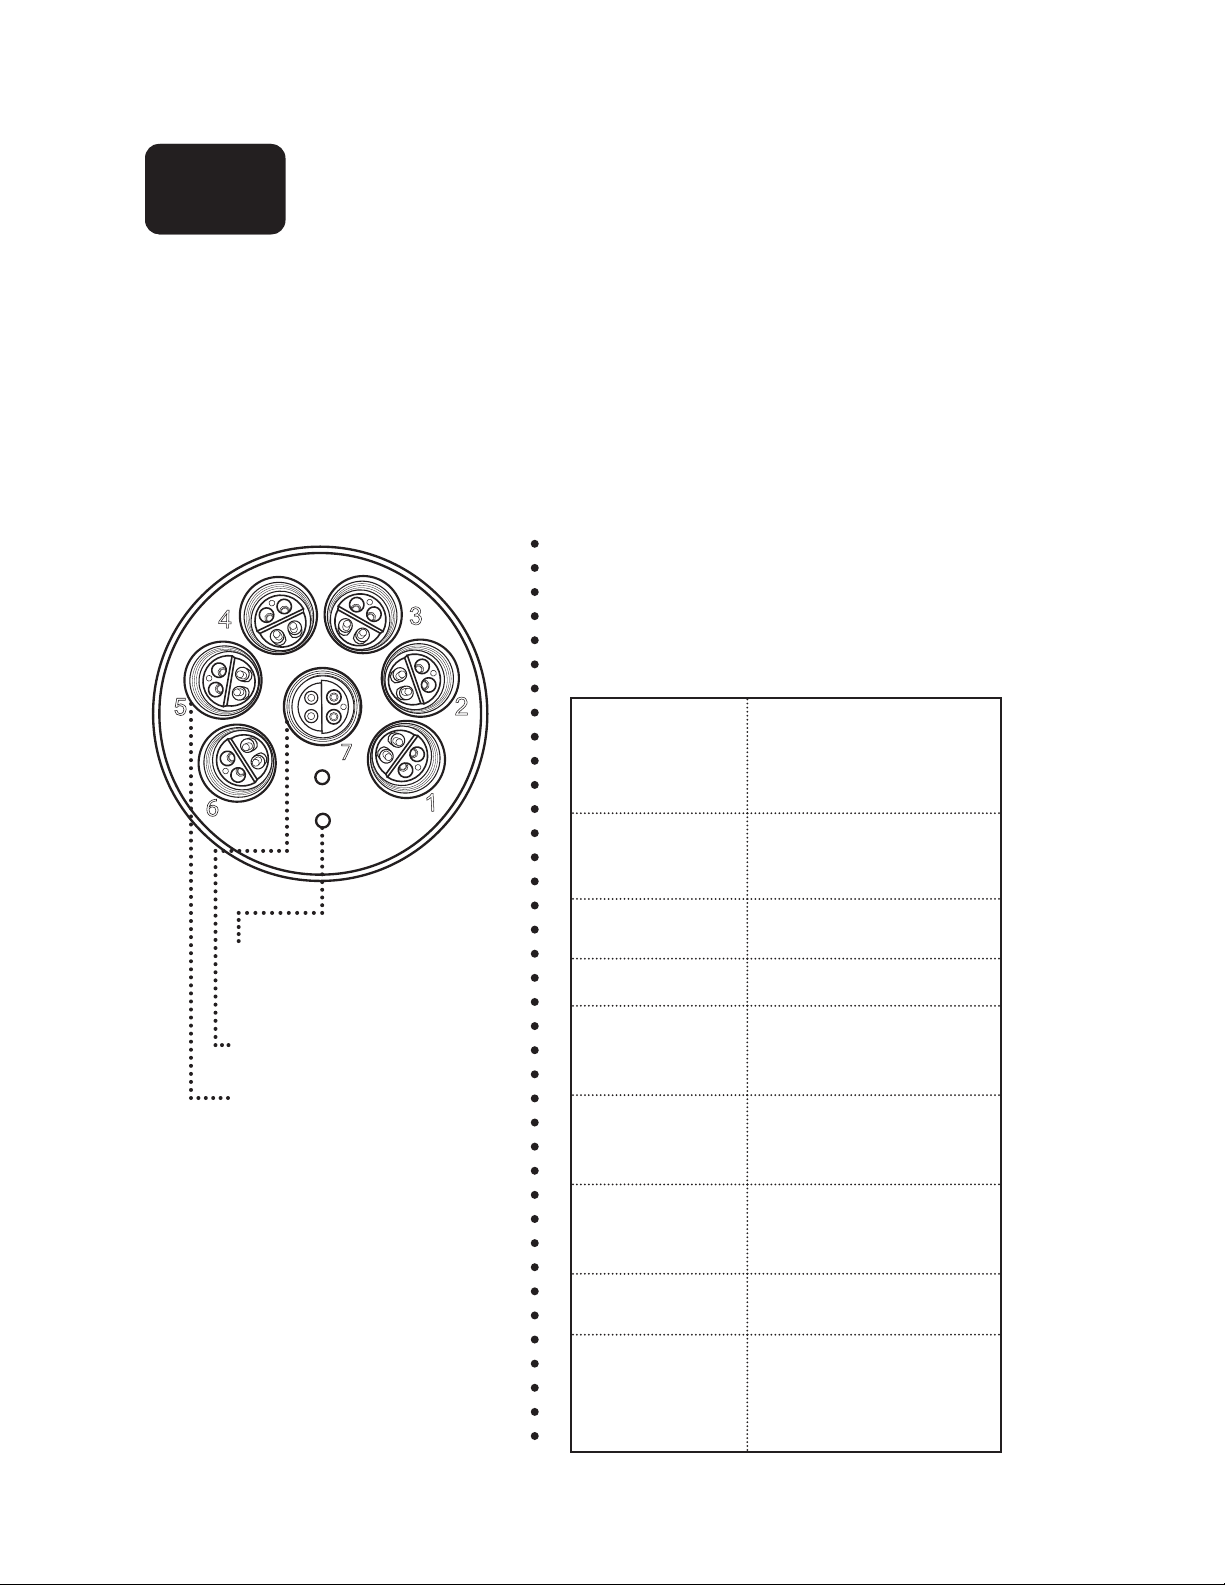
EXO2 Sonde
599502
Removable Bail
599474
Auxiliary Port
6-Pin Cable Connector
Battery Cap/Pressure Relief Valve
O-rings 599681
Battery Compartment Opening
Battery Compartment
pg | 8
On/Off Magnetic Switch for
Power and Bluetooth
Red LED Indicator
– Sonde
Status
Blue LED Indicator – Bluetooth
Bulkhead
Sensor
Port Plug
599475
Sensor Guard
599334, 599564
Calibration Cup
599316
Central Wiper
599549
Guard Weight
599472, 599366
Page 9
2.9
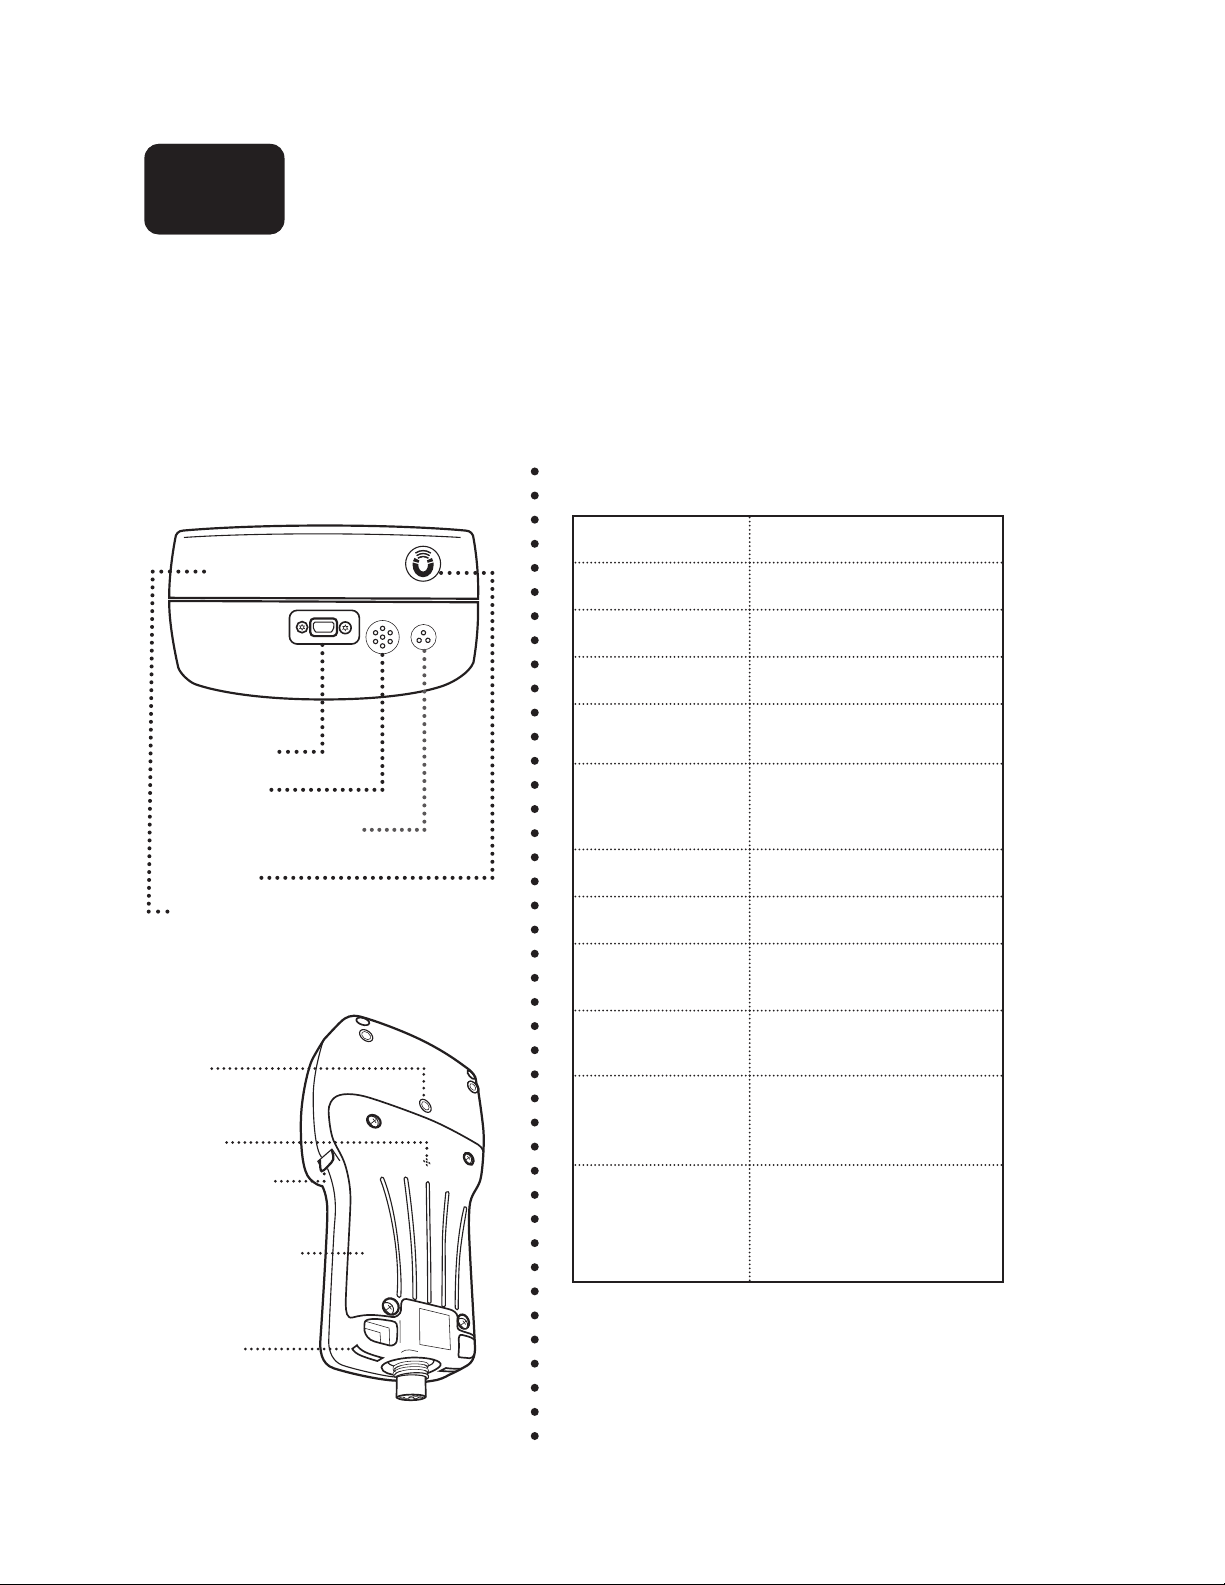
EXO Handheld
1.3
Overview
e EXO Handheld (HH) is a rugged, microcomputer-based instrument that allows the user to display sonde
readings, congure sondes, store and retrieve data, and transfer data from sondes to a computer. Equipped with
GPS, barometer, and custom operating system, the Handheld communicates via Bluetooth wireless technology,
eld cable, or USB connector. e unit utilizes an adjustable backlit screen for easy day or night viewing. Preinstalled KOR soware facilitates all user interaction and provides powerful control over data collection.
Top View
Specifications
US B Port
Speaker
Microphone is for future
functionality; not active yet
Magnet
GPS Antenna
Tripod Mount
(1)
Barometer
Vent
Handstrap
Mount
Battery Cover
(internal)
Back View
Barometer
GPS
Microphone
Audio Speaker
Operating
System
Material
Memory
Software
Communications
Power
Internal
Temperature
Operating
Storage
Dimensions
Width
Length
Weight w. batt.
Yes
Yes
Yes
Yes
Windows CE 5.0
Polymer,
rated to IP-67 in factory
tests
2 GB
Kor Interface Software
Bluetooth, Field Cable,
USB
4 C - size alkaline batteries
+
-5 to
-20 to
11.9 cm, 4.7 in
22.9 cm, 9.0 in
0.91 kg, 2.1 lb
50°C
+
80°C
Handstrap
Mount
pg | 9
Page 10
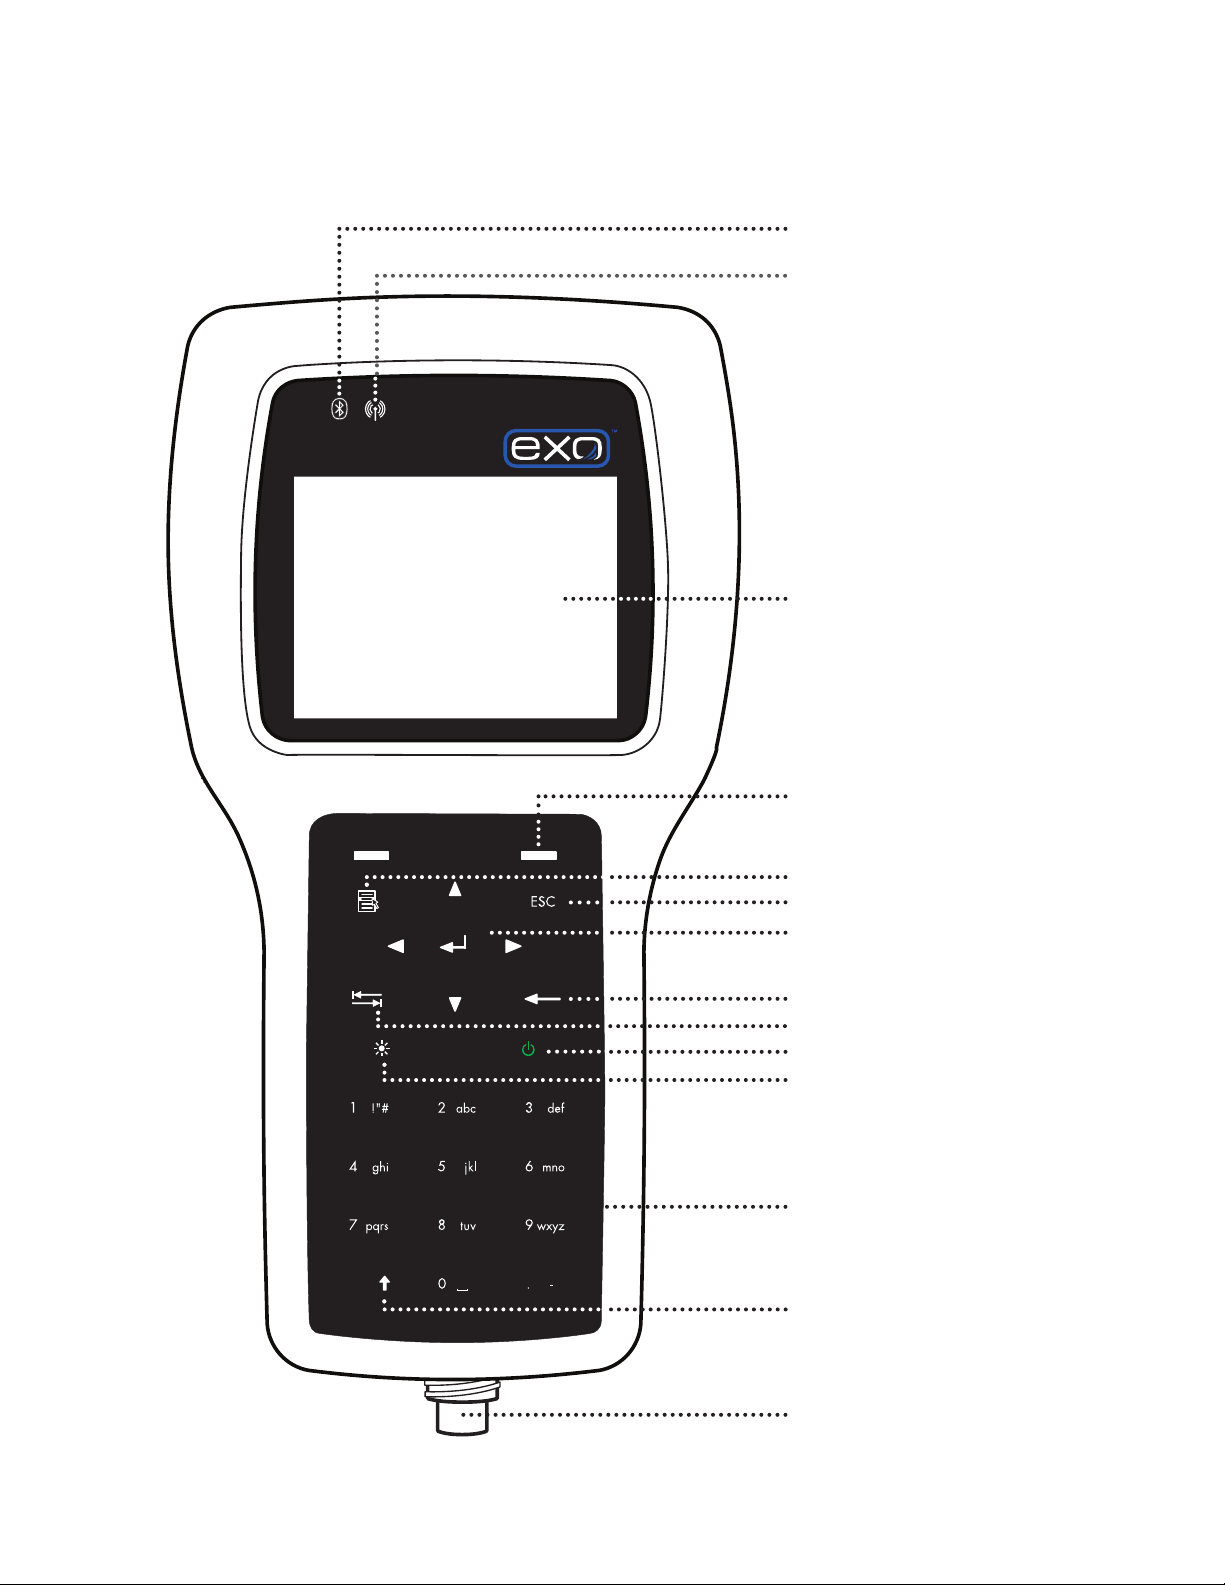
EXO Handheld
599150
Bluetooth Indicator
Wi-Fi Indicator is for future
functionality; not active yet
Daylight-viewable
LCD
Soft Keys (2)
Menu
Escape
Navigation Arrows (4)
& Return
Backspace
Tab
Power
Brightness
Alphanumeric
Keypad
Shift
pg | 10
Cable Connector
Page 11

EXO Sensors
1.4
Overview
e EXO product line includes nine sensors that detect a variety of physical, chemical, and biological
properties of natural water. EXO sensors are designed to collect highly accurate data under ever-changing
environmental conditions.
Data Filtering
All EXO sensors share some common embedded soware, including the ltering of real-time data. Sensors
acquire environmental data at a constant rate, and use this stream of data as the input to the ltering algorithm
that produces results seen by the user. EXO sondes collect data from the EXO sensors and are able to output
data at rates up to 4 Hz. e EXO sensor data ltering process consists of four components:
Basic Rolling Filter
e lter is fundamentally a rolling or window average of past acquired inputs to the lter, such that as a new
data value is added to the summation, the oldest data value is removed, and the total summation is divided
by the total number of data values. It is a simple average, just rolling or moving in time.
Adaptive Filtering
e drawback to a basic rolling lter is that response time to an impulse event is delayed, and the more entries
in the average summation, the longer the delay for the result to converge on the true value. To correct this,
the lter algorithm monitors the new data arriving and compares it to the current averaged result, looking
for indication of an impulse event. When new data deviates from the average by more than a predetermined
tolerance, the number of data entries within the rolling average is reduced to a minimum count and the
remaining values are ushed with the new data. e result is a snap to the new value, entirely eliminating
the inherent delay caused by the rolling average.
Outlier Rejection
Every time a newly acquired data value is added, the rolling average entries are scanned for outlier data.
Although such data has already been determined to fall within the tolerances dened above, the remaining
worst oenders are removed from the rolling average calculation. is outlier rejection allows for smoother
continuous data results.
Calibration Stability
During calibration, the ltering is active as described, plus an additional feature works to provide stability
feedback to the user. When the user attempts to calibrate a sensor, the sudden changes in environment
are perceived as impulses or plunge events and the ltering reacts accordingly. e results immediately
show the value of the solution, and aer a few moments, the lter incrementally engages fully and supplies
the smoothest data. However, as the sensor and the calibration solution work towards equilibrium, the
measurement may slowly dri. e sensor will monitor the results from the lter and determine if the
measurement is stable. It watches the results and calculates a slope from each and every result to the next.
Once the slope settles and is consistently at for approximately 30 seconds, the sensor is considered stable.
KOR is then notied and calibration can continue.
pg | 11
Page 12

Sensor Response Times
Response times for EXO sensors are based on laboratory testing. Actual response times in the eld may vary
depending on application.
Sensor Accuracy Specifications
To maintain accuracy specications for EXO sensor, we recommend that users calibrate sensors in the lab in
standards with temperatures as close to the ambient temperature of the eld water as possible.
pg | 12
Page 13

2.9
Conductivity/Temperature
1.5
Sensor Overview
e EXO combination conductivity and temperature sensor should be installed in a sonde in nearly all sonde
applications. Not only will this sensor provide the most accurate and fastest response temperature data, but
it will also provide the best data for the use in temperature compensation for the other EXO probes. e
conductivity data is used to calculate salinity, specic conductance, and total dissolved solids, and compensate
for changes in density of water (as a function of temperature and salinity) in depth calculations if a depth
sensor is installed.
Temperature Thermistor
e temperature sensor uses a highly stable and aged
thermistor with extremely low-dri characteristics. e
Conductivity Cell
Specifications
Conductivity
Default Units
Temperature
Operating
Storage
Range
Accuracy
Response
Resolution
Sensor Type
Temperature
microSiemens/centimeter
-5 to +50°C
-20 to +80°C
0 to 200 mS/cm
0-100 mS/cm: ±0.5% of
reading or 0.001 mS/cm,
whichever is greater;
100-200 mS/cm: ±1% of
reading
T63<2 sec
0.0001 to 0.01 mS/cm
range-dependent
4-electrode nickel cell
(see pg 12)
(continued)
599870
Default Units
Temperature
Operating
Storage
Accuracy
Response
Resolution
Sensor Type
°Celsius
-5 to +50°C
-20 to +80°C
-5 to 35°C: ±0.01°C
35 to 50°C: ±0.05°C
T63<1 sec
0.001°C
Thermistor
pg | 13
Page 14

thermistor’s resistance changes with temperature. e measured resistance is then converted to temperature
using an algorithm. e temperature sensor receives a multi-point NIST traceable wet calibration and the
accuracy specication of 0.01˚C is valid for expected life of the probe. No calibration or maintenance of the
temperature sensor is required, but accuracy checks can be conducted and logged through the KOR interface
soware.
Conductivity Electrodes
e conductivity sensor uses four internal, pure-nickel electrodes to measure solution conductance. Two of
the electrodes are current driven, and two are used to measure the voltage drop. e measured voltage drop is
then converted into a conductance value in milliSiemens (millimhos). To convert this value to a conductivity
value in milliSiemens per cm (mS/cm), the conductance is multiplied by the cell constant that has units of
reciprocal cm (cm-1). e cell constant for the conductivity cell is approximately 5.5/cm ±10%. For most
applications, the cell constant is automatically determined (or conrmed) with each deployment of the system
when the calibration procedure is followed.
Temperature Compensation
EXO sensors have internal thermistors for quality assurance purposes. However, this internal temperature
is not logged or displayed. Turbidity uses the internal thermistor for temperature compensation, while all
other EXO sensors reference the C/T probe for temperature compensation. To display and log temperature,
a C/T probe must be installed in an EXO sonde.
pg | 14
Page 15
Depth
1.6
Sensor Overview
EXO measures depth of water with a non-vented strain gauge. A dierential strain gauge transducer
measures pressure with one side of the transducer exposed to the water and the other side exposed to a
vacuum. We calculate depth from the pressure exerted by the water column minus atmospheric pressure.
Factors inuencing depth measurement include barometric pressure, waterdensity, and temperature.
Calibration in the atmosphere “zeros” the sensorwith respect to the local barometric pressure. A change in
barometricpressure will result in a zero shi unless the transducer is recalibrated to the new pressure.
EXO sondes have intake openings to allow water to act on the strain gauge. e EXO1 intake is located in
the yellow section between the battery compartment and
label of the sonde. e EXO2 intake openings are two small
holes on the face of the sonde bulkhead.
Location of Depth Sensor
Depth sensors are not on center. When deploying the sonde
vertically, take care to ensure the sonde is redeployed in
same position. Oen a marker pin inside a PVC pipe is
used. In horizontal deployments, take care to ensure the
redeployments are always in the same orientation. is is
especially important for the EXO2 sonde because the depth
EXO 2 Depth Intake
EXO 1 Depth Intake
sensor is o-axis.
(continued)
Specifications
Depth Sensor Location relative
to other water quality sensors
(see EXO sonde label)
Depth Sensor Location
27.2 cm to WQ Sensors
Units
Temperature
Operating
Storage
Range
Accuracy
Response
Resolution
Sensor Type
PSI, Depth (m, ft, bar)
-5 to +50°C
-20 to +80°C
Shallow: 0 to 33 ft (10 m)
Medium: 0 to 328 ft (100 m)
Deep: 0 to 820 ft (250 m)
Shallow: ±0.04% FS (±0.013
ft or ±0.004 m)
Medium: ±0.04% FS (±0.13 ft
or ±0.04 m)
Deep: ±0.04% FS (±0.33 ft or
±0.10 m)
T63<2 sec
0.001 ft (0.001 m)
Stainless steel strain gauge
(see pg 12)
pg | 15
Page 16
Location of Depth Sensor (continued)
To assist with consistent horizontal orientation, the EXO2 sonde has
an indentation at the top of the sonde for a marker or positioning
pin.
e sonde should be installed with at least 1 cm of water above the
intake ports.
If a conductivity sensor is installed, the depth will be compensated
automatically for changes in the density of water as temperature
and salinity change.
Depth Configuration
EXO sondes must be ordered with a specic depth option: 0-10 m,
0-100 m, 0-250 m, or no depth. Once the depth selection is made,
the sonde’s depth sensor cannot be changed.
pg | 16
Page 17
2.9
Dissolved Oxygen
1.7
Sensor Overview
e principle of operation of the EXO optical Dissolved Oxygen sensor is based on the well-documented
concept that dissolved oxygen quenches both the intensity and the lifetime of the luminescence associated
with a carefully chosen chemical dye. e EXO DO sensor operates by shining a blue light of the proper
wavelength on this luminescent dye which is immobilized in a matrix and formed into a disk. e blue
light causes the immobilized dye to luminesce and the lifetime of this dye luminescence is measured via a
photodiode in the probe. To increase the accuracy and stability of the technique, the dye is also irradiated with
red light during part of the measurement cycle to act as a reference in the determination of the luminescence
lifetime.
When there is no oxygen present, the lifetime of the signal
is maximal; as oxygen is introduced to the membrane
surface of the sensor, the lifetime becomes shorter. us,
the lifetime of the luminescence is inversely proportional
Sensor Cap
Sensor without
Sensor Cap
to the amount of oxygen present and the relationship
between the oxygen pressure outside the sensor and the
lifetime can be quantied by the Stern-Volmer equation.
For most lifetime-based optical DO sensors, this SternVolmer relationship
((Tzero/T) – 1) versus O2 pressure
is not strictly linear (particularly at higher oxygen
pressures) and the data must be processed using analysis by
(continued)
599100,
599110
Specifications
Units
Temperature
Operating
Storage
Range
Accuracy
Response
Resolution
Sensor Type
% Saturation, mg/L
-5 to +50°C
-20 to +80°C
0 to 500% air sat.
0 to 50 mg/L
0-200%: ±1% reading or 1%
air sat., whichever is greater;
200-500%: ±5% reading
0-20 mg/L: ±1% of reading or
0.1 mg/L;
20-50 mg/L: ±5% reading
T63<5 sec
0.1% air sat.
0.01 mg/L
Optical, luminescence lifetime
(see pg 12)
pg | 17
Page 18

polynomial non-linear regression. Fortunately, the non-linearity does not change signicantly with time
so that, as long as each sensor is characterized with regard to its response to changing oxygen pressure, the
curvature in the relationship does not aect the ability of the sensor to accurately measure oxygen for an
extended period of time.
pg | 18
Page 19
fDOM
1.8
Sensor Overview
e EXO fDOM (Fluorescent Dissolved Organic Matter) sensor is a uorescence sensor which detects the
uorescent component of DOM (Dissolved Organic Matter) when exposed to near-ultraviolet (UV) light.
Colored Dissolved Organic Matter
Users might wish to quantify colored dissolved oxygen matter (CDOM) in order to determine the amount of
light which is absorbed by stained water and thus is not available for the photosynthesis process carried out
by subsurface aquatic plants and algae. In most cases, fDOM can be used as a surrogate for CDOM.
Quinine Sulfate
A surrogate for fDOM is Quinine Sulfate, which, in acid
solution, uoresces similarly to dissolved organic matter.
e units of fDOM are quinine sulfate units (QSUs) where
1 QSU = 1 ppb quinine sulfate and thus quinine sulfate is
really a double surrogate for the desired CDOM parameter.
e EXO fDOM sensor shows virtually perfect linearity
2
=1.0000) on serial dilution of a colorless solution of
(R
WARNING
UV LIGHT
Do not look
directly at light.
quinine sulfate. However, on serial dilution of stained water
eld samples, the sensor shows some underlinearity. e
point of underlinearity in field samples varies and is
(continued)
599104
Specifications
Units
Temperature
Operating
Storage
Range
Response
Resolution
Sensor Type
Linearity
Detection Limit
Optics:
Excitation
Emission
Quinine Sulfate equivalents
(QSE), ppb
-5 to +50°C
-20 to +80°C
0 to 300 ppb QSE
T63<2 sec
0.01 ppb QSE
Optical, fluorescence
2
>0.999 for serial dilution
R
of 300 ppb Quinine Sulfate
solution
0.07 ppb QSE
365±5 nm
480±40 nm
(see pg 12)
pg | 19
Page 20

aected by the UV absorbance of the DOM in the water. Testing shows that underlinearity can occur at fDOM
concentrations as low as 50 QSU. is factor means that a eld sample with an fDOM reading of 140 QSU will
contain signicantly more than double the fDOM of a sample that reads 70 QSU. is eect—good linearity
in colorless quinine sulfate solution, but underlinearity in stained eld samples—is also exhibited by other
commercially available fDOM sensors and thus the performance of the EXO sensor is likely to be equivalent
or better than the competition while providing the advantages of easy integration into a multiparameter
package and automatic mechanical cleaning when used in monitoring studies with an EXO2 sonde.
pg | 20
Page 21
2.9
pH and ORP
1.9
Sensor Overview
Users can choose between a pH sensor or a combination pH/ORP sensor to measure these parameters. pH
describes the acid and base characteristics of water. A pH of 7.0 is neutral; values below 7 are acidic; values
above 7 are alkaline. ORP designates the oxidizing-reducing potential of a water sample and is useful for
water which contains a high concentration of redox-active species, such as the salts of many metals and strong
oxidizing (chlorine) and reducing (sulte ion) agents. However, ORP is a non-specic measurement—the
measured potential is reective of a combination of the eects of all the dissolved species in the medium.
Users should be careful not to overinterpret ORP data unless specic information about the site is known.
(continued)
Specifications
pH
Units
Temperature
Operating
Storage
Range
Accuracy
Response
Resolution
Sensor Type
ORP
Units
Temperature
Operating
Storage
pH units
-5 to +50°C
0 to 60°C
0 to 14 units
±0.1 pH units within ±10°C
of calibration temperature;
±0.2 pH units for entire temp
range
T63<3 sec
0.01 units
Glass combination electrode
millivolts
-5 to +50°C
0 to 60°C
(see pg 12)
EXOISE1, EXOISE2,
EXOISE5, EXOISE6,
599795, 599797
Range
Accuracy
Response
Resolution
Sensor Type
-999 to +999 mV
±20 mV in Redox standard
solution
T63<5 sec
0.1 mV
Platinum button
(see pg 12)
pg | 21
Page 22

Replaceable Sensor Module
e EXO pH and pH/ORP sensors have a unique design that incorporates a user-replaceable sensor tip
(module) and a reusable sensor base that houses the processing electronics, memory, and wet-mate connector.
is allows users to reduce the costs associated with pH and pH/ORP sensors by only replacing the relatively
inexpensive module periodically and not the more costly base.
e connection of the module to the sensor base is designed for one connection only and the procedure must
be conducted in an indoor and dry environment. Once installed the module cannot be removed until you
are prepared to replace it with a new module. See section 6.14 for detailed instructions.
Users must order either a pH or pH/ORP sensor. Once ordered the sensor is only compatible with like-model
sensor modules. For example, if a pH sensor is purchased initially, then the user must order a replaceable pH
sensor module in the future; it cannot be replaced with a pH/ORP module.
Electrodes
EXO measures pH with two electrodes combined in the same probe: one for hydrogen ions and one as a
reference. e sensor is a glass bulb lled with a solution of stable pH (usually 7) and the inside of the glass
surface experiences constant binding of H+ ions. e outside of the bulb is exposed to the sample, where the
concentration of hydrogen ions varies. e resulting dierential creates a potential read by the meter versus
the stable potential of the reference.
e ORP of the media is measured by the dierence in potential between an electrode which is relatively
chemically inert and a reference electrode. e ORP sensor consists of a platinum button found on the tip
of the probe. e potential associated with this metal is read versus the Ag/AgCl reference electrode of
the combination sensor that utilizes gelled electrolyte. ORP values are presented in millivolts and are not
compensated for temperature.
Amplification
Signal conditioning electronics within the pH sensor improve response and increase stability. Amplication
(buering) in the sensor head is used to eliminate any issue of humidity in the front-end circuitry and reduce
noise. Finally, the EXO pH sensor is insensitive to proximal interference during calibration due to having the
circuit next to the sensor and having a well-shielded pH signal.
pg | 22
Page 23
Total Algae (Chl & BGA-PC)
1.10
Sensor Overview
e EXO total algae sensor is a dual-channel uorescence sensor that generates two independent data sets;
one resulting from a blue excitation beam that directly excites the chlorophyll a molecule, present in all
photosynthetic cells, and a second from an orange excitation beam that excites the phycocyanin accessory
pigment found in blue-green algae (cyanobacteria). is orange excitation triggers a transfer of energy from
the phycocyanin to the central chlorophyll a, where photosynthesis is initiated.
Although blue-green algae contain chlorophyll a, the chlorophyll uorescence signal detected by in situ
uorometers is weaker than in eukaryotic phytoplankton. is results in an underestimate of algae biomass when
using a single-channel chlorophyll sensor when blue-green
algae are present. e EXO total algae sensor generates a more
accurate total biomass estimate of the planktonic autotrophic
a
and
community by exciting chlorophyll
Specifications
Units
Chlorophyll
BGA - PC
Temperature
Operating
Storage
Range
RFU, µg/L Chl
RFU, µg/L PC
-5 to +50°C
-20 to +80°C
Chl: ~0 to 400 µg/L Chl; 0 to
100 RFU
BGA-PC: 0 to 100 µg/L PC;
0 to 100 RFU
phycocyanin.
(continued)
599102
Response
Resolution
Sensor Type
Linearity
Detection
Limit
Optics:
Chl Excitation
PC Excitation
Emission
T63<2 sec
Chl: 0.01 µg/L Chl; 0.01 RFU
BGA-PC: 0.01 µg/L PC;
0.01 RFU
Optical, fluorescence
2
>0.999 for serial dilution
Chl: R
of Rhodamine WT solution from 0
to 400 µg/L Chl equivalents
BGA: R2>0.999 for serial dilution
of Rhodamine WT solution from 0
to 100 µg/L PC equivalents
Chl: 0.09 µg/L Chl
BGA-PC: 0.04 µg/L PC
.
470±15 nm
590±15 nm
685±20 nm
(see pg 12)
pg | 23
Page 24

e sensor generates data in three formats: RAW, RFU, and an estimate of the pigment concentration in μg/L.
e RAW value is a value unaected by user calibrations and provides a range from 0-100, representing the per
cent of full scale that the sensor detects in a sample.
RFU stands for Relative Fluorescence Units and is used to set sensor output relative to a stable secondary
standard, such as Rhodamine WT dye. is allows users to calibrate sensors identically; for example, calibrating
all sensors in a network to read 100 RFU in a concentration of Rhodamine WT dye. e sensors can then be
deployed and generate data that is relative to all other sensors. Once a sensor is retrieved, it can be checked
against that same standard to assess sensor performance, dri, or the potential eects of biofouling.
e μg/L output generates an estimate of pigment concentration. e relationship between μg/L and sensor’s
RAW signal should be developed through following standard operating procedures of sampling the water body
of interest, collecting sensor data from sample, and then extracting the pigment to establish a correlation. e
higher the temporal and spatial resolution of the sampling, the more accurate this estimate will be.
Chlorophyll
e EXO chlorophyll sensor operates on the in vivo uorescence principle with no disruption of the cells
required to obtain either spot readings or long-term data. e EXO sensor has an excellent detection limit as
determined under laboratory conditions and this advantage should be realized in many eld applications.
EXO chlorophyll readings show excellent linearity on serial dilution of a surrogate solution of Rhodamine WT
2
>0.9999) and this should ensure relative accuracy of eld chlorophyll readings, i.e., a chlorophyll reading
(R
of 100 units will represent twice the algal content of water with a chlorophyll reading of 50 units. Also, EXO
chlorophyll readings show very low interference from turbidity, allowing for more accurate determination of
algal content during rainfall events which release both sediment and algae into the water. e EXO chlorophyll
sensor also exhibits very low interference from dissolved organics, increasing data accuracy.
Blue-green Algae
e EXO BGA readings show excellent linearity on serial dilution of a surrogate solution of Rhodamine WT
2
>0.9999) and this should ensure relative accuracy of eld BGA-PC readings, i.e., a BGA-PC reading of 100
(R
units will represent twice the algal content of water with a BGA-PC reading of 50 units. A signicant advantage
of the EXO BGA-PC sensor is that its readings show less interference from turbidity and this will allow for
much more accurate determination of BGA-PC content during rainfall events which release both sediment
and algae into the water.
pg | 24
Page 25
2.9
Turbidity
1.11
Sensor Overview
Turbidity is the indirect measurement of the suspended solid concentration in water and is typically
determined by shining a light beam into the sample solution and then measuring the light that is scattered
o of the particles which are present. e suspended solid concentration is an important water quality factor
and is a fundamental measure of environmental change. e source of the suspended solids varies in nature
(examples include silt, clay, sand, algae, organic matter) but all particles will impact the light transmittance
and result in a turbidity signal.
e EXO Turbidity sensor employs a near-infrared light source and detects scattering at 90 degrees of the
incident light beam. According to ASTM D7315 method,
this type of turbidity sensor has been characterized as a
nephelometric near-IR turbidimeter, non-ratiometric
is method calls for this sensor type to report values in
formazin nephelometric units (FNU). FNU is the default
calibration unit for the EXO sensor but users are able to
change calibration units to nephelometric turbidity units
(NTU), raw sensor signal (RAW), or total suspended solids
(TSS) assuming the user enters the appropriate correlation
data.
e RAW value is a value unaected by user calibrations
and provides a range from 0-100, representing the per cent
of full scale that the sensor detects in a sample.
(continued)
#
.
599101
Specifications
Default Units
Temperature
Operating
Storage
Range
Accuracy
Response
Resolution
Sensor Type
Optics:
Excitation
#
ASTM D7315-07a “Test Method for Determination of
Turbidity Above 1 Turbidity Unit (TU) in Static Mode.”
FNU
-5 to +50°C
-20 to +80°C
0 to 4000 FNU
0-999 FNU: 0.3 FNU or
±2% of reading, whichever is
greater; 1000-4000 FNU: ±5%
of reading
T63<2 sec
0-999 NTU: 0.01 FNU
1000-4000 FNU: 0.1 FNU
Optical, 90° scatter
.
860±15 nm
(see pg 12)
pg | 25
Page 26

While all turbidity sensors will read consistently in formazin, other calibration solutions and eld readings
will vary between dierent models of turbidity sensors. ese dierences are thought to be a result of diering
optical components and geometries and the resulting detection of varying suspended sediment characteristics.
is eect is inherent in the nature of every turbidity sensor, and as a result readings between dierent model
turbidity sensors are likely to show dierent eld values even aer calibration in the same standards.
For long-term, in situ continuous monitoring of turbidity, the EXO2 sonde has a wiper to clean the turbidity
sensor to avoid sensor fouling and maintain accuracy.
pg | 26
Page 27
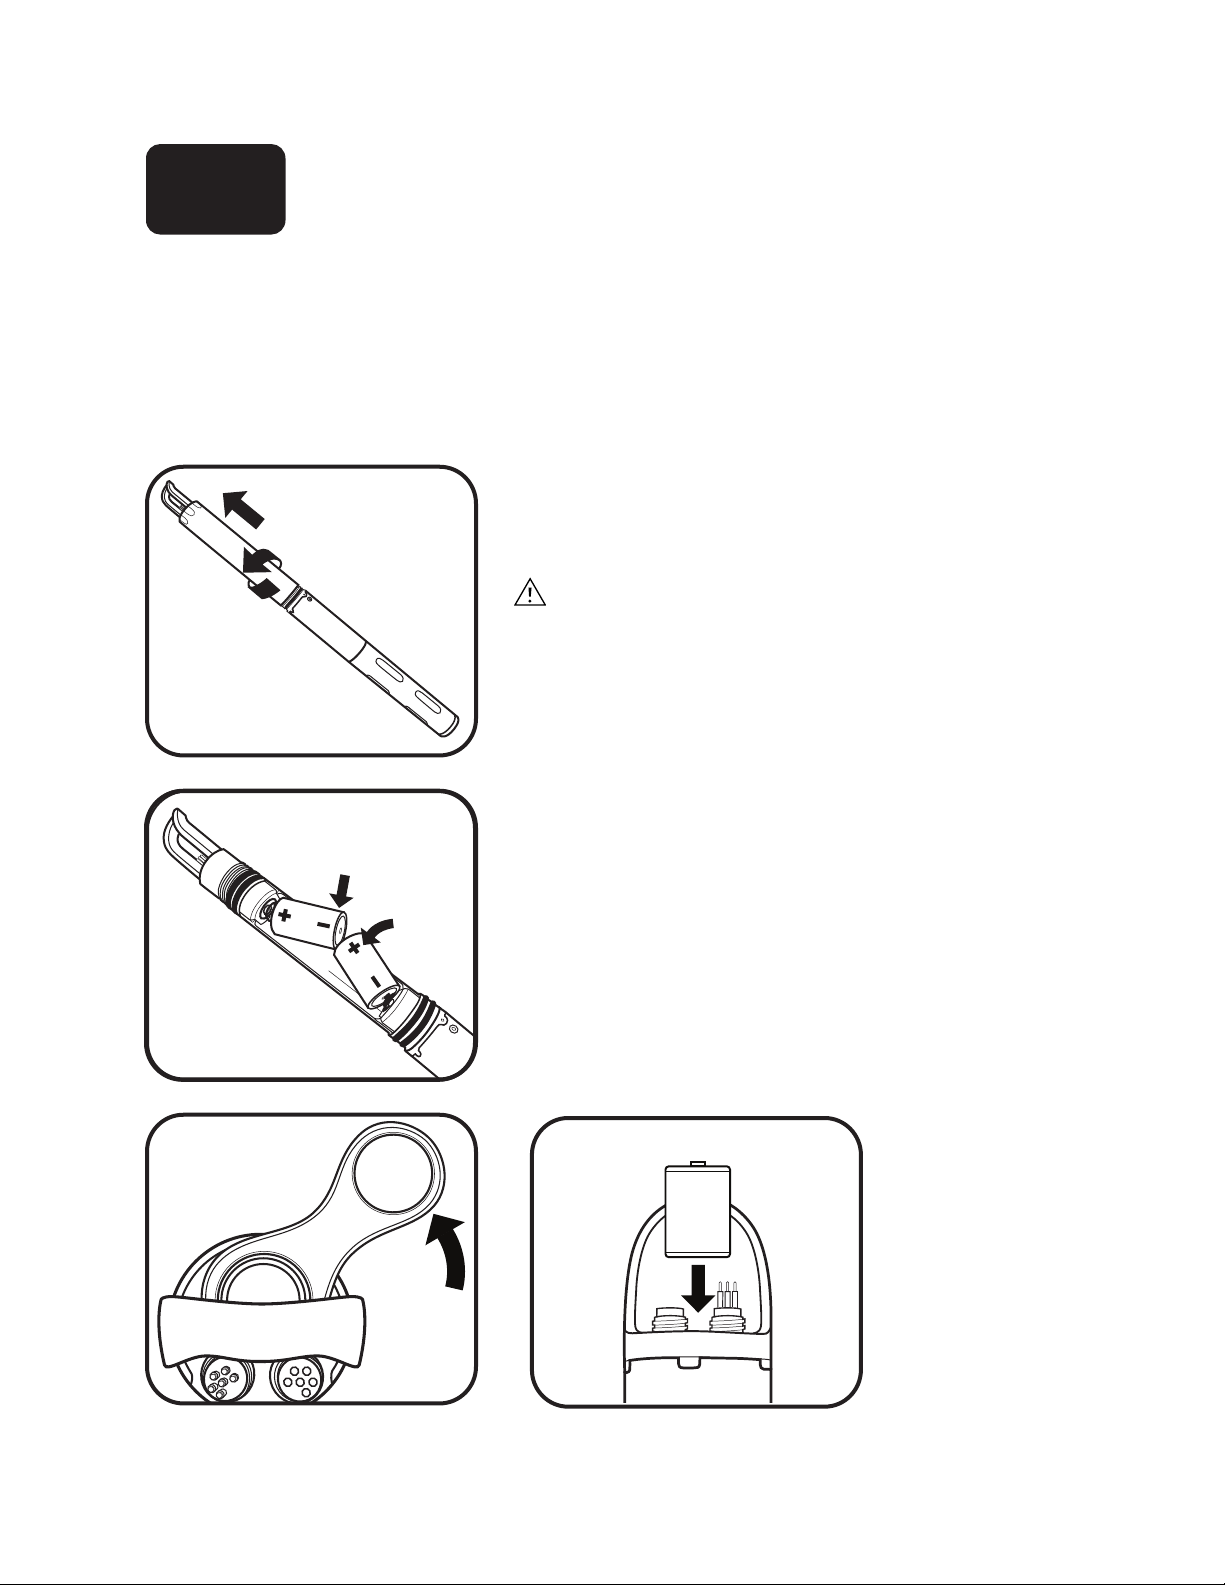
Install Batteries
2.1
e EXO1 Sonde uses two (2) D-cell alkaline batteries and the EXO2 Sonde uses four (4) D-cell alkaline
batteries as the recommended power source. Alternatively, the sonde may use rechargeable NiMH D-cell
batteries that you purchase. See detailed installation instructions Section 6.2
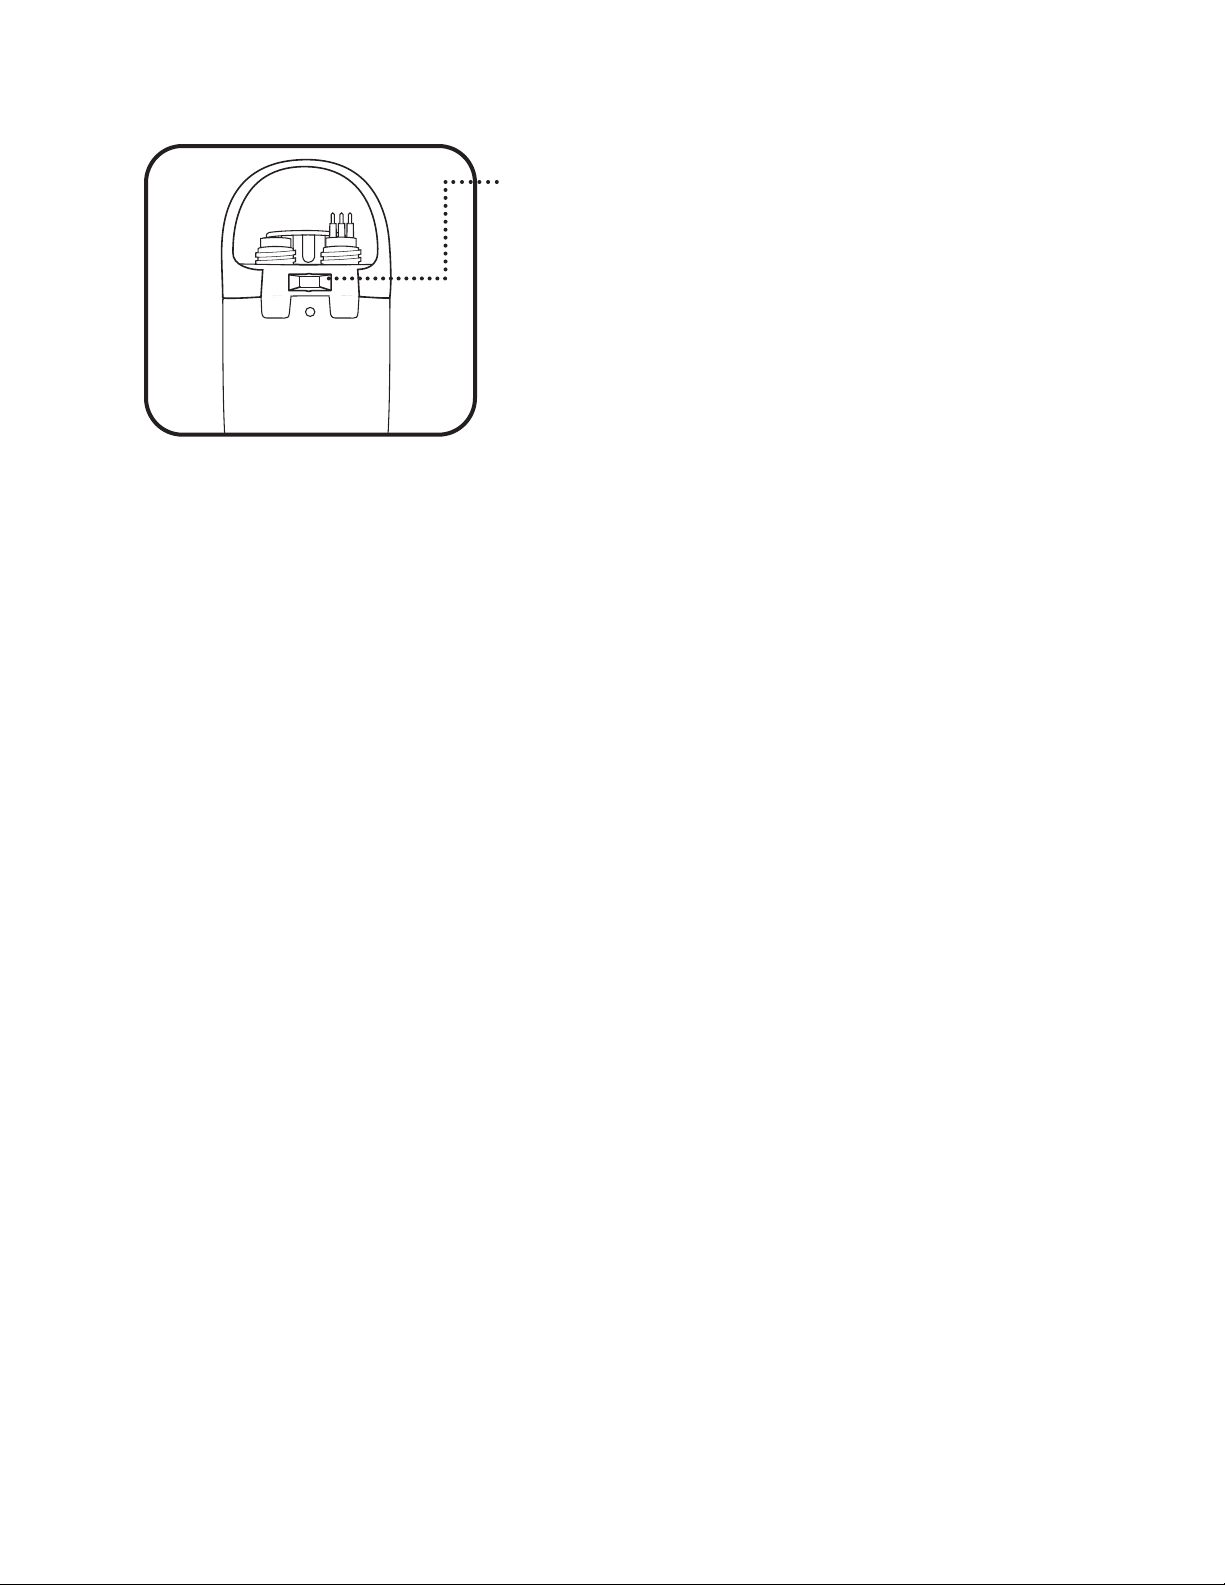
1. Remove battery cover.
EXO1: Twist the blue battery cover counterclockwise to
loosen, li up to remove.
nec essar y.
Do not remove the screws on the sonde’s electronics
compartment.
Use included wrench to loosen, if
EXO1
EXO2
EXO2: Unscrew and remove battery cap. Use included
wrench to loosen, if necessary.
2. Install batteries.
Insert the batteries with positive terminals (+) facing up
and negative terminals (-) facing down toward the probes.
3. Replace battery cover.
Replace the battery cover or cap and tighten until snug. Do
not overtighten.
pg | 27
Page 28
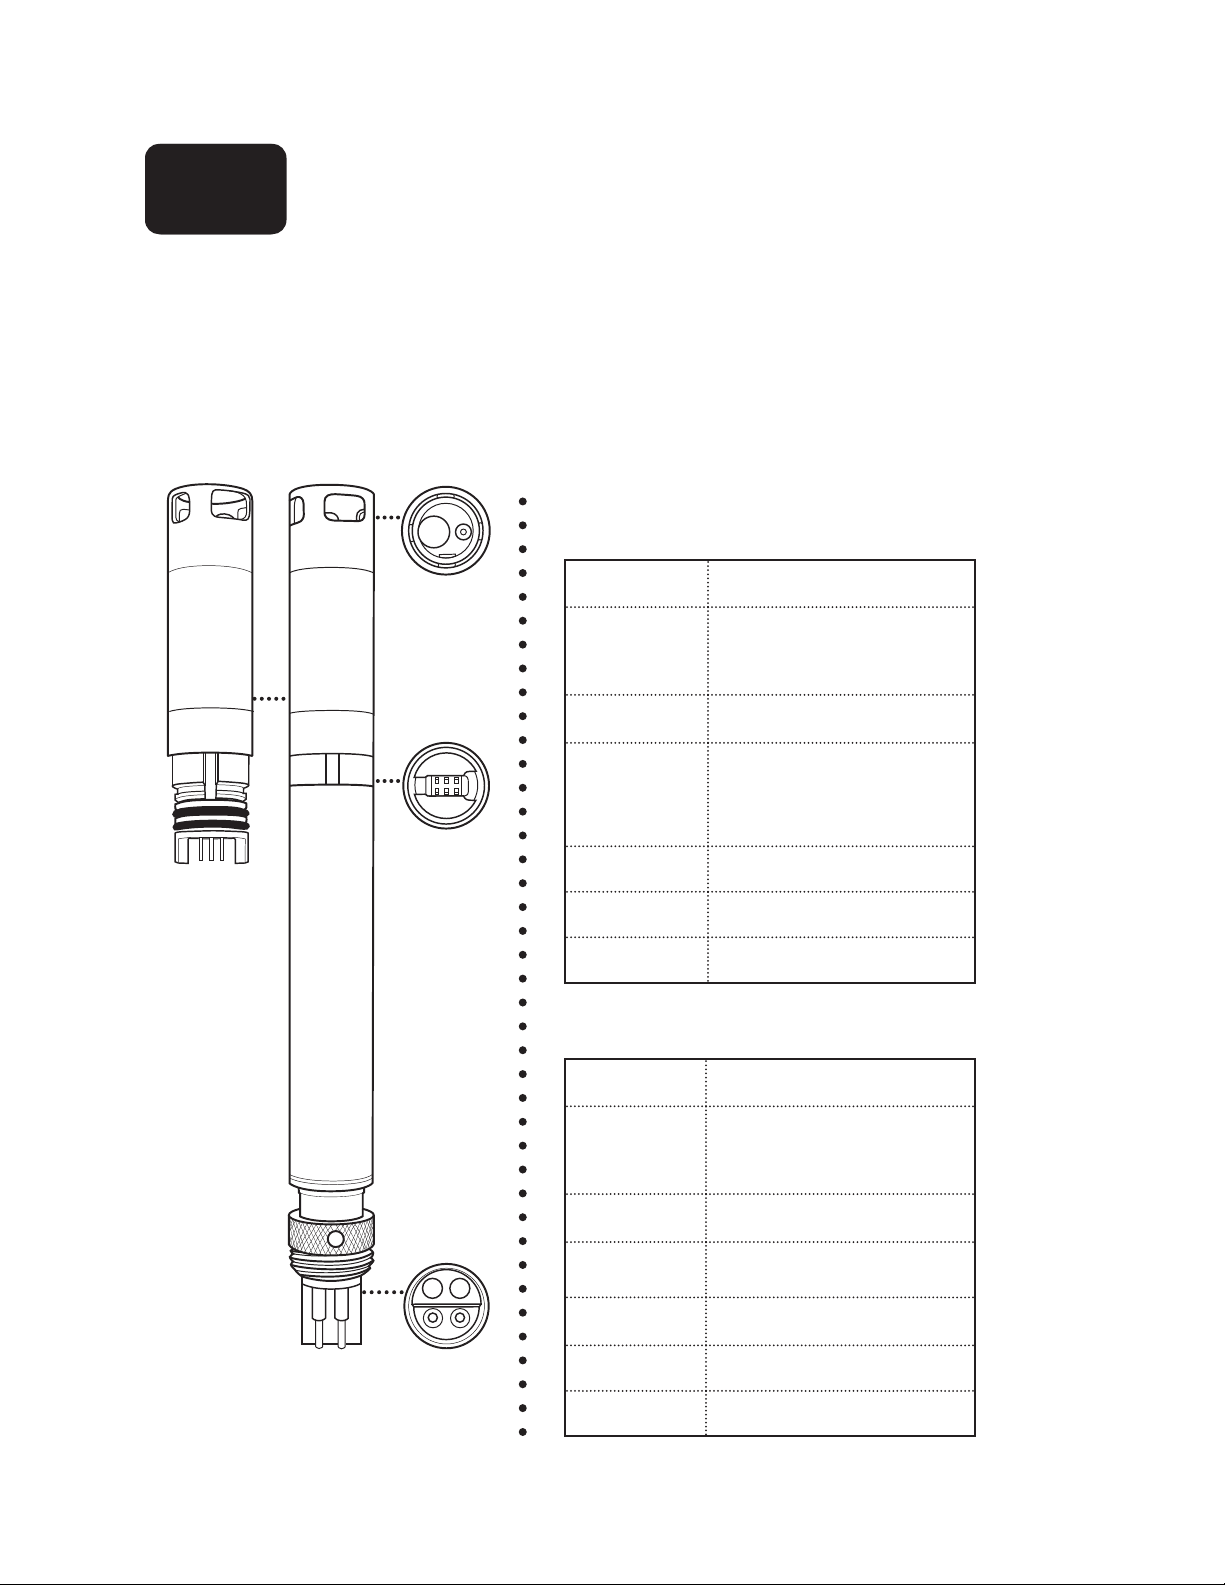
Install/Remove Sensors
2.2
EXO sensors have identical connectors and identify themselves via onboard rmware; therefore, users can
install any probe into any universal sonde port. e exception is the wiper for the EXO2 sonde, which must
be installed in the central Port 7. Individual ports are physically identied by an engraved number on the
sonde bulkhead. Although the probes are wet-mateable, users should clean, lubricate, and dry the sonde and
sensors connectors prior to installation or service, when possible.
1 Remove probe or port plug.
Remove the calibration cup and sensor guard from the
sonde. Place the sonde on a clean, at surface and prevent
it from rolling. R
and place on a clean surface.
If removing a sensor,
nut and rotate counterclockwise to loosen. Pull the probe
straight out of the port and place on a clean surface.
Remove hydration caps or buer bottles on probes. Wipe
dry with a clean, lint-free cloth.
emove port plugs by pulling straight out
use the probe tool in the locking
2 Clean port and install sensor.
Visually inspect the port for contamination. If the port
is dirty or wet, clean it with a clean, lint-free cloth or
compressed air. Apply a light coat of Krytox grease to the
rubber mating surfaces of the connector.
Insert the sensor into the port by properly aligning the
connectors’ pins and sleeves (male and female contacts);
then press them rmly together.
3 Tighten locking nut.
Taking care not to cross-thread the grooves, nger-tighten
the locking nut clockwise. When the nut is seated against
the bulkhead, tighten it with probe tool until snug. Once
sensors or plugs are installed, reinstall the sensor guard to
protect sensors from impact damage.
Take care not to twist the probe body when tightening
and loosening the locking nut. Excessive twisting of the
probe can damage the connector and is not covered under
warranty.
pg | 28
Page 29
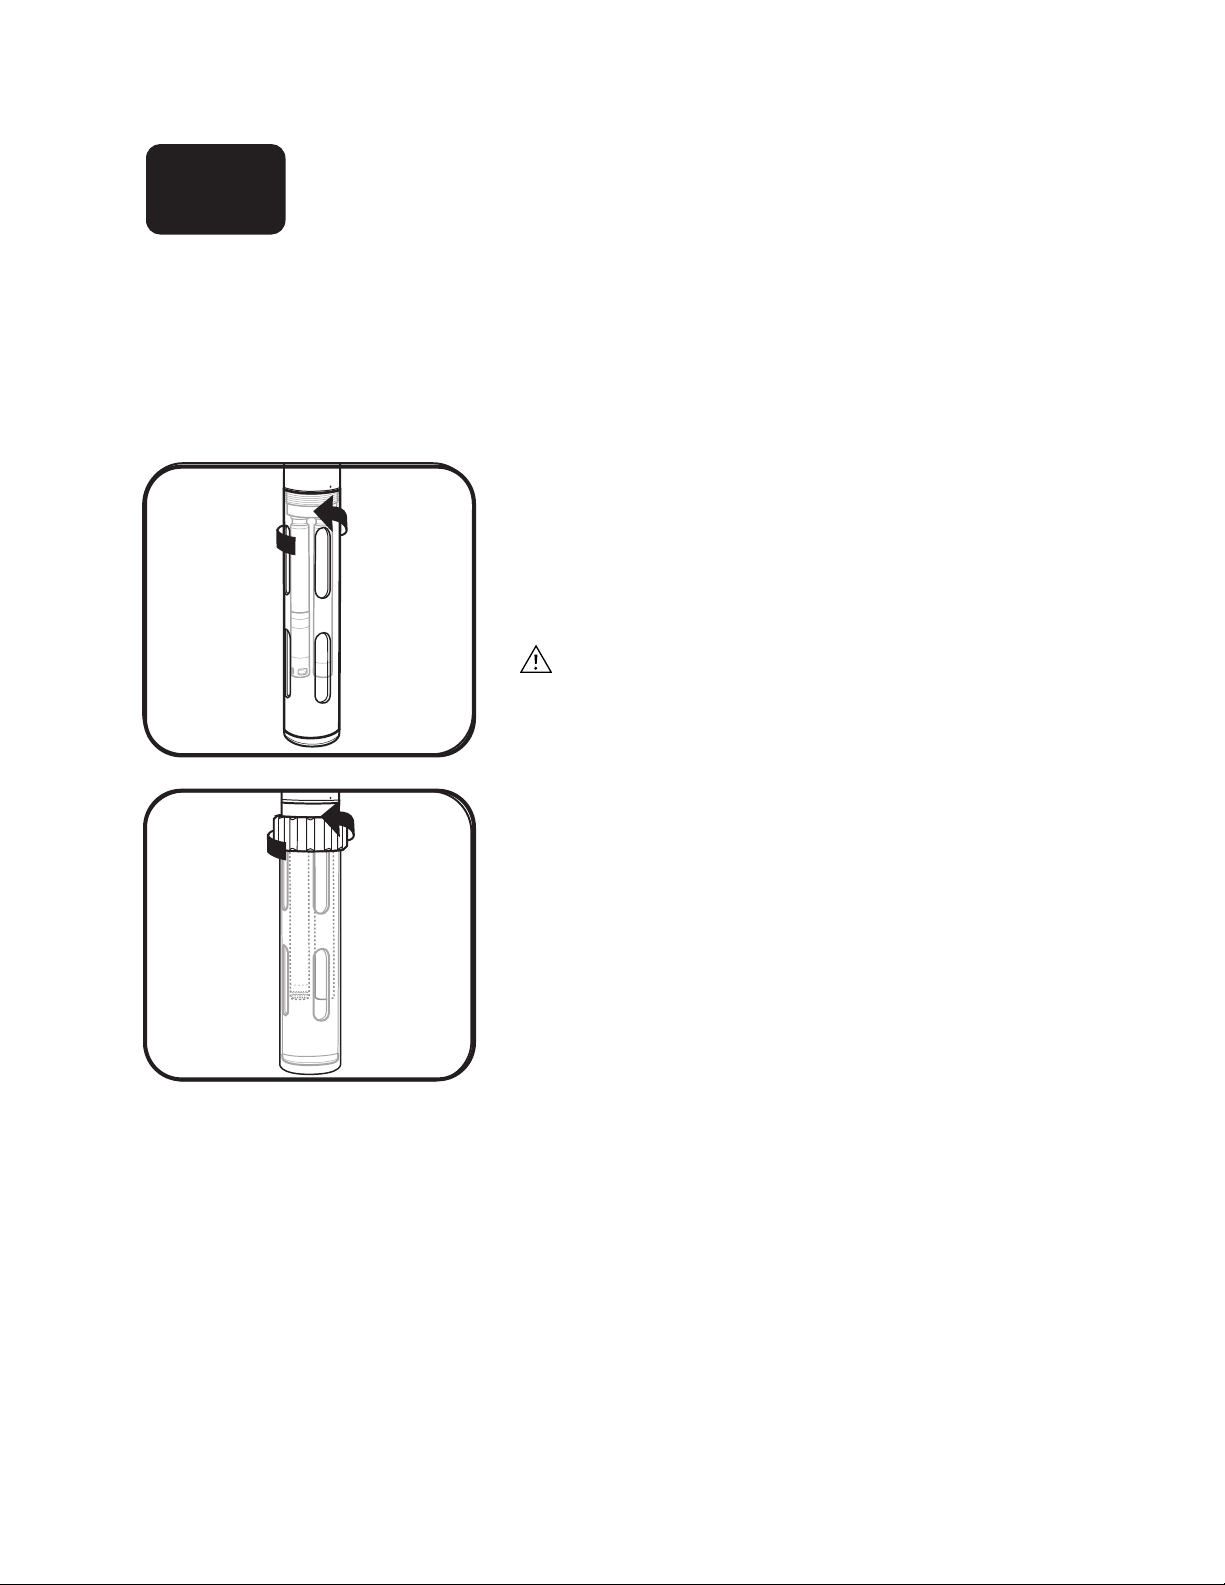
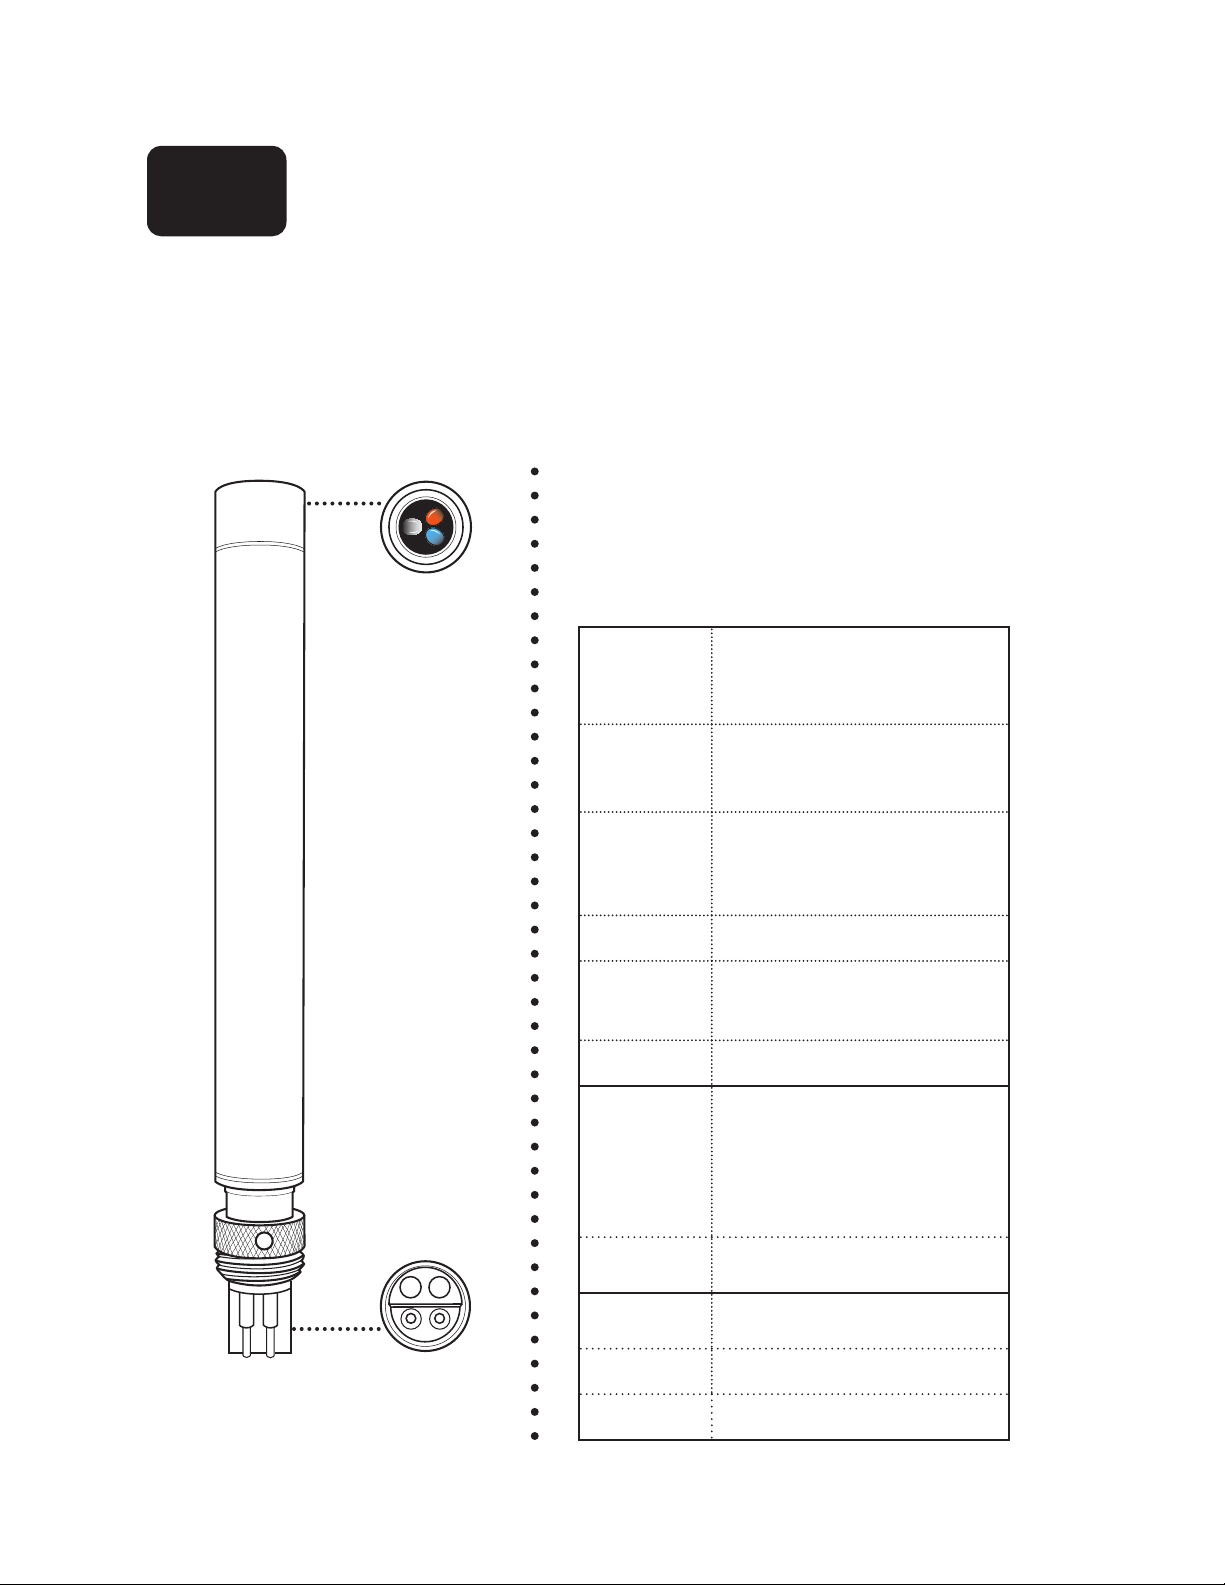
Install/Remove Guard or
2.3
Calibration Cup
Sonde guards protect EXO sensors from impact throughout deployment. Users should always install the guard
prior to data collection. e calibration cup (cal cup) is used for storage and calibration. We recommend
using two guards: one for eld deployments and a second used exclusively for calibrations. Using a second
guard will minimize calibration solution contamination (especially for turbidity) and calibration errors. EXO
calibration cups install over an installed sonde guard. is conguration reduces the amount of standards
required for calibration.
1 Install/remove sonde guard.
Install guard by threading it onto the sonde bulkhead
threads. Rotate the guard clockwise on the bulkhead to
install. Rotate it counterclockwise to remove. Always
use one guard for deployment/storage and the other for
calibration only.
Take care not to let the guard damage unguarded pH or
pH/ORP sensors when installing and removing.
2 Install/remove calibration cup.
Before installation, loosen (but do not remove) the
cup’s clamping ring. en, with the sonde guard already
installed, slide the cal cup over the guard until the bottom
of the guard rests against the bottom of the cal cup. Tighten
the ring until snug. To remove the cal cup, loosen the ring
by 1/4 turn and pull the guard free from the cup.
pg | 29
Page 30
Sonde States and
2.4
LED Descriptions
States
An EXO sonde is always in one of three operational states: O, Awake, and Asleep. ese states determine the
sonde’s current power usage and logging potential. When O , the sonde is not powered and cannot collect
data (no batteries installed, no topside power). Users can apply power to the sonde internally, using batteries,
or externally with an EXO eld cable attached from the topside port to an EXO Handheld, DCP or other
approved power source. Once power is applied to a sonde, it is either Awak e or Asleep.
When in an Asleep state, the sonde remains in a very low
States
Off: Not powered, no data
collection.
Asleep: Low power. Waiting for
command.
Awake: Full power. Ready to
collect.
LED Indicators
Blue LED – Bluetooth
None: Off, not active.
On Solid: On, not linked.
2 Hz Blink: On, successfully linked.
Red LED – Sonde State
None: Sonde is Off or Asleep
with logging disabled.
0.1 Hz Blink: Sonde is Asleep with
logging enabled.
1 Hz Blink: Sonde is Awake.
On: Sonde is Awake with faults.
power setting and waits for a user command or its next
scheduled logging interval. An Awake sonde is fully powered
and ready to collect data. Once awakened, a sonde remains
Awake for ve minutes aer its last communication via
Bluetooth or 30 seconds aer its last communication via
the topside port. e sonde also automatically awakens 15
seconds before its next scheduled logging interval.
LED Indicators
Each sonde has two LED indicators that show the sonde’s
status. The blue LED indicates the Bluetooth’s wireless
connection status. e red LED indicates the sonde’s current
state.
e Bluetooth light (blue) is activated by a magnet swipe at
the magnetic activation area. When the blue LED is o, the
Bluetooth is disabled. When the light is on continuously, the
Bluetooth is enabled, but no link has been established. When
the blue LED blinks at 2 Hz, the sonde’s Bluetooth is on, and
has established a link.
When the red sonde state LED is o, the sonde is either O
or Asleep and not logging. When it blinks at 0.1 Hz (once
every 10 seconds), the sonde is Asleep and logging is enabled.
When the red light blinks at 1 Hz, the sonde is Awak e and
has no faults. If the red light is lit continuously, the sonde is
Awake and has detected faults, such as problems with the
system that need to be xed prior to use.
pg | 30
Modes
Within the Awake state, the sonde has three modes, which
are activated via Kor soware. When “Inactive (O),” the
sonde does not log any data. In “Real-Time” mode, the
sonde continuously collects data at a user-specied interval
(default is 2 Hz). “Sample/Hold” mode allows users to easily
synchronize data between the sonde’s data logger and an
external data collection platform.
Page 31

Awaken Sonde,
2.5
Activate Bluetooth
Once power is applied to the sonde, internally or externally, users can awaken their sondes from Sleep state using
any of several methods. Primarily, users activate EXO sondes and the Bluetooth connections via a magnetic
switch installed in sonde’s electronics compartment. e sonde will automatically disable the connection and
go to sleep once it has not received a Bluetooth signal for 5 minutes or a signal from the topside connector
for 30 seconds. In order to activate their sondes, users should keep a magnet with them when setting up and
deploying sondes. For more information on sonde states and LEDs, please see Section 2.4.
1 Awaken sonde with magnet.
Users can make their sonde go to the Awake state by
holding a magnet at the magnetic activation area on the
sonde’s bulkhead (identied by the illustrated magnet
symbol on the label). Simply hold the magnet within
one (1) cm of the symbol until the LEDs activate. EXO
Handhelds and sensor tools contain embedded magnets
identied by the same symbol.
2 Awaken sonde without magnet.
Users can also make their sonde go to the Awake state
using any of the following methods.
• Cycling power to the sonde (uninstalling/installing
batteries).
• Communicating via the topside port.
• Inserting a sensor.
In addition to these manual methods, the sonde also
automatically awakens for scheduled unattended logging
(programmed in Kor).
3 Activate sonde’s Bluetooth.
Users activate Bluetooth by holding a magnet at the
magnetic activation area in the same way as described in
Step 1. In addition to magnetic activation, users can also
activate Bluetooth by:
• Cycling power to the sonde (uninstalling/installing
batteries).
• Enabling Bluetooth via a connection at the topside port
in Kor.
pg | 31
Page 32

Attach Sonde to Handheld
2.6
Field Cable
All EXO cables have 6-pin and wet-mateable connectors. Each cable also incorporates a strain relief
mechanism to alleviate stress on the connector. Read the Cable Maintenance section before rst-time use.
Because Bluetooth wireless will not pass through water, users must use the cable to connect to the sonde
when it is submerged and taking real-time eld readings that are being viewed by the user or logged by a
data collection platform.
1 Attach cable to sonde.
Apply a light layer of Krytox grease to the male pins on
the cable and the female connector on the sonde. Press in
the male 6-pin connector, then screw down the retaining
collar. Attach the cable’s strain relief to the sonde’s bail with
a carabiner. e cable’s strain relief should be positioned to
remove any weight-bearing from the actual connector and
retaining collar.
2 Attach cable to handheld.
Apply a light layer of Krytox grease to the male pins on the
handheld and the female connector on the cable. Press on
the female 6-pin connector, then screw down the retaining
collar. Connect the strain relief to the Handheld’s strap.
3 Discover sonde in KOR.
Upon startup of the Handheld, KOR soware searches for a
hard-wired connection to the sonde. If KOR discovers the
sonde it will request to connect to it.
pg | 32
Page 33

Attach Sonde to Handheld
2.7
Bluetooth Wireless
Users can wirelessly connect EXO sondes (above water) to the EXO Handheld using Bluetooth wireless. With
Bluetooth, users can reduce the amount of cables needed to operate their sonde. is wireless connection
has a typical range of 10 meters, but this range will uctuate depending on the operating environment. Users
cannot wirelessly connect through water.
In order to connect via wireless, both devices must be powered on.
1 Activate sonde’s Bluetooth.
Activate Bluetooth by holding a magnet at the magnetic
activation area. In addition to magnetic activation, users
can also activate Bluetooth by cycling power to the sonde
(remove/reinstall batteries).
2 Discover sonde in KOR.
Every time the Handheld powers on, it automatically
searches for a sonde via the hard-wired cable connection.
3 Rescan sonde.
If a wired connection is not found, and to manually
establish a connection to a sonde via Bluetooth, navigate to
the Connections menu in KOR soware on the Handheld.
Select Rescan. KOR will rescan and detect Bluetoothenabled sondes. Select the sonde from the list and then
click the Connect button.
pg | 33
Page 34

Install KOR Software
2.8
e desktop KOR soware is supplied will all EXO sondes on a USB ash drive. Installing the soware will
require Administrative privileges on the local PC. It is important to install KOR soware prior to using the
USB Signal Adapter, as the required drivers for the adapter are installed along with KOR soware.
NOTE: A “lite” version of KOR soware on the EXO handheld does not require any installation.
1 Install KOR software and drivers.
Insert USB drive and install soware using the startup.exe
le. Reboot the computer aer installation of the soware.
e program installs several items: EXO-KOR soware,
National Instruments supporting soware, and USB drivers
for the EXO USB adapter.
When complete, the program will reside in the root
Program menu (not in a subfolder) with the following icon:
Additionally, a folder called National Instruments will be
created; however this information will not be accessed
through the course of normal operation.
Minimum requirements:
Minimum requirements on a computer for KOR soware:
• Windows®XP (service pack 3) or newer Windows
operating platform (Windows®7 recommended)
• Microso .NET (any version from 2.0 through 3.5
Service Pack 1)
• 500 MB of hard disk space (1 GB recommended)
• 2 GB of RAM (4 GB recommended)
• Screen with resolution of 1280x800 or greater
• Available USB 2.0 port
• Internet access for soware updates
• Optional: Integral Bluetooth or USB dongle Bluetooth
adapter
2 Software updates
When they become available, updated versions of KOR
soware will be posted to www.EXOwater.com. Users
will need to register a free account to access the soware
download.
pg | 34
Page 35

Connect Sonde
2.9
USB
e USB signal output adapter (USB-SOA #599810) allows users to connect to an EXO sonde over a standard
USB connection. Although the USB-SOA is rugged and water resistant, users should protect its connectors
with the included cap when not in use. e SOA should never be submerged.
Prior to use, users must install KOR soware and its drivers on the associated PC. e USB-SOA will not
work without the drivers that accompany KOR See section 2.8.
1 Connect SOA to sonde.
Remove the plug from the 6-pin connector on the sonde.
Apply a light layer of Krytox grease to the male pins on the
sonde and the female connector on the USB-SOA. en
align the connector’s six pins and jackets, and press them
rmly together so that no gap remains.
2 Connect USB cable to SOA and PC.
Remove the protective cap from the USB end of the SOA,
and ensure that the connector is clean and dry. en insert
the small end of the provided USB cable into the SOA
connector and the large, standard side into one of the PC’s
USB ports.
Attaching the adapter to the PC causes a new device to be
recognized. Windows automatically installs the drivers
and creates a new port. Each new adapter that is attached
creates a new port.
Ports
KOR automatically scans ports for both USB adapters and
Bluetooth. To view the USB adapter and its associated
comm port, go to the Control Panel on your computer,
click Device Manager, then click Ports.
pg | 35
Page 36

Connect Sonde
2 .10
Bluetooth
Before users can communicate wirelessly with their EXO sondes, they must establish a Bluetooth link. All
EXO sondes are equipped with Bluetooth wireless. is technology provides a secure, two-way, reliable
communication channel with which users can communicate with their sondes above water without cables.
Many new computers are equipped with Bluetooth wireless installed internally; those without Bluetooth
can use a Bluetooth dongle (not included). Follow the manufacturer’s instructions for installing the dongle’s
soware and hardware. Administrative permissions and IT support may be required depending on the
adapter and your PC settings.
1 Install Bluetooth dongle (optional).
If your computer is not equipped with internal Bluetooth,
insert a Bluetooth dongle (not provided) into any of
the computer’s USB ports. Wait for the computer to
automatically install the device and its drivers. Once the
installation is complete, the computer should indicate that
the device is installed and ready to use.
e preferred Bluetooth conguration is Windows 7 with
native Windows Bluetooth drivers and soware.
2 Activate sonde’s Bluetooth.
Users activate Bluetooth wireless by holding a magnet
at the magnetic activation area. In addition to magnetic
activation, users can also activate Bluetooth by:
• Applying power to the sonde
• Enabling Bluetooth via KOR through a USB or eld
cable connection at the topside port.
See more information on sonde activation and LED
conditions in sections 2.4 and 2.5.
3a Establish Bluetooth link. (Win XP)
1.Open Control Panel>Bluetooth Devices.
2.Check “My device is setup and ready to be found,” then
click “Next.”
3.Locate the sonde from the options. e sonde name
should begin with YSI.
4.Select “Use passkey found in documentation,” and enter
the passkey 9876. Click “Next.”
5.Select Finish.
e device is now available in the “Devices” tab.
pg | 36
Page 37

3b Establish Bluetooth link. (Win 7)
1.Open Control Panel>Devices and Printers.
2.Select “Add a Device” from the top of the screen.
3.Locate the sonde name (starts with YSI) from the options.
4.Select “Enter the device’s pairing code,” then enter the
pairing code 9876. Click “Next.”
3c Alternative: Establish Bluetooth link.
(Win 7)
1.Launch KOR soware and click the Connections menu.
2.Click Rescan button.
3.Click Search Bluetooth button. is may take up to 40
seconds, and may require several attempts using the
Refresh button.
4.Select the device from the list and click Connect.
e sonde is now available in the Devices and Printers
screen.
4 Confirm successful link.
Once the device has been added, conrm that the device
appears in:
• Win XP -Devices tab of the BT Devices window
• Win 7 - Devices and Printers screen
If the device is not listed, attempt the establishment process
again.
is process establishes a secure wireless link between the
sonde and a PC. Once established, users will not need to
perform this process again in order to link with the sonde.
Users communicate with the sonde via the KOR soware.
Once this wireless link is established, use KOR to nd the
sonde and perform desired operations.
Ports
KOR automatically scans ports for both USB adapters
and Bluetooth. To view the comm port associated with
Bluetooth, go to the Bluetooth menu on your computer,,
click Show Bluetooth Devices, click on the device you
added, then click Properties.
pg | 37
Page 38

Connect Sonde
on reverse
3M
3M
2.11
Data Collection Platform (DCP)
is signal output adapter (SOA) allows users to connect an EXO sonde to a Data Collection Platform (DCP)
as well as power it via an external 12 V DC source (not included). Users wire a sonde cable with ying leads
into one side of the SOA and an SDI-12 /RS-232 output and power source into the other. Mount the SOA in
a humidity-controlled enclosure using the following recommended hardware, and never attempt to perform
electrical work beyond your experience.
1 Configure sonde.
Using KOR soware, go to the Deploy menu and choose
to deploy by opening a template or starting a custom
deployment. Click Edit, then go to the SDI-12 tab and
select your parameters and the SDI address. e sonde’s
default address is zero (0). Click save. Refer to Section 5
KOR Soware for more details.
2 Route cable.
Determine the sonde cable routing to the DCP, and protect
the cable from chafe damage and impact.
Route the cable through a sealing gland into the DCP, and
ensure that the seal is air-tight and water-tight.
3 Mount SOA.
Users can mount the SOA horizontally or vertically either
by the screw slots on the sides of the SOA or with the
included 3M adhesive strips. e screw slots were designed
to accept #4 wood screws but may accept other types and
sizes.
If the user opts to use adhesive strips, rst clean the
application surface with a 50:50 mixture of isopropyl
alcohol and water, then mount them in temperatures
between 21° and 38°C and allow the bond to cure for 72
hours if possible before attaching wires.
pg | 38
Page 39

4 C onnect flying lead cable to sonde.
10
12
14
16
18
20
Press in the male 6-pin connector, then screw down the
retaining collar. Attach the cable’s strain relief to the sonde’s
bail with a carabiner. e cable’s strain relief should be
positioned to remove any weight-bearing from the actual
connector and retaining collar.
5 Prepare wires.
Always follow proper safety precautions when performing
electrical work.
Properly strip the ends of the wire. Remove 0.25 inches
of insulation from each wire then twist the bared strands
together. All wires should be 18-24 AWG and are not
included with the SOA.
6 Insert wires into SOA.
Loosen the clamping screw with the supplied screwdriver,
insert the indicated wire into the terminal strip, and tighten
the clamping screw back down onto the exposed wire end.
Ensure that all strands are inserted to avoid short circuits.
Take care not to strip the slots in the heads of the screws.
• Connect DCP signal ground to SOA SDI ground terminal
(recommend black wire)
• Connect DCP SDI-12 data terminal for SOA SDI-12
terminal (recommend violet wire)
• Connect DCP output ground terminal to SOA power
ground terminal (recommend black wire)
• Connect DCP 12 VDC output to SOA 9-16 VDC input
terminal (recommend red wire).
pg | 39
Page 40

Sonde
Expansion
(Handheld)
Power
RS-232
SDI-12
+ 9-16V DC
- Ground
1 Amp Fuse
Voltage
esondeisdesignedtorunwith12-voltbatteries,with
supplyvoltagesbetween9and16VDC.
should be directly powered by a sealed battery or installed
as part of a remote solar system.
1-ampslow-blowfuseforprotection.
allwiringiscompleted.
When used with a solar system always ensure use of
12-volt solar regulator. Never connect the sonde directly to
solar panel; voltages above 16.5 volts will cause the sonde to
shut down and excessive voltage will permanently damage
the sonde and is not covered under warranty.
PowertheSOAthrougha
ese systems
Removethefuseuntil
pg | 40
Page 41

Connect Sonde
2.12
Flow Cell
ere are two versions of the EXO ow cell: EXO1 ow cell (#599080) and EXO2 ow cell (#599201). Flow
rate of the ow cell is typically between 100 mL and 1 L per minute. Maximum ow rate depends on tubing
type, size, and length. Maximum pressure for each ow cell is 25 psi.
Inspect sonde and flow cell.
Remove the sonde guard or calibration cup from the sonde
so that the sensors are exposed.
Make sure that the threads of the sonde and ow cell as
well as all o-rings are clean and free of any particles such as
sand, grit, or dirt.
Insert sonde into flow cell.
Outflow ..
Insert the sonde into the top of the ow cell. Be careful not
to bump or scrape the sensors on the sides of the ow cell.
Screw the sonde into the ow cell by turning the sonde
clockwise until it is hand-tightened into place; do not use
a tool.
Inflow ..
Connect tubing to flow cell.
Install the Quick Connect tube ttings onto the ow cell
by inserting them into the Quick Connect coupling body.
ey should snap into place.
Connect the tubing from your pump (not included) to the
Quick Connect tube ttings, making sure that the tubing is
pushed securely onto the ttings. e inow should be at
the bottom of the ow cell and the outow should be at the
top.
Keep ow cell vertical to purge it and ensure air release
from Conductivity/Temperature sensor.
Do not turn on water to the system until the ow cell is
securely connected.
pg | 41
Page 42

is page intentionally le blank
pg | 42
Page 43

Handheld
3.1
Install or Replace Batteries
e EXO Handheld (HHs) uses four (4) C-cell alkaline batteries as a power source. Users can extend battery
life by putting the HH in “Sleep” mode, when convenient, by pressing and holding the power button for less
than three seconds. Rechargeable Nickel Metal Hydride (NiMH) batteries can also be used. Battery life varies
depending on GPS and Bluetooth wireless use.
1 Remove battery cover panel.
e battery cover panel is located on the back of the HH.
To remove the panel, unscrew (counter-clockwise) the four
screws with a at or Phillips head screwdriver.
Note: e retaining screws are integrated into this panel
and are not independently removable. If replacement is
necessary, replace the entire assembly.
2 Insert/replace batteries.
Remove the old batteries and dispose of them according to
local ordinances and regulations. Install the new batteries
between the battery clips with their polarity (+/-) oriented
as shown on the bottom of the battery compartment.
If you use your own rechargeable batteries, they cannot
be charged inside the handheld; they should be charged
outside the handheld.
3 Reinstall battery cover panel.
Ensure that the rubber battery cover gasket is seated
properly, then replace the cover onto the back of the HH.
Tighten the four retaining screws back into their holes, but
do not overtighten.
pg | 43
Page 44

Power On/Off Handheld
3.2
Users can power on/o and awaken/put to sleep the EXO Handheld (HH) depending on use. In order to
use the HH, users must rst power it on. When nished with the HH, users should power it o to increase
its battery life. When temporarily not using the HH, users should put it to sleep, and awaken it when next
needed. e HH’s sleep mode is a low-power mode designed to increase its battery life. When nished with
the HH for a long period of time, users should power it o and remove the batteries.
1 Power on/awaken handheld.
With batteries installed, press and hold the power button
for one second. e Bluetooth wireless indicator will then
illuminate. Next the splash screen will appear then briey
go black (approximately 5 seconds) while the system starts
up. e HH will then automatically start Kor.
If the HH is asleep, users should briey press the power
button to awaken it.
2 Power off/put to sleep.
To power o the HH, users must press and hold the power
button for more than three seconds. Once the button has
been held long enough, the screen will power down and go
black.
To put the HH to sleep, press and hold the power button
for less than three seconds, and release it. e screen will
then go black.
pg | 44
Page 45

Attach Handheld to Sonde
3.3
Field Cable
All EXO cables have 6-pin and wet-mateable connectors. Each cable also incorporates a strain relief mechanism
to alleviate stress on the connector throughout deployment. Read the Cable Maintenance section before rsttime use. Although the cables are wet-mateable, users should dry the connectors prior to installation when
possible. Always protect connectors by leaving the cable or connector caps installed even when the connector
is not in use. Always attach the cable’s strain relief mechanism to the bail when the sonde is deployed.
1 Attach cable to sonde.
If needed, lightly grease the black rubber part of the
connector with Krytox grease. Press in the male 6-pin
connector, then screw down the retaining collar. Attach
the cable’s strain relief to the sonde’s bail with a carabiner.
e cable’s strain relief should be positioned to remove any
weight-bearing from the actual connector and retaining
collar.
2 Attach cable to handheld.
Apply a light layer of Krytox grease to the male pins on the
handheld and the female connector on the cable. Press on
the female 6-pin connector, then screw down the retaining
collar. Connect the strain relief to the Handheld’s strap.
3 Discover sonde in KOR.
Upon startup of the Handheld, KOR soware searches for a
hard-wired connection to the sonde. If KOR discovers the
sonde, it will request to connect to it.
pg | 45
Page 46

Attach Handheld to Sonde
3.4
Bluetooth Wireless
Users can wirelessly connect their EXO sondes (above water) to the EXO Handheld using Bluetooth wireless
communication. With Bluetooth, users can reduce the amount of cables needed to operate their sonde. e
wireless connection has a typical range of 10 meters, but this range will uctuate depending on the operating
environment. Users cannot wirelessly connect through water.
In order to connect via wireless, both devices must be powered on.
1 Activate sonde’s Bluetooth.
Users activate Bluetooth by holding a magnet at the
magnetic activation area. In addition to magnetic
activation, users can also activate Bluetooth by cycling
power to the sonde (remove/reinstall batteries).
2 Discover sonde in KOR.
Every time the Handheld powers on, it automatically
searches for a sonde via the hard-wired cable connection.
3 Rescan sonde.
If a wired connection is not found, and to manually
establish a connection to a sonde via Bluetooth, navigate to
the Connections menu in KOR soware on the Handheld.
Select Rescan. KOR will rescan and detect Bluetoothenabled sondes. Select the sonde from the list and then
click the Connect button.
pg | 46
Page 47

Spot Sampling
3.5
View Live Data
When connecting through the Handheld, KOR soware attempts to automatically connect to an available
sonde and start displaying current data in a live view. To manually access the live view from either the
Handheld or Desktop, go to the Run menu and choose “Dashboard.” Users can set view preference in the live
view menu to display numeric live data (default) or a graph view, where a maximum of two parameters can
simultaneously be plotted on the screen. For overview of KOR menus, see section 4; for overview of Handheld
keypad functions, see section 1.3
Data dashboard and graph
Users can toggle between numeric dashboard and live
graph views using a so key. e other so key may be used
to log information displayed on the screen.
Dashboard image at le; live graph image at middle le.
Parameter preference
Users can select which parameters to display in both graph
and dashboard modes by using the backspace and tab keys
on the Handheld keypad. If an expected parameter is not
available, rst set the appropriate units preference from the
Options | Units menu.
Advanced display settings
Adjust data display settings for both dashboard and live
graph modes in the Run menu. Select Settings to change
the settings for log mode (up to 100 points), graph type
(time series or vertical prole), sample interval (default is 1
sec), and default parameters to view.
pg | 47
Page 48

Spot Sampling
3.6
Record Spot Sampling Data
e sonde can be used for both continuous and spot-sampling applications. Spot-sampling readings are
refreshed in real-time on the Dashboard screens. e so keys on the Handheld allow logging of this
information. ere are two options when logging data: log a single point or continuous logging. Users may
select one of these options from the live view settings window. (Live view log settings should not be used
for deploying a sonde in continuous monitoring applications. Use the Deploy menu for these applications.)
1 Capture data.
To capture spot sample les, go to the Run menu and click
the so key below the Capture Data button.
Select a site from the list of your pre-programmed sites
on the Handheld. If no sites have been loaded in the
Handheld, skip this step. e site data is appended to the
data le.
Data is captured in a .cap le on the Handheld.
2 Name file.
Whether logging data a single point at a time or logging a
stream of data, information will be stored in a le specied
under the Options menu. If a unique le name is not
selected, then a default le is automatically created.
pg | 48
Page 49

Upload Data
3.7
from Handheld to PC
e EXO Handheld stores two dierent sets of sensor data les: Files uploaded from the sonde and les
manually logged into the Handheld from the live data mode. Both types of les can be sent to a PC via the
USB cable. Note that KOR Desktop soware must rst be installed on a computer before transferring les
from Handheld to PC.
1 Connect handheld to computer.
Plug the small end of the USB cable into the port on the
top side of the EXO Handheld. Plug the other end of the
USB cable into a port on your computer. Allow a minute for
Windows to recognize the Handheld as a removable drive
before the Handheld shows up in KOR soware.
2 Transfer files.
When the Handheld is connected to the PC, go to the
Options | Sync with Handheld menu in KOR Desktop
soware. Select Sync All and KOR will search all folders
and synchronize the les automatically. Or users can
select each folder separately and synchronize selected les
manually.
3 Delete files.
Directory Maintenance: Users can browse folders and
select les to delete from the Handheld. Deleting les is
optional.
pg | 49
Page 50

GPS
3.8
Upon startup of the Handheld, the GPS function automatically initiates a x of the location. is may take
some time. During this process, the Handheld should remain stationary and have a clear view of the sky. e
rst time a user powers on the Handheld, the GPS x can take up to a maximum of 20 minutes to obtain.
Enable GPS.
To manually enable GPS, go to the Options menu. Select
Handheld | Enable GPS | On. Click Apply. When GPS is
xed, a signal strength icon with green bars will appear. If
the bars are black, then no GPS signal is found.
Turn on/off GPS.
e GPS consumes battery power and can be turned o to
conserve battery life. To manage the GPS, go to the Options
| Handheld | GPS menu and select On or O.
To display GPS units on screen, go to the Options | Units
menu and select GPS Lati and GPS Long. When units are
selected, GPS data is displayed on screen only if the GPS is
turned on.
If the Handheld is stored for more than 10 days without
batteries installed, then the user will need to re-enter the
date and time. Additionally, it will take longer for the unit
to obtain a new GPS x.
pg | 50
Page 51

KOR Software
4.1
Users interface with the EXO sondes and handheld via KOR soware. Once the soware is installed and
a device is connected to a computer or an EXO handheld, launch the KOR soware. (KOR Installation
instructions, see section 2.8.)
Navigation
Both versions of KOR—Desktop KOR for computers and
KOR for the EXO handheld—have the same basic menu
structure. e main menu items are:
Run: is menu is used to display live data from the EXO
sonde either in numeric or graphical display.
Calibrate: is menu is used to calibrate the sensors
installed in the EXO sonde, aer the sonde is connected.
Deploy: Go to Deploy to set up the EXO sonde for logging
deployments. Settings such as logging interval and SDI12 congurations are in this menu, as well as starting and
stopping autonomous logging on the sonde.
Sites: Used to manage sites, this optional menu helps users
create site detail that may be associated with les logged in
the sonde.Not available now; future functionality.
Data: is menu enables le transfers from the EXO sonde
or handheld, and can also be used without a sonde to view
and export data les that were previously transferred to the
desktop or handheld.
Options: Application preferences, sonde settings, and
soware and rmware updates can be accessed through this
menu. e user can change display units here.
Connections: is menu allows the user to connect
to other sondes and devices, identify which probes are
installed in which ports, and update Bluetooth settings.
Help: is page links to support resources for using KOR.
Status icons: e icons in the top right of the KOR window
are information-only displays. e white box shows the
connected device by serial number and name, and the icons
show if an EXO sonde is connected and if it is currently in
logging mode. Check mark means it is and X means it is not.
pg | 51
Page 52

KOR Software
4.2
Run Menu
e Run menu displays real-time water quality data in numeric or graph formats, and has three main
submenus.
Dashboard
is real-time display shows data from connected devices.
e data appears in a default order of parameters in the
list. In the RUN menu, data is automatically buered, up to
1000 points, for all parameters that load into memory.
Capture Data: Use the Capture Data button to save a
snapshot of the data buer to the computer. e captured
data is automatically saved in the location specied in the
Settings submenu.
Wipe Sensors: In the Dashboard menu, it is possible to
manually activate the central wiper if the EXO2 sonde
is equipped with one. is feature can be helpful when
transferring the sensors into liquid; the wiper can help
remove any bubbles that may be trapped at the sensor faces.
Note: Menu functionality is the same, although visual display
dierences are found between KOR’s Desktop version (top) and
Handheld version (bottom).
Graph
is real-time display will graph one or two parameters
from the attached EXO device. e parameters are chosen
from the drop-down menu above the plot area. Only
parameters currently active in the attached device will be
available for plotting.
It is important to note the scale when viewing real-time
data in Graph mode. Due to the precise nature of EXO
sensors, very small micro-changes are visible in the graph.
• Auto-scaling enables KOR to best t data into the
available window, even if the Y-axis extremes vary by less
than a unit.
• To manually scale the plot, rst deselect the Autoscale
button(s), then click the upper-most and bottom-most
numbers on either Y-axis.
pg | 52
Page 53

Capture
Data
Clear
Buffer
Advanced
Plot Tools
Clear Buer: As in the Dashboard, the data buer can
manually be saved to a le using the Capture Data button.
Alternatively the buer data can be cleared using the Clear
Buer button. Once the buer is cleared, it cannot be
recovered.
Advanced Plot Tools are available to manipulate the graph.
Explore these features by clicking either of the small plot
lines in the upper right corner immediately above the plot
to reveal the submenus.
Settings
e Settings menu denes the preferences for the RUN
mode. Plot line colors and width can be chosen, as well
as the default plot parameters. While all parameters are
available to set as default, the connected device must have
the corresponding sensor installed in order to plot the data.
File Mode: When using the Capture Data button, data
will be saved to a le. When the le mode is set to NEW, a
new data le will be created. When the le mode is set to
Append, subsequent data is captured into the same le.
Log Mode: Controls the amount of data saved to a le.
ALL data sends the entire real-time data buer (up to 1000
points for every parameter), while Last Point records a
single data set (1 point for every parameter).
Sample Interval: is option corresponds to the refresh rate
of the graph and dashboard. 1 sample per second (1 Hz)
is typical for most real-time display; once per second new
readings are posted to the buer and updated on the display.
e sampling rate on the real-time display is limited to 4
samples per second (4 Hz) because of the processing eort
of transferring the information to the PC.
File Prex: is prex is the le name that will appear at
the beginning of the captured data le. KOR automatically
applies a unique identier name on all les generated. e
user can change this setting, but the le prex allows users
to give the captured le a name.
Graph Type: Choose between Time Series or Proling
graph displays. For future functionality; not active yet.
Default View: e Default View allows the user to choose
between Dashboard or Graph as the default display when
KOR automatically opens the Run menu.
Apply: When a eld is edited in the Settings menu, the user
must click the Apply button to commit those changes. If you
edit a eld, then attempt to navigate away, a warning box
appears to remind you to apply or discard your changes.
pg | 53
Page 54

KOR Software
4.3
Calibrate Menu
is menu is the main interface for calibrating EXO sensors. Calibration and verication settings will vary
by sensor. A device must be connected to access the Calibrate menu.
For detailed calibration procedures for individual sensors, reference Section 5 Calibration.
Calibration menu overview
In the Calibrate menu, the list of installed sensors is shown
on the le side of the window. If your sonde is congured
with a depth sensor, Port D depth also appears in the list.
Sensor calibration menu
Select a sensor from the list to bring up a sensor-specic
menu of parameters. For example, selecting ODO (optical
dissolved oxygen) from the list, brings up a menu for
the enabled parameters ODO % sat and ODO mg/L. (To
change the enabled parameters, go to the Options | Units
menu.)
Click on a parameter to bring up the sensor-specic
calibration menu. e manufacturer recommended default
calibration parameters are in bold.
A typical calibration window shows 1, 2, or 3 calibration
points, depending on the sensor. If the sensor supports
only a single calibration point, then the other calibration
points are not active (grayed out).
Temperature: is eld displays current temperature, if a
conductivity/temperature sensor is installed. If no sensor is
installed, user can input data into this eld.
Barometer: Displays for DO calibrations only.
Standard Value: User-input eld for the calibration
setpoint based on the value of the standard being used.
pg | 54
Page 55

Type : Optional eld for type of standard being used. Prepopulated for some calibrations; user-input eld for other
calibrations.
Manufacturer: Optional eld to record manufacturer
of calibration standard used. is data is logged in the
calibration worksheet.
Lot number: Optional eld for calibration standard lot
number, used for traceability purposes.
Advanced calibration menu
Each sensor calibration menu has an Advanced button to
access advanced features for the specic parameter. Unique
sensor options include TSS input for Turbidity and sensor
cap coecients for DO.
Uncalibrate
e Uncalibrate function returns the probe back to
factory calibration settings. Users may select this for
troubleshooting if a calibration process on probe is not
working correctly.
Calibrating multiple sensors
To calibrate multiple sensors of the same type concurrently,
install all the sensors in the sonde. In the Calibration menu,
click on the sensor, and new options are available in the
second menu for calibrating ALL like sensors.
Follow the calibration instructions in KOR to calibrate
all the sensors. Calibrations occur one aer the other, not
simultaneously. Sensors are turned on one at a time so the
user can validate each sensor’s reading and to avoid the
possibility of interference from the other sensors.
Once all like sensors have been calibrated, they can be
removed from the sonde and installed in other EXO sondes.
e sensor will retain its calibration.
Note: Menu functionality is the same, although visual display
dierences are found between KOR’s Desktop version (top) and
Handheld version (bottom), this page and previous page.
pg | 55
Page 56

KOR Software
4.4
Deploy Menu
e Deploy menu is used mainly to congure an EXO sonde to collect unattended data and to manage
deployment templates. is menu is dynamic based on the mode of the attached device. Two or three
submenu options are available: Read Current Settings, Open a Template, and, if a connected sonde is logging,
a Stop Deployment button.
Read current sonde settings
is menu scans the attached device and summarizes its
current conguration, including battery life, sample count
and when the next sample will be taken. e user can view the
conguration, edit the conguration, or apply a saved template.
When reading the current sonde settings, KOR communicates
with the EXO and performs a number of system checks,
including a date and time check. If the sonde clock and the
computer clock dier, then KOR noties the user.
Edit: Edit the existing settings using the Edit button.
Deploy: Redeploy the sonde by clicking the Deploy button,
with these options:
• Start logging now. For example, a rst sample logs at
11:32:31, and with a 15-minute logging interval the next
sample will log at 11:47:31.
• Sync logging at next even interval. For example, a rst
sample logs at 00:00:00, and with a 15-minute logging
interval the next sample will log at 00:15:00, then 00:30:00,
00:45:00, etc. is set-up is typical. Logged data will be
uniform.
• Set a custom start time. Choose the start date and time, which
can vary from minutes to days in the future, then click the Apply
button to prepare the sonde for deployment. Setting a start time
in the past causes the sonde to start logging immediately.
• Apply or Cancel. Click the Apply button to apply the edits
to the settings. Or click the Cancel button to update the
sonde settings for SDI-12 but not actually start a log le.
Open a template
is submenu opens saved template les on the computer
for conguration settings. Deploy immediately by opening
default templates for 15-minute and one-hour logging
intervals, which are stored in the KOR-EXO | Deployment
Files folder located in the Program Files folder on the
computer.
Template Edit: Open, edit, apply and save a template with a
new name before deploying to the sonde.
pg | 56
Page 57

Stop deployment
is Stop Deployment button appears when an attached
EXO device is actively logging. Aer stopping a
deployment, the button disappears and the icon in the
upper right changes state to indicate the sonde is not
actively logging data.
Advanced sampling and logging
Access the following functions in the in the Deploy | Open
Template | Edit Template menu and click on the Advanced
tab.
Logging Intervals
When deploying a sonde, data is logged and time-stamped
at a routine sampling interval. A typical sampling interval
for unattended logging is 15 minutes. If the sonde logs
at 00:15:00, the sonde will wake up early to activate the
sensors and start processing data. Typically this will be 1215 seconds before the time-stamp. If an averaging interval
were activated, then the sonde would wake up 15 seconds
early plus the averaging interval to start averaging the data.
Samples Per Wipe - Wiping Interval
In most deployments the user will choose to use the EXO2 central wiper to wipe the sensors preceding each
logging interval. We recommend a wiping interval of 1 for 15-minute and 30-minute sampling intervals; 1
wipe will occur just prior to a sample being taken. Set the wiping interval to 2 and one wipe will occur every
other sample. If you have a short sampling interval, such as 5 minutes, and biofouling is not aggressive, then
you may not need to wipe the sensors prior to every sampling interval. In this case, you can set the wiping
interval to 4, in which case it will wipe every fourth time a sample is taken, or approximately every 20 minutes.
is action can help conserve battery life.
Setting Samples Per Wipe to 0 will disable the central wiper.
Sampling Rates
e sensors output data to the EXO sonde in real time, this data transfer rate varies by sensor and processing
conditions but generally it can be assumed the sensor transfers data to the sonde twice a second (2 Hz). In
high speed unattended sampling applications, like vertical proling, the sonde can be deployed to log data as
fast as 4 times a second (4 Hz). e user can set the sampling interval, and the real time transfer between the
sensors and sonde will automatically adjust to an appropriate output rate. e user can not manually control
the output rate of the sensors themselves.
Sampling rates can vary signicantly depending on application, and a sampling rate will have a signicant
impact on memory usage and battery consumption. An EXO2 sonde with a full payload can be expected to
log more than 90 days at a 30-minute sampling interval, but the same sonde set to prole at 4 Hz (four times
pg | 57
Page 58

per second) will have battery power for only one day. An estimate of this life is provided in the deployment
summary screen, and should be considered when setting sampling intervals.
Burst Sampling
Burst sampling allows the user to collect a set of data at each logging interval. Activate Burst Sampling by
clicking on Burst in the Logging Mode area of the Template Edit menu. en select a time duration between
1 and 300 seconds. Data will be collected at a rate of 2 Hz during the specied duration. is data set will
allow users to perform advanced data analysis and post processing. However, note that this increased data
in the logged le may more rapidly ll the internal memory of the data logger.
Adaptive Logging
Adaptive or Event Logging allows the user to select one or two sensors as triggers for a higher resolution
logging interval. e user can set the trigger to activate above or below a pre-determined threshold level
for the given sensor. Activate the Adaptive Logging feature by clicking the box next to Adaptive Logging.
Enter values for the logging interval and duration elds. en select a trigger sensor for Parameter 1 from
the drop-down list, set the Mode to Above, Below or O, and set the threshold value. Repeat this process for
Parameter 2, if desired.
pg | 58
Page 59

4.5
KOR Software
Sites Menu
Used to manage sites, this optional menu helps users create site detail that may be associated with les logged
in the sonde. Not yet implemented in the rst version(s) of KOR.
KOR is a dynamic soware platform subject to additional development and future improvements. Soware
menus and features are subject to change.
pg | 59
Page 60

KOR Software
4.6
Data Menu
e Data menu is used to transfer les from the sonde or handheld and manage data les on a local computer.
e Transfer function will only work when connected to a sonde.
Transfer
Clicking the Transfer submenu button initiates a scan of the
attached EXO and lists all les on the sonde.
Upload/copy les: Select les to upload by clicking a le name
in the list, clicking the Select All button, or clicking multiple les
by holding down the Control key. Selected les are highlighted in
blue. Aer les are selected, use the Selected button to copy the
le to the PC. Click the Latest button to copy the most recent le.
e uploaded le(s) are in binary format and are stored in the
Program Files\KOR-EXO\Data Files folder on the computer. See
Data Files & File Locations section 4.10 for more detail.
Delete les:
selected les. Select the les to be removed and use the Delete
Selected button to remove them permanently from the sonde.
Quick View: Click a le in the list, and then click the Quick View
button to view the last 50 data points of the le.
Storage space:
memory usage on the sonde. We recommend users keep a back-up
copy of the binary les on the sonde, unless storage space is needed.
Aer les have been copied to the PC, users can delete
e progress bar on the bottom will indicate
View/export
Use this submenu to review binary les transferred from the
sonde and export the binary data to dierent format.
View: Select and open a saved le from the Data Files pop-up
menu. Alternatively, click the Select File button to manually
open a le. When a le is loaded in KOR, you can view it one
point at a time using the arrow buttons or change to a graph
view using the Change View button.
Export: Click the Export Data button to export les to Excel
format or delimited text le. For Excel format, an Excel
spreadsheet automatically opens with the data. Save other
open les in Excel rst, or the export will not work.
Settings
is submenu allows the user to set the default le location,
export format, and data display formatting.
View calibration worksheets
is submenu allows the user to open and view saved Calibration
Worksheets from the Calibration Files folder on the computer.
pg | 60
Page 61

KOR Software
4.7
Options Menu
Many preferences, settings, and updates for KOR can be accessed through the Options menu.
Smart QC: KOR performs quality checks on each
connected sonde and sensor and provides an overall
Network QC Score.
Check mark: OK.
X: Warning that part or all of the system is out of
specication ranges.
Question mark: Unknown, not enough data to
determine QC score.
Exclamation point: Caution. While OK now, one or
more parts of the system is getting close to being out of
specication.
Sonde: Bluetooth pin number, activate Bluetooth, sonde
ID/name, sonde date and time, battery type, and fault bit
eld.
KOR soware on the EXO Handheld also has a Handheld
submenu to set language, date and time, power, GPS,
sound volume, Bluetooth pin number, and hibernate/sleep
preferences on the Handheld itself.
User: Select Language setting, Idle Timeout setting, and
Time Zone and Time Format preferences.
Units: Customize display units/parameters for each sensor,
plus adjust wiper position and sonde cable and battery
readings. While the sonde and sensors record data in xed
formats, KOR can adjust the displayed units. For example,
the Temperature sensor outputs degrees C to the sonde;
however the display units can be set to degrees F, and the
temperature reading is converted. Aer the units are set, data
viewed on the Run menu will be displayed in this format.
Firmware: Check and update rmware on connected
devices. KOR automatically searches for connected sondes,
sensors, and handhelds and loads the table with sensor
names, serial numbers and current rmware revisions. To
update rmware, see instructions in section 6.4 and 6.7.
Calibration: To speed the calibration process, users can
set default calibration settings for individual sensors and
parameters here. Click the Apply button and changes take
eect immediately.
Sync with Handheld: Upload les from Handheld to PC.
See section 3.7.
pg | 61
Page 62

KOR Software
4.8
Connections Menu
is menu allows the user to connect to other sondes and devices, identify which probes are installed in
which ports, and update Bluetooth settings.
Rescan
is submenu allows the user to refresh and initiate
connections to hard-wired devices, search for Bluetooth
connections, or disconnect.
To reconnect to a sonde, wait for KOR to scan the devices,
then select a device from the list. Click Connect.
Map
is menu allows the user to view serial numbers and the
ports assigned to the sensors. As part of future functionality,
this menu will also display other sondes and sensors
connected to the EXO network.
Settings
is submenu allows the user to control Bluetooth settings
including PIN number and auto-scanning.
pg | 62
Page 63

KOR Software
4.9
Help Menu
is menu connects the user to documentation resources for using KOR soware and the EXO products.
pg | 63
Page 64

KOR Software
4.10
Data Files & File Locations
KOR soware is installed onto your computer’s default hard drive, which is typically C:\ on most Windowsbased PCs. e KOR program is then placed into the program le directory. On XP and Windows 7 32-bit
systems, this folder is simply called Program Files. On 64-bit systems KOR is placed in the Program File (x86)
folder. e two most common le paths are:
C:\Program Files\KOR-EXO\ (XP and 32-bit Windows 7)
C:\Program Files (x86)\KOR-EXO\ (64-bit Windows 7)
Data folders
Data Files: ese are the binary data les from EXO, which
are only accessible via KOR. We strongly recommend you
maintain all binary data les in this folder and also create a
back-up copy.
Deployment Files: Templates for deployments are stored
here. ey may be moved to another computer to provide
consistent deployments across your organization.
Site Files: ese contain the site details used by KOR. ey
may be copied to another computer running KOR.
Do not edit, move, or rename other les. is could damage
KOR and aect system reliability.
Data files
Templates, binary data les, data les and conguration
settings are in the KOR-EXO | Data Files folder. You can
navigate to the KOR-EXO folder to access template and data
les, if you want to copy them to another computer.
Data file names
Data les are given unique names to ensure no duplication. e le name structure is:
AAAAAAAA_YYMBBBBBB_MMDDYY_HHMMSS.bin
Sample: EXODT_12N768062_033012_182618.bin
AAAAAAAA: User-dened le prex up to 8 characters, set in the deployment template or Run | Settings menu.
YYMBBBBBB: EXO sonde serial number. YY represents the year the sonde was manufactured, M
corresponds to the month of manufacture, and BBBBBB is a unique sequential lot number. For live data
capture les, the serial number is a number assigned to the instance of Desktop KOR or the serial number
of the Handheld.
MMDDYY: MM is the month the data le was created, DD is the day of the month, and YY is the year.
HHMMSS: UTC time stamp where HH is 24 hour the le was created, MM the minute, and SS the second.
.bin: binary le extension. To obtain a delimited le format or Excel format, see section 4.6.
pg | 64
Page 65

KOR Software
4.11
SDI-12
e sonde can be connected to an SDI-12 bus using a Signal Output Adapter (SOA). e SOA provides the
necessary SDI-12 electrical interface and communicates to the sonde via the topside RS-485 interface. e
SOA will automatically recognize when a sonde is connected and retrieve the SDI-12 address and ID from
the sonde. e SDI-12 data parameter list is set by the user in the Deploy menu.
Sensor parameter codes
Temp
SpCond
Sal
pH
pH
Orp
Press
Depth
Battery
Turbidity
Date
Date
Date
C 1
µS/cm 7
ppt 12
mV 17
18
mV 19
psia 20
meters 22
Volts 28
NTU 37
D/M/Y 51
M/D/Y 52
Y/M/D 53
Time
Chlorophyll
Fluorescence
ODO%
ODO Conc+
BGA PC
HH:MM:SS 54
μg/L 193
% full scale 194
% 211
mg/L 212
RFU 216
pg | 65
Page 66

Calibration
5.1
Basic
EXO sensors (except temperature) require periodic calibration to assure high performance. Calibration
procedures follow the same basic steps with slight variations for particular parameters. Conduct calibrations
in a temperature-controlled lab.
Calibration set-up
For accurate results, thoroughly rinse the EXO calibration cup
with water, and then rinse with a small amount of the calibration
standard for the sensor you are going to calibrate. Discard the
rinse standard, then rell the calibration cup with fresh calibration
standard. Fill the cup to approximately the rst line with a full
sensor payload or the second line with small sensor payload.
Volumes will vary, just make certain that the sensor is submerged.
Fill to line 2
Fill to line 1
Be careful to avoid cross-contamination with other standards.
Begin with a clean, dry probe installed on the EXO sonde. Install
the sonde guard over the probe(s), and then immerse the probe(s)
in the standard and tighten the calibration cup onto the EXO
sonde. We recommend using one sonde guard for calibration
procedures only, and another sonde guard for eld deployments.
is ensures a greater degree of cleanliness and accuracy for the
guard used in the calibration procedure.
Basic calibration in KOR software
Matching units
Click the Start Calibration button. is action initiates the probe’s calibration in the standard; initially the
data reported will be unstable and then they will move to stable readings. Click the Graph Data button to
compare the pre-cal and post-cal values in graph form. Users should conrm that the value is within their
acceptable margin of error. Once readings are stable, click Apply to accept this calibration point. Repeat the
process for each calibration point. Click Complete when all points have been calibrated.
A calibration summary appears with a QC score. View, export, and/or print the calibration worksheet. If a
calibration error appears, repeat the calibration procedure.
Go the Calibrate menu in KOR soware. is menu’s appearance
will vary depending on the sensors installed in the sonde. Select
the sensor you are going to calibrate from the list. Next select
the parameter for the sensor you are going to calibrate. Some
sensors have only one parameter option, while other sensors have
multiple options.
In the next menu, select a 1-, 2-, or 3-point calibration, depending
on your sensor. Enter the value of the standard you are using.
Check that the value you enter is correct and its units match
the units at the top of the menu (e.g., microSiemens versus
milliSiemens). You may also enter optional information for type
of standard, manufacturer of standard, and lot number.
pg | 66
Page 67

Calibration
4.45.2
Conductivity
Clean the conductivity cell with the supplied so brush before calibrating. Also, review the basic calibration
description on pg 65.
is procedure calibrates conductivity, specic conductance, salinity, and total dissolved solids.
Place the correct amount of conductivity standard into a clean and dry or pre-rinsed calibration cup. A
variety of standards are available based on the salinity of your environment. Select the appropriate calibration
standard for your deployment environment; we recommend using standards greater than 1 mS/cm (1000
μ
S/cm) for greatest stability.
Carefully immerse the probe end of the sonde into the solution, making sure the standard is above the vent
holes on the conductivity sensor. Gently rotate and/or move the sonde up and down to remove any bubbles
from the conductivity cell.
Allow at least one minute for temperature equilibration before proceeding.
In the Calibrate menu, select Conductivity and then a second menu will oer the options of calibrating
conductivity, specic conductance, or salinity. Calibrating any one option automatically calibrates the other
two parameters. Aer selecting the option of choice (specic conductance is normally recommended), enter
the value of the standard used during calibration. Be certain that the units are correct and match the units
displayed in the second window at the top of the menu.
Click Start Calibration. Observe the readings under Current and Pending data points and when they
are Stable (or data shows no signicant change for approximately 40 seconds), click Apply to accept this
calibration point.
- If the data do not stabilize aer 40 seconds, gently rotate the sonde or remove/reinstall the cal cup
to make sure there are no air bubbles in the conductivity cell.
Click Complete. View the Calibration Summary screen and QC score. Click Exit to return to the sensor
calibration menu, and then the back arrows to return to main Calibrate menu.
Rinse the sonde and sensor(s) in tap or puried water and dry.
pg | 67
Page 68

Calibration
5.3
Dissolved Oxygen
First review the basic calibration description on pg 65.
ODO % sat – 1-point
Place the sonde with sensor either (a) into a calibration cup containing about 1/8 inch of water which is
vented by loosening the threads or (b) into a container of water which is being continuously sparged with an
aquarium pump and air stone. Wait approximately 10 minutes before proceeding to allow the temperature
and oxygen pressure to equilibrate.
In the Calibrate menu, select ODO, then select ODO % sat. Calibrating in ODO % sat automatically calibrates
ODO mg/L and vice versa.
Enter the current barometric pressure in mm of Hg (Inches of Hg x 25.4 = mm Hg).
Note: Laboratory barometer readings are usually “true” (uncorrected) values of air pressure and can
be used “as is” for oxygen calibration. Weather service readings are usually not “true”, i.e., they are
corrected to sea level, and therefore cannot be used until they are “uncorrected”. An approximate
formula for this “uncorrection” (where the BP readings MUST be in mm Hg) is:
True BP = [Corrected BP] – [2.5 * (Local Altitude in above sea level/100)]
Click 1 Point for the Calibration Points. Enter the standard value (air saturated).
Click Start Calibration. Observe the readings under Current and Pending data points and when they
are Stable (or data shows no signicant change for approximately 40 seconds), click Apply to accept this
calibration point.
Click Complete. View the Calibration Summary screen and QC score. Click Exit to return to the sensor
calibration menu, and then the back arrows to return to main Calibrate menu.
mg/L – 1-point
Place the sonde with sensor in a container which contains a known concentration of dissolved oxygen in
mg/L and that is within ±10% of air saturation as determined by one of the following methods:
- Winkler titration
- Aerating the solution and assuming that it is saturated
- Measurement with another instrument
Carrying out DO mg/L calibrations at values outside the range of ±10 % of air saturation is likely to
compromise the accuracy specication of the EXO sensor.
In the Calibrate menu, select ODO, then select ODO mg/L. Calibrating in ODO mg/L automatically
calibrates ODO % sat and vice versa.
Click 1 Point for Calibration Points. Enter the known mg/L concentration for the standard value. Click Start
Calibration. Observe the readings under Current and Pending data points and when they are Stable (or data
shows no signicant change for approximately 40 seconds), click Apply to accept this calibration point. Click
Complete.
Rinse the sonde and sensor(s) in tap or puried water and dry.
pg | 68
Page 69

ODO % sat or mg/L – 2-point (or zero point)
Normally it is not necessary to perform a 2-point calibration for the DO sensor, and the procedure is not
recommended unless (a) you are certain that the sensor does not meet your accuracy requirements at low
DO levels and (b) you are operating under conditions where you are certain to be able to generate a medium
which is truly oxygen-free.
For ODO % sat, calibrate your sonde at zero oxygen and in water-saturated air or air-saturated water. For
ODO mg/L, calibrate your sonde at zero oxygen and a known concentration of oxygen within ±10% of airsaturation. e key to performing a 2-point calibration is to make certain that your zero-oxygen medium is
truly oxygen-free:
- If you use nitrogen gas for the zero-point calibration, make certain that the vessel you use has a
small exit port to prevent back diusion of air and that you have completely purged the vessel before
conrming the calibration.
- If you use sodium sulte solution for the zero-point calibration, prepare the solution at a
concentration of approximately 2 g/L at least two hours prior to use and keep it sealed in a bottle
which does not allow diusion of oxygen through the sides of the container. Transfer the sodium
sulte solution rapidly from its container to the calibration cup, ll the cup as full as possible with
solution to minimize head space, and seal the cup to the sonde to prevent diusion of air into the
vessel.
Place the sonde with DO and temperature sensors in a zero-oxygen medium.
In the Calibrate menu, select ODO, then select either ODO % sat or ODO mg/L.
Click 2 Point for the Calibration Points. Enter Zero Point as the value of the rst standard.
Click Start Calibration. Observe the readings under Current and Pending data points and when they
are Stable (or data shows no signicant change for approximately 40 seconds), click Apply to accept this
calibration point.
- If you used sodium sulte solution as your zero calibration medium, you must thoroughly remove
all traces of the reagent from the probes prior to proceeding to the second point. We recommend
that the second calibration point be in air-saturated water if you use sodium sulte solution.
Next place the sensors in the medium containing a known oxygen pressure or concentration and wait at
least 10 minutes for temperature equilibration. Click Proceed in the pop-up window. en enter either the
barometer reading in mm Hg (for ODO % sat) or the actual concentration of oxygen which was probably
determined from a Winkler titration (for ODO mg/L). Observe the readings under Current and Pending
data points and when they are Stable (or data shows no signicant change for approximately 40 seconds),
click Apply to accept this calibration point.
Click Complete. View the Calibration Summary screen and QC score. Click Exit to return to the sensor
calibration menu, and then the back arrows to return to main Calibrate menu.
Carrying out DO mg/L calibrations at values outside the range of ±10 % of air saturation is likely to
compromise the accuracy specication of the EXO sensor.
Rinse the sonde and sensor(s) in tap or puried water and dry.
pg | 69
Page 70

Calibration
5.4
Depth
Note: is calibration option is available only if your sonde is equipped with an integral depth sensor.
For the depth calibration, make certain that the depth sensor module is in air and not immersed in any
solution. Also, review the basic calibration description on pg 65.
In the Calibrate menu, select Port D-Depth, then select Depth from the second menu.
Click 1 Point for the Calibration Points. Enter 0 or a known sensor oset.
Click Start Calibration. Observe the readings under Current and Pending data points and when they
are Stable (or data shows no signicant change for approximately 40 seconds), click Apply to accept this
calibration point. is process zeros the sensor with regard to current barometric pressure.
Click Exit to return to the sensor calibration menu, and then the back arrows to return to main Calibrate
menu.
For best performance of depth measurements, users should ensure that the orientation of the sonde remains
constant while taking readings. Keep the sonde still and in one position while calibrating.
Use the Advanced menu to select if a sonde will be mounted
in a moving/proling deployment instead of a xed location.
You can also enter latitude and longitude in the Advanced
menu.
pg | 70
Page 71

Calibration
5.5
pH
2-point
Most environmental water has a pH between 7 and 10. erefore, unless you anticipate a pH of less than 7
for your deployment application, we recommend a 2-point calibration using pH 7 and pH 10 buers.
Review the basic calibration description on pg 65.
Pour the correct amount of pH 7 buer/standard in a clean and dry or pre-rinsed calibration cup. Carefully
immerse the probe end of the sonde into the solution, making sure the sensor’s glass bulb is in solution by at
least 1 cm. Allow at least 1 minute for temperature equilibration before proceeding.
In the Calibrate menu, select pH or pH/ORP, then select pH.
Click 2 Point for the Calibration Points. Enter 7 as the value of the rst standard and 10 as the value of the
second standard.
- Observe the temperature reading above the standard value. e actual pH value of all buers varies
with temperature. Enter the correct value from the bottle label for your calibration temperature for
maximum accuracy. For example, the pH of one manufacturer’s pH 7 Buer is 7.00 at 25˚C, but 7.02
at 20˚C.
- If no temperature sensor is installed, user can manually update temperature by entering a value.
Click Start Calibration. Observe the readings under Current and Pending data points and when they
are Stable (or data shows no signicant change for approximately 40 seconds), click Apply to accept this
calibration point.
Rinse the sonde in water and dry the sonde. Pour the correct amount of an additional pH buer standard
into a clean, dry or pre-rinsed calibration cup, and carefully immerse the probe end of the sonde into the
solution. Allow at least 1 minute for temperature equilibration before proceeding.
Click Proceed in the pop-up window. Observe the readings under Current and Pending data points and
when they are Stable (or data shows no signicant change for approximately 40 seconds), click Apply to
accept this calibration point. (It is best not to touch the sonde while stabilizing).
Click Complete. View the Calibration Summary screen and QC score. Click Exit to return to the sensor
calibration menu, and then the back arrows to return to main Calibrate menu.
Rinse the sonde in tap or puried water and dry the sonde.
3-point
Select the 3-point option to calibrate the pH probe using three calibration solutions. In this procedure, the
pH sensor is calibrated with a pH 7 buer and two additional buers. e 3-point calibration method assures
maximum accuracy when the pH of the media to be monitored cannot be anticipated. e procedure for
this calibration is the same as for a 2-point calibration, but the soware will prompt you to proceed to a third
pH buer to complete the 3-point procedure.
pg | 71
Page 72

Calibration
5.6
ORP
Review the basic calibration description on pg 65.
Pour the correct amount of standard with a known oxidation reduction potential value (we recommend
Zobell solution) in a clean and dry or pre-rinsed calibration cup. Carefully immerse the probe end of the
sonde into the solution.
In the Calibrate menu, select pH/ORP, then select ORP mV.
Click Start Calibration. Observe the readings under Current and Pending data points and when they
are Stable (or data shows no signicant change for approximately 40 seconds), click Apply to accept this
calibration point.
Do not leave sensors in Zobell solution for a long time. A chemical reaction occurs with the copper
on the sonde (sonde bulkhead, central wiper assembly, copper tape). While the reaction does not impact
calibration, it will degrade the sonde materials over time. Discard the used standard.
Click Complete. View the Calibration Summary screen and QC score. Click Exit to return to the sensor
calibration menu, and then the back arrows to return to main Calibrate menu.
Rinse the sonde in tap or puried water and dry the sonde.
pg | 72
Page 73

Calibration
4.45.7
Turbidity
Before calibrating, be certain that the probe is clean and free of debris. Solid particles, particularly those
carried over from past deployments, will contaminate the standards during your calibration protocol and
cause either calibration errors and/or inaccurate eld data. Use a clean, spare sonde guard. Also, review the
basic calibration description on pg 65.
For proper calibration, you must use standards that have been prepared according to details in Standard
Methods for the Treatment of Water and Wastewater (Section 2130 B). Acceptable standards include (a)
formazin prepared according to Standard Methods; (b) dilutions of 4000 NTU formazin concentrate
purchased from Hach; (c) Hach StablCal
AEPA standards prepared specically for the EXO turbidity sensor by the manufacturer.
2-point
Pour the correct amount of 0 NTU standard (clear deionized or distilled water) into the calibration cup.
Immerse the probe end of the sonde into the water.
In the Calibrate menu, select Turbidity, then select Turbidity FNU.
Click 2 Point for the Calibration Points. Enter 0 FNU for rst standard value and 124 FNU for second
standard value. (0 must be calibrated rst.)
TM
standards in various NTU denominations; and (d) AMCO-
- If the water to be evaluated is known to be low in turbidity, an appropriate choice of standards
might be 0 and 12.4. However, for general purpose measurements an appropriate choice of standards
is usually 0 and 124.
Click Start Calibration. Observe the readings under Current and Pending data points. While stabilizing,
click the Wipe Sensors button to activate the wiper to remove any bubbles. When data are Stable (or data
shows no signicant change for approximately 40 seconds), click Apply to accept this calibration point.
- If the temperature of your eld site is substantially dierent from the lab temperature, allow the
sensor to sample for 3-5 minutes at each calibration point before accepting it. is step ensures the
best possible temperature compensation when deployed.
Next place the sensors in the second calibration standard. Click Proceed on the pop-up window. Observe
the readings under Current and Pending data points. While stabilizing, click the Wipe Sensors button to
activate the wiper to remove any bubbles. When data are Stable (or data shows no signicant change for
approximately 40 seconds), click Apply to accept this calibration point.
Click Complete. View the Calibration Summary screen and QC score. Click Exit to return to the sensor
calibration menu, and then the back arrows to return to main Calibrate menu.
Rinse the sonde in tap or puried water and dry the sonde.
3-point
Select the 3-point calibration option for maximum accuracy over a wider range. As for the 2-point procedure,
the rst standard must be 0 FNU. Because of the linearity characteristics of the sensors, we recommend that
the other two standards have turbidity values of 124 and 1010 FNU. However, the user can select any values
that are deemed appropriate. e procedure for this calibration is the same as for a 2-point calibration, but
the soware will prompt you to proceed to an additional solution to complete the 3-point procedure.
pg | 73
Page 74

Calibration (Chl + BGA-PC)
4.45.8
Total Algae
Chlorophyll
is procedure calibrates Chlorophyll RFU or Chlorophyll μg/L. If the user has both units selected, then this
procedure must be performed twice, once for each unit, to completely calibrate the parameter.
For 2-point calibrations, one standard must be clear water (0 μg/L), and this standard must be calibrated
rst. e other standard should be in the range of a known chlorophyll content of the water to be monitored.
Two general types of standards can be used: (a) phytoplankton suspensions of known chlorophyll content,
determined by employing the extractive analysis procedure described in Standard Methods for the
Examination of Water and Wastewater, or by analyzing the suspension in situ using a laboratory uorometer,
and (b) dye solutions whose uorescence can be correlated to that of chlorophyll.
For option (b), we recommend using a 625 μg/L Rhodamine WT dye solution (for detailed instructions, see
section 5.10), and the solution is used in the calibration steps below.
µ
g/L – 1- or 2-point
is procedure will zero your uorescence sensor and use the default sensitivity for calculation of chlorophyll
concentration in μg/L, allowing quick and easy uorescence measurements that are only semi-quantitative
with regard to chlorophyll. However, the readings will reect changes in chlorophyll from site to site, or over
time at a single site.
Pour the correct amount of clear deionized or distilled water into the calibration cup. Immerse the probe
end of the sonde in the water.
In the Calibrate menu, select BGA-PC/Chlor, then select Chl μg/L. Select either a 1- or 2-point calibration.
Enter 0 for rst standard value and 66 for second standard value.
Click Start Calibration. Observe the readings under Current and Pending data points. While stabilizing,
click the Wipe Sensors button to activate the wiper to remove any bubbles. When data are Stable (or data
shows no signicant change for approximately 40 seconds), click Apply to accept this calibration point.
Next place the sensors in the Rhodamine WT standard. Click Proceed on the pop-up window. Observe
the readings under Current and Pending data points. While stabilizing, click the Wipe Sensors button to
activate the wiper to remove any bubbles. When data are Stable (or data shows no signicant change for
approximately 40 seconds), click Apply to accept this calibration point.
Click Complete. View the Calibration Summary screen and QC score. Click Exit to return to the sensor
calibration menu, and then the back arrows to return to main Calibrate menu.
Rinse the sonde in tap or puried water and dry the sonde.
RFU – 1- or 2-point
RFU is a percent full scale output; it outputs relative uorescence from 0-100%. is calibration procedure is
recommended if you are also using grab samples to post-calibrate in vivo chlorophyll readings.
e sonde will report relative values of uorescence in the sample being measured. ese values can be
converted into actual chlorophyll concentrations in μg/L by using a post-calibration procedure, aer the
pg | 74
Page 75

chlorophyll content of grab-samples taken during a deployment has been analyzed in a laboratory. is
determination can involve conducting the extractive analysis procedure described for chlorophyll in Methods
for the Examination of Water and Wastewater or by carrying out an in situ measurement of chlorophyll using
a commercial benchtop uorometer.
Pour the correct amount of clear deionized or distilled water into the calibration cup. Immerse the probe
end of the sonde in the water.
In the Calibrate menu, select BGA-PC/Chlor, then select Chl RFU. Select either a 1- or 2-point calibration.
Enter 0 for rst standard value and 16.4 for second standard value.
Click Start Calibration. Observe the readings under Current and Pending data points. While stabilizing,
click the Wipe Sensors button to activate the wiper to remove any bubbles. When data are Stable (or data
shows no signicant change for approximately 40 seconds), click Apply to accept this calibration point.
Next place the sensors in the Rhodamine WT standard. Click Proceed on the pop-up window. Observe
the readings under Current and Pending data points. While stabilizing, click the Wipe Sensors button to
activate the wiper to remove any bubbles. When data are Stable (or data shows no signicant change for
approximately 40 seconds), click Apply to accept this calibration point.
Click Complete. View the Calibration Summary screen and QC score. Click Exit to return to the sensor
calibration menu, and then the back arrows to return to main Calibrate menu.
Rinse the sonde in tap or puried water and dry the sonde.
Blue-green Algae
μ
is procedure calibrates BGA RFU or BGA
must be performed twice, once for each unit, to completely calibrate the parameter.
For the 2-point calibration, one of the standards must be clear water (0 μg/L), and this standard must
be calibrated rst. e other standard should be in the range of the suspected BGA-PC content at the
environmental site. Two general types of standards can be used: (a) phytoplankton suspensions of known
BGA-PC content, and (b) dye solutions whose uorescence can be correlated to that of BGA-PC. e user
is responsible for determining the BGA-PC content of algal suspensions by using standard cell counting
techniques.
For option (b), we recommend using a 625 μg/L Rhodamine WT dye solution (for detailed instructions, see
section 5.10), and the solution is used in the calibration steps below.
µ
g/L – 1- or 2-point
is procedure will zero your uorescence sensor and use the default sensitivity for calculation of
μ
phycocyanin-containing BGA in
semi-quantitative with regard to BGA-PC. However, the readings will reect changes in BGA-PC from site
to site, or over time at a single site.
g/L, allowing quick and easy uorescence measurements that are only
g/L. If the user has both units selected, then this procedure
Pour the correct amount of clear deionized or distilled water into the calibration cup. Immerse the probe
end of the sonde in the water.
pg | 75
Page 76

In the Calibrate menu, select BGA-PC/Chlor, then select BGA μg/L. Select either a 1- or 2-point calibration.
Enter 0 for rst standard value and 10.4 for second standard value.
Click Start Calibration. Observe the readings under Current and Pending data points. While stabilizing,
click the Wipe Sensors button to activate the wiper to remove any bubbles. When data are Stable (or data
shows no signicant change for approximately 40 seconds), click Apply to accept this calibration point.
Next place the sensors in the Rhodamine WT standard. Click Proceed on the pop-up window. Observe
the readings under Current and Pending data points. While stabilizing, click the Wipe Sensors button to
activate the wiper to remove any bubbles. When data are Stable (or data shows no signicant change for
approximately 40 seconds), click Apply to accept this calibration point.
Click Complete. View the Calibration Summary screen and QC score. Click Exit to return to the sensor
calibration menu, and then the back arrows to return to main Calibrate menu.
Rinse the sonde in tap or puried water and dry the sonde.
RFU – 1- or 2-point
RFU is a percent full scale output; it outputs relative uorescence from 0-100%. is calibration procedure
is recommended if you are also using grab samples to post-calibrate in vivo algae readings.
Pour the correct amount of clear deionized or distilled water into the calibration cup. Immerse the probe
end of the sonde in the water.
In the Calibrate menu, select BGA-PC/Chlor, then select BGA RFU. Select either a 1- or 2-point calibration.
Enter 0 for rst standard value and 10.4 for second standard value.
Click Start Calibration. Observe the readings under Current and Pending data points. While stabilizing,
click the Wipe Sensors button to activate the wiper to remove any bubbles. When data are Stable (or data
shows no signicant change for approximately 40 seconds), click Apply to accept this calibration point.
Next place the sensors in the Rhodamine WT standard. Click Proceed on the pop-up window. Observe
the readings under Current and Pending data points. While stabilizing, click the Wipe Sensors button to
activate the wiper to remove any bubbles. When data are Stable (or data shows no signicant change for
approximately 40 seconds), click Apply to accept this calibration point.
Click Complete. View the Calibration Summary screen and QC score. Click Exit to return to the sensor
calibration menu, and then the back arrows to return to main Calibrate menu.
Rinse the sonde in tap or puried water and dry the sonde.
pg | 76
Page 77

Calibration
4.45.9
fDOM
is procedure calibrates fDOM RFU or fDOM QSU/ppb. If the user has both units selected, then this
procedure must be performed twice, once for each unit, to completely calibrate the parameter.
For 2-point calibrations, the rst standard must be clear water (0 μg/L). e second standard should be a 300
μ
g/L quinine sulfate solution. (For detailed instructions for mixing this solution, see section 5.10.)
Do not leave sensors in quinine sulfate solution for a long time. A chemical reaction occurs with the
copper on the sonde (sonde bulkhead, copper tape) that degrades the solution and causes it to dri.
QSU – 1- or 2-point
Pour the correct amount of clear deionized or distilled water into the calibration cup. Immerse the probe
end of the sonde in the water.
In the Calibrate menu, select fDOM, then select QSU/ppb. Select either a 1- or 2-point calibration. Enter 0
for rst standard value and 300 μg/L for second standard value.
Click Start Calibration. Observe the readings under Current and Pending data points, and when they are Stable
(or data shows no signicant change for approximately 40 seconds), click Apply to accept this calibration point.
Remove the central wiper from the EXO2 sonde before proceeding to the next step.
Next place the sensors in the correct amount of 300 μg/L quinine sulfate standard in the calibration cup. Click
Proceed on the pop-up window. Observe the readings under Current and Pending data points. While stabilizing,
click the Wipe Sensors button to activate the wiper to remove any bubbles. When data are Stable (or data shows
no signicant change for approximately 40 seconds), click Apply to accept this calibration point.
Click Complete. View the Calibration Summary screen and QC score. Click Exit to return to the sensor
calibration menu, and then the back arrows to return to main Calibrate menu.
RFU – 1- or 2-point
Pour the correct amount of clear deionized or distilled water into the calibration cup. Immerse the probe
end of the sonde in the water.
In the Calibrate menu, select fDOM, then select RFU. Select either a 1- or 2-point calibration. Enter 0 for
rst standard value and 100 RFU for second standard value.
Click Start Calibration. Observe the readings under Current and Pending data points, and when they are Stable
(or data shows no signicant change for approximately 40 seconds), click Apply to accept this calibration point.
Remove the central wiper from the EXO2 sonde before proceeding to the next step.
Next place the sensors in the correct amount of 300 μg/L quinine sulfate standard in the calibration cup. Click
Proceed on the pop-up window. Observe the readings under Current and Pending data points. While stabilizing,
click the Wipe Sensors button to activate the wiper to remove any bubbles. When data are Stable (or data shows
no signicant change for approximately 40 seconds), click Apply to accept this calibration point.
Click Complete. View the Calibration Summary screen and QC score. Click Exit to return to the sensor
calibration menu, and then the back arrows to return to main Calibrate menu.
Rinse the sonde in tap or puried water and dry the sonde. Discard the used standard.
pg | 77
Page 78

Calibration
5.10
Calibration Standards
Quinine Sulfate Solution for fDOM Sensor
Before using a quinine sulfate reagent (solid or solution) or sulfuric acid reagent, read the safety instructions
provided by the supplier. Take extra precautions when making dilutions of concentrated sulfuric acid, as this
reagent is particularly dangerous. Remember that only trained personnel should handle chemicals.
Preparation
Use the following procedure to prepare a 300 μg/L solution of quinine sulfate (300 QSU) that can be used to
calibrate the EXO fDOM sensor for eld use:
1. Purchase solid quinine sulfate dihydrate with a high purity (>99%). (Recommended supplier: Fisher Scientic
item #6119-70-6.) Purchase 0.1 N (0.05 M) sulfuric acid, to avoid the hazards of diluting concentrated
sulfuric acid to make this reagent. (Recommended supplier: Fisher Scientic item # AA35651K7.)
2. Weigh 0.100 g of solid quinine sulfate dehydrate and quantitatively transfer the solid to a 100-mL
volumetric ask. Dissolve the solid in about 50 mL of 0.05 M (0.1 N) sulfuric acid (H
the solution to the mark of the volumetric ask with additional 0.05 M sulfuric acid, and mix well by
repeated inversion. is solution is 1000 ppm in quinine sulfate (0.1%).
3. Transfer 0.3 mL of the 1000 ppm solution to a 1000 mL volumetric and then ll the ask to the top
graduation with 0.05 M sulfuric acid. Mix well to obtain a solution that is 300 μg/L (300 QSU).
4. Store the concentrated standard solution in a darkened glass bottle in a refrigerator to retard
decomposition. e dilute standard prepared in the previous step should be used within 5 days of
preparation and should be discarded immediately aer exposure to EXO’s metal components.
2SO4
), dilute
Degradation of quinine fluorescence by copper
Exposure of the dilute quinine sulfate solution to any copper-based component of the EXO sonde and sensors
(primarily the wiper assembly) will begin to degrade the solution signicantly within minutes. us, perform
your calibration as quickly as possible on immersion of the sensors into the quinine sulfate solution. Discard
the used standard. When quinine sulfate standards are required in the future, perform another dilution of the
concentrated solution.
Effect of temperature on fluorescence
e intensity of the uorescence of many dyes shows an inverse relationship with temperature. is eect
must be accounted for when calibrating the EXO fDOM sensor with Rhodamine WT. Enter the QSU
calibration value from the table below that corresponds to the temperature of the standard.
Temp (˚C)
30 96.4 18 101.8
28 97.3 16 102.7
26 98.2 14 103.6
24
22
20
QSU
99.1
100
100.9
Temp (˚C)
12
10
8
QSU
104.6
105.5
106.4
pg | 78
Page 79

Rhodamine WT Dye Solution for Total Algae Sensor
Read and follow all the safety instructions and MSDS documentation supplied with the dye before
proceeding. Remember that only trained personnel should handle chemicals.
Preparation
Use the following procedure to prepare a Rhodamine WT solution for use as a sensor stability check reagent
for the EXO Total Algae (Chlorophyll and Blue-green Algae) sensor:
1. Purchase Rhodamine WT dye in solution form, which can vary somewhat in nominal concentration.
Recommended supplier for a solution that is approximately 2.5% in Rhodamine WT:
Fluorescent FWT Red Dye (item #106023)
Kingscote Chemicals
3334 South Tech Blvd.
Miamisburg, OH 45342 USA
1-800-394-0678
2. Accurately transfer 5.0 mL of the Rhodamine WT solution into a 1000 mL volumetric ask. Fill the
ask to the volumetric mark with deionized or distilled water and mix well to produce a solution that
is approximately 125 mg/L of Rhodamine WT. Transfer this standard to a glass bottle and retain it for
future use.
3. Accurately transfer 5.0 mL of the solution prepared in the above step to a 1000 mL volumetric ask
and then ll the ask to the volumetric mark with deionized or distilled water. Mix well to obtain a
solution, which is 0.625 mg/L in water (a 200:1 dilution of the concentrated solution).
4. Store the concentrated standard solution in a glass bottle in a refrigerator to retard decomposition. e
dilute standard prepared in the previous step should be used within 24 hours of its preparation.
Discard the used standard. When Rhodamine standards are required in the future, perform another dilution
of the concentrated Rhodamine WT solution aer warming it to ambient temperature.
Effect of temperature on fluorescence
e intensity of the uorescence of many dyes shows an inverse relationship with temperature. is eect
μ
must be accounted for when calibrating the EXO Total-Algae sensor with Rhodamine WT. Enter the
g/L
calibration value from the table below that corresponds to the temperature of the standard.
Temp (˚C)
30 56.5 7.4 18 70.8 11.4
28 58.7 8.5 16 73.5 12.4
26 61.3 9.2 14 76 13.1
24
22
20
g/L Chl
μ
63.5 9.7
66 10.4
68.4 11.1
μ
g/L
BGA-PC
Temp (˚C)
12
10
8
g/L Chl
μ
78.6 13.8
81.2 14.5
83.8 14.7
g/L BGA-PC
μ
pg | 79
Page 80

Calibration
5.11
Calibration Worksheet
e Calibration Worksheet is a record of the calibration for an EXO sensor. e worksheet contains quality
assurance information including date and time of calibration, date of previous calibration, sensor rmware
version, type of calibration performed, standard used, and QC score.
Calibration Worksheets are saved in the Calibration Files folder on the computer (not on the sonde). All
saved Worksheets can be accessed and viewed through the Data menu in KOR soware.
Sample Worksheets
1-point calibration of specic conductance
on EXO conductivity/temperature probe
1-point calibration of percent saturation
on EXO optical dissolved oxygen probe
ODO Gain
e ODO gain is a diagnostic value recorded on the Calibration Worksheet and used for advanced diagnostic
purposes. e nominal value is 1, and accurate calibrations will only slightly deviate from this number.
pg | 80
Page 81

Sonde
6.1
Storage
Proper sonde storage helps to ensure proper sonde operation. To keep sondes in their best working order,
users must follow these instructions. is section will identify storage as “long-term” or “short-term.”Longterm denotes storage during times of long inactivity (over winter, end of monitoring season, etc.). Short-term
denotes storage during times the sonde will be used at a regular interval (daily, weekly, biweekly, etc.).
1 Short -term storage
For interim storage, users should keep sensors moist, but
not submerged; submersion during storage may produce
sensor dri. Users should aim for a storage environment of
water-saturated air (100% humidity) for the sensors.
Place approximately 0.5 in (1 cm) of water (deionized,
distilled, tap, or environmental) in the bottom of the
calibration cup. en place the sonde with all of its sensors
into the cup and close it tightly to prevent evaporation.
Users can also use a moist sponge to create a humid
environment.
Ensure that unused sensor ports are properly protected
with port plugs. e sonde itself should be stored in dry air.
To protect the cable connector, either leave the cable
installed on the connector, or install the connector guard.
2 Long-term storage
Store all removed sensors according to the specic
instructions in their sensor storage section. Plug all open
ports, and store the sonde according the above instructions
for short-term sonde storage.
Always remove batteries from sondes during long periods
of inactivity to prevent potentially harmful battery leaks.
pg | 81
Page 82

Sonde
6.1
Maintenance
Like all precision equipment, EXO sondes work most reliably when users maintain them properly. A proper
inspection and cleaning can prevent several issues, including leaks. When performing general maintenance
on the sonde, also check this manual’s depth and connector sections. Use only the recommended materials to
service instruments. Each sonde comes with a maintenance kit, including proper lubricants and replacement
o-rings. Users can order another replacement o-ring kit (#599680) or tool kit (#599594) from the manufacturer
or an authorized distributor.
1 Inspect and service o-rings
User-serviceable o-rings are located in the EXO sonde
battery compartments. Perform a thorough visual
inspection of o-rings each time they are exposed. Carefully
look for grit, hair, etc. on the o-ring and mating surfaces
and wipe away any contamination with a lint-free cloth.
Without removing them from their grooves, lightly grease
each o-ring with Krytox. Replace any damaged o-rings.
2 Replace o-rings.
If the above inspection reveals a damaged (split, cracked, or
misshapen) o-ring, remove it. Wipe the groove clean with
alcohol and a lint-free cloth. Grease the o-ring by drawing
it between your lightly greased thumb and index ngers.
Place the o-ring in its groove, being careful to not roll or
twist it, and lightly grease the surface. Inspect the o-ring for
contamination.
Do not apply excess grease to the o-rings. is can cause
contamination and seal failure.
3 Inspect, clean, and grease ports.
Visually inspect each port for contamination (grit, hair,
etc.). Should the user detect contamination, remove it with
a blast of compressed air. When the port’s rubber appears
dry, lightly grease the sensor connector before insertion.
Never insert solid objects into the sonde ports. is could
permanently damage the connectors.
pg | 82
Page 83

Sonde
6.2
Install or Replace EXO 1 Batteries
EXO1 water quality sondes use two (2) D-cell batteries as a power source. Using alkaline batteries, users can
expect approximately 90 days of deployment from a fully loaded sonde that samples once every 15 minutes.
However, deployment times may vary greatly depending on water temperature, sampling rate, sensor payload,
and brand of battery. *See battery life specication, next page.
1 Remove battery cover.
Start with a clean and dry sonde. Hold the sonde
horizontally with the bail up and twist the battery
cover counterclockwise until free. If necessary, slide
the sonde tool’s larger opening over the end of the
battery compartment and use it as a lever to break the
compartment free. en slide o the battery cover.
Do not remove the screws on the sonde.
Do not clamp the sonde in a vise.
2 Remove old batteries.
Expose the batteries by ipping the isolation ap up away
from the batteries, and pull the batteries free of their
compartment. Always dispose of used alkaline batteries
according to local requirements and regulations.
Clean the inside of the battery compartment with a lintfree cloth.
3 Install new batteries.
Install the new batteries so that the positive terminals point
towards the bail (away from the sensor bulkhead). Replace
the isolation ap over the batteries.
pg | 83
Page 84

4 Check and service o-rings.
Before replacing the battery cover, check and service the four
o-rings.
Ensure that the o-rings are not nicked or torn and that they
have no contaminants or particles on them or the sealing
surfaces inside the battery cover. Clean the o-rings with a
lint-free cloth. en apply a thin coat of Krytox® lubricant
to each o-ring.
5 Replace battery cover.
Screw the battery cover clockwise until it seats snugly
against the rubber gasket. Do not overtighten.
*Battery life specification
When using alkaline batteries: Approximately 90 days at
20˚C at a 15-minute logging interval, and temperature/
conductivity, pH/ORP, Optical DO, and turbidity installed.
Battery life is heavily dependent on sensor conguration
and is given for a typical sensor ensemble.
When using rechargeable nickel metal hydride (NiMH)
batteries: Estimated battery life is not available because
NiMH batteries vary greatly in manufacturer capacity and
discharge curves. We recommend a NiMH D-cell battery
with a minimum rating of 10,000 milliamp hours that are
fully charged each time they are used.
pg | 84
Page 85

Sonde
6.2
Install or Replace EXO 2 Batteries
EXO2 water quality sondes use four (4) D-cell batteries as a power source. Using alkaline batteries, users can
expect approximately 90 days of deployment from a fully loaded sonde that samples once every 15 minutes.
However, deployment times may vary greatly depending on water temperature, sampling rate, sensor payload,
wiper frequency, and brand of battery. *See battery life specication, next page.
1 Loosen battery cap.
Start with a clean and dry sonde. Slide the sonde tool’s
smaller opening over the battery cap on top of the
EXO2. Using the tool as a lever, rmly turn the tool
counterclockwise until the battery cap is loose.
+
–
2 Remove battery cap and old batteries.
Once the cap is suciently loose, remove the cap and old
batteries from the well. Always dispose of used alkaline
batteries according to local requirements and regulations.
Clean the o-ring sealing surfaces with a lint-free cloth.
Inspect down into the battery tube to make sure it is clean
and dry.
3 Insert new batteries.
With the positive terminal facing up, insert four (4) new
D-cell batteries into the battery well.
pg | 85
Page 86

4 Check and service o-rings.
Before replacing the battery cover, inspect and service the
four o-rings.
Ensure that the o-rings are not nicked or torn and that they
have no contaminants or particles on them or the sealing
surfaces inside the battery cover. en apply a thin coat of
Krytox® lubricant to each o-ring and sealing surface.
5 Replace battery cap.
Aer servicing the cap’s o-rings, insert the cap in its recess.
en, using your thumb, press down on the pressure relief
valve while turning the cap clockwise. Once the cap threads
are engaged, use the tool to tighten until snug. When
completed, the top o-ring of the cap must be below the
battery compartment opening.
Pressure in Battery Compartment
e EXO2 sonde is equipped with a pressure relief valve
to protect against catastrophic battery failure. Signicant
water leakage into battery compartment requires that
your instrument be inspected by the manufacturer or
Authorized Service Center before the next deployment.
*Battery Life Specification
When using alkaline batteries: Approximately 90 days at
20˚C at a 15-minute logging interval, and temperature/
conductivity, pH/ORP, Optical DO, turbidity, and Total
Algae-PC installed along with a central wiper which
rotates once every logging interval. Battery life is heavily
dependent on sensor conguration and is given for a
typical sensor ensemble.
When using rechargeable nickel metal hydride (NiMH)
batteries: Estimated battery life is not available because
NiMH batteries vary greatly in manufacturer capacity and
discharge curves. We recommend a NiMH D-cell battery
with a minimum rating of 10,000 milliamp hours that are
fully charged each time they are used.
pg | 86
Page 87

Sonde
6.3
Replace EXO1 Bail
Sonde bails provide users with a handle for convenient transport and an attachment point for cable strain
reliefs. If an EXO1 bail breaks due to impact or standard wear and tear throughout the life of the sonde, a
user can easily replace it. Always attach the cable’s strain relief mechanism to the bail. Do not use the cable
connector to support the whole weight of the sonde. Although the cable connector and locking ring are very
robust, always use the strain relief to mitigate unnecessary pressure on the connection.
1 Remove battery cover.
Twist the battery cover counterclockwise until free. en
slide o the battery cover.
2 Remove bail.
Spread the sides of the bail away from the connector, pull
the bail over the posts on top of the sonde, and remove the
o-ring from its groove and discard.
3 Install new bail.
Install a new o-ring in the groove at the base of the bail.
en carefully spread the bail open and seat its sockets over
the posts around the connector.
pg | 87
Page 88

Sonde
6.3
Replace EXO2 Bail
Sonde bails provide users with a handle for convenient transport and an attachment point for cable strain
reliefs. If an EXO2 bail breaks due to impact or standard wear and tear throughout the life of the sonde, a
user can easily replace it. Always attach the cable’s strain relief mechanism to the bail. Do not use the cable
connector to support the whole weight of the sonde. Although the cable connector and locking ring are very
robust, always use the strain relief to mitigate unnecessary pressure on the connection.
1 Remove bail.
Use a small screwdriver to remove two screws on the sides
of the bail.
Once screws are removed, li the bail o the sonde.
2 Install new bail.
Place the new bail onto the sonde, aligning holes for the
screws. Use a small screwdriver to insert two screws on the
sides of the bail. Tighten until snug.
pg | 88
Page 89

Sonde
6.4
Update Firmware
Users can check and update sensor or sonde rmware through the KOR interface soware. Each device must
be connected to the computer that is running the Desktop version of KOR, and the computer must have
internet access.
1 Open firmware submenu in Kor.
Navigate to the Options menu in KOR, then to the
Firmware submenu. Immediately aer clicking the
Firmware submenu button, KOR begins to search for
connected sondes and sensors and loads the table with
names, serial numbers, and current rmware versions.
2 Select device and update.
To update a device, click on the device’s name in the table
and then click the Update button.
KOR then updates the device’s rmware, which could take
several minutes.
Note: For best power management, update rmware while
a device is connected via USB, as this will provide power to
the device. However, if you use Bluetooth, we recommend
installing fully charged batteries in the sonde.
pg | 89
Page 90

Handheld
6.5
Maintenance and Storage
EXO Handhelds (HH) are rugged eld instruments that are tested to a rating of IP-67 in the factory. Follow
the instructions below for the most reliable performance from the HH. is section will identify storage as
“long-term” or “short-term.” Long-term denotes storage during times of long inactivity (over winter, end of
monitoring season, etc.). Short-term denotes storage during times the sonde will be used at a regular interval
(daily, weekly, biweekly, etc.).
1 Clean handheld.
If the HH’s USB connector is contaminated, rinse it with
clean water and dry it.
To clean the HH’s cable connector, follow directions in
section 6.18 for Connector Maintenance.
Wipe clean the HH’s keypad, lens, and polymer case
with a cloth soaked in clean water and a few drops of a
dishwashing liquid that contains a degreaser. Take care not
to scratch the lens.
2 Short-term storage.
Keep the HH in a safe storage location and power it down
by pressing and holding the power button for more than
three seconds. Pressing the power button for less than three
seconds does not entirely power down the instrument
(Sleep mode) and may cause unnecessary battery drain.
3 Long-term storage.
Keep the HH in a safe location and remove the batteries
(and reinstall the battery compartment panel) to prevent
potentially harmful battery leaks.
Note: If the HH is stored for more than several days without
batteries, the GPS will take longer to obtain a location x.
pg | 90
Page 91

Handheld
6.6
Install or Replace Batteries
e EXO Handheld (HHs) uses four (4) C-cell alkaline batteries as a power source. Users can extend battery
life by putting the HH in “Sleep” mode, when convenient, by pressing and holding the power button for less
than three seconds. Rechargeable Nickel Metal Hydride (NiMH) batteries can also be used. Battery life varies
depending on GPS and Bluetooth wireless use.
1 Remove battery cover panel.
e battery cover panel is located on the back of the HH.
To remove the panel, unscrew (counter-clockwise) the four
screws with a at or Phillips head screwdriver.
Note: e retaining screws are integrated into this panel
and are not independently removeable. If replacement is
necessary, replace the entire assembly.
2 Insert/replace batteries.
Remove the old batteries and dispose of them according to
local ordinances and regulations. Install the new batteries
between the battery clips with their polarity (+/-) oriented
as shown on the bottom of the battery compartment.
If you use your own rechargeable batteries, they cannot
be charged inside the handheld; they should be charged
outside the handheld.
3 Reinstall battery cover panel.
Ensure that the rubber battery cover gasket is seated
properly, then replace the cover onto the back of the HH.
Tighten the four retaining screws back into their holes, but
do not overtighten.
pg | 91
Page 92

Handheld
6.7
Update Firmware & KOR Software
To update the instrument rmware and KOR soware on the EXO Handheld, use the Desktop version of
KOR on a computer with internet access. KOR Desktop will go online and pull updated les for the Handheld,
which are then transferred to the Handheld.
1 Connect handheld to computer.
Plug the small end of the USB cable into the port on the
top side of the EXO Handheld. Plug the other end of the
USB cable into a port on your computer. Allow a minute for
Windows to recognize the Handheld as a removable drive
before the Handheld shows up in KOR soware.
2 Sync handheld.
When the Handheld is connected to the PC, go to the
Options | Firmware menu in KOR Desktop soware. Select
the Update Handheld button from the bottom-right corner
of the menu. Follow the prompts for completing the update
process and rebooting the Handheld.
pg | 92
Page 93

Depth Sensor
6.8
Maintenance
EXO depth sensors access the water through small holes (ports) located in the sonde body or bulkhead.
Although users cannot access them directly, proper storage maintenance will help to ensure reliable operation.
Depth sensors can be stored dry, in water-saturated air, or submerged in clean water. However, be sure that
the water does not contain solutions that are corrosive. is can cause damage to the sensor’s strain gauge.
1 Locate depth ports.
e two EXO1 depth ports are located in the yellowplastic section between the bulkhead tube (labeled area)
and the blue plastic battery cover. e EXO2 depth ports
are located on the metal bulkhead face itself, in the largest
open area between ports.
2 Clean depth ports.
Although users cannot directly access the depth/level
sensors, they should periodically clean them with the
syringe included in the sonde maintenance kit. Fill the
syringe with clean water and gently force water through
one of the ports. Ensure that water ows from the other
hole. Continue ushing the port until the water comes out
clean.
Do not insert objects in the EXO2 depth ports, as this may
cause damage to the transducer not covered under the
warranty.
pg | 93
Page 94

Standard Optical Sensor
6.9
Maintenance and Storage
Standard optical sensors include Turbidity, Total Algae, and fDOM sensors; these optical sensors are very
low maintenance. is section identies storage as “long-term” or “short-term.” Long-term denotes storage
during times of long inactivity (over winter, end of monitoring season, etc.). Short-term denotes storage
during times the sonde will be used at a regular interval (daily, weekly, biweekly, etc.). Maintain connectors
as instructed in the “Connectors” section.
1 Clean sensing window.
Turbidity, Total Algae, and fDOM require minimal
maintenance. Users should periodically inspect the optical
surface at the tip of the sensor and wipe it clean with a nonabrasive, lint-free cloth if necessary. As much as possible,
prevent scratches and damage to the sensing window.
2 Long- and short-term storage.
Turbidity, Total Algae, and fDOM require minimal
precautions. Users can either remove the sensors or leave
them installed in the sonde for long- and short-term storage.
If le installed on the sonde, follow guidelines for sonde
storage. If users remove them from the sonde, the sensors
may be stored in dry air in their shipping cap (to protect
against physical damage).
Do not store the fDOM sensor in quinine sulfate solution.
pg | 94
Page 95

Conductivity/Temp Sensor
6.10
Maintenance and Storage
EXO conductivity and temperature (CT) sensors require little maintenance or special attention for storage.
As much as possible, prevent impact to the sensor’s exposed thermistor. is section will identify storage
as “long-term” or “short-term.” Long-term denotes storage during times of long inactivity (over-wintering,
end of monitoring season, etc.). Short-term denotes storage during times the sonde will be used at a regular
interval (daily, weekly, biweekly, etc.). Maintain connectors as instructed in the “Connectors” section.
1 Clean electrode channels.
e only parts of the CT sensor that require special
maintenance are the channels leading to the internal
electrodes. Dip the sensor’s cleaning brush (included in
the sonde maintenance kit) in clean water, insert at top of
channels, and sweep the channels 15-20 times. If deposits
have formed on the electrodes, use a mild solution of
dishsoap and water to brush the channels. If necessary, soak
in white vinegar to aid cleaning. Rinse the channels with
clean water following the sweepings or soak.
2 Short -term storage
When in regular eld use, the sensor should remain
installed on the sonde in an environment of watersaturated air. Place approximately 0.5 in (1 cm) of any water
(deionized, distilled, tap, or environmental) in the bottom
of the calibration cup. Insert the sonde and sensor into the
cup and screw it on tightly to prevent evaporation. (More
information in “Short-Term Sonde Storage” section.)
3 Long -term storage
Store the sensors either dry or wet, installed on the
sonde or detached. However, before storage, perform the
recommended maintenance (above) to ensure the sensor is
in good working order for the next deployment season. If
the sensor is submerged for storage, ensure that the liquid
is not corrosive.
pg | 95
Page 96

Dissolved Oxygen Sensor
6.11
Storage
EXO DO sensors require separate storage instructions from other optical sensors due to their sensing
membranes. is section will identify storage as “long-term” or “short-term.” Long-term denotes storage
during times of long inactivity (over winter, end of monitoring season, etc.). Short-term denotes storage
during times the sonde will be used at a regular interval (daily, weekly, biweekly, etc.).
1 Short -term storage
When in regular eld use, the ODO sensor should remain
installed on the sonde. Place approximately 0.5 in (1 cm)
of any water (deionized, distilled, tap, or environmental)
in the bottom of the calibration cup. Insert the sonde
and sensor into the cup and screw it on tightly to prevent
evaporation. (More information in “Short-Term Sonde
Storage” section.)
2 Long-term storage
Leave the sensor installed in the sonde, and submerge it in
clean water in the calibration cup. Screw the cup on tightly
to prevent evaporation. Users may also store the ODO
sensor by itself in two ways. One, submerge the sensing end
of the sensor in a container of water; occasionally check the
level of the water to ensure that it does not evaporate. Two,
store the sensor in water-saturated air.
We do not recommend storing the sensor with the
connector end unmated or exposed. If unmated, cover with
plastic connector cap.
pg | 96
Page 97

Dissolved Oxygen Sensor
6.11
Maintenance and Rehydration
EXO Dissolved Oxygen (DO) sensors require unique maintenance instructions due to their sensing
membranes. Users should routinely perform these instructions in order to achieve the highest levels of
sensor accuracy. DO sensor caps have a typical life of 12 months. Aer this point, users should replace the
DO membrane cap. As caps age, accuracy is reduced, ambient light rejection suers, and response times can
be aected. Maintain connectors as instructed in the “Connectors” section.
1 DO membrane maintenance
Users should periodically inspect the optical surface at the
tip of the sensor and wipe it clean with a non-abrasive, lint-
free cloth if necessary. Never use organic solvents to clean an
EXO DO sensor.
As much as possible, prevent scratches and damage to the
sapphire sensing window. Avoid getting ngerprints on the
window. If necessary, wash with warm water and dishsoap
and rinse with DI water.
2 Sensor rehydration
Users should always store DO sensors in a moist or wet
environment in order to prevent sensor dri. However,
should DO sensors be le in dry air for longer than eight
hours, they must be rehydrated. To rehydrate, soak the
DO sensor cap in warm (room temperature) tap water for
approximately 24 hours. Following this soak, calibrate the
sensor and store it in a moist environment.
3 Sensor cap replacement
Due to restrictions inherent to all DO sensors, DO sensor
caps have a typical life of 12 months. Aer this point, users
should replace the DO membrane cap. To replace this cap,
follow the directions in the “Sensor Cap Replacement”
section.
pg | 97
Page 98

Dissolved Oxygen Sensor
6.12
Sensor Cap Replacement
Follow these instructions to replace the sensor cap on an EXO optical dissolved oxygen sensor once the
previous cap has exhausted its usable life (typically about one year). is cap is shipped in a humidied
container, and should be stored in a 100% humid environment. If the sensor cap dries completely, follow
instructions to rehydrate it.
1 Remove current sensor cap.
Rotate the sensor cap with your ngers counterclockwise
until free.
If possible, do not use any tools during this process.
However, should the cap be immovable aer use, carefully
twist the sensor cap with pliers until it breaks loose. Do not
use pliers on the sensor body, and take great care not to
damage the sensor threads
2 Replace o-ring.
Remove the o-ring (pinch the o-ring out, then roll it
upwards over the threads) and discard it. Visually inspect
the new o-ring for nicks, tears, contaminants, or particles;
discard damaged o-rings. Without twisting it, carefully
install the new o-ring over the threads and into its groove,
then apply a thin coat of Krytox lubricant to the o-ring
only. Ensure the sensor cap’s cavity is completely dry before
installing the new cap.
3 Install new sensor cap.
Aer the o-ring is installed and lubricated, wipe the clear
window at end of sensor with a lint-free cloth until clean.
en dry the inside cavity of the sensor cap with a lint-free
cloth. With a clockwise motion, thread the new sensor
cap onto the sensor until it is nger-tight. e o-ring
should now be completely under the cap and not pinched.
If pinched, remove and discard the o-ring and repeat
procedure.
Do not over-tighten the sensor cap. Do not use any tools
for the installation process.
pg | 98
Page 99

4 Configure probe for new cap.
In KOR soware, congure the probe for the new sensor
cap. Click the Calibrate button and then click the ODO
button. Next click the ODO % sat button, and in the DO
calibration window click the Advanced button.
In the Advanced menu, click the Edit button and enter the
unique membrane cap coecients found on the instruction
sheet shipped with the DO sensor cap.
Note: Calibration coecients are associated with specic
individual sensor caps. ey cannot be used for other ODO
sensors.
5 Store sensor cap.
e sensor cap is shipped in a humidied container,
and should be consistently stored in a 100% humid
environment. Prior to installation, ensure the cap’s
container remains moist. Once the sensor cap is installed
on the sensor, maintain this environment by placing
approximately 0.5 in (1 cm) of water (deionized, distilled,
tap, or environmental) in the bottom of the calibration cup
and screw it tightly onto the sonde to prevent evaporation.
You may also store the sensor by submerging the cap end in
water.
If pH sensor is also installed, do not submerge it in distilled
water.
pg | 99
Page 100

pH and pH/ORP Sensors
6.13
Storage and Rehydration
pH and pH/ORP sensors have two specic storage requirements: they should not be stored in distilled or
deionized water and their reference electrode junction should never dry out. is section will identify storage
as “long-term” or “short-term.” Long-term denotes storage during times of long inactivity (over-wintering,
end of monitoring season, etc.). Short-term denotes storage during times the sonde will be used at a regular
interval (daily, weekly, biweekly, etc.).
1 Short -term storage
When in regular eld use, the sensor should remain
installed on the sonde in an environment of watersaturated air. Place approximately 0.5 in (1 cm) of any water
(deionized, distilled, tap, or environmental) in the bottom
of the calibration cup. Insert the sonde and sensor into the
cup and screw it on tightly to prevent evaporation. (More
information in “Short-Term Sonde Storage” section.)
2 M KCl
2 Long-term storage
Remove the sensor from the sonde and insert its sensing
end into the bottle that the sensor was shipped in. Install
the bottle’s o-ring and cap then tighten. is bottle contains
a 2 molar solution of pH 4 buer. If this solution is
unavailable, users may store the sensor in tap water.
Do not store the pH/ORP sensor in Zobell solution.
3 Rehydrate reference junction.
If the pH sensor has been allowed to dry, soak the sensor
for several hours (preferably overnight) in a 2 molar (2
M) solution of potassium chloride (KCl). In order to
create a 2 M KCl solution, dissolve 74.6 g of KCl in 500
mL of distilled or deionized water. If KCl is unavailable,
a tap water or pH 4 buer soak may restore function. If
the sensor is irreparably damaged, users must replace the
sensor module.
pg | 100
 Loading...