

Page 1

TI-30X Ú S:
A Guide for Teachers
Developed by
Texas Instruments Incorporated
Activities developed by
Gary Hanson and Aletha Paskett
Illustrated by
Jay Garrison
Page 2
About the Authors
Gary Hanson and Aletha Paskett are math teachers in the Jordan Independent School District
in Sandy, Utah. They developed the Activities section and assisted in evaluating the
appropriateness of the examples in the How to Use the TI-30X
Important Notice Regarding Book Materials
Texas Instruments makes no warranty, either expressed or implied, including but not limited to any implied warranties of
merchantability and fitness for a particular purpose, regarding any programs or book materials and makes such materials available
solely
on an as-is basis. In no event shall Texas Instruments be liable to anyone for special, collateral, incidental, or consequential
damages in connection with or arising out of the purchase or use of these materials, and the sole and exclusive liability of Texas
Instruments, regardless of the form of action, shall not exceed the purchase price of this book. Moreover, Texas Instruments shall
not be liable for any claim of any kind whatsoever against the use of these materials by any other party.
Note:
Using calculators other than the TI-30X IIS may produce results different from those described in these materials.
Ù
S section of this guide.
Permission To Reprint or Photocopy
Permission is hereby granted to teachers to reprint or photocopy in classroom, workshop, or seminar quantities, the pages or sheets
in this book that carry a Texas Instruments copyright notice. These pages are designed to be reproduced by teachers for use in
classes, workshops, or seminars, provided each copy made shows the copyright notice. Such copies may not be sold, and further
distribution is expressly prohibited. Except as authorized above, prior written permission must be obtained from Texas Instruments
Incorporated to reproduce or transmit this work or portions thereof in any other form or by any other electronic or mechanical
means, including any information storage or retrieval system, unless expressly permitted by federal copyright law.
Send inquiries to this address:
Texas Instruments Incorporated
7800 Banner Drive, M/S 3918
Dallas, TX 75251
Attention: Manager, Business Services
Note:
If you request photocopies of all or portions of this book from others, you must include this page (with the permission
statement above) to the supplier of the photocopying services.
www.ti.com/calc
ti-cares@ti.com
© 1999 T
Except for the specific rights granted herein, all rights are reserved.
Automatic Power Down, APD, and EOS are trademarks of Texas Instruments Incorporated.
EXAS INSTRUMENTS INCORPORATED
Copyright © 1999 Texas Instruments Incorporated.
Printed in the United States of America.
TI-30X ÙS: A Guide for Teachers
ii
Page 3

About the Teacher Guide
How the Teacher Guide is Organized
This guide consists of two sections: Activities
and How to Use the TI-30X ÙS. The Activities
section is a collection of activities for
integrating the TI-30X ÙS into mathematics
instruction. The How To Use the TI-30X ÙS
section is designed to help you teach students
how to use the calculator.
Activities
The activities are designed to be teacherdirected. They are intended to help develop
mathematical concepts while incorporating the
TI-30X ÙS as a teaching tool. Each activity is
self-contained and includes the following:
An overview of the mathematical purpose
•
of the activity.
The mathematical concepts being
•
developed.
The materials needed to perform the
•
activity.
Things to Keep in Mind
While many of the examples on the
•
transparency masters may be used to
develop mathematical concepts, they were
not designed specifically for that purpose.
For maximum flexibility, each example and
•
activity is independent of the others.
Select the transparency master
appropriate for the key you are teaching, or
select the activity appropriate for the
mathematical concept you are teaching.
If an example does not seem appropriate
•
for your curriculum or grade level, use it to
teach the function of a key (or keys), and
then provide relevant examples of your own.
To ensure that everyone starts at the
•
same point, have students reset the
calculator by pressing & and
simultaneously or by pressing %
and then selecting Y (yes).
The detailed procedure, including step-by-
•
step TI-30X ÙS key presses.
A student activity sheet.
•
How to Use the TI-30X ÚS
This section contains examples on
transparency masters. Chapters are numbered
and include the following.
An introductory page describing the
•
calculator keys presented in the example,
the location of those keys on the
TI-30X ÙS, and any pertinent notes about
their functions.
Transparency masters following the
•
introductory page and providing examples
of practical applications of the key(s) being
discussed. The key(s) being discussed are
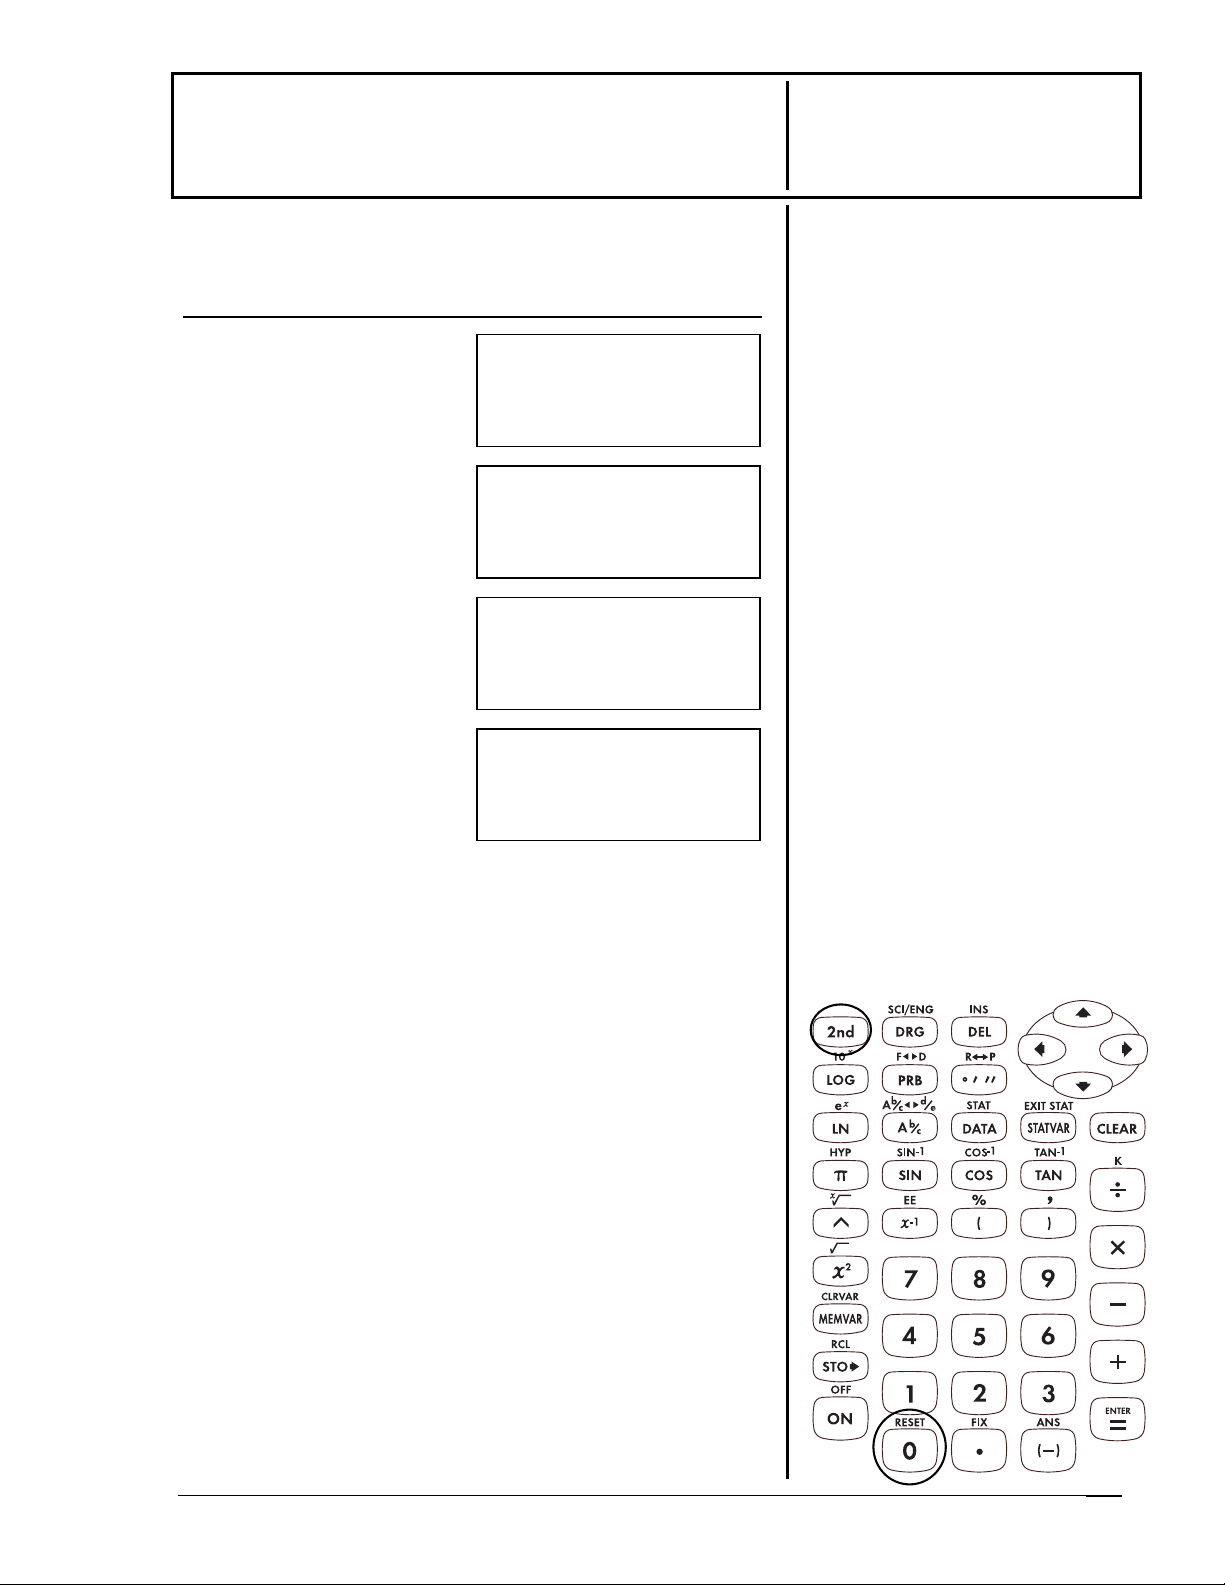
circled on the TI-30X ÙS keyboard.
Conventions Used in the Teacher Guide
In the text, brackets [ ] around a key’s
•
symbol/name indicate that the key is a
second, or alternate, function.
For example:
On the transparency masters, second
•
functions are shown just as they appear on
the keyboard.
For example:
Z
How to Order Additional Teacher Guides
To place an order or to request information
about Texas Instruments (TI) calculators,
use our e-mail address:
visit our TI calculator home page:
or, call our toll-free number:
1.800.TI.CARES (1.800.842.2737)
ti-cares@ti.com
www.ti.com/calc
© 1999 T
EXAS INSTRUMENTS INCORPORATED
TI-30X IIS: A Guide for Teachers
iii
Page 4
2
6
10
14
17
23
S 1
29 2
33 3
36 4
40 5
43 6
45 7
47 8
52 9 Pi 58 10
61 11
68 12
75 13
8 1
14
88 15
91 16
94 17
18
Table of Contents
About the Authors
About the Teacher Guide
About the TI-30X
Activities
The Better Batter —
Using the FIX Key
Star Voyage —
Using Scientific Notation
Trig Functions
What’s My Score —
1-Variable Statistics
Heart Rates —
1-Variable Statistics
WNBA Stats —
2-Variable Statistics
How to Use the TI-30X
Ö
S
Ú
ii
How to Use the TI-30X Ú S
iii
iv
Notation
Logarithms and Antilogarithms
Angle Settings and Conversions
Polar and Rectangular Conversions 98
Hyperbolics
Appendix A
Quick Reference to Keys
Appendix B
Display Indicators
Appendix C
Error Messages
Appendix D
Support and Service Information
Appendix E
Warranty Information
(continued)(continued)
100
A-1
B-1
C-1
D-1
E-1
TI-30X
Ö
S Basic Operations
Clear, Insert, and Delete
Basic Math
Order of Operations and
Parentheses
Constant
Decimals and Decimal Places
Memory
Fractions
Powers, Roots, and Reciprocals
Probability
Statistics
Trigonometry
© 1999 T
EXAS INSTRUMENTS INCORPORATED
TI-30X ÙS: A Guide for Teachers
VI
Page 5

Activities
The Better Batter —
The FIX Key 2
Star Voyage —
Scientific Notation 6
Trig Functions 10
What’s My Score? —
1-Variable Statistics 14
Heart Rates —
1-Variable Statistics 17
WNBA Stats —
2-Variable Statistics 23
© 1999 T
EXAS INSTRUMENTS INCORPORATED
TI-30X ÙS: A Guide for Teachers
1
Page 6
The Better Batter — The FIX Key
Overview
Students use % ‚ on the TI-30X ÙS to change
numbers to different place values. Students
calculate batting averages using the TI-30X ÙS and
then round their answers to three decimal places.
Introduction
1. Have students practice rounding the following
numbers to 3 decimal places using pencil and
paper.
a. 2.35647 2.356
b. 15.3633 15.363
c. 0.02698 0.027
2. Have students round the following numbers to 4
decimal places using the TI-30X ÙS.
a. 4.39865 4.3987
b. 72.965912 72.9659
c. 0.29516 0.2952
d. 0.00395 0.0040
Activity
Present the following problem to students:
You are going to play Virtual Baseball. You need to
select 9 players from the list to be on your team.
Choose the players with the best batting averages.
Find the batting averages (number of hits
of times at bat) rounded to 3 decimal places for each
player. Make a list of your players in order, from
highest to lowest.
¾
number
Math Concepts
• rounding
• place value
• division
• comparing and
ordering decimals
³ 1. Enter the first number.
4.39865
2. Press % ‚ to display
the menu that lets you set
the number of decimal
places.
F0123456789
3. Press 4 to select 4
decimal places.
4. Press <.
Materials
• TI-30X ÙS
• pencil
• student
activity
4.39865
4.39865
4.3987
See the table on the next page for solutions.
© 1999 T
EXAS INSTRUMENTS INCORPORATED
TI-30X ÙS: A Guide for Teachers
2
Page 7
The Better Batter — The FIX Key
(Continued)
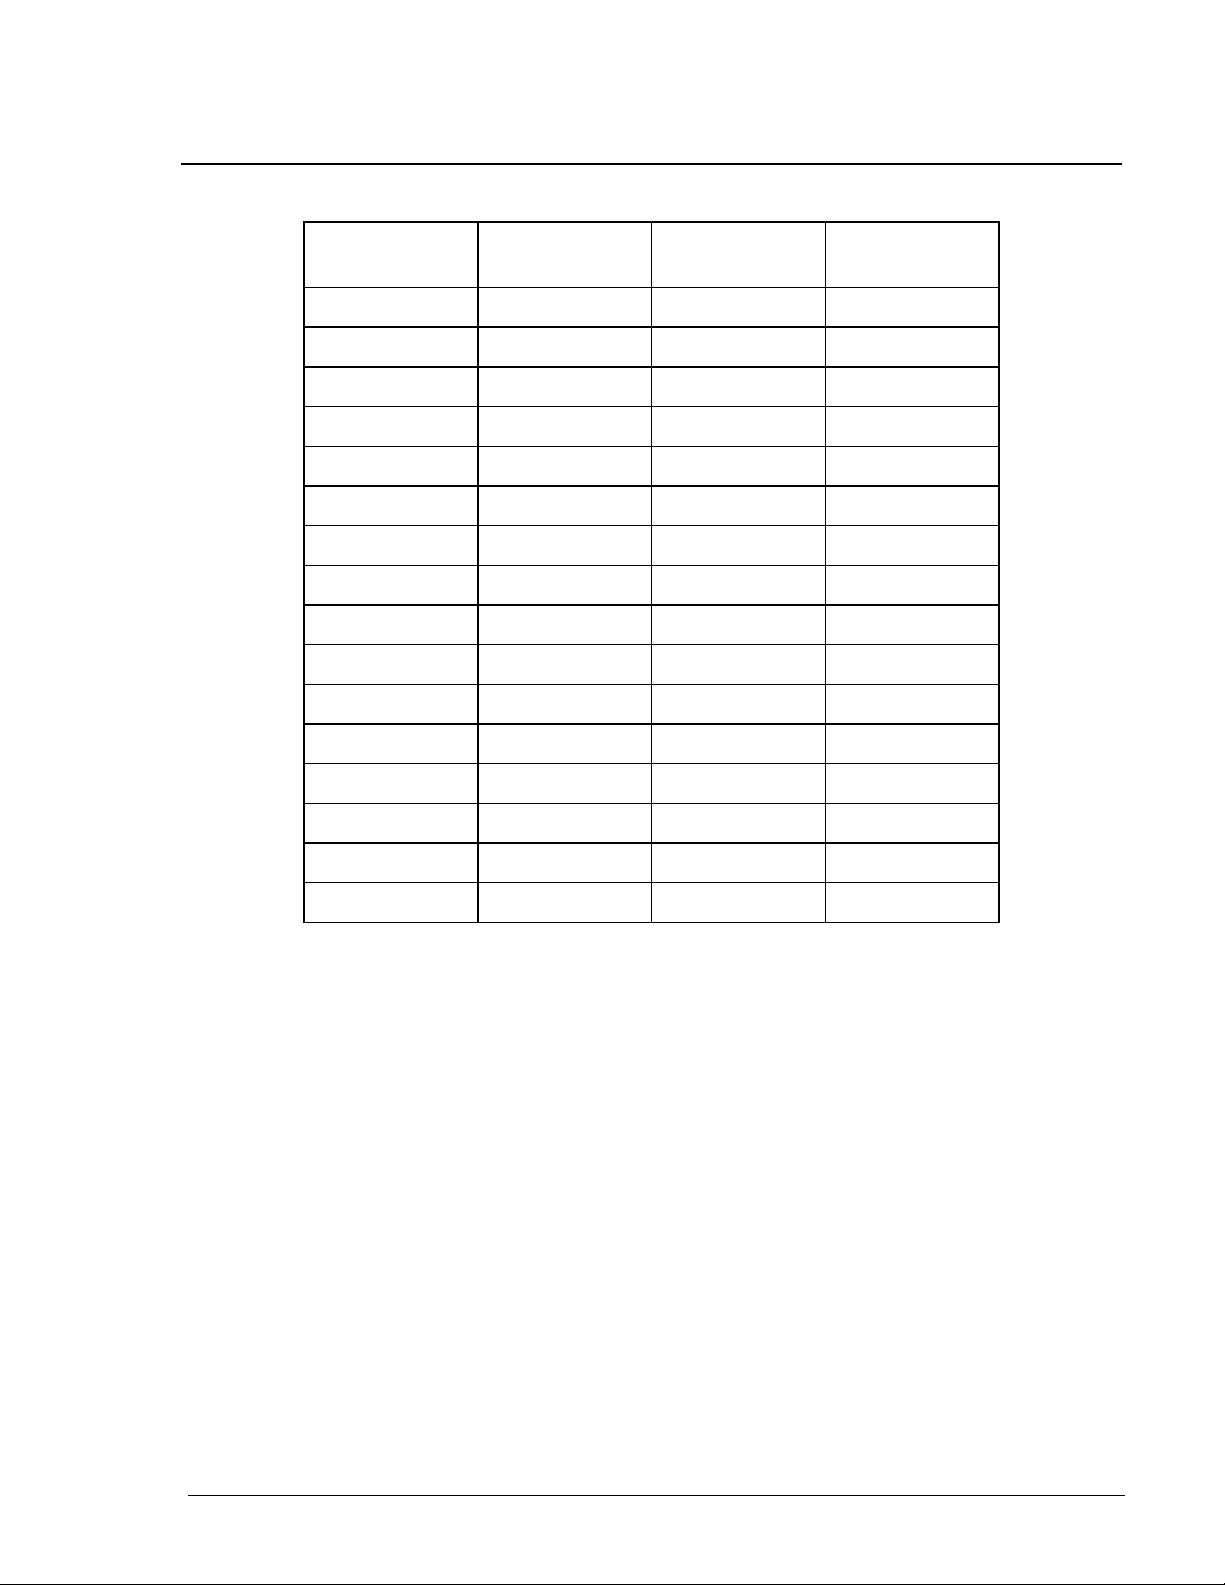
Player Number of
Hits
C. Ripken 122 368 0.332
Puckett 119 363 0.328
Molitor 119 364 0.327
Greenwell 104 334 0.311
Tartabull 103 311 0.331
Palmeiro 120 366 0.328
Franco 109 344 0.317
Joyner 105 338 0.311
Boggs 106 329 0.322
Baines 91 290 0.314
Sax 113 388 0.291
Williams 20 74 0.270
Sheridan 15 63 0.238
Number of
Times at Bat
Batting
Average
Barfield 64 284 0.225
Mattingly 109 367 0.297
Hall 87 280 0.311
© 1999 T
EXAS INSTRUMENTS INCORPORATED
TI-30X ÙS: A Guide for Teachers
3
Page 8
The Better Batter —
Name ___________________________
The FIX Key
Date ___________________________
Problems
1. Round the following numbers to 3 decimal places.
a. 2.35647 _________________
b. 15.3633 _________________
c. 0.02698 _________________
2. Using the TI-30X ÙS, round the following numbers to 4 decimal places.
a. 4.39865 _________________
b. 72.965912 _________________
c. 0.29516 _________________
d. 0.00395 _________________
© 1999 T
EXAS INSTRUMENTS INCORPORATED
TI-30X ÙS: A Guide for Teachers
4
Page 9
The Better Batter —
Name ___________________________
The FIX Key
Date ___________________________
Problem
You are going to play Virtual Baseball. You need to select 9 players from the list to
be on your team. Choose the players with the best batting averages.
Procedure
1. Find the batting averages (number of hits ¾ number of times at bat) rounded to
3 decimal places for each player.
Player Number of Hits Number of
Times at Bat
C. Ripken 122 368
Puckett 119 363
Molitor 119 364
Greenwell 104 334
Tartabull 103 311
Batting Average
(rounded to 3 decimal places)
Palmeiro 120 366
Franco 109 344
Joyner 105 338
Boggs 106 329
Baines 91 290
Sax 113 388
Williams 20 74
Sheridan 15 63
Barfield 64 284
Mattingly 109 367
Hall 87 280
2. Make a list of your players in order, from highest to lowest.
Player 1 ____________________ Player 6 ____________________
Player 2 ____________________ Player 7 ____________________
Player 3 ____________________ Player 8 ____________________
© 1999 T
Player 4 ____________________ Player 9 ____________________
Player 5 ____________________
EXAS INSTRUMENTS INCORPORATED
TI-30X ÙS: A Guide for Teachers
5
Page 10

Star Voyage — Scientific Notation
Overview
Students investigate scientific notation by changing
numbers into scientific notation, and then using
them in calculations.
Introduction
Set up the activity by telling your students:
The standard form for scientific notation is a Q 10
where a is greater than or equal to 1 and less than
10, and n is an integer.
1. Have students practice writing the following
numbers in scientific notation using pencil and
paper.
a. 93 000 000 9.3 Q 10
b. 384 000 000 000 3.84 Q 10
c. 0.00000000000234 2.34 Q 10
d. 0.0000000157 1.57 Q 10
7
11
-12
-8
Math Concepts
• scientific
notation
• addition
• division
n
,
Materials
• TI-30X ÙS
• pencil
• student activity
2. Have students change the following numbers into
scientific notation using the TI-30X ÖS.
a. 12 000 000 1.2 Q 10
b. 974 000 000 9.74 Q 10
c. 0.0000034 3.4 Q 10
d. 0.000000004 4 Q 10
Note: Answers assume the default floating decimal
setting.
7
8
-6
-9
3. Have students change the following numbers into
floating decimal (standard notation).
a. 5.8 Q 10
b. 7.32 Q 10
c. 6.2 Q 10
d. 3 Q 10
Note: To enter a negative number, press M and then
7
5
-6
-8
enter the number.
58 000 000
732 000
0.0000062
0.00000003
1. Enter the first number.
12000000
2. Press % d.
FLO SCI ENG
3. Press " < <.
12000000
4. Now, just type the next
number and press <.
³ 1. Enter 5.8; press % C.
5.8
¯
2. Enter 7; press % d.
FLO SCI ENG
3. Press !
FLO
4. Press < <.
5.8¯7
58000000.
07
1.2
x10
.
SCI ENG
© 1999 T
EXAS INSTRUMENTS INCORPORATED
5. Type the next number and
press <.
TI-30X ÙS: A Guide for Teachers
6
Page 11
Star Voyage — Scientific Notation
Activity
Present the following problem to students:
You are a captain of a starship. You have been
assigned to go to Alpha Centauri and you have 5
years to get there. The distance from the sun to
Alpha Centauri is 2.5 x 10
from the earth to the sun is approximately 9.3 x
7
10
miles. Your ship can travel at the speed of light.
You know that light can travel a distance of 6 x
12
10
miles in 1 light year. Will you be able to get to
Alpha Centauri on time?
Procedure
13
miles. The distance
(Continued)
1. Using the TI-30X ÖS, find the total distance you
need to travel.
2.5 Q 10
13
+ 9.3 Q 107 = 2.5000093 Q 1013 miles
2. Next, find out how long it will take you to travel
the distance. (distance traveled P 1 light year)
2.5000093 Q 10
13
P 6 Q 1012 = 4.166682167 years
3. Can you make the trip in the given time?
Yes
Extension
Now that you have been successful, you have been
asked to make another trip. The distance from the
Sun to Delta Centauri is 9 x 10
will it take you to get there from Earth?
≈
15 years
13
miles. How long
Hint: Make sure your calculator
is in scientific notation mode
before you beginning addition.
Hint: The Earth is approximately
9.3 x 10
7
miles from the Sun.
© 1999 T
EXAS INSTRUMENTS INCORPORATED
TI-30X ÙS: A Guide for Teachers
7
Page 12
Star Voyage —
Name ___________________________
Scientific Notation
Problems
1. Write the following numbers in scientific notation.
Standard Notation Scientific Notation
a. 93 000 000 _________________________
b. 384 000 000 000 _________________________
c. 0.00000000000234 _________________________
d. 0.0000000157 _________________________
2. Using the TI-30X ÖS, change the following numbers into scientific notation.
Standard Notation Scientific Notation
Date ___________________________
a. 12 000 000 000 000 _________________________
b. 974 000 000 000 _________________________
c. 0.0000000000034 _________________________
d. 0.0000000004 _________________________
3. Using the TI-30X ÖS, change the following numbers into floating decimal
notation (standard).
Scientific Notation Standard Notation
a. 5.8 Q 10
b. 7.32 Q 10
c. 6.2 Q 10
7
5
-6
_________________________
_________________________
_________________________
© 1999 T
d. 3 Q 10
EXAS INSTRUMENTS INCORPORATED
-8
_________________________
TI-30X ÙS: A Guide for Teachers
8
Page 13
Star Voyage —
Name ___________________________
Scientific Notation
Problem
You are a captain of a starship. You have been assigned to go to Alpha
Centauri and you have 5 years to get there. The distance from the Sun to Alpha
Centauri is 2.5 x 10
approximately 9.3 x 10
know that light can travel a distance of 6 x 10
be able to get to Alpha Centauri on time?
Procedure
1. Using the TI-30X ÖS, find the total distance that you need to travel. ______
_________________________________________________________________
Hint: Make sure your calculator is in scientific notation mode before you begin addition.
2. Next, find out how long it will take you to travel the distance. (distance
traveled P 1 light year) ________________________________________________________
13
miles. The distance from the Earth to the Sun is
7
miles. Your ship can travel at the speed of light. You
Date ___________________________
12
miles in 1 light year. Will you
_______________________________________________________________________________
3. Can you make the trip in the given time? _____________________________
Extension
Now that you have been successful, you have been asked to make another
trip. The distance from the Sun to Delta Centauri is 9 x 10
will it take you to get there from Earth?
Hint: The Earth is approximately 9.3 Q 10
7
miles from the Sun.
13
miles. How long
© 1999 T
EXAS INSTRUMENTS INCORPORATED
TI-30X ÙS: A Guide for Teachers
9
Page 14
Trig Functions
5
Overview
Students practice solving sine, cosine, and tangent
ratios, and solve problems involving trigonometric
ratios.
Introduction
Introduce the trigonometric ratios to students.
¾
sin = opposite leg
cos = adjacent leg
tan = opposite leg
1. Have students find the trigonometric ratios for
the triangle using the above definitions. Round to
the nearest hundredth if necessary. (Use %
for rounding.)
a. sin C 3
b. cos C4
c. tan C3
d. sin A4
e. cos A3
f. tan A4
hypotenuse
¾
hypotenuse
¾
adjacent leg
¾
¾
¾
¾
¾
¾
5 = 0.60
5 = 0.80
4 = 0.75
5 = 0.80
5 = 0.60
3 = 1.33
‚
Math Concepts
• multiplication
• division
• trigonometric
ratios
Materials
• TI-30X ÙS
• pencil
• student activity
A
3
BC
4
³ To set 2 decimal places:
1. Press % ‚.
F0123456789
2. Press 2 to select 2
decimal places.
2. Have students find the value of each ratio using
the TI-30X ÙS. Round to the nearest 10
thousandth.
a. sin 71° 0.9455
b. tan 31° 0.6009
c. cos 25° 0.9063
3. Have students find the measure of each angle
using the TI-30X ÙS. Round to the nearest degree.
a. sin B = 0.4567 27 degrees
b. cos A = 0.6758 47 degrees
c. tan C = 5.83 80 degrees
³ To find sin 71°:
1. Press >.
sin(
2. Enter 71; press E <.
sin(71)
0.945518576
3. Press % ‚ 4.
sin(71)
0.9455
³ To find
1. Press % Z.
2. Enter
3. Press % ‚ 0.
B
when sin B=0.4567:
sin-1(
; press E <.
.4567
sin-1(.4567)
27.1744
sin-1(.4567)
27.
© 1999 T
EXAS INSTRUMENTS INCORPORATED
TI-30X ÙS: A Guide for Teachers
10
Page 15
Trig Functions
(Continued)
Activity
Present the following problem to students:
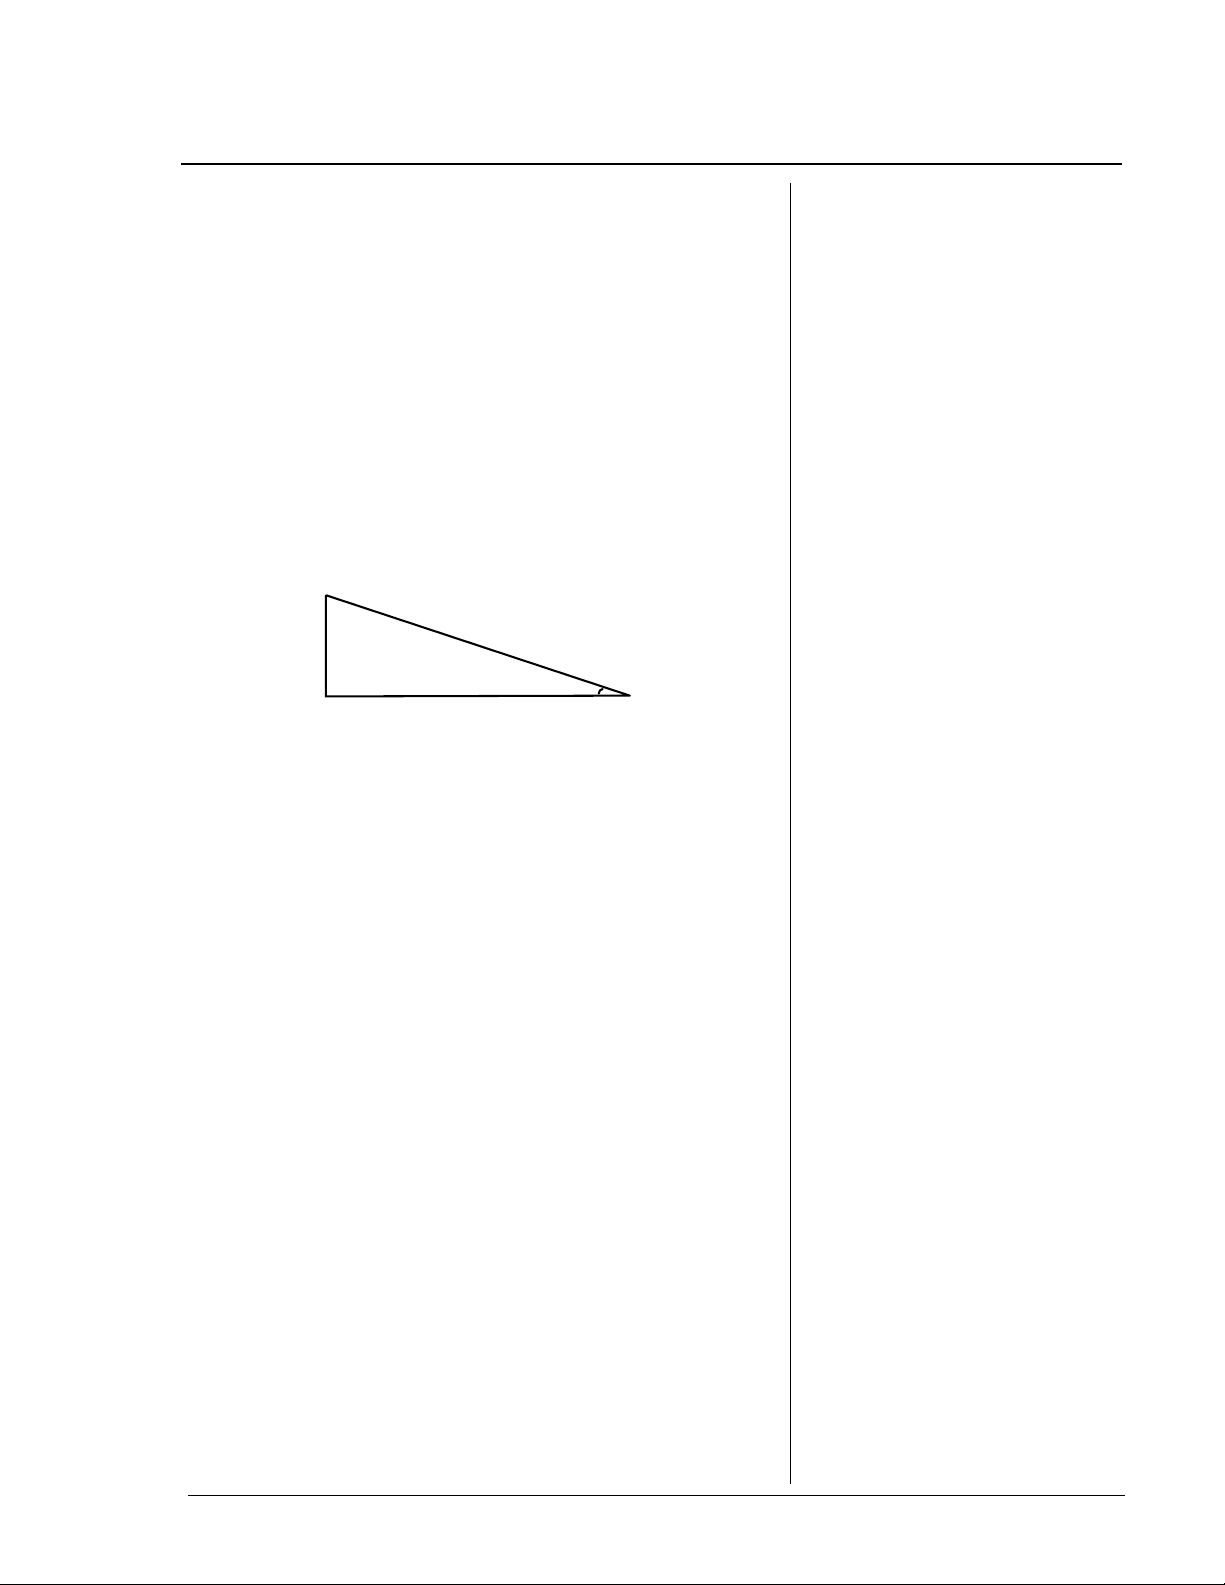
You need to build a ramp to your front door. The
distance from the ground to the bottom of the door
is 1.5 feet. You dont want the angle of incline to be
more than 6 degrees. The distance from the street to
the door is 20 feet. Is there enough room to build the
ramp?
Procedure
1. Make a drawing of the problem.
1.5 ft.
20 ft.
2. Use the trigonometric ratio
tan = opposite leg
to find angle A.
Angle A is 4.3 degrees (rounded to the nearest
tenth). Yes, there is enough room to build the
ramp.
¾
adjacent leg
Extension
Present the following problem to students:
³ 1. Press % \.
tan-1(
2. Enter
E <.
tan-1(1.5/20)
A
³ 1. Press % \.
tan-1(
W 20 and press
1.5
4.3
You want to start the ramp 15 feet away from the
door. Can you do that and still have the angle of
incline be less than 6 degrees?
Yes, angle A is 5.7º.
© 1999 T
EXAS INSTRUMENTS INCORPORATED
2. Enter
<.
tan-1(1.5/15
TI-30X ÙS: A Guide for Teachers
1.5 ¾¾ 15
5.7
and press
11
Page 16

Trig Functions
5
Problems
1. Find the trigonometric ratios for the triangle. Round to the nearest
hundredth. (Use % ‚ for rounding.)
a. sin C _______________________
Name ___________________________
Date ___________________________
b. cos C _______________________
c. tan C _______________________
d. sin A _______________________
e. cos A _______________________
f. tan A _______________________
2. Using the TI-30X ÙS, find the value of each ratio. Round to the nearest ten
thousandth.
a. sin 71º _______________________
b. tan 31º _______________________
c. cos 25º _______________________
3. Using the TI-30X ÙS, find the measure of each angle. Round to the nearest
degree.
A
3
BC
4
a. sin B = 0.4567 _______________________
b. cos A =0.6758 _______________________
c. tan C = 5.83 _______________________
© 1999 T
EXAS INSTRUMENTS INCORPORATED
TI-30X ÙS: A Guide for Teachers
12
Page 17
Trig Functions
Problem
You need to build a ramp to your front door. The distance from the ground to
the bottom of the door is 1.5 feet. You dont want the angle of incline to be
more than 6 degrees. The distance from the street to the door is 20 feet. Is
there enough room to build the ramp?
Procedure
1. Make a drawing of the problem.
Name ___________________________
Date ___________________________
2. Use the trig ratio tan = opposite leg
your answer to the nearest tenth.) ___________________________________
_________________________________________________________________
3. Is there room to build the ramp? ____________________________________
Extension
You want to start the ramp 15 feet away from the door. Can you do that and
still have the angle of incline be less than 6 degrees?
© 1999 T
EXAS INSTRUMENTS INCORPORATED
¾
adjacent leg to find angle A. (Round
TI-30X ÙS: A Guide for Teachers
13
Page 18

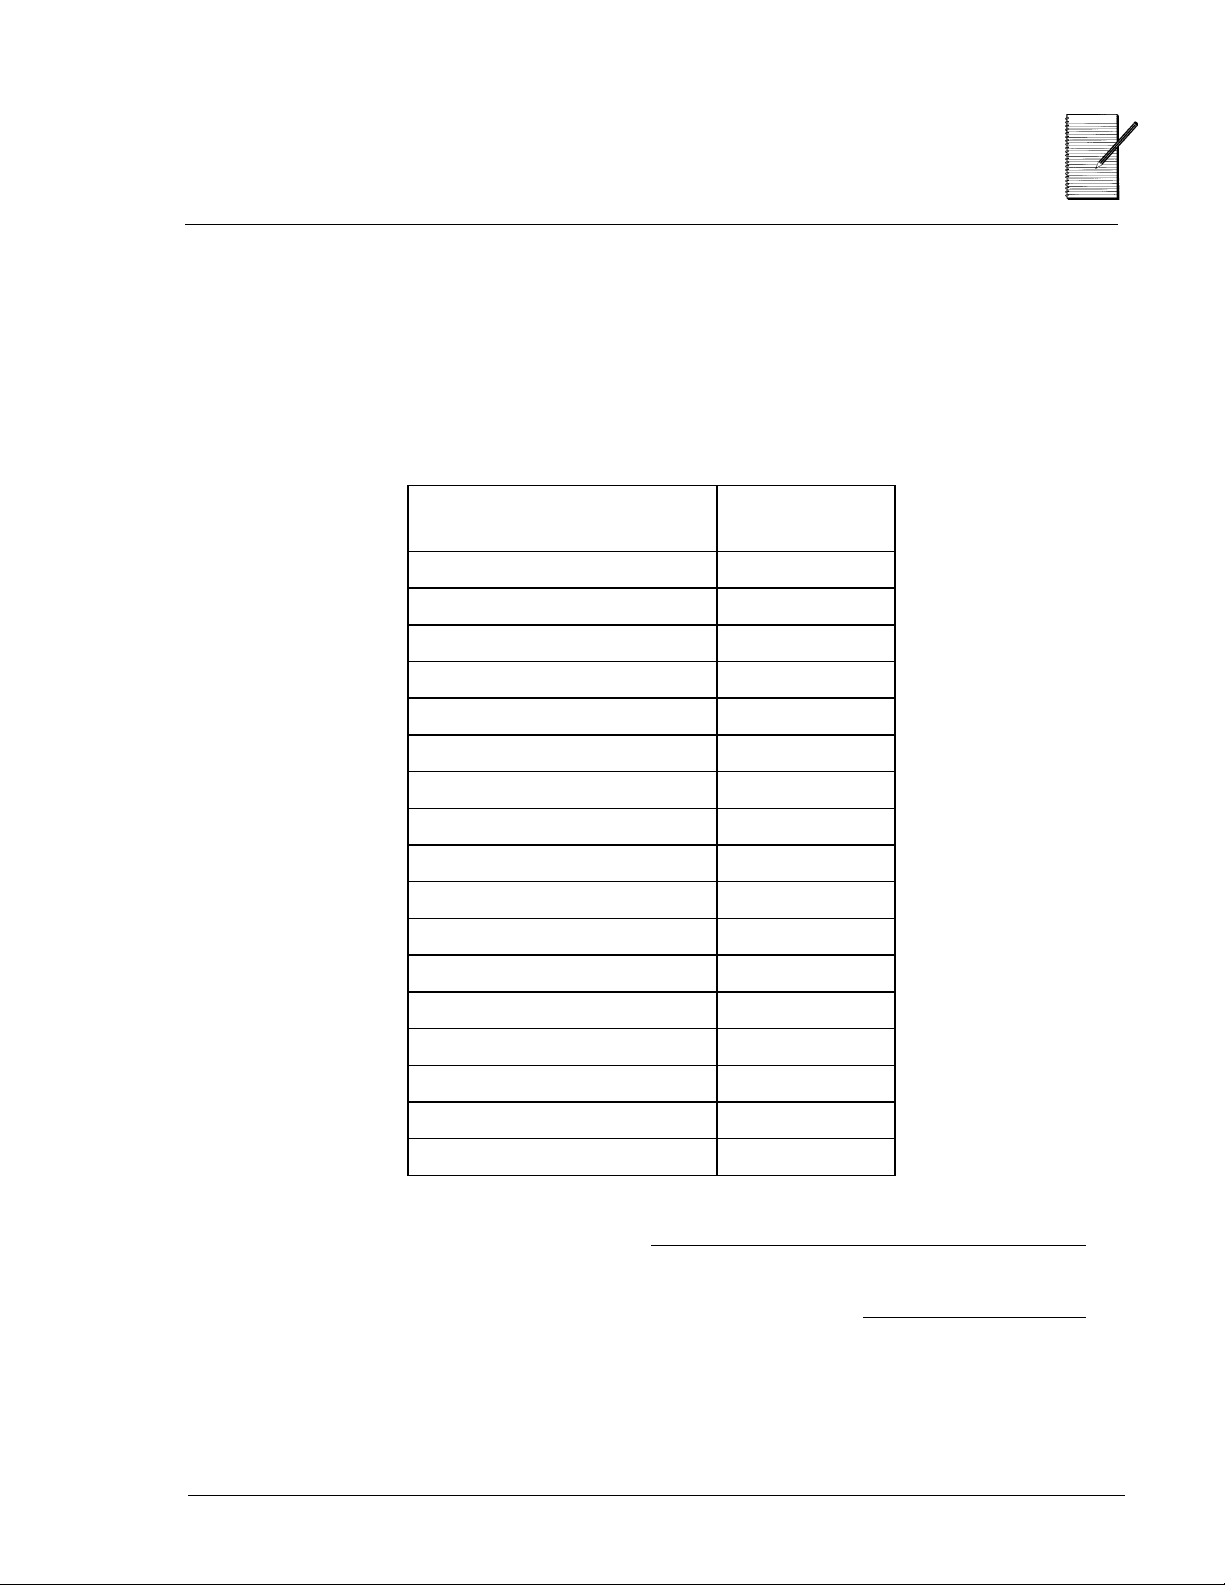
What’s My Score? — 1-Variable Statistics
Overview
Students use the given test scores to find averages.
Introduction
Discuss finding averages with your students.
Activity
Present the following problem to students:
You and your friend are having a contest. The one
gets the highest average on their math tests for one
quarter wins. Your scores are 98, 89, 78, 98, and
100. Your friends scores are 89, 89, 97, 90, and
100. Who is the winner?
Procedure
1. Have students find the average of their scores
using the TI-30X ÙS. Remember to enter 2 as the
frequency for 98 and 1 for all others.
Math Concepts
• averages
³ 1. Press % t < to
select
2. Press v and enter your
first score.
X1 = 98
Materials
• TI-30X ÙS
• pencil
• student activity
1-VAR
mode.
3. Press $ and enter 2 as
the frequency for 98.
FRQ = 2
4. Press $. Continue
entering your scores and
frequencies, pressing $
after each score and
frequency.
5. When finished, press
u " to select v, the
average. Write it down.
n v Sx sx ¹
92.6
© 1999 T
EXAS INSTRUMENTS INCORPORATED
TI-30X ÙS: A Guide for Teachers
14
Page 19
What’s My Score? — 1-Variable Statistics
(Cont.)
2. Now find the average of your friends scores.
Remember to put 2 as the frequency for 89 and 1
for all others.
3. Who won?
Your friend: 93 (You had 92.6.)
Extension
Present the following problem to students:
Your friend took a test on the day you were absent
and scored 95. What score do you need to get so that
you are the winner?
³ 1. Press % t " " to
CLRDATA
select
<.
2. Press v and enter the
friend’s first score.
X1 = 89
3. Continue entering the
friend’s scores and
frequencies, following
steps 3 and 4 on the
previous page.
4. When finished, press
u " to select
average. Write it down.
n
v Sx sx ¹
93.0
³ 1. Press % t and " "
CLRDATA
to
2. Recalculate your friend’s
average, making sure to
include the new score.
. Press
, the
v
. Press <.
The score you need: 98
Note:
Make sure you exit the
to another problem.
STAT
mode before going on
3. Use guess and check to
figure out what score you
need to get.
STAT
4. To exit
% w <.
mode, press
© 1999 T
EXAS INSTRUMENTS INCORPORATED
TI-30X ÙS: A Guide for Teachers
15
Page 20
What’s My Score? —
Name ___________________________
1-Variable Statistics
Date ___________________________
Problems
1. You and your friend are having a contest. Whoever gets the highest average on
their math tests for one quarter wins. Your scores are 98, 89, 78, 98, and 100.
Your friend's scores are 89, 89, 97, 90, and 100. Who is the winner?
Your average _______________________
Your friends average _______________________
2. Your friend took a test on the day you were absent and scored 95. What score
do you need to get so that you are the winner?
Your friends new average _______________________
Your new score _______________________
© 1999 T
EXAS INSTRUMENTS INCORPORATED
TI-30X ÙS: A Guide for Teachers
16
Page 21

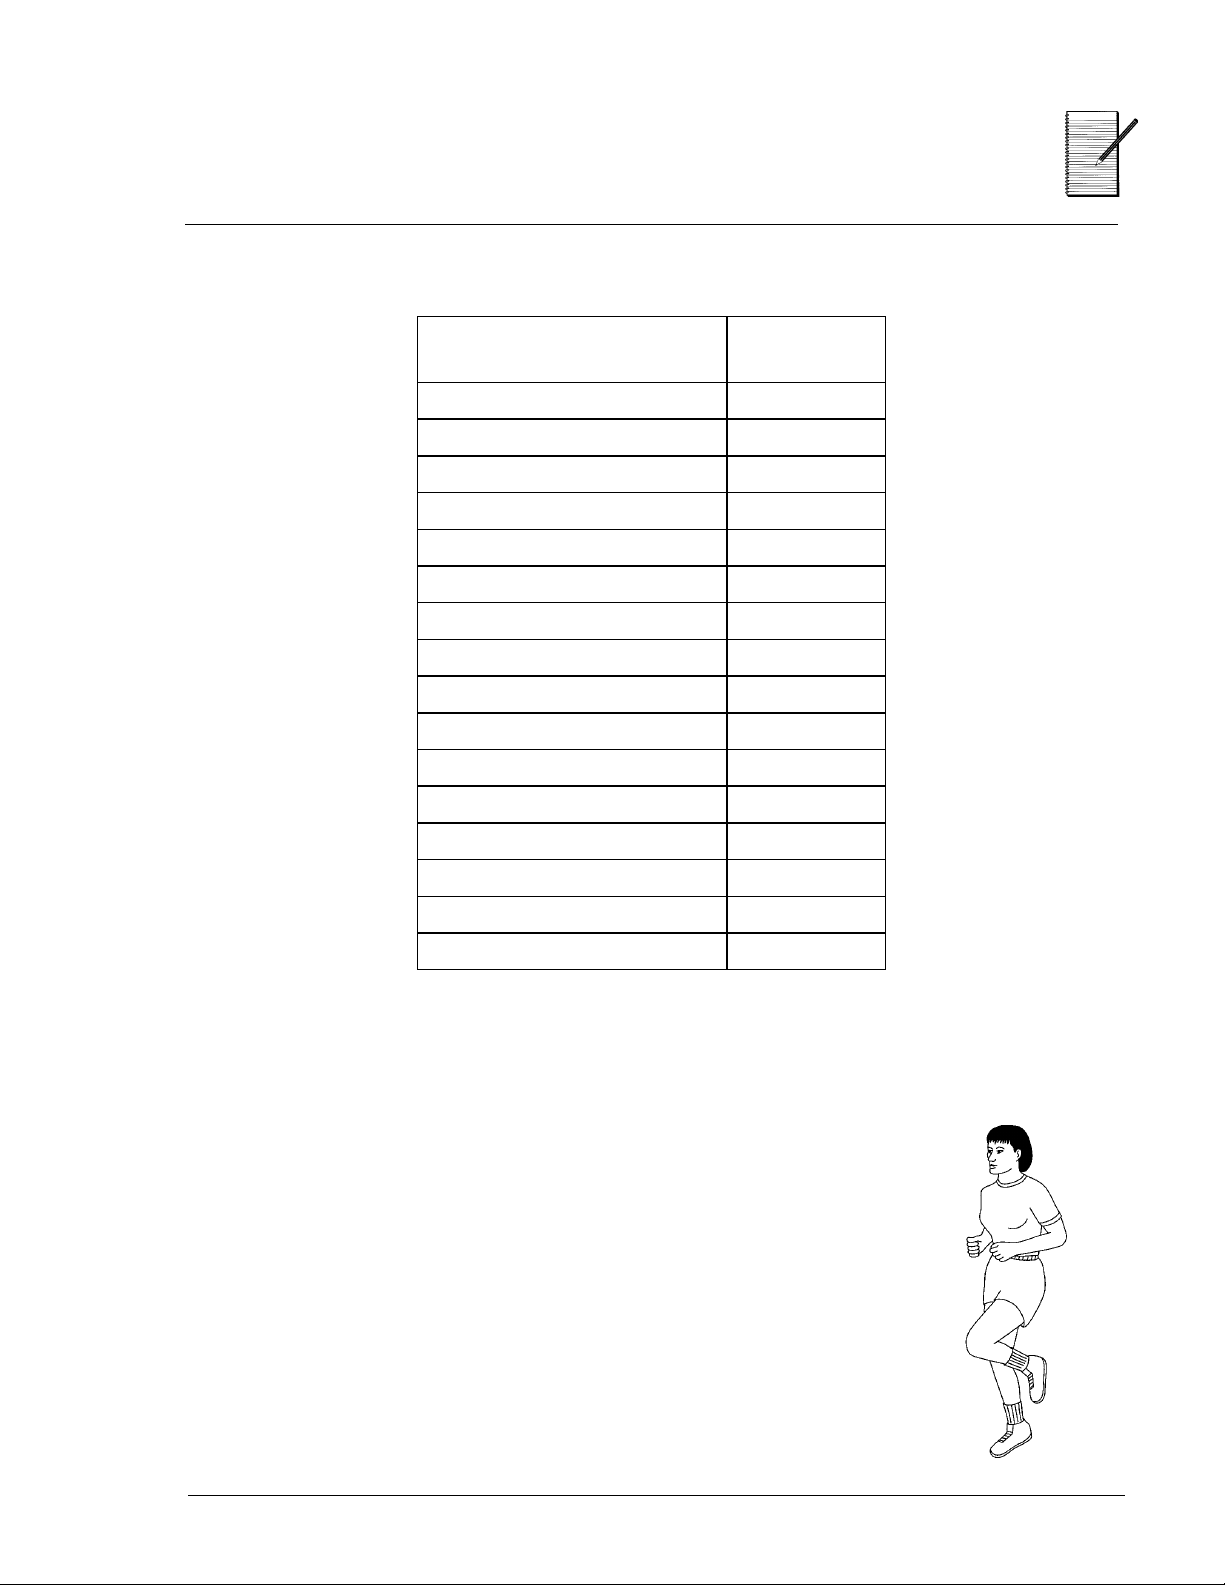
Heart Rates — 1-Variable Statistics
Overview
Students use the statistics functions of the
TI-30XÙS calculator to investigate the effect of
exercise on heart rate.
Introduction
Students may be placed in smaller groups for this
activity to minimize the amount of data to be
entered. Ask students:
•
What do you think the average heart rate is for
someone your age?
•
What about after exercising?
Activity
Have students complete the following investigation
to check their estimations.
Math Concepts
• mean,
minimum,
maximum, and
range
Materials
• TI-30X ÙS
• stopwatch or
a watch with
a second hand
• student activity
1. Have students check their resting heart rates by
timing their pulse for 1 minute. (You could have
them time for 10 seconds and then multiply by 6,
but this could be the quietest minute of your day!)
2. Collect data on the chart. Enter each students
heart rate and a mark in the frequency column.
As other students have the same heart rate, add
another tally mark in the frequency column.
3. Enter the heart rate data into the TI-30X ÙS.
a. Enter the first heart rate on the chart as the
first
X
value, and the number of tallies for
that heart rate as the frequency.
b. You must press $ between entries. For
example, enter the first heart rate, and then
press $. Enter the first frequency, and then
press $.
For example, assume a class of 22 students:
Rate Students Rate Students
60 3 63 3
61 5 64 1
62 6 65 4
³ 1. Press % t <.
2. Press v to enter the
heart rates and
frequencies.
X1=
3. Enter first heart rate and
press $.
FRQ=
4. Continue entering until
you have entered all the
heart rates and
frequencies.
© 1999 T
EXAS INSTRUMENTS INCORPORATED
TI-30X ÙS: A Guide for Teachers
17
Page 22
Heart Rates — 1-Variable Statistics
(Continued)
4. Check the statistics calculations. After
students display
Òx
(Sigma x), explain that
is the sum of all the heart rates. Ask students:
•
How many heartbeats were there in one
minute?
•
Is the average heart rate higher or lower
than you expected?
5. Now we will see the effect of some exercise
on heart rate. Tell students:
If at any point during this portion of the
activity you experience pain, weakness, or
shortness of breath, stop immediately.
6. Have the students run in place for 2 minutes
and then give them these instructions:
a. Time your pulse for 1 minute.
b. Record your heart rate as before.
c. Enter the data into the calculator.
d. Compare the average heart rate after
running with the resting heart rate.
Òx
1. Press u.
n Ï Sx Îx
22.
n should equal the total
number of student sampled.
Ï
62.
2
1370.
to see the
x
Ò
.
2. Press " to
average heart rate.
n Ï Sx Îx
3. Press " " " to
Òx
x
Ò
Note: The numbers show the
results of the example described
above. Your students’ results will
vary depending on the size of
group and the heart rate readings.
7. Now have the students do jumping jacks for 2
minutes. Instruct them to time their pulse for 1
minute again and record as before. Have them
enter the data into the calculator again and
calculate the average heart rate after jumping
jacks. Compare to the other 2 averages.
8 How fit is the class? If the class (or individual)
heart rate after jumping jacks is less than 90,
then you are in great shape. If it is higher than
125, then you are in poor shape.
Instruct students to make a histogram of the 3
9.
sets of data they collected. Ask students:
•
How are the histograms the same?
•
How are they different?
•
Is the data grouped the same or is it more
spread out in one graph compared to
another?
© 1999 T
EXAS INSTRUMENTS INCORPORATED
TI-30X ÙS: A Guide for Teachers
18
Page 23
Heart Rates —
Name ___________________________
1-Variable Statistics
Problem
What do you think the average heart rate is for someone your age? What about
after exercising?
Procedure
1. Use this table to record your class or group data (resting).
Heartbeats per minute
(resting)
Date ___________________________
Frequency
© 1999 T
2. What is the class (group) average? ___________________________________
3. What is the total number of heartbeats for the minute? _________________
EXAS INSTRUMENTS INCORPORATED
TI-30X ÙS: A Guide for Teachers
19
Page 24
Heart Rates —
Name ___________________________
1-Variable Statistics
4. Use this table to record your class or group data (running).
Heartbeats per minute
(running)
Date ___________________________
Frequency
© 1999 T
5. What is the class (group) average?___________________________________
6. What is the total number of heartbeats for the minute? _________________
EXAS INSTRUMENTS INCORPORATED
TI-30X ÙS: A Guide for Teachers
20
Page 25
Heart Rates —
Name ___________________________
1-Variable Statistics
7. Use this table to record your class or group data (jumping).
Heartbeats per minute
(jumping)
Date ___________________________
Frequency
© 1999 T
8. What is the class (group) average? __________________________________
9. What is the total number of heartbeats for the minute? _________________
10. How fit is the class? _______________________________________________
_________________________________________________________________
Note: If the class (or individual) heart rate after jumping jacks is less than 90, then you are in
great shape. If it is higher than 125, then you are in poor shape.
EXAS INSTRUMENTS INCORPORATED
TI-30X ÙS: A Guide for Teachers
21
Page 26
Heart Rates —
Name ___________________________
1-Variable Statistics
11. Now make a histogram for each of the 3 sets of data you collected.
Resting Running Jumping
Date ___________________________
© 1999 T
12. How are the histograms the same? How are they different? _____________
_________________________________________________________________
_________________________________________________________________
13. Is the data grouped the same or is it more spread out in one graph
compared to another? _____________________________________________
_________________________________________________________________
_________________________________________________________________
EXAS INSTRUMENTS INCORPORATED
TI-30X ÙS: A Guide for Teachers
22
Page 27
WNBA Stats — 2-Variable Statistics
Overview
Students use WNBA statistics to explore the
relationship between 2 variables. They use the
TI-30X ÙS to compute the regression equation and
evaluate some values.
Activity
Present the following problem to students:
Do you think WNBA (Womens National Basketball
Association) playing time (in minutes per game)
is related to how many points a player scores? Do
you think it is related to how many rebounds a
player gets? Or is it related to the players field-goal
percentage?
Procedure
1. Put the calculator in
2-VAR
statistics.
STAT
mode and choose
Math Concepts
• 2-variable
statistics
1. Press % t and then
".
1-VAR 2-VAR
Materials
• TI-30X ÙS
• pencils
• student activity
2. Using the table in the activity, enter the data.
Enter points per game as the
X
-variable and
minutes per game (playing time) as the
Y
-variable.
2. Press < to select
2-VAR
.
1. Press v.
X1=
2. Enter
game for the first player,
Rhonda Mapp).
X1=10.1
3. Press $.
Y1=1
4. Enter
game for Rhonda Mapp).
Y1=21.7
5. Press $ to enter data for
the second player.
6. Enter data for each player
in the table. Press $ after
entering each data point.
(points per
10.1
(minutes per
21.7
© 1999 T
EXAS INSTRUMENTS INCORPORATED
TI-30X ÙS: A Guide for Teachers
23
Page 28
WNBA Stats — 2-Variable Statistics
(
Continued)
3. Calculate the statistical data.
You may want to fix the decimal to 2 places
before doing the statistical calculations.
Ask students:
•
What is the average points scored for the
players shown?
•
What is the average playing time?
•
What is the total number of points scored
per game for all the given players?
You may want to discuss the other statistical
variables and what they mean.
4. The form of the equation is
y = ax + b
the equation for the line of best fit (round to
the nearest hundredth).
1.56x + 7.02
. Write
1. Press % ‚.
F0123456789
2. Press 2.
1. Press u.
n Ï Sx Îx Ð
12.00
2. Press " to Ï.
n Ï Sx Îx Ð
9.33
3. Press " " " to Ð.
n Ï Sx Îx Ð
21.59
4. Press " " " to Òx.
Sy Îy Òx
112.00
1. Press " until you get to a.
This is the slope of the line of
best fit.
b r
ÒXY a
1.56
5. The closer the correlation coefficient value is
to 1 (or 1), the better the correlation
between the two variables. Write the
correlation coefficient.
r
= .91
6. Now calculate how many minutes you would
expect a player to play if she averages 15
points per game.
2. Press " to b. This is the
y-intercept of the line.
Ò XY a b
3. Press " to r. This is the
correlation coefficient.
ÒXY a b r
1. Press " " to
x¢ y
2. Press <.
3. Type
y¢(15)
r
7.02
0.91
y¢
.
¢
15
E and press <.
30.44
© 1999 T
EXAS INSTRUMENTS INCORPORATED
TI-30X ÙS: A Guide for Teachers
24
Page 29

WNBA Stats — 2-Variable Statistics
(
Continued)
7. Now calculate how many points you would
expect a player to score if she plays 35 minutes a
game.
8. Discuss the correlation as a class. Ask students:
•
Are there other factors affecting the players
minutes per game besides points scored?
•
What about defense, rebounding, etc.?
Extension
Now have students use the calculator to investigate
the correlation of the other data in the chart such as
the relation of field-goal percentage to minutes per
game, or rebounds per game to minutes per game.
(Remember, since you have already entered the
minutes in
in
X
.)
Ask students:
Y
, you only need to enter the new data
1. Press u.
n Ï Sx Îx Ð
12.00
2. Press ! ! to x¢.
y
x
¢
¢
3. Press <.
35
4. Type
<.
x¢(35)
E and press
17.92
Which 2 variables have the closest correlations?
(That is, which have the correlation coefficient
closest to 1 or 1?)
© 1999 T
EXAS INSTRUMENTS INCORPORATED
TI-30X ÙS: A Guide for Teachers
25
Page 30
WNBA Stats —
Name ___________________________
2-Variable Statistics
Date ___________________________
Problem
Do you think WNBA playing time (in minutes per game) is related to how
many points a player scores? Do you think it is related to how many rebounds
a player gets? Or is it related to the players field goal percentage?
Procedure
Use the following table of data to explore the relationships of different pairs of
data. Begin by entering the points per game as the
per game as the
Player Field-Goal
1. Rhonda Mapp .506 10.1 4.3 21.7
2. Vicky Bullet .441 13.3 6.5 31.6
3. Janeth Arcain .426 6.8 3.6 21.9
Y
-variable.
Percentage
Points
per Game
X
-variable and the minutes
Rebounds
per Game
Minutes
per Game
4. Cynthia Cooper .446 22.7 3.7 35
5. Elena Baranova .420 12.9 9.3 33.6
6. Malgozata Dydek .482 12.9 7.6 28
7. Heidi Burge .509 6.7 3.3 16.7
8. Keri Chaconas .297 4.8 .8 13.2
9. Rebecca Lobo .484 11.7 6.9 29.2
10. Coquese Washington .294 1.9 .9 8.1
11. Toni Foster .467 4.9 1.9 13.6
12. Maria Stepanova .426 3.3 1.9 6.5
© 1999 T
EXAS INSTRUMENTS INCORPORATED
TI-30X ÙS: A Guide for Teachers
26
Page 31

WNBA Stats —
Name ___________________________
2-Variable Statistics
Extension
Use the calculator to investigate the correlation of the other data in the table
such as the relation of field-goal percentage to minutes per game, or rebounds
per game to minutes per game. (Remember, since you have already entered
the minutes per game in
1. What is the average field-goal percentage?
2. Write the equation for the line of best fit.
3. Write the correlation coefficient.
4. What is the average number of rebounds per game?
Y
, you only need to enter the new data in X.)
Date ___________________________
5. Write the equation for the line of best fit.
6. What is the total number of rebounds per
game for all the given players?
7. Write the equation for the line of best fit.
8. Write the correlation coefficient.
9. Which 2 variables have the closest correlation?
(That is, which have the correlation coefficient
closest to 1 or 1?)
© 1999 T
EXAS INSTRUMENTS INCORPORATED
TI-30X ÙS: A Guide for Teachers
27
Page 32
29
33
36
40
43
45
47
52 Pi 58
61
68
75
81
88
91
94
98
How to Use
the TI-30X
TI-30X
Clear, Insert, and Delete
Basic Math
Order of Operations and Parentheses
Constant
Decimals and Decimal Places
Memory
Fractions
Powers, Roots, and Reciprocals
Probability
Statistics
Trigonometry
Notation
Logarithms and Antilogarithms
Angle Settings and Conversions
Polar and Rectangular Conversions
Hyperbolics
Ú
S Basic Operations
Ú
100
S
© 1999 T
EXAS INSTRUMENTS INCORPORATED
TI-30X ÙS: A Guide for Teachers
28
Page 33
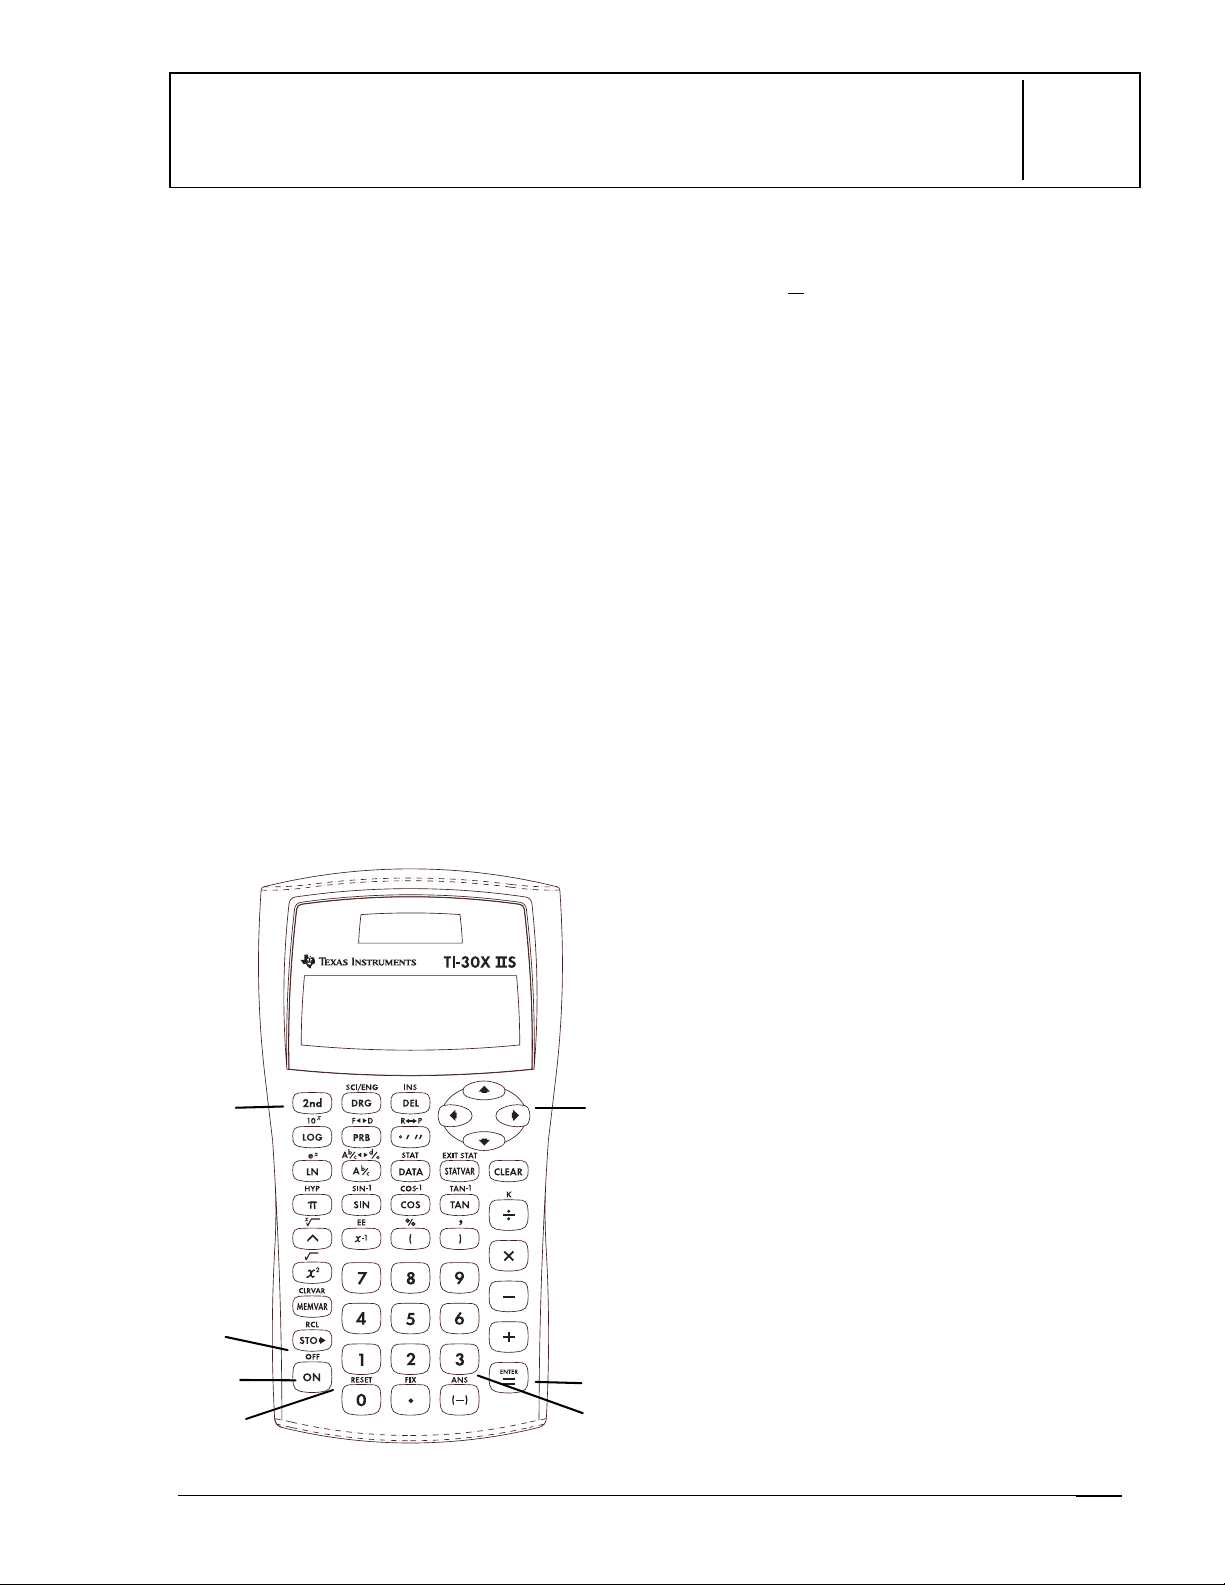
7
TI-30X
Ú
S Basic Operations
Keys
&
1.
2.
3.
4.
5.
6.! and " move the cursor left and right to
turns on the calculator.
%
turns on the
accesses the function shown above the
next key you press.
% '
clears the display.
<
the command.
% i
calculated result and displays it as
scroll the entry line. Press % ! or
% "
the entry line.
turns off the calculator and
completes the operation or executes
recalls the most recently
to scroll to the beginning or end of
indicator and
2nd
Ans
.
%
7.
RESET: N Y
Press
•
underlined to return to the previous
screen without resetting the
calculator.
Press
•
underlined to reset the calculator.
The message
displayed.
Note
simultaneously
immediately. No menu or message is
displayed.
displays the
<
when N (no) is
<
when Y (yes) is
MEM CLEARED
: Pressing & and
resets the calculator
RESET
-
1
menu.
is
#
and $ move the cursor up and down
through previous entries. % # or %
scroll to the beginning or end of history.
2
6
$
Notes
The examples on the transparency masters
•
assume all default settings.
Resetting the calculator:
•
Returns settings to their defaults:
floating decimal (standard) notation
and degree (
Clears memory variables, pending
operations, entries in history,
statistical data, constants, and
(Last Answer).
Ans
The entry line can contain up to 88
•
characters. When ¸ or ¹ appear in the
display, the entry line contains more
characters to the left or right. When º or
appear, more characters are located above
or below the entry line.
DEG
) mode.
»
Press & after Automatic Power Down
3
1
© 1999 T
EXAS INSTRUMENTS INCORPORATED
4
5
•
(APDé). The display, pending operations,
settings, and memory are retained.
TI-30X ÙS: A Guide for Teachers
é
29
Page 34

Second, Off, Arrows,
Equals
Enter 46 N 23. Change 46 to 41.
Change 23 to 26 and complete the
operation. Enter 81 + 57 and
complete the operation. Scroll to
see your previous entries.
Press Display
%
¥
! "
# $ <
46 U 23
! ! ! ! 1
" " 6 <
81 T 57 <
%
¥
&
# # $
46-23
41-26
81+57
~
81+57
DEG
15.
DEG
138.
DEG
DEG
'
'
'
'
© 1999 T
EXAS INSTRUMENTS INCORPORATED
DEG
TI-30X ÙS: A Guide for Teachers
30
Page 35
Reset
Reset the calculator.
Press Display
%
¨
%
¨
"
<
-
Pressing & and - at the same
time also resets the calculator
RESET: N Y
-
DEG
RESET: N Y
-
DEG
MEM CLEARED
DEG
~
DEG
immediately. No menu or message is
displayed.
Using %
returns all settings to their defaults
and clears the memory.
© 1999 T
EXAS INSTRUMENTS INCORPORATED
¨
or & and -
TI-30X ÙS: A Guide for Teachers
31
Page 36

Last Answer (Ans)
Use Last Answer (Ans) to calculate
(2+2)
Press Display
2 T 2 <
%
<
2
ª
.
F
2+2
Ans
4.
DEG
2
16.
DEG
'
%
ª
© 1999 T
EXAS INSTRUMENTS INCORPORATED
TI-30X ÙS: A Guide for Teachers
32
Page 37

Clear, Insert, and Delete
2
Keys
-
1.
messages. Once the display is clear, it
moves the cursor to the most recent
entry.
% f
2.
cursor.
J
3.
Hold
the right. Then, each time you press
deletes 1 character to the left of the
cursor.
clears characters and error
lets you insert a character at the
deletes the character at the cursor.
J
down to delete all characters to
J
, it
Notes
The examples on the transparency masters
•
assume all default settings.
Pressing
•
memories, statistical registers, angle
units, or numeric notation.
-
does not affect the
2
3
1
© 1999 T
EXAS INSTRUMENTS INCORPORATED
TI-30X ÙS: A Guide for Teachers
33
Page 38

Delete, Insert
Enter 4569 + 285, and then
change it to 459 + 2865. Complete
the problem.
Press Display
J %
‘
4569 T 285
! ! ! ! !
! J
" " " "
%
‘
6
<
4569+285
459+285
459+2865
459+2865
DEG
DEG
DEG
3324.
DEG
'
© 1999 T
EXAS INSTRUMENTS INCORPORATED
TI-30X ÙS: A Guide for Teachers
34
Page 39

Clear
Enter 21595.
Clear the 95.
Clear the entry.
Press Display
-
21595
! ! -
(Clear to right)
-
(Clear entry)
21595
DEG
215
DEG
~
DEG
© 1999 T
EXAS INSTRUMENTS INCORPORATED
TI-30X ÙS: A Guide for Teachers
35
Page 40

Basic Math
7
3
Keys
T
1.
adds.
U
2.
subtracts.
V
3.
multiplies.
W
4.
divides.
<
5.
the command.
M
6.
7.
lets you enter a negative number.
% _
completes the operation or executes
changes a real number to a percent.
Notes
The examples on the transparency masters
•
assume all default settings.
The TI-30X ÙS allows implied multiplication.
•
Example
Do not confuse M with U. U allows
•
subtraction.
Results of percent calculations display
•
according to the decimal notation mode
setting.
: 3 (4+3) = 21
4
3
2
1
5
6
© 1999 T
EXAS INSTRUMENTS INCORPORATED
TI-30X ÙS: A Guide for Teachers
36
Page 41

7
Add, Subtract, Multiply,
T U V W
Divide, Equals
Find: 2 + 54 ½ 6 =
16 x 21 =
78 P 2 =
12 x (5 + 6) =
Press Display
2 T 54 U 6
<
16 V 21 <
2+54-6
16*21
50.
DEG
336.
DEG
'
'
<
78 W 2 <
12 V D 5 T
6 E <
78/2
12*(5+6)
39.
DEG
132.
DEG
'
'
© 1999 T
EXAS INSTRUMENTS INCORPORATED
TI-30X ÙS: A Guide for Teachers
3
Page 42

Negative Numbers
The temperature in Utah was L3¡ C
at 6:00 a.m. By 10:00 a.m. the
temperature had risen 12¡ C. What
was the temperature at 10:00 a.m.?
Press Display
M
M 3 T 12
<
-
3+12
9.
DEG
'
© 1999 T
EXAS INSTRUMENTS INCORPORATED
TI-30X ÙS: A Guide for Teachers
38
Page 43

Percent
Mike makes $80 per week. He saves
15% of his earnings. How much does
Mike save per week?
Press Display
%
£
15
%
£
<
V 80
15
15%*80
DEG
12.
DEG
'
© 1999 T
EXAS INSTRUMENTS INCORPORATED
TI-30X ÙS: A Guide for Teachers
39
Page 44

Order of Operations and Parentheses
4
Keys
D
1.
E
2.
opens a parenthetical expression.
closes a parenthetical expression.
Notes
The examples on the transparency masters
•
assume all default settings.
The transparency master showing the
•
Equation Operating System (EOS
demonstrates the order in which the
TI-30X ÙS completes calculations.
Operations inside parentheses are
•
performed first. Use D E to change the
order of operations and, therefore, change
the result.
Example
: 1 + 2 x 3 = 7
(1 + 2) x 3 = 9
TM
)
© 1999 T
EXAS INSTRUMENTS INCORPORATED
1
2
TI-30X ÙS: A Guide for Teachers
40
Page 45

Equation Operating System
(first)
1
Expressions inside D E.
EOS
2
3
4
5
6
7
Functions that need a E and precede the
expression, such as the >, A, or
%
Functions entered after the expression, such as
F and angle unit modifiers (¡, ¢, £, r, g).
Fractions.
Exponentiation (G) and roots (%
Negation (M).
Permutations (nPr), and combinations (nCr).
’
menu items
.
¡
.
)
8
9
10
11
(last)
Multiplication, implied multiplication, and division.
Addition and subtraction.
Conversions (%
<
open parentheses
completes all operations and closes all
š
.
,
%
“
, and
8DMS)
.
© 1999 T
EXAS INSTRUMENTS INCORPORATED
TI-30X ÙS: A Guide for Teachers
41
Page 46

Order of Operations
1 + 2 x 3 =
Press Display
T V D E
1 T 2 V 3
<
1+2*3
7.
DEG
'
(1 + 2) x 3 =
Press Display
D 1 T 2 E V
3 <
(1+2)*3
9.
DEG
'
© 1999 T
EXAS INSTRUMENTS INCORPORATED
TI-30X ÙS: A Guide for Teachers
42
Page 47

Constant
5
Keys
% l
1.
lets you define a constant. A K displays
when the constant mode is on.
<
2.
of the expression in the display.
turns on the constant mode and
places the contents of K at the end
Notes
The examples on the transparency masters
•
assume all default settings.
All functions, except statistics, work in
•
constant mode.
To enter a constant:
•
1. Press % l. If a constant is
already stored, press
it.
2. Enter your constant (any set of
operations, functions, and values).
3. Press
mode. K appears in the display.
4. Press
5. Enter an initial value. If you do not
enter a value, 0 is assumed, and
will appear in the display.
<
to turn on the constant
-
to clear the display.
-
to clear
Ans
6. Press
K
evaluate it.
7. Continue pressing
the constant.
1
2
<
to place the contents of
at the end of the expression and
<
to repeat
The result is stored in
displayed, and the constant is used
to evaluate the new expression.
Ans
, which is
© 1999 T
EXAS INSTRUMENTS INCORPORATED
TI-30X ÙS: A Guide for Teachers
43
Page 48

Constant
Three people babysit for $3.25 each
per hour. First person works 16
hours. Second person works 12
hours. Third person works 17 hours.
How much did each person earn?
Press Display
%
™
%
™
V 3.25 <
-
16 <
12 <
K =
DEG
K = *3.25
DEG K
DEG K
'
16*3.25
52.
DEG K
'
12*3.25
17 <
%
(Constant mode
is off.)
© 1999 T
™
EXAS INSTRUMENTS INCORPORATED
17*3.25
~
39.
DEG K
'
55.25
DEG K
DEG
TI-30X ÙS: A Guide for Teachers
44
Page 49

Decimals and Decimal Places
6
Keys
8
1.
enters a decimal point.
% ‚
2.
lets you set the number of decimal places.
F 0 1 2 3 4 5 6 7 8 9
F
0-9
displays the following menu that
Sets floating decimal
(standard) notation.
Sets number of decimal places.
Notes
The examples on the transparency masters
•
assume all default settings.
% ‚ 8
•
returns to standard notation (floating
decimal).
The
•
•
FIX
and the mantissa of Scientific and
Engineering notation results.
The TI-30X ÙS automatically rounds the
result to the number of decimal places
selected. For example, when the decimal is
set to 2 places, 0.147 becomes 0.15 when
you press
or pads resulting values with trailing zeros
to fit the selected setting. For example,
when the decimal is set to 5 places, 0.147
becomes 0.14700 when you press
removes the setting and
setting affects all decimal results
<
. The TI-30X ÙS also rounds
<
.
All results are displayed to the
•
until you clear the setting by either
pressing % ‚ 8 or selecting
(floating) on the decimal notation menu.
F
Resetting the calculator also clears the
setting.
After pressing % ‚, you can select the
•
number of decimal places in 2 ways:
Press ! or " to move to the
number of decimal places you want,
<
, or
• FIX
and then press
Press the number key that
corresponds to the number of
decimal places you want.
affects only the results, not the entry.
FIX
setting
FIX
© 1999 T
EXAS INSTRUMENTS INCORPORATED
2
TI-30X ÙS: A Guide for Teachers
45
Page 50

Decimal, FIX
Round 12.345 to the hundredths
place, to the tenths place, and then
cancel the FIX setting.
Press Display
8 %
©
12 8 345
%
©
" " "
<
12.345
DEG
F
0123456789
_
DEG
F
0123456789
_
DEG
12.345
FIX DEG
<
%
%
© 1999 T
©
©
EXAS INSTRUMENTS INCORPORATED
1
8
12.345
FIX DEG
12.345
FIX DEG
12.345
12.35
12.3
12.345
DEG
TI-30X ÙS: A Guide for Teachers
'
'
'
46
Page 51

7
Memory
Keys
L
1.
displays the following menu of
variables.
A B C D E
Lets you select a variable
in which to store the
displayed value. The new
variable replaces any
previously stored value.
% {
3.
% h
4.
variables.
A B C D E
7
clears all variables.
displays the following menu of
Lets you view the stored
value before pasting it to
the display.
rand
z
2.
variables.
A B C D E
Lets you set a seed value
for random integers.
displays the following menu of
Lets you view the stored
value before pasting it in
variable form to the display.
Notes
The examples on the transparency masters
•
assume all default settings.
You can store a real number or an
•
expression that results in a real number to
a memory variable.
When you select a variable using
•
the variable name (A, B, C, D, or E) is
displayed on the entry line.
When you select a variable using %
the value of the stored variable is
displayed on the entry line.
Resetting the calculator clears all memory
•
variables.
For more about
•
Probability.
, see Chapter 11,
rand
z
h
,
,
3
2
4
1
© 1999 T
EXAS INSTRUMENTS INCORPORATED
TI-30X ÙS: A Guide for Teachers
4
Page 52

Store, Memory Variable,
L z
Clear Variable
Test scores: 96, 76, 85.
Weekly scores: 92, 83, 97, and 86.
Find the average of test and weekly
scores. Find the final average.
Press Display
96 T 76 T
85 <
W 3 <
96+76+85
257.
DEG
'
Ans/3
85.66666667
DEG
%
¦
L <
92 T 83 T
97 T 86 <
W 4 <
T z
< <
W 2 <
'
Ans¹A
85.66666667
DEG
'
92+83+97+86
358.
DEG
'
Ans/4
89.5
DEG
'
Ans+A
175.1666667
DEG
'
Ans/2
© 1999 T
EXAS INSTRUMENTS INCORPORATED
87.58333333
DEG
TI-30X ÙS: A Guide for Teachers
48
Page 53

Store, Recall
L
Which would be the better buy: 3
cassette tapes for $7.98, or 4
cassette tapes for $9.48?
Press Display
7 8 98 W 3
<
L <
9 848 W 4
7.98/3
Ans¹A
9.48 / 4
2.66
DEG
2.66
DEG
'
'
%
§
<
L " <
View the first price again.
%
§
View the second price again.
"
Ans¹B
A B C D E
_
A B C D E
_
2.37
DEG
2.37
DEG
2.66
DEG
2.37
DEG
'
'
'
© 1999 T
EXAS INSTRUMENTS INCORPORATED
TI-30X ÙS: A Guide for Teachers
49
Page 54

Store, Recall
L
Shop Purchases Qty Cost
A shirts 2 $13.98 ea.
B ties 3 $7.98 ea.
C belt 1 $6.98
suspenders 1 $9.98
How much did you spend at each
shop, and how much did you spend
altogether?
Press Display
2 V 13 8 98
2*13.98
%
§
<
L
<
3 V 7 8 98
<
27.96
A B C D E
27.96
Ans¹A
27.96
3*7.98
23.94
DEG
DEG
DEG
DEG
¹
'
'
'
Continued
© 1999 T
EXAS INSTRUMENTS INCORPORATED
TI-30X ÙS: A Guide for Teachers
50
Page 55

Store, Recall
(Continued)
L
Press Display
L " <
6 8 98 T
9 8 98 <
L " "
<
%
§
Ans¹B
23.94
DEG
6.98+9.98
16.96
DEG
Ans¹C
16.96
DEG
27.96+
'
'
'
'
%
§
< T
%
§
"
< T
%
§
" "
< <
¸
.96+23.94+
27.96+23.94
68.86
DEG
¹
DEG
¹
DEG
'
'
© 1999 T
EXAS INSTRUMENTS INCORPORATED
TI-30X ÙS: A Guide for Teachers
51
Page 56

Fractions
8
Keys
N
1.
2.
3.
lets you enter mixed numbers and
fractions.
% O
a mixed number or a mixed number to a
simple fraction.
% j
equivalent or changes a decimal to its
fractional equivalent, if possible.
3
2
1
converts a simple fraction to
converts a fraction to its decimal
Notes
The examples on the transparency masters
•
assume all default settings.
To enter a mixed number or a fraction,
•
press
the numerator and between the numerator
and the denominator.
You can enter a fraction or mixed number
•
anywhere you can enter a decimal value.
You can use fractions and decimals
•
together in a calculation.
Fractional results and entries are
•
automatically reduced to their lowest
terms.
Fractional calculations can show fractional
•
or decimal results.
N
between the whole number and
When possible, calculations involving
2 fractions or a fraction and any
integer will display fractional results.
Calculations involving a fraction and
a decimal will always display results
as decimals.
© 1999 T
EXAS INSTRUMENTS INCORPORATED
For a mixed number, the whole number can
•
be up to 3 digits, the numerator can be up
to 3 digits, and the denominator can be
any number through 1000.
For a simple fraction, the numerator can be
•
up to 6 digits and the denominator can be
any number through 1000.
TI-30X ÙS: A Guide for Teachers
52
Page 57

Fractions
5
At the party, you ate
pepperoni pizza and
sausage pizza. How much pizza did
you eat?
/
1
10
of the
/
6
of the
N
Press Display
5 N 6 T 1
N 10 <
5®6+1®10
14 / 15
DEG
'
© 1999 T
EXAS INSTRUMENTS INCORPORATED
TI-30X ÙS: A Guide for Teachers
53
Page 58

Mixed Numbers
3
A baby weighed 4
birth. In the next 6 months, she
3
4
gained 2
kilograms.
/
How much does she weigh?
Press Display
8
kilograms at
/
N
4 N 3 N
8 T 2 N 3
N 4 <
4®3®8+2®3®4
7− 1/8
DEG
'
© 1999 T
EXAS INSTRUMENTS INCORPORATED
TI-30X ÙS: A Guide for Teachers
54
Page 59

Mixed Number to Fraction,
Fraction to Mixed Number
Sam is making his birthday cake.
1
2
1
2
/
/
-cup
cups of
The recipe calls for 3
flour. He has only a
measuring cup. To find out how
many times Sam must use his
measuring cup, change the mixed
number to a fraction.
%
š
3
1
/
2
¾
1
/
= 7
2
Press Display
3 N 1 N 2
%
š
<
3®1®2
3®1®2'
3®1®2'
DEG
b
A
/
b
A
/
c , '
DEG
c
, '
d
e
/
'
d
e
/
Show the mixed number again.
b
A
c ,
%
š
Ans'
/
<
© 1999 T
EXAS INSTRUMENTS INCORPORATED
7 / 2
DEG
d
e
'
/
3− 1/2
DEG
'
TI-30X ÙS: A Guide for Teachers
55
Page 60

Fraction to Decimal
Juan swims 20 laps in 5.72 minutes.
3
Mary swims 20 laps in 5
minutes. Change Mary’s time to a
decimal to determine who swims
faster.
Press Display
4
/
%
“
5 N 3 N
4 %
“
<
5®3®4.F
5®3®4.F
, '
, '
D
DEG
D
5.75
DEG
'
© 1999 T
EXAS INSTRUMENTS INCORPORATED
TI-30X ÙS: A Guide for Teachers
56
Page 61

7
Decimal to Fraction
Change 2.25 to its fractional
equivalent.
Press Display
%
“
2 8 25
%
“
<
2.25.F
, '
D
2−1®4
DEG
© 1999 T
EXAS INSTRUMENTS INCORPORATED
TI-30X ÙS: A Guide for Teachers
5
Page 62

Pi
9
Keys
g
1.
displays the value of pi rounded to 10
digits (3.141592654).
Notes
The examples on the transparency masters
•
assume all default settings.
Internally, pi is stored to 13 digits
•
(3. 141592653590).
After pressing % ‚, you can select the
•
number of decimal places in 2 ways:
Press ! or " to move to the
number of decimal places you want,
and then press
Press the number key that
corresponds to the number of
decimal places you want.
The transparency masters show both
ways.
<
, or
1
© 1999 T
EXAS INSTRUMENTS INCORPORATED
TI-30X ÙS: A Guide for Teachers
58
Page 63

Circumference
Use this formula to find the amount
of border you need if you want to
put a circular border all the way
around the tree.
C = 2pr = 2 x p x 1.5m
g
Press Display
2 V g V 1.5
<
© 1999 T
EXAS INSTRUMENTS INCORPORATED
*p*
2
1.5
9.424777961
DEG
'
TI-30X ÙS: A Guide for Teachers
59
Page 64

Area
Use this formula to find how much
of a lawn would be covered by the
sprinkler. Round your answer to the
nearest whole number, and then
return to Floating Decimal mode.
g
A = pr2 = p x 4
2
Press Display
g V 4 F
<
2
p
*
4
50.26548246
DEG
%
©
<
%
© 1999 T
©
EXAS INSTRUMENTS INCORPORATED
"
8
F 0123456789123456789
_
DEG
2
p
*
4
FIX DEG
2
*
p
4
50.26548246
50.
DEG
TI-30X ÙS: A Guide for Teachers
'
'
60
Page 65

Powers, Roots, and Reciprocals
10
Keys
F
1.
% b
2.
% c
3.
the value.
a
4.
G
5.
squares the value.
calculates the square root.
calculates the specified root (x) of
calculates the reciprocal.
raises a value to a specified power.
Notes
The examples on the transparency masters
•
assume all default settings.
To use G, enter the base, press G, and
•
then enter the exponent.
The base (or mantissa) and the exponent
•
may be either positive or negative. Refer to
Domain under Error Messages in Appendix
C for restrictions.
The result of calculations with G must be
•
within the range of the TI-30X ÙS.
A sign change takes precedence over
•
exponents.
2
Example
: L5
(L5)
2
= L25
= 25
4
3
5
2
1
© 1999 T
EXAS INSTRUMENTS INCORPORATED
TI-30X ÙS: A Guide for Teachers
61
Page 66

Squares
Use this formula to find the size of
the tarp needed to cover the entire
baseball infield.
F G
A = x
2
= 27.4
2
Press Display
27.4 F <
27.4
2
'
or
27.4 G 2
<
© 1999 T
EXAS INSTRUMENTS INCORPORATED
750.76
DEG
'
90
^2
750.76
DEG
TI-30X ÙS: A Guide for Teachers
62
Page 67

Square Roots
Use this formula to find the length
of the side of a square clubhouse if
2
3m
Round your answer to 0 decimal
places.
of carpet would cover the floor.
L = x = 3
%
œ
of carpet
Press Display
(3)
1.732050808
(3)
DEG
2.
DEG
%
œ
<
%
©
<
3 E
"
© 1999 T
EXAS INSTRUMENTS INCORPORATED
TI-30X ÙS: A Guide for Teachers
63
Page 68

Cubes
Use this formula to find the volume
of a cube with sides 2.3 meters long.
Change your answer to a fraction.
G
V = L
3
= 2.3
3
Press Display
2 8 3 G 3
<
2.3^3
12.167
DEG
'
%
“
<
© 1999 T
EXAS INSTRUMENTS INCORPORATED
'
Ans.F
TI-30X ÙS: A Guide for Teachers
, .
D
12−167/1000
DEG
64
Page 69

Powers
Fold a piece of paper in half, in half
again, and so on until you cannot
physically fold it in half again. How
many sections would there be after
10 folds? After 15 folds?
Press Display
G
2 G 10 <
2 G 15 <
2^10
2^15
1024.
DEG
32768.
DEG
'
'
© 1999 T
EXAS INSTRUMENTS INCORPORATED
TI-30X ÙS: A Guide for Teachers
65
Page 70

Roots
If the volume of a cube is 125 cm3,
what is the length of each side?
Press Display
x
Ñ
125.
3 %
<
¡
125
3
5.
DEG
%
¡
© 1999 T
EXAS INSTRUMENTS INCORPORATED
TI-30X ÙS: A Guide for Teachers
66
Page 71

7
Reciprocals
The chart below shows the amount
of time spent building model ships.
Time Portion
Spent Completed
Ships Building Per Hour
Sailing 10 hrs. ?
Steam 5 hrs. ?
1
Luxury 5
How much of each model was
completed per hour?
Press Display
/
hrs. ?
3
a
Sailing ship:
10 a %
“
<
Steam ship:
5 a %
“
<
Luxury liner:
5 N 1 N 3
a <
-1
10
.F
-1
.F
, .
5
5®1®3
, .
D
-1
D
1 / 10
DEG
1 / 5
DEG
3 / 16
DEG
'
'
'
© 1999 T
EXAS INSTRUMENTS INCORPORATED
TI-30X ÙS: A Guide for Teachers
6
Page 72

Probability
11
Keys
H
1.
displays the following menu of
functions.
Calculates the number of
nPr
possible permutations.
nCr
Calculates the factorial.
!
RAND
RANDI
Calculates the number of
possible combinations.
Generates a random 10digit real number between
0 and 1.
Generates a random
integer between 2 numbers
that you specify.
Notes
The examples on the transparency masters
•
assume all default settings.
A
combination
•
objects in which the order is not important,
as in a hand of cards.
A
permutation
•
objects in which the order is important, as
in a race.
A
factorial
•
integers from 1 to n, where n is a positive
whole number 69.
To control a sequence of random numbers,
•
you can store (
just as you would store values to memory
variables. The seed value changes randomly
when a random number is generated.
is an arrangement of
is an arrangement of
is the product of all the positive
L
) an integer to
RAND
For
•
1
RANDI
numbers that you specify.
, use a comma to separate the 2
© 1999 T
EXAS INSTRUMENTS INCORPORATED
TI-30X ÙS: A Guide For Teachers
68
Page 73

Combination (nCr)
You have space for 2 books on your
bookshelf. You have 4 books to put
on the shelf. Use this formula to
find how many ways you could place
the 4 books in the 2 spaces.
4 nCr 2 = x
ABCD
H
AB and BA
count as only 1
combination.
AB AC AD
BA
CA
DA
BC BD
CB CD
DB DC
Press Display
4 H "
2 <
nPr nCr !
---
DEG
4 nCr 2
6.
DEG
¹
'
© 1999 T
EXAS INSTRUMENTS INCORPORATED
TI-30X ÙS: A Guide For Teachers
69
Page 74

Permutation (nPr)
Four different people are running in
a race. Use this formula to find how
many different ways they can place
st
1
and 2nd.
4 nPr 2 = x
ABC D
H
AB and BA
count as 2
permutations.
AB AC AD
BA BC BD
CA CB CD
DA DB DC
Press Display
4 H
2 <
nPr nCr !
---
DEG
4 nPr 2
12.
DEG
¹
'
© 1999 T
EXAS INSTRUMENTS INCORPORATED
TI-30X ÙS: A Guide For Teachers
70
Page 75

Factorial (!)
Using the digits 1, 3, 7, and 9 only
one time each, how many 4-digit
numbers can you form?
4! = x
1379
ABCD
H
ABCD
BACD
CABD
DABC
ABDC
BADC
CADB
DACB
ACBD
BCAD
CBAD
DBAC
ACDB
BCDA
CBDA
DBCA
ADBC
BDCA
CDAB
DCAB
ADCB
BDAC
CDBA
DCBA
Press Display
4 H " "
< <
nPr nCr !
DEG
4!
24.
DEG
¹
-
'
© 1999 T
EXAS INSTRUMENTS INCORPORATED
TI-30X ÙS: A Guide For Teachers
71
Page 76

Random (RAND)
Generate a sequence of random
numbers.
Press Display
H
H " " "
< <
< <
Results will vary.
¸
RAND RANDI
___
-
DEG
RAND
0.839588694
DEG
RAND
0.482688185
DEG
'
'
© 1999 T
EXAS INSTRUMENTS INCORPORATED
TI-30X ÙS: A Guide For Teachers
72
Page 77

Random (RAND)
Set 1 as the current seed and
generate a sequence of random
numbers.
Press Display
H
1 L !
< <
H " " "
< <
<
¸
rand
----
1083958869.
1¹rand
RAND
0.000018633
RAND
0.745579721
DEG
1.
DEG
DEG
DEG
'
'
'
© 1999 T
EXAS INSTRUMENTS INCORPORATED
TI-30X ÙS: A Guide For Teachers
73
Page 78

Random Integer (RANDI)
Generate a random integer from 2
through 10.
Press Display
H
H !
< 2 %
¤
10 E
<
Results will vary.
¸
RAND RANDI
---
DEG
¸
ANDI( 2, 10)
DEG
RANDI( 2, 10)
3.
DEG
__
¹
'
'
© 1999 T
EXAS INSTRUMENTS INCORPORATED
TI-30X ÙS: A Guide For Teachers
74
Page 79

Statistics
12
Keys
% t
1.
can select
1-VAR
2-VAR
CLRDATA
v
2.
1-VAR
displays a menu from which you
1-VAR, 2-VAR
or
CLRDATA
Analyzes data from 1 set
of data with 1 measured
variable—x.
nalyzes paired data from
A
2 sets of data with 2
measured variables—x, the
independent variable, and
y
, the dependent variable.
Clears data values without
exiting
STAT
mode.
lets you enter data points (
stats; x and y for
2-VAR
stats).
% w
3.
displays the following menu
that lets you clear data values and exit
mode.
.
STAT
EXIT ST: Y N
•
Press
<
when Y (yes) is
underlined to clear data values and
•
exit
Press
STAT
<
mode.
when N (no) is
underlined to return to the previous
4.
screen without exiting
u
displays the menu of variables
STAT
mode.
with their current values.
for
x
n
Number of x (or x,y) data
points.
v
Sx
or
or
w
Sy
Mean of all x or y values.
Sample standard deviation
of x or
y.
or sy Population standard
sx
deviation of x or y.
Gx
or
Gy
Sum of all x values or
y
values.
Gx
2
or
Gy
2
Sum of all
2
x
values or
2
y
values.
Gxy
Sum of (
x
y)
Q
for all
xy
pairs in 2 lists.
1
3
a
b
2
r
Linear regression slope.
Linear regression
y-intercept.
Correlation coefficient.
Notes
The examples on the transparency masters
•
assume all default settings.
To save the last data point or frequency
•
value entered, you must press
<
or $.
© 1999 T
EXAS INSTRUMENTS INCORPORATED
You can change data points once they are
•
entered.
TI-30X ÙS: A Guide For Teachers
75
Page 80

Entering 1-VAR Stat Data
Five students took a math test.
Using their scores, enter the data
points—85, 85, 97, 53, 77.
Press Display
%
”
v
%
”
< v
85
$
2
1-VAR 2-VAR
-----
X1=
X1=85
FRQ=1
FRQ=2
-
DEG
STAT DEG
STAT DEG
STAT DEG
STAT DEG
¹
S
S
S
S
$ 97
$ $ 53
$ $ 77 <
Continued
© 1999 T
EXAS INSTRUMENTS INCORPORATED
X2=97
X3=53
X
=77
4
STAT DEG
STAT DEG
77.
STAT DEG
S
S
S
TI-30X ÙS: A Guide For Teachers
76
Page 81

7
Viewing the Data
(Cont.)
Find the number of data points (n),
the mean (v), the sample standard
deviation (Sx), the population
standard deviation (sx), the sum of
u
the scores (
squares (
Gx
), and the sum of the
Gx
2
).
Press Display
u
"
"
"
n v Sx sx
-
STAT DEG
n v Sx sx
-
STAT DEG
79.4
n v Sx sx
---
16.39512123
STAT DEG
n v Sx sx
---
¹
5.
¹
¹
¹
"
"
Continued
© 1999 T
EXAS INSTRUMENTS INCORPORATED
14.66424222
STAT DEG
¸
Gx Gx
---
STAT DEG
x
¸
G
STAT DEG
x
G
---
2
397.
22
32597.
TI-30X ÙS: A Guide For Teachers
7
Page 82

Removing Data Points
(Cont.)
Return to the first data point.
Display the lowest score, drop it,
and then find the new mean (v).
%
˜
Clear all data by exiting
STAT
mode.
Press Display
v
$ $ $ $
$ 0 <
u "
X1=85
X3=53
FRQ=0
n
v
-
STAT DEG
STAT DEG
STAT DEG
Sx
STAT DEG
0.
x
s
86.
S
S
S
%
˜
<
© 1999 T
EXAS INSTRUMENTS INCORPORATED
EXIT ST: Y N
-
STAT DEG
~
DEG
TI-30X ÙS: A Guide For Teachers
78
Page 83

Entering 2-VAR Stat Data
The table below shows the number of
pairs of athletic shoes sold by a
small shoe store. Enter this data
as the data points.
Month Total No.(x) Brand A (y)
April 58 (x1) 35 (y1)
May 47 (x2) 28 (y2)
Press Display
%
”
v
%
”
"
< v
58
$ 35
$ 47
1-VAR 2-VAR
-----
DEG
X1=
STAT DEG
X1=58
STAT DEG
Y1=35
STAT DEG
X2=47
STAT DEG
&
S
S
S
S
$ 28
<
Continued
© 1999 T
EXAS INSTRUMENTS INCORPORATED
Y2=28
Y
=28
2
STAT DEG
28.
STAT DEG
S
S
TI-30X ÙS: A Guide For Teachers
79
Page 84

Viewing the Data
(Cont.)
u
If the store sells 32 pairs of shoes
in June, predict the June sales of
Brand A. When finished, exit STAT
mode and clear all data points.
Press Display
u !
< 32 E
<
%
x’ y’
-
t
y’ (32)
18.45454545
t
DEG
DEG
%
˜
%
˜
<
EXIT ST: Y N
-
t
~
DEG
DEG
© 1999 T
EXAS INSTRUMENTS INCORPORATED
TI-30X ÙS: A Guide For Teachers
80
Page 85

Trigonometry
13
Keys
@
1.
% \
2.
?
3.
% [
4.
>
5.
% Z
6.
calculates the tangent.
calculates the inverse tangent.
calculates the cosine.
calculates the inverse cosine.
calculates the sine.
calculates the inverse sine.
Notes
The examples on the transparency masters
•
assume all default settings.
Before starting a trigonometric
•
calculation, be sure to select the
appropriate angle mode setting (
radian, or gradient
Angle Settings and Conversions). The
calculator interprets values according to
the current angle-unit mode setting.
E
•
ends a trig function.
—See Chapter 16,
degree,
6
5
© 1999 T
EXAS INSTRUMENTS INCORPORATED
2
1
4
3
TI-30X ÙS: A Guide For Teachers
81
Page 86

Tangent
Use this formula to find the
distance from the lighthouse to the
boat. Round your answer to the
nearest whole number, and then
return to floating decimal mode.
D = 78/TAN 27
@
Press Display
78 W @
27 E <
%
©
"
<
%
©
8
78/tan (27)
153.0836194
F 0 1 2 3 4 5 6 7 8 9
-
78/tan (27)
FIX DEG
78/tan (27)
153.0836194
DEG
DEG
153.
DEG
'
'
'
© 1999 T
EXAS INSTRUMENTS INCORPORATED
TI-30X ÙS: A Guide For Teachers
82
Page 87

Inverse Tangent
Use this formula to find the angle of
depression. Round your answer to
the nearest tenth, and then return
to floating decimal mode.
TAN x = 600/2500
%
Ÿ
Press Display
%
Ÿ
600 W
2500 E <
%
©
" "
<
%
©
8
-1
tan
F 0 1 2 3 4 5 6 7 8 9
tan
tan
(600/25
13.49573328
-
-1
(600/25
FIX DEG
-1
(600/25
13.49573328
DEG
DEG
13.5
DEG
¹
¹
¹
'
'
© 1999 T
EXAS INSTRUMENTS INCORPORATED
TI-30X ÙS: A Guide For Teachers
83
Page 88

Cosine
Use this formula to find how far the
base of the ladder is from the
house. Round your answer to the
nearest whole number, and then
return to floating decimal mode.
D = 5 x COS 75
?
Press Display
5 V ?
75 E <
%
©
"
<
%
©
8
5*cos (75)
1.294095226
F 0 1 2 3 4 5 6 7 8 9
-
FIX DEG
5*cos (75)
FIX DEG
5*cos (75)
1.294095226
DEG
1.
DEG
'
'
'
© 1999 T
EXAS INSTRUMENTS INCORPORATED
TI-30X ÙS: A Guide For Teachers
84
Page 89

Inverse Cosine
Use this formula to find the angle of
the ski jump. Round your answer to
the nearest tenth, and then return
to floating decimal mode.
COS x = 453/500
%
Press Display
%
453 W
cos
-1
(453/50
25.04169519
¹
DEG
500 E <
F 0 1 2 3 4 5 6 7 8 9
cos
cos
-
DEG
-1
(453/50
FIX DEG
-1
(453/50
25.04169519
25.0
DEG
¹
¹
'
'
%
©
<
%
©
" "
8
© 1999 T
EXAS INSTRUMENTS INCORPORATED
TI-30X ÙS: A Guide For Teachers
85
Page 90

Sine
Use this formula to find the length
of the ramp. Round your answer to
the nearest whole number, and then
return to floating decimal mode.
D = 1.5/SIN 12
Press Display
>
1 8 5 W >
12 E <
%
©
"
<
%
©
8
DEG
DEG
7.
DEG
¹
¹
¹
1.5/sin (12)
7.214601517
F 0 1 2 3 4 5 6 7 8 9
-
1.5/sin (12)
FIX DEG
1.5/sin (12)
7.214601517
'
'
'
© 1999 T
EXAS INSTRUMENTS INCORPORATED
TI-30X ÙS: A Guide For Teachers
86
Page 91

7
Inverse Sine
Use this formula to find the angle of
the conveyor belt. Round your
answer to the nearest tenth, and
then return to floating decimal
mode.
SIN x = 13/20
%
Press Display
¹
¹
¹
'
'
'
%
13 W
20 E <
%
©
" "
<
%
©
8
-1
sin
F 0 1 2 3 4 5 6 7 8 9
sin
sin
(13/20)
40.54160187
-
-1
(13/20)
FIX DEG
-1
(13/20)
40.54160187
DEG
DEG
40.5
DEG
© 1999 T
EXAS INSTRUMENTS INCORPORATED
TI-30X ÙS: A Guide For Teachers
8
Page 92

Notation
Keys
% d
1.
notation mode menu.
displays the following numeric
% C
2.
exponent.
14
lets you enter and calculate the
FLO
SCI
ENG
Restores standard mode
(floating decimal).
Turns on scientific mode
and displays results as a
number from 1 to 10 (1 n
< 10) times 10 to an
integer power.
Turns on engineering mode
and displays results as a
number from 1 to 1000 (1
n < 1000) times 10 to an
integer power. The integer
power is always a multiple
of 3.
Notes
The examples on the transparency masters
•
assume all default settings.
You can enter a value in scientific notation
•
regardless of the numeric notation mode
setting. For a negative exponent, press
before entering it.
Results requiring more than 10 digits are
•
automatically displayed in scientific
notation.
For the Decimal notation mode, refer to
•
% ‚
Decimal Places.
These modes (
•
only
in Chapter 6, Decimals and
FLO, SCI
the display of results.
, and
ENG
) affect
M
1
2
© 1999 T
EXAS INSTRUMENTS INCORPORATED
TI-30X ÙS: A Guide For Teachers
88
Page 93

Engineering, Scientific,
Floating Decimal
Enter 12543, which will be in floating
decimal notation (default), and
alternate between scientific and
engineering notations.
Press Display
%
12543
%
"
< <
%
"
<
%
"
FLO SCI ENG
---
DEG
12543
04
1.2543
SCI DEG
FLO SCI ENG
SCI DEG
12543
12.543
ENG DEG
FLO SCI ENG
---
x10
---
03
x10
'
'
<
© 1999 T
EXAS INSTRUMENTS INCORPORATED
12543
ENG DEG
12543.
DEG
'
TI-30X ÙS: A Guide For Teachers
89
Page 94

Exponent
The Earth is 1.496 x 10⁸ kilometers
%
¢
from the Sun. Jupiter is 7.783 x 10
8
kilometers from the Sun. Enter the
numbers in Scientific notation and
determine how far away the Earth is
from Jupiter.
Press Display
'
7 8 783
%
¢
8
7.783E 8-1.4
628700000.
¹
DEG
U 1 8 496
¢
%
8
<
© 1999 T
EXAS INSTRUMENTS INCORPORATED
TI-30X ÙS: A Guide For Teachers
90
Page 95

Logarithms and Antilogarithms
15
Keys
A
1.
2.
3.
4.
calculates the common logarithm
(base 10).
B
calculates the natural logarithm (base
e
, where e = 2.718281828459).
% ]
antilogarithm (10 raised to the power of
the value).
% ^
antilogarithm (e raised to the power of the
value).
calculates the common
calculates the natural
Note
The examples on the transparency masters
•
assume all default settings.
E
•
ends a logarithmic function.
3
1
4
2
© 1999 T
EXAS INSTRUMENTS INCORPORATED
TI-30X ÙS: A Guide For Teachers
91
Page 96

Common Logarithm,
Natural Logarithm
Find log 23 rounded to 4 decimal
places. Then find ln 23 rounded to 4
decimal places and return to
Floating Decimal notation.
Press Display
A B
A 23 E
<
%
©
4
B 23 E
<
%
©
8
log (23)
1.361727836
F 0 1 2 3 4 5 6 7 8 9
-
log (23)
FIX DEG
ln (23)
FIX DEG
ln (23)
3.135494216
DEG
DEG
1.3617
3.1355
DEG
'
'
'
'
© 1999 T
EXAS INSTRUMENTS INCORPORATED
TI-30X ÙS: A Guide For Teachers
92
Page 97

Common Antilogarithm,
Natural Antilogarithm
%
Find antilog 3.9824 rounded to 4
decimal places. Then find antiln
3.9824 rounded to 4 decimal
places. When finished, return to
Floating Decimal notation.
Press Display
'
%
3 8
9824 E <
%
©
10^ (3.9824)
9602.846792
F 0 1 2 3 4 5 6 7 8 9
-
DEG
%
4
%
3 8
9824 E <
%
©
8
10^ (3.9824)
9602.8468
FIX DEG
e^ (3.9824)
53.6456
FIX DEG
e^ (3.9824)
53.64562936
DEG
'
'
'
DEG
© 1999 T
EXAS INSTRUMENTS INCORPORATED
TI-30X ÙS: A Guide For Teachers
93
Page 98

Angle Settings and Conversions
Keys
=
I
1.
displays the following menu that lets
you change the
, and
RAD
in the display.
DEG
RAD
GRD
When you turn on the TI30X ÖS, it is
always in the
GRD
Sets degree mode.
Sets radian mode.
Sets gradient mode.
DEG
mode setting to
angle
without affecting the value
mode.
DEG
2.
,
Notes
•
•
displays a menu that lets you specify
the unit of an angle.
º
r
g
DMS
The examples on the transparency masters
assume all default settings.
Angles with a trig function ignore the angle
mode setting and display results in the
original unit. Otherwise, angles (without a
trig function) are converted and displayed
according to the angle mode setting.
Specifies degrees.
Specifies radians.
Specifies gradients.
Specifies degrees (º), minutes
(´), and seconds (´´). It also lets
you convert an angle from
decimal degrees to
notation.
16
DMS
You enter decimal-degree angles the same
•
as you would any other number.
For decimal/
1
2
•
calculator interprets all values as degrees,
regardless of the angle-unit setting.
• DMS
angles are entered as º (degrees),
(minutes), and ´´ (seconds).
´
conversions, the
DMS
© 1999 T
EXAS INSTRUMENTS INCORPORATED
TI-30X ÙS: A Guide For Teachers
94
Page 99

Degrees, Minutes, and
Seconds to Decimal
You watched 2 videos that were 2:05
(2 hours and 5 minutes) and 1:46
(1 hour and 46 minutes) in length.
How long did you watch videos?
Press Display
=
2 =
<
5 = "
< T 1 =
<
46 = "
Å
¡
-
¡
2
Å
¡
-
2¡ 5Å + 1
r g
Æ
r g
Æ
¡
DEG
DEG
DEG
DEG
2¡ 5Å + 1¡ 46
¹
'
¹
'
Å
'
< <
= !
< <
© 1999 T
EXAS INSTRUMENTS INCORPORATED
¸
'DMS
----
Ans ' DMS
3¡ 51Å 0
3.85
DEG
DEG
'
Æ
DEG
TI-30X ÙS: A Guide For Teachers
95
Page 100

Fraction to Degrees,
Minutes, and Seconds
2
3
How much is
minutes, and seconds?
Press Display
/
of an hour in hours,
=
2 N 3
= !
< <
2®3
%
'DMS
----
2®3 ' DMS
¡
40Å
0
DEG
DEG
DEG
0
'
'
Æ
© 1999 T
EXAS INSTRUMENTS INCORPORATED
TI-30X ÙS: A Guide For Teachers
96
 Loading...