

Page 1
S/5
S/5
S/5
Datex-Ohmeda Hemodynamic modules
TM
NE12STPR Module, M-NE12STPR (rev. 01)
TM
NE12STR Module, M-NE12STR (rev. 01)
TM
NE12TPR Module, M-NE12TPR (rev. 01)
TM
S/5
NESTPR Module, M-NESTPR (rev. 01)
TM
S/5
S/5
S/5
NESTR Module, M-NESTR (rev. 01)
TM
NETPR Module, M-NETPR (rev. 01)
TM
ESTPR Module, M-ESTPR (rev. 04)
TM
S/5
S/5
ESTR Module, M-ESTR (rev. 04)
TM
ETPR Module, M-ETPR (rev. 04)
Technical Reference Manual Slot
Datex-Ohmeda Inc.
3030 Ohmeda Drive
53707-7550 MADISON, WIS
USA
Tel. +1-608-221 1551,Fax +1-608-222 9147
www.us.datex-ohmeda.com
All specifications are subject to change without notice.
Document No. 800 1008-2
June 2001
Datex-Ohmeda Division,
Instrumentarium Corp.
P.O. Box 900, FIN-00031
DATEX-OHMEDA, FINLAND
Tel. +358 10 394 11 Fax +358 9 146 3310
www.datex-ohmeda.com
Instrumentarium Corp. All rights reserved.
Page 2

Page 3

Table of contents
TABLE OF CONTENTS
HEMODYNAMIC MODULES
TABLE OF CONTENTS i
Table of figures iii
Introduction 1
1 Specifications 2
1.1 General specifications ..............................................................................................................................2
1.2 Typical performance .................................................................................................................................2
1.2.1 NIBP................................................................................................................................................2
1.2.2 ECG.................................................................................................................................................3
1.2.3 Pulse oximetry..................................................................................................................................3
1.2.4 Temperature.....................................................................................................................................4
1.2.5 Invasive blood pressure ....................................................................................................................4
1.2.6 Respiration ......................................................................................................................................4
1.3 Technical specifications............................................................................................................................5
1.3.1 NIBP................................................................................................................................................5
1.3.2 ECG.................................................................................................................................................5
1.3.3 Pulse oximetry..................................................................................................................................6
1.3.4 Temperature.....................................................................................................................................6
1.3.5 Invasive blood pressure ....................................................................................................................6
1.3.6 Respiration ......................................................................................................................................6
2 Functional Description 7
2.1 Measurement principle .............................................................................................................................7
2.1.1 NIBP................................................................................................................................................7
2.1.2 ECG.................................................................................................................................................7
2.1.3 Pulse oximetry..................................................................................................................................7
2.1.4 Temperature.....................................................................................................................................9
2.1.5 Invasive blood pressure ..................................................................................................................10
2.1.6 Respiration ....................................................................................................................................10
2.2 Main components...................................................................................................................................10
M-ESTPR/-ETPR/-ESTR modules...............................................................................................................10
M-NE12STPR/-NE12STR/-NE12TPR/-NESTPR/-NESTR/-NETPR modules .................................................11
2.2.3 NIBP board ....................................................................................................................................12
2.2.4 ECG board in 3-and 5-lead measurement........................................................................................14
2.2.5 ECG board in 12-lead measurement ...............................................................................................16
2.2.6 ECG filtering...................................................................................................................................18
2.2.7 STP board ......................................................................................................................................19
2.3 Connectors and signals...........................................................................................................................24
2.3.1 Module bus connector....................................................................................................................24
2.3.2 Front panel connectors...................................................................................................................25
2.3.3 Test points on boards .....................................................................................................................26
3 Service Procedures 28
3.1 General service information.....................................................................................................................28
3.2 Service check .........................................................................................................................................28
Document No. 800 1008-2
i
Page 4

Datex-Ohmeda S/5 monitors
3.2.1 Recommended tools......................................................................................................................28
3.2.2 Recommended parts......................................................................................................................29
3.3 Disassembly and reassembly..................................................................................................................39
3.3.1 M-ESTPR, M-ESTR, and M-ETPR modules........................................................................................39
3.3.2 M-NE12STPR/-NE12STR/-NE12TPR/-NESTPR/-NESTR/-NETPR modules.......................................39
3.4 Adjustments and calibrations..................................................................................................................40
3.4.1 Pressure safety level detection “OFFSET”.........................................................................................40
3.4.2 NIBP calibrations ...........................................................................................................................40
3.4.3 Temperature calibration .................................................................................................................42
3.4.4 Invasive pressure calibration ..........................................................................................................42
4 Troubleshooting 43
4.1 Troubleshooting charts ...........................................................................................................................43
4.1.1 NIBP..............................................................................................................................................43
4.1.2 NIBP error code explanation ...........................................................................................................46
4.1.3 ECG...............................................................................................................................................47
4.1.4 Pulse oximetry (SpO
4.1.5 Temperature ..................................................................................................................................48
4.1.6 Invasive blood pressure..................................................................................................................49
4.1.7 Impedance respiration ...................................................................................................................50
4.2 Troubleshooting flowcharts .....................................................................................................................51
4.2.1 M-NE12STPR and M-NESTPR module troubleshooting.....................................................................51
4.2.2 M-ESTPR, M-ESTR, and M-ETPR module troubleshooting .................................................................52
).....................................................................................................................47
2
5Service Menu 53
5.1 NIBP service menu .................................................................................................................................54
5.1.1 NIBP demo menu...........................................................................................................................55
5.1.2 NIBP calibration menu....................................................................................................................56
5.1.3 NIBP safety valve menu..................................................................................................................57
5.1.4 NIBP pulse valve menu...................................................................................................................58
5.1.5 NIBP buttons/leds menu................................................................................................................59
5.1.6 NIBP pneumatics menu..................................................................................................................60
5.1.7 NIBP watchdog menu.....................................................................................................................61
5.2 ECG service menu ..................................................................................................................................62
5.2.1 ECG setup menu ............................................................................................................................64
5.3 STP service menu ...................................................................................................................................65
5.3.1 STP calibration menu .....................................................................................................................67
6 Spare Parts 68
6.1 Spare parts list.......................................................................................................................................68
6.1.1 M-ESTP rev. 01, M-ETP rev. 00, M-EST rev. 00 .................................................................................68
6.1.2 M-ESTP rev. 02, M-ETP rev. 01, M-EST rev. 01 .................................................................................69
6.1.3 M-ESTP rev. 03, M-ETP rev. 02, M-EST rev. 02 .................................................................................69
6.1.4 M-ESTP rev. 04, M-ETP rev. 03, M-EST rev. 03 .................................................................................69
6.1.5 M-ESTP rev. 05, M-ETP rev. 04, M-EST rev. 04 .................................................................................69
6.1.6 M-ESTPR rev. 01, M-ETPR rev. 01, M-ESTR rev. 01...........................................................................70
6.1.7 M-ESTPR rev. 02, M-ETPR rev. 02, M-ESTR rev. 02...........................................................................70
6.1.8 M-ESTPR rev. 03, M-ETPR rev. 03, M-ESTR rev. 03...........................................................................70
6.1.9 M-ESTPR rev. 04, M-ETPR rev. 04, M-ESTR rev. 04...........................................................................70
6.1.10 M-NESTPR rev. 00, M-NETPR rev. 00, M-NESTR rev. 00 ...............................................................71
6.1.11 M-NESTPR rev. 01, M-NETPR rev. 01, M-NESTR rev. 01 ...............................................................72
ii
Document No. 800 1008-2
Page 5

Table of contents
6.1.12 M-NE12STPR rev. 00, M-NE12STR rev. 00, M-NE12TPR rev. 00...................................................72
6.1.13 M-NE12STPR rev. 01..................................................................................................................72
6.1.14 Front panel stickers....................................................................................................................73
6.1.15 Front panel stickers for S/5 modules...........................................................................................74
7 Earlier Revisions 76
APPENDIX A 77
Service Check Form A-1
TABLE OF FIGURES
Figure 1 S/5 NE12STPR Module, M-NE12STPR ................................................................................1
Figure 2 Absorption of infrared light in the finger probe parts layout and schematic diagram................9
Figure 3 Front panel of M-ESTPR.....................................................................................................10
Figure 4 Front panel of M-NESTPR ..................................................................................................11
Figure 5 NIBP board functional block diagram.................................................................................12
Figure 6 3- and 5- lead ECG board block diagram ...........................................................................14
Figure 7 12-lead ECG measurement block diagram.........................................................................16
Figure 8 STP board block diagram...................................................................................................19
Figure 9 Temperature measurement principle .................................................................................20
Figure 10 Pressure measurement principle .......................................................................................20
Figure 11 Pulse oximetry measurement block diagram ......................................................................21
Figure 12 Serial communication and opto isolation of M-NESTPR/-NE12STPR ...................................22
Figure 13 Serial communication and opto isolation of M-ESTPR.........................................................23
Figure 14 Module bus connector (X1) pin layout ................................................................................24
Figure 15 M-NE12STPR and M-NESTPR module troubleshooting flowchart .........................................51
Figure 16 M-ESTPR Module Troubleshooting Flowchart ......................................................................52
Document No. 800 1008-2
iii
Page 6

Datex-Ohmeda S/5 monitors
This page intentionally left blank.
iv
Document No. 800 1008-2
Page 7
INTRODUCTION
This Technical Reference Manual Slot provides information for the maintenance and service of the
hemodynamic modules. Please see also related Technical Reference Manual for information
related to system e.g. related documentation, conventions used, symbols on equipment, safety
precautions, system description, system installation, interfacing, functional check and planned
maintenance.
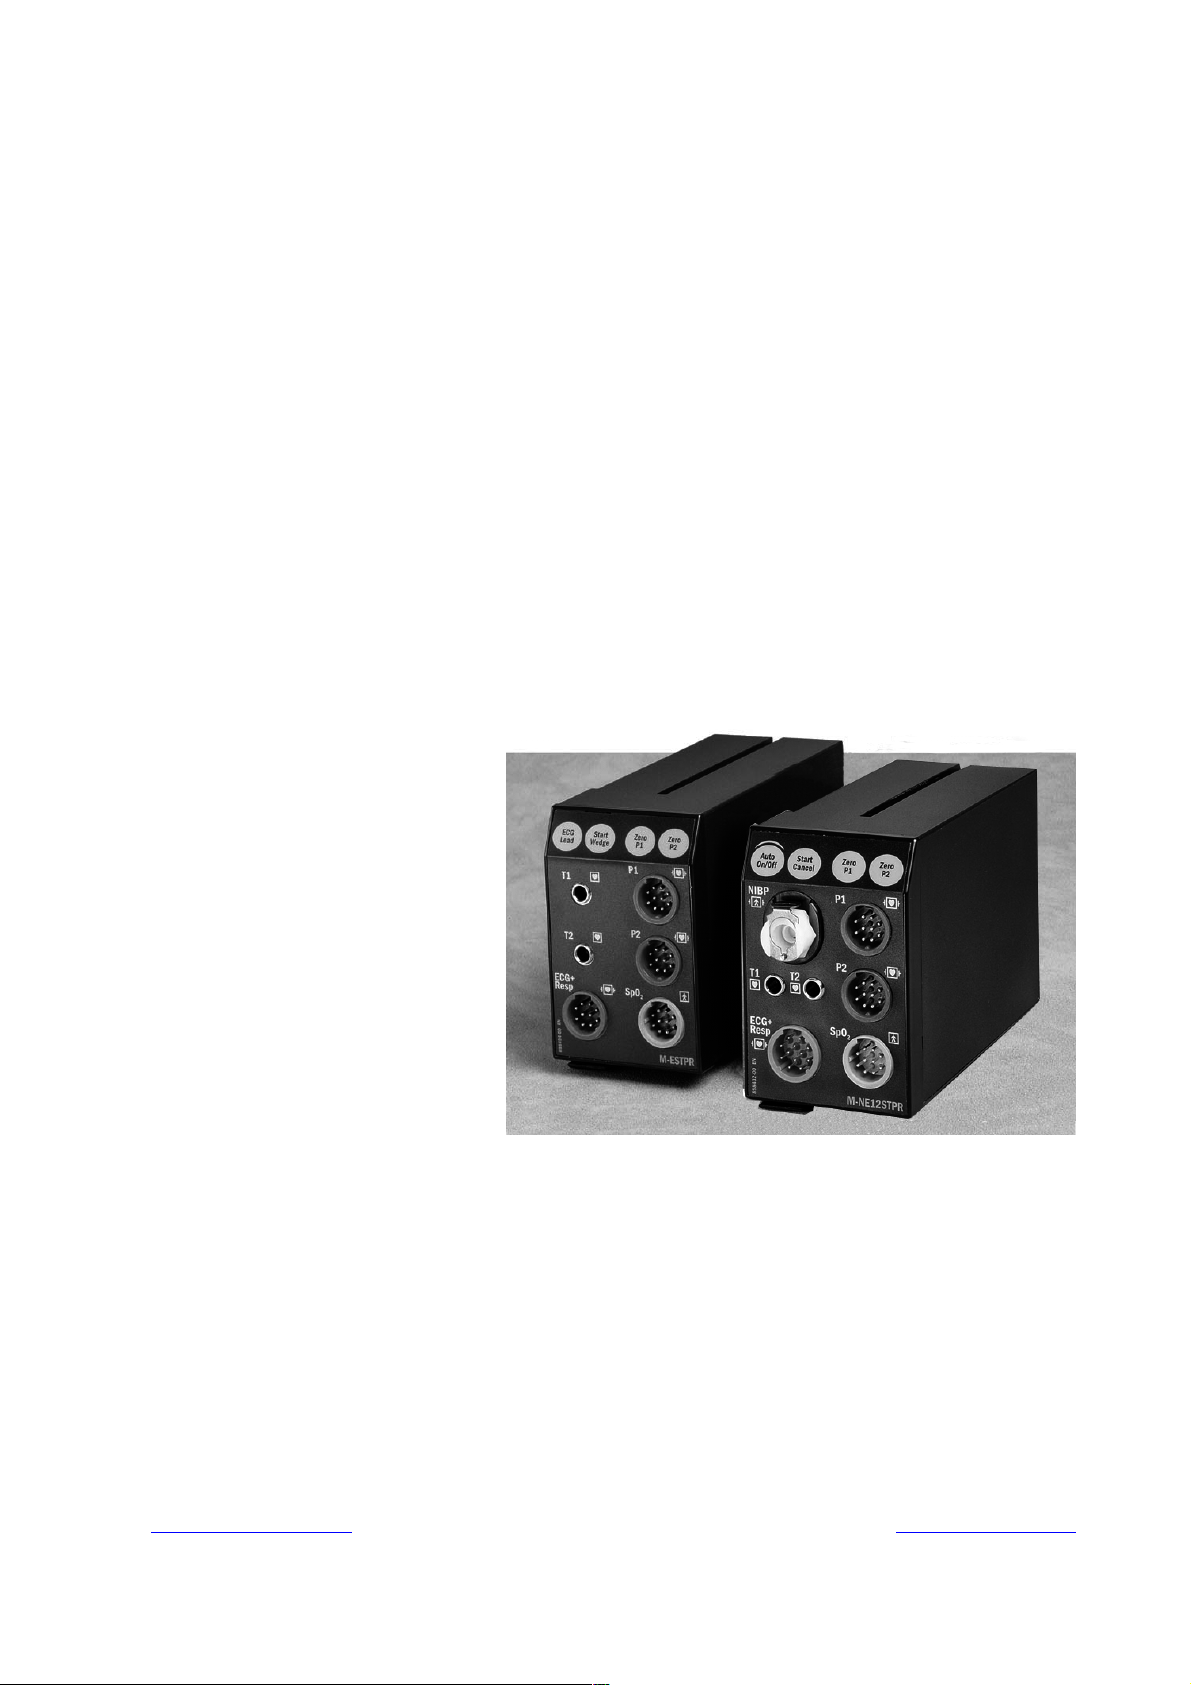
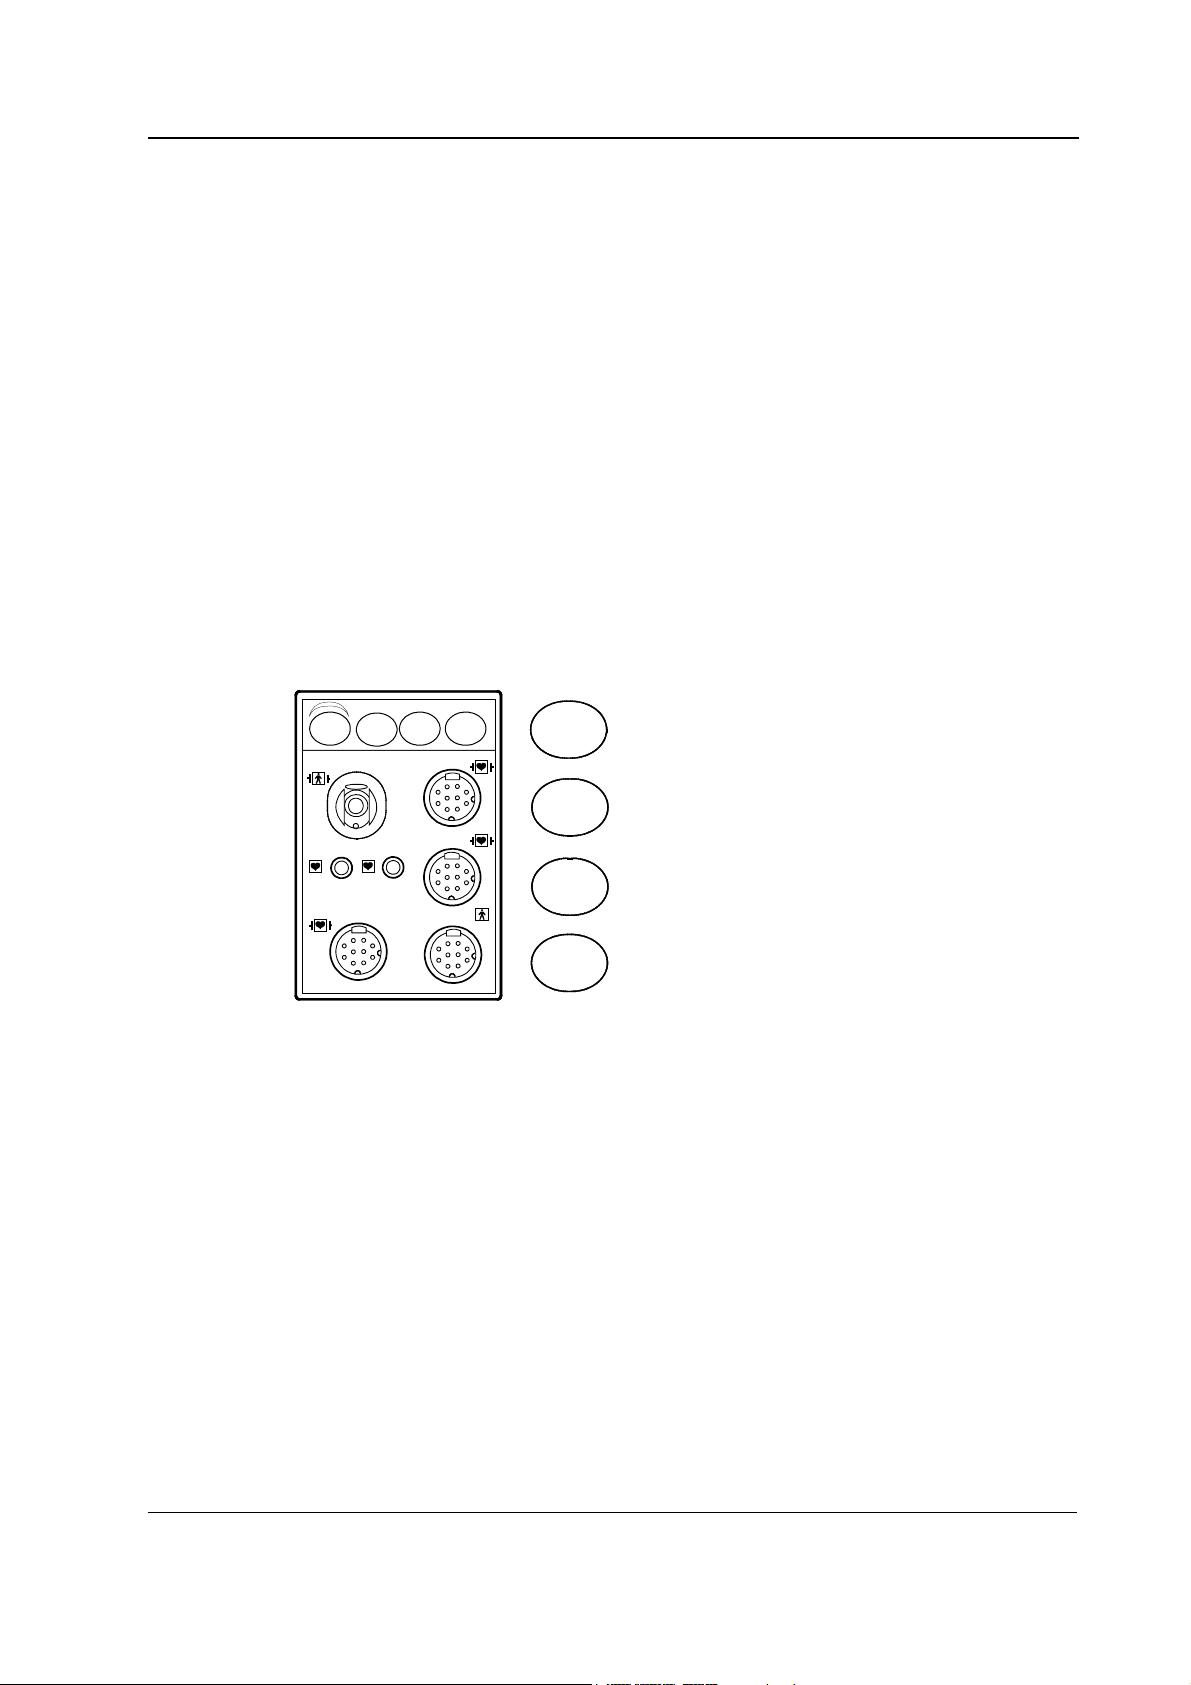
The S/5 M-ESTPR/-ESTR/-ETPR and S/5 M-NE12STPR/-NE12STR/-NE12TPR/-NESTPR/NESTR/-NETPR are double width modules designed for use with S/5 monitors. The modules
provide general hemodynamic parameters. Later in this manual modules can be called w/o
system name S/5.
S/5 Hemodynamic modules
NOTE: Do not use identical modules in
the same monitor simultaneously.
The following modules are considered
identical:
M-ESTP/-EST/-ETP
M-ESTPR/-ESTR/-ETPR
M-NESTPR/-NESTR/-NETPR
M-NE12STPR/-NE12STR/-NE12TPR
M-MRI/-MRIP
NOTE: 12-lead ECG measurement
requires Display Controller, B-DISP.
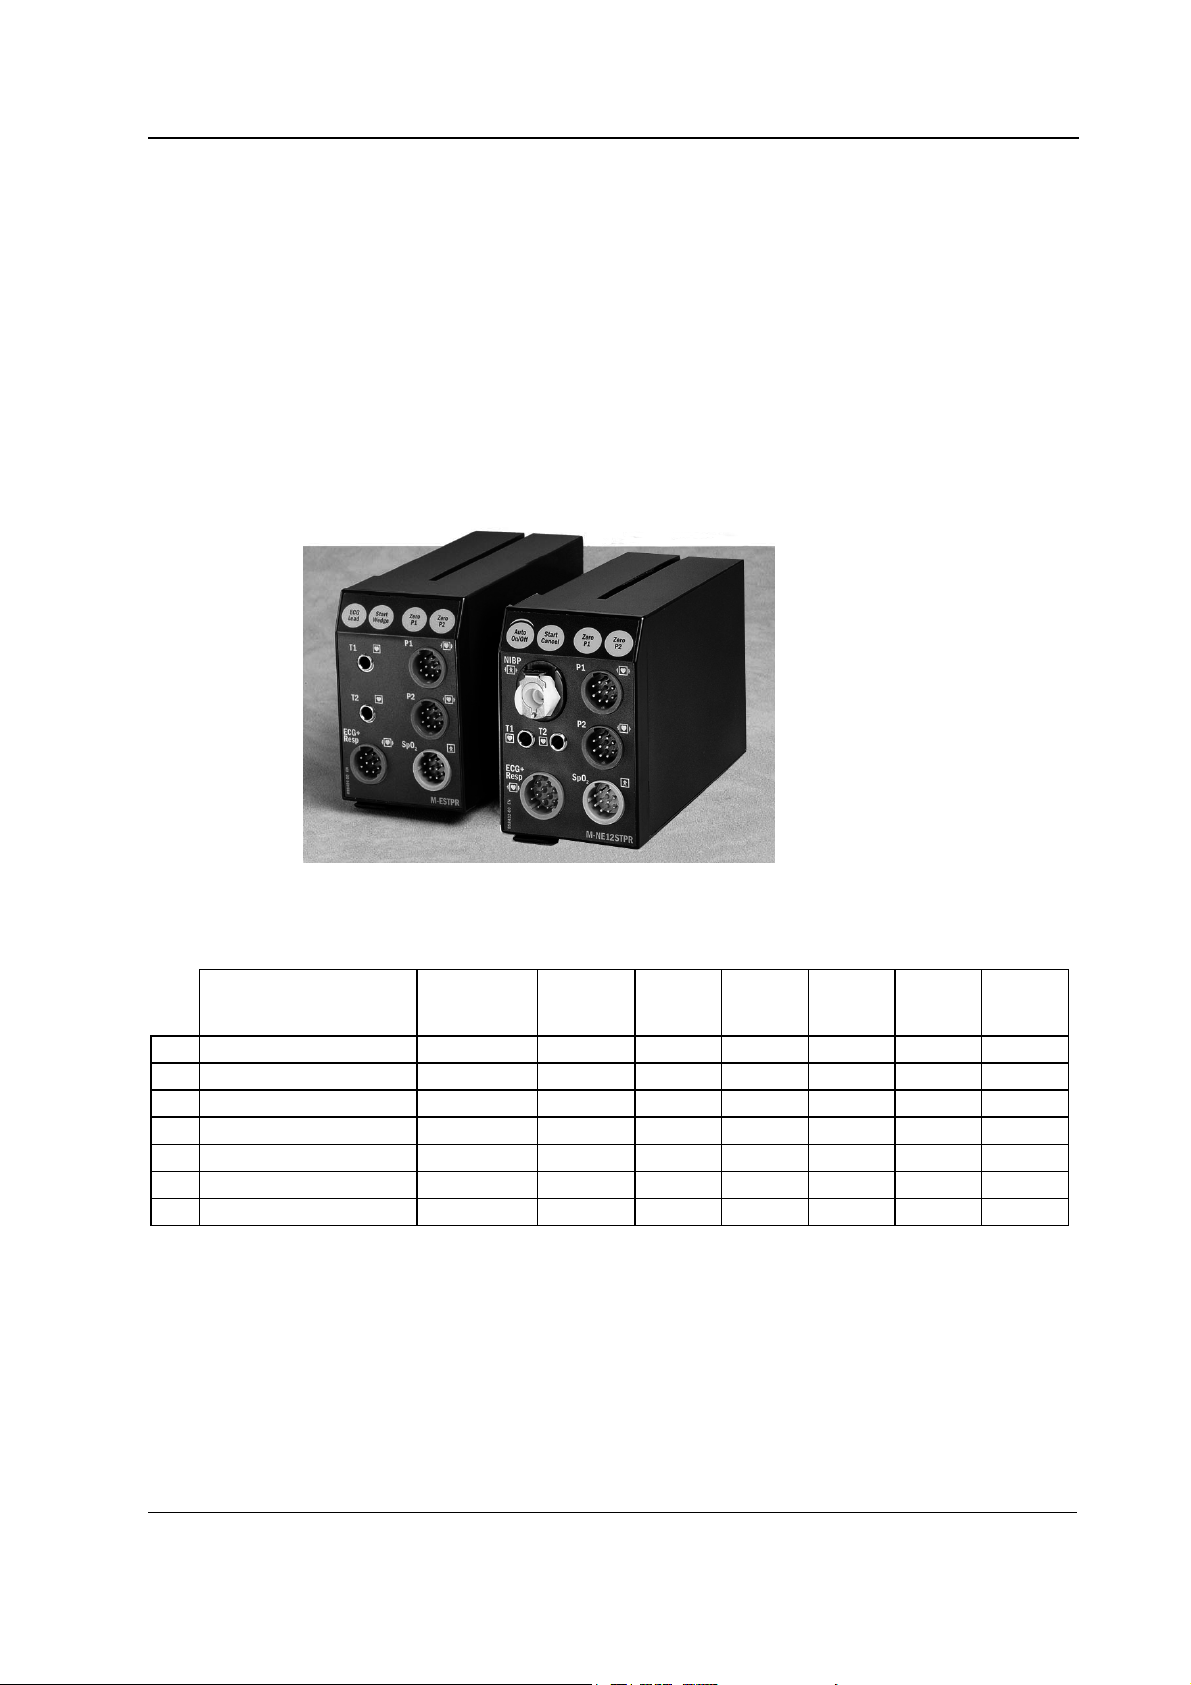
Figure 1 S/5 NE12STPR Module, M-NE12STPR
Table 1 Options of S/5 hemodynamic modules
Parameter NE12STPR NESTPR NE(12)
STR
12
12-lead ECG • (•)(•)
N
NIBP ••••
E
ECG • • •••••
S
Pulse oximetry ••• ••
T
Two temperatures • • •••••
P
Two invasive blood pressures •• •• •
R
Impedance respiration • • •••••
NE(12)
TPR
ESTPR ESTR ETPR
Document No. 800 1008-2
1
Page 8

Datex-Ohmeda S/5 monitors
1 SPECIFICATIONS
1.1 General specifications
Module size 75 × 180 × 112 mm
W × D × H3.0 × 7.1 × 4.4 in
Operation temperature 10...40 °C / 50...104 °F
@ M-ESTPR/-ETPR/-ESTR
Module weight 0.6 kg / 1.3 lbs
Power consumption 6 W
@ M-NE12STPR/-NE12STR/-NE12TPR/-NESTPR/-NESTR/-NETPR
Module weight 1 kg
Power consumption about 9 W
1.2 Typical performance
1.2.1 NIBP
Oscillometric measurement principle.
Measurement range adult 25...260 mmHg
Pulse rate range accepted 30...250 bpm
Measurement interval from continuous to 1h, 2h, 4h
Typical measuring time adult 23 s
Initial inflation pressure adult 185 ±10 mmHg
Venous stasis adult 80 ±10 mmHg / 2 min.
Cuff widths please see User’s Guide
child 25...195 mmHg
infant 15...145 mmHg
infant 20 s
child 150 ±10 mmHg
infant 120 ±10 mmHg
child 60 ±10 mmHg / 2 min.
infant 40 ±10 mmHg / 1 min.
2
Document No. 800 1008-2
Page 9

1.2.2 ECG
S/5 Hemodynamic modules
Lead selection @ 12-lead ECG I, II, III, aVR, aVL, aVF, V1, V2, V3, V4, V5, V6
Lead selection @ other modules I, II, III, aVR, aVL, aVF, V
Sweep speeds 12.5, 25, 50 mm/sec
DISPLAY FILTER
Diagnostic @ 12-lead ECG 0.05...150 Hz
Diagnostic @ other modules 0.05...100 Hz
Monitoring 0.5...30 Hz (-3 dB, with 50 Hz reject filter)
0.5...40 Hz (-3 dB, with 60 Hz reject filter)
ST filter 0.05...30 Hz (-3 dB, with 50 Hz reject filter)
0.05...40 Hz (-3 dB, with 60 Hz reject filter)
HEART RATE FROM ECG
Range 30...250 bpm
Accuracy ±5 bpm or ±5 %, whichever is greater
Resolution 1 bpm
Update interval 5 s
Averaging time 10 s
ST LEVELS (in main software)
ST level range -9...+9 mm (-0.9...+0.9 mV)
Resolution 0.1 mm (0.01 mV)
Averaging calculated from 8 QRS
SYNCHRONIZATION
Direct ECG analog output of ECG, 1 V/1 mV
Pacer 5 V and 0.5...2.5 ms pulse, < 30 ms after pacer peak
Defibrillator 5 V and 10 ms pulse, < 35 ms after R-point synchronization
1.2.3 Pulse oximetry
Measurement range 40...100 %
Accuracy 100...80 %, ±2 digits
(% SpO
Display resolution 1 digit = 1 % of SpO
Display averaging time 20, 10 sec, beat-to-beat
Pulse beep pitch varies with SpO
The monitor is calibrated over the measurement range against functional saturation SpO
HEART RATE FROM PLETH
Measurement range 30...250 bpm
Accuracy 30...100, ±5 bpm,
Resolution 1 bpm
Display averaging 10 s
2 ±1 SD)
1
80...50 %, ±3 digits
50...40 %, unspecified
2
2 level
func.
2
100...250, ±5 %
1
1 SD (standard deviation) = 68 % of all readings in the specified range in stable conditions.
3
Document No. 800 1008-2
Page 10

Datex-Ohmeda S/5 monitors
Adjustable pulse beep volume.
PLETH WAVEFORM
Scales 2, 5, 10, 20, 50 mod%, Auto
Start up scale is 20 mod% if AUTO is not selected to be the default setting.
1.2.4 Temperature
Measurement range 10...45 °C (50...113 °F)
(In rev. ESTP 03/ EST 02/ETP 02 or earlier: 15...45 °C (59...113 °F))
Measurement accuracy ±0.1 °C (25...45.0 °C)
Display resolution 0.1 °C (0.1 °F)
Temperature test automatic (every 10 min)
Probe type compatible with YSI 400 series
1.2.5 Invasive blood pressure
Measurement range -40...320 mmHg
Measurement accuracy ±2 mmHg or ±5 %
Zero adjustment range ±150 mmHg
Calibration range ±20 %
Scales upper limit is adjustable between 10 and 300 mmHg in steps of
±0.2 °C (10...24.9 °C)
10. Lower limit is 10 % of selected upper limit below zero.
Sweep speed 12.5, 25, 50 mm/s
DIGITAL DISPLAY
Range -40...320 mmHg
Resolution ±1 mmHg
WAVEFORM DISPLAY
Range -30...300 mmHg
HEART RATE FROM ARTERIAL PRESSURE
Measurement range 30...250 bpm
Resolution 1 bpm
Accuracy ±5 bpm or ±5 % whichever is greater
1.2.6 Respiration
Measurement range 4...120 bpm
Accuracy ±5 bpm or ±5 %
Resolution 1 bpm
Averaging time 30 s
Update interval 10 s
RESPIRATION WAVEFORM
Sweep Speeds 6.25 mm/s and 0.625 mm/s
4
Document No. 800 1008-2
Page 11

1.3 Technical specifications
1.3.1 NIBP
Deflation rate, PR dep. 5...13 mmHg/s
Inflation time 20...185 mmHg, 1...5 s
Automatic software control, max. inflation pressure
Over pressure limit, stops measurement after 2 seconds
Safety valve limits the maximum cuff pressure to 320 mmHg in adult/child mode or 165 mmHg in
infant mode. Independent timing circuit limits pressurizing (>5 mmHg) time to 2 minutes 10
seconds maximum in adult/child mode, and 1 minute 5 seconds in infant mode.
S/5 Hemodynamic modules
adult 280 ±10 mmHg
child 200 ±10 mmHg
infant 150 ±10 mmHg
adult 320 mmHg
child 220 mmHg
infant 165 mmHg
1.3.2 ECG
Zeroing to ambient pressure is done automatically.
Inflation pressure is adjusted according to the previous systolic pressure, typically 40 mmHg
above. If the systolic pressure is not found, inflation pressure is increased typically 50 mmHg.
Max. measurement time adult 2 min
child 2 min
infant 1 min
Pressure transducer accuracy is better than ±3 mmHg or ±2 % whichever is greater.
Max. error ±4 mmHg.
Protection against electrical
shock Type BF defibrillation proof
Defibrillation protection 5000 V, 360 J
Recovery time 2 s
Input impedance >2.5 MΩ (10 Hz)
CMRR >100 dB (ST)
System noise <40 µV (p-p, RTI)
Allowable offset ±300 mVDC
Gain range 0.2...5.0 cm/mV
Pacemaker pulse detection 2...500 mV, 0.5...2 ms pulses
Protection against electrical
shock Type CF defibrillator proof
5
Document No. 800 1008-2
Page 12

Datex-Ohmeda S/5 monitors
1.3.3 Pulse oximetry
Protection against electrical
shock Type BF defibrillation proof
1.3.4 Temperature
Measurement accuracy ±0.1 °C (25.0...45.0 °C)
Protection against electrical
shock Type CF defibrillation proof
NOTE: The accuracy of the measurement may be different from the specified, depending on
transducer/probe used. Please check the transducer/probe specification.
1.3.5 Invasive blood pressure
DIGITAL DISPLAY AVERAGING
Digital displays Art and P1 are averaged over 5 seconds and updated at 5 seconds intervals. All
other pressures have respiration artifact rejection.
±0.2 °C (10.0...24.9 °C)
Accuracy ±5 % or ±2 mmHg, whichever is greater
Transducer and input sensitivity
Filter 0...4 - 22 Hz adjustable
Zero set accuracy ±1 mmHg
Calibration resolution ±1 mmHg
Zero time less than 15 s
Protection against electrical
shock Type CF defibrillation proof
NOTE: The accuracy of the measurement may be different from the specified, depending on
transducer/probe used. Please check the transducer/probe specification.
1.3.6 Respiration
Excitation frequency @ 12-lead ECG 62.5 kHz
Excitation frequency @ other modules 31.25 kHz
Breath detection automatic, range 0.3...6 Ω manually adjustable minimum
Input dynamic range 0.2...6 Ω
Input impedance range 100...5000 Ω
Respiration Rate min. 4 bpm
Lead off detection >3 MΩ
5 µV/V/mmHg, 5 VDC, 20 mA max current
detection: 0.2, 0.4, 0.6, 0.8, 1.0
max. 120 bpm
6
Document No. 800 1008-2
Page 13

2 FUNCTIONAL DESCRIPTION
2.1 Measurement principle
2.1.1 NIBP
NIBP (Non-Invasive Blood Pressure) is an indirect method for measuring blood pressure.
The NIBP measurement is performed according to the oscillometric measuring principle. The cuff is
inflated with a pressure slightly higher than the presumed systolic pressure, and deflated at a
speed based on the patient’s pulse, collecting data from the oscillations caused by the pulsating
artery. Based on these oscillations, values for systolic, mean, and diastolic pressures are
calculated.
The following parts are necessary for the NIBP measurement:
• M-NE12STPR/-NE12STR/-NE12TPR/-NESTPR/-NESTR/-NETPR (or M-NIBP) module
S/5 Hemodynamic modules
• twin hose (adult or infant model)
• blood pressure cuffs (different sizes)
2.1.2 ECG
Electrocardiography analyzes the electrical activity of the heart by measuring the electrical
potential produced with electrodes placed on the surface of the body.
ECG reflects:
• electrical activity of the heart
• normal/abnormal function of the heart
• effects of anesthesia on heart function
• effects of surgery on heart function
See the User's Reference Manual for electrodes positions and other information.
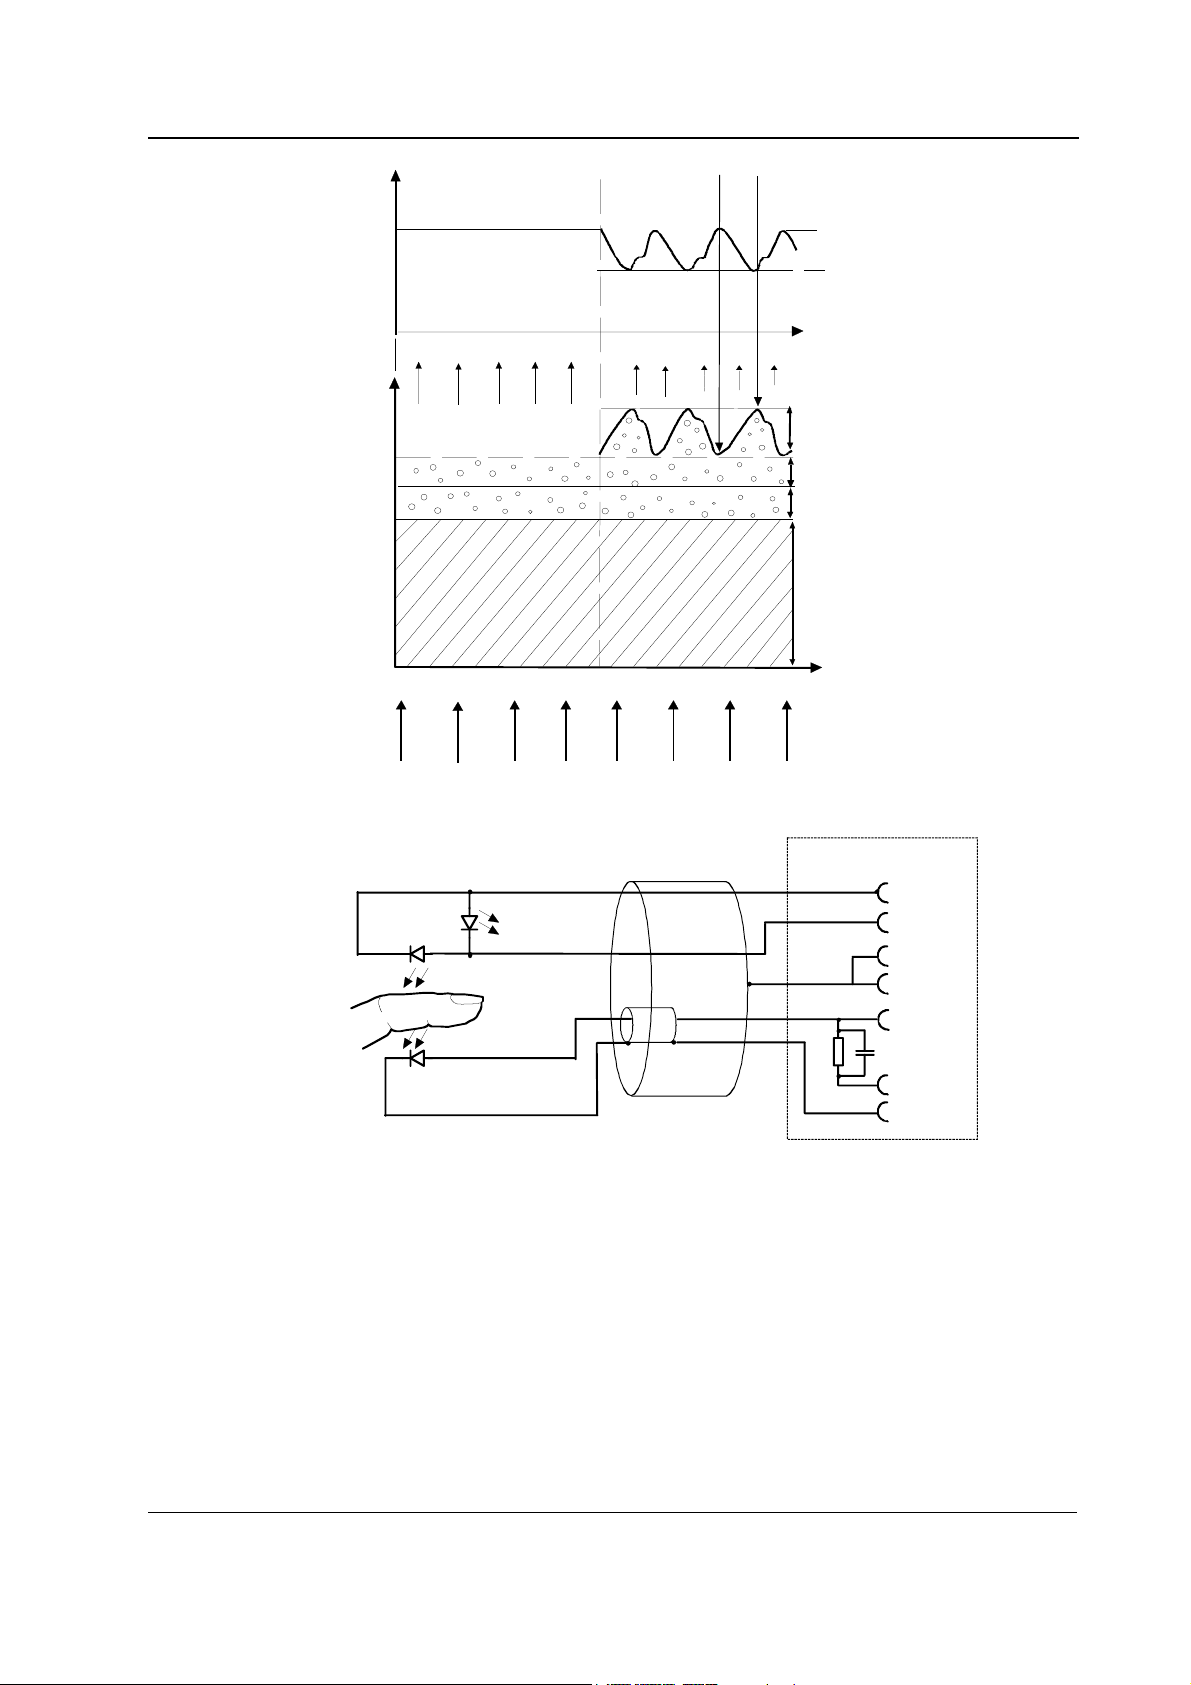
2.1.3 Pulse oximetry
A pulse oximeter measures the light absorption of blood at two wavelengths, one in the near
infrared (about 900 nm) and the other in the red region (about 660 nm) of light spectrum. These
wavelengths are emitted by LEDs in the SpO
tissue and is finally detected by a PIN-diode opposite to LEDs in the probe. Pulse oximeter derives
the oxygen saturation (SpO
absorption at the two wavelengths and the arterial oxygen saturation SaO
probe, the light is transmitted through peripheral
2
) using empirically determined relationship between the relative
2
.
2
In order to measure the arterial saturation accurately, pulse oximeters use the component of light
absorption giving variations synchronous with heart beat as primary information on the arterial
saturation.
Document No. 800 1008-2
7
Page 14

Datex-Ohmeda S/5 monitors
A general limitation of the above pulse oximetry principle is that due to only two wavelengths used
only two hemoglobin species can be discriminated by the measurement.
The modern pulse oximeters are empirically calibrated either against fractional saturation
frac;
SaO
2
2
fracSaO
2
=
HbO
2
++
binDyshemogloHbHbO
Formula 1
or against functional saturation SaO
HbO
=
2
funcSaO
which is more insensitive to changes of carboxyhemoglobin and methemoglobin concentrations in
blood.
The oxygen saturation percentage SpO
the functional saturation SaO
measurement relative to SaO2func can be maintained even at rather high concentrations of
carboxyhemoglobin in blood. Independent of the calibration method, pulse oximeter is not able to
correctly measure oxygen content of the arterial blood at elevated carboxyhemoglobin or
methemoglobin levels.
Plethysmographic pulse wave
The plethysmographic waveform is derived from the IR signal and reflects the blood pulsation at
the measuring site. Thus the amplitude of the waveform represents the perfusion.
Pulse rate
The pulse rate calculation is done by peak detection of the plethysmographic pulse wave. The
signals are filtered to reduce noise and checked to separate artifacts.
func;
2
2
HbHbO
2
+
measured by Datex-Ohmeda module is calibrated against
2
func. The advantage of this method is that the accuracy of SpO
2
Formula 2
2
Probe
8
Document No. 800 1008-2
The standard probe is a finger clamp probe which contains the light source LEDs in one half and
the photodiode detector in the other half. Different kinds of probes are available from DatexOhmeda.
Page 15
Intensity of
transmitted
light
I
max (DC-component)
S/5 Hemodynamic modules
I
max
AC-component
I
min
Transmitted
light
Incident light
Emitter
RED
Detector
No pulsation
IRED
Pulsatile blood
SpO sensor cable
2
Variable absorption
due to pulse added
volume of arterial
blood
Arterial blood
Venous blood
Tissue
Time
SpO sensor connector
2
6
GND
7
I
LED
4
5
GND
8
V
B
R
C
1
I
S
9
GND
Figure 2 Absorption of infrared light in the finger probe parts layout and schematic
2.1.4 Temperature
The temperature is measured by a probe whose resistance varies when the temperature changes,
called NTC (Negative Temperature Coefficient) resistor.
The resistance can be measured by two complementary methods:
• Applying a constant voltage across the resistor and measuring the current that flows through
diagram
it
9
Document No. 800 1008-2
Page 16
Datex-Ohmeda S/5 monitors
• Applying a constant current through the resistor and measuring the voltage that is generated
across it.
In Datex-Ohmeda modules the two methods are combined in a form of a voltage divider. The NTCresistor is connected in series with a normal resistor and a constant voltage is applied across them.
The temperature dependent voltage can be detected at the junction of the resistors, thus producing
the temperature signal from the patient. The signal is amplified by analog amplifiers and further
processed by digital electronics.
2.1.5 Invasive blood pressure
To measure invasive blood pressure, a catheter is inserted into an artery or vein. The invasive
pressure setup, consisting of connecting tubing, pressure transducer, an intravenous bag of normal
saline all connected together by stopcocks, is attached to the catheter. The transducer is placed at
the same level with the heart, and is electrically zeroed.
The transducer is a piezo-resistive device that converts the pressure signal to a voltage. The monitor
interprets the voltage signal so that pressure data and pressure waveforms can be displayed.
2.1.6 Respiration
Impedance respiration is measured across the thorax between ECG electrodes. The signal of the
respiration is made by supplying current between electrodes and by measuring the differential
current from the electrodes. The signal measured is the impedance change caused by breathing.
From these impedance changes, respiration rate is calculated, and respiration waveform is
displayed on the screen.
2.2 Main components
2.2.1 M-ESTPR/-ETPR/-ESTR modules
T1
T2
ECG+
Resp
SpO
P1
P2
2
ECG
Lead
Start
Wedge
Zero
P1
Zero
P2
10
Document No. 800 1008-2
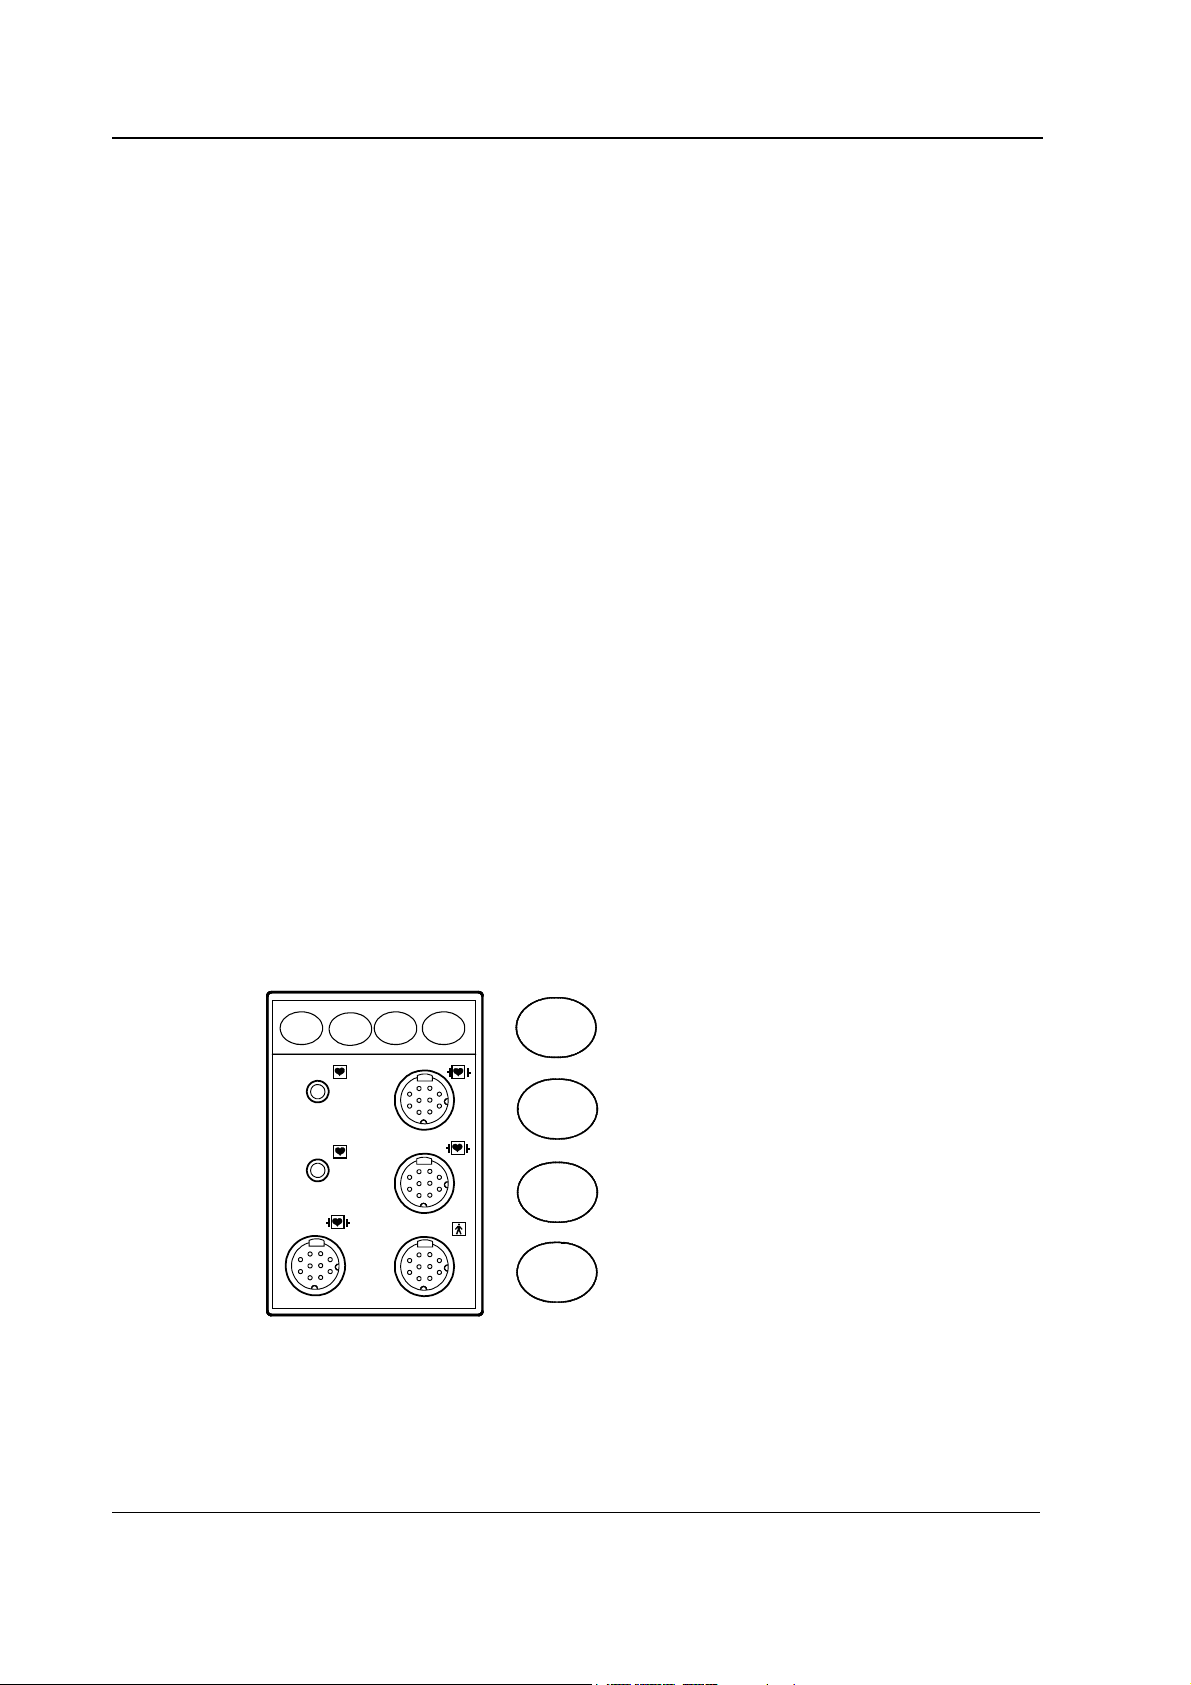
Figure 3 Front panel of M-ESTPR
The M-ESTPR, M-ETPR, and M-ESTR modules contain two main PC boards, the STP board and the
ECG board. They work independently. Both of them have their own processor and software EPROM.
Some components on the boards are not used in ETPR and ESTR modules.
In M-ESTPR module, additionally, there are two small boards, the SP input and the ECG input
Page 17
S/5 Hemodynamic modules
boards, attached to the front panel of the module. The front panel has six connectors and four keys.
The connectors are two for temperature measurement, two for invasive blood pressure
measurement, one for ECG, and one for SpO
measurement. The keys are for ECG lead, Start
2
Wedge, P1 zero, and P2 zero.
In M-ETPR module, there are two small boards, the ECG input board and the 2P input board
attached to the front panel of the module. The front panel has five connectors and four keys. The
connectors are two for temperature measurement, two for invasive blood pressure measurement,
and one for ECG
measurement. The keys are for ECG lead, Start Wedge, P1 zero, and P2 zero.
In M-ESTR module, there are two small boards: the S input board and the ECG input board,
attached to the front panel of the module. The front panel has four connectors and one key. The
connectors are two for temperature measurement, one for ECG, and one for SpO
The key is for ECG lead select.
NOTE: M-ESTP rev. 03, M-ETP rev. 02 and M-EST rev. 02 and all earlier revisions have separate T
and SP input boards.
2.2.2 M-NE12STPR/-NE12STR/-NE12TPR/-NESTPR/-NESTR/-NETPR modules
measurement.
2
Auto
On/Off
NIBP
T1
ECG+
Resp
P1
Start
Cancel
P2
T2
Zero
SpO
2
P1
Zero
P2
Figure 4 Front panel of M-NESTPR
The M-NESTPR, M-NETPR, and M-NESTR modules contain three main PC boards, the STP board,
the ECG board, and the NIBP board. They work independently. Each of these has their own
processor and software EPROM.
The M-NE12STPR, M-NE12TPR, and M-NE12STR contain three main PC boards, The STP board,
the ECG board and the NIBP board. They work independently. Each of them has their own
processor. The STP board and NIBP board have software EPROM. In the ECG board the software is
in flash memory. The STP and NIBP boards are the same as in M-NESTPR module but the ECG
board and ECG input board are different.
In M-NESTPR module, there are two small boards, the SP input and the ECG input board attached
to the front panel of the module. The front panel has seven connectors and four keys. The
connectors are two for temperature measurement, two for invasive blood pressure measurement,
one for ECG, one for NIBP, and one for SpO
measurement. The keys are for NIBP Auto On/Off,
2
NIBP Start/Cancel, P1 zero, and P2 zero. The structure of M-NE12STPR is similar except the ECG
board and ECG input board are different.
Document No. 800 1008-2
11
Page 18
Datex-Ohmeda S/5 monitors
In M-NETPR module, there are two small boards, the 2P input board and the ECG input board,
attached to the front panel of the module. The front panel has six connectors and four keys. The
connectors are two for temperature measurement, two for invasive blood pressure measurement,
one for ECG, and one for NIBP. The keys are for Auto On/Off, Start/Cancel, P1 zero, and P2 zero.
The structure of M-NE12TPR is similar except the ECG board and ECG input board are different.
In M-NESTR module, there are two small boards, the ECG input board and the S input board,
attached to the front panel of the module. The front panel has five connectors and two keys. The
connectors are two for temperature measurement, and one for SpO
and one for NIBP. The keys are for Auto On/Off, Start/Cancel. The structure of M-NE12STR is
similar except the ECG board and ECG input board are different.
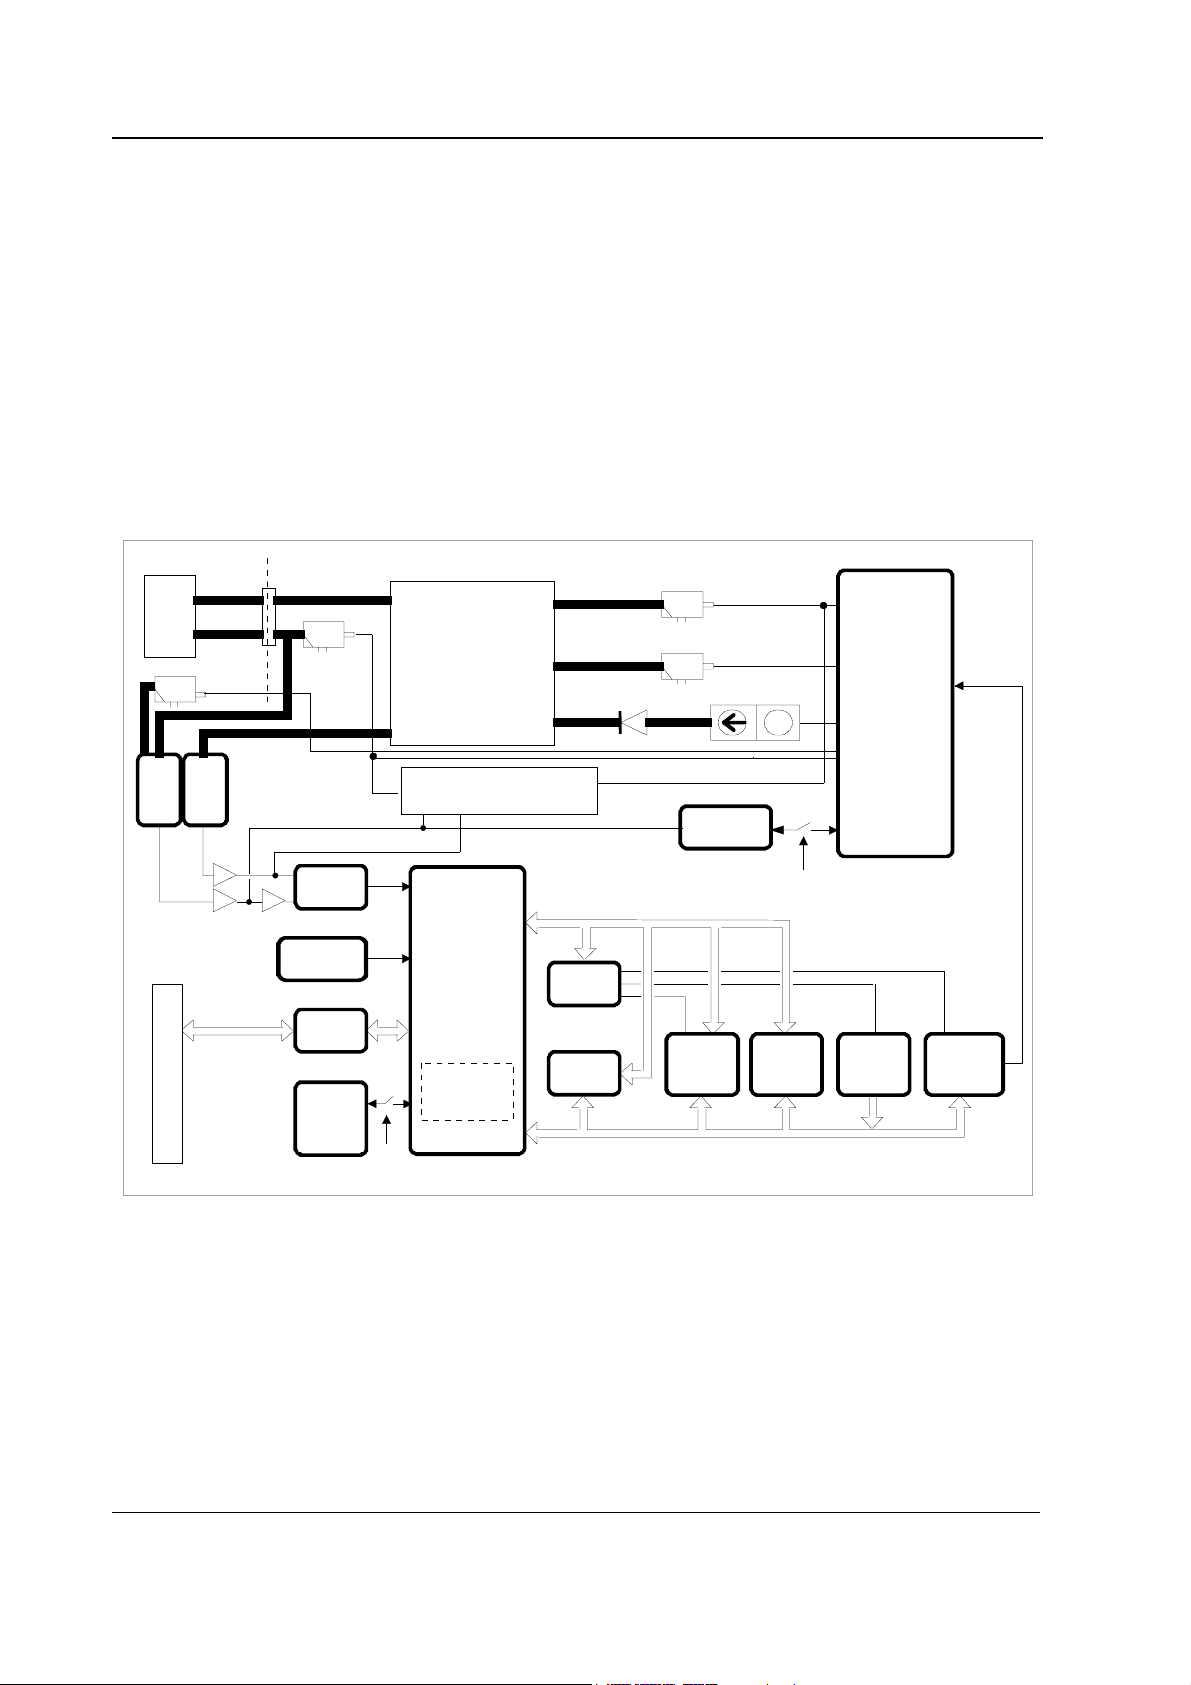
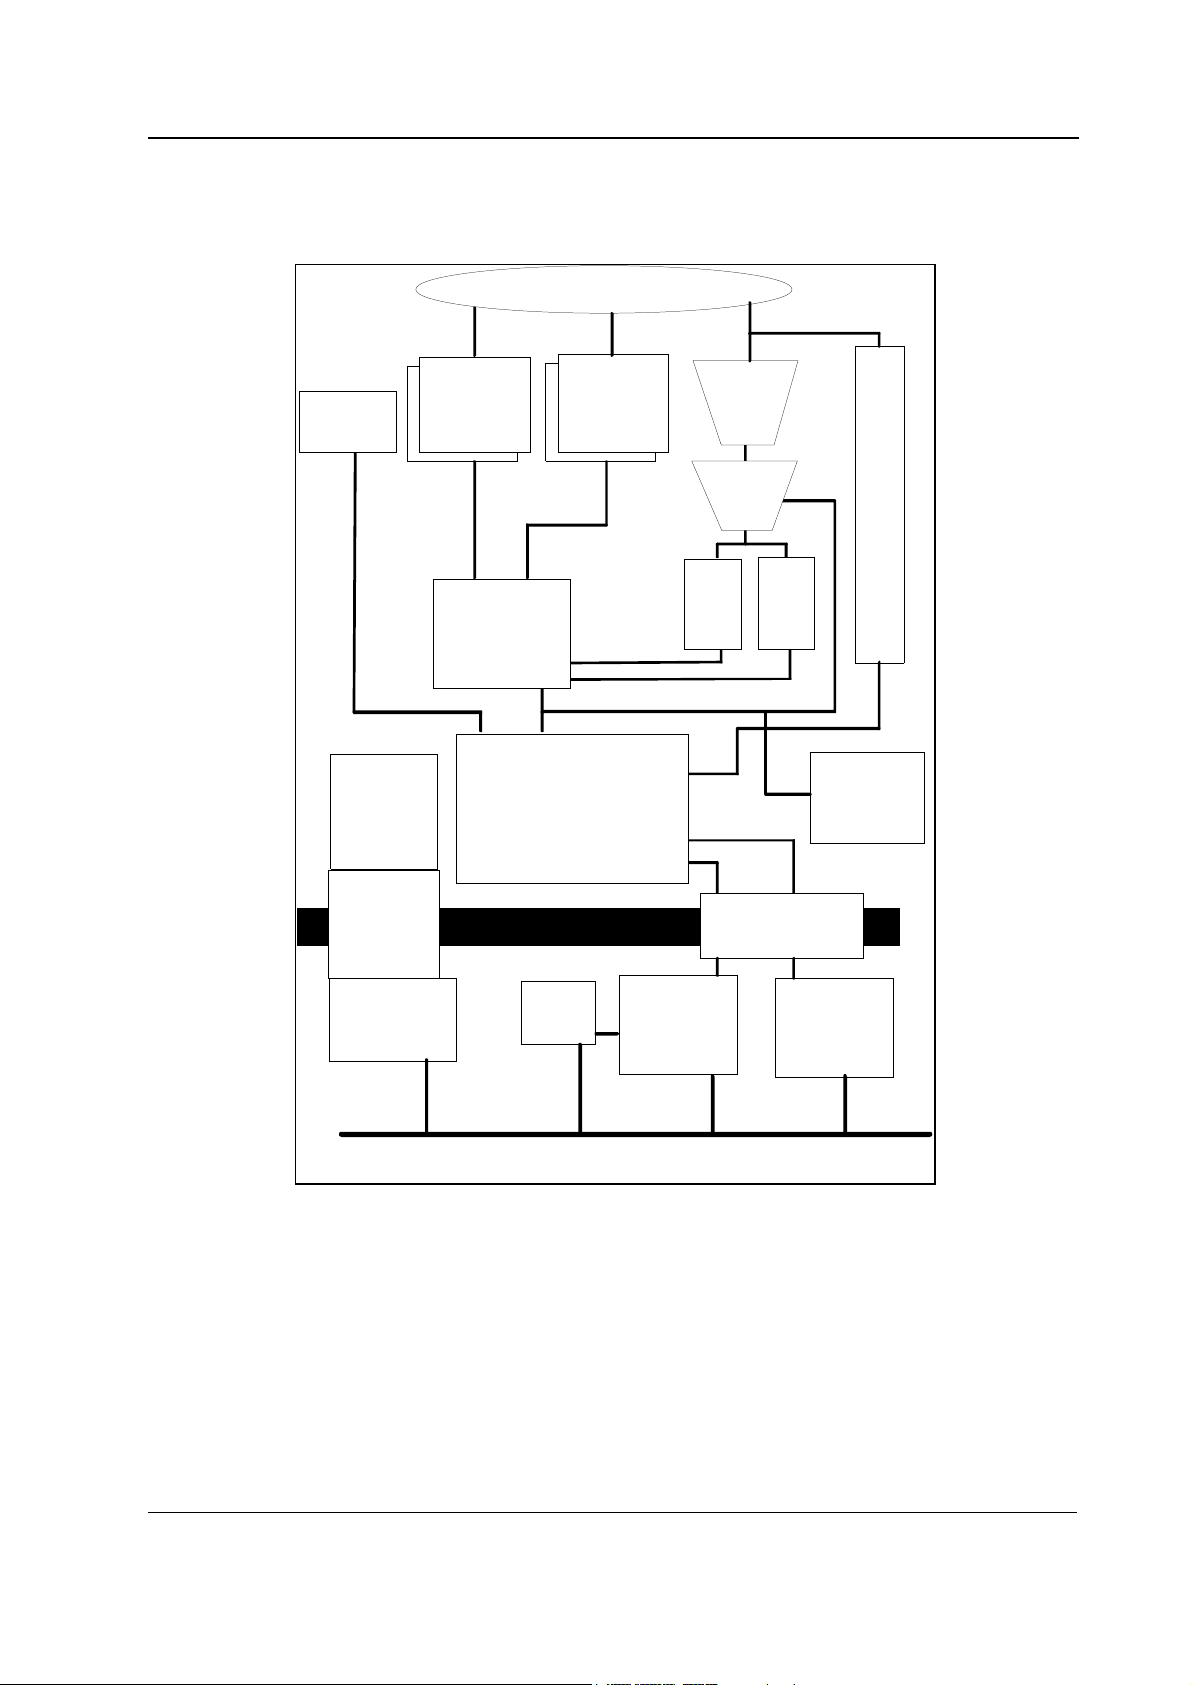
2.2.3 NIBP board
CUFF
ZERO
VALVE
EXHAUST
VALVE 2
JOIN ING
CHAMBER
EXHAUST VALVE 1
BLEED VALVE
CHECK VALVE
measurement, one for ECG,
2
PUMP and
PUMP
M
VALVE
DRIVER
B1 B2
t
o
/
f
r
o
m
m
o
d
u
l
e
b
u
s
X1
PRESSURE
S
TRAN
-
D
UCERS
AD-CONVERTER
POWER-UP
RESET
RS485
INTER F.
EEPRO
(C alibration
Data)
Figure 5 NIBP board functional block diagram
Pressure transducers
OVERPRESSURE CONTROL
M
Write protect switch
CPU
80C51FA
NTERNAL
I
WATCHDOG
ADDRESS BUS
ADDRESS
DECODER
ADDRESS
LATCH
WATCHDO G
TIMER
RAM
DATABUS
+
1
5
EPROM
D
V
FRONT
PANEL
KEYS
SOFT WAR E
CON TRO L
12
Document No. 800 1008-2
The NIBP board contains two pressure transducers. They are of piezoresistive type. One is used for
measuring the pressure of the blood pressure cuff and the pressure fluctuations caused by arterial
wall movement (B1). The other is used for detection of cuff hose type, cuff loose and cuff occlusion
situations etc. (B2). The transducers are internally temperature compensated. They are supplied by
a constant voltage and their output voltage changes up to 40 mV max. (50 kPa, 375 mmHg).
Page 19

Signal processing
Two signals from the pressure transducers are amplified and sent to A/D converter. After the
converter, digitized signals are sent to microprocessor for data processing. Before the converter,
one of the signals is used to adjust the offset to the pressure safety level.
The NIBP board is controlled with 80C51FA microprocessor at 16 MHz oscillator frequency.
Memory
NIBP program memory (EPROM) size is 128k × 8. RAM size is 32k × 8 bit and it stores variable
values in NIBP measurement. EEPROM is size 64 × 16 bit and is used to store the calibration
values for the pressure transducers, the pulse valve constants gained during measurements, the
PC board identification, and module serial number.
Software control
Software controls valves and pump. In addition to the individual on/off signals for each component
there is a common power switch for the valves and the pump that can be used at pump/valve
failures.
S/5 Hemodynamic modules
In addition to external RS485 reset line the microprocessor system is equipped with its own powerup reset. See the section in ECG board’s description: “RS485 communication”
Watchdog timer
The NIBP board is equipped with software independent safety circuit to disconnect supply voltages
from the pump and the valves if the cuff has been pressurized longer than preset time. As soon as
the cuff pressure rises over a specifiedpressure limit, timer starts counting. The timer is adjusted to
stop the pump and open the valves in 2 minutes 10 seconds in adult/child mode and in 1 minute
5 seconds in infant mode.
Valves
Exhaust valves are used for emptying the cuff and the joining chamber after the measurement.
Exhaust valve 1 is also used as safety valve in infant mode. Valve opens at 165 mmHg. Exhaust
valve 2 is also used as safety valve in adult mode and opens at 320 mmHg.
Bleed valve is used for emptying the cuff during measurement. Zero valve is used for connecting
the pressure transducer B1 to open air.
Power supply section
All connections are established via 25-pin connector (D-type, female). The module needs +5 V,
±15 V, and +15 VD (dirty) power supply to operate. The pump and the valves use separate +15 VD
power line. The supply voltages are generated in the power supply section of the S/5 monitor. The
reference voltages ±5 V
and +10 V
ref
are generated on the NIBP board.
ref
13
Document No. 800 1008-2
Page 20
Datex-Ohmeda S/5 monitors
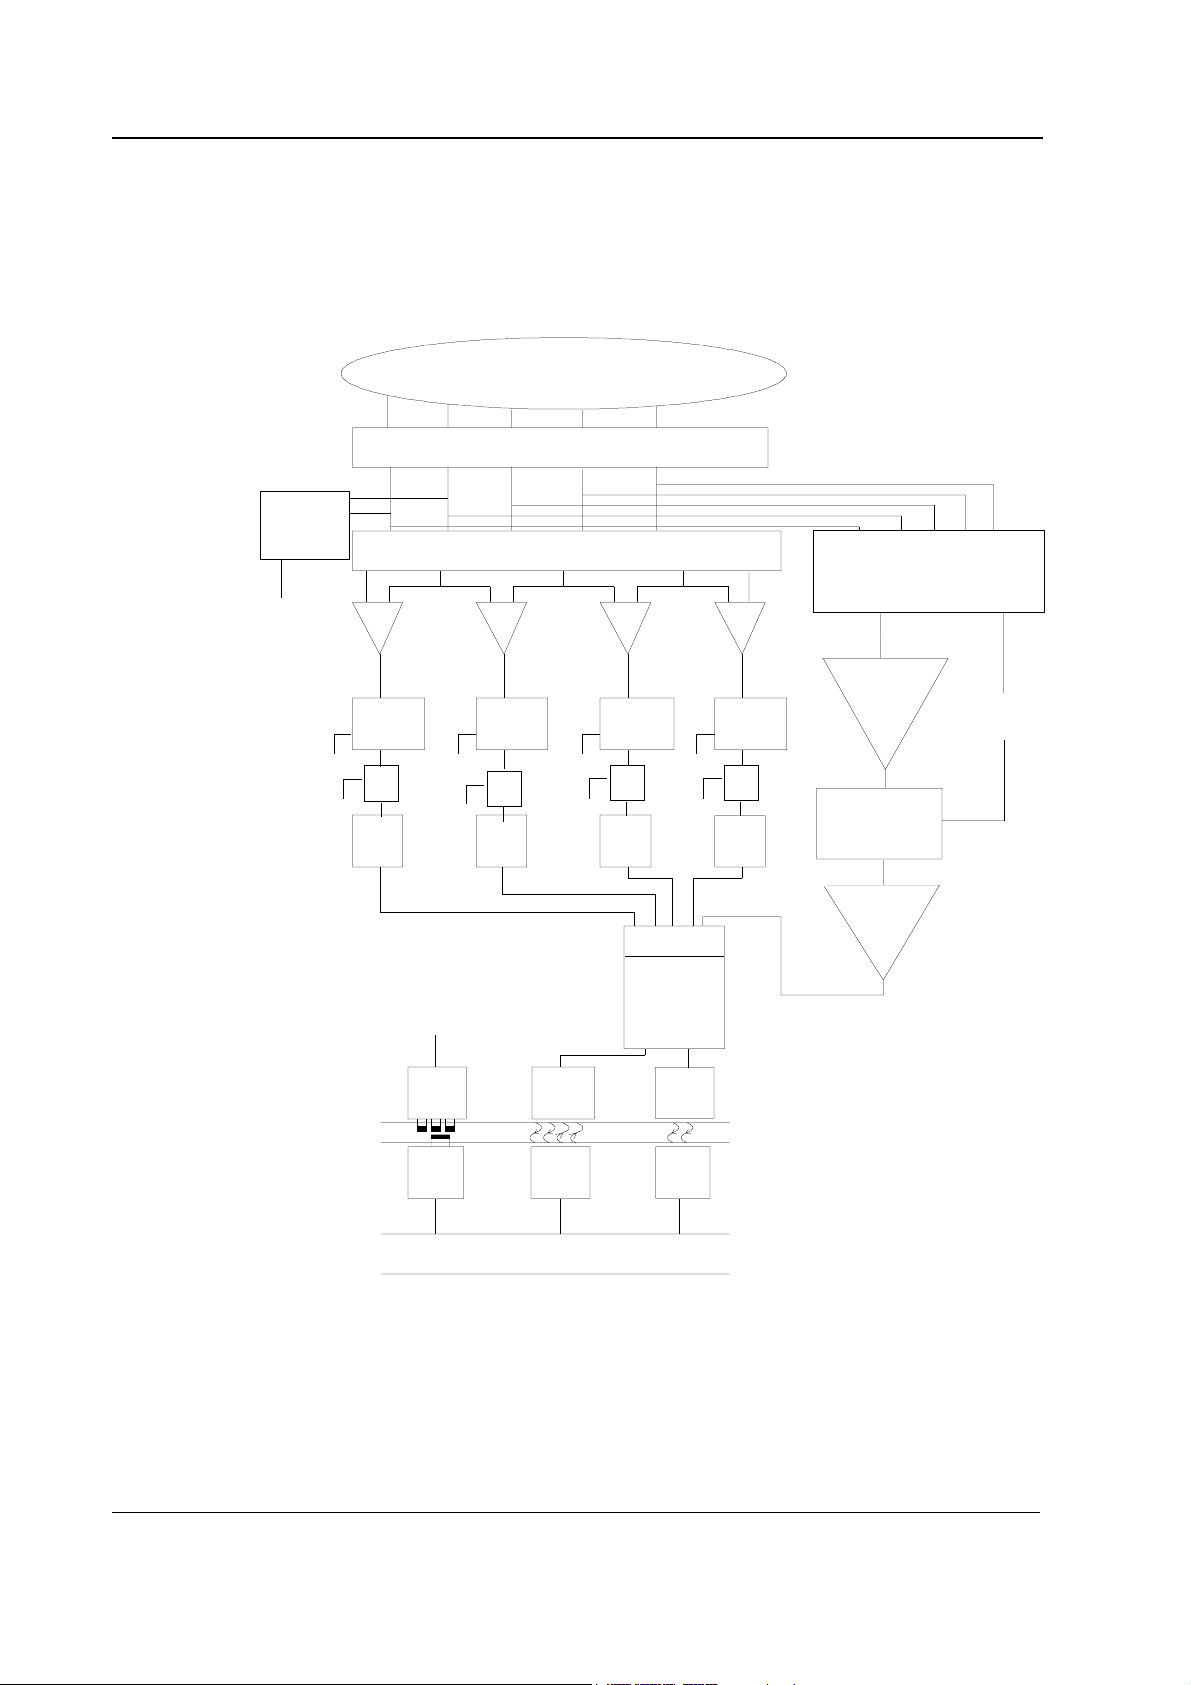
2.2.4 ECG board in 3-and 5-lead measurement
Patient signals are connected to overload protection circuits (resistors and gas-filled surge
arresters) and analog switches to instrumentation amplifiers. Then the signals are amplified by 480
and limited by slew rate. Then they are A/D-converted, analyzed and transferred to module bus in
digital form.
PATIENT
OVERLOAD PROTECTION
DEFIBRILLATION
DETECTOR
uP
SLEWRATE
DETECTOR
HP
Filter
uP
ANTIALIAS
RL
ANALOG SWITCHES
SLEWRATE
DETECTOR
uP
ANTIALIAS
SUPPLY
VOLTAGES
FCN
SLEWRATE
DETECTOR
uPuPuP
uP
HP
Filter
ANTIALIAS
A/D
MICROPROCESSOR
(uP)
HP
Filter
SLEWRATE
DETECTOR
uP
uP
HP
Filter
ANTIALIAS
LEAD SELECTION LOGIC
Controlled by ECG lead
selection signals from uP
Resp
amplifier
31 kHz
from uP
Sync. Rectifier
Amplifier
Figure 6 3- and 5- lead ECG board block diagram
Analog ECG section
ECG cable is connected to connector pins E1 to E6 on the input board which contains an overload
protection circuit. Leads are connected to amplifiers via analog switches. States of the switches
depend on the cable type. Lead-off, noise and pacemaker are detected by a slew rate detector.
14
Document No. 800 1008-2
ISOLATION
POWER
SOURCE
POWER
SOURCE
OPTOCOUPLER
OPTOCOUPLER
to STP Board
DIRECT
ECG
DIRECT
ECG
Page 21

S/5 Hemodynamic modules
Lower frequency is determined by high pass (HP) filter 0.5 Hz (monitor bandwidth) or 0.05 Hz
(diagnostic or ST- bandwidth).
Respiration section
3-lead cable The analog switches control the current supply source of the impedance respiration measurement,
and the lead selection for the 3-lead cable can be seen from the following table:
Table 2 Lead selection and coding for the 3-lead cable
Selected lead Current source between Signal measured from
IR - L N
II R - N L
III L - N R
Position on
IEC standard coding AAMI standard coding
body surface
right arm R = red RA = white
left arm L = yellow LA = black
left leg F = green LL = red
5-lead cable When the 5-lead cable is used, the current source is between L-F and the signal is measured from
the N, independently on the lead selection.
The respiration amplifier consist of the operational amplifiers, and the components around them.
There is an analog switch for controlling the gain of the first stage of the preamplifier. Synchronous
rectifier consists of the analog switches, which are used for detecting the respiration signal from 31
kHz amplitude modulated raw signal. The amplifier stage consists of the differential amplifier and
the last amplifier. The differential amplifier consists of the operational amplifiers and the
components around them. This stage is AC-coupled on both sides for minimising the offset
voltages. The last amplifier is used for amplifying the signal derived from differential amplifier
stage. The respiration signal is zeroed at the beginning of the measurement. Zeroing is also used
for fast recovering the measurement after the motion artefact. This is done in amplifier section.
NOTE: The respiration measurement is switched OFF for 20 seconds when defibrillation is detected
at the defibrillation detector.
Microprocessor section
Microprocessor contains RAM and EPROM memories. The processor uses external EEPROM
memory. The microprocessor’s internal 8-channel A/D-converter converts the ECG-signals to
digital form. See the section in ECG board’s description: “RS485 communication
Serial communication
Communication with the module bus is made through RXD and TXD pins. See the section in STP
board’s description: “Serial communication”.
15
Document No. 800 1008-2
Page 22
Datex-Ohmeda S/5 monitors
Isolated section
The patient isolation of ECG is 5 kV.
NOTE: The isolation has been changed from the earlier revisions.
WARNING Do not touch battery operated monitor during defibrillation procedure.
See the “Isolated section” in STP board description.
Power supply section
See the “Power supply section” in STP board description.
There is a test connector (X20) on the board for voltages +5 VREF, +5 V, +12 V, GND and -12 V.
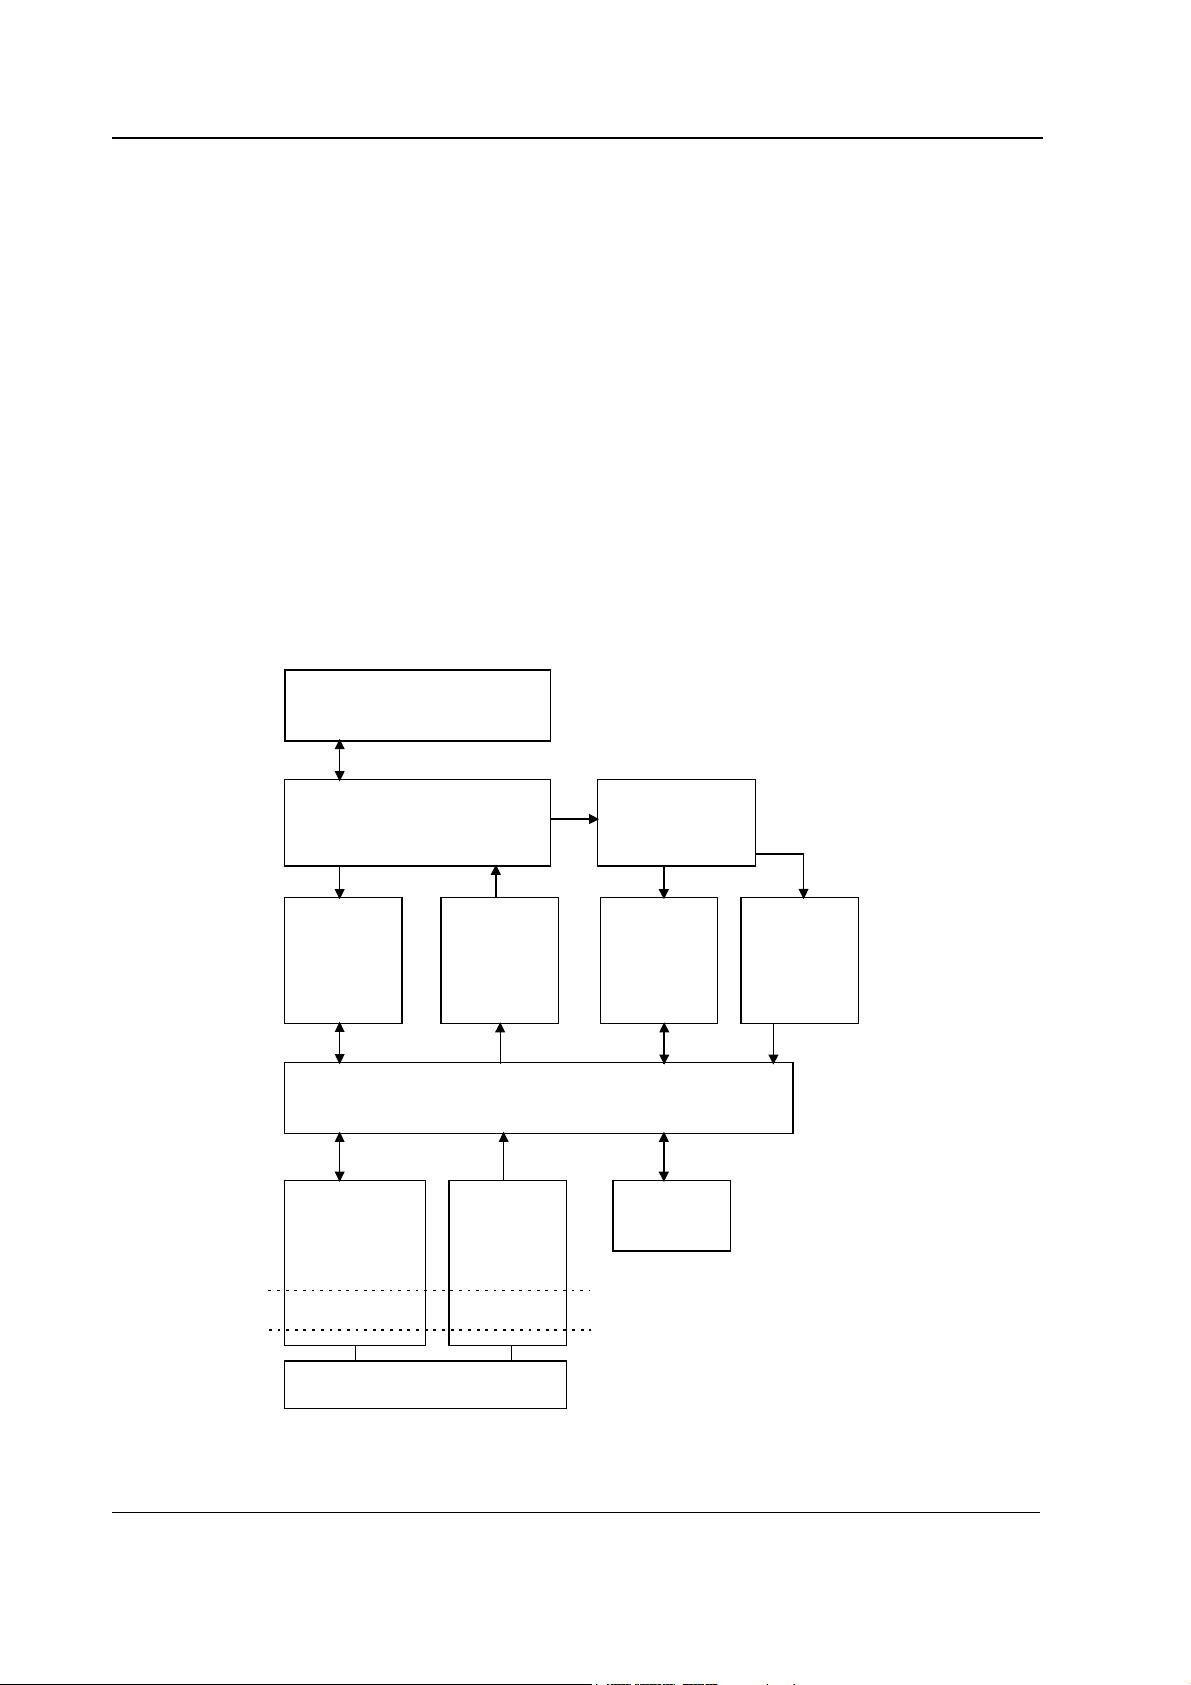
2.2.5 ECG board in 12-lead measurement
The 12-lead ECG measurement consists of the functions, which are shown in the figure 7. All
functions are located in the ECG board except the front panel connector and the ECG input board.
Front panel connector and
ECG input board
Input protection and filtering
Respiration
impedance
amplifiers
RS 485
communication
Respiration
impedance
supply
ECG CPU
Power
supply
ECG preamplifiers
ECG amplifiers
and
Baseline
restoration
NV memory
Pacer
detection
16
Document No. 800 1008-2
Isolation
to STP board
Isolation
Figure 7 12-lead ECG measurement block diagram
Page 23

Front panel connector and ECG input board
The connector for the 12-lead ECG cable is a green 12 pin Nicolay type connector. 3- or 5-lead
cables with blue connector cannot be connected to this connector. The ECG input board contains
high voltage resistors and a connector for ECG board.
Input protection and filtering
The input protection is implemented with protection diodes, which are connected to analog power
supply voltage and ground. The input filtering for ECG measurement is done with discrete
components. The measured signal is AC-coupled for respiration measurement. The signal from the
respiration supply is AC coupled. There are also the overload protection diodes for respiration
measurement supply.
ECG preamplifiers
The buffer amplifiers are used for each lead except N/RL. The leads off detection is implemented
by measuring the level of the input buffer amplifiers with A/D converter of CPU. The ECG signals are
measured using differential amplifiers.
S/5 Hemodynamic modules
ECG amplifiers and baseline restoration
The function of the ECG amplifiers and baseline restoration is to amplify the signal and to restore
the baseline of the signal in the middle of the display after the change of the signal level e.g. after
the change of the DC offset voltage.
Pacer detection
Pacer detection has been made by using two slew rate detector circuits. The pacer detection
amplifiers have been realized at the front of the slew rate detectors independently from the ECG
measuring channels.
Respiration impedance supply
The 62.5 kHz sine wave generator is used as the respiration measurement signal supply. Analog
switches are used for connecting the sine wave to the ECG leads to be measured.
Respiration impedance amplifiers
Buffer amplifiers are used in respiration measurement. Analog switches are used for selecting the
measurement leads. There are also additional amplifiers for increasing the respiration signal gain.
Respiration is always measured between R and F, independently on the ECG lead selection.
ECG CPU
The CPU is a 16 bit H8/3048 single-chip microcomputer. It contains 128 kbytes of flash memory
and 4 kbytes of RAM. The clock frequency is 16 MHz.
17
Document No. 800 1008-2
Page 24

Datex-Ohmeda S/5 monitors
RS485 communication
The communication to the CPU board of the monitor uses RS485 protocol. The RS485 driver
circuits are optically isolated from the processor of the module. PWM signal is used for direct ECG
signal. Direct ECG signal is available from the X2 connector of the UPI board or from the PT module.
Power supply
The ECG board has a driver controlled half bridge switching power supply with 5 kV isolation. The
supply voltages have been regulated with linear regulators.
2.2.6 ECG filtering
The S/5 monitors have three ECG filtering modes:
MONITORING 0.5...30 Hz (with 50 Hz reject filter)
DIAGNOSTIC @ 12-lead ECG 0.05...150 Hz
DIAGNOSTIC @ other modules 0.05...100 Hz
0.5...40 Hz (with 60 Hz reject filter)
ST FILTER 0.05...30 Hz (with 50 Hz reject filter)
0.05...40 Hz (with 60 Hz reject filter)
The purpose of filtering is to reduce high frequency noise and low frequency (e.g. respiratory)
movement artifacts.
Monitor filter is used in normal monitoring. Diagnostic filter is used if more accurate diagnostic
information is needed. ST filter gives more accurate information of ST segment, but reduces high
frequency noise.
The high-pass filters 0.5 Hz and 0.05 Hz are done with hardware. The monitor sends a command to
the hemodynamic module determining which of the corner frequencies 0.5 Hz or 0.05 Hz is to be
used.
The 50 Hz and 60 Hz reject filters are both low-pass filters with zero at 50 Hz or 60 Hz
correspondingly and they are done with software. They are for the mains supply filtering. When
these filters are used, 3 dB value for low-pass filter is 30 Hz or 40 Hz.
In diagnostic mode the upper frequency is limited by hardware and the -3 dB frequency is 100 Hz
for 3 or 5 lead ECG measurement. For 12 lead ECG the upper frequency is 150 Hz and it is limited
by software.
18
Document No. 800 1008-2
Page 25
2.2.7 STP board
S/5 Hemodynamic modules
Patient connectors
Front panel
keys
Power
isolation
section
Isolation
transformer
TEMP
measuring
unit
Temp AD
AD-converter
- 8 chn
- 12 bit
INV
PRESS
measuring
unit
Press AD
Pox AD
Serial device communication
µprocessor unit
RAM internal 2K
external 16K
EPROM 48K
RS communication
Patient isolation
POX preamplifier
POX
gain
control
Re d
Module
bus
data
Reset
Opto
isolation
ver
i
dr
Ds
LE
ox
g
rin
su
ed
measuring
ea
IR
m
Intensities
Non volatile
memory
P
Figure 8 STP board block diagram
Microprocessor unit
As processor, Intel’s 80C196KC-16 is used. There are external memories, an 8-bit data bus, a 16
MHz oscillator, an open collector reset, and a watchdog timer. Three A/D-converters within the
processor are used. The processor’s internal UART communicates with the CPU board.
High speed I/O is used to obtain pulse control sequence necessary for pulse oximetry
measurement. It gets its timing clock from the oscillator.
Power
nonisolation
section
Power for
module
Power
reset
Power for
Communication
Module bus connector or
connector to NIBP Board (NESTPR)
RS485 Driver
for module
reset
Module reset
RS485 Driver
for data
Module data
19
Document No. 800 1008-2
Page 26
Datex-Ohmeda S/5 monitors
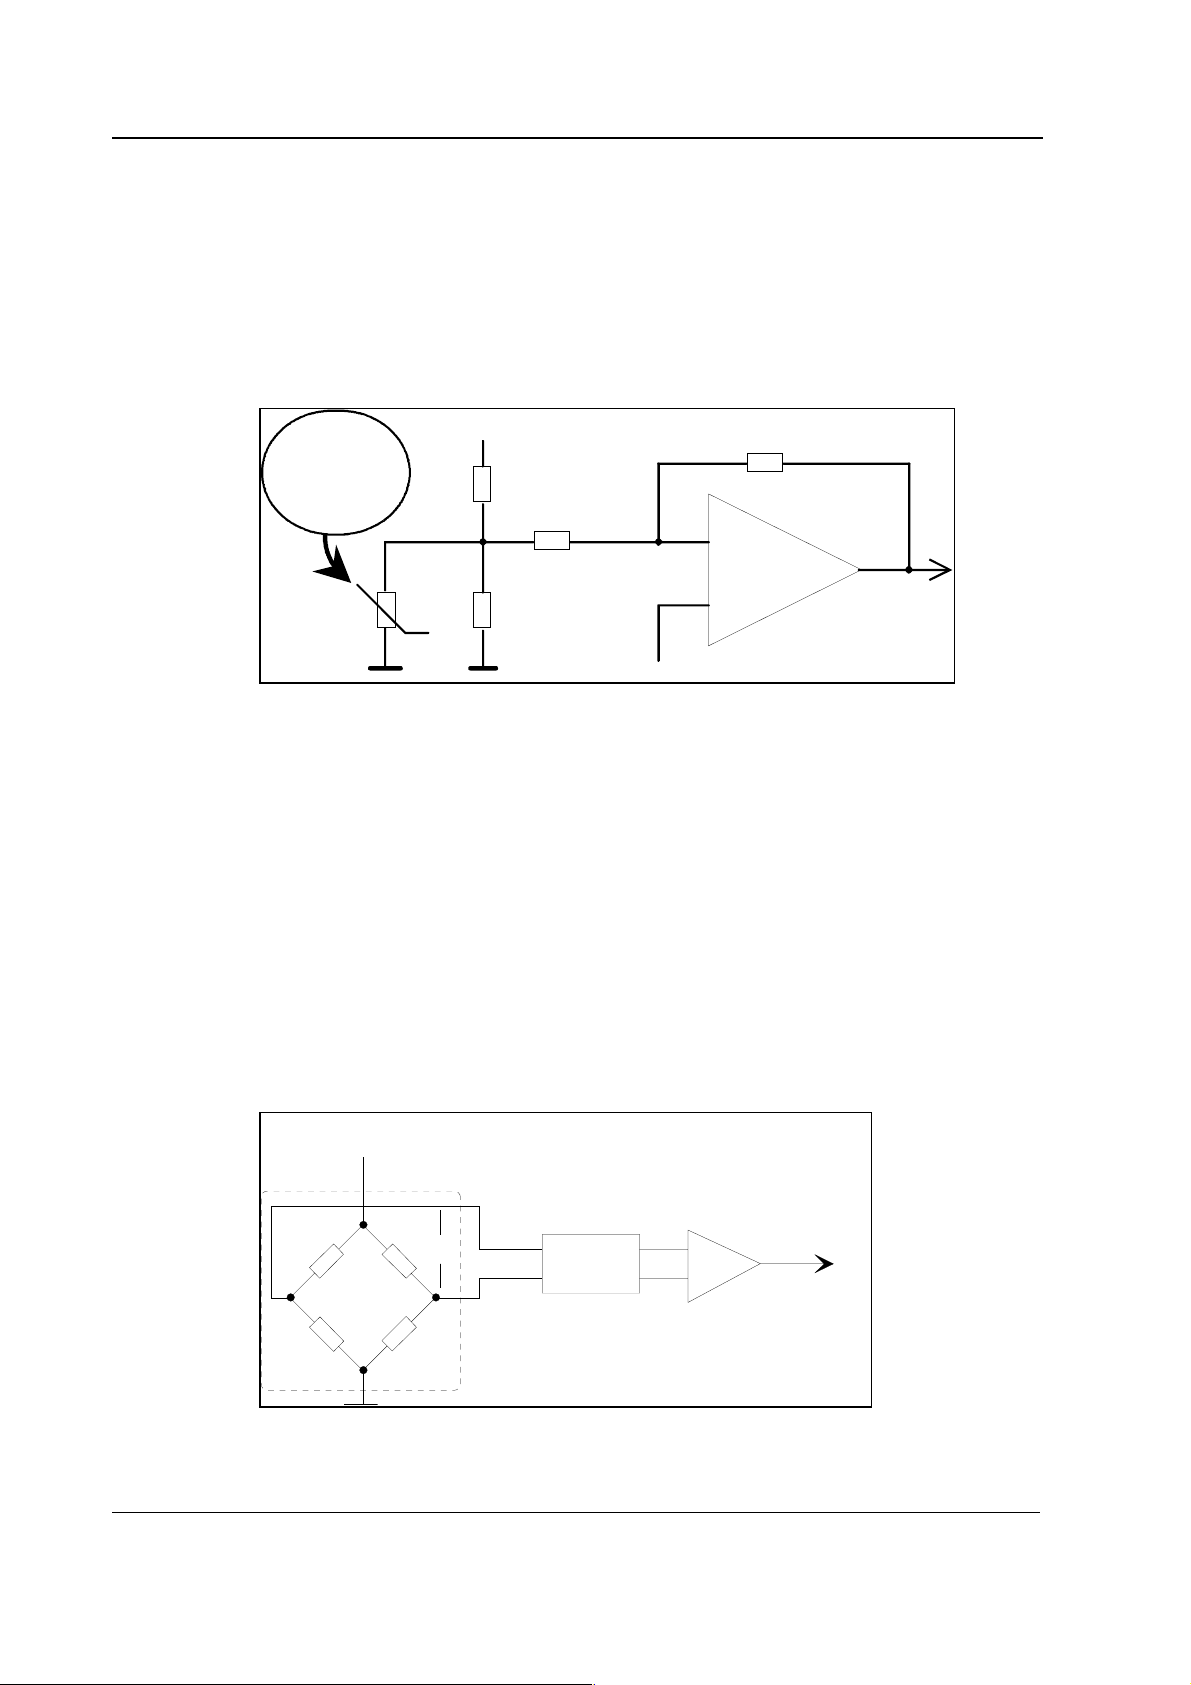
Temperature measurement unit
Value of NTC-resistor in the probe depends on patient’s temperature. It is measured with the
following principle.
The temperature signal(s) is produced by voltage dividers, part of which is the patient probe (YSI
400-series thermistor). The output is amplified by the calibrated amplifier(s) whose offset voltage
makes its output spread on both sides of zero. Wider output range (measurement range) means
better resolution.
0 °C => 7K357
15 °C => 3K541
25 °C => 2K253
38 °C => 1K301
45 °C => 984R1
+5Vreference
NTC
Figure 9 Temperature measurement principle
Invasive blood pressure measurement unit
Isolated +5 V voltage is supplied to the pressure transducer. From the bridge connection a
differential voltage, which depends on pressure and supplied voltage, is calculated (see the
formula below).
= Uin × pressure × 5 V, where Uin is 5 V
U
out
= 25 V × pressure [mmHg]
Þ U
out
Pressure amplification is realized in the instrumentation amplifier. Gain of the amplifier is set so
that the level of the signal transferred to A/D converter stays within the measurement range even
when there are circumstantial offsets or offsets caused by the transducer. There is a filter before the
amplifier to attenuate high frequency disturbances.
A1
to AD
converter
offset
20
Document No. 800 1008-2
Vin
Pressure
transducer
Vout
Input
Filter
Figure 10 Pressure measurement principle
Instrumentation
amplifier
G
to AD converter
Page 27
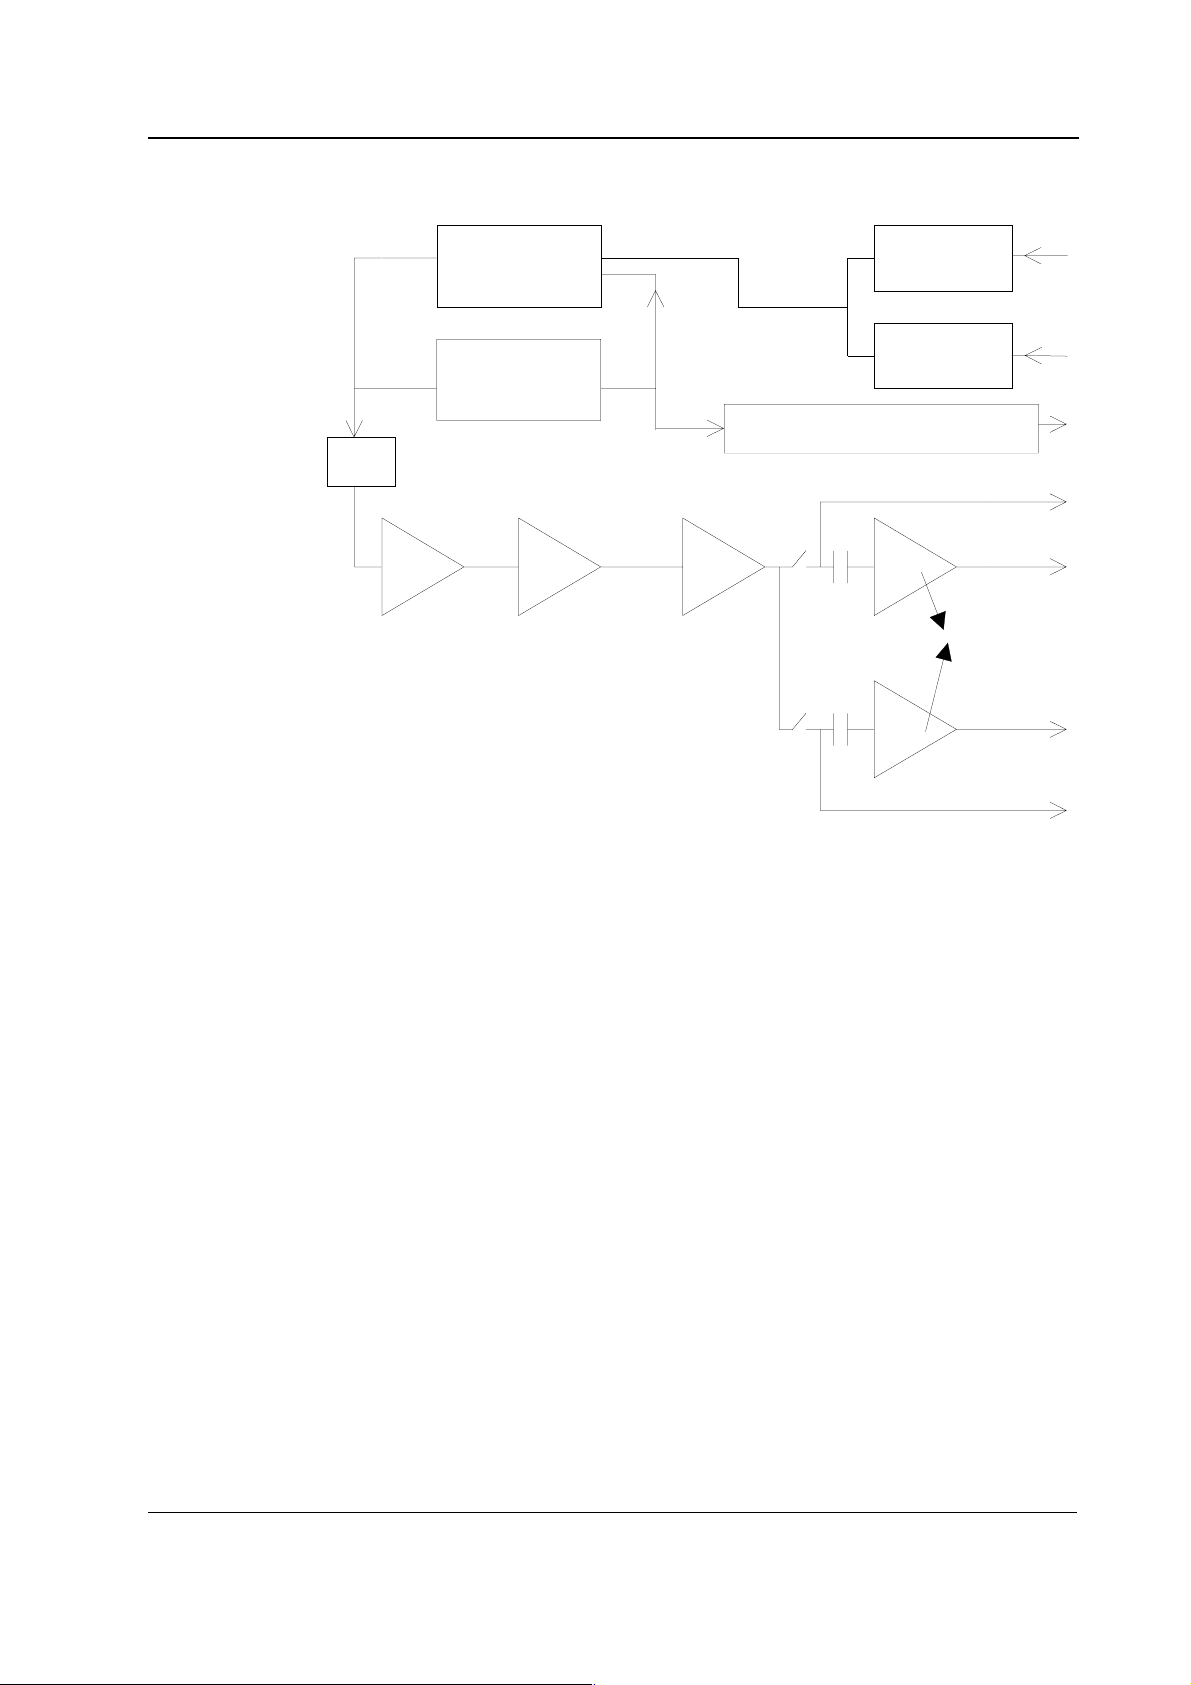
Pulse oximetry measurement section
S/5 Hemodynamic modules
I=5-350mA
Probe
Preamplifier
Current - to - Voltage
converter
LED driving circuit
Level of LED current
measurement and
feedback circuit
G =1/4096-1
Digitally controlled
attenuator
Amplifier
IRed LED intensity
adjustment
Red LED intensity
adjustment
Level of LED current indication (to CPU)
IR DC level
G = 275
Two step
AC amplifier
G =16
or 63
G =16
or 63
IRed AC signal
for NESTPR
G =18
or 125
Red AC signal
Red DC level
Figure 11 Pulse oximetry measurement block diagram
LED control signals
The processor sends pulse width modulated signals, IRED intensity and RED intensity, which are
converted to DC voltage and filtered. By switches either RED or IRED intensity is sent forward to
amplifier in LED driving circuit.
LED driving circuit
Voltage difference which corresponds to LED current, is measured by the differential amplifier
circuit and its output is sent back to the processor in 0 to 5 V level. There are feedback circuits from
LED current measurement and LED intensity control.
Background light is measured by picking up a sample from the signal. The sample is modified to 0
to 5 V level and sent to the processor.
Measured signal preamplification
Preamplifier is current-to-voltage converter with gain selection. The higher gain is used for
measuring of thin tissue.
Digitally controlled amplifier
D/A converter is a digitally controlled amplifier after which there is another constant amplifier.
Document No. 800 1008-2
21
Page 28

Datex-Ohmeda S/5 monitors
Red and infrared channel separation
Red and infrared channels are separated from each other by switches. Operational amplifier
functions as a buffer and after this infrared DC signal is sent to the processor. A capacitor
separates AC signal from it and the AC signal is sent to the processor after amplification. There is a
switch to choose the amplification constant.
Serial communication
Serial communication between the module and the frame is done by RS485 type bus whose
buffers get their supply voltage (+5 VDC) from the Frame and in the isolation section get the supply
voltage (+5 V) from the isolated power supply.
The buffers of the serial communication are controlled also by Reset signal so that when the Reset
is active, the buffer does not transfer data.
Reset is also RS485 type and additionally, there is an auxiliary logic power reset, which keeps the
reset active for about 500 ms despite the state of reset in the module bus. Time constant
determines the power-up reset time. There are components to prevent the module from sending
data during reset. Data transmission rate is 500 kbps.
NIBP Board
or
s
send/receive
dule proses
o
m
STP Board
r
osesso
r
send/receive
le p
du
o
m
ECG Board
ssor
se
send/ recei ve
Receive data
Send d ata
Res et
Rece ive dat a
Send data
Res et
Rec ei ve da ta
Send data
Res et
Opto isolation
PatientIso
Opto isolation
n
tio
la
Rece ive da ta
Send data
Rese t
Recei ve d ata
Send data
connector for ECG board
Rec ei ve d at a
Send dat a
send/recei ve
Res e t
Res et
RS485
Dri ver
send/receive
RS485
Dri ver
RS485
Dri v e r
send/r eceiv e
RS485
Dri v e r
Dat a
NDat a
Rese t in
NRes et in
Dat a
NDat a
Rese t i n
NRes et i n
connector for STP boardconnector for NIBP board
module bus connector
22
Document No. 800 1008-2
module pro
t
n
e
ti
Isolation
Pa
connector for STP board
Figure 12 Serial communication and opto isolation of M-NESTPR/-NE12STPR
Page 29

S/5 Hemodynamic modules
STP Board
send/receive
module processor
ECG Board
send/receive
module processor
Receive data
Send data
Res et
Receive data
Send data
Res et
Opto isolation
Patient
Opto isolation
Patient
isolation
isolation
Receive data
Send data
connector for ECG board
Recei ve dat
Send data
send/receive
Reset
Rese t
RS485
Driver
send/receive
RS485
Driver
Connector for STP board
Data
NDat a
Reset in
NRese t in
Connector for ECG board
module bus connector
Figure 13 Serial communication and opto isolation of M-ESTPR
Isolated section
There are two opto isolators. Signal is processed on logical high-low level even though the outputs
of the opto isolators are analog signals in the isolated section.
Reset line is an open collector type with a pull-up resistor. Thus the processor is able to use its
internal watch-dog function.
Power supply section
Isolated supply voltage of the module is developed from +15 Vdirty voltage from the Central Unit.
Power supply is a switched-mode circuit, where FET transistor switch is controlled by an oscillator
using bipolar timer. The frequency of the oscillator is about 30 kHz and pulse ratio 50 %.
Controlling of the FET switch is slowed to suppress spurious interference.
A special pulse transformer is used in the circuit. In the secondary circuit normal linear regulators
are used except for +5 V (low drop type linear regulator).
23
Document No. 800 1008-2
Page 30

Datex-Ohmeda S/5 monitors
2.3 Connectors and signals
2.3.1 Module bus connector
13
25
1
14
Figure 14 Module bus connector (X1) pin layout
Table 3 Module bus connector description
Pin No I/O Signal Note
1 I RESET_RS485
2 I -15 VDC ∗∗
3 I +15 VDIRTY
4 I +15 VDC ∗∗
5 I/O -DATA_RS485
6 I/O DATA_RS485
7 Ground & Shield
8 I -RESET_RS485
9 I CTSB ∗
10 O RTSB ∗
11 I RXDB ∗
12 O TXDB ∗
13 Ground & Shield
14 I +32 VDIRTY ∗
15 I GroundDIRTY
16 I CTSC ∗
17 O RTSC ∗
18 I RXDC ∗
19 O TXDC ∗
20 ON/STANDBY ∗
21 O PWM_ECG
22 RXDD_RS232 ∗
23 TXDD_RS232 ∗
24 I +5 VDC
25 I +5 VDC
24
Document No. 800 1008-2
∗ = Not used
∗∗ = Used only by M-ESTPR, M-ETPR, M-ESTR and M-NIBP modules
Page 31

2.3.2 Front panel connectors
Table 4 Front panel connectors
12-lead ECG connector
8
1
2
3
Pin No Signal Pin No Signal
1
Right arm electrode (R)
2
Left arm electrode (L)
3
N
4
Left leg electrode (F)
5
Chest electrode (C1)
6
Chest electrode (C2)
9
101112
45
7
6
7
8
9
10
11
12
Chest electrode (C3)
Chest electrode (C4)
Chest electrode (C5)
Chest electrode (C6)
Cable type
Ground
S/5 Hemodynamic modules
ECG connector (ECG) SpO2 connector (SpO2) Invasive blood pressure
connectors (P1, P2)
6
3
1
2
9
4
7
0
5
8
6
3
1
2
9
4
7
0
5
8
3
1
4
2
5
Pin No Signal Pin No Signal Pin No Signal
10
1
Right arm electrode (R)
2
Left arm electrode (L)
3
Right leg electrode (RL)
4
Left leg electrode (F)
5
Chest electrode (C)
6
Cable shield
7
Not connected
8
3/5 lead identification
9
Lead connection check
Ground
10
1
Feedback resistor
2
Ground
3
Not Connected
4
Cable shield +
probe identification ground
5
Probe identification
6
LED drive ground
7
LED drive current
8
Input signal current
9
Ground
Ground
10
1
Pressure +
2
Pressure -
3
Polarisation - (ground)
4
Polarisation +
5
Not connected
6
Not connected
7
Not connected
8
Not connected
9
Ground
Cable detection
6
9
7
0
8
25
Document No. 800 1008-2
Page 32

Datex-Ohmeda S/5 monitors
2
2.3.3 Test points on boards
12-lead ECG board
X2
non floating
10
1 GND
6 +15 Vdirty
8 +5 V
1
12-lead ECG board
component side
NIBP board
1
X4
floating
1
2 +5 Vdig.
1
X6
floating
1 -5 V
2 +2.5 V
10
9
2
X3
1
floating
1 GND
6 +5 Vanalog
10 GND
There are test pad blocks on solder side. X8 and X6 pads and voltages are:
10 X6
9
X6
X8
X5
X7
1
X8
X8 X6
12
78
Pin No Signal Pin No Signal
1 GND 1 GND
2 WD out 2 A1 output
3 reset 3 - 5 V
4 +5 V 4 +5 V ref
5 +15 V dirty 5 B1 out - (A1 input)
6 +15 V 6 B1 out +
7 -15 V 7 B2 out +
8- 8B2 out -
9-
10 GND
26
Document No. 800 1008-2
Page 33

ECG and STP board
There are test pin blocks identical both on STP and ECG boards. Pins and voltages are as follows:
ESTPR
S/5 Hemodynamic modules
NESTPR
X11 pin 1 +5 Vref
pin 2 +5 V
pin 3 +12 V
pin 4 Gnd
pin 5 -12 V
X12 pin 1 -5 V (STP board only)
X11 pin 1 +5 Vref
pin 2 +5 V
pin 3 +7 V
pin 4 Gnd
pin 5 -7 V
X12 pin 1 -5 V (STP board only)
X11
X11
X12
X12
27
Document No. 800 1008-2
Page 34

Datex-Ohmeda S/5 monitors
3 SERVICE PROCEDURES
3.1 General service information
Field service of the hemodynamic modules is limited to replacing faulty printed circuit boards or
mechanical parts. Faulty printed circuit boards should be returned to Datex-Ohmeda for repair.
Datex-Ohmeda is always available for service advice. Please provide the unit serial number, full
type designation, and a detailed description of the fault.
CAUTION Only trained personnel with appropriate equipment should perform the tests and repairs outlined in
this section. Unauthorized service may void warranty of the unit.
3.2 Service check
These instructions include complete procedures for service check. The service check is
recommended to be performed after any service repair, however, the service check procedures can
be used also for determining possible failures.
The procedures should be performed in ascending order.
The instructions include a check form (Appendix A) which should be filled in when performing the
procedures.
The mark
check form.
The procedures are designed for monitors with S/5 monitor software of revision 01. However, most
of the procedures also apply to monitors, which contain some other monitor software
type/revision.
? in the instructions means that the performed procedure should be signed in the
3.2.1 Recommended tools
Tool Order No. Notes
Patient simulator -
Pressure manometer -
Temperature test set 884515
3-lead ECG trunk cable
5-lead ECG cable
10-leadwire ECG cable
SpO2 finger probe SAS-F4
InvBP transducer
Adult NIBP cuff & hose
Infant NIBP cuff & hose
Screwdriver
28
Document No. 800 1008-2
Page 35

3.2.2 Recommended parts
Part Order No. Notes
NIBP pump filter 57142
All modules
Detach the module box by removing the two screws from the back of the module. Be careful with
loose latch and spring pin for locking.
1. Check internal parts:
− screws are tightened properly
− cables are connected properly
− all IC’s that are on sockets are attached properly
− EMC covers are attached properly
− there are no loose objects inside the module
?
S/5 Hemodynamic modules
2. Check external parts:
− the front cover and the front panel sticker are intact
− all connectors are intact and are attached properly
− the module box, the latch and the spring pin are intact
?
3. Replace the NIBP pump filter in NE12STPR/NE12TPR/NE12STR/NESTPR/NETPR/NESTR
modules, if necessary.
?
• Reattach the module box and check that the latch is moving properly.
• Switch the monitor on and wait until the monitoring screen appears. Configure the monitor
screen so that all the needed parameters are shown, for example as follows:
Monitor Setup - Waveform Fields - Field 1 - ECG1
Field 2 - ECG2
Field 3 - P1
Field 4 - P2
Field 5 - Pleth
Field 6 - Resp
Digit Fields - Lower Field 2 - NIBP
Lower Field 3 - T1+T2
29
Document No. 800 1008-2
Page 36

Datex-Ohmeda S/5 monitors
4. Plug in the module. Check that it goes in smoothly and locks up properly
?
5. Check that the module is recognized, i.e. all needed parameter information, except invasive
blood pressure, starts to show on the screen.
?
Preset ECG, Respiration, InvBP and SpO2 measurement settings:
ECG - ECG Setup - Hr Source - Auto
Others - Resp Setup - Size - 1.0
Invasive Pressures - P1 ‘Art’ Setup - Label - Art
Pacemaker - Show
Resp Rate Source - Auto
Measurement - On
Detection Limit - Auto
P2 ‘Cvp’ Setup - Label - Cvp
ECG measurement
6. Enter the service menu:
7. Enter the ESTP : ECG service menu:
8. Check the front panel membrane key ECG Lead (not available in NE12STPR/NESTPR type
Pulse Oximetry - Pleth Scale - Auto
Monitor Setup - Install/Service (password 16-4-34) -
Service (password 26-23-8) - Parameters
Take down the information regarding module software by selecting Scroll Vers and turning
the ComWheel.
?
Check that the ‘Timeouts’, ‘Bad checksums’ and ‘Bad c-s by mod’ values are not increasing
faster than by 50 per second. Check also that the ECG/RESP board memories have passed
the internal memory test, i.e. the ‘RAM’, ‘ROM’ and ‘EEPROM’ state all OK.
?
modules).
Press the key at least for two seconds. Check that the selected ECG lead is changing on the
screen and the state for ‘Button’ in the service menu.
30
Document No. 800 1008-2
?
Page 37

S/5 Hemodynamic modules
9. Check that the power frequency value has been set according to the current mains power
frequency. Change the setting by selecting Power Freq, if necessary.
?
10. @ M-ESTPR, M-ETPR , M-ESTR, M-NESTPR, M-NETPR and M-NESTR modules: connect a 5-
lead ECG cable to the module. Check that the ‘Cable type’ shows 5 lead. If it shows 3 lead,
make sure the used 5-lead ECG cable contains the necessary wiring for cable recognition
(pins 0, 8 and 9 connected together).
@ M-NE12STPR, M-NE12TPR and M-NE12STR modules: connect a 10-leadwire ECG cable
to the module. Connect limb lead electrodes and one electrode from the chest lead set to
the same potential. Check that the ‘Cable type’ shows 10 lead.
?
11. Connect a 3-lead ECG trunk cable without a lead set to the module. Check that the
message "Leads off" is displayed on the screen.
?
12. Check that all the electrodes show OFF in the service menu and the message ‘Leads Off’ is
shown on the screen.
Connect all the leads together, for example to a suitable screwdriver. Check that all the
electrodes show ON and the message ‘Asystole’ appears.
Disconnect one of the leads and check that the corresponding electrode in the service
menu shows OFF within 10 seconds from the disconnection, then reconnect the lead.
Check the rest of the leads using the same method.
NOTE: When the ground lead (black) is disconnected all the electrodes should show OFF.
NOTE: The ‘Asystole’ and ‘Different leads off’ messages are shown using certain priority, so
even one of the leads is disconnected, the lead related ‘Leads off’ message may not appear
onto the screen.
NOTE: When RA, LA or LL electrode is disconnected, all six V electrodes show OFF.
NOTE: With NESTPR/ESTPR type modules and 5 lead cable the state of V2, V3, V4, V5 and
V6 electrodes follow the state of the V electrode.
?
13. Connect the leads to a patient simulator.
The settings and checks with Dynatech Nevada MedSim 300 Patient Simulator:
ECG - BASE - BPM - 160
PACE - WAVE - NSR
31
Document No. 800 1008-2
Page 38

Datex-Ohmeda S/5 monitors
Check that normal ECG waveform is shown, the HR -value is 160 (±5) and the ‘Pacer count’
-value is not increasing in the service menu. Check the lead selections by pressing the
Lead key on the module (not available in NE12STPR/NESTPR type modules).
ECG - PACE - WAVE - ASNC
Check that pacemaker spikes are shown on the ECG waveform, the ‘HR’ -value changes to
75 (±5) and the ‘Pacer count’ -value is increasing according to shown pacemaker spikes.
Set the pacemaker option off:
ECG - PACE - WAVE - NSR
?
Respiration measurement
13. Check that the ‘Resp Available’ and ‘RESP Measurement’ show both ON in the ESTP: ECG
service menu.
?
ECG
14. Check the respiration measurement with a patient simulator.
The settings and checks with Dynatech Nevada MedSim 300 Patient Simulator:
BASELINE IMPEDANCE -switch - 500
LEAD SELECT-switch - II/RL-LL
RESP - WAVE - NORM
RATE - 20
OHMS - 1.0
RATIO - 1/1
APNEA - OFF
SHIFT - OFF
Check that the RESP waveform is shown and the ‘RR’ -value is 20 (±5). Change the position
of the BASELINE IMPEDANCE -switch and check that appropriate RESP waveform and ‘RR’ value are shown again within 30 seconds.
RESP - APNEA - 32 S
Check that the monitor gives the APNEA -alarm.
NOTE: Make sure that only the ECG leads are connected to the simulator during the apnea test. If other cables are connected at the same time, the respiration signal from the
simulator may be disturbed, and therefore, the APNEA -alarm may not be activated.
32
Document No. 800 1008-2
NOTE: When you have ECG service menu open, spikes will appear on the respiration
waveform. These spikes represent the threshold level for detecting inspiration and
expiration.
?
Page 39

Temperature measurement
15. Enter the ESTP : STP service menu:
Parameters - ESTP : STP
Check that the ‘Timeouts’, ‘Bad checksums’ and ‘Bad c-s by mod’ values are not increasing
faster than by 50 per second. Check also that the STP board memories have passed the
internal memory test, i.e. the ‘RAM’, ‘ROM’ and ‘EEPROM’ show all OK.
?
16. Check that the ‘Cable’ and ‘Probe’ show OFF for both channels, T1 and T2, when no probes
are connected.
Connect a temperature test plug into the connector T1. Check that the ‘Cable’ and ‘Probe’
for T1 show ON and the corresponding temperature value appears onto the monitor screen.
Perform the same check also for the channel T2.
?
S/5 Hemodynamic modules
17. Check the temperature calibrations using temperature test plugs.
If the deviation on a temperature reading on the screen is more than 0.1 °C, calibrate the
temperature channels according to the instructions in the chapter 3.4.3 Temperature
calibration.
?
18. Activate the temperature test by selecting Temp Test from the menu and pressing the
ComWheel twice. When the message ‘Performing temp test’ disappears from the digit field,
check that no error messages appear and ‘Temp error’ shows OFF for both channels in the
service menu.
?
19. Check that the module configuration has been set correctly. The configuration in use is
shown beside the text ‘Configuration’ in the service menu and it can be either STP, ST or TP.
Change the configuration in the Calibrations menu, if necessary.
?
Invasive blood pressure measurement
20. Check the front panel membrane keys that are related to the InvBP or temperature
measurement.
Press each of the keys at least for one second. Check that the pressed key is identified, i.e.
one of the texts for ‘Buttons’ changes from OFF to ON in the service menu.
?
21. Check that the ‘Cable’ and ‘Probe’ for P1 show OFF. Plug a cable with an invasive blood
pressure transducer into the front panel connector P1 and check that the ‘Cable’ and
Document No. 800 1008-2
33
Page 40

Datex-Ohmeda S/5 monitors
‘Probe’ show ON and the corresponding pressure waveform appears onto the screen.
Perform the same check also for the InvBP channel P2.
?
22. Calibrate the InvBP channels P1 and P2 according to the instructions in the chapter 3.4.4.
Invasive pressure calibration
?
23. Check the InvBP channels with a patient simulator.
The settings and checks with Dynatech Nevada MedSim 300 Patient Simulator:
SENSITIVITY -switch - 5 µV/V/mmHg
ECG - BASE - BPM - 60 - BP - 1 - WAVE - ATM
2 - WAVE - ATM
SpO2 measurement
24. Check that the message ‘No probe’ is shown when no SpO2 sensor is connected to the
Restore the normal monitoring screen by pressing the key Normal Screen.
Connect cables from the channels BP1 and BP2 to the module connectors P1 and P2. Zero
the InvBP channels by pressing the keys ZERO P1 and ZERO P2 on the module front panel.
BP - 1 - WAVE - ART
2 - WAVE - CVP
Check that appropriate InvBP waveforms are shown and the InvBP values are approximately
120/80 (±3 mmHg) for the channel P1 and 15/10 (±2 mmHg) for the channel P2.
Check that HR- value is calculated from P1 when ECG is not measured (ECG cable
disconnected).
?
module. Connect a SpO
shown when the probe is not connected to a finger.
finger probe to the module. Check that the message ‘Probe off’ is
2
?
34
Document No. 800 1008-2
25. Connect the SpO2 probe onto your finger. Check that the reading of
95-99 and SpO
and InvBP (P1) are not measured.
waveform appear. Check that HR- value is calculated from SpO2 when ECG
2
?
Page 41

Non Invasive Blood Pressure measurement
26. Enter the NIBP module service menu:
Parameters - NIBP
Check that the ‘Timeouts’, ‘Bad checksums’ and ‘Bad c-s by mod’ values are not increasing
faster than by 50 per second. Check also that the NIBP board memories have passed the
internal memory test, i.e. the ‘RAM’, ‘ROM’ and ‘EEPROM’ show all OK.
?
27. Check the front panel membrane keys.
Select Buttons/Leds.
Press each of the two NIBP related membrane keys at least for one second. Check that the
pressed key is identified, i.e. the corresponding text changes from OFF to ON in the menu.
?
S/5 Hemodynamic modules
28. Check the pump and valves.
Highlight Pneumatics from the NIBP menu. Connect a pressure manometer to the NIBP
module cuff connector.
Select Start Pump and press the ComWheel. Check that the pump turns on and the
pressure inside the tubing system starts to increase. Stop the pump by pressing the
ComWheel again when the pressure reaches 280 mmHg.
Highlight Open Exh1. Press the ComWheel and check that the pressure inside the tubing
system starts to drop then press the ComWheel again. Check the other exhaust valve by the
same way by selecting Open Exh2 from the menu.
If necessary, turn the pump on again for a moment to increase the pressure inside the
tubing system.
Highlight Set Valve. Press the ComWheel and set the value under the text ‘Pulse Valve’ to
number 150 by turning the ComWheel. Press the ComWheel again and check that the
pressure inside the tubing system starts to drop. Finish the test by selecting Previous Menu.
?
35
Document No. 800 1008-2
Page 42

Datex-Ohmeda S/5 monitors
29. Check the NIBP tubing system for leakages.
Select Calibrations from the NIBP service menu.
Connect the pressure manometer to the NIBP module cuff connector. Start the active leak
test from the menu by pressing the ComWheel. The module pumps a pressure of about 265
mmHg and then the pump stops.
Wait for 15 seconds for the pressure to stabilize then check that the pressure does not drop
more than 5 mmHg per one minute. Release the pressure by pressing the ComWheel once
more.
?
30. Calibration check.
Disconnect the pressure manometer. Select Calibrations and then highlight Calibration
Check. Press the ComWheel and take down the zero offset values for both pressure
transducers, B1 and B2. The values should be within ±10 mmHg.
Connect the pressure manometer to the cuff connector and check the calibration with
pressures 100 mmHg, 200 mmHg and 260 mmHg. The zero offset value must be added to
the displayed pressure value in order to determine the real pressure.
Recalibrate the NIBP measurement according to the instructions in the chapter 3.4
Adjustment and calibration, Calibration, if necessary. Remember to set the calibration
protection back on after the calibration.
?
31. Check the watchdog timer activation pressure.
Select Pneumatics from the NIBP service menu.
Keep the pressure manometer connected to the cuff connector. Pump up the pressure very
slowly and note the value on the manometer when your hear a signal from the loudspeaker.
The pressure at where the watchdog timer should activate with an audible signal is
7.5 mmHg (5...10 mmHg). Adjust the limit with the trimmer on the NIBP board, if necessary.
?
36
Document No. 800 1008-2
Page 43

S/5 Hemodynamic modules
32. Check the watchdog timer.
Select Watchdog from the NIBP service menu.
Check the watchdog timer in the adult mode. Activate the timer by highlighting Test ADULT
and then pressing the ComWheel. Check that the time beside the text ‘Watchdog Interval’
starts to run. Wait until you hear a signal from the loudspeaker and then check the time
again. The time from the adult test should fall within 120...140 seconds.
Check the watchdog timer also in the infant mode by first selecting Test INFANT from the
menu. The time from the infant test should fall within 60...70 seconds.
?
33. Check the safety valve.
Select Safety Valve from the NIBP service menu.
Keep the pressure manometer connected to the cuff connector.
NOTE: Make sure your pressure manometer can be used to measure pressures over 300
mmHg. If such a pressure manometer is not available, perform the check with an adult cuff
that is connected around some round object, for example a calibration gas bottle.
Highlight Start Test. Start the adult safety valve test by pressing the ComWheel. Wait until
the pump stops and the pressure is deflated. Check the pressure values ‘Max press’ and ‘2
s after stop’ for both transducers. All the values should be within 290 - 330 mmHg.
Highlight ADULT. Press the ComWheel and check that the text changes now to INFANT.
Select Start Test and wait until the pump stops and the pressure values on the screen have
been updated. Check that the values ‘Max press’ and ‘2 s after stop’ are all now within
154...165 mmHg.
Return to the normal monitoring mode by pressing
Normal Screen.
?
34. Connect an adult NIBP cuff to the cuff connector and disconnect one of its hoses.
Start NIBP measurement by pressing the key
the message ‘Cuff loose’ appears on the screen within 30 seconds.
Reconnect the hose and then bend it with your fingers. Restart the measurement and check
that the message ‘Cuff occlusion’ appears on the screen within 30 seconds.
Start/Cancel on the module and check that
?
Check that automatic inflation limits are in use:
NIBP - NIBP Setup - Inflation Limits - Auto - Previous Menu
37
Document No. 800 1008-2
Page 44

Datex-Ohmeda S/5 monitors
35. Connect the cuff onto your arm, highlight Start Ven.Stasis in the NIBP menu and press the
ComWheel. Check the module identifies the cuff, i.e. the text ‘Adult’ appears into the NIBP
digit field for a short moment.
Keep the pressure inside the cuff for about half a minute in order to find out that the cuff is
not leaking, then press the ComWheel again. Select
?
36. Keep the cuff on your arm and perform one NIBP measurement. Check that the module
gives a reasonable measuring result.
?
37. Connect an infant cuff to cuff connector and wrap it around your fingers.
Start NIBP measurement and check that the module identifies the cuff, i.e. the text ‘Infant’
appears into the NIBP digit field. Cancel the measurement after the cuff identification.
?
Normal Screen.
All modules
38. Perform electrical safety check and leakage current test.
?
39. Check that the module functions normally after the performed electrical safety check.
?
40. Clean the module with suitable detergent.
?
• Fill in all necessary documents.
38
Document No. 800 1008-2
Page 45

S/5 Hemodynamic modules
3.3 Disassembly and reassembly
3.3.1 M-ESTPR, M-ESTR, and M-ETPR modules
Disassemble the M-ESTPR/-ESTR/-ETPR module in the following way. See the exploded view of
the module in 6.1.1.
1. Remove the two screws from the back of the module.
2. Pull the module box slowly rearwards and detach it from the main body. Be careful with
loose latch and spring pin for locking.
3. To detach the ECG board, remove four screws, disconnect the ribbon cable from the STP
board, and the ribbon cable from the front panel. Slide the board rearward to disconnect
the fixed 10-pin connector from the ECG input board.
4. To detach the STP board, remove two screws and disconnect the two connectors from the
SP input board. The T-input connector cables must be disconnected as well.
CAUTION When reassembling the module, make sure that all cables are reconnected
properly.
3.3.2 M-NE12STPR/-NE12STR/-NE12TPR/-NESTPR/-NESTR/-NETPR modules
Disassemble the M-NE12STPR/-NE12STR/-NE12TPR/-NESTPR/-NESTR/-NETPR module in the
following way. See the exploded view of the module in 6.1.12.
1. Remove the two screws from the back of the module.
2. Pull the module box slowly rearwards and detach it from the main body. Be careful with
loose latch and spring pin for locking.
3. To detach the ECG board, detach four screws, disconnect ribbon cable from the STP board
(supply voltage), and ribbon cable from the ECG input board.
4. When the ECG board is removed, the STP board can be detached by removing four screws,
disconnecting the cable from the membrane keypad, the cable from the temperature
connectors, and cables from the SP input board. Also disconnect the NIBP hoses and the
ribbon cable from the NIBP board.
5. When the ECG board and the STP board are removed, the NIBP board can be detached by
removing four screws. The joining chamber can be detached by removing three screws and
disconnecting the hoses from the pressure transducers and the pump. The pump can be
detached by removing two screws. If the filter for the air inlet of the pump is removed, it
must be replaced.
39
Document No. 800 1008-2
Page 46

Datex-Ohmeda S/5 monitors
3.4 Adjustments and calibrations
3.4.1 Pressure safety level detection “OFFSET”
Remove two screws at the rear of the module. Remove the module box. Connect first the service
cable (e.g. a long Gas Interface Cable) to the module connector inside the monitor frame and then
to the rear connector of the module. Turn the monitor on. Enter to the NIBP service menu and select
Pneumatics. Pump reference pressure 7.5 mmHg into the module.
Adjust the trimmer until AD5 signal sign changes from negative to positive. Re-check the
adjustement, then lock the trimmer with for example nail polish.
3.4.2 NIBP calibrations
The electronics of NIBP pressure measurement is calibrated at the factory. Zeroing pressure is
automatically maintained by the processor. If the zero point of the pressure transducer drifts more
than specified, an error message is given and the NIBP board should be recalibrated or replaced.
The calibration can be checked and recalibrated in the NIBP service menu.
The calibration of the primary pressure channel can also be checked from the NIBP setup menu
(NIBP - NIBP Setup - Calibration Check). In this case the auto zeroing is performed at start remove hose before entering to ensure atmospheric pressure to the pressure transducers - the
primary pressure is displayed. The zero-offset value should then be zero.
Calibration check
1. Enter Calibration menu.
2. Select Calibration Check and press the ComWheel.
3. Connect an external precision manometer to the module.
40
Document No. 800 1008-2
Page 47

Calibration
S/5 Hemodynamic modules
4. Pump the following pressures to manometer and check the difference between the
manometer and monitor pressure display:
Table 5 NIBP calibration check pressures
Pressure Max. error Example
0 mmHg ±9 mmHg (=zero offset) -2
100 mmHg 100 + zero offset ±2 mmHg 98 ±2
200 mmHg 200 + zero offset ±3 mmHg 198 ±2
If the error of pressure channel B1 is larger than specified above, the module should be
recalibrated. The error of B2 is allowed to be even twice as large because it has no effect on blood
pressure measurement accuracy. However, it is recommended to recalibrate the module also when
the error of B2 is larger than specified above to ensure best possible operation.
1. Enter Calibration menu.
2. Remove hoses from front panel connector to enable proper zeroing.
3. Select Calibration. If it is not available, perform the steps A, B, and C.
NOTE: Do not pull out the NIBP module from the monitor frame. The module must be in the frame
during the whole procedure.
A. Turn the toggle switch at the bottom of the NIBP module to enable the calibration. Turn the
switch to the right by, for example, a sharp pencil. This enables menu selection Protection.
The message ‘Calibration switch ON!’ appears.
B. Select Protection OFF in the Calibration menu and press the ComWheel.
C. Return the toggle switch to the left. Menu selection Calibration is now enabled, and
Protection is disabled. When the calibration is enabled, a message ‘Calibration not
protected’ appears.
• Start Calibration by pressing the ComWheel. Messages ‘Zeroing’ and ‘Zeroed’ will appear in
the NIBP message field. After this a pressure bar will appear.
• Connect an external mercury manometer with pump to module through the both tubes of
the hose - both transducers B1 and B2 must be calibrated simultaneously. Pump up to a
pressure about 200 mmHg according to the manometer. Calibration is possible in the range
150 to 300 mmHg.
• Verify that both pressure values in the prompt field match the manometer reading. If not,
adjust by turning the ComWheel. When the values of the pressure bar and the manometer
are equal, press the ComWheel to confirm the calibration. The message ‘Calibrating’ will
appear onto the NIBP digit field. After a few seconds it is followed by ‘Calibrated’, which
means that the calibration has succeeded, and the new calibration data has been saved
into EEPROM.
Document No. 800 1008-2
41
Page 48

Datex-Ohmeda S/5 monitors
− To set the protection on:
Turn the toggle switch to the right. Select Protection ON and push the ComWheel.
Then turn the toggle switch back to the left.
• Remove the module from the frame and plug it back again. Then perform Calibration check
(see the preceding page) to verify the new calibration.
3.4.3 Temperature calibration
NOTE: For the temperature calibration, separate, accurate test plugs (25 °C and 45 °C) are
needed. A test set of two plugs is available from Datex-Ohmeda, order code 884515.
Calibrate temperature when measured test values deviate more than ±0.1 °C, and always after
STP board replacement.
1. Enter ESTPR: STP service menu.
2. Enter Calibrations menu.
3. Press the protect button at the bottom of the module and choose OFF in protect mode.
Release the button.
4. Select Calibrate T1/Calibrate T2.
5. Insert calibration plug (25 °C) into T1/T2 connector.
6. Press the ComWheel.
7. Insert calibration plug (45 °C) into T1/T2 connector.
8. Press the ComWheel.
9. Press in the protect button at the bottom of the module and choose ON in protect mode.
Release the button.
3.4.4 Invasive pressure calibration
Calibrate invasive pressure when the pressure transducer (probe) is replaced with a different type
of transducer, and when STP board is replaced.
1. Enter ESTPR: the STP service menu.
Monitor Setup, Install/Service (password 16-4-34), Service (password 26-23-8),
(
Parameters).
2. Enter Calibrations menu.
3. Connect a pressure transducer with a pressure manometer to the P1/P2 connector. Choose
Calibrate P1 or Calibrate P2. Leave the transducer to room air pressure.
4. Press the ComWheel to start zeroing.
42
Document No. 800 1008-2
5. Supply a pressure of 100 mmHg to 300 mmHg to the transducer. The recommended
pressure is 200 mmHg.
6. Set the pressure on the display to match the pressure reading on the manometer and press
the ComWheel. A tolerance of ±1 mmHg is allowed.
7. The message ‘Calibrated’ will appear on the display.
Page 49

S/5 Hemodynamic modules
4 TROUBLESHOOTING
4.1 Troubleshooting charts
See also the User’s Reference Manual for more troubleshooting procedures.
4.1.1 NIBP
TROUBLE CAUSE TREATMENT
No NIBP value displayed NIBP not selected on screen. Check monitor setup.
NIBP menu fading No M-NE(12)STPR module, module
not properly connected, or NIBP and
NE(12)STPR module connected at
the same time.
Artifacts-message Unsuccessful measurement due to
patient movements or shivering.
Weak pulsation-message Weak or unstable oscillation pulses
due to:
• artifacts (accurate diastolic
pressure difficult to measure)
• marked arrhythmia
• marked drop in diastolic
pressure
• diastolic pressure difficult to
measure
• improper cuff position or
attachment
• too few pulses detected
Plug in the module.
Check patient condition and retry.
Check any leaks and retry.
Use proper size of cuff. Check
attachment.
Call service
Error X-message
• weak or unusual blood
circulation
• may give systolic value
NIBP hardware error.
X = error number.
See the description of the error message
code in 4.1.2, the causes and the
solutions listed in the next chapter.
43
Document No. 800 1008-2
Page 50

Datex-Ohmeda S/5 monitors
TROUBLE CAUSE TREATMENT
Cuff loose-message 1. Hose and/or cuff not connected. 1. Connect the hose and the cuff.
2. Hose and cuff connected.
2.
Reasons:
− cuff loosely wrapped − tighten the cuff
− leakage in cuff or hose − replace cuff/hose
− leakage inside module − check internal tubing and air
chamber, and fix if necessary
− pump does not work − check pump connector; if OK, replace
pump
− no pulses during the last three
− check cuff positioning
measurements
Air leakage-message 1. Hose or cuff leaking. Reasons: 1. Replace cuff
− cuff damaged − replace cuff
− cuff connector damaged − replace cuff connector (if the fault is
in hose connector,)
− O-ring damaged or missing − replace O-ring
− hose double connector
− replace hose
damaged
Unable to measure Sysmessage
2. Hose and cuff OK. Reasons: 2. Connect or replace tube
− leakage inside the module − replace the whole tubing
− tube disconnected or damaged − fix connections
− air chamber leaking −
− tubes or valve(s) damaged − replace tubes/valve(s)
Systolic blood pressure probably
higher than the maximum inflation
Automatic retrial with increased
pressure.
pressure.
44
Document No. 800 1008-2
Page 51

TROUBLE CAUSE TREATMENT
S/5 Hemodynamic modules
Cuff occlusion-message 1. Cuff and/or hose occluded.
Reason:
− cuff tube kinked − straighten tube
− tube inside module kinked − straighten tube
− occlusion inside/outside
module
2. Cuff, hose, and tubes OK.
Reason:
− fault in pressure transducer − replace the NIBP board
− fault in A/D converter − replace the NIBP board
− faulty calibration − check calibration
− missing voltages − recalibrate
Calibration switch on message
EEPROM protection switch at the
bottom of the module is turned to
right.
Calibration not protected message.
Calibration protection is set to
OFF.
1.
− remove occlusion
2.
Enables setting the protection OFF in the
Calibration menu. Turn switch to left if you
are not going to calibrate.
Set the protection ON in the NIBP
Calibration menu.
45
Document No. 800 1008-2
Page 52

Datex-Ohmeda S/5 monitors
4.1.2 NIBP error code explanation
Code Explanation Treatment
0 RAM failure; memory failure Change NIBP board.
1 ROM checksum error; memory failure Change NIBP board.
2 +15 V failure Check short circuits. Change NIBP
3 -15 V failure Check short circuits. Change NIBP
board.
board.
4 EEPROM protection switch error (only
with S-STD93)
5 Calibration not protected. (only with S-
STD93)
6 ADC error ADC circuit failure. Change NIBP board.
7 Watchdog time too short Change NIBP board.
8 Watchdog time too long Change NIBP board.
9 Watchdog activated Change NIBP board.
10 EEPROM checksum error; memory failure Change NIBP board.
11 Auto zero range exceeded Calibrate NIBP.
12 Communication break; temporal break
down of communication from monitor
detected
13 - -
14 Too early Auto Start (needs 25 seconds
without pressure)
Turn the toggle switch to the left at the
bottom of the module.
Protect calibration by selecting
Protection ON in the NIBP calibration
menu.
Automatic recovery
46
Document No. 800 1008-2
Page 53

4.1.3 ECG
TROUBLE CAUSE TREATMENT
S/5 Hemodynamic modules
HR numerical display
shows ‘---’
Unacceptable ECG waveform Poor electrode or poor electrode
No ECG trace Waveform not selected on screen.
No heart rate available. If no ECG waveform, check LEADS OFF
skin contact.
Poor electrode condition. Electrodes are dried out.
Improper site of electrodes. Check that electrodes are not placed
Improper skin preparation. Remove body hair. Clean attachment
Improper bandwidth filter. Check filter.
message and connect the leads.
If ECG waveform exists, check heart
rate source e.g. in the ECG Setup
menu behind ECG key.
Electrodes from different
manufacturers are used. /Too
much/little gel is used.
over bones, active muscles, or layers
of fat.
site carefully with alcohol.
Press the
make adjustments.
Monitor Setup key and
Module not plugged in correctly. Plug in.
Noise-message High frequency or 50/60 Hz noise. Isolate noise source.
4.1.4 Pulse oximetry (SpO2)
TROUBLE CAUSE TREATMENT
Message ‘NO PROBE’ No probe connected to the
monitor.
Probe faulty. Change the probe.
Message ‘PROBE OFF’ though
probe properly attached to the
patient
Finger probe falls off 1. Probe is slippery. 1. Wipe with 70 % isopropyl alcohol
Unsuitable site. Try another site.
Probe faulty. Try another probe.
Probe connection cable not
connected to probe.
Check probe connections.
Connect the cable to probe.
and allow to dry.
47
Document No. 800 1008-2
Page 54

Datex-Ohmeda S/5 monitors
TROUBLE CAUSE TREATMENT
2. Finger is too thin or thick. 2. Try other fingers, or other probe
types.
Weak signal artifacts Poor perfusion. Try another place.
Movement artifacts.
Shivering.
Message ‘NO PULSE’ Pulse search > 20 sec. and low
or low pulse rate.
SpO
2
Message ‘ARTIFACT’ Pulse modulation exceeds the
Try other fingers.
Try another place or another probe.
present scale.
Message ‘CHECK PROBE’ DC value not in balance. Try another probe.
Message ‘POOR SIGNAL’ Modulation (Red or Ired) < 0.25 % Patient may be cold.
Message ‘FAULTY PROBE’ Probe is faulty. Change the probe.
No SpO
2
No waveform selected on screen. Check selected SpO2 waveforms by
pressing
Monitor Setup key and
selecting Modify waveforms.
Wrong configuration setting. Check the configuration settings from
the ESTPR:STP/Calibrations menu
Monitor Setup - Install/Service -
(
Service - Parameters)
4.1.5 Temperature
TROUBLE CAUSE TREATMENT
Message ‘TEMPERATURE ERROR’ Faulty calibration. Perform calibration. If it does not
help, check that front panel
connector is properly connected to
STP board.
No temperature displayed Wrong type of probe. Use correct probe.
Temperature out of measurable
The range is between 10 and 45 °C.
range.
Temperature calibration not
protected.
Set the protection ON in the Service
Menu.
48
Document No. 800 1008-2
Page 55

S/5 Hemodynamic modules
4.1.6 Invasive blood pressure
TROUBLE CAUSE TREATMENT
Abnormally low pressure Transducer wrongly positioned. Check mid-heart level and reposition
transducer.
No pressure Defective transducer. Check transducer.
No pressure module plugged in. Check the module.
No waveform selected on screen. Check selected pressure waveforms
by pressing Monitor Setup key and
selecting modify waveforms.
Check that pressure transducer is
open to patient.
Wrong configuration setting Check the configuration setting from
the ESTP:STP/Calibrations menu
Monitor Setup - Install/Service -
(
Service - Parameters)
Not zeroed -message Measurement on, channel not
zeroed.
Zeroing failed -message Unsuccessful zeroing of P1 /P2
(number field).
Calibration failed -message Unsuccessful calibrating of
P1/P2 (number field), possibly
due to pulsating waveform
Out of range < 40 mmHg Measurement pressure is beyond
measurement range.
Out of range > 320 mmHg Measurement pressure is beyond
measurement range.
Zero the channel.
Possibly due to pulsating pressure
waveform. Open the transducer to air
and zero the channel.
Offset is > 150 mmHg. Open the
transducer to air and zero the
channel.
Defective transducer. Replace it and
zero the channel.
Turn the transducer to
sphygmomanometer and try again
(zeroing takes place first).
Gain is beyond the limits (± 20 % of
the default gain). Replace the
transducer.
Check transducer level. Zero the
channel.
Check transducer level. Zero the
channel. The patient may also have
high pressure.
Zero adj. > 100 mmHg Offset when zeroing is > 100
mmHg (but < 150 mmHg) from
the absolute zero of the module
(with default gain).
Check transducer. The waveform may
hit the top and the numeric display
not shown.
49
Document No. 800 1008-2
Page 56

Datex-Ohmeda S/5 monitors
TROUBLE CAUSE TREATMENT
Out of range Measured pressure is beyond the
internal measurement range of
the module.
The waveform hits the top and the
numeric display not shown. Check
transducer and its level. Zero the
channel.
4.1.7 Impedance respiration
TROUBLE CAUSE TREATMENT
No resp trace Waveform not selected on the
screen
Module not plugged in correctly Plug in
Unacceptable resp waveform Poor electrode or poor electrode
skin contact
Poor electrode condition Electrodes are dried out.
Improper site of electrodes Check that electrodes are not placed
Press the Monitor Setup key and
make adjustments
Electrodes from different
manufacturers are used. Too
much/little gel is used.
over bones, active muscles, or layers
of fat.
Improper skin preparation Remove body hair. Clean
attachment site carefully with
alcohol.
Message: ‘SMALL RESP CURVE’ Respiration signal is very small With 3-lead cable in ESTPR/NESTPR
try another lead connection I, II, III or
try 5-lead cable.
Message: ‘APNEA ALARM’, and
respiration waveform normal
Respiration source is CO
2
Check respiration source and
change it to correct one.
50
Document No. 800 1008-2
Page 57

4.2 Troubleshooting flowcharts
4.2.1 M-NE12STPR and M-NESTPR module troubleshooting
S/5 Hemodynamic modules
START
Insert NIBP module
and turn power on.
Does fault
still appear?
YES
Module ID
on screen?
YES
Error
message on
screen?
NO
YES
See error code explanation
in Service Manual and
fix it.
NO
NO
Possible fault
in NIBP module.
Remove all
modules from
Monitor Frame.
Fault not in
NIBP module.
NO
Does
another
module work
in same
slot?
Key check
in Service Menu
OK?
YES
YES
NO
Check and
replace
NIBP board.
Check keyboard
connector. If OK,
change front panel.
Replace
NIBP module.
NO
OK?
Check and
replace
NIBP board.
NO
OK?
Do
they work?
NO
Check tubes and
connectors. Find leak and
fix it.
Figure 15 M-NE12STPR and M-NESTPR module troubleshooting flowchart
Pump check
in Service Menu
OK?
YES
Leak test
in Service Menu
OK?
NO
NO
YES
Check pump
connector. If OK,
change pump.
51
Document No. 800 1008-2
Page 58

Datex-Ohmeda S/5 monitors
4.2.2 M-ESTPR, M-ESTR, and M-ETPR module troubleshooting
Possibly faulty
ESTPR module
Check module c onfiguration in
Service menu (ESTPR/STP/Calibrations)
Is it
correct?
YES
Remove all
modules from
the frame
Insert ESTPR module
and t urn pow er on
Does fault
still appear?
YES
Enter the
Service menu
STP
module ID
on screen?
YES
NO
NO
NO
Select the correct
configuration
Fault not in
ESTPR module
NO
Does
another
module work
in same
slot?
YES
Remove
ECG boa rd
Replace
STP board
NO
STP
module ID
on screen?
YES
ECG
module ID
on screen?
Check front panel
key functions in
Service menu
Check front panel unit,
ECG board, and STP board
to find culprit. Replace if
necessary.
YES
Do
they work?
NO
YES
Figure 16 M-ESTPR Module Troubleshooting Flowchart
52
Document No. 800 1008-2
NO
Has ECG
measurement
failed?
YES
Replace
ECG board
NO
board failed?
Has STP
YES
Replace
STP board
NO
Replace
ECG board
Has inv BP
measur ement
failed?
YES
Replace
STP board
NO
Has Temp
measurement
failed?
YES
Replace
STP board
NO
measurement
Has SpO2
failed?
YES
Replace
STP board
Page 59

5 SERVICE MENU
S/5 Hemodynamic modules
1. Press the Monitor Setup key.
2. Select Install/Service (password 16-4-34).
3. Select Service (password 26-23-8).
4. Select Parameters - NIBP.
NOTE: Parameter values in Service Data fields are for reference only on this chapter.
53
Document No. 800 1008-2
Page 60

Datex-Ohmeda S/5 monitors
5.1 NIBP service menu
Service Data
Pressure shows measured pressure multiplied by 10.
Zero shows pressure at auto zeroing multiplied by 10 and changes between +20 and -20 mmHg.
Absolute pressure is the sum of Pressure and Zero.
Protect handle indicates hardware protection for EEPROM memory. It should be ON all the time in
normal operation. If it is OFF data can not be read from or written to EEPROM, only the calibration
protection can be set or reset by software. It can be turned to OFF by turning the toggle switch to the
right at the bottom of the module, which also enables Protection ON/OFF menu selection in the
calibration menu.
Calibr. prot. shows software calibration protection and it should be OFF to enable calibration.
+15 V power indicates the condition of the supply voltage +15 Vdirty for the pump and valves. It
exists (ON) or not (OFF) depending on service menu function. The supply voltage can be turned on
by selecting the previous Menu and then the desired menu again.
AD0 to AD7 show the values of each eight channels of A/D converter.
Timeouts is a cumulative number that indicates how many times the module has not responded to
the monitor’s inquiry. Bad checksums is a cumulative number that indicates how many times
communication from the module to monitor broke down.
Bad c-s by mod is a cumulative number that indicates how many communication errors the
module has detected.
The monitor starts counting these items at power up and resets to zero at power off. The nonzero
values do not indicate a failure, but the continuous counting (more than 50 per second) indicates
either serial communication failure, or module not in place. Also other modules can cause
communication errors that cause these numbers rise.
54
Document No. 800 1008-2
RAM indicates the state of the RAM memory.
ROM indicates whether the checksum in the EPROM is in accordance with the one the software has
calculated.
Page 61

EEPROM indicates if the values stored in the permanent memory are valid.
The state is either OK, Fail or ? (module not in place or a communication error).
5.1.1 NIBP demo menu
S/5 Hemodynamic modules
A service menu for demonstrating the oscillometric method of NIBP measurement. The menu
shows the realtime pressure signals that are measured from the NIBP cuff. The measurement result
is shown in the adjoining digit field.
Wave Recording Wave Recording is for selecting the recording option. If ON is selected, the pressure signals are
recorded in realtime onto the M-REC paper.
Remove menu Remove menu widens the displayed waveform area.
Previous Menu The menu can be closed by selecting the Previous Menu or just by pressing the ComWheel if the
Remove menu was selected.
55
Document No. 800 1008-2
Page 62

Datex-Ohmeda S/5 monitors
5.1.2 NIBP calibration menu
Active Leak Test Wrap an adult cuff around a pipe and connect the cuff to the module. Select the active leak test
(ON). The module automatically pumps a pressure of 260 mmHg into the cuff. Wait for several
seconds until the pressure stabilizes. Then check that the pressure reading does not drop more
than 5 mmHg per minute. If it does, leaking point(s) should be detected and fixed. Cancel the test
by selecting Active leak test OFF.
Calibration Check
After the calibration check is selected (ON), manually pump pressure into the module and make
sure that the same pressure values are shown both on the display and on manometer. Pressure of
both pressure channels B1 and B2 are shown. Note that if the display shows +2 mmHg at zero
pressure and if you pumped +200 mmHg into the module, the display should show +202 mmHg.
Protection Software calibration protection (ON/OFF). Select OFF when calibrating. Protection can be set to ON
or OFF only when the toggle switch at the bottom of the module is set to the right.
Calibration Calibration selection is available only when protection is OFF.
NIBP calibration can be performed in the NIBP Service menu as follows:
NOTE: Both channels B1 and B2 must be calibrated simultaneously.
1. If Protection is ON change it to OFF by first turning the toggle switch to the right at the
bottom of the module, which enables the Protection selection. Then turn the toggle switch
to the left to enable Calibration.
NOTE : Do not disconnect the module from the frame when turning the switch. The module must be
in the frame during the whole procedure.
56
Document No. 800 1008-2
NOTE: When the switch is at the right, the NIBP field shows an error message ‘Calibration switch
on!’.
NOTE: When calibration is enabled, a message ‘Calibration not protected’ appears.
2. For proper zeroing to take place, remove the hose from the front panel connector. Select
Calibration and push the ComWheel. Messages ‘Zeroing’ and ‘Zeroed’ will appear in the
NIBP message field. After this a pressure bar will appear beside the menu.
Page 63

3. Connect an external mercury manometer with pump to module through the both tubes of the
hose. Pump up to about 200 mmHg pressure (range of 150 to 300 mmHg allowed) according
to the manometer. Verify that both pressure values in the prompt field match the manometer
reading. If not, adjust by turning the ComWheel.
4. When the values are equal, push the ComWheel to confirm the calibration. First the message
‘Calibrating’ will appear in the digit fields for NIBP followed after a few seconds ‘Calibrated’,
which means that the calibration data has now been saved.
5. Use the bottom switch to enable Protection setting and set it ON, and finally disable
Protection setting.
5.1.3 NIBP safety valve menu
S/5 Hemodynamic modules
Start Test Start test is for starting and Stop test is for stopping the Safety Valve test.
Safety Valve Data
See NIBP Service menu in chapter 5.1 for information on general items Pressure, Zero, Protect
handle, Calibr. prot., +15 V power, AD0 to AD7 as well as Timeouts etc.
Max. press and 2 s after stop show the measured values at Safety Valve test.
Safety Valve Test Adult/Infant
Wrap an adult cuff around a pipe and connect the cuff to the module. Highlight Start test and give
the ComWheel a push. The test ends automatically or when Stop test (appears in place of Start
test) is pushed.
Max. press indicates the pressure at which the safety valve opens and is normally 310 ±15 mmHg
for adult and 150 mmHg ±15 mmHg for infant. 2 s after stop indicates the pressure at 2 seconds
after the pump has stopped and is normally > 280 mmHg for adult and > 120 mmHg for infant. If
the value is less, check leakage by the active leak test.
57
Document No. 800 1008-2
Page 64

Datex-Ohmeda S/5 monitors
5.1.4 NIBP pulse valve menu
Start Test Start test is for starting and Stop test is for stopping the test.
Set Valve Set Valve lets you adjust the opening of the pulse valve.
Pulse Valve Data
See NIBP Service menu in chapter 5.1 for information on general items Pressure, Zero, Protect
handle, Calibr. prot., +15 V power, AD0 to AD7 as well as Timeouts etc.
Pulse Valve Checking
Wrap an adult cuff around a pipe and connect the cuff to the module. Select the Start test and
push the ComWheel. The pressure rises beyond 240 mmHg and stops. The pulse valve opens. The
module counts the time it takes for the pressure to go down from 240 mmHg to 50 mmHg and
displays it on the screen. The test can be manually stopped by selecting Stop test.
The valve can be adjusted between 0 and 255 (0 for fully closed and 255 for fully open). First
select Set Valve and push the ComWheel. See the pulse valve value and adjust it by turning the
ComWheel. Then push the ComWheel to confirm the value.
The ‘Interval 240 mmHg -> 50 mmHg’ time should be less than 60 seconds when the valve is
‘150’ and less than 10 when fully opened (255). When fully closed (0), the system should be
airtight and the pressure does not drop. Depending on an individual, the pulse valve may remain
closed up to approx. value 100.
58
Document No. 800 1008-2
If the measured time deviates much from those above, then the pulse valve or its tubes are faulty.
Page 65

5.1.5 NIBP buttons/leds menu
S/5 Hemodynamic modules
The selections Auto ON/OFF, Manual ON/OFF, STAT ON/OFF, and Measur. ON/OFF have no
effect on the module.
Buttons/Leds Data
See NIBP Service menu in chapter 5.1 for information on general items Pressure, Zero, Protect
handle, Calibr. prot., +15 V power, AD0 to AD7 as well as Timeouts etc.
Buttons Checking
The front panel keys function is confirmed by pressing the key and observing OFF turns to ON at
Auto On/Off, and Start Cancel.
59
Document No. 800 1008-2
Page 66

Datex-Ohmeda S/5 monitors
5.1.6 NIBP pneumatics menu
Start Pump/Stop Pump
A manual control for the pump. The selection changes to Stop Pump when the pump turns on.
Open Exh1/Close Exh1
A manual control for the exhaust valve 1. The selection changes to Close Exh1 when the valve is
opened.
Open Exh2/Close Exh2
A manual control for the exhaust valve 2. The selection changes to Close Exh2 when the valve is
opened.
Set Valve With Set Valve, the opening of the pulse valve is adjusted between 0 and 255 (0 for fully closed
and 255 for fully open). First push the ComWheel, then turn it to adjust the value on screen and
finally push to set the value.
Reset Clock Reset Clock will zero the time on the display.
Pneumatics Data field
See NIBP service menu in chapter 5.1 for information on general items Pressure, Zero, Protect
handle, Calibr. prot., +15 V power, AD0 to AD7 as well as Timeouts etc.
Pump, Exh1 Valve, and Exh2 Valve show their states.
Pulse Valve shows how much the valve is opened (0 to 255) during Valve Setting.
60
Document No. 800 1008-2
Interval 20 mmHg -> 185 mmHg Checking
Select the Start pump at different combinations of the valves open/closed and push the
ComWheel. The module counts the time it takes for the pressure to go up from 20 mmHg to 185
mmHg and displays it. When all the valves are closed, the pump should be able to pump the
pressure in about 1 to 4 seconds into an adult cuff wrapped around a pipe. The pump does not
stop without selecting the Stop Pump by pushing the ComWheel.
Watchdog BEEP
Connect manometer to the front panel and pump pressure into the module. When the AD5 value
Page 67

changes from negative to positive value (at about 5 mmHg) a beep is heard. This is the watchdog
threshold pressure. Beyond this pressure the watchdog is active and cut pressures at about 2 min.
(adult).
5.1.7 NIBP watchdog menu
S/5 Hemodynamic modules
Test ADULT Test ADULT is to test watchdog timer in adult mode (120 to 140 seconds).
Test INFANT Test INFANT is to test watchdog timer in infant mode (about 60 to 70 seconds).
Stop Test Stop Test is for stopping the test.
Watchdog Data field
See NIBP Service menu in chapter 5.1 for information on general items Pressure, Zero, Protect
handle, Calibr. prot., +15 V power, AD0 to AD7 as well as Timeouts etc.
Watchdog Interval shows the time the +15 Vdirty stays on during the test.
Adult watchdog time testing
Select Test ADULT and push the ComWheel. Watchdog interval starts counting up seconds and
keeps on counting as long as the +15 Vdirty is on. The time should be 120 to 140 seconds.
Infant watchdog time testing
Select Test INFANT and push the ComWheel. Watchdog interval starts counting up seconds and
keeps on counting as long as the +15 Vdirty is on. The time should be 60 to 70 seconds.
61
Document No. 800 1008-2
Page 68

Datex-Ohmeda S/5 monitors
5.2 ECG service menu
Power freq Set power frequency; 50 Hz/60 Hz.
Filter low Set filter low frequency; 0.05 Hz/0.5 Hz.
Filter high Set filter high frequency; 30 Hz (40 Hz if power freq is 60 Hz) /100 Hz or 150 Hz @ NE12STPR.
Service Data field
Power freq, and Cable type show the values chosen or detected, Filter low and high defines the
selected filter (Monitor/Diagnostic/ST).
Quick zero @ NESTPR and ESTPR modules is ON when the signal in any of the three internal
amplifier goes beyond scale, and therefore, a capacitor connected to the related channel
discharges overvoltage. At least one of Quick zero values is OFF when 3-lead cable is used. All
three values are OFF when 5-lead cable is used. Quick zero also takes place when lead is changed
in 3-lead measurement. @ NE12STPR Quick zero is on if any of the ECG amplifiers goes beyond
the scale.
Cable shows ON when an ECG cable is connected.
Electrode shows ON when each of these electrodes are connected.
Pacer count is a running number for pacemaker users.
The front panel ECG key function is confirmed by pressing the key and observing OFF turns to ON at
Button.
62
Document No. 800 1008-2
NOTE: M-NE12STPR and M-NESTPR Module does not consist ECG key.
Resp Available indicates that ECG hardware is capable of measuring impedance respiration.
Measurement shows ON when the respiration measurement is on.
Amp zero shows ON when zeroing of the respiration amplifier takes place.
Waveform VALUE will be updated in one second interval.
Page 69

S/5 Hemodynamic modules
Timeouts is a cumulative number that indicates how many times the module has not responded to
the monitor’s inquiry. Bad checksums is a cumulative number that indicates how many times
communication from the module to monitor broke down.
Bad c-s by mod is a cumulative number that indicates how many communication errors the
module has detected.
The monitor starts counting these items at power up and resets to zero at power off. The nonzero
values do not indicate a failure, but the continuous counting (more than 50 per second) indicates
either serial communication failure, or module not in place. Also other modules can cause
communication errors that cause these numbers rise.
RAM indicates the state of the RAM memory.
ROM indicates whether the checksum at the EPROM is in accordance with the one the software
has calculated.
EEPROM indicates if the values stored in the permanent memory are valid.
The state is either OK, Fail or ? (module not in place or a communication error).
63
Document No. 800 1008-2
Page 70

Datex-Ohmeda S/5 monitors
5.2.1 ECG setup menu
Filter Filters the ECG signal high frequency noise and slow respiratory artefacts.
Monit (monitor) filter is used in routine monitoring. It effectively filters the artefacts caused by the
electrosurgery unit and respiration.
Diagn (diagnostic) filter is used if more accurate information of the waveform is needed (e.g., of P-
wave or AV block). The diagnostic filter is more susceptible to both high frequencies and baseline
wander than monitor filter.
STfilt (ST filter) permits more accurate information of ST segment. It filters the high frequency
artefacts caused by electrosurgery unit but catches the slow changes in ST segment. The ST filter is
more susceptible to baseline wander than the monitor filter.
Pacemaker Selects how to display the pacing pulse of cardiac pacemaker. The selections are Show, Hide, ON
R and Sensit.
Hide, the pacing pulse is filtered away from ECG data.
Show, the pacer pulse is filtered away from ECG data but the pulse is displayed as a constant
height marker.
ON R, pacing pulses are not filtered away from ECG data. This improves ECG monitoring with A-V
pacemaker patients, as QRS complexes are counted even if the pacing pulse hits the QRS
complex. However, during asystole the monitor may count pacing pulses as heart beats.
Sensit selection uses a more sensitive pacemaker detection. Pacemaker spike is displayed on
ECG.
64
Document No. 800 1008-2
Page 71

S/5 Hemodynamic modules
5.3 STP service menu
Record Data Record Data prints out the shown service data and board information (id, serial number and sw id)
onto the recorder module, M-REC.
Temp Test Temp Test activates the automatic temperature test for the temperature channels T1 and T2. The
result from the test is shown in the service data field.
NOTE: The Temp Test needs to be selected twice before the test starts.
Service Data field
Gain is a coefficient to compensate gain error. Usually the values for P1 and P2 are between
17000 and 25000 and for T1 and T2 between 13000 and 14300. Zero indicates offset
compensation value of each parameter in A/D converter. Typically the values for P1 and P2 are
within ±1000 and for T1 and T2 between -150 and +300. Calibrate if zero and/or gain value is
outside the ranges.
Cable shows ON when a corresponding cable is connected to the front panel and Probe shows ON
when a corresponding probe is connected to the cable.
Under Value the measured numeric values are displayed simultaneously. Pressure values are real
time values and shown in mmHg. Temperature values are shown in degrees Celsius.
The front panel STP keys functions are confirmed by pressing each key and observing OFF turns to
ON at Button.
shows measured beat-to-beat SpO2 value. Modpr is a modulation % that indicates AC/DC
SpO
2
ratio in the measured signal. Hr is a pulse rate calculated from every beat.
Cable and Probe can be either OFF or ON, and these indicate the state PROBE OFF.
Under them there is a message field for SpO
. It can be OK, PULSE SEARCH, NO PROBE, PROBE
2
OFF, NO PULSE, ARTEFACT, POOR SIGNAL, or CHECK PROBE.
Balance between leds is adjusted by changing the intensity of red/infrared. Intensity of infrared
(Ired int.) is in the range of 40...255 and red intensity (red int.)is in the range of 40...255.
Document No. 800 1008-2
65
Page 72

Datex-Ohmeda S/5 monitors
DC gain shows the gain of DC signal adjusted by the module.
IDC is the value of infrared signal.
RDC is the dc value of red signal.
AC gain is the gain of infrared and red ac signals. AC gain values can be 1 or 0. Value 1 means high
ac gain and 0 means low gain.
Pre gain is a preamplifier gain for infrared and red signals. Pre gain values can be 1 or 0. Value 1
means normal operation. Value 0 means that signal levels are very low and extra gain is taken into
use.
Temp error shows the status of the temperature test. No errors found shows the status (OFF) and
errors found (ON).
Protect key shows normally OFF but turns to ON when the button at the bottom of the module is
pressed.
Protect mode is normally ON. It turns to OFF when Protect is switched to OFF for the temperature
calibration in Calibration Menu.
Configuration shows the chosen module configuration: TP, ST, or STP.
Timeouts is a cumulative number that indicates how many times the module has not responded to
the monitor’s inquiry. Bad checksums is a cumulative number that indicates how many times
communication from the module to monitor broke down.
Bad c-s by mod is a cumulative number that indicates how many communication errors the
module has detected.
The monitor starts counting these items at power up and resets to zero at power off. The nonzero
values do not indicate a failure, but the continuous counting (more than 50 per second) indicates
either serial communication failure, or module not in place. Also other modules can cause
communication errors that cause these numbers rise.
RAM indicates the state of the RAM memory.
ROM indicates whether the checksum at the EPROM is in accordance with the one the software
has calculated.
EEPROM indicates if the values stored in the permanent memory are valid.
The state is either OK, Fail or ? (module not in place or a communication error).
66
Document No. 800 1008-2
Page 73

S/5 Hemodynamic modules
5.3.1 STP calibration menu
Protection Protection for the configuration and temperature calibrations can be set ON and OFF only when
protect button at the bottom of the module is pressed.
Set Config The module configuration should be set according to the module type. The setting is possible only
when the protection is set OFF. The available selections are TP, ST or STP. The configuration setting
should be checked if the STP board is replaced.
Calibrate T1 / Calibrate T2
The functions are for calibrating the temperature channels T1 and T2. The calibrations are possible
only when the protection is set OFF. The temperature calibration requires accurate test plugs of
value 25 °C and 45 °C.
Calibration:
1. Select Calibrate T1/Calibrate T2
2. Insert the test plug 25 °C into the T1/T2 connector
3. Press the ComWheel
4. Insert the test plug 45 °C into the T1/T2 connector
5. Press the ComWheel
Calibrate P1/Calibrate P2
The functions are for calibrating the invasive blood pressure channels P1 and P2. The calibrations
require a pressure transducer (with an appropriate cable) and a pressure manometer.
1. Connect the pressure transducer with the pressure manometer to the P1/P2 connector.
Select Calibrate P1/Calibrate P2. Leave the transducer to room air pressure.
2. Press the ComWheel to start zeroing.
3. Supply a pressure of 100 mmHg to 300 mmHg to the transducer. The recommended
pressure is 200 mmHg.
4. Set the pressure on the display to match the pressure reading on the manometer and press
the ComWheel.
67
Document No. 800 1008-2
Page 74

Datex-Ohmeda S/5 monitors
6 SPARE PARTS
6.1 Spare parts list
NOTE: Only changed part numbers are listed under later revisions. To find the desired part: check
first the list of the revision that corresponds your device. If the part is not listed there, check the
previous revision, etc. until you find the right number.
* stands for recommendation for stock.
6.1.1 M-ESTP rev. 01, M-ETP rev. 00, M-EST rev. 00
6 14 8
4
1
3
2
5
11
13 7
17
16
Item Item description Order no.
- Membrane keypad 879374
1 Module box (wide) 886168
2 Spring pin 879182
3Latch 879181
4 Cross recess screw M3x8 black 616215
5 Front panel unit, M-ESTP (rev. 01) 880337
5 Front panel unit, M-ETP (rev. 00) 880941
5 Front panel unit, M-EST (rev. 00) 880946
6 STP board, M-ESTP (rev. 01), M-P (rev. 00-01) *880339
7 ECG board, M-ESTP (rev. 01) *880338
11 Metal frame 879184
13 Cross cylinder-head screw M3x6 61721
14 Cross cylinder-head screw M3x12 628700
15 10
68
Document No. 800 1008-2
Page 75

S/5 Hemodynamic modules
6.1.2 M-ESTP rev. 02, M-ETP rev. 01, M-EST rev. 01
Item Item description Order no.
6 STP board, M-ESTP (rev. 02) *(882130) Use 882627, 1) 884342
7 ECG board, M-ESTP (rev. 02) *(882025) Use 888957, 2) 883806
8 Front panel unit, M-ESTP (rev. 02-03) 882127
8 Front panel unit, M-ETP (rev. 01-02) 882128
8 Front panel unit, M-EST (rev. 01-02) 882129
15 T-input board, M-ESTP (rev. 02-03) *882090
6.1.3 M-ESTP rev. 03, M-ETP rev. 02, M-EST rev. 02
Item Item description Order no.
- EMC plate 884099
6 STP board, M-ESTP (rev. 03-05), M-P (rev. 02) *882627
7 ECG board, M-ESTP (rev. 03) *(883119) Use 888957, 2) 883806
6.1.4 M-ESTP rev. 04, M-ETP rev. 03, M-EST rev. 03
Item Item description Order no.
- ECG software *883806
D4 STP software *884342
7 ECG board, M-ESTP (rev. 04) *(886748) Use 888957
8 Front panel unit, M-ESTP (rev. 04-05) 887153
8 Front panel unit, M-ETP (rev. 03-04) 887154
8 Front panel unit, M-EST (rev. 03-04) 887155
15 T-input connectors, M-ESTP (rev. 04-05) *887152
16 EMC cover 884099
6.1.5 M-ESTP rev. 05, M-ETP rev. 04, M-EST rev. 04
Item Item description Order no.
7 ECG board, M-ESTP (rev. 05) *888957
A front panel unit includes all the connectors and input boards.
1)
NOTE: The STP board 882627 can be used as a replacement only with STP software 884342.
2)
NOTE: The ECG board 888957 can be used as a replacement only with ECG software 883806.
69
Document No. 800 1008-2
Page 76

Datex-Ohmeda S/5 monitors
6.1.6 M-ESTPR rev. 01, M-ETPR rev. 01, M-ESTR rev. 01
Item Item description Order no.
- Membrane keypad 879374
1 Module box (wide) 886168
2 Spring pin 879182
3Latch 879181
5 Cross recess screw M3x8 black 616215
6 STP board, M-ESTP (rev. 03-05), M-P (rev. 02) *882627
7 ECG/RESP board, M-ESTPR (rev. 01) *(884609) Use 888956
8 Front panel unit, M-ESTPR (rev. 01-02) 887153
8 Front panel unit, M-ETPR (rev. 01-02) 887154
8 Front panel unit, M-ESTR (rev. 01-02) 887155
11 Metal frame 879183
13 Cross cylinder-head screw M3x6 61721
14 Cross cylinder-head screw M3x12 628700
15 T-input connectors, M-ESTP (rev. 04-05) *887152
16 EMC cover 884099
17 EMC cover 886818
6.1.7 M-ESTPR rev. 02, M-ETPR rev. 02, M-ESTR rev. 02
Item Item description Order no.
7 ECG/RESP board, M-ESTPR (rev. 02) *888956
A front panel unit includes all the connectors and input boards.
6.1.8 M-ESTPR rev. 03, M-ETPR rev. 03, M-ESTR rev. 03
Item Item description Order no.
6 STP board *(891442) use 8002575
8 Front panel unit, M-ESTPR 894161
8 Front panel unit, M-ESTR 894162
8 Front panel unit, M-ETPR 894163
ECG board *889988
ECG input board *889985
NOTE: The STP board 891442 can be used as a replacement only with STP software 891401.
6.1.9 M-ESTPR rev. 04, M-ETPR rev. 04, M-ESTR rev. 04
Item Item description Order no.
6 STP board 8002575
NOTE: The STP board 8002575 includes the STP software 8000717.
70
Document No. 800 1008-2
Page 77

6.1.10 M-NESTPR rev. 00, M-NETPR rev. 00, M-NESTR rev. 00
S/5 Hemodynamic modules
Item Item description Order no. Item Item description Order no.
1 Module box (wide) 886168 17 T input connectors *887152
2 Spring pin 879182 18 ECG input board, M-NESTPR (rev. 00) 889985
3 Latch 879181 19 SP input board, M-NESTPR (rev. 00) 890006
4 ECG/RESP board, M-NESTPR (rev. 00) *889988 19 SPO2 input board, M-NESTR (rev. 00) 890833
5 STP board, M-NESTPR (rev. 00) *(890007)
use 8002574
6 EMC cover 884099 20 Fitting plate 879510
7 NIBP board, M-NESTPR (rev. 00) *887520 23 Membrane keypad 888242
8 EMC cover 892305 24 Front panel unit, M-NESTPR
9 NIBP pump, M-NESTPR *889993 25 Metal frame 888230
10 EMC cover 892307 26 Cross recess screw M3x8 black 616215
11 NIBP pump filter *57142 27 Cross cylinder-head screw M3x6 61721
13 Damping chamber, M-NESTPR 888240 28 Cross cylinder-head screw M3x12 628700
14 Bleed valve, M-NESTPR 58566 30 Flat cable, STP 890874
15 Magnetic valve 58562 31 Flat cable, ECG 890876
16 Hose connector 64654 32 Flat cable, PP 891573
19 P input board, M-NETPR (rev. 00) 890834
888273
M-NESTR
M-NETPR
891748
891772
A front panel unit includes all the connectors and input boards.
NOTE: The STP board 890007 can be used as a replacement only with STP software 891401.
71
Document No. 800 1008-2
Page 78

Datex-Ohmeda S/5 monitors
6.1.11 M-NESTPR rev. 01, M-NETPR rev. 01, M-NESTR rev. 01
Item Item description Order no.
5 STP board, M-NESTPR (rev. 01) 8002574
NOTE: The STP board 8002574 includes the STP software 8000717.
6.1.12 M-NE12STPR rev. 00, M-NE12STR rev. 00, M-NE12TPR rev. 00
Item Item description Order no.
4 ECG board *894284
18 ECG input board *896913
24 Front panel unit, M-NE12STPR 896910
24 Front panel unit, M-NE12STR 896911
24 Front panel unit, M-NE12TPR 896912
33 Screw 61719
6.1.13 M-NE12STPR rev. 01
Item Item description Order no.
5 STP Board 8002574
72
Document No. 800 1008-2
Page 79

6.1.14 Front panel stickers
Front panel stickers that are related to the Compact Module type and adaptation:
Adaptation codes: DA=Danish, DE=German, EN=English, ES=Spanish, FI=Finnish,
FR=French, IT=Italian, JA=Japanese, NL=Dutch, NO=Norwegian, PT=Portuguese,
SV=Swedish
Item no. 10 or 29
S/5 Hemodynamic modules
M-ESTP
Adaptation
(rev. 01)
Order No.
DE 880552 880560 880453
EN 879481 880428 880138
FR 880158 880429 880140
M-ESTP
Adaptation
(rev. 02 -->)
Order No.
DE 881955 881958 881961
EN 881953 881956 881959
ES 884200 885043 885044
FR 881954 881957 881960
IT 886753 886754 886755
NL 886044 886046 886045
SV 885857 885856 885859
M-ESTPR
Adaptation
(rev. 01-03)
Order No.
DA 892207 892209 892208
DE 886966 886967 886968
EN 886603 886604 886605
ES 886943 886944 886945
FI 888868 888869 888870
FR 886963 886965 886964
IT 886925 886926 886927
JA 888303 888305 888304
NL 886937 886938 886939
NO 893554 893555 893556
PT 895249 895251 895250
SV 886928 886929 886930
M-ETP
(rev. 00)
Order No.
M-ETP
(rev. 01 -->)
Order No.
M-ETPR
(rev. 01-03)
Order No.
M-EST
(rev. 00)
Order No.
M-EST
(rev. 01 -->)
Order No.
M-ESTR
(rev. 01-03)
Order No.
73
Document No. 800 1008-2
Page 80

Datex-Ohmeda S/5 monitors
M-NESTPR
Adaptation
(rev. 00)
Order No.
DA 892204 892206 892205
DE 891166 891678 891671
EN 889264 891457 891456
ES 891171 891681 891674
FI 891170 891683 891676
FR 891167 891679 891672
IT 891172 891682 891675
JA 894963 894965 894964
NL 891168 891680 891673
NO 893566 893567 893568
PT 895234 895236 895235
SV 891169 891684 891677
M-NE12STPR
Adaptation
(rev. 00)
Order No.
DA 897718 897622 897655
DE 897709 897613 897646
EN 896985 896986 896987
ES 897712 897616 897649
FI 897715 897619 897652
FR 897710 897614 897647
IT 897713 897617 897650
JA 897719 897623 897656
NL 897711 897615 897648
NO 897717 897621 897654
PT 897714 897618 897651
SV 897716 897620 897653
M-NETPR
(rev. 00)
Order No.
M-NE12STR
(rev. 00)
Order No.
M-NESTR
(rev. 00)
Order No.
M-NE12TPR
(rev. 00)
Order No.
6.1.15 Front panel stickers for S/5 modules
Front panel stickers that are related to the Compact Module type and adaptation:
Adaptation codes: DA=Danish, DE=German, EN=English, ES=Spanish, FI=Finnish,
FR=French, IT=Italian, JA=Japanese, NL=Dutch, NO=Norwegian, PT=Portuguese,
SV=Swedish
S/5 M-ESTPR
Adaptation
DA 898504 898578 898565
DE 898495 898569 898556
EN 898494 898568 898555
ES 898498 898572 898559
FI 898501 898575 898562
74
Document No. 800 1008-2
(rev. 04)
Order No.
S/5 M-ETPR
(rev. 04)
Order No.
S/5 M-ESTR
(rev. 04)
Order No.
Page 81

FR 898496 898570 898557
IT 898499 898573 898560
JA 898505 898579 898566
NL 898497 898571 898558
NO 898503 898577 898564
PT 898500 898574 898561
SV 898502 898576 898563
S/5 Hemodynamic modules
S/5 M-NESTPR
Adaptation
(rev. 01)
Order No.
DA 898429 898492 898458
DE 898420 898483 898449
EN 898419 898482 898448
ES 898423 898486 898452
FI 898426 898489 898455
FR 898421 898484 898450
IT 898424 898487 898453
JA 898430 8000380 898459
NL 898422 898485 898451
NO 898428 898491 898457
PT 898425 898488 898454
SV 898427 898490 898456
S/5 M-NE12STPR
Adaptation
(rev. 01)
Order No.
DA 898442 898470 898481
DE 898433 898461 898472
EN 898432 898460 898471
ES 898436 898464 898475
FI 898439 898467 898478
FR 898434 898462 898473
IT 898437 898465 898476
JA 8000377 8000378 8000379
NL 898435 898463 898474
NO 898441 898469 898480
PT 898438 898466 898477
SV 898440 898468 898479
S/5 M-NETPR
(rev. 01)
Order No.
S/5 M-NE12STR
(rev. 01)
Order No.
S/5 M-NESTR
(rev. 01)
Order No.
S/5 M-NE12TPR
(rev. 01)
Order No.
75
Document No. 800 1008-2
Page 82

Datex-Ohmeda S/5 monitors
7 EARLIER REVISIONS
For service information on the earlier revisions, please refer to:
Module revision Manual Note!
ESTP Module revision 01 Service Manual p/n 880850
ETP Module revision 00 Service Manual p/n 880850
ESTP Module revision 02 Service Manual p/n 882580
ETP and EST Modules revision 01 Service Manual p/n 882580
ESTP Module revision 03-04,
and ETP and EST Modules revision 02-03
NE12STPR Module, M-NE12STPR (rev. 00)
NE12STR Module, M-NE12STR (rev. 00)
NE12TPR Module, M-NE12TPR (rev. 00)
NESTPR Module, M-NESTPR (rev. 00)
NESTR Module, M-NESTR (rev. 00)
NETPR Module, M-NETPR (rev. 00)
ESTPR Module, M-ESTPR (rev. 03)
ESTR Module, M-ESTR (rev. 03)
ETPR Module, M-ETPR (rev. 03)
Technical Reference Manual Slot 896620-1. Main manual is 896 624.
76
Document No. 800 1008-2
Page 83

APPENDIX A, Service check form, S/5 Hemodynamic modules
APPENDIX A
Document No. 800 1008-2
77
Page 84

Datex-Ohmeda S/5 monitors
This page intentionally left blank.
78
Document No. 800 1008-2
Page 85

APPENDIX A, Service check form, S/5 Hemodynamic modules
SERVICE CHECK FORM
DATEX-OHMEDA HEMODYNAMIC MODULES
Customer
Service
Service engineer Date
OK = Test OK N.A. = Test not applicable Fail = Test Failed
All modules
1. Internal parts 2. External parts
3. NIBP pump filter 4. Installation
5. Recognition
Notes
ECG measurement
6. Module software (serial numbers)
ECG/RESP
STP
NIBP
7. Communication and
memories
9. Power frequency 10. Cable recognition
OK N.A. Fail OK N.A. Fail
OK N.A. Fail OK N.A. Fail
8. Membrane key
S/N
11. Lead detection 12. Test with patient
simulator
Notes
A-1(4)
Document No. 800 1008-2
Page 86

Datex-Ohmeda S/5 monitors
RESP measurement
OK N.A. Fail OK N.A. Fail
13. RESP measurement
recognition
14. Test with patient
simulator
Notes
TEMP measurement
OK N.A. Fail OK N.A. Fail
15. Communication and
memories
16. Temperature probe
detection
17. Calibration check 18. Temp test -function
19. Configuration
STP/ST/TP
Notes
InvBP measurement
S/N
S/N
S/N
OK N.A. Fail OK N.A. Fail
20. Membrane keys 21. Cable and transducer
detection
22. Calibration 23. Test with patient
simulator
Notes
SpO2 measurement
OK N.A. Fail OK N.A. Fail
24. SpO2 probe detection 25. Test measurement
Notes
S/N
A 2 (4)
Document No. 8001008-2
Page 87

APPENDIX A, Service Check Form,S/5 Hemodynamic Modules
NIBP measurement
S/N
OK N.A. Fail OK N.A. Fail
26. Communication and
27. Membrane keys
memories
28. Pump and valves
29. Leak test ≤ 5 mmHg/min
30. Calibration check
Measured B1 Measured B2 Allowed range
0 mmHg ± 9 mmHg
100 mmHg 100 + z.o. ± 2 mmHg
200 mmHg 200 + z.o. ± 3 mmHg
260 mmHg 260 + z.o. ± 4 mmHg
z.o. = zero offset at 0 mmHg pressure
31. Watchdog timer activation
5...10 mmHg
pressure
32. Watchdog timer
Adult 120...140 s
Infant 60...70 s
33. Safety valve functions
B1 B2 Allowed range
‘Max press’ ADULT 290...330 mmHg
‘2 s after stop’ ADULT 290...330 mmHg
‘Max press’ INFANT 154...165 mmHg
‘2 s after stop’ INFANT 154...165 mmHg
OK N.A. Fail OK N.A. Fail
34. Cuff related messages 35. Adult cuff detection
36. Test measurement 37. Infant cuff detection
Notes
A-3(4)
Document No. 800 1008-2
Page 88

Datex-Ohmeda S/5 monitors
All modules
OK N.A. Fail OK N.A. Fail
38. Electrical safety check 39. Functioning after
electrical safety check
40. Final cleaning
Notes
Notes
Used Spare Parts
Signature
A 4 (4)
Document No. 8001008-2
 Loading...