

Page 1

BROOKFIELD DV-III ULTRA
Programmable Rheometer
Operating Instructions
Manual No. M98-211-E0912
SPECIALISTS IN THE
MEASUREMENT AND
CONTROL OF VISCOSITY
with offices in
Boston • Chicago • London • Stuttgart • Guangzhou
:
BROOKFIELD ENGINEERING LABORATORIES, INC.
11 Commerce Boulevard, Middleboro, MA 02346 USA
TEL 508-946-6200
F
AX 508-946-6262
or 800-628-8139 (USA e xcluding MA)
http://www.brookfieldengineering.com
I
NTERNET
Brookeld Engineering Laboratories, Inc. Page 1 Manual No. M98-211-E0912
Page 2

Brookeld Engineering Laboratories, Inc. Page 2 Manual No. M98-211-E0912
Brookeld Engineering Laboratories, Inc. Page 2 Manual No. M/98-211-B0104
Page 3

Table of Contents
I. Introduction .......................................................................................................... 5
I.1 Torque Measurement ................................................................................................................. 5
I.2 Viscosity Units of Measurement ................................................................................................5
I.3 Yield Stress Measurement ........................................................................................................6
I.4 Components ..............................................................................................................................7
I.5 Dimensional Information ............................................................................................................ 8
I.6 Utilities ....................................................................................................................................... 9
I.7 Specication ..............................................................................................................................9
I.8 Safety Symbols and Precautions ............................................................................................. 11
I.9 Data Retention ......................................................................................................................... 11
I.10 Set-Up ................................................................................................................................... 11
I.11 Connections ........................................................................................................................... 15
I.12 Key Functions ........................................................................................................................ 16
I.13 Cleaning .................................................................................................................................17
II. Getting Started ................................................................................................... 18
II.1 Autozero .................................................................................................................................18
II.2 Rheometer Display ................................................................................................................. 18
II.3 Spindle Entry ..........................................................................................................................21
II.4 Direct Speed Entry .................................................................................................................23
II.5 External Control ...................................................................................................................... 24
II.6 Preventative Maintenance ...................................................................................................... 25
III. Making Viscosity and Yeild Measurements .................................................... 27
III.1 Quick Start ............................................................................................................................. 27
III.2 Preparations for Making Measurements ................................................................................28
III.3 Selecting a Spindle/Speed ....................................................................................................30
III.4 Multiple Data Points ...............................................................................................................30
IV. Programming the DV-III Ultra and Data Collection Methods/Analysis ......... 31
IV.1 Programming Concepts ......................................................................................................... 31
IV.2 DV-III Speed/Time Pair Programs for Making Viscosity Measurements ...............................32
IV.3 Bevis Programs for Making Viscosity Measurements ...........................................................42
IV.3.1 Setting Up Bevis Programs ............................................................................................42
IV.3.1.1 Description of B.E.V.I.S. Commands ......................................................................43
IV.3.1.2 Example Programs ................................................................................................. 46
IV.3.2 Running Bevis Programs in Standalone Mode ............................................................... 47
IV.4 Choosing the Best Data Collection Method for Viscosity Tests ............................................. 49
IV.5 Data Analysis for Viscosity Tests ........................................................................................... 50
IV.6 Automated Data Gathering and Analysis using Rheocalc .....................................................50
IV.7 Math Models ..........................................................................................................................50
IV.7.1 The Power Law (Ostwald) Model ...................................................................................42
IV.7.2 The Herschel/Bulkley Model ...........................................................................................42
IV.7.3 The Bingham Model .......................................................................................................42
IV.7.4 The Casson Model .........................................................................................................42
Brookeld Engineering Laboratories, Inc. Page 3 Manual No. M98-211-E0912
Brookeld Engineering Laboratories, Inc. Page 3 Manual No. M/98-211-B0104
Page 4

Table of Contents (cont'd)
IV.7.5 Other Common Rheological Models ..............................................................................42
IV.8 Yeild Stress Test Programs and Test Samples ...................................................................... 53
IV.8.1 Test Parameter Description ............................................................................................ 53
IV.8.2 Toolbar and Menu Options .............................................................................................57
IV.8.3 Data Page ......................................................................................................................60
IV.8.4 Graphs Page ..................................................................................................................62
IV.8.5 Examples of Yield Test Programs ................................................................................... 65
IV.8.5.1 Example Application: Hair Gel .............................................................................. 65
IV.8.5.2 Example Application: Hand Cream ....................................................................... 66
IV.8.5.3 Example Application: Ketchup .............................................................................. 66
IV.8.5.4 Torque vs. Time for Various Food Products ........................................................... 68
IV.8.6 Running Yield Test Programs in Stand-Alone Mode ..................................................... 69
IV.8.6.1 Data Output ...........................................................................................................73
IV.8.6.2 Printing A Program ................................................................................................73
IV.8.6.3 Test Results ........................................................................................................... 75
V. OPTIONS ............................................................................................................. 77
V.1 Set Up ....................................................................................................................................77
V.2 Print ........................................................................................................................................77
V.3 Alarm ......................................................................................................................................78
V.4 Set Temperature ..................................................................................................................... 79
V.5 Data ........................................................................................................................................79
V.6 Timed Data Collection ............................................................................................................81
Appendix A - Cone/Plate Rheometer Set-Up ...................................................................83
A.1 Electronic Gap Setting Features ............................................................................................83
A.2 Set-Up .....................................................................................................................................84
A.3 Setting the Gap .......................................................................................................................85
A.4 Verifying Calibration ................................................................................................................86
Appendix B - Viscosity Ranges ........................................................................................87
Appendix C - Variables in Viscosity Measurements .......................................................93
Appendix D1 - Spindle and Model Codes for Viscosity Tests .......................................95
Appendix D2 - Spindle Codes and Speeds for Yeild Tests ............................................99
Appendix E - Calibration Procedures .............................................................................102
Appendix F - The Brookeld Guardleg ..........................................................................107
Appendix G - DV-III Ultra Stand Assembly .....................................................................109
Appendix H - DVE-50A Probe Clip ..................................................................................110
Appendix I - DV-III Ultra to Computer Command Set .................................................... 111
Appendix J - Fault Diagnosis and Troubleshooting .....................................................115
Appendix K - Online Help and Other Resources ........................................................... 118
Appendix L - Warranty Repair and Service .................................................................... 119
Viscosity Test Report .........................................................................................Tear out page
Brookeld Engineering Laboratories, Inc. Page 4 Manual No. M98-211-E0912
Page 5

I. INTRODUCTION
The Brookeld DV-III Ultra Programmable Rheometer measures uid parameters of Shear Stress
and Viscosity at given Shear Rates. Viscosity is a measure of a uid’s resistance to ow. You will
nd a detailed description of the mathematics of viscosity in the Brookeld publication “More
Solutions to Sticky Problems”, a copy of which was included with your DV-III Ultra.
The principle of operation of the DV-III Ultra is to drive a spindle (which is immersed in the test
uid) through a calibrated spring. The viscous drag of the uid against the spindle is measured
by the spring deection. Spring deection is measured with a rotary transducer. The viscosity
measurement range of the DV-III Ultra (in centipoise or cP) is determined by the rotational speed
of the spindle, the size and shape of the spindle, the container the spindle is rotating in, and the full
scale torque of the calibrated spring.
The DV-III Ultra can also measure yield stress (in Pascals or Pa). See Section I.3 for more information
on yield stress.
I.1 Torque Measurement
There are four basic spring torque models offered by Brookeld:
Spring Torque
Model dyne•cm mN•m
LVDV-III Ultra 673.7 0.0673
RVDV-III Ultra 7,187.0 0.7187
HADV-III Ultra 14,374.0 1.4374
HBDV-III Ultra 57,496.0 5.7496
The higher the torque calibration, the higher the viscosity measurement range. The viscosity
measurement range for each spring torque model may be found in Appendix B.
I.2 Viscosity Units of Measurement
All units of measurement are displayed according to either the CGS system or the SI
system.
1. Viscosity appears in units of centipoise (shown as “cP”) or milliPascal-seconds (shown
as mPa•s).
2
2. Shear Stress appears in units of dynes/square centimeter (“D/cm
2
meter (“N/m
”).
”) or Newtons/square
3. Shear Rate appears in units of reciprocal seconds (“1/SEC”).
4. Torque appears in units of dyne-centimeters or Newton-meters (shown as percent “%”
in both cases).
The equivalent units of measurement in the SI system are calculated using the following
conversions:
SI CGS
Viscosity: 1 mPa•s = 1 cP
Shear Stress: 1 Newton/m
2
= 10 dyne/cm
2
Torque: 1 N•m = 107 dyne•cm
References to viscosity throughout this manual are done in CGS units.
Brookeld Engineering Laboratories, Inc. Page 5 Manual No. M98-211-E0912
Brookeld Engineering Laboratories, Inc. Page 5 Manual No. M/98-211-B0104
Page 6
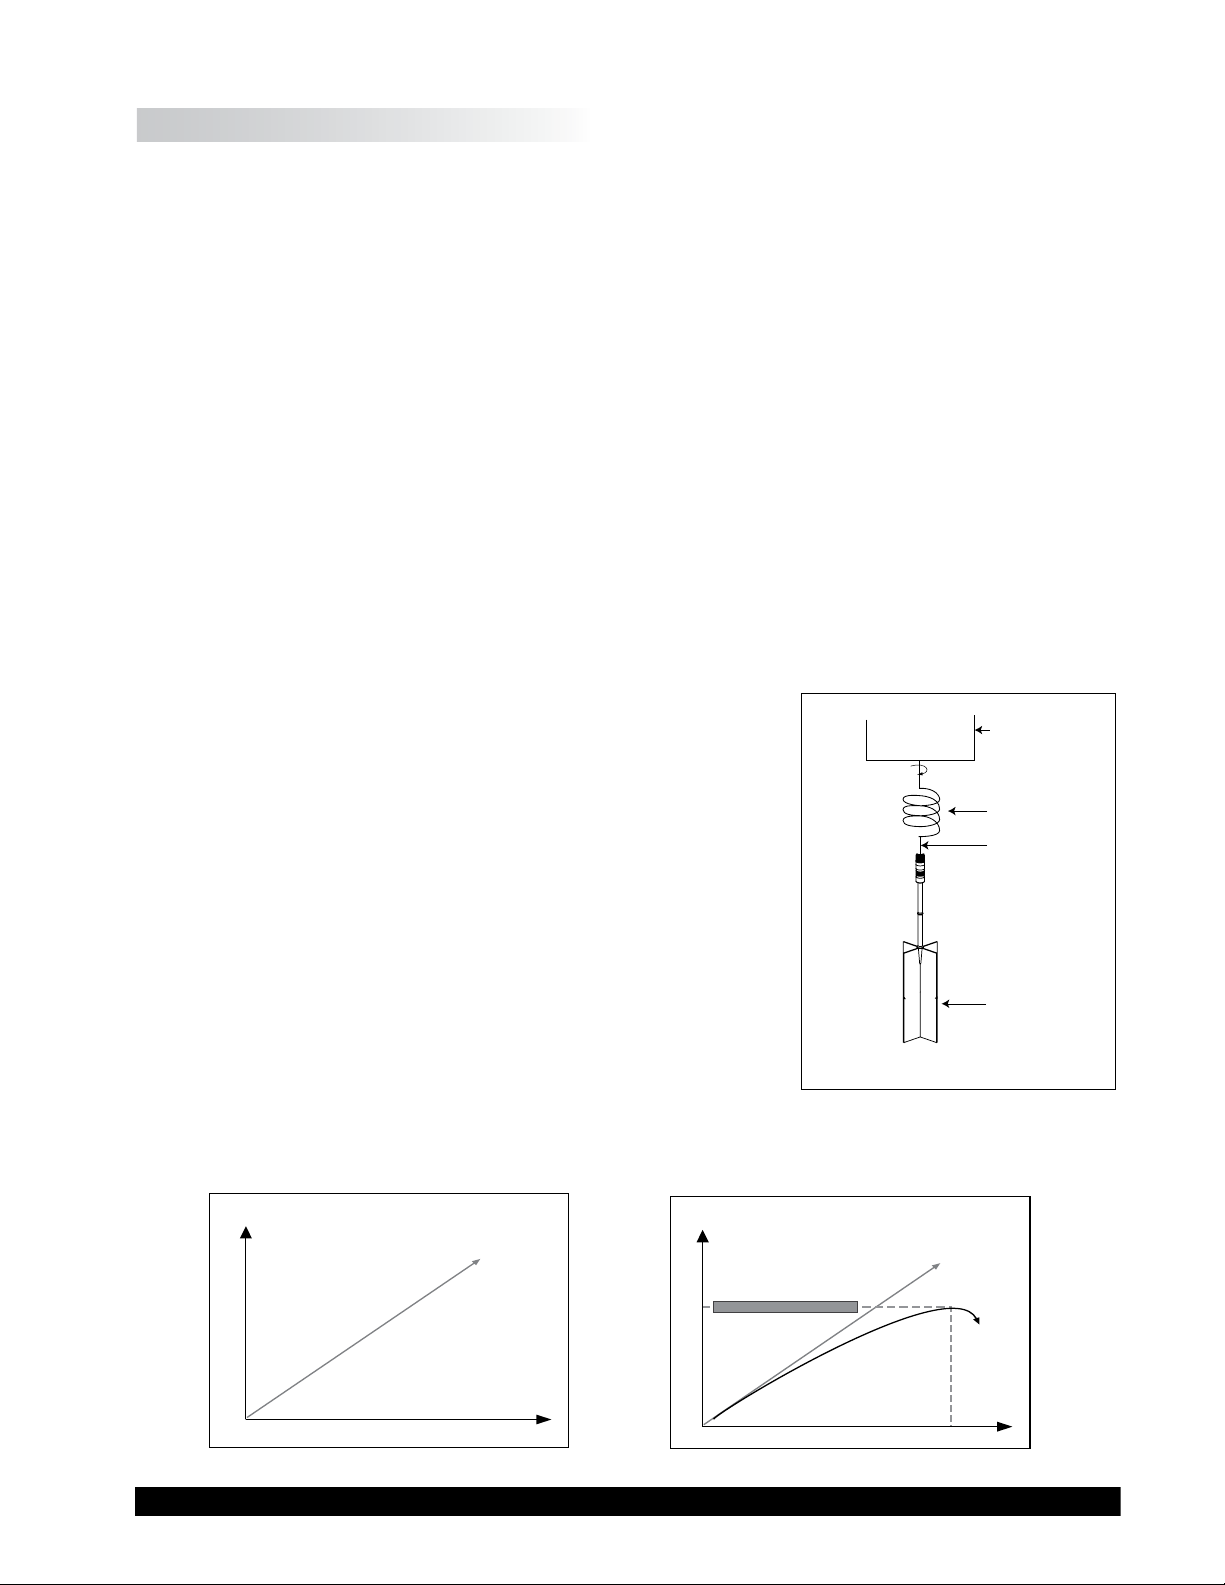
I.3 Yield Stress Measurement
Motor
Calibrated
Spiral Spring
Drive
Shaft
Vane
Spindle
Maximum Torque Value
TIME
TORQUE
TIME
TORQUE
Another feature now available in the DV-III Ultra Rheometer is the yield stress test.
The yield point is the point at which a material begins to ow. The associated properties are the
yield stress and yield strain. The yield stress is the critical shear stress, applied to the sample, at
which the material begins to ow as a liquid. The yield strain is the deformation in the material,
resulting from the applied stress prior to the start of ow.
Many materials are designed to have a yield point, so that the behavior of their products satises
various customer needs. Foods often have yield points. Ketchup in particular must ow out of a
bottle when shaken or squeezed, but then solidify on the targeted food such as french fries. Shaking
or squeezing the bottle stresses the ketchup so that it ows; after the ketchup settles on the fries, its
structure rebuilds so the ketchup “sits” in place rather than owing off the fries like water. Puddings
have yield points, as well. The “body” of the pudding appeals to consumers – it is solid at rest,
yet it’s easily spooned out of its cup and is easy to eat. Thus, the yield behavior of many foods
contributes to the food texture that we like.
Many paints have low yield stresses. Many latex house paints, for example, are easily stirred or
poured. Brushing or spraying provides enough stress so that the paint ows easily and smoothly
over a painted wall. However, a thin layer of applied paint (if a good one!), that is allowed to rest
undisturbed on the surface, regains its structure quickly so that there is very little unsightly “dripping”
afterwards. The smooth appearance of the painted surface is very appealing to the homeowner.
The operating principle is to drive a vane spindle through the
calibrated spiral spring connected to a motor drive shaft (see
Figure I-1). The vane spindle is immersed in the test material.
The resistance of the material to movement is measured by
observing increasing torque values as the DV-III Ultra motor
rotates. The amount of shaft rotation is measured by the deection
of the calibrated spiral spring inside the instrument. Spring
deection is measured with a rotary transducer.
If the vane spindle did not move at all, the data would look like
the graph in Figure I-2. The data often looks like the graph in
Figure I-3 because there is usually some deformation of the test
material due to the increasing force imparted by the vane spindle.
The maximum torque value is the yield point. The straight line
in Figure I-3 is a repeat of what was shown in Figure I-2. An
algorithm in the rmware converts the maximum torque value
into a yield stress value.
Figure I-1
The shear stress measurement range of the DV-III Ultra (in Pascals) is determined by the size and
shape of the vane spindle and the full scale torque range of the calibrated spring.
Brookeld Engineering Laboratories, Inc. Page 6 Manual No. M98-211-E0912
Figure I-2
Figure I-3
Page 7

I.4 Components
Component Part Number
DV-III Ultra Rheometer depends on model
Powerbase DVP-2Y
includes:
Leveling Screws (3) VS-3
Upright Rod VS-20
Jam Nut VS-21
Clamp Assembly VS-27Y
Spindle Set with Case
LVDV-III Ultra set of four spindles or SSL
RVDV-III Ultra set of six spindles or SSR
HA/HBDV-III Ultra set of six spindles SSH
Optional Vane Set of three spindles SSVANE
For Cone/Plate versions: a spindle wrench, one cone spindle and sample cup Part No.
CPE-44Y replace the spindle set.
Power Cord
for 115 VAC DVP-65
for 230 VAC DVP-66
RTD Temperature Probe DVP-94Y
Ribbon Cable DVP-145
Guard Leg:
LVDV-III Ultra B-20Y
RVDV-III Ultra B-21Y
Carrying Case DVP-71Y
RHEOLOADER Software, EZ-Yield Software CD-PROGA
RS-232 Cable (DV-III Ultra to Computer) DVP-80
USB Cable DVP-202
Operator Manual M98-211
Please check to be sure that you have received all components, and that there is no
damage. If you are missing any parts, please notify Brookeld Engineering or your local
Brookeld agent immediately. Any shipping damage must be reported to the carrier.
Brookeld Engineering Laboratories, Inc. Page 7 Manual No. M98-211-E0912
Page 8
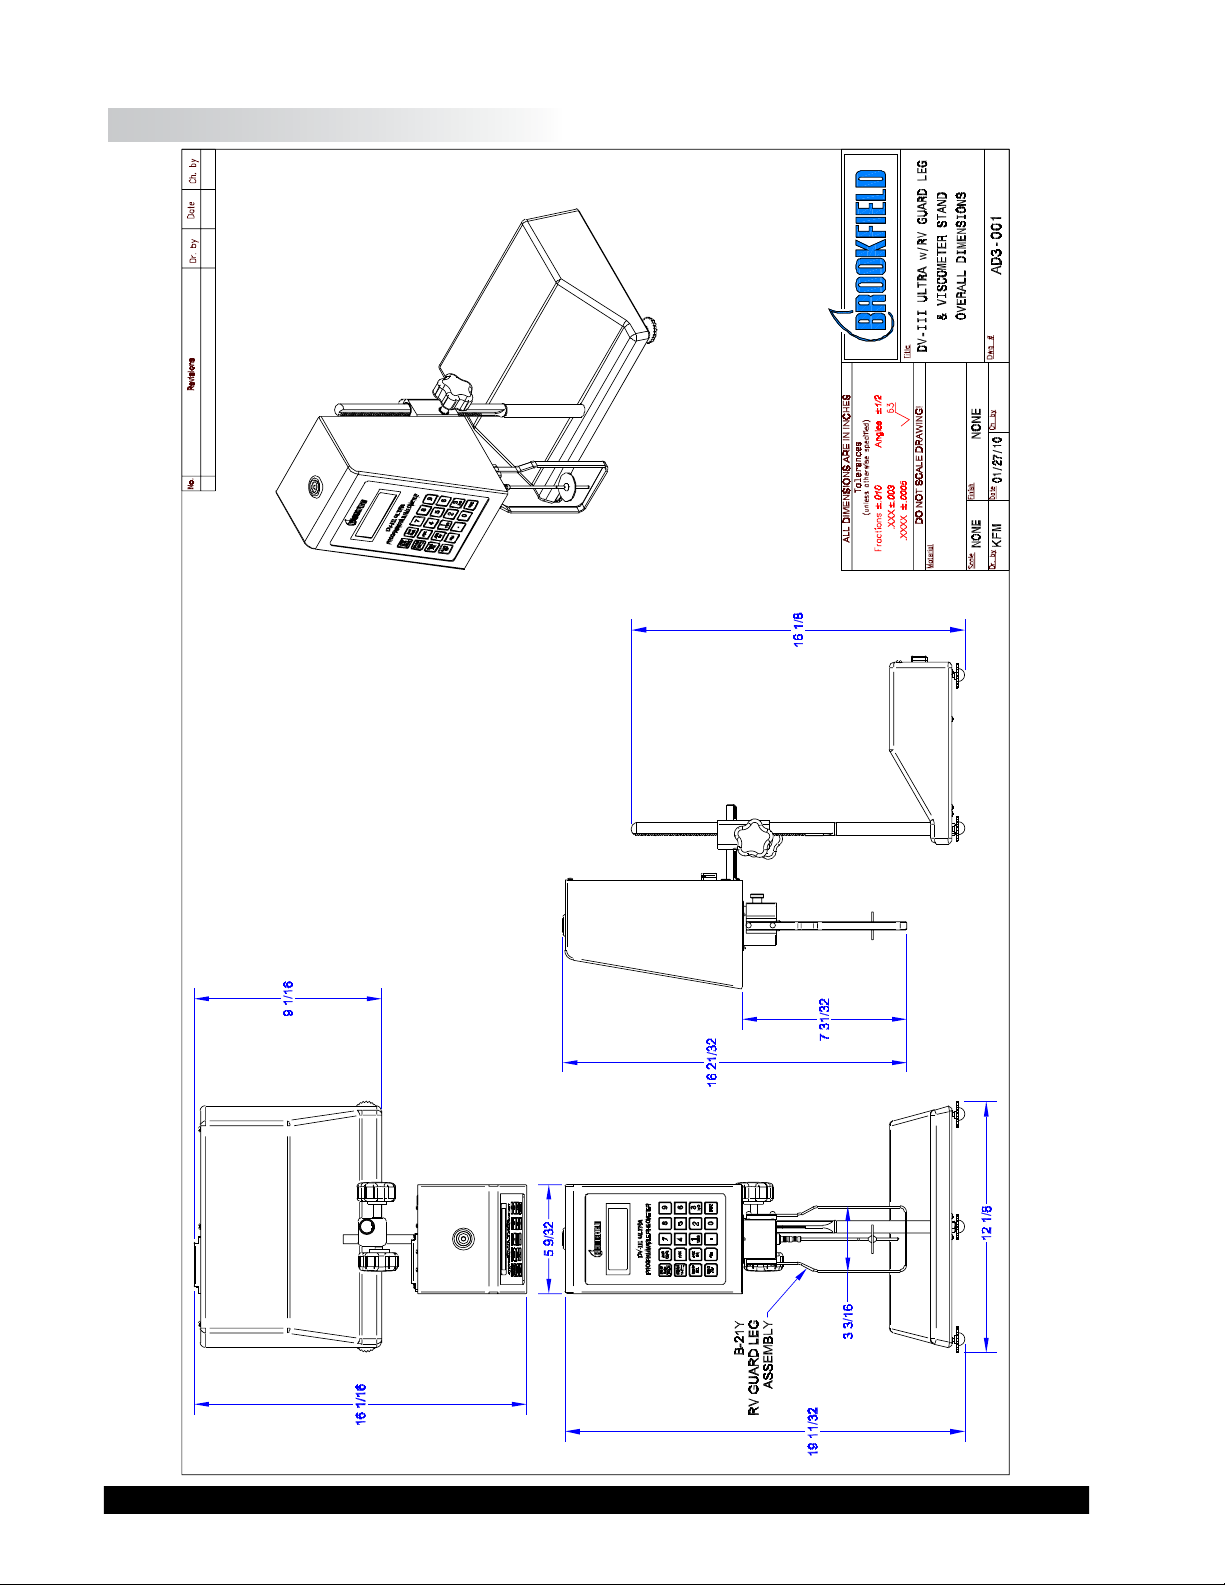
I.5 Dimensional Information
Brookeld Engineering Laboratories, Inc. Page 8 Manual No. M98-211-E0912
Brookeld Engineering Laboratories, Inc. Page 8 Manual No. M/98-211-B0104
Page 9

I.6 Utilities
Auto-sensing Power Supply:
Input Voltage: 90 - 260 VAC
Input Frequency: 50 - 60 Hz
Power Consumption: Less than 220 VA
Main supply voltage uctuations are not to exceed ± 10% of the nominal supply voltage.
Power Cord Color Code:
United States Outside United States
Hot (live) Black Brown
Neutral White Blue
Ground (earth) Green Green/Yellow
I.7 Specication
Speed Ranges 0.01-250 RPM, 0.01 RPM increments from 0.01 to 0.99 RPM,
for viscosity tests: 0.1 RPM increments from 1.0 to 250 RPM
Speed Ranges Pre Shear 0.01 to 200 rpm
for yield tests: Zero 0.01 to 0.5 rpm
Yield Test 0.01 to 5 rpm
Time Intervals 100 msec - 1000 msec
for yield tests:
Viscosity Accuracy: ± 1.0% of full scale range for a specic spindle running at a
specic speed.
Temperature sensing range: - 100°C to 300°C (-148°F to 572°F)
Temperature accuracy: ± 1.0°C from -100°C to 150°C
± 2.0°C from +150°C to 300°C
Analog Torque Output: 0 - 1 Volt DC (0 - 100% torque)
Analog Temperature Output: 0 - 4 Volts DC (10mv / °C)
Printer Output: Centronics, parallel or serial
Computer Interface: RS-232
USB
Torque Accuracy: ±1.0% of full scale range
Torque Repeatability: ±0.2%
Brookeld Engineering Laboratories, Inc. Page 9 Manual No. M98-211-E0912
Page 10

Operating Environment: Use indoors only.
5 °C to 40 °C temperature range (41 °F to 104 °F)
20% - 80% R.H.: non-condensing atmosphere
Pollution Degree II
Installation Category II
Altitude up to 2000 meters (max).
Weight: Gross Weight: 35 lbs. 15.9 kg
Net Weight: 32 lbs. 14.5 kg
Carton Volume: 2.0 cu. ft. 0.057 m
3
Ball Bearing Option:
If you ordered the ball bearing suspension system with your new instrument, please note the
following:
1) The ball bearing suspension in your Brookeld instrument is noted on the serial tag on
the back of the head by the letter "B" after the mode.
2) When attaching and detaching the spindle, it is not necessary to lift the coupling where
the spindle connects to the instrument.
3) The Oscillation Check explained in the Appendix J - Fault Diagnosis and Troubleshooting
does not pertain to this instrument.
Electrical Certication:
This product has been certied to the applicable CSA and ANSI/UL Standards, for use in
Canada and the U.S. (cCSAus).
Installation Category II, Pollution Degree 2, Altitude 2000m (max).
NOTICE TO CUSTOMERS:
This symbol indicates that this product is to be recycled at an appropriate collection center.
Users within the European Union:
Please contact your dealer or the local authorities in charge of waste management on how to
dispose of this product properly. All Brookeld ofces and our network of representatives
and dealers can be found on our web site: www.brookeldengineering.com
Users outside of the European Union:
Please dispose of this product according to your local laws.
Brookeld Engineering Laboratories, Inc. Page 10 Manual No. M98-211-E0912
Brookeld Engineering Laboratories, Inc. Page 10 Manual No. M/98-211-B0104
Page 11

I.8 Safety Symbols and Precautions
Safety Symbols
The following explains safety symbols which may be found in this operating manual.
Indicates hazardous voltages may be present.
Refer to the manual for specic warning or caution information to avoid personal injury
or damage to the instrument.
Precautions
If this instrument is used in a manner not specied by the manufacturer, the protection
provided by the instrument may be impaired.
This instrument is not intended for use in a potentially hazardous environment.
In case of emergency, turn off the instrument and then disconnect the electrical cord
from the wall outlet.
The user should ensure that the substances placed under test do not release poisonous,
toxic or ammable gases at the temperatures which they are subjected to during the
testing.
Instrument intended for indoor use only.
I.9 Data Retention
The DV-III Ultra will save spindle parameters (used to calculate centipoise, shear rate and shear
stress), default settings and the test data from the last program test run when the rheometer is turned
off or there is a power failure.
I.10 Set-Up
Note: "IQ,OQ,PQ", a guideline document for installation, operation and
performance validation for your DV-III Ultra Rheometer, can be
downloaded from our website: www.brookeldengineering.com
Brookeld Engineering Laboratories, Inc. Page 11 Manual No. M98-211-E0912
Page 12
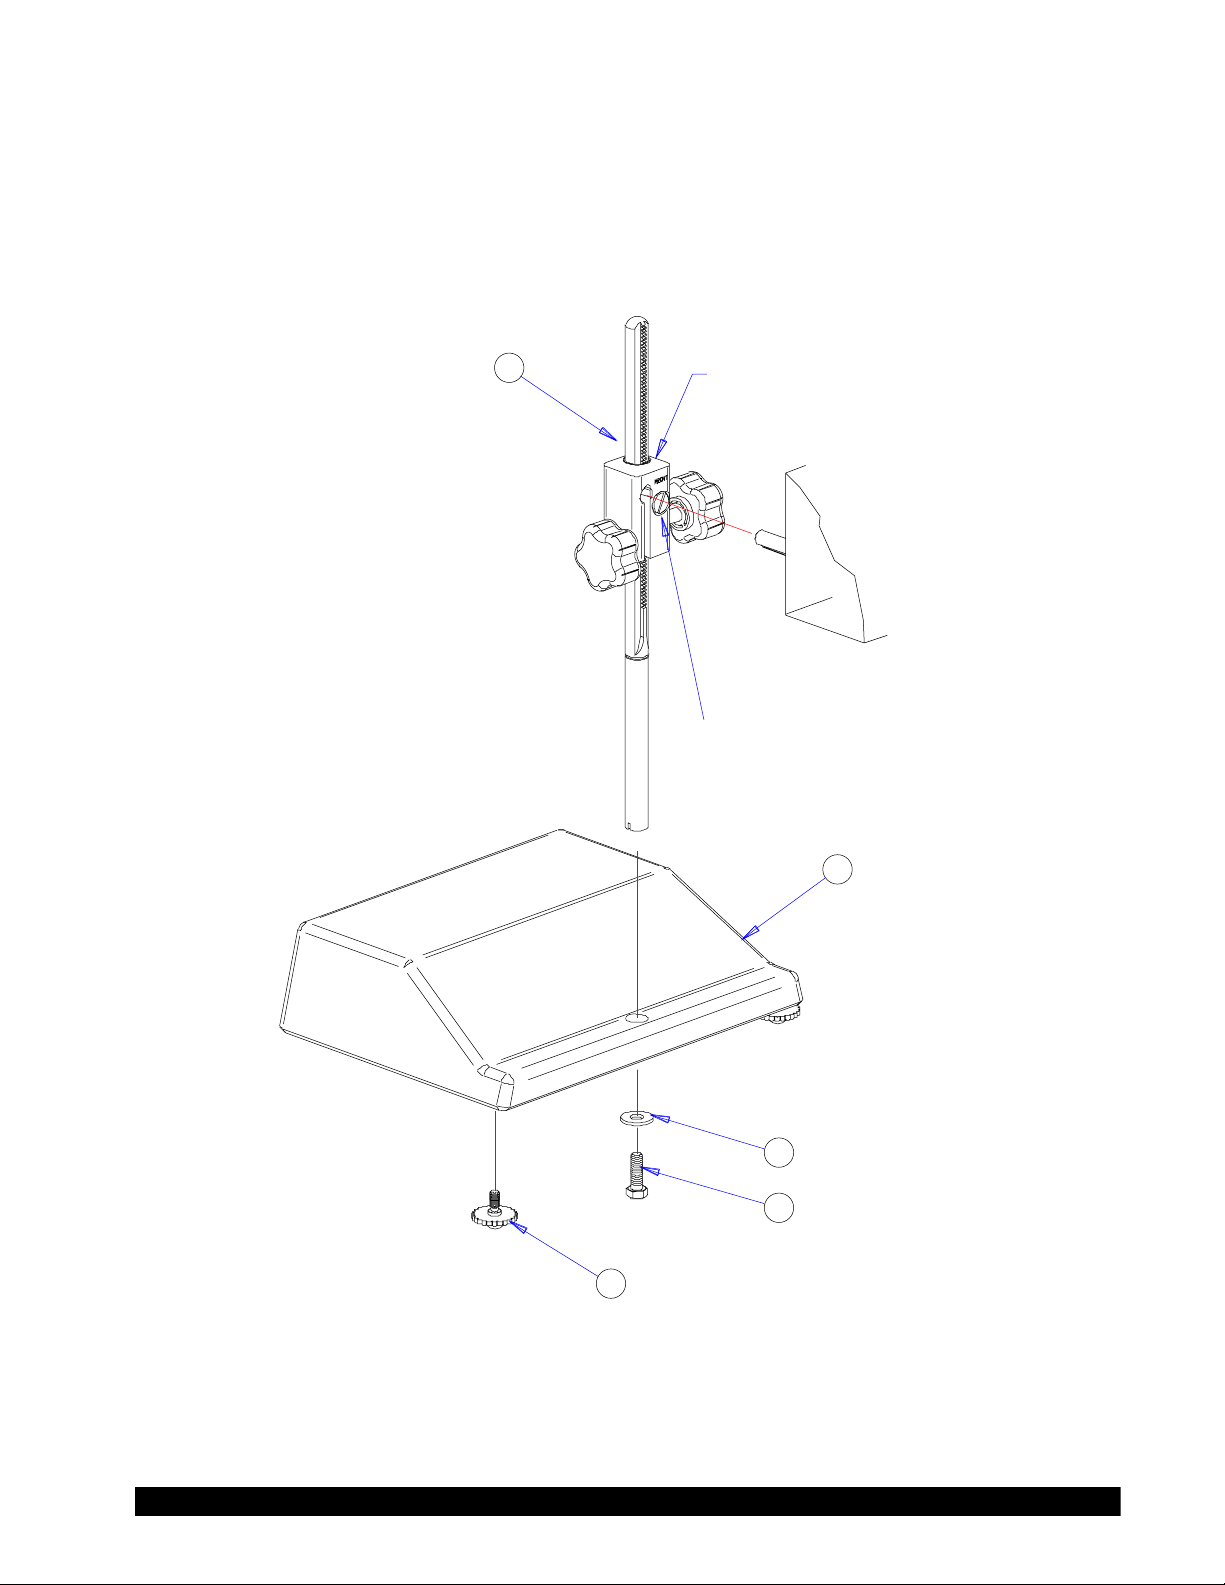
1) Place the upright rod into the hole at the front of the base. The rack gear and clamp assembly
DV-III Ultra Stand Assembly
should face the rear of the base (see Figure I-4). The upright rod (item #1) is held in place
with the jam nut (item #4) which is attached from the bottom of the base. Tighten this nut
with a suitable wrench (spanner).
1
CLAMP ASSEMBLY
NOTE: “FRONT” FACES TOWARD YOU.
DV-III Ultra
HEAD UNIT
TENSION SCREW
2
3
4
5
Figure I-4
Brookeld Engineering Laboratories, Inc. Page 12 Manual No. M98-211-E0912
Page 13

Bubble Level
Rack Gear
Clamp Assembly
Clamp Screw
Upright Rod
Mounting Handle
Figure I-5
2) Insert the mounting handle on the back of the DV-III Ultra into the hole on the clamp assembly
(SEE Figure I-5).
3) Tighten the DV-III Ultra clamp Screw (SEE Figure I-5).
Note: If the clamp assembly moves along the upright rod to freely, tighten the
tension screw (See Appendix G)
4) Insert the ribbon cable into the DV-III Ultra Rheometer head. Insert the other end of the
ribbon cable into the connector on the DV-III Ultra base (see Figure I-6).
5) Connect the RTD probe to the socket on the back side of the DV-III Ultra Rheometer (see
Figure I-6).
6) The Rheometer must be leveled before the instrument is zeroed and readings are taken. The
level is adjusted using the three leveling screws on the base. Adjust so that the bubble level
on top of the DV-III Ultra (see Figure I-5) is centered within the circle.
7) Remove the grey shipping cap which secures the lower coupling nut on the Rheometer to the
pivot cup
Brookeld Engineering Laboratories, Inc. Page 13 Manual No. M98-211-E0912
Brookeld Engineering Laboratories, Inc. Page 13 Manual No. M/98-211-B0104
Note: Check level periodically during use
8) Make sure that the AC power switch at the rear of the base unit is in the OFF position. Connect
the AC plug to the socket on the back of the DV-III Ultra base and plug it into the appropriate
AC line. Allow at least 10 minutes for warm up; 30 minutes is preferable.
Page 14
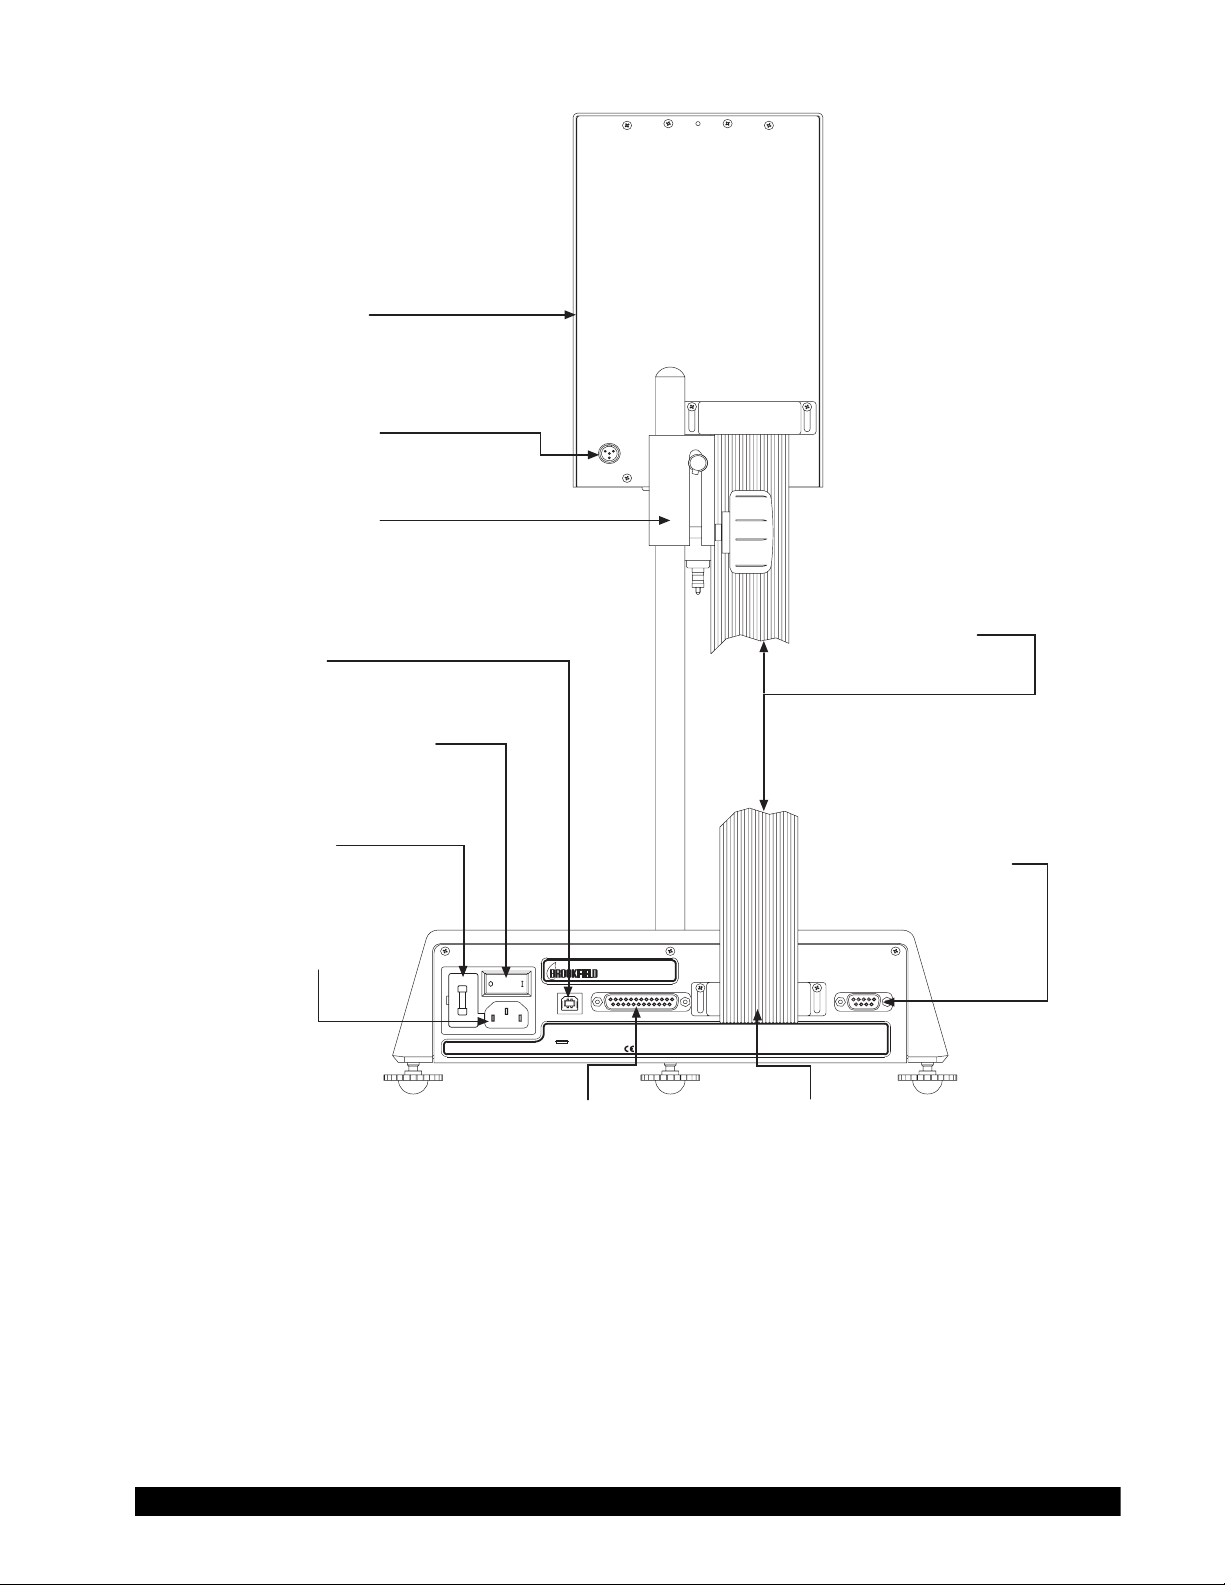
Rheometer Head
RTD Temperature
Probe Connector
Adjustment Knob
Connector
USB Cable
Power ON/OFF Switch
AC Fuse(s)
AC Power Connector
ELECTRIC RA TINGS (AUTORANGING)
90-260V AC 50/60Hz 220V A
11 COMMERCE BLVD.
MIDDLEBORO , MA 02346 U.S.A .
US BPARALLEL PRINTE RRHEOMETER UNIT SERIAL I/O
FUSE RA TINGS
F/250V 2A
-EARTH GROUNDING REQUIRE D-
Connector
Parallel Printer
MODEL DV-III ULTRA BASE UNIT Rev. B
Connector
Ribbon Cable
Figure I-6
Ribbon Cable
Connector
RS-232 Serial
Printer/Computer
Analog Output(s)
PRINTER OR COMPUTE R
ANAL OG OUTPUT S
o
TORQUE 0-1V TEMP 10MV/ C
The DV-III Ultra must be earth grounded to ensure against electronic failure!!
9) Temperature monitoring is assured (after the instrument has stabilized) to within ±1.0°C in
the range -100°C to +150°C and within 2°C in the range 150°C to 300°C.
10) For Cone/Plate models refer to Appendix A.
11) For printers, software and temperature controllers, refer to Section I.11, Connections.
Brookeld Engineering Laboratories, Inc. Page 14 Manual No. M98-211-E0912
Page 15

I.11 Connections
The DV-III Ultra Rheometer is capable of communicating with several external devices to enhance
operation. The cables and connections required for proper communication are detailed below.
S
RHEOLOADER
The DVP-202 USB Cable is used to connect the USB Port on the DV-III Ultra Base to the computer.
The DVP-80 cable is used to connect the RS-232 serial port on the DV-III Ultra base to Com Port
1 or Com Port 2 on the computer. Some PCs may also have Com Port 3 and Com Port 4. These
cables are supplied with the DV-III Ultra.
RHEOLOADER AND EZ-YIELD SOFTWARE
S
The DVP-80 cable is used to connect the RS-232 serial port on the DV-III Ultra base to Com Port
1 or Com Port 2 on the computer. Some PCs may also have Com Port 3 and Com Port 4. This
cable is supplied with the DV-III Ultra.
RHEOCALC SOFTWARE
S
The DVP-202 USB Cable is used to connect the USB Port on the DV-III Ultra Base to the computer.
The DVP-80 cable is used to connect the RS-232 serial port on the DV-III Ultra base to Com Port
1 or Com Port 2 on the computer. Both cables are supplied with the RHEOCALC software.
PARALLEL PRINTER
S
The CAP-86 cable is used to connect the 25-pin parallel port on the DV-III Ultra base with the
Centronics port on the printer.
SERIAL PRINTER
S
The DVP-81 cable is used to connect the 9-pin serial port on the DV-III Ultra with the 25-pin serial
port on a printer.
THERMOSEL CONTROLLER AND TC SERIES TEMPERATURE BATHS
S
Earlier model baths with programmable Brookeld Controllers will also work.
The DVP-141 cable is used to connect the serial port on the DV-III Ultra base to the serial port on
the controller. This cable is supplied with the controller/bath.
Be sure that the controller temperature probe is properly located in the control device (Thermosel
or bath) and connected to the controller.
Note: 1. The controller may alternately communicate with Rheocalc V.2.0 or
higher software. In this conguration, the controller is connected to the
computer through either Com Port 1 or Com Port 2 by using the DVP-80
cable. The DV-III Ultra can also be connected to a computer through
the USB Port by using the DVP-202 cable.
2. The controller must also be connected to the control device (Thermosel
or bath) with the appropriate load cable.
Brookeld Engineering Laboratories, Inc. Page 15 Manual No. M98-211-E0912
Brookeld Engineering Laboratories, Inc. Page 15 Manual No. M/98-211-B0104
Page 16
S STRIP CHART RECORDER
DVP-96Y cable is used to connect the serial port on the DV-III Ultra to the input block of the strip
chart recorder. This cable is supplied with a Brookeld strip chart recorder.
I.12 Key Functions
Figure I-7 shows the control keys on the face of the DV-III Ultra Rheometer. The following describes
each key’s function.
MOTOR
ON/OFF
ESCAPE
OPTION
TAB
SELECT
SPDL
SELECT
DISP
AUTO
RANGE
PROG
PROG
RUN
PRINT
789
456
1
YES NO
.
2
0
3
ENTER
Figure I-7
MOTOR
Turns the motor on or off. Cancels any operation. Returns the user to the previous screen.
MOTOR ON/OFF, ESCAPE
ON/OFF
ESCAPE
Presents the maximum (100% torque) viscosity attainable using the selected spindle at
AUTORANGE
AUTO
RANGE
the current speed.
SELECT SPDL
SELECT
SPDL
Allows selection of the spindle to be used.
Selects the parameter to be displayed:
SELECT DISP
SELECT
DISP
% Rheometer Torque (%)
cP Viscosity (cP or mPa
SS Shear Stress (Dynes/cm
.
s)
2
or Newtons/m2)
SR Shear Rate (1/Sec)
Brookeld Engineering Laboratories, Inc. Page 16 Manual No. M98-211-E0912
Page 17
OPTION
TAB F
PRINT
OPTION, TAB
Accesses options menu (see Section V). Toggles between selectable items when indicated.
PRINT
Sends a single line of data to an attached printer. Selects printing and non-printing mode as
selected in the Options menu.
PROG
PROG
Access the Programs menu for program creation, running or deleting. Constructs a test program.
Allows you to review/modify an existing test program. Execute a Bevis program.
PROG RUN
PROG
RUN
Execute DV-III Ultra speed/time pair program.
NUMBER KEYS (0 through 9)
0
Sets speeds and choose items from various dialog screens and the option menu.
ENTER
ENTER
Functions as an ENTER key similar to a computer by serving to accept a keyboard entry.
I.13 Cleaning
Make sure the instrument is in a decent working environment (dust-free, moderate
temperature, low humidity, etc).
Make sure the instrument is on a level surface.
Hands/ngers must be clean and free of residual sample. Not doing so may result in
deposit build-up on the upper part of the shaft and cause interferences between the
shaft and the pivot cup.
Be sure to remove the spindle from the instrument prior to cleaning. Severe
instrument damage may result if the spindle is cleaned in place.
Instrument and Keypad: Clean with a dry, non-abrasive cloth. Do not use solvents
or cleaners.
Immersed Components (spindles): Spindles are made of stainless steel. Clean with a
non-abrasive cloth and solvent appropriate for sample
material.
When cleaning, do not apply excessive force which may result in bending the
spindles.
Brookeld Engineering Laboratories, Inc. Page 17 Manual No. M98-211-E0912
Brookeld Engineering Laboratories, Inc. Page 17 Manual No. M/98-211-B0104
Page 18

II. GETTING STARTED
II.1 Autozero
Before readings may be taken, the Rheometer must be auto zeroed. This is done each time the
power switch is turned on. The Rheometer will guide you through the procedure, as follows:
Turn power switch on; as shown in Figure II-1, the screen indicates that the DV-III Ultra is in the
standalone mode (is not connected to a computer) and gives the version of the operating rmware
(the built in program which controls the instrument) and a two-digit alphanumeric code which
indicates the Model number (see Table D2 in Appendix D; the code tells the spring torque rating
of your Rheometer).
BROOKFIELD
DV-III ULTRA RHEOMETER
V1.0 HA
STANDALONE
Figure II-1
No key press is necessary. After a short pause the display will read “REMOVE SPINDLE, LEVEL
RHEOMETER AND PRESS THE MOTOR ON/OFF KEY TO AUTOZERO.” Before beginning the autozero
procedure, Brookeld recommends that you allow 10 minutes for the instrument to warm up.
After pressing the MOTOR ON/OFF key, the screen “ashes” for approximately 15 seconds while
the DV-III Ultra auto zeros.
After 15 seconds the display reads “AUTOZERO IS COMPLETE REPLACE SPINDLE AND PRESS ANY
KEY.” Press a key.
The main screen is displayed and the DV-III Ultra is ready for use (Figure II-2).
RPM: 0.0 SPINDLE: 31
TEMP: 72.1 F PRTN
TORQUE = 0.0 %
Figure II-2
II.2 Rheometer Display
The DV-III Ultra Rheometer is supplied with a 4-line display. The basic set of information is called
"The Default Screen" and is shown in Figure II-3. The parameters are detailed below:
RPM: 0.0 SPINDLE: 31
TEMP: 72.1°F PRTN
TORQUE = 0.0 %
Figure II-3
Brookeld Engineering Laboratories, Inc. Page 18 Manual No. M98-211-E0912
Page 19

1. Motor Status and Current Rheometer Speed
The DV-III Ultra motor can be OFF, ON at 0.0 rpm or ON at a speed greater than 0.0 rpm.
When the motor is OFF, "OFF" will be displayed and no speed entry will be accepted. When
the motor is ON, the actual speed of rotation will be displayed. When the motor is switched
from ON to OFF, the speed of rotation will be remembered; when the motor is turned ON
again, the DV-III Ultra will operate at that same speed. The rheometer motor is set to "OFF"
after AUTOZERO.
Note: Motor OFF and a speed setting of 0.0 are essentially the same.
2. Spindle Number
The currently-selected spindle. Viscosity, shear rate, and shear stress values will be calculated
based on this number. See Section II.3.
3. Measured Temperature
The current temperature as measured by the attached temperature probe. If no probe is
connected, four dashes "----" will be displayed.
4. Printing Status
Indicates the currently-selected method of printing.
5. Measured Data
Instrument Torque (%), Viscosity (cP), Shear Stress (D/cm2), Shear Rate (s-1)
The parameters are toggled from one to another using the Select Display key.
Note: Shear Stress and Shear Rate data cannot be calculated for some spindle
geometries. In these cases, the display will show 0.0.
6. Blank Line
This line is used to display entry data when selecting a spindle or speed of rotation. Additionally,
selected programs available for running will be identied here when in the Program mode.
(See Section IV.2).
The default screen will appear at the completion of the AUTOZERO sequence each time the DV-III
Ultra is turned ON in the standalone mode (see Section II.5: External Control). The displayed data
may be changed as described in the following sections.
The format for data displayed in the default screen and all other screens is described in Table 11.1.
For appearance sake, the entries in the table have been decimal point aligned. Actual rheometer
display will have all elds left justied.
Brookeld Engineering Laboratories, Inc. Page 19 Manual No. M98-211-E0912
Brookeld Engineering Laboratories, Inc. Page 19 Manual No. M/98-211-B0104
Page 20

ITEM PRINT FORMAT RANGE EXAMPLE
RPM RPM
Model M
Spindle S
Torque T
Viscosity cP or mPas
Shear Stress D/CM2 or
N/M2 =
D/CM 2/10
Shear Rate 1/SEC
Temperature T
Time Z
X.XX
XX.X
XXX.X
XXXXX
XX
XX.X
X.XX
XXX.X
XXXXX
XXXeX
X.XX
XXX.X
XXXXX
XXXeX
X.XXX
XX.X
XXXXX
XX:XX
0.01 <= RPM <= 0.99
0.1 <= RPM <= 99.9
100 <= RPM <= 250
See Model Table D-2 - Appendix D RV
00 <= S <= 99 31
-10.1 <= T <= 99.9 82.4
0 <= cP <= 9.99
10 <= cP <= 999.9
1000 <= cP <= 99999
100000 <= cP <=
51200000000
12345
123e3 to 8
0 <= D/CM2 <= 9.99
10 <= D/CM2 <= 999.9
1000 <= D/CM2 <= 99999
100000 <= D/CM2 <= 999999
12345
123e3
0 <= 1/SEC <= 9.999
10 <= 1/SEC <=99.9
100 <= 1/SEC <= 99999
-99.9 <= T <= 300.0 -10.3
00:00 <= Z <= 99.59 05:32
Table II-1
0.09
2.4
150.0
3.16
123.8
4.56
234.5
1.234
20.7
200
S
OUT OF RANGE INDICATORS
The DV-III Ultra is capable of measuring instrument torque within the range of 0 to 100%. Based
on this measurement, viscosity and shear stress are calculated. Brookeld recommends that data be
collected only in the range of 10 to 100%. Any data collected outside of this range is considered
invalid.
The DV-III Ultra provides the following display indicators when the measurement point is outside
of the 10-100% acceptable range.
S TORQUE GREATER THAN 100%
When Rheometer torque exceeds 100%, the parameter display eld will show “EEEE” for torque,
viscosity and shear stress.
RPM: 112 SPINDLE: 31
TEMP: 72.1°F PRTN
TORQUE = EEEE %
Figure II-4
S TORQUE LESS THAN 10%
When Rheometer torque drops below ten (10) percent, the Rheometer will continue to display
measurement (%, cP, D/cm2) values with units ashing:
Brookeld Engineering Laboratories, Inc. Page 20 Manual No. M98-211-E0912
Page 21

RPM: 112 SPINDLE: 31
TEMP: 72.1°F PRTN
VISC = 900@6 CPS
Figure II-5
S TORQUE LESS THAN 0%
When Rheometer torque drops below zero (0) percent, the Rheometer will continue to display
torque values preceded by a minus (-) sign. The viscosity and shear stress eld will display dashes
(- - - - ) as indicated in Figure II-6:
RPM: 112 SPINDLE: 31
TEMP: 72.1°F PRTN
S STR = ----- D/CM2
Figure II-6
II.3 Spindle Entry
The user can elect to change the spindle selection by pressing the
SELECT SPDL key. The DV-III
Ultra control program will use the previously blank line 3 on the default display screen to record
the new spindle input as depicted in Figure II-7.
RPM: 0.0 SPINDLE: 31
TEMP: 72.1°F PRTN
ENTER SPINDLE # 31
TORQUE = 0.0%
Figure II-7
To enter a spindle number, press the numeric keys until the desired spindle number has been entered.
Valid spindle numbers encompass the range from 00 to 99 as listed in Appendix D. Mistakes are
corrected by repeatedly pressing the numeric keys until the proper spindle value has been entered.
At that point, the user presses the
SELECT SPDL key again. An invalid spindle entry will result in a
“beep” and the display of the data entry error screen as shown in Figure II-8.
INVALID DATA ENTRY
"BAD SPINDLE"
** RE-ENTER **
Figure II-8
An invalid spindle entry is any two digit number in the range from 01 to 99 which is not listed in
Appendix D. This error message will be displayed for a few seconds after which the spindle entry
screen (see Figure II-7) will be re-displayed with a blank eld for the spindle number. The user
can cancel spindle entry at any time by pressing the
MOTOR ON/OFF/ESCAPE key.
To enter a new spindle into memory, use the following procedures.
Press and Hold the motor on/off and “9” key on power up. The screen in Figure II-9 appears.
Brookeld Engineering Laboratories, Inc. Page 21 Manual No. M98-211-E0912
Brookeld Engineering Laboratories, Inc. Page 21 Manual No. M/98-211-B0104
Page 22
VISCOMETER SETUP
PRESS ENTER TO START
Figure II-9
Press the
ENTER key. The screen in Figure II-10 appears. Press the "3" key for NO.
PRINT PARAM RAM?
1 = YES 3 = NO
Figure II-10
The display will now ask “SPECIAL SPINDLE?” as shown in Figure II-11. Press the “1” key
for YES.
SPECIAL SPINDLE?
1 = YES 3 = NO
Figure II-11
The display will ask “ADD A SPINDLE?” Press the “1” key for YES.
ADD A SPINDLE?
1 = YES 3 = NO
Figure II-12
The spindle number and name will be ashing. Use the “2” key for scrolling downward (ê) and
the “8” key for scrolling upward (è). The spindle name can be changed to any (2) letters from A
to Z.
Use the “tab” key to move left and right through the menu. Press the “enter” key to accept.
SPECIAL SPINDLE #1
NAME = D AA E
SMC =
SRC =
Figure II-13
Check the spindle constants to be entered. You must have the SMC (spindle multiplier constant)
and the SRC (the shear rate constant). Enter the rst set of numbers. Press the “enter” key to go
to the next line (example: spindle AA = SMC = 1.0 SRC = 2.0).
If you are adding additional spindles, press the “enter” key. You can enter up to 5 special
spindles.
Brookeld Engineering Laboratories, Inc. Page 22 Manual No. M98-211-E0912
Page 23

SPECIAL SPINDLE #2
NAME = D BB E
SMC = 1.000
SRC = 2.000
Figure II-14
To complete, enter 0 values for SMC and SRC.
The display may ask “ADD A SPINDLE”. You may press YES to repeat or NO to nish.
ADD A SPINDLE?
1 = YES 3 = NO
Figure II-15
If you press “3” NO, the display will ask “SAVE NEW SPINDLE?” Press the “1” YES to save or
press “3” NO.
SAVE NEW SPINDLES?
1 = YES 3 = NO
Figure II-16
The display will now say “SET UP COMPLETE”, turn power off.
You can edit any existing spindle entry names and spindle constants. If so, you will need to complete
the steps until you are prompted to “Save New Spindle”. For example, if you have three special
spindles entered and need to modify the second spindle, you will need to proceed through the third
spindle parameters by pressing “Enter” until prompted to “Save New Spindle”. This will then save
the modied spindle.
II.4 Direct Speed Entry
At this point, the user may choose to enter a speed by the so-called direct speed entry method.
Enter a valid speed in the range of 0.01 to 250 RPM by pressing the numeric keys successively.
The previously blank line 3 on the default display screen records the user’s new speed input as
depicted in Figure II-17:
RPM: 0.0 SPINDLE: 31
TEMP: 72.1°F PRTN
ENTER NEW RPM: 11_
TORQUE = 0.0 %
Figure II-17
Here, the user intends to enter a speed of 112 RPM, has pressed the “1” key twice and is about
to press the “2” key. If the user makes more than ve (5) key presses, the DV-III Ultra control
program will “roll” the cursor back to the rst character of the eld and begin to overwrite the
previous data entry.
Next the user presses the
Brookeld Engineering Laboratories, Inc. Page 23 Manual No. M98-211-E0912
Brookeld Engineering Laboratories, Inc. Page 23 Manual No. M/98-211-B0104
ENTER key to accept the speed. The motor will begin running at 112 RPM
Page 24

and the display will be updated to the next screen image:
RPM: 112 SPINDLE: 31
TEMP: 72.1°F PRTN
TORQUE = 56.3 %
Figure II-18
If the speed entered was not valid the Rheometer will display the following message:
INVALID DATA ENTRY
"BAD SPEED/TIME"
** RE-ENTER **
Figure II-19
After a few seconds, the display returns to Figure II-17 with the speed data eld cleared and just
the underscore cursor awaiting a new entry.
II.5 External Control
The DV-III Ultra Rheometer can be used in conjunction with Brookeld software, RHEOCALC
(V. 2. or higher). Through RHEOCALC, all rheometer functions are controlled by the computer.
The DV-III Ultra must be set to the external control mode to allow for proper communication with
RHEOCALC. To congure the external control mode, connect computer interface cable DVP-80
(RS-232) or DVP-202 (USB) to the port on the DV-III Ultra base before turning on the DV-III
Ultra. With the DVP-80 cable in place, the DV-III Ultra will present the screen shown in Figure
II-20 when it is turned on. If external control is selected, the DV-III Ultra will display Figure II-21
and only accept control commands from RHEOCALC software.
BROOKFIELD
DV-III ULTRA RHEOMETER
1 = EXTERNAL CONTROL
2 = STANDALONE MODE
Figure II-20
BROOKFIELD
DV-III ULTRA RHEOMETER
V0.0 HA
EXTERNAL
Figure II-21
The DV-III Ultra may be set to stand alone mode by turning it OFF and ON again and selecting
"Stand Alone" or by removing the cable (DVP-80 or DVP-202) prior to turning the DV-III Ultra
on.
Note: The DV-III Ultra cannot communicate with RHEOLOADER or EZ-
Yield software in the external control mode. Choose "Stand Alone"
when presented with Figure II-20 if you want to use RHEOLOADER
or EZ-YIELD.
Brookeld Engineering Laboratories, Inc. Page 24 Manual No. M98-211-E0912
Page 25

II.6 Preventative Maintenance
The DV-III Ultra does not require any internal maintenance or adjustment. Periodic verication
of calibration is an important procedure. We recommend that you check the calibration of
your DV-III Ultra on a regular basis. The frequency of calibration checks should be set based
on your use of the instrument and the signicance of the data. We generally recommend
a frequency of 1 month. See Appendix E - Calibration Check Procedure for information on
performing a calibration check.
Any condition that results in an out of calibration result (see Interpretation of Calibration
Results at the end of Appendix E) must be corrected by Brookeld or our authorized dealers.
Please check our web site for information on our dealers and a Laboratory Return Form;
www.brookeldengineering.com.
Preventative maintenance for the DV-III Ultra consists primarily of good practice when
using the instrument. Please follow the suggestions below.
• Long term storage: When the DV-III Ultra will be out of service for an extended period
of time, use the Instrument Carrying Case in which it was supplied. Be sure to install
the shipping cap.
• When the unit is not in use, place it on the back of the laboratory bench out of the
way of normal activity.
• Be sure that the unit is properly leveled for all measurements (Section I.10; Step 6).
• Periodically check the Tension Screw on the Clamp Assembly of the Upright Rod
Assembly (Appendix G). This screw should be tight enough to prevent the unit from
moving down the rod spontaneously but not so tight as to prevent the operator
from moving the unit with the adjustment knob.
• Keep hands free from test materials to prevent transfer of material to surfaces of
the unit.
• Keep the bottom of the unit housing clean from test samples and debris. The pivot
cup and spindle connection should be clean and free of any material. This will ensure
proper connection of the spindle to the unit and proper rotation of the spindle
(minimize run out).
• Properly clean spindles and sample chambers (optional) after each measurement.
Remove the spindle from the unit prior to cleaning, not doing so may result in the
spindle being bent. Use cleaning solvents that are compatible with 300 series
stainless steel. Do not use abrasive cloths.
• Clean keypad and display screen with a soft dry cloth. Do not use harsh solvents or
abrasive materials.
• Clean instrument surfaces with a soft dry cloth. Solvents may remove factory
paint.
• Wells/Brookeld cone spindles should be handled carefully to prevent scratches to
the measurement surface and nicks on the outer radius. Do not drop the spindle
on the lab bench or oor. We recommend placing a rubber mat in the areas around
the DV-III Ultra when these spindles are in use.
Brookeld Engineering Laboratories, Inc. Page 25 Manual No. M98-211-E0912
Page 26

• Wells/Brookeld sample cups should be handled carefully to prevent scratches or
nicks. Do not use abrasive cleaners or cloths.
• Store all spindles in the protective case in which they were supplied.
• Do not store spindles attached to the unit.
• Periodically inspect all cables for proper connection and damage.
Brookeld Engineering Laboratories, Inc. Page 26 Manual No. M98-211-E0912
Page 27

III. MAKING VISCOSITY AND YEILD MEASUREMENTS
III.1 Quick Start
Viscosity Measurement
The DV-III Ultra Rheometer uses the same methodology for viscosity measurement as the Brookeld
Dial Reading Viscometer and DV series of Digital Viscometers. If you have experience with other
Brookeld equipment, this section will give you the quick steps for taking a viscosity reading. If
you have not used a Brookeld Viscometer before, skip this section and go to Section III.2 for a
detailed description.
A) Assemble and level the rheometer (Section I.10).
B) Turn power on. Select 2 = STANDALONE MODE.
C) Autozero the rheometer (Section II.1).
D) Enter the spindle number using the SELECT SPINDLE key (Section II.3).
E) Introduce the spindle into the sample and attach the spindle to the coupling nut.
NOTE: Left-hand threads.
F) Enter the speed of rotation using the number pad and ENTER key (Section II.4).
G) Record % torque and viscosity.
Yield Measurement
The DV-III Ultra Rheometer uses the same methodology for yield measurement as the Brookeld
YR-1 Rheometer. If you have experience with the YR-1, this section will give you the quick steps
for taking a yield stress reading. If you have not used a Brookeld Viscometer before, skip this
section and go to Section IV.8 for a detailed description.
A) Assemble and level the rheometer (Section I.10).
B) Turn power on. Select 2 = STANDALONE MODE.
C) Autozero the rheometer (Section II.1).
D) Press the PROG key on the rheometer keypad. The rheometer will display the “PROGRAM
MODES” screen as shown in Figure II.20. Press the “4” key to access the Yield Program.
E) Start the EZ-Yield software program on your PC. In the upper right corner of the main screen,
set the instrument setting to “DV-III ULTRA” and the COM port setting to the appropriate
com port.
F) Click on the “Test Parameters” tab beneath the toolbar on your PC screen. Insert values for
the EZ-Yield test parameters as explained in Section I.3 and save the le if required for future
use.
G) Click the download button on the toolbar on your PC screen. The screen on the rheometer
will show “DOWNLOAD COMPLETE, PRESS ANY KEY”.
Brookeld Engineering Laboratories, Inc. Page 27 Manual No. M98-211-E0912
Brookeld Engineering Laboratories, Inc. Page 27 Manual No. M/98-211-B0104
Page 28

H) Press the ENTER button on the rheometer to run the test. The screen will then show “USE
SPINDLE #__”. Conrm that the correct spindle is attached to the rheometer and that the
sample is properly prepared and in position to begin the test. Press the ENTER button to start
the test.
I) After a few seconds, your PC will automatically show the Graphs page in the EZ-Yield software
program, indicating that the test has begun. The DV-III Ultra will send data to the PC and the
graph of the yield stress ow behavior will be captured. The Data page in the software will
record the actual numerical values for shear stress.
J) When the test is complete, a dialog box appears asking you to save the data that was just
acquired.
K) Subsequent tests can be started by either pushing the ENTER button on the DV-III Ultra or
by clicking the RUN button in the EZ-Yield software.
III.2 Preparations for Making Measurements
A) RHEOMETER: The DV-III Ultra should be turned on, leveled and auto zeroed. The level is
adjusted using the three feet on the bottom of the base and conrmed using the bubble on the
top of the head. Adjust the feet until bubble is inside the center target. Set the level prior to
autozero and check the level prior to each measurement.
Proper level is essential for correct operation of the DV-III Ultra.
B) SAMPLE: The uid to be measured (sample) must be in a container. The standard spindles
supplied with the DV-III Ultra (LV (1-4), RV (2-7), or HA/HB (2-7)) are designed to be used
with a 600 ml low form Grifn beaker (or equivalent container with a diameter of 8.25cm).
The same applies to the optional RV1, HA/HB1, and Vane spindles. Many other spindle
systems are supplied from Brookeld with specic sample chambers such as the Small Sample
Adapter, UL Adapter and Thermosel.
Brookeld recommends that you use the appropriate container for the selected spindle. You
may choose to use an alternate container for convenience, however, this may have an effect
on the measured viscosity. The DV-III Ultra is calibrated considering the specied container.
Alternate containers will provide results that are repeatable but not "true."
The LV (1-4) and RV (1-7) are designed to be used with the guardleg attached (see Appendix
F). Measurements made without the guardleg will provide repeatable results but may not
provide "true" results.
When comparing data with others, be sure to specify the sample container and presence/
absence of the guardleg.
Many samples must be controlled to a specic temperature for viscosity measurement. When
conditioning a sample for temperature, be sure to temperature control the container and spindle
as well as the sample.
Please see our publication, "More Solutions to Sticky Problems", for more detail relating to
sample preparation.
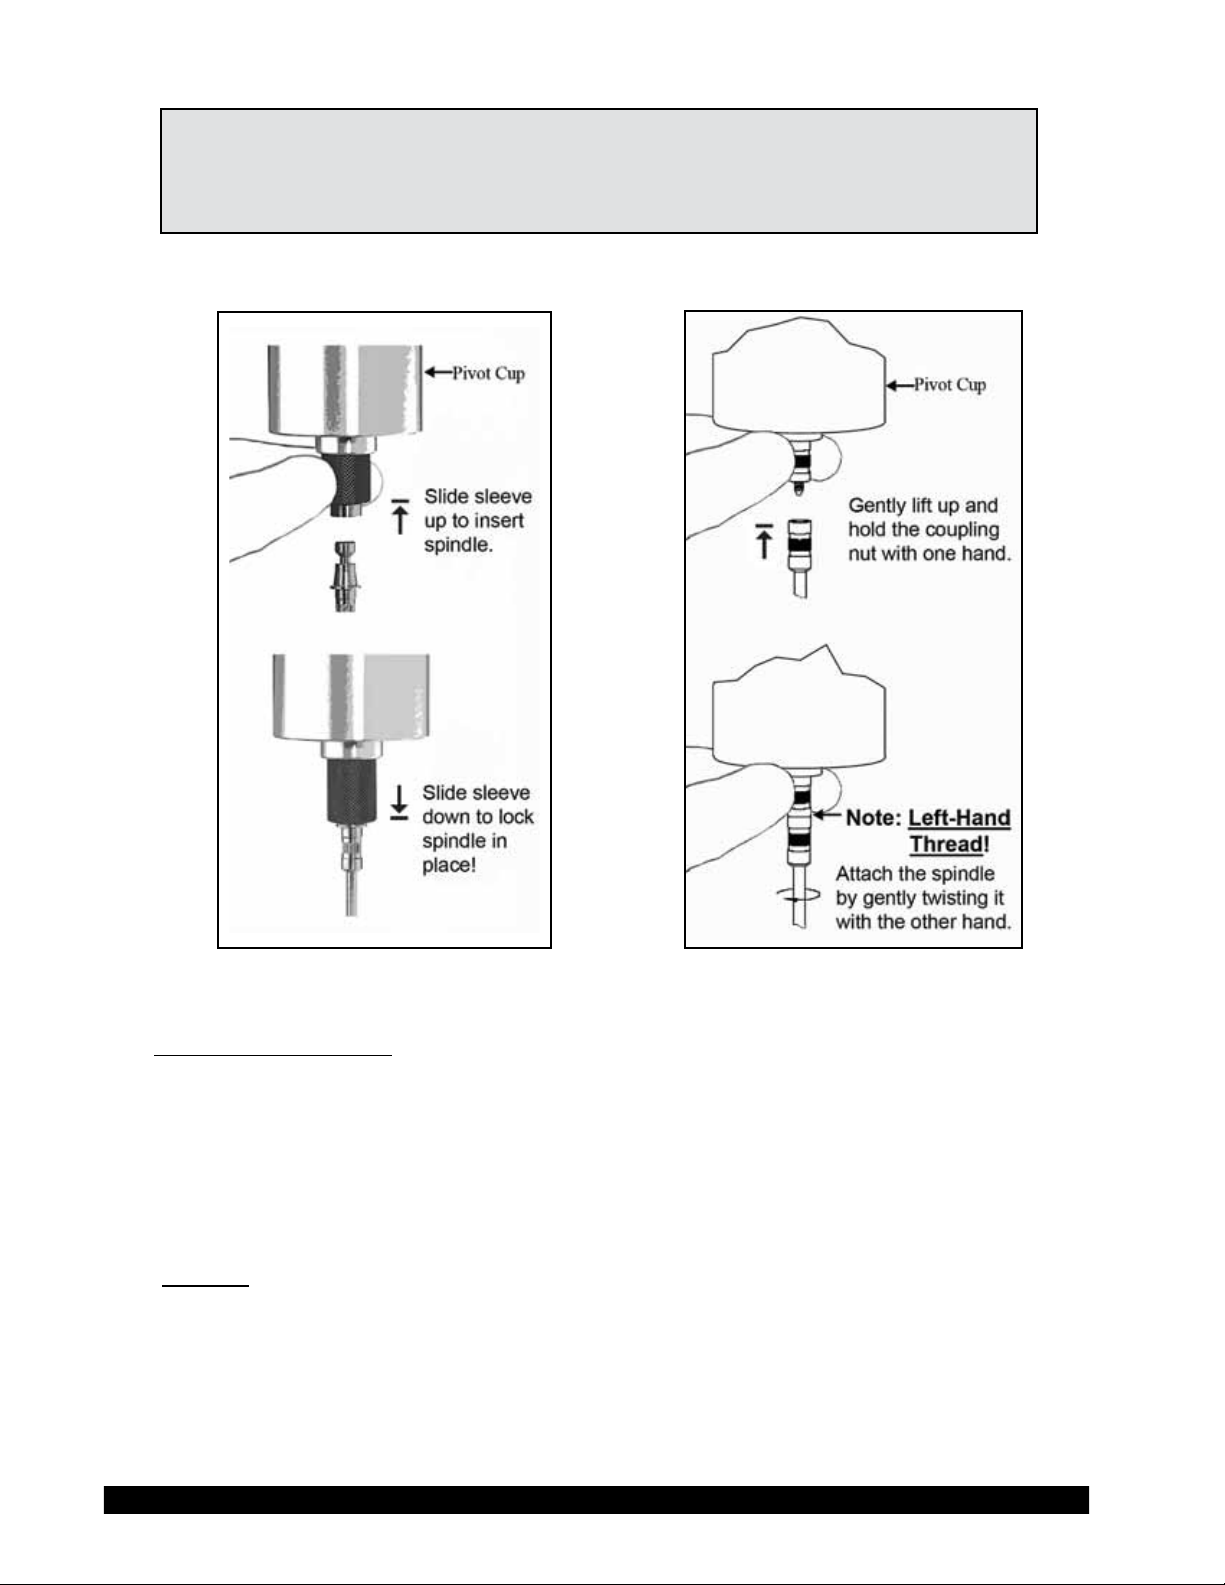
C) SPINDLE ATTACHMENT: The method of spindle connection to the DV-III Ultra is specied
at the time of order as either Standard Threaded Shaft or EZ-Lock. The spindle connection
method may be changed by sending the DV-III Ultra to Brookeld or our authorized agents.
There is an adapter available to convert Standard Threaded Spindles to EZ-Lock Spindles. It
is not possible to use EZ-Lock Spindles on a Standard Threaded Unit.
Brookeld Engineering Laboratories, Inc. Page 28 Manual No. M98-211-E0912
Page 29
Note: If you are using an accessory device such as a Small Sample Adapter,
the complete kit must be congured for the EZ-Lock Unit to ensure
proper alignment and spindle immersion. Contact Brookeld for more
information.
Figures III-1a and III-1b shows the method for both connection systems.
Figure III-1a: EZ-Lock Figure III-1b: Standard Spindle
Standard Threaded Shaft
The spindles are attached to the viscometer by screwing them onto the lower shaft. Note that the
spindles have a left-handed thread. The lower shaft should be secured and slightly lifted with one
hand while screwing the spindle to the left. The face of the spindle nut and the matching surface
on the lower shaft should be smooth and clean to prevent eccentric rotation of the spindle. Spindles
can be identied by the number on the side of the spindle coupling nut.
EZ-Lock
Hold the spindle with one hand while gently raising the spring-loaded outer sleeve to its highest
position with the other hand. Insert the EZ-Lock Spindle Coupling so that the bottom of the coupling
is ush with the bottom of the sleeve, and lower the sleeve. The sleeve should easily slide back
down to hold the spindle/coupling assembly in place for use. [Spindles can be identied by entry
code; look for the number on the side of the EZ-Lock spindle coupling.]
Brookeld Engineering Laboratories, Inc. Page 29 Manual No. M98-211-E0912
Brookeld Engineering Laboratories, Inc. Page 29 Manual No. M/98-211-B0104
Page 30

III.3 Selecting a Spindle/Speed
The DV-III Ultra has the capability of measuring viscosity over an extremely wide range (for example,
the RVDV-III Ultra can measure uids within the range of 100-40,000,000 cP) (see Appendix B).
This range is achieved through the use of several spindles over many speeds. When measuring
yield stress with vane spindles, a broad measurement range is also possible through the choice of
multiple spindles.
The process of selecting a spindle and speed for an unknown uid is normally trial and error. An
appropriate selection will result in measurements made between 10-100 on the instrument %
torque scale. Two general rules will help in the trial and error process.
1) Viscosity range is inversely proportional to the size of the spindle.
2) Viscosity range is inversely proportional to the rotational speed.
In other words: to measure high viscosity, choose a small spindle and/or a slow speed. If the chosen
spindle/speed results in a reading above 100%, then reduce the speed or choose a smaller spindle.
Experimentation may reveal that several spindle/speed combinations will produce satisfactory results
between 10-100%. When this circumstance occurs, any of the spindles may be selected.
Non-Newtonian uid behavior can result in the measured viscosity and yield stress changing if the
spindle and/or speed is changed. See our publication, "More Solutions to Sticky Problems," for
more detail.
When viscosity and/or yield stress data must be compared, be sure to use the same test
methodology: namely the same instrument, spindle, speed, container, temperature and test
time.
III.4 Multiple Data Points
The majority of viscosity and yield stress measurements are made at the quality control level and
often consist of a single data point. The test is conducted with one spindle at one speed. The data
point is a useful bench mark for the go/no-go decision in a production setting. The DV-III Ultra
can be used for single point measurement.
Many uids exhibit a characteristic change in viscosity and yield stress with a change in applied
force. This non-Newtonian ow behavior is commonly seen in paints, coatings and food products
as a decrease in viscosity as shear rate increases or an increase in yield stress as rotational speed
increases. This behavior cannot be detected or evaluated with the single point measurement.
Non-Newtonian ow is analyzed through the collection of viscosity data over a range of shear
rates and the generation of a graph of viscosity versus shear rate (a rheogram). The same applies to
yield stress determination by analyzing torque vs. time behavior at different rotational speeds. This
information will allow for a more complete characterization of a uid and may help in formulating
and production of the product. The DV-III Ultra is capable of collecting multiple data points for
comprehensive analysis of ow behavior. See Section IV on Programming and Analysis.
More information on ow behavior, shear rate and rheograms is available in our publication, "More
Solutions to Sticky Problems."
Brookeld Engineering Laboratories, Inc. Page 30 Manual No. M98-211-E0912
Page 31

IV. PROGRAMMING THE DV-III ULTRA AND DATA COLLECTION
METHODS/ANALYSIS
The programming and data analysis functions of the DV-III Ultra are accessed by pressing the
PROG key on the rheometer. The display will change to present a menu with four choices: DVIII, B.E.V.I.S., Models and Yield as shown in Figure IV-1. DV-III, B.E.V.I.S. and Yield are the
programming alternatives. Models will present the ve math models available for viscosity data
analysis (see IV.7 for more details about Math Models).
PROGRAM MODES
1 = DVIII 3 = MODELS
2 = BEVIS 4 = YIELD
SELECT:_
Figure IV-1
IV.1 Programming Concepts
The DV-III Ultra may be programmed to collect viscosity or yield data without operator involvement.
The captured data may be displayed and analyzed or output to a printer. Programs may be written
using three different methodologies: DV-III, B.E.V.I.S and Yield.
The DV-III Ultra programming technique uses speed/time pairs, when making viscosity measurements,
to control the DV-III Ultra. A program consists of multiple lines (up to 25) instructing the rheometer
to operate at a particular speed for some period of time. As an example, we can instruct the DV-III
Ultra to rotate the spindle at 5 RPM for 30 seconds and then change speed to 10 RPM and wait 20
seconds with the following program:
Step 1 RPM = 5 Time = 00:30
Step 2 RPM = 10 Time = 00:20
A single data point will be collected at the end of each time interval. Complete details on this
programming technique are in Section IV.2.
The B.E.V.I.S. programming technique uses a custom program language to control the DV-III Ultra.
A program consists of a series of commands instructing the rheometer in speed control, time control,
data collection, temperature control, and output. B.E.V.I.S. offers a higher level of rheometer control
compared to the DV-III method. However, the construction of B.E.V.I.S programs is more involved.
The 2-step DV-III program previously described is duplicated using B.E.V.I.S. commands below:
WTI 00:30
PDN
SSN 10
WTI 00:20
PDN
END
SSN 5
The involved programming of B.E.V.I.S. commands is a small trade-off for the signicant increase
in control capability over the DV-III method. Complete details on this programming technique are
in Section IV.3.
The yield programming technique uses three control parameters to run yield tests on the DV-III
Ultra: speed control, time control and torque change between successive data points. Complete
details on this programming technique are in Section IV.
Brookeld Engineering Laboratories, Inc. Page 31 Manual No. M98-211-E0912
Page 32

IV.2 DV-III Speed/Time Pair Programs for Making Viscosity Measurements
This programming method allows the operator to control the DV-III Ultra through the variables of
speed and time. These speed/time pairs instruct the rheometer to operate at a speed of rotation for
a certain period of time. Programs can be created with up to 25 steps. The DV-III Ultra can store
up to 10 programs. Upon completion of a program, the data may be viewed on the DV-III Ultra
display, analyzed or printed to an attached parallel or serial printer.
Two examples of programs are shown below:
Collect Data Over Time Collect Data At Several Speeds
Step RPM Time Step RPM Time
1 100 00:12 1 2.5 01:00
2 100 00:12 2 5 00:30
3 100 00:12 3 10 00:30
4 100 00:12 4 20 00:15
5 100 00:12 5 50 00:15
Five viscosity data points Five viscosity data points will be
will be collected over collected at ve speeds over
one minute. 150 seconds.
This program mode is accessed by pressing the program key and selecting number 1; 1 = DV-III.
The creation, editing and execution of DV-III programs are described in the following sections.
There are two types of test programs:
1) Next Speed Set where the test speeds are programmed, and the operator must signal the DVIII Ultra to change speeds (and therefore take a reading) by pressing the ENTER key.
2) Prog Speed Set where the DV-III Ultra will perform the test automatically.
Each step of a program has two variables - speed and hold time. The reading is taken at the end of the
hold time interval in a Prog Speed Set or when the ENTER key is pressed in a Next Speed Set.
If the rst step hold time interval is 0 seconds, the program is a Next Speed Set type. If the rst
step interval is 1 second or more, the program is a Prog Speed Set type.
S SPEED SET SELECTION AND PROGRAMMING
The DV-III Ultra viscometer allows for the retention of a maximum of 10 speed sets with up to
25 discrete speeds per speed set. The program locations are numbered 0 through 9. These speed
sets are retained in EEPROM memory for those times when the DV-III Ultra is not powered up.
To access a previously programmed speed set or to enter data for a new speed set, the user presses
the “1” key when in the display of Figure IV-1 and is presented with the screen shown in Figure
IV-2:
SPEED SET OPERATIONS
1 = ENTER/EDIT A PGM
2 = CLEAR SPEED SET
3 = USE SPEED SET
Figure IV-2
Brookeld Engineering Laboratories, Inc. Page 32 Manual No. M98-211-E0912
Brookeld Engineering Laboratories, Inc. Page 32 Manual No. M/98-211-B0104
Page 33

At this point, the user may Enter/Edit, Clear or Use a stored program (Speed Set). Let’s start with
Enter/Edit by pressing the “1” key:
SPEED SET USAGE
IN MEM: 012589
AVAIL: 3467
USE SET:_
Figure IV-3
In this example, the user is informed that he has 6 speed sets (0,1,2,5,8,9) pre-programmed in
memory and 4 speed sets (3,4,6,7) not programmed and available. Select any one of the ten speed
sets by pressing the appropriate numeric key. Pressing the MOTOR ON/OFF/ESCAPE key at
this point would exit the user to the default PROGRAM MODES display (Figure IV-1). For
now let’s assume that the user wants to program a new speed set by pressing the “3” key (the rst
available program slot).
ENTERING A SPEED SET PROGRAM
S
There are two (2) types of programs available to the user: programs with nite step time intervals
and programs with zero (0) step time intervals. We will cover the inputting of nite step time
programs rst.
S SPEED SETS WITH FINITE STEP TIMES PROG SPEED
These programs when executed will automatically progress from step to step based on the time
intervals programmed by the user. On pressing the “3” key in Figure IV-3 the user is presented
with:
NEW SPEED SET #3
STEP 01
STEP RPM = 0.0
STEP TIME = 00:05
Figure IV-4
This screen reminds the user of the speed set that he has selected to program and then allows him
to change either the speed or time interval or both for that step.
Note: The time interval on entry to this screen will always be set to 00:05
seconds as the default value. The user may of course change it to any
valid time of his choice. Whenever you change time interval, that new
time becomes the default interval until it is again changed by the user.
Also, note that zero (0) times are not allowed for program steps after
the rst step for Finite Step programs.
The OPTION/TAB key is used for moving from input eld to input eld and the ENTER key to accept
the current input for a step. On entry to this screen, the underscore cursor would be ashing (as
shown) under the rst digit of the step RPM. Use the numeric keys to make changes to the step
speed, repeating the input as many times as required until satised.
Brookeld Engineering Laboratories, Inc. Page 33 Manual No. M98-211-E0912
Page 34

When satised with the speed input, press the OPTION/TAB key which moves the ashing cursor
down to the rst character of the time eld. The same procedure is used here to input the step time
as was used to enter the RPM above. Speed or time data that is out of range, as dened by Table
II-1, will result in the following screen:
INVALID DATA ENTRY
"BAD SPEED/TIME"
** RE-ENTER **
Figure IV-5
This screen will be displayed for 1-3 seconds.
When ready, the user may press the
PROG RUN key to display the data for the next step in the
program, or the MOTOR ON/OFF/ESCAPE key (whereby none of the changes up to that point will be
accepted) to return to the screen of Figure IV-3. To end a program, the user simply enters and
accepts a step RPM and Time of zero (0) or continues to input step data until the program reaches
the twenty-ve (25) step program limit. In either case, the following screen will be displayed:
PROGRAM #3 COMPLETE
1 = ENTER/EDIT A PGM
2 = CLEAR SPEED SET
3 = USE SPEED SET
Figure IV-6
To use the currently selected speed set, press the “3” key in Figure IV-6. This would immediately
revert to the default screen modied as follows:
RPM: 0.0 SPINDLE:
TEMP: 72.1°F PRTO
SPEED SET 3 SELECTED
TORQUE = 00.0 %
Figure IV-7
Note: If at this point, prior to using the program the user wished to enter a
direct speed, a press of any numeric key which would result in a display
similar to Figure II-17. At the completion of the direct speed input, the
display would revert to Figure IV-7 above with the appropriate RPM
displayed, and the viscometer running at that speed.
The program is initiated by pressing the PROG RUN key. See "Using Pre-programmed Speeds."
S
SPEED SETS WITH ZERO STEP TIMES
These programs when executed will require that the user press the
ENTER key to progress from step
to step. On pressing the “3” key in Figure IV-3 the user is presented with the same screen that he
saw in the above description for nite step programs:
NEW SPEED SET #3
STEP 01
STEP RPM = 0.0
STEP TIME = 00:05
Figure IV-8
Brookeld Engineering Laboratories, Inc. Page 34 Manual No. M98-211-E0912
Brookeld Engineering Laboratories, Inc. Page 34 Manual No. M/98-211-B0104
Page 35

The user inputs his step RPM exactly as he did for nite step time programs above. However,
for time, input 00:00 and press the ENTER key. From this point forward, the user will only be able
to enter speeds since each press of the ENTER key will advance him to the next step. The OPTION/
TAB key will not be required. If the user wishes to correct the speed input, continue to press the
numeric/decimal point keys until satised. To correct a speed after pressing the ENTER key for that
step, wait until the program is complete and then edit the program to correct the mistake. To end
a program, simply enter and accept a step RPM of zero (0) or continue to input step data until the
program reaches the twenty-ve (25) step program limit. Speed restrictions/limits are the same as
for the description just above as are the error messages.
S EDITING A SPEED SET PROGRAM
This item is used to review a just-entered program or to review/modify (edit) a program already
stored in a memory slot. Entry to this method would typically be from Figure IV-3 after selecting
an “IN MEM” program slot or by pressing the “1” key in Figure IV-2 having just nished entering
a program. In either case, the user is presented with:
REVIEW SPEED SET #3
STEP 01 OF 03
STEP RPM = 10.0
STEP TIME = 00:05
Figure IV-9
Operation in this mode is exactly the same as for entering a new speed set; all key actions and speed
and time limits are the same. At this point, the user may continue to review/modify the speeds
comprising speed set #3 or elect to print a listing of the speeds in this speed set. To accomplish
this, the user must be in the program Enter/Edit mode; have selected or programmed a speed set
which contains more than two (2) speeds, and then press the
PRINT key. If all is well (i.e. satised
the above requirements) the rheometer will display:
PRINT SPEED SET #3
READY PRINTER THEN
PRESS PRINT KEY.
Figure IV-10
This message simply asks the user to make sure the printer is ready (it’s on-line and has paper in it)
and then awaits for the PRINT key to be pressed. When it is pressed, the DV-III Ultra will send
the following data to the attached printer:
S
FOR SPEED SETS WITH FINITE STEP TIMES
Program Use: _________________________________________________________
Programmer: _________________________________________________________
BROOKFIELD DV-III+ RHEOMETER — DATA FOR SPEED SET #9
SPEED #01 RPM = 2.5 TIME INTERVAL = 00:05
SPEED #02 RPM = 5.0 TIME INTERVAL = 00:05
SPEED #03 RPM = 10.0 TIME INTERVAL = 00:05
SPEED #04 RPM = 20.0 TIME INTERVAL = 00:05
SPEED #05 RPM = 50.0 TIME INTERVAL = 00:05
Brookeld Engineering Laboratories, Inc. Page 35 Manual No. M98-211-E0912
Page 36

S FOR SPEED SETS WITH ZERO STEP TIMES
Program Use: _________________________________________________________
Programmer: _________________________________________________________
BROOKFIELD DV-III+ RHEOMETER — DATA FOR SPEED SET #8
SPEED #01 RPM = 10.0 TIME INTERVAL = 00:00
SPEED #02 RPM = 20.0 TIME INTERVAL = 00:00
SPEED #03 RPM = 30.0 TIME INTERVAL = 00:00
SPEED #04 RPM = 40.0 TIME INTERVAL = 00:00
Since speed sets can contain twenty-ve (25) separate speeds, printing the speeds that comprise a
speed set will be of great help in allowing the user to fully exercise the power of the DV-III Ultra.
After the printing is complete, the user will be returned to the display of Figure IV-9.
S
CLEARING A SPEED SET FROM MEMORY
Since 10 speed sets can be retained in memory, the user may eventually use all the available speed
set slots. The user may also have programmed speed sets that are no longer required and would
like to remove. Assume that the user had programmed a new speed set #3 above. If he wished to
permanently remove that new speed set, or any other IN MEMORY speed set he would, while in
the screens of Figure IV-2, press the “2” key and be presented with:
CLEAR SPEED SET
IN MEM:0123589
IN USE:3
CLEAR SET:_
Figure IV-11
This screen advises that there are 7 speed sets in memory; speed set #3 is in use and that the DV-III
Ultra is awaiting input for the speed set to delete.
Note: If no speed set is in use the word “NONE” will appear next to the IN USE: prompt.
At this point, the user has two options:
1. Pressing the MOTOR ON/OFF/ESCAPE key will exit from this screen and no speed sets
will be cleared. Or
2. Pressing any of the keys “0”, “1”, “2”, “3”, “5”, “8”, or “9” will delete that speed set.
Thus, to discard speed set #5, the user would press the “5” key and be presented with:
DELETE SPEED SET 5
ARE YOU SURE?
1 = YES 3 = NO
Figure IV-12
Brookeld Engineering Laboratories, Inc. Page 36 Manual No. M98-211-E0912
Brookeld Engineering Laboratories, Inc. Page 36 Manual No. M/98-211-B0104
Page 37

In which the DV-III Ultra is requesting that the user specically press the “1” key in order to delete
the desired speed set.
CLEAR SPEED SET
IN MEM:012389
IN USE:3
CLEAR SET:_
Figure IV-13
Pressing the “3” key will cause the DV-III Ultra to take no action and will return the user to the
CLEAR SPEED SET opening screen, Figure IV-11. Any attempt to delete an in-use speed (“3”
for instance) will cause the DV-III Ultra to issue a “beep beep” with no action being taken. Thus
no active (i.e. selected for use) program can be deleted from this screen.
USING PREPROGRAMMED SPEEDS
S
Pressing the three (3) key from Figure IV-2 takes the user to the speed set selection screen of Figure
IV-3 where the user selects a new speed set. That done the user is sent to the default screen with:
“SPEED SET X SELECTED” displayed on line three (3) of the screen.
The user initiates the use of programmed speeds by pressing the
PROG RUN key. If the user presses
the PROG RUN key with no speed set selected, the following error box will be displayed:
** ERROR **
A SPEED SET HAS NOT
BEEN SELECTED
PRESS ANY KEY
Figure IV-14
However, we will assume at this point that we have selected speed set #2 for use in the ensuing
data gathering operations. To initiate the use of this speed set (with nite step times or with zero
step times), the user presses the
PROG RUN key and is presented with a start/end step input screen
as shown next:
SPEED SET #2
TOTAL STEPS = 13
START STEP: 01
END STEP: 13
Figure IV-15
If the user had not previously entered start and end steps, this screen will display 01 for the start
step, and the last program step (13 in this case) as the end step. The user could elect to use the entire
speed set at this point by pressing the
PROG RUN key. If the user had previously selected a start and
end step, those values would be displayed upon entry to this screen instead of the program limit
values as shown above. However, while a speed set can contain up to 25 separate speeds, the user
may be in a situation where only a few contiguous steps may be required. Therefore, this screen
allows for the option of entering the range of speeds encompassed by the start step (not necessarily
the rst step) and the end step (not necessarily the last step). Pressing any numeric key at this
point will erase the currently displayed start step and substitute the new value. The user may select
a start step less than the end step ( a so-called Up Ramp) or a start step greater than the end step
( a so-called Down Ramp). Any attempt to enter a start or end speed not contained in the speed
set will result in the following display:
Brookeld Engineering Laboratories, Inc. Page 37 Manual No. M98-211-E0912
Page 38

INVALID DATA ENTRY
"BAD STEP INPUT"
** RE-ENTER **
Figure IV-16
The
ENTER key is used to step from the start step entry to the end step entry. Repeated pressing
of the ENTER key will allow the user to move back-and-forth between the start and end entries and
change them as required until the correct start and end step values have been entered. The selected
speed set, and the start and end steps values entered, will be retained in EEProm memory for use
the next time the viscometer is powered up in the stand-alone mode. Pressing the OPTION/TAB key
at this point results in the following screen display:
LOCKOUT OPTIONS
1 = Enable Lockout
3 = Disable Lockout
Figure IV-17
S LOCKOUT OPTIONS
Pressing the “1” key locks out any use of the NUMERIC keys, and the PROGRAM, SELECT
SPINDLE and OPTIONS/TAB keys. Pressing the “3” key would disable an existing lockout
condition only when in the LOCKOUT OPTIONS screen, Figure IV-17. After pressing the “1” or
“3” keys the user would be returned to the display of Figure IV-15. From Figure IV-15 the user
runs the program by pressing the PROGRAM RUN key which signies that the user is satised
with his start and stop step values, and wishes to start running with the selected speed set. Or, he
can return to the default screen of Figure II-3 by pressing the MOTOR ON/OFF/ESCAPE key.
(Note: the OPTIONS/TAB key is re-enabled at this point only to allow the user to return to the
LOCKOUT OPTIONS screen). In either case, if the user has enabled the lockout mode, the top
line of the default display will change as shown in Figure IV-18 below:
RPM: 0.0 LK SPDL:31
TEMP: 72.1°F PRTO
SPEED SET 2 SELECTED
TORQUE = 00.0 %
Figure IV-18
The “LOCKOUT” condition will remain in effect until the user re-starts the program mode by
pressing the
PROGRAM RUN key re-initiating the steps of Figures IV-15 through IV-18 above.
Once the start and end steps have been selected, the program is started by pressing the PROG
RUN key. However, if the viscometer motor was not turned on, the following message would be
displayed:
MOTOR MUST BE TURNED
ON PRIOR TO RUNNING
PROGRAMMED SPEEDS.
Figure IV-19
At this point, the user would turn the viscometer motor on by pressing the MOTOR ON/OFF/ESCAPE
key. This will cause the viscometer to start running at the rst selected program speed.
Brookeld Engineering Laboratories, Inc. Page 38 Manual No. M98-211-E0912
Brookeld Engineering Laboratories, Inc. Page 38 Manual No. M/98-211-B0104
Page 39

S USING PROGRAMMED SPEEDS WITH A ZERO TIME INTERVAL
Assume the following:
• A speed set has been selected.
• A subset of the speed set has not been selected. (i.e. we will use the entire set of speeds)
• The speed set included a time interval that was equal to zero minutes and zero seconds.
• Print mode has been set to non-continuous mode (i.e. output will be sent to the printer only
when the user presses the ENTER key).
With the above items in effect our default display screen will appear as follows after the PROGRAM
steps have been completed:
RPM:112 SPINDLE:31
TEMP:72.1°F PRTN
SET 2 01-12@02 ENTER
TORQUE = 56.3 %
Figure IV-20
Or, if the user had selected the LOCKOUT option, the default screen above would appear as in
Figure IV-21 below:
RPM:112 LK SPDL:31
TEMP:72.1°F PRTN
SET 2 01-12@02 ENTER
TORQUE = 56.3 %
Figure IV-21
Here, the LOCKOUT mode is indicated by the revision to the top line of Figure IV-21 where
“SPINDLE” has been contracted to “SPDL” and the two-letter combo: “LK” is being used to
indicate the “LOCKOUT” condition. Please note that while TORQUE is presently being displayed,
there is nothing to prevent the user from pressing the
SELECT DISP key to change the data display
item.
The item to note here is the message being displayed on line 3 informing the user that the program is
at speed #02 of the 12 speeds comprising speed set #02. The DV-III Ultra will continue to operate
at 112 RPM until the ENTER key is pressed. At that point (pressing the ENTER key), two distinct
events will occur:
1. The DV-III Ultra will ramp up (or down) to programmed speed #03 and,
2. Since the printer is On (PRNT), the data corresponding to the last speed (112 RPM) that
existed at the time the ENTER key was pressed will be sent to the attached printer.
Thus, if 12 speeds comprised the selected speed set, then the user would be required to press the
ENTER key 12 times to exercise the entire speed set. After the last speed has been executed (i.e.
the user pressed the ENTER key for the twelfth time), the viscometer speed will be set at ZERO
RPM and the following message will be displayed:
PROGRAM COMPLETE
PRESS EITHER
ENTER OR PROGRAM RUN
Figure IV-22
Brookeld Engineering Laboratories, Inc. Page 39 Manual No. M98-211-E0912
Page 40

Pressing the ENTER key would return the user to the default screen, as depicted in Figure IV-21, or
to the program start and stop limit selections of Figure IV-15 if the PROG RUN key is pressed.
S USING PROGRAMMED SPEEDS WITH A NONZERO TIME INTERVAL
Assume the following:
• A speed set has been selected.
• A subset of the speed set has not been selected. (i.e. we’ll use all of the speeds in the speed
set)
• The speed set included a time interval that was greater than zero (0) minutes and zero (0)
seconds.
• Print mode has been set to non-continuous mode (i.e. output will be sent to the printer only
when the user presses the ENTER key).
With the above items in effect our default display screen will appear as follows after the program
steps have been completed:
RPM:112 LK SPDL:31
TEMP:72.1°F PRTN
SET 2 01-12@02 PROG
TORQUE = 56.3 %
Figure IV-23
The difference between this mode and the zero time interval mode is reected in the message being
displayed on line three of the display where PROG has replaced ENTER indicating that the program
will be executed step-by-step without user intervention. Here the user is again informed that he is
at speed #02 of the 12 speeds comprising speed set #02. As the programmed time interval elapses,
the following will occur:
• The DV-III Ultra will ramp up (or down) to programmed speed #03 and,
• The data corresponding to the last speed (speed #02) that existed at the moment the step
time elapsed will be sent to the printer since the printer is ON (PRTN) (The automatic
ramping to the next speed will be interpreted by the DV-III Ultra as if the ENTER key
had been pressed, causing the printer output).
• At the completion of the speed set, the viscometer speed will be set at ZERO RPM
After the last speed has been executed, the viscometer speed will be set at ZERO RPM and the
following message will be displayed:
PROGRAM COMPLETE
PRESS EITHER
ENTER OR PROGRAM RUN
Figure IV-24
Pressing the
in Figure IV-23, or to the program start and stop limit selections of Figure IV-15 if the
ENTER key would return the user to the default screen, as depicted in its general form
PROG RUN
key is pressed.
Brookeld Engineering Laboratories, Inc. Page 40 Manual No. M98-211-E0912
Brookeld Engineering Laboratories, Inc. Page 40 Manual No. M/98-211-B0104
Page 41

Had the user selected a subset of a speed set (Figure IV-15), say speeds #04 through #08, then the
programmed mode (with a non-zero time interval) would result in the following display:
RPM:112 LK SPDL:31
TEMP:72.1°F PRTN
SET 2 04-08@04 PROG
TORQUE = 56.3 %
Figure IV-25
Here, the user is informed that speed set #2 is being used starting with speed number four and
ending at speed #08 while currently executing speed #04. After the rst speed (number #04) is
completed, the display would be updated to show the new speed and the step display would now
reect the current executing step number as in Figure IV-26 below.
RPM:120 SPINDLE:31
TEMP:72.1°C PRTO
SET 2 04-08 @05 PROG
TORQUE = 72.8 %
Figure IV-26
If the speed set contained no time interval, the selection of a subset of speeds would result in a
screen display as shown in Figure IV-27.
RPM:112 LK SPDL:31
TEMP:72.1°F PRTN
SUB 2 04-08@04 ENTER
TORQUE = 56.3 %
Figure IV-27
The step number would be incremented each time the user pressed the
speed corresponding to step #04 was executing. If the user presses the
ENTER key. Assume that the
ENTER key, our display will
be updated as shown in Figure IV-28.
RPM:120 LK SPDL:31
TEMP:72.1°F PRTN
SUB 2 04-08@05 ENTER
TORQUE = 72.8 %
Figure IV-28
S PROGRAMMED SPEED STOP
The user may stop program mode operation at any time by pressing the MOTOR ON/OFF/ESCAPE key
anytime during program operation. The following message would be displayed:
PROGRAM STOPPED
PRESS ANY KEY
Figure IV-29
Brookeld Engineering Laboratories, Inc. Page 41 Manual No. M98-211-E0912
Page 42

The viscometer motor would be automatically turned OFF and the default screen display (Figure IV-
18) would show zero (0.0) RPM. At this point, the user may perform any valid viscometer operation
- load a new speed set; run a direct speed; set alarms or even re-start the current program.
PROGRAMMED SPEED HOLD
S
The user may interrupt program mode operation at any time by pressing the PROG key during
program execution. The following message would be displayed:
PROGRAM HOLD
1 = CONTINUE PROGRAM
3 = STOP PROGRAM
Figure IV-30
The viscometer motor would be automatically turned OFF and the DV-III+ would be awaiting user
key input. If the user presses the “1” key, the DV-III Ultra will continue executing the current
program, picking up from whichever RPM (and time, if applicable) it had been interrupted.
However, if the user had pressed the “3” key, operation would be identical to that described above
for Programmed Speed Stop mode.
IV.3 Bevis Programs for Making Viscosity Measurements
The B.E.V.I.S. Programming Method allows the operator to control the DV-III Ultra through the
variables of speed, temperature and time while providing for independent data collection. Programs
can include up to 25 commands with a maximum data count of 800. The DV-III Ultra can store
up to 10 programs. Upon completion of the program the data may be viewed on the DV-III Ultra
display, analyzed or printed to an attached parallel or serial printer.
B.E.V.I.S. programs are created on a PC using Rheoloader software (supplied with the DV-III
Ultra). The programs are "loaded" onto the DV-III Ultra. Loaded programs cannot be deleted,
but can be overwritten.
IV.3.1 Setting Up B.E.V.I.S. Programs
B.E.V.I.S. (Brookeld Engineering Viscometers Instruction Set) is a scripting language developed
at Brookeld Engineering Laboratories that allows for the creation of exible programs to control
our line of Rheometers. In the case of the DV-III Ultra Rheometer, programs are created then loaded
into the Rheometer using the RheoLoader software.
Some features of the scripting language are:
• Repeatedly run the same program for quality control purposes.
• Wait for a prevailing condition before continuing with the program (i.e. torque value, a
temperature value, a key press, etc.).
• Run the Rheometer at any of the speeds in the Custom Speed menu.
• Display messages to the screen or an attached printer to aid in operator usability.
Brookeld Engineering Laboratories, Inc. Page 42 Manual No. M98-211-E0912
Brookeld Engineering Laboratories, Inc. Page 42 Manual No. M/98-211-B0104
Page 43

• An internal clock that keeps time between each printed data line (this time is displayed as
the last parameter on each printed line) providing a consistent time base for the collected
data.
IV.3.1.1 Description of B.E.V.I.S. Commands
Command Code Required Parameter Command Description
WTI Time (MM:SS) The program waits at this step until the specied time elapses.
WPT % Torque value The program waits at this step until the current % torque equals the
(%) specied value.
WTP Temperature value The program waits at this step until the current temperature equals the
(°C) specied value.
WKY 16 character (or less) The specied message is displayed on the top line of the DV-III Ultra dis
text message play while PRESS A KEY is displayed on the bottom line of the DV-III
Ultra. The program waits at this step until a viscometer key is pressed.
While waiting at this step, the viscometer produces a beep every few
second to remind the operator that a keypress is required to continue. If
a print interval was enabled (see SPI) at the time this command is
executed, the data print timer continues to count up. If the print interval
elapses and a key has not yet been pressed, a line of data displaying the
time since the last data print is printed as soon as a key is pressed.
SSN Speed value The DV-III Ultra begins rotating at the specied speed. This can be any
(RPM) of the speeds listed in the Speed list of the DV Loader software. These
speeds are the same as those listed in the Custom Speeds list in the
viscometer’s Options menu.
SPI Time The DV-III Ultra begins printing data to the selected printer (serial or
(MM:SS) parallel; as selected in the DV-III Ultra menus) at the rate specied.
MM:SS is minutes:seconds.
SSP Two digit spindle code Calculations of viscosity, shear stress, and shear rate are performed
based on the specied spindle code. This command overrides the
spindle currently entered via the keypad on the DV-III Ultra.
STM Temperature value Set and control to the specied temperature if a Brookeld
Engineering Labs. temperature controller is attached to the rheometer.
STZ N/A Sets the data print timer clock back to zero.
PDN N/A The DV-III Ultra immediately prints a data string to the selected printer
(serial or parallel; as selected in the DV-III Ultra menus).
PLN 16 character (or less) The DV-III Ultra prints the specied message to the selected printer
text message (serial or parallel; as selected in the DV-III+ menus).
NOTE: MM:SS is minutes:seconds
By using various combinations of the above commands, programs are created that automatically control
the viscometer and collect data (via an attached printer) from the DV-III Ultra Rheometer.
Brookeld Engineering Laboratories, Inc. Page 43 Manual No. M98-211-E0912
Page 44

The RheoLoader software is a Windows 95 (or above) based
program used to create, save, print and download B.E.V.I.S.
programs to the DV-III Ultra Rheometer. Start the software by
clicking on its associated icon or by clicking the Start button;
select Run; enter the name of the program to execute
{Rheoad.exe}; then click OK.
This is the grid where the operator programs are created. It
is used to view and edit the B.E.V.I.S. programs. When the
software starts, an empty grid appears on the left of the screen.
Highlight a command in the list box to the right of this grid,
then click on the Insert button to insert the command into the
highlighted line of the grid. This same insertion task can also be
accomplished by double-clicking on the appropriate command
in the list box to the right.
Before being permitted to insert another command, the parameter
for the previous command in the grid must be entered if one
is required. This parameter is entered into the last column of
the grid.
Select the COM (RS-232) port the Programmable DV-III Ultra Rheometer is connected
to from the COM Port drop down list. Low number generally represent RS-232 Ports.
High number generally represent USB Ports.
The refresh button is used if all ports are not visible.
Click the Open File button to load existing B.E.V.I.S. programs.
Click the Save File button to save the B.E.V.I.S. program displayed in the grid.
Click the Print button to print the B.E.V.I.S. program displayed in the grid.
Click the Insert button to insert the B.E.V.I.S. command selected in the Commands
box into the selected row in the program grid.
Brookeld Engineering Laboratories, Inc. Page 44 Manual No. M98-211-E0912
Brookeld Engineering Laboratories, Inc. Page 44 Manual No. M/98-211-B0104
Page 45

Click the Delete button to delete the command in the selected row of the program
grid.
Click the Up button to move the command in the selected row of the program grid up
one row.
Click the Down button to move the command in the selected row of the program
grid down one row.
Click the Clear button to clear the grid of all commands. Once cleared, the
commands cannot be retrieved.
This list box displayed the commands available for
creating programs. As previously stated, clicking on the
Insert button inserts the highlighted command (WTI in this
case) into the selected line in the program grid. Doubleclicking on a line in this list box also inserts the command
into the grid.
The icons to the left of the command descriptions indicate
the type of command:
A command to wait for a condition.
A command to set a program parameter.
A command to send information to an attached
printer.
Figure IV-31
Before downloading a program to the Rheometer, ensure the following have been checked:
• The appropriate cable (BEL Part No. DVP-80 or DVP-202) is connected between the selected COM port/USB of the PC and the Rheometer.
• The DV-III Ultra is at the download screen: OPTIONS/DOWNLOAD A PROGRAM/
LOAD TO SLOT#x where x is slot 1,2,3, or 4.
• With the LOAD TO SLOT #x screen displayed, choose a store slot using the DV-III Ultra
arrow keys, then press the ENTER/AUTORANGE key on the Rheometer. If after ve sec-
onds, the Rheometer cannot communicate with the RheoLoader program, the B.E.V.I.S.
Brookeld Engineering Laboratories, Inc. Page 45 Manual No. M98-211-E0912
Page 46

ERROR NO PC ATTACHED message is displayed. If a connection is established, the
Download button on the PC software becomes enabled, and the DV-III Ultra screen displays
DOWNLOADING B.E.V.I.S. PROGRAM TO SLOT #1. Click on this button to download
the displayed program to the DV-III Ultra. When the download is complete, the DV-III Ul-
tra displays DOWNLOAD DONE TO EXIT PRESS A KEY.
At this point, the program in the DV-III Ultra can be printed and/or run from the Rheometer.
Click on this button to exit the RheoLoader software.
IV.3.1.2 Example Programs
The following example programs can also be found on the RheoLoader disk that was included
with the DV-III Ultra Rheometer:
Program 1: Pre-shear
Command Command Description Parameter Comments
PLN Print text now Preshearing now print user message
SSN Set viscometer speed 50.0 run at 50 RPM
WPT Wait for % torque 90.0 wait until 90% torque is reached
PLN Print text now Collecting data print user message
SPI Set print interval 00:10 begin printing data at 10 second
intervals
SSN Set viscometer speed 10.0 run at 10 RPM
WTI Wait for time interval 01:40 wait at this step for 1 minute and
40 seconds, effectively printing 10
data lines
Program 2: For use with an external temperature controller
Command Command Description Parameter Comments
STM Set temperature 40.0 Set control value to 40°C
WTP Wait for temperature 40.0 wait until temperature = 40°C
(as an example, a
Thermosel/Controller can be
used for temperature control)
WTI Wait for time interval 05:00 soak time; allow temperature to
settle
SSN Set viscometer speed 25.0 run at 25 RPM
SPI Set print interval 00:30 begin printing data at 30 second
intervals
WTI Wait for time interval 06:00 wait at this step for 6 minutes,
effectively printing 12 data lines
Program 3: Wait for cure
Brookeld Engineering Laboratories, Inc. Page 46 Manual No. M98-211-E0912
Brookeld Engineering Laboratories, Inc. Page 46 Manual No. M/98-211-B0104
Page 47

Command Command Description Parameter Comments
SSP Set spindle 31 set to a number 31 spindle
SSN Set viscometer speed 100.0 run at 100 RPM
SPI Set print interval 00:05 begin printing data at 5 second
intervals
WPT Wait for % torque 85.0 wait until % torque = 85; a curing
cycle
Program 4: Spring relax
Command Command Description Parameter Comments
WKY Wait for a key press Wind to 100% tell operator to wind spindle
until 100% torque is reached
WPT Wait for % torque 100.0 wait until 100% torque is reached
WKY Wait for a key press Release spindle tell operator to release the spindle
SPI Set print interval 00:01 begin printing data at 1 second
intervals
WPT Wait for % torque 0.0 wait for spindle to completely
unwind to 0% torque
Program 5: Variable speed
Command Command Description Parameter Comments
SSN Set viscometer speed 50 run at 50 RPM
WTI Wait for time interval 00:10 wait for 10 seconds
PDN Print data point now print one data point
SSN Set viscometer speed 10 run at 10 RPM
WTI Wait for time interval 00:10 wait for 10 seconds
PDN Print data point now print one data point
SSN Set viscometer speed 20 run at 20 RPM
WTI Wait for time interval 00:10 wait for 10 seconds
PDN Print data point now print one data point
SSN Set viscometer speed 50 run at 50 RPM
WTI Wait for time interval 00:10 wait for 10 seconds
PDN Print data point now print one data point
IV.3.2 Running B.E.V.I.S Programs in Standalone Mode
The B.E.V.I.S. program menu is accessed by pressing the PROG key and selecting number 2,
2 = B.E.V.I.S. The loading and execution of B.E.V.I.S. programs are described in the following
sections.
Brookeld Engineering Laboratories, Inc. Page 47 Manual No. M98-211-E0912
Page 48

S B.E.V.I.S. PROGRAMS MENU
B.E.V.I.S. operations are accessed by pressing the “2” key when in the PROGRAM MODES
menu. The user is immediately presented with:
B.E.V.I.S. PROGRAMS
PROGRAM #3 IS IN USE
1 = SELECT/DOWNLOAD
2 = RUN
Figure IV-32
This screen informs the user that the B.E.V.I.S. program in storage slot 3 is current (“last used”)
and that it may be run by pressing the “2” key or another program may be selected by pressing
the “2” key. It should be noted that entrance to the B.E.V.I.S. program mode makes the last used
program available for printing or running. Thus the user, seeing that a program was resident in slot
3, could have printed it directly from the above screen by pressing the front panel
PRINT key.
S SELECTING AND DOWNLOADING B.E.V.I.S. PROGRAMS
To select a program the user presses the “1” key and is presented with:
SELECT A PROGRAM
AVAILABLE: 56789
IN MEMORY: 01234
CURRENT: 3
Figure IV-33
The user is informed that the current (or “last used”) program is no. 3; that programs 0, 1, 2, 3 and
4 are available for immediate use and that ve (5) slots: 5, 6, 7, 8 and 9 are empty and are available
for download from a host computer. A press of the
ENTER key would select the current program (i.e.
“3”) for use while a press of an appropriate numeric key 0,1,2,3 and 4 would select that specic
program slot for use. The above screen would be updated to reect the new selection. A press of
the 5, 6, 7, 8 or 9 keys will place the user in the B.E.V.I.S. program download mode. The following
screen appears (assuming a press of the “5” key):
DOWNLOAD A PROGRAM
LOAD PGM TO SLOT #5
PRESS ENTER TO START
Figure IV-34
The user’s selection “5” is ashing and is the current slot selection. When ready, the user presses
the
ENTER key to begin the program download. The following screen will appear for the duration
of the download. See Section VI. RHEOLOADER for information on creating and downloading
B.E.V.I.S. programs.
DOWNLOAD A PROGRAM
DOWNLOADING BEVIS
PROGRAM TO SLOT #2
Figure IV-35
Brookeld Engineering Laboratories, Inc. Page 48 Manual No. M98-211-E0912
Brookeld Engineering Laboratories, Inc. Page 48 Manual No. M/98-211-B0104
Page 49

Programs are run by pressing the “2” key when in Figure IV-32 which presents the user with the
following screen:
B.E.V.I.S. PROGRAMS
RUN PROGRAM #3
PRESS ENTER TO START
Figure IV-36
Here we see that our program is no. “3” and that a press of the
ENTER key will start it running. As
soon as the program starts executing the user will be presented with:
RUNNING PROGRAM #3
THIS STEP: WTI0330
NEXT STEP: PDN
STEP 02/39 01:00
Figure IV-37
This is a typical display for a given program step. The current step being executed (WTI0330)
is shown as well as the next step to be executed (PDN). The bottom line displays the current
program step, the total number of steps (02/39) and any time intervals if they are relevant. The
WKY command message could be displayed on the bottom line in lieu of the step and time info.
This screen stays resident until the user presses the
OPTIONS/TAB key which “toggles” back-and-
forth between this screen and an amended default screen shown next:
RPM:0.0 SPINDLE:31
TEMP:72.1°C PRTN
BEVIS PROG RUNNING
TORQUE = 00.0 %
Figure IV-38
The user now sees viscosity data and can use the
measurement parameters. Pressing the
OPTIONS/TAB key from now on will toggle between the
SELECT DISPLAY key to view other viscosity
screens of Figure IV-37 and Figure IV-38. The program code will automatically switch back to
the program progress screen, Figure IV-37 above, if a conditional has been reached, the end of
a program step is reached or user input is required. If no user input is required, the B.E.V.I.S.
program proceeds to the next step without switching back to the progress screen.
IV.4 Choosing the Best Data Collection Method for Viscosity Tests
The DV-III Ultra offers 3 methods for data collection; Single Speed, DV-III Speed/Time Pairs
and B.E.V.I.S. Programs. The decision of which technique is best should be made considering
the test requirements.
SINGLE SPEED
S
Single speed measurements may be made by direct speed commands on the DV-III Ultra keypad.
Viscosity and % Torque are read directly from the display. This technique offers the simplicity of
the Brookeld Dial Viscometer. Multiple data points may be gathered by issuing multiple speed
commands.
Brookeld Engineering Laboratories, Inc. Page 49 Manual No. M98-211-E0912
Page 50

This technique is fast and easy. It's well suited to gathering data on samples prior to establishing
a test method or for performing single point tests.
S DVIII SPEED/TIME PAIRS
DV-III speed/time pairs offers a simple technique to collect multiple data points. Programs can
be created and executed from the DV-III Ultra keypad. Results can be analyzed or output to a
printer.
This technique is useful when multiple data points are required and the test method is simple.
B.E.V.I.S. PROGRAMS
S
B.E.V.I.S. Programs offer a command set capable of sophisticated rheometer control and data
collection. Programs are created on a PC and executed from the DV-III Ultra keypad. Results can
be analyzed or output to a printer.
The B.E.V.I.S. Program technique is useful when sophisticated data collection is necessary.
IV.5 Data Analysis for Viscosity Tests
Data collected from DV-III speed/time pairs or B.E.V.I.S. programs may be analyzed using several
math models. These models provide a means to numerically describe the behavior of the test uid.
In the case of viscosity measurement, a non-Newtonian uid will produce a curve when test data
is plotted on a shear stress vs. shear rate graph. The math model will force the data into a straight
line and describe it with a slope and y intercept. The terminology associated with the slope and y
intercept vary from model to model as does the interpretation of results. (See Appendix for more
information on math models.)
The DV-III Ultra does not allow for data sets to be edited. Programs must be constructed to conform
with the following data requirements if math models are to be used:
• The data set must contain non zero values for shear stress and shear rate (except for the
paste model which requires non zero viscosity and RPM).
• There cannot be two equal adjacent shear rate values (RPM values for paste model).
• % torque values of all data points must be between 0.1% and 100%.
If any of the above circumstances are violated, an error message will appear when a math
model is selected.
ERROR #1: A % torque value is less than 0.1. A shear stress or shear rate value is
zero.
ERROR #2: A % torque value is greater than 100.
ERROR #3: Reserved
ERROR #4: Two adjacent speeds of equal value.
Math models for data analysis are accessed by pressing the PROG key and then 3; 3 = Models
(Figure IV-1). If no data (i.e. no data at all or less than two (2) data points) is in the data buffer, no
modeling can be performed and Figure IV-39 will be displayed:
Brookeld Engineering Laboratories, Inc. Page 50 Manual No. M98-211-E0912
Brookeld Engineering Laboratories, Inc. Page 50 Manual No. M/98-211-B0104
Page 51

ERROR
YOU CANNOT EXECUTE A
MATH MODEL BECAUSE NO
DATA IS IN BUFFER
Figure IV-39
If there is already data in the data buffer, the user will be presented with the following screen:
MATH MODELS
1 CASSON 4 PWR LAW
2 NCA/CMA 5 PASTE
3 BINGHAM
Figure IV-40
The user is informed that there are ve (5) math models which can be used on the buffer data.
A model is selected by pressing the appropriate numeric key. No matter the model selected, the
following screen will be displayed for the duration of the mathematical analysis.
MATH MODEL
CALCULATING
Figure IV-41
When the calculations are complete, the results for the particular model will be displayed as
follows:
CASSON (STANDARD) cP
PLASTIC VISC: 3069
YIELD STRESS: 140.1
CONF OF FIT: 97.5
Figure IV-42
This screen, for the Standard CASSON Model, is typical for all ve (5) of the math models. Note
the cP in the upper right-hand corner to remind the user that the values are cP based. It could have
been SI (if the user had opted for SI display in the SETUP menu) as shown on the next two (2) of
the following four (4) math model screens:
The user may elect to print test results in order to obtain hard copy results. This is accomplished by
pressing the PRINT key while any of the above screens are being displayed causing the following
to be printed:
S
STANDARD CASSON PRINTOUT
Sample Name: ____________________________________________________
Operator Name: ___________________________________________________
Date: 01/14/1999 Time: 02:27 Math Model Results: CASSON (STANDARD)
Brookeld Engineering Laboratories, Inc. Page 51 Manual No. M98-211-E0912
Page 52

Model: HB Spindle: 34
Plastic Viscosity: 1906.3 cP
Yield Stress: 1976.88 D/CM2
Condence of Fit: 63.6 %
The equation for each model is described below with a denition of parameters. Please contact
Brookeld or an authorized representative if further information is required.
Note: The condence of t parameter used in all of the models is an indication
of how well the model ts the data set. 100% indicates the best t.
1. Casson (Standard)
The Standard Casson equation is: √τ = √τo + √ηD where:
D = Shear Rate
The calculated parameters for this model are:
Plastic Viscosity (cP or mPa•s)
Yield Stress (Dynes/cm2 or N/m2)
Condence of Fit (%)
τ = Shear Stress
τo = Yield Stress (stress at zero shear rate)
η = Plastic Viscosity
The Standard Casson method is a direct implementation of the original Casson equation.
2. NCA/CMA Casson (Chocolate)
This Casson method is derived from the standard set forth by the National Confectioners Association
(NCA) and the Chocolate Manufacturers Association (CMA). Although based on the original
Casson equation, this implementation has been tailored by the NCA and CMA specically to
applications involving chocolate.
The Chocolate Casson equation is:
τo = Yield Stress (stress at zero shear rate)
D = Shear Rate
The calculated parameters for this model are:
Plastic Viscosity (cP or mPa•s)
Yield Stress (Dynes/cm2 or N/m2)
Condence of Fit (%)
3. Bingham Plastic
The Bingham equation is: τ = τo + ηD where:
τo = Yield Stress (stress at zero shear rate)
D = Shear Rate
The calculated parameters for this model are:
Brookeld Engineering Laboratories, Inc. Page 52 Manual No. M98-211-E0912
Brookeld Engineering Laboratories, Inc. Page 52 Manual No. M/98-211-B0104
τ = Shear Stress
η = Plastic Viscosity
a = spindle (or bob) radius/ inner cup radius
τ = Shear Stress
η = Plastic Viscosity
(1+a)√τ = 2√τo + (1+a)√ηD where:
Page 53

Plastic Viscosity (cP or mPa•s)
Yield Stress (Dynes/cm2 or N/m2)
Condence of Fit (%)
4. Power Law
The Power Law equation is τ = kD
τ = Shear Stress
n
where:
D = Yield Stress (stress at zero shear rate)
k = Plastic Viscosity
n = Shear Rate
The calculated parameters for this model are:
Flow Index (no units)
Consistency Index (cP or mPa•s)
Condence of Fit (%)
5. IPC Paste Analysis
This method is intended to calculate the Shear Sensitivity Factor and the 10 RPM Viscosity value
of pastes. A prime example of its use is in the solder paste industry, thus the name IPC (Institute
for Interconnecting and Packaging Electronic Circuits).
The Paste equation is:
η = Viscosity (cP)
k = Consistency Multiplier
R = Rotational Speed (RPM)
η = kR
n
where:
n = Shear Sensitivity Factor
The calculated parameters for this model are:
Shear Sensitivity Factor (no units)
10 RPM Viscosity (cP or mPa•s)
Condence of Fit (%)
Brookeld Engineering Laboratories, Inc. Page 53 Manual No. M98-211-E0912
Page 54

IV.6 Automated Data Gathering & Analysis Using Rheocalc
Important features and benets in Rheocalc which enhance operator versatility in performing
viscosity tests include the following:
• Rheocalc version 3.0 and higher are compatible with Windows™ 2000, NT, XP, Vista and
Windows™ 7 operating systems for exible operation
• 32-bit operation for rapid performance
• Easy-to-use, structured command language to make viscosity tests easier to program
• Display of current temperature set point
• Concurrent plotting of four data sets on one graph
• Various mathematical models for data analysis
• Auto range feature which shows in screen display the complete viscosity range which can be
measured at any shear rate for a specic spindle geometry
The following gures show the principal screens associated with Rheocalc:
Figure IV-43: Dashboard Screen
Brookeld Engineering Laboratories, Inc. Page 54 Manual No. M98-211-E0912
Brookeld Engineering Laboratories, Inc. Page 54 Manual No. M/98-211-B0104
Page 55

Figure IV-44: Test Screen
Figure IV-45: Run/Data Screen
Brookeld Engineering Laboratories, Inc. Page 55 Manual No. M98-211-E0912
Page 56

Figure IV-46: Setup Screen
Figure IV-47: Analysis Screen
Brookeld Engineering Laboratories, Inc. Page 56 Manual No. M98-211-E0912
Brookeld Engineering Laboratories, Inc. Page 56 Manual No. M/98-211-B0104
Page 57

IV.7 Math Models
IV.7.1 The Power Law (Ostwald) Model
(t = shear stress, k = consistency index, = shear rate, and n = ow index)
What does it tell you?
The Power Law model provides a consistency index, k, which is a product’s viscosity at one
reciprocal second. (Reciprocal seconds are the units of measurement for shear rate.) It also
provides a ow index, n, which indicates the degree with which a material exhibits non-Newtonian
ow behavior. Since Newtonian materials have linear shear stress vs. shear rate behavior and n
describes the degree of non-Newtonian ow, the ow index essentially indicates how “non-linear”
a material is.
Figure IV-48
When n < 1 the product is shear-thinning or Pseudoplastic. This means the apparent viscosity
decreases as shear rate increases. The closer n is to 0, the more shear thinning the material is.
When n > 1 the product is shear-thickening or Dilatant. Their apparent viscosity increases as
shear rate increases.
When should you use it?
This model should be used with non-Newtonian, time-independent uids that do not have a yield
stress. These uids will begin to ow under any amount of shear stress. Graphs of such material
generally intersect the y-axis at 0.
Brookeld Engineering Laboratories, Inc. Page 57 Manual No. M98-211-E0912
Page 58

An Example of the Power Law Model at Work
t
t
o
t
o
t
o
Formulators at a personal care company
would like to use a substitute ingredient to
Shampoo
decrease cost. They use the Power Law model
to evaluate the eect the new ingredient
will have on the behavior of their shampoo.
Flow Index (n) = 0.08
Consistency Index (k) = 91071 cP
They need to know how it will behave during
processing and how it will behave when it is
being used be the consumer
With the new ingredient the shampoo has a ow index (n) of 0.08. This indicates that the
shampoo is shear-thinning enough to ow properly during processing and that it will ow
properly for the end-user. The consistency index, k, indicates how the shampoo behaves
when it experiences low shear rates. The power law values show that the shampoo becomes
quite thin at process shear rates and therefore it can be easily pumped into lling equipment,
hold tanks, etc. The consistency index of 91,071 cP shows that the shampoo is very viscous
at low shear rates, and as a result, it will appear to customers to be “rich and creamy” while
still being easy to apply.
IV.7.2 The Herschel-Bulkley Model
(
= shear stress,
= yield stress, k = consistency index, = shear rate, and n = ow index)
What does it tell you?
The Herschel-Bulkley model is simply the Power Law model with the addition of
stress. Yield stress,
, denotes how much shear stress is required to initiate ow. This model also
provides a consistency index, k, which is a product’s viscosity at 1 reciprocal second, and a ow
index, n, which indicates the degree with which a material exhibits non-Newtonian ow behavior.
Since Newtonian materials have linear shear stress vs. shear rate behavior and n describes the
degree of non-Newtonian ow, the ow index essentially indicates how “non-linear” a material
is. For Herschel-Bulkley uids, n will always be greater than or less than 1.
When n < 1 the product is shear-thinning or Pseudoplastic. This means the apparent viscosity
decreases as shear rate increases. The closer n is to 0, the more shear thinning the material is.
When n > 1 the product is shear-thickening or Dilatant. It’s apparent viscosity increases as shear
rate increases.
for yield
Brookeld Engineering Laboratories, Inc. Page 58 Manual No. M98-211-E0912
Brookeld Engineering Laboratories, Inc. Page 58 Manual No. M/98-211-B0104
Page 59

Figure IV-49
t
o
When should you use it?
The Herschel-Bulkley model should be used with non-Newtonian, time-dependent materials that
have a yield stress. Products with a yield stress only begin to ow after a certain amount of shear
stress is applied. As a result, the ow curve intersects the y-axis at a point greater than 0. After
yielding, the product creates a ow curve and behaves as a Power Law uid so that n indicates
where there is a shear-thinning or shear-thickening tendency. (In this case, if n =1, the material is
behaving as a Bingham uid, which is discussed next.)
An Example of the Herschel-Bulkley Model at Work
A company uses a gel-like substance as part
of their production process. Upon arrival
Gel-Like Substance
they test the material and apply the HerschelBulkley model to ensure it will perform
correctly during process. The results in gure
VI-2 show that the consistency index is 8,550
cP, the ow index is 0.66, and the yield stress
2
is 51.0 dynes/cm
. These results indicate
n = 0.66
= 51.0 dynes/cm
k = 8550 cP
2
that this batch of gel does not quite meet
specication. While the consistency index is within spec, the yield value is higher than
normal so the uid will not begin to ow as easily. With a ow index of 0.66, this batch is
also less shear thinning than normal. Pump and mixer speeds must be adjusted before
using this material.
Brookeld Engineering Laboratories, Inc. Page 59 Manual No. M98-211-E0912
Page 60

IV.7.3 The Bingham Model
t =
t
o
hD
t
t
o
t
o
(
+
= shear stress,
What does it tell you?
= yield stress, η = plastic viscosity, and D = shear rate)
The Bingham model indicates a product’s yield stress,
, which is the amount of shear stress
required to initiate ow. It also provides the plastic viscosity,
product yields.
η, which is the viscosity after a
Figure IV-50
When should you use it?
This model should be used with non-Newtonian materials that have a yield stress and then behave
in a Newtonian fashion once they begin to ow. As a result, the shear stress-shear rate plot forms
a straight line after yielding. (Products that have a yield stress only begin to ow after a certain
amount of shear stress is applied. They are also called “viscoplastic”. Their shear stress vs. shear
rate graphs intersect the y-axis at a point greater than 0.)
Brookeld Engineering Laboratories, Inc. Page 60 Manual No. M98-211-E0912
Brookeld Engineering Laboratories, Inc. Page 60 Manual No. M/98-211-B0104
Page 61

An Example of the Bingham Model at Work
t
o
D
t
t
o
t
o
A manufacturer of drilling uid applies the
Bingham Model to ensure the quality of their
Drilling Fluid
product. Results from a recent batch, shown
in Figure VI-50, showed that the yield stress
and plastic viscosity were both below the
pass/fail criteria, which would cause the uid
Plastic Viscosity (
Yield Stress (
η) = 6621 cP
) = 166.4 dynes/cm
to insuciently hold-up the cuttings. The
shipment was cancelled and the root-cause
of the problem was identied.
IV.7.4 The Casson Model
t = to+ h
= shear stress,
= yield stress, η = plastic viscosity, and D = shear rate)
(
What does it tell you?
The Casson model provides parameters similar to that of the Bingham model. However, unlike
the Bingham model, it was developed for materials that exhibit non-Newtonian ow after yielding.
The Casson model indicates the product’s yield stress (
required to initiate ow, and the product’s plastic viscosity,
) which is the amount of shear stress
η, which is the viscosity of the product
after it yields.
2
Figure IV-51
Brookeld Engineering Laboratories, Inc. Page 61 Manual No. M98-211-E0912
Page 62

When should you use it?
t
o
t
o
t
o
t
2 to +
ηg
t
t
o
The Casson model should be used with non-Newtonian materials that have a yield stress and that
do not exhibit a “Newtonian-like” behavior once they begin to ow. This model is most suitable
for uids that exhibit Pseudoplastic or shear thinning, ow behavior after yielding.
These uids have a non-linear ow curve. The point at which it crosses the y-axis is the product’s
yield stress (
). To protect the point at which the curve will intersect with the y-axis, the Casson
model linearizes or straightens the plot by taking the square root of the data. To ensure accurate
extrapolation to yield stress it is best to take some data at low shear rates.
An Example of the Casson Model at Work
Before releasing a new over the counter gel, a
pharmaceutical company needs to learn how
Pharmaceutical Gel
it will behave which it is being used by the
end consumer. They perform a full viscosity
prole and apply the Casson model. From the
results, shown in Figure VI-4, they learn that
their ointment has a higher yield stress,
lower plastic viscosity,
η, than they originally
, and
Plastic Viscosity (
Yield Stress (
η) = 329.8 cP
) = 325.8 dynes/cm
2
intended. As a result it is difcult or dispense
from its container (due to the high yield stress) and it does not hold it shape very well (due
to the low plastic viscosity), making it difcult to apply a small amount to the affected area
of the skin. Based on this data, formulators are able to modify the ingredients accordingly.
Once a formulation is established, multi-point tests and the Casson model are performed as a
QC tool to check batches before and after processing.
IV.7.5 Other Rheological Models
The NCA/CMA Casson Model
(1 + a)
=
(1 + a)
.
(
= shear stress
,
= yield stress, η = plastic viscosity, and = shear rate)
The NCA/CMA Casson model is designed by the National Confectioners Association and the
Chocolate Manufacturers Association as the standard rheological model for the industry. This
model determines yield and ow properties under specied conditions and closely approximates
the plastic behavior of chocolate before nal processing.
Brookeld Engineering Laboratories, Inc. Page 62 Manual No. M98-211-E0912
Brookeld Engineering Laboratories, Inc. Page 62 Manual No. M/98-211-B0104
Page 63

Figure IV-51
When chocolate is used for enrobing, it must have a yield stress high enough to stay in place once
it enrobes the lling. In the case of decorating chocolate, the yield stress must be high enough so
it can keep its shape once it has been squeezed into place through a nozzle. For molding chocolate,
the plastic viscosity must be low enough to completely ll the mold.
(The NCA/CMA lists Brookeld’s HA-spring range viscometer with a Small Sample Adapter,
SC4-27 spindle and SC4-13R sample chamber as the approved apparatus.)
The IPC Paste Model
n
η=kR
The IPC Paste Model was developed for solder pastes. It calculates the viscosity of solder pastes at
10rpm. The IPC Paste Model requires that the product be tested with a Brookeld Spiral Adapter
at multiple speeds. More details can be found in the IPC-TM-650 Test Methods Manual (methods
2.4.34.2 and 2.4.3).
This model is a variation of the Power Law Model. Unlike the Power Law Model, which relates
apparent viscosity to shear rate, the IPC Paste Model relates apparent viscosity to the testing speed
(rpm).
Brookeld Engineering Laboratories, Inc. Page 63 Manual No. M98-211-E0912
Page 64

Figure IV-52
Figure IV-53
Brookeld Engineering Laboratories, Inc. Page 64 Manual No. M98-211-E0912
Brookeld Engineering Laboratories, Inc. Page 64 Manual No. M/98-211-B0104
Page 65

IV.8 Yield Stress Test Programs and Test Samples
This section explains how to create a yield test program for the DV-III Ultra Rheometer. There
are no yield test programs stored in instrument memory when the DV-III Ultra is shipped from
Brookeld. Therefore, you will need to use the EZ-Yield Software on your PC to create yield test
programs. Once a yield test program has been downloaded from your PC to the DV-III Ultra, you
will be able to run tests by following the instructions in this section.
Brookeld EZ-Yield software is a 32-bit Windows program supplied with every DV-III Ultra Yield
Rheometer.
IV.8.1 Test Parameter Description
When running the EZ-Yield application on your PC, the main screen for creating yield test programs
is in Figure IV-54:
Figure IV-54
Use this page to create, load, save, and print test parameters that are then downloaded into one of
the memory locations in the DV-III Ultra Rheometer. The le name (including path) of the test
parameters currently loaded is displayed at the top of the page. Click on the entry eld to edit the
information in that eld. The elds with downward pointing arrows on the right require that you
click that arrow to make a selection from the drop down list. When a eld is selected, the text on
the right of the page, in the Parameter Descriptions box, changes to give information appropriate
to the eld selected.
The Pre-Shear, Zero, and Wait Time steps are optional. Clicking the check box to the left of these
elds until the check mark appears enables these parameters. Clicking the check box to the left of
these elds until the check mark disappears disables these parameters.
Brookeld Engineering Laboratories, Inc. Page 65 Manual No. M98-211-E0912
Page 66

Clicking the New button (or selecting New from the File menu) sets all parameters to their default
Primary
Immersion
Mark
Secondary
Immersion
Mark
values.
All open, save, and print operations selected while this page is displayed will open, save, and
print test parameters, but NOT data. The following is a detailed description of the test parameters
involved in creating a yield stress test.
Program Number
This is the number of the memory slot in the DV-III Ultra Rheometer to which the test parameters
will be loaded. There are ten (10) slots, numbered from 0 through 9.
Program Name
This descriptive user-supplied name is loaded into the memory slot in the DV-III Ultra Rheometer
with the test parameters. A maximum of ten (10) alphanumeric characters may be used for this
name.
Spindle
Spindle Number
A two (2) digit code representing the spindle number used for the test must be selected. See Appendix
A for more information regarding spindles for use with the DV-III Ultra Rheometer. Selection of
the appropriate spindle code is important to ensure correct stress calculations.
Immersion Mark
Each vane spindle has two (2) immersion marks. The primary immersion mark is located on the
spindle shaft. Normally, the spindle should be inserted so that the sample reaches this mark. If
the sample container is too small to allow the spindle to be inserted to this mark, the secondary
immersion mark may be used. This mark appears half way down the blades of the vane spindles.
See Appendix D2 for more information regarding spindles and immersion marks.
Figure IV-55
Note: Selection of the appropriate immersion mark is important to ensure
correct stress calculations.
Pre-Shear Information
An optional Pre-Shear step can be included in the test parameters. If the Pre-Shear box is checked
on the Test Parameter page of the EZ-Yield software, a pre-shear step will be performed before
running the actual test. The user must supply the speed and duration of the pre-shear step. See
Appendix B for a complete list of pre-shear speeds.
Brookeld Engineering Laboratories, Inc. Page 66 Manual No. M98-211-E0912
Brookeld Engineering Laboratories, Inc. Page 66 Manual No. M/98-211-B0104
Page 67

Pre-shearing is the shearing of sample before measuring its yield properties. This process breaks
down the sample’s structure. It is particularly useful if the investigator wants to eliminate previous
shear history (e.g., bumping, transferring) of the sample before testing and observe the structural
rebuilding of the sample. This may simulate the following: ketchup pumped out of a bottle will
rebuild after it comes to rest on the French Fries. There are materials whose measured yield stress
will be lower after pre-shearing than if tested without pre-shearing. This may be used to compare
the rate at which different materials rebuild. The yield stress measured in a pre-sheared sample is
the “dynamic yield”, while the yield stress measured for an originally undisturbed material is the
“static yield”. Zeroing after pre-shearing is performed on the sample is highly recommended for
every test. The next section explains how to do this.
Zero
An optional, but highly recommended, torque Zero step can be included in the test parameters. If
the Zero box is checked on the Test Parameter page of the EZ-Yield software, the rheometer will
rotate the motor in the appropriate direction until 0% torque is achieved.
This may be necessary because the spindle sometimes twists a small amount during insertion into
the sample. This results in a small, although possibly signicant, torque applied to the sample.
Slow zeroing speeds are used to eliminate this initial torque and minimize effects on the sample’s
structure before the test is started.
Zeroing is an essential step after preshearing.
This gives a consistent starting point for each test. A speed for the step must be supplied in the
appropriate box. Faster speeds achieve a “zero” quicker but may cause a more variable starting
point. See Appendix D2 for a complete list of zero step speeds.
Wait Time
An optional Wait step can be included in the test parameters. If the Wait Time box is checked on
the Test Parameters page of the EZ-Yield software, there will be a time delay after zeroing before
the actual test run begins. During this delay, the motor shaft will be at zero (0) RPM.
Wait Time is the time the sample is allowed to rest between the completion of zeroing and the start
of the yield measurement. Some samples rebuild structure more slowly than others after shearing,
such as during handling, pouring sample into a beaker, etc. Certain low-viscosity paints may also
have a low yield stress. Waiting 30 seconds, for example, after immersing the spindle may allow
the sample to rebuild, producing a more consistent test method.
Run Speed
Run Speed is the motor speed for the DV-III Ultra at which the material is tested. It is common for
materials to appear stiffer when tested at higher speeds. That is, the slope of the stress-vs.-strain
curve increases with increasing speed. This is because the material structure has less time in which
to react to dissipate the applied stress. Increasing the speed will, in most cases, increase the yield
stress measured by the instrument. Most yield tests are conducted at relatively low speeds (<1
rpm) to minimize any inertial effects when using vane spindles. See Appendix D2 for a complete
list of run speeds.
Base Increment
Base Increment is the amount of time in milliseconds between data points used for taking torque
(stress) readings. The software automatically calculates base increment values. Smaller base
increment values are used during faster speed tests to ensure that data are taken fast enough to
properly determine the yield point. Larger base increment values are used during slower speed
tests because these tests are expected to take longer and the longer time between data points helps
prevent typical data les from becoming very large. However, the user may still wish to set this
value to suit the required need after some familiarity is gained with the material being tested.
The % torque data are used to determine when a yield point is reached. The rigid line incremental
torque value is automatically calculated by the EZ-Yield software and depends on the Run Speed
Brookeld Engineering Laboratories, Inc. Page 67 Manual No. M98-211-E0912
Page 68

selected. Although this value is calculated, it can be altered if there is a compelling need to do
BEL gpk test.DB syrup
hair gel #1.DB chocolate syrup #1.DB syrup
hair gel #2.DB chocolate syrup #2.DB
hair gel #3.DB chocolate syrup #3.DB
hair gel #4.DB chocolate syrup #4.DB
petroleum jelly #1.DB ketchup #1.DB
petroleum jelly #2.DB ketchup #2.DB
so. If the Base Increment has been manually altered for any reason, selecting a new Run Speed
automatically resets the Base Increment to its optimum value.
Torque Reduction
Torque Reduction is percentage change in torque value between successive data points. That is, the
material yields or begins to break down and, as a result, the measured incremental torque begins to
decrease. A value of 100% for this parameter causes the test to stop as soon as there are no torque
increases during a base time increment. Some users may wish to see a drop in torque after the
yield point. Setting this parameter to values greater than 100% allows data to be collected after the
yield point by the EZ-Yield
TM
software so the decrease in torque may be more easily visualized.
However, this will also affect the calculated yield stress value.
Low and High Yield Limits
These values (in Pa) can be used as a Quality Control tool. If the resulting yield stress from a test
falls outside these limits, an appropriate message is displayed and printed with the results. Entering
zero (0) for both these parameters disables this QC feature.
IV.8.2 Toolbar and Menu Options
Figure IV-56
Note: All functions shown on the toolbar can also be accessed from the menu
above the toolbar.
New
Selecting New (using the New button or the New option in the File menu) displays the Test Parameters
page with default values in each eld. Use this function before creating a new test program.
Open
Selecting Open (using the
OpeN button or the Open option in the File menu) displays the Open
File dialog box.
Brookeld Engineering Laboratories, Inc. Page 68 Manual No. M98-211-E0912
Brookeld Engineering Laboratories, Inc. Page 68 Manual No. M/98-211-B0104
Figure IV-57
Page 69

The Open File dialog box automatically displays les of the type it thinks the user requires; i.e., if
BEL gpk test.DB syrup
hair gel #1.DB chocolate syrup #1.DB syrup
hair gel #2.DB chocolate syrup #2.DB
hair gel #3.DB chocolate syrup #3.DB
hair gel #4.DB chocolate syrup #4.DB
petroleum jelly #1.DB ketchup #1.DB
petroleum jelly #2.DB ketchup #2.DB
the Test Parameters page was displayed, the le types displayed are test parameter les (*.BYT)
and if the Data or Graph pages were displayed, the le types displayed are data les (*.DB).
Regardless of the le types initially displayed, either type of le can be loaded by selecting the
desired type at the bottom of the Open File dialog using the Files of Type drop down list.
Save
Selecting Save (using the Save button or the Save option in the File menu) displays the Save File
dialog box.
Figure IV-58
The Save File dialog box automatically displays les of the type it thinks the user requires (i.e. If
the Test Parameters page was displayed, the le types displayed are test parameter les (*.BYT)
and if the Data or Graph pages were displayed, the le types displayed are data les.). Regardless
of the le types initially displayed, either type of le can be saved by selecting the desired type at
the bottom of the Save File dialog using the Files of Type drop down list.
Print
Selecting Print (using the priNt button or the Print option in the File menu) displays a Print
Preview window. Once this window is displayed, clicking the priNt button sends the report to the
selected printer. The functions of the buttons on the toolbar are described below:
Brookeld Engineering Laboratories, Inc. Page 69 Manual No. M98-211-E0912
Page 70

Figure IV-59
Zoom To Fit Displays a complete page of the report in the window. Text and
graphics are shrunk so that a complete page will t on the screen.
Zoom To 100% Increases the size of all text and graphics so that they are displayed
at 100% of their actual size.
Zoom To Width Displays a page so that the complete width of the page ts on the
screen.
First Page Displays the rst page of the report.
Previous Page Displays the previous page of the report.
Next Page Displays the next page of the report.
Last Page Displays the last page of the report.
Printer Setup Displays the standard Windows Print Setup dialog box. From this
dialog box, a target printer can be chosen and its settings can be
altered before printing.
Print Sends the report to the selected printer.
Save Report Displays the Save Report dialog box allowing the report to be
saved to a QuickReport (*.QRP), Comma Separated Text (*.CSV),
HTML (*.HTM), or Excel spreadsheet (*.XLS) format.
Load Report Previously saved reports can be loaded into the Print Report
Preview window. Only reports saved to the QuickReport (*.QRP)
format can be reloaded.
Brookeld Engineering Laboratories, Inc. Page 70 Manual No. M98-211-E0912
Brookeld Engineering Laboratories, Inc. Page 70 Manual No. M/98-211-B0104
Page 71

Download
Selecting Download (using the Download button or the Download Program option in the
Utility menu) sends the parameters displayed on the Test Parameters page to the specied memory
location in the DV-III Ultra Rheometer. After a few seconds, a dialog box appears indicating that
the rheometer received the parameters.
If no dialog box appears, see Appendix J - Troubleshooting - to help determine why the parameters
were not received by the rheometer.
Run
Selecting Run and a program number (using the Run button or the Run Program option in the
Utility menu) directs the DV-III Ultra Rheometer to run the selected program.
Note: The program numbers refer to the memory locations in the DV-III Ultra
Rheometer.
After a few seconds, the DV-III Ultra tells EZ-Yield that the test has begun. Once all optional
preparation steps have been performed by the rheometer, EZ-Yield begins to receive data as the
test runs. If the On-Line Plotting option is selected in EZ-Yield, the Graph page is automatically
displayed as soon as the rst data point is received. Data are plotted as received, while being
displayed in the Data/Results section of the Data page.
If the rheometer is running the test and no data appears, see Appendix J- Troubleshooting - to
help determine why EZ-Yield is not receiving the data. When the test is complete, a dialog box is
displayed asking you to save the freshly collected data and results.
Help
Selecting Help (using the Help button or the Help option on the menu) displays the on-line help
system.
Exit
Selecting Exit (using the Exit button or the Exit option on the File menu) exits the EZ-Yield software.
If test parameters or data have not yet been saved, a dialog box appears informing you of this fact
and giving you the opportunity to save the pertinent information.
COM Port
Select the COM Port on the host PC (sometimes referred to as a serial port or an RS-232 port) to
which the DV-III Ultra Rheometer is attached. COM1 through COM4 may be selected. Selecting
NONE disconnects the rheometer from the host PC.
Note: Simply selecting the COM port is only part of what is needed for a
valid connection between the rheometer and the host PC. Ensure that
the appropriate cable is in use (Brookeld part # DVP-80) and that it
is connected properly. See Appendix I - DV-III Ultra to COmputer
Command Set - for more information regarding the DV-III Ultra to host
PC connection.
Brookeld Engineering Laboratories, Inc. Page 71 Manual No. M98-211-E0912
Page 72

IV.8.3 Data Page
Figure IV-60
Use this page to load, save, print, and export data taken with the DV-III Ultra Rheometer. The le
name (including path) of the data currently loaded is displayed at the top of the page.
The test parameters used to collect the data are displayed on the left of the page in the box labeled
“Parameters Used To Collect Data”.
Data is displayed on the right of the page in the box labeled “Data/Results”. All recorded data
points are displayed in the table.
Time Elapsed time since the beginning of the run cycle is shown here in units of
hours, minutes, seconds, and thousandths of seconds (H:MM:SS.SSS).
Data is taken at an interval equal to the Base Increment parameter.
% Torque This eld displays actual measured % Torque value
Delta % Torque This eld displays the difference between the current % Torque value and
the previous % Torque value. As the sample approaches its yield point,
the Delta % Torque should begin to decrease. If the Torque reduction for
the test is 100%, the yield point occurs when the % decrease in torque =
100.
Stress This eld displays the calculated stress for each data point. The nal Stress
value (i.e. the Stress at the yield point) is the resultant yield stress. See
Appendix D - Calculations - for the equation used to calculate stress.
Brookeld Engineering Laboratories, Inc. Page 72 Manual No. M98-211-E0912
Brookeld Engineering Laboratories, Inc. Page 72 Manual No. M/98-211-B0104
Page 73

Strain This eld displays the Apparent Strain placed on the sample for each data
point. The Apparent Strain is the angular distance that the spindle rotates
in the sample. See Appendix D2 - Spindle Codes and Speeds for Yield
Tests - for the equation used to calculate strain.
The following are displayed in the line immediately below the Data/Results table:
1. The number of the highlighted record
2. The total number of data records
3. The date and time that the highlighted record was taken.
The test results are displayed below that line.
Test Result There are ve (5) possible test results:
1. Test Passed
2. Test Failed due to an Under-Range condition
3. Test Failed due to an Over-Range condition
4. Test Failed due to a User-Limit violation
5. Test Failed due to a user cancellation
See Section IV.8.6.3 - Test Results - for more information regarding these possible results.
Temperature The temperature recorded at the conclusion of the test is displayed here
in °C.
% Torque @ Yield The %Torque value at the yield point is displayed here.
Yield Stress The stress at the yield point is displayed here in Pascals (Pa).
Clicking the expOrt button displays the Print Preview window. From the Print Preview window, the
Save repOrt button can be clicked to allow you to save the report to various other le formats.
Note: The Save Report dialog box allows reports to be saved to in QuickReport
(*.QRP), Comma Separated Text (*.CSV), HTML (*.HTM), and Excel
spreadsheet (*.XLS) formats.
See Section IV.8.6.2 - Printing a Program - for more information regarding this window.
All open, save, and print operations selected while this page is displayed will open, save, and print
data, but NOT test parameters.
Brookeld Engineering Laboratories, Inc. Page 73 Manual No. M98-211-E0912
Page 74

IV.8.4 Graphs Page
Figure IV-61
Use this page to graphically display yield test data both on-line (i.e. while the test is running) and
after it is collected.
Two (2) graphs are displayed on this page.
1. % Torque vs. Time
This graph displays the % Torque values versus the time (since the beginning of the
Run cycle) at which the data points were collected. Torque is displayed in units of %
of full scale range while the Time is displayed in seconds.
2. Stress vs. Apparent Strain
This graph displays the calculated Stress values versus the calculated Apparent Strain
values for each data point collected. Stress is displayed in units of Pascals (Pa) while
Apparent strain is displayed in units of radians (rad).
See Appendix D2 - Spindle Codes and Speeds for Yield Tests - for more information regarding these
calculated values.
Double-clicking on either graph enlarges or zooms that graph and displays it on the left side while
shrinking the other graph and displaying it on the right.
The three (3) toolbars on the right side of the page can be resized and moved within the connes of
the toolbar box by clicking and dragging the toolbar sizer located to the left of the toolbar title.
Brookeld Engineering Laboratories, Inc. Page 74 Manual No. M98-211-E0912
Brookeld Engineering Laboratories, Inc. Page 74 Manual No. M/98-211-B0104
Page 75

Graphs Page Options Toolbar
Note: Many of the Options buttons are two (2) state buttons. Two (2) state
buttons have two (2) positions: depressed and un-pressed. A visually
depressed button indicates the option is turned ON while a visually
un-pressed button indicates that the option is OFF. Clicking a two (2)
state button causes its state to change, thereby turning an option ON and
OFF.
The following is a functional description of each of the buttons on the Options toolbar of the Graphs
page:
Replot Click this button to refresh both graphs. Any time another option
is changed, the replOt must be clicked to see those changes.
On-Line Plotting This is a two (2) state button. Turning this option ON causes data to
be plotted on both graphs during the run cycle of a yield test. Keep in
mind that the DV-III Ultra Rheometer must be communicating with
the host PC and EZ-YieldTM in order for this data to be plotted.
Show Data Values This is a two (2) state button. Turning this option ON causes a hint
box to be displayed whenever the mouse cursor is placed on the
Stress versus Apparent Strain graph within the data boundaries of
the graph. This hint box displays the Time, % Torque, and Stress
of the position pointed to by the cursor for the % Torque vs. Time
graph. It displays Stress and Apparent Strain of the position pointed
to by the cursor for the Stress vs. Strain graph.
Calibration Data This is a two (2) state button. Turning this option ON causes
the straight line, representing the calibration information of the
rheometer, to be displayed along with the user data on the % Torque
vs. Time graph.
Major Grid Lines This is a two (2) state button. Turning this option ON displays the
major grid lines (those with a numerical representation on each axis)
to be displayed.
Minor Grid Lines This is a two (2) state button. Turning this option ON displays the
minor grid lines (those without numerical representation on each
axis) to be displayed.
Data Markers This is a two (2) state button. Turning this option ON displays a
data marker (i.e. a colored shape matching that in the Data legend)
for each data point.
Color Printouts This is a two (2) state button. Turning this option ON allows graphs to
be printed in color if an appropriately equipped printer is connected
and properly congured in Windows.
Use the Plot title two (2) state button to toggle between a user supplied graph title (the same
title is used on both graphs) or a title indicating the yield test results. When the Plot title button
is depressed, the user supplied title is used. You may delete the default “Enter Graph Title Here”
message and type in a new one.
Note: The Replot button must be clicked after making any changes to the state
of the Plot title button or to the user-supplied text.
Brookeld Engineering Laboratories, Inc. Page 75 Manual No. M98-211-E0912
Page 76

Graphs Page Legend Toolbar
BEL gpk test.DB syrup
hair gel #1.DB chocolate syrup #1.DB syrup
hair gel #2.DB chocolate syrup #2.DB
hair gel #3.DB chocolate syrup #3.DB
hair gel #4.DB chocolate syrup #4.DB
petroleum jelly #1.DB ketchup #1.DB
petroleum jelly #2.DB ketchup #2.DB
This toolbar allows you to select multiple data sets to plot (up to 5) and select which color and
marker to use for each data set. To select a data set to be plotted, click the box to the left of the
marker so that a check mark is displayed. To un-select a data set so that it is not plotted, click the
box to the left of the marker so that a check mark is NOT displayed. Once the appropriate data sets
to be plotted are selected, click the replOt button in the Options toolbar to update the graphs.
The top line in the toolbar always displays Captured Data and cannot be changed. Select this data
set to graph freshly collected (i.e., unsaved) data. The bottom four lines are used to select and load
data from disk les. To select a le either double-click the intended line or select the line with a
single click, then click the BrOwSe button (i.e. the button with the three (3) dots or ellipsis). The Open
File dialog box appears allowing you to navigate to and select the desired data le to graph.
Figure IV-62
Note: The RePlot button must be clicked after making any changes to the
state of the Data Legend toolbar in order for the changes to be seen on
the graphs.
On the graphs, the data is plotted using the color specied for the selected data sets in the Data
Legend toolbar. In addition, if the Data Markers option is turned ON, the appropriate data marker
from the legend is displayed on each graph for each data point.
IV.8.5 Examples of Yield Test Programs
IV.8.5.1 Example Application: Hair Gel
The test method and data shown in Figure IV-63 show an analysis of yield from a typical hair gel
product. It is usually desirable to measure yield on products without transferring them from their
containers because doing so would “pre-shear” the material. Hair gel is normally sold in shallow
jars, as was the case with this sample. The V-73 vane spindle was selected because it is the smallest
and could be completely immersed in the shallow jar. An RVDV-III Ultra Rheometer was used
for the test.
Brookeld Engineering Laboratories, Inc. Page 76 Manual No. M98-211-E0912
Brookeld Engineering Laboratories, Inc. Page 76 Manual No. M/98-211-B0104
Page 77

The spindle was immersed to the primary immersion mark and pre-shear was turned off. Zero was
turned on and a nominal “zero” speed of 0.1 rpm was chosen. This allows the motor to reset the
torque to zero prior to running the test. Occasionally, the spindle rotates a bit while being lowered
into the sample. This moves the torque sensor away from zero. It is usually desirable to reset it to
zero before starting the measurement. Run speed was set to 0.1 rpm. Often, 0.5 rpm is selected
and is a good starting point when establishing test parameters. In this case, a slow test was desired
so test speed was set intentionally low. Low and high yield limits (for Q.C.) were ignored.
This test resulted in a good mid-range torque of 44.5% at the yield stress, which was reported as
44.38 Pa.
Figure IV-63: Hair Gel Sample
IV.8.5.2 Example Application: Hand Cream
Hand cream is typically packaged in a small jar. The small V-73 spindle did not provide enough
torque signal (less than 10% on the RVDV-III Ultra Rheometer) so the larger V-72 spindle was
used. The jar was too shallow to completely immerse the spindle so the secondary immersion mark
was used. This provided just enough torque at the yield point for a satisfactory test. Pre-shear was
turned off. Zero was turned on and a low test speed of 0.1 rpm was selected. Torque reduction was
left at the default setting of 100%. Q.C. limits were turned off (by selecting zero for their values).
The base increment (data interval) was left at the default 1,000.
Upon conclusion of the test, individual data points were widely spaced because yield was reached so
quickly. In this case, either a lower Run Speed might be desired or a smaller Base Increment. Both
would increase the density of data points and result in a more accurate or repeatable test result.
Brookeld Engineering Laboratories, Inc. Page 77 Manual No. M98-211-E0912
Page 78

The yield stress resulting from this test was reported as 190.32 Pa.
Figure IV-64: Hand Cream Sample
IV.8.5.3 Example Application: Ketchup
In this example, a name brand ketchup was tested and compared to a store brand ketchup. Visual
examination of both products could distinguish no noticeable differences. Both tests were run
under exactly the same conditions using an HBDV-III Ultra with spindle V-72. See Figure IV-65
for the test set up.
Signicant differences between the name brand and the store brand can be characterized by such
a test as shown in Figure IV-66. Both the slope of the stress/strain curves and the yield points are
clearly different.
Brookeld Engineering Laboratories, Inc. Page 78 Manual No. M98-211-E0912
Brookeld Engineering Laboratories, Inc. Page 78 Manual No. M/98-211-B0104
Page 79

Figure IV-65
Figure IV-66: Ketchup Comparison Samples
Brookeld Engineering Laboratories, Inc. Page 79 Manual No. M98-211-E0912
Page 80

IV.8.5.4 Torque vs. Time for Various Food Products
Figures IV-67 and IV-68 shows graphs of Torque (%) vs. Time (seconds) and Stress (Pa) vs. Strain
for several different materials: cream cheese, mayonnaise, pudding and ketchup. Experimentally
determining an appropriate combination of torque range, spindle and speed for testing each material
ensures that the torque readings are within the recommended 10-100% on the torque scale. If a
sample has a relatively low torque reading for the yield (<10%), then try using a faster speed or
larger spindle to get a larger torque reading. Alternatively, a DV-III Ultra Rheometer with a more
sensitive spring could be used as well; e.g., RVDV-III Ultra instead of HBDV-III Ultra.
You will need different spring torques in order to test a wide range of products that have vastly
different yield characteristics. The spring torque of the HB is eight times greater than that of the
RV and the 5xHB torque is 40 times greater than that of the RV (or ve times that of the HB).
TM
An advantage of the EZ-Yield
software is that multiple samples can be compared graphically on
the same set of axes for easy and rapid evaluation of yield behavior.
Figure IV-67: Torque vs. Time Graphs for Various Food Products
Brookeld Engineering Laboratories, Inc. Page 80 Manual No. M98-211-E0912
Brookeld Engineering Laboratories, Inc. Page 80 Manual No. M/98-211-B0104
Page 81

Figure IV-68: Stress vs. Strain Graphs for Various Food Products
IV.8.6 Running Yield Test Programs in Stand-Alone Mode
This section explains how to use the DV-III Ultra Rheometer in standalone mode. There are no test
programs stored in instrument memory when the DV-III Ultra is shipped from Brookeld. Therefore,
you will need to review the preceding section on the EZ-Yield
TM
Software which explains how to
create test programs. Once a test program has been downloaded from your PC to the DV-III Ultra,
you will be able to run tests by following the instructions in this section.
S Yield Programs Menu
Yield test operations are accessed by pressing the "4" key when in the PROGRAM MODES menu.
The following screen is immediately displayed:
YIELD TEST
#5: Sample Tst
ENTER = Run Test
PRINT = Print Test
Figure IV-69
The program number and the program name (in this case, “#5: Sample Tst”) are displayed on the
second line. The program name ashes to indicate that it is the currently chosen test.
Pressing the OPTIONS/TAB key scrolls through the program numbers (0-9) and displays the
corresponding program name.
Brookeld Engineering Laboratories, Inc. Page 81 Manual No. M98-211-E0912
Page 82

Note: If the program number chosen has no program loaded, the word EMPTY
is displayed as the program name.
Pressing the MOTOR ON/OFF/ESCAPE key from this screen returns the display to the
PROGRAMS MODE menu.
S Running Yield Programs
When the ENTER key is pressed while a valid program is chosen in the Yield Programs Menu (see
Figure IV-69), the following screen is displayed:
#5: Sample Tst
USE SPINDLE #71
PRESS ENTER
Figure IV-70
The spindle number for the current yield program is displayed on line 3. Prepare the sample, attach
the appropriate spindle and lower it into the sample before continuing. Be sure to use the correct
immersion mark.
Pressing the eNter key with Figure IV-70 displayed performs the following:
• The test is started.
• The pre-test information (test parameters) is sent to both the serial (RS-232) port and to
an attached printer via the parallel printer port. See section IV.8.6.1 for a description of
the pre-test information sent to the printer.
• The program number being run is recorded so that it will be the rst program shown the
next time the Yield Programs Menu (see Figure IV-69) is displayed.
Pressing the MOtOr ON/OFF/eSC key at this screen causes Figure IV-69 to be displayed.
After ensuring the appropriate spindle is attached and pressing the eNter key, the various Run
screens are displayed. The top line of the Run screens always displays the program and spindle
number as follows:
#5: Sample Tst S:71
--------------------
--------------------
Figure IV-71
Where the program and spindle numbers in use are displayed on the top line. The bottom lines of
the Run screens vary depending upon the options selected in the program.
Figure IV-72 is displayed when a Pre-Shear speed and time were selected. If the current program
requires a Pre-shear step, the spindle will rotate at the selected speed for the selected time. The eld
after the word “RPM” is the speed of the pre-shear (in rpm) while the eld after the word "Time" is
a time (in seconds) that counts down from the user dened pre-shear time. A Pre-shear step allows
the sample to be conditioned before the actual test is started. In Figure IV-72, the pre-shear speed
is 10 rpm and the pre-shear time is 30 seconds.
Brookeld Engineering Laboratories, Inc. Page 82 Manual No. M98-211-E0912
Brookeld Engineering Laboratories, Inc. Page 82 Manual No. M/98-211-B0104
Page 83

#5: Sample Tst S:71
PRE-SHEARING...
RPM: 010 TIME: 0030
Figure IV-72
Figure IV-73 is displayed when a Zero operation was selected. If the current program requires a
Zero step, the spindle rotates backwards until the % torque reading is zero (0). The eld after the
word “RPM” is the speed (in rpm) while the eld after the word "Torque" is the current % torque
reading. A Zero step ensures that each test is started from 0% torque. In Figure IV-62, the speed
is 0.2 rpm and the torque reading is momentarily at 2.4% as it decreases back to 0%.
#5: Sample Tst S:71
ZEROING...
RPM: 0.2 TORQUE: 2.4
Figure IV-73
Figure IV-74 is displayed when a Wait Time was selected. A Wait Time step allows for a user-
dened time delay before starting the test. The eld after the word “Time” is the time, in seconds,
that counts down from the user-dened wait time.
#5: Sample Tst S:71
WAITING...
TIME: 0010
Figure IV-74
Figure IV-75 is always displayed during the actual test, after the aforementioned preparation steps
have been completed. During this portion of the test, data is continuously sent out the serial (RS232 port) located on the rear panel of the instrument. This data is for use with the accompanying
EZ-YieldTM software. See Appendix H for more information regarding this data.
#5: Sample Tst S:71
RUNNING YIELD
Figure IV-75
If the eSC key is pressed at any time during the yield test run, the following is displayed:
#5: Sample Tst S:71
USER TERMINATED TEST
PRESS ESC OR ENTER
Figure IV-76
At this point, pressing the eNter key starts the test again starting from whichever Run screen is
applicable (see Figures IV-72 through IV-75). Pressing the eSC key returns the display to that of
Figure IV-70, reminding you which spindle should be used.
Brookeld Engineering Laboratories, Inc. Page 83 Manual No. M98-211-E0912
Page 84

When the test is allowed to run to completion, one of the following screens (Figures IV-78 through
IV-81) are displayed:
Figure IV-78 is displayed when the yield test passes. The % torque and stress (in Pa) at the point
of yield are displayed along with the temperature (in °C) at the conclusion of test.
#5: Sample Tst S:71
TEST COMPLETE
%=73.56 TEMP=025.5
YIELD=0726.4 Pa
Figure IV-78
Figure IV-79 is displayed when the yield test fails due to an over-range error.
#5: Sample Tst S:71
YIELD ERROR
OVER-RANGE
PRESS ESC OR ENTER
Figure IV-79
Figure IV-80 is displayed when the yield test fails due to an under-range error.
#5: Sample Tst S:71
YIELD ERROR
UNDER-RANGE
PRESS ESC OR ENTER
Figure IV-80
Figure IV-81 is displayed when the yield test fails due to the resultant yield stress exceeding the
user dened limits. The actual yield stress measured during the test is displayed in the rst eld to
the right of the "Yield=", while the limiting value causing the failed test (high or low yield stress)
is displayed in the second eld.
#5: Sample Tst S:71
LIMIT ERROR
YIELD=726.436 (200.0)
PRESS ESC OR ENTER
Figure IV-81
After screens IV-78 through IV-81 are displayed, pressing the MOtOr ON/OFF/eSC key returns
the screen to Figure IV-70. At this point, after ensuring the appropriate spindle is attached, the
eNter key can be pressed to run the test again. Pressing the eNter key when any of these screens
is displayed immediately runs the test again and displays the rst appropriate Run screen (Figure
IV-72 through IV-75). When the test is complete, the results are sent out of both the parallel and
serial (RS-232) ports.
Brookeld Engineering Laboratories, Inc. Page 84 Manual No. M98-211-E0912
Brookeld Engineering Laboratories, Inc. Page 84 Manual No. M/98-211-B0104
Page 85

IV.8.6.1 Data Output
Pre-Test Output
When a test is begun, the following information is sent out both the parallel and serial (RS-232)
ports in the format shown with each line terminated by a CR/LF (i.e., a Carriage Return/Line Feed
command):
Date : ......................................................................
Sample Information : ......................................................................
Operator : ......................................................................
Model : RV
YD1:Spindle : 71/001 YD2:Pre-shear (rpm/secs) : 0.1/0010
YD3:Zero (rpm) : 0.05 YD4:Wait Time (secs) : 0010
YD5:Run Speed (rpm) : 0.4 YD6:Base Inc. (msec) : 0200
YD7:Torque Red. (%) : 020 YD8:Under-Range Red. (%) : 050
YD9:Average (readings) : 05 YDA:Limits (Low/High) (Pa) : 00200/01000
Base Inc. Cal. (%) : 1.55 Temperature (°C) : 25.5
Test Name : Sample Test Slot Number : 01
Note: 1) The Base Inc. Cal. (Base Increment Calibration) number is the change
in torque expected for the Base Inc. (Base Increment) selected using the
calibration data stored in the instrument.
2) The YDx values are for use with the EZ-YieldTM software and can be
ignored.
Post-Test Output
At the conclusion of the test, one of the following six (6) messages is sent to both the parallel and
serial (RS-232) ports:
1. Test (test number: test name) Complete
Yield Stress (Pa) = 196.53 % Torque @ Yield = 78.6 Temperature = 25.5°C
Test Passed
2. Test (test number: test name) Complete
Test Failed = Under-range (displayed if test fails due to an under-range condition; see Section
IV.8.6.3)
3. Test (test number: test name) Complete
Test Failed = Over-range (displayed if test fails due to an over-range condition; see Section
IV.8.6.3)
4. Test (test number: test name) Complete
Yield Stress (Pa) = 196.53 % Torque @ Yield = 78.6 Temperature = 25.5°C
Test Failed = Yield Stress Below Low Limit (displayed if test fails due to resultant yield stress
being below low limit; see Section IV.8.6.3)
5. Test (test number: test name) Complete
Yield Stress (Pa) = 196.53 % Torque @ Yield = 78.6 Temperature = 25.5°C
Test Failed = Yield Stress Above High Limit (displayed if test fails due to resultant yield stress
being above high limit; see Section IV.8.6.3)
6. Test (test number: test name) Cancelled
Test Failed = Cancelled By User (displayed if test fails due to cancellation by the user)
Brookeld Engineering Laboratories, Inc. Page 85 Manual No. M98-211-E0912
Page 86

IV.8.6.2 Printing A Program
Pressing the priNt key with a valid program selected in the Yield Programs Menu (Figure IV-69)
displays the following screen:
#5: Sample Tst
READY PRINTER THEN
PRESS PRINT KEY
Figure IV-82
Pressing the eNter key at this screen causes the selected program information to be sent out the
parallel printer port (located on the rear panel of the instrument).
Pressing the MOtOr ON/OFF/eSC key at this screen returns the display to that of Figure IV-69. If,
after pressing the PRINT key with Figure IV-82 displayed, a printer error is detected (Ex: printer
being off-line), the following screen is displayed:
#5: Sample Tst
PRINTER IS NOT READY
ENSURE PRINTER IS
ONLINE-PRESS ANY KEY
Figure IV-83
Pressing any key at this point returns the display to that of Figure IV-82.
Pressing the eNter key also records the program number being printed so that it will be the rst
program shown the next time PRINT TEST is selected from the default screen (see Figure IV-69).
After printing is complete, the screen returns to the display shown in Figure IV-69.
Note: Printing can only be accomplished using the parallel printer port. The
serial port (RS-232) is strictly used for downloading programs and/or
collecting yield data using the accompanying EZ-YieldTM software.
Test programs are printed in the following format:
Program Number/Name: #5/Sample Tst
Operator: Date:
Spindle Number: 71 Multiplier : 002
------------------------------------------------------------------------------Preparation Parameters
----------------------------
Pre-Shear Speed (rpm): 10 Pre-Shear Time (sec): 0030
Zero Speed (rpm): 0.2 Wait Time (sec): 0010
Run Parameters
------------------
Run Speed (rpm): 0.5 Base Increment (msec): 0100
Torque Reduction (%): 100
Average (readings): 05 Limits (Low/High) (Pa):0090/0100
Brookeld Engineering Laboratories, Inc. Page 86 Manual No. M98-211-E0912
Brookeld Engineering Laboratories, Inc. Page 86 Manual No. M/98-211-B0104
Page 87

IV.8.6.3 Test Results
Test Passed
When a yield test runs successfully, the resultant Yield Stress (Pa), the % Torque value at the time
of the yield and the Temperature at yield are printed.
Test (#5: Sample Tst) Complete
Yield Stress (Pa) = 726.36 % Torque @ Yield = 73.56 Temperature = 25.5C
In addition, the results are shown on the display as follows:
#5: Sample Tst S:71
TEST COMPLETE
%=73.56 TEMP=025.5
YIELD=0726.4 Pa
Figure IV-84
Test Failed
Some of the reasons a yield test may fail are as follows.
Under-Range Condition
Only yield measurements in the % Torque range from 10% to 100% will be accepted. If a Yield
Stress is reached before the % Torque value is 10%, an Under-Range error causes the test to end.
The following is sent to an attached printer:
Test Failed = Under-range
Test (#5: Sample Tst) Complete
The following screen is displayed:
#5: Sample Tst S:71
YIELD ERROR
UNDER-RANGE
PRESS ESC OR ENTER
Figure IV-85
Under-Range Error
The yield stress (Torque Reduction Value) is reached before the absolute % torque reaches 10%.
When a test is started, once the absolute torque is greater than zero (0), the second, third, and fourth
Delta Torques (also known as the Base Increment Torque) are averaged. The rst three (3) Delta
Torques after 9% absolute torque is reached are also averaged. An under-range error occurs if the
second average falls below the rst average by 15% or more.
Over-Range Condition
Only yield measurements in the % Torque range from 10% to 100% will be accepted. If Yield
Stress is not reached before the measured % Torque value reaches 100%, an Over-Range error
causes the test to end.
The following is sent to an attached printer:
Test (#5: Sample Tst) Complete
Test Failed = Over-range
Brookeld Engineering Laboratories, Inc. Page 87 Manual No. M98-211-E0912
Page 88

The following screen is displayed:
#5: Sample Tst S:71
YIELD ERROR
OVER-RANGE
PRESS ESC OR ENTER
Figure IV-86
User-Dened Limit Condition
When an upper and lower limit has been imposed upon the Yield Stress by the user, any resulting
Yield Stress that falls outside these limits causes the test to fail with a Limit Violation Condition.
One of the following messages is sent to the attached printer dependent upon which limit was
violated:
Low Limit Violation
Test (#5: Sample Tst) Complete
Yield Stress (Pa) = 196.53 % Torque @ Yield = 27.4 Temperature = 250.5C
Test Failed = Yield Stress Below Low Limit
High Limit Violation
Test (#5: Sample Tst) Complete
Yield Stress (Pa) = 996.53 % Torque @ Yield = 78.6 Temperature = 250.5C
Test Failed = Yield Stress Above High Limit
The following screen, showing rst the actual yield stress followed by the violated limit value, is
displayed:
#5: Sample Tst S:71
LIMIT ERROR
YIELD = 996.53 (800)
PRESS ESC OR ENTER
Figure IV-87
Test Cancelled By User
When a test is cancelled by the user, either by pressing the ESC key during a running test or by
TM
canceling the test via the EZ-Yield
software (See Section IV.8.2), the following is sent to the
attached printer:
Test (#test number: test name) Cancelled
Test Failed = Cancelled By User
The following screen is displayed:
#5: Sample Tst S:71
USER TERMINATED TEST
PRESS ESC OR ENTER
Figure IV-88
Brookeld Engineering Laboratories, Inc. Page 88 Manual No. M98-211-E0912
Brookeld Engineering Laboratories, Inc. Page 88 Manual No. M/98-211-B0104
Page 89

V. OPTIONS
The DV-III+ Options Menu allows the user to execute temperature control commands and special
time tests. General rheometer settings are also accessed from this menu. The Options Menu is
shown in Figure V-1. Selections are made by pressing the appropriate number key.
OPTIONS MENU
1 SETUP 4 SET TEMP
2 PRINT 5 DATA
3 ALARMS 6 TIMED
Figure V-1
V.1 Set Up
1. Change the units of temperature. The change is selected by pressing the 1 key. The change must
be conrmed by pressing the
ENTER key.
2. Change the units of viscosity and shear stress (CGS System: cP, D/cm
2
) (SI System: mPa•s,
N/m2).
The change is selected by pressing the 2 key. The change must be conrmed by pressing the
ENTER key.
3. Change communication status with external Brookeld temperature controller. An "off" indication
means that there is no communication with a controller. Selecting this option will make the
DV-III Ultra try to establish communication. When communication is established, "off" will be
change to "on". Temperature control will always be set to "off" when the DV-III Ultra is turned
on.
When communication is established, Line 1 of the default screen will be modied. The temperature
eld will show "CTLR" in place of "TEMP".
Communication may only be established with Brookeld controllers.
The change is selected by pressing the 3 key. Subsequent key presses required will be indicated
on the display.
4. Change the temperature display by offsetting the measured temperature to agree with an external
temperature measurement device. The adjustment will be indicated by ashing temperature
units (F or C) on the default screen (Figure II-3). The adjustment will be reset to 0.0 when the
DV-III+ is turned on.
The adjustment is entered using the number keys. The sign (+ or -) is selected using the
TAB key. The change must be conrmed by pressing the ENTER key.
Brookeld Engineering Laboratories, Inc. Page 89 Manual No. M98-211-E0912
OPTION/
Page 90

V.2 Print
1. Change the time interval that is used when the DV-III Ultra is printing continuously. Data is
entered in the format of MM:SS. For example: an interval of one minute and 30 seconds is
entered as: 01:30.
The change is initiated by pressing the 1 key. Once the time interval is input, it must be accepted
by pressing the
ENTER key.
2. Change the port to be used for printing, parallel or serial.
The change is selected by rst pressing the 2 key and then the appropriate key for the printing
method. The change will be indicated by the position of the arrow on the right side of the display.
The change is accepted by pressing the
ENTER key.
When selecting serial printing, the DV-III Ultra will also ask for handshaking status. Please see
the instruction manual of the printer for specication.
If the DV-III Ultra is communicating with an external temperature controller, serial printing
will not be available (the controller uses the serial port).
3. Enter the date and time to be shown on printed data tables. Data is entered in the format of
DD/MM/YY for date and HH:MM for time (24-hour clock). For example: 2:30 pm on January
15, 1999 is entered as 15/01/99, 14:30.
The change is initiated by pressing the 3 key. Once the data is input, it must be accepted by
pressing the
ENTER key.
V.3 Alarm
There are three adjustable alarm settings: LO ALARM %, HI ALARM % and MOTOR OFF %.
The values are set in the Set Alarms mode. Alarms are used to signal the operator that the uid is
out of the input specication. The alarms are set in % torque values, not Viscosity, Shear Stress
or Shear Rate values. The range of values which may be entered for each alarm and their default
values are:
LO ALARM HI ALARM MOTOR OFF
Minimum value: 10% Minimum value: 0% Minimum value: 0%
Maximum value: 99.9% Maximum value: 100% Maximum value: 115%
Default value: 10% Default value: 99.9% Default value: 110%
The procedure for entering and enabling alarm values is as follows starting from the main screen:
1) Press the
OPTION/TAB key to display the Options Menu.
2) Press the
3) Press the
NUMBER 3 key to display the Alarms Options screen.
NUMBER 1 key to View/Set Alarms.
4) Enter the LO ALARM % torque value. The new entry will overwrite the default values.
Brookeld Engineering Laboratories, Inc. Page 90 Manual No. M98-211-E0912
Brookeld Engineering Laboratories, Inc. Page 90 Manual No. M/98-211-B0104
Page 91

5) Press the OPTION/TAB key to move the cursor to the HI ALARM % eld.
6) Enter the HI ALARM % torque value. The new entry will overwrite the default values.
7) Press the
OPTION/TAB key to move the cursor to the MOTOR OFF % eld.
8) Enter the MOTOR OFF % torque value. The new entry will overwrite the default value.
9) Press the
10) Press the
11) Press
ENTER key to accept the ALARM values.
NUMBER 3 key to enable (turn on) / disable (turn off) the alarms.
ENTER to accept the ALARM condition.
Note: The LO ALARM is tripped after the % torque reading falls below the
setting. The beeping may be shut off by either the % torque reading
rising above the alarm setting or by pressing the ESCAPE key.
The HI ALARM is tripped after the % torque reading goes above the alarm
setting. The beeping may be shut off by either the % torque reading falling
below the alarm setting or by pressing the
ESCAPE key.
The MOTOR OFF is tripped after the % torque reading goes above the
motor off setting. The DV-III Ultra stops rotating and the instrument
beeps. Pressing any key turns off the beep.
V.4 Set Temperature
The DV-III Ultra can issue temperature control commands when an external temperature control
device has been connected (see Section V.1). Selecting item #4 Set Temp in the Options menu
will display the current setpoint. Enter the new setpoint by using the number keys and accept with
ENTER key. The temperature controller will begin using the new setpoint immediately upon the
the
press of the
Note: The sign of temperature is changed by using the arrow keys when the
ENTER key.
cursor is under the ± character. This is possible only with temperature
bath controllers.
V.5 Data
The Review Data menu allows data review of the most recently completed speed set program.
Data may be reviewed on the DV-III Ultra screen, on a serial printer, or both. The procedure for
reviewing data after a test is as follows:
1) Run a DV-III or B.E.V.I.S. program.
2) Press the
OPTION/TAB key.
3) Press the NUMBER 5 key to display the Review Data screen.
Brookeld Engineering Laboratories, Inc. Page 91 Manual No. M98-211-E0912
Page 92

REVIEW DATA
1 = SCREEN ONLY
2 = SCREEN & PRINT
3 = PRINTER ONLY
Figure V-2
4) Select one of the review modes: press “
2
” for DV-III Ultra screen and printer, or “NUMBER 3” for printer only. Note that you should
NUMBER 1” for DV-III Ultra screen only, “NUMBER
select options 2 and 3 only if the printer is connected and “on-line.”
5) If NUMBER 1 or NUMBER 2 were pressed, data from the rst step is either displayed on the
screen or displayed and printed. Press the
ENTER key to scroll through and display/print the
remaining step data.
cP=10800 STEP01
%=50.2 TIME=00:00
SS=0.0 TEMP=70.2
SR=0.0 RPM=100.0
Figure V-3
6) If the NUMBER 3 key (printer only) is selected, the DV-III Ultra prompts to “READY PRINTER
PRESS ANY KEY” or “PRINTER IS NOT READY TURN ON/PRESS ONLINE”. A sample of printed
output is shown in Figure V-4.
Sample Name:_____________________________________________________________
Operater Name:____________________________
Date: 06/21/91 Time: 10:06 Model: 2R Spindle: 31
#01 RPM=30.0 %=18.2 cP=970 D/CM2=100 1/SEC=10.2 T=22.1C TIME=00:05
#02 RPM=40.0 %=24.3 cP=972 D/CM2=132 1/SEC=13.6 T=22.1C TIME=00:05
#03 RPM=50.0 %=30.3 cP=969 D/CM2=164 1/SEC=17.0 T=22.1C TIME=00:05
#04 RPM=60.0 %=36.3 cP=967 D/CM2=197 1/SEC=20.4 T=22.1C TIME=00:05
#05 RPM=70.0 %=42.3 cP=966 D/CM2=230 1/SEC=23.8 T=22.1C TIME=00:05
Figure V-4
Review data notes:
1) The DV-III Ultra stores data from the most recent speed set program test. When a
subsequent speed set program is run, any test data in memory will be overwritten and
the previous data will be lost.
2) If the “Printer Only” option is selected, the date, time of day, model and spindle
number are printed with the test results. The DV-III Ultra does not store time and date
when it is turned off; therefore, the time and date must be entered when printing the
rst time after start-up. See Section V. 2 .
Brookeld Engineering Laboratories, Inc. Page 92 Manual No. M98-211-E0912
Brookeld Engineering Laboratories, Inc. Page 92 Manual No. M/98-211-B0104
Page 93

3) The DV-III Ultra may be set-up to “handshake” (using XOn/XOff protocol) or not
handshake when connected to a serial printer. If you opt to use the handshake mode,
your printer is “on line”, all cable connections are correct and your printer is set for
handshake mode, then data should appear on your printer immediately. If it does not
appear, and instead you see the message:
ONLINE” then you should turn the handshake option off. See Section V.2 .
V.6 Timed Data Collection
“PRINTER IS NOT READY TURN ON/PRESS
The DV-III Ultra offers three methods of time control that may be used independently of the control
programs for making viscosity measurements described in IV.2 and IV.3. These techniques result
in a single data point collected at the end of the test. If multiple points are required, the rheometer
should be connected to a printer and set up with an appropriate print interval.
S
TIME TO TORQUE
The DV-III Ultra will record the amount of time required to reach the specied % torque value at
a single speed. Torque and speed are input using the number keys and
will begin immediately upon the press of the
ENTER key.
OPTIONS/TAB key. The test
The test will end when the specied torque level is reached (in either an upward or downward
direction). The data will be displayed as shown in Figure V-5. The SELECT DISPLAY key can be
used to view all measurement parameters. The
PRINT key can be used to send a single data line to
the printer.
RPM:OFF SPINDLE:31
TEMP:72.1 F PRTN
TIME TO TORQUE DONE
TORQ=89.4 % m=03S=22
Figure V-5
Note: If continuous printing was used during the test, it will be suspended when viewing
the test data or entering time to torque parameters.
TIMED STOP
S
The DV-III Ultra will operate at a single RPM for a specied period of time. Time and speed are
entered using the number keys and OPTIONS/TAB key. The test will begin immediately upon the
press of the ENTER key.
The test will end when the specied time interval has elapsed. The data will be shown as displayed
in Figure V-6. The SELECT DISPLAY key can be used to view all measurement parameters. The PRINT
key can be used to send a single dataline to the printer.
RPM:OFF SPINDLE:31
TEMP:72.1 F PRTN
TIMED STOP TEST DONE
TORQ=82.4 % m=02s=30
Figure V-6
Brookeld Engineering Laboratories, Inc. Page 93 Manual No. M98-211-E0912
Page 94

Note: Continuous print mode may be used in conjunction with Timed Stop to
print data throughout the time period. Printing will occur only during
the test.
S TIMED AVERAGE
The DV-III Ultra will collect a specied number of data points over a period of time and present
the average reading (arithmetic average). Time, speed and the number of data points are entered
using the number keys and
ENTER key. Non-averaged data will be displayed during the test.
the
OPTIONS/TAB key. The test will begin immediately upon the press of
The test will end when the specied time interval has elapsed. The averaged data point will be
shown as displayed in Figure V-7. The SELECT DISP key can be used to view the average value of
all measurement parameters. The
PRINT key can be used to send a single averaged dataline to the
printer.
DATA AVERAGING
300 READINGS WERE
AVG'D OVER 02:30 M:S
AVERAGE TORQUE=90.3
Figure V-7
Note: Printing during a Timed Average test will show non-averaged data.
Averaged data is available only at the conclusion of the test. Printing the
averaged data must be done with the PRINT key at the end of the test.
Brookeld Engineering Laboratories, Inc. Page 94 Manual No. M98-211-E0912
Brookeld Engineering Laboratories, Inc. Page 94 Manual No. M/98-211-B0104
Page 95

APPENDIX A - Cone/Plate Rheometer Set-Up
Pilot Light
(red)
Toggle Swtich
Contact Light
(yellow)
Sliding Reference
Marker
Micrometer
Adjustment Ring
This Cone/Plate version of the DV-III Ultra uses the same operating instruction procedures as described
in this manual. However, the “gap” between the cone and the plate must be veried/adjusted before
measurements are made. This is done by moving the plate (built into the sample cup) up towards the
cone until the pin in the center of the cone touches the surface of the plate, and then by separating
(lowering) the plate 0.0005 inch (0.013mm).
Programmable DV-III Ultra Cone/Plate Viscometers, S/N 50969 and higher, have an Electronic Gap
Setting feature. This feature enables the user to easily nd the 0.0005 inch gap setting that was established
at Brookeld prior to shipment.
The following information explains how to set the Electronic Gap and verify calibration of the DV-III
Ultra Viscometer. Acceptable operating temperature range is 0ºC to 100ºC. Be careful about condensation
and the possible formation of ice crystals when approaching 0ºC. Setting the gap should be accomplished
at the same temperature that you intent to use for testing your material.
A.1 ELELECTRONIC GAP SETTING FEATURES
TOGGLE SWITCH allows you to enable/disable the Electronic Gap Setting Feature: left position is OFF
(disabled), right position is ON (enabled).
PILOT LIGHT is the red (LED) light; when illuminated, it means the Electronic Setting Function is
sensing (enabled).
CONTACT LIGHT is the yellow (LED) light; when it rst turns on, the “hit point” has been found.
SLIDING REFERENCE MARKER is used after nding the “hit point;” it is the reference for establishing
the 0.0005 inch gap.
MICROMETER ADJUSTMENT RING is used to move the cup up or down in relation to the cone spindle.
Turning the ring left (clockwise) lowers the cup; turning it right (counterclockwise) raises the cup.
Each line on the ring represents one scale division and is equivalent to 0.0005 inch movement of the
plate relative to the cone.
Brookeld Engineering Laboratories, Inc. Page 95 Manual No. M98-211-E0912
Brookeld Engineering Laboratories, Inc. Page 95 Manual No. M/98-211-B0104
Figure A-1
Page 96

A.2 SET-UP
Bath/Circulator
Bath
Inlet
Bath
Outlet
Sample
Cup
(CPE-44Y
or
CPE-44P)
Cup
Outlet
Cup
Inlet
Spindle
Wrench
(CPE) Cone
These surfaces
must be clean!
Coupling Nut
Micrometer
Adjustment
Ring
Do Not hit the
CONE with the CUP!
1. Be sure that the Viscometer is securely
mounted to the Laboratory Stand, leveled
and zeroed with no cone or cup attached and
0% torque is displayed.
2. Figure A-2 shows a typical water bath setup.
Connect the sample cup inlet/outlet ports to
the water bath inlet and outlet and set the
bath to the desired test temperature. Allow
sufcient time for the bath to reach the test
temperature.
3. The Viscometer has been supplied with a
special cone spindle(s) which contains the
Electronic Gap Setting feature. The “CPE”
part number designation on the cone veries
the Electronic Gap Setting feature. Note:
The “CPE” cone or cup cannot be used with
earlier DV-III Ultra cone/plate Viscometers
(below S/N50969) which do not have the
electronic gap setting feature.
Figure A-2
4. With the motor off, thread the cone spindle
by using the spindle wrench to secure the
viscometer coupling nut (see Figure A-3);
Figure A-3
gently push up on the coupling nut and hold
this securely with the wrench. Thread the
cone spindle by hand. Note: Left Hand
Threads.
5. Attach the cup, taking care not to hit the cone
with the cup (Figure A-4).
The viscosity of electrically conductive
uids may be affected if readings are taken
with the Electronic Gap Setting feature
“on”. Be sure to shut the feature “off”
before taking readings!
Brookeld Engineering Laboratories, Inc. Page 96 Manual No. M98-211-E0912
Figure A-4
Page 97

A.3 SETTING THE GAP
Moves Away
from Hit Point
(clockwise)
LEFTx
Moves Towards
Hit Point
(counter-clockwise)
RIGHT
Full Scale
Division Marks
Sliding
Reference
Marker
1. Move the toggle switch to the right; this will
turn on (enable) the Gap Setting Feature.
The Pilot (red) light will be illuminated.
2. If the contact light (yellow) is illuminated,
turn the micrometer adjustment ring
clockwise (as you look down on the
instrument) until the light is just breaking
contact, i.e., ickering (see Figure A-5).
3. If the yellow contact light is not illuminated,
slowly turn the micrometer adjustment ring in
small increments (one or two scale divisions)
counter-clockwise.
Continue moving the micrometer adjustment
ring slowly counter-clockwise until the
contact light (yellow) turns on. Back off
(rotate clockwise) until the light is just
breaking contact, i.e., ickering.
Figure A-5
4. Adjust the sliding reference marker, right or
left, to the closest full scale division mark
(see Figure A-6).
5. Turn the micrometer adjustment ring one
scale division to the left to meet the line
on the sliding reference marker. THE
YELLOW CONTACT LIGHT SHOULD
GO OFF.
6. You have established the gap space needed
for measurement. Now turn the toggle
switch OFF (left); the red pilot light should
go off.
7. Carefully remove the sample cup.
Note:
1. The cup may be removed and replaced without resetting the gap if the micrometer
adjustment ring has not been moved.
2. Remove the spindle from the viscometer when cleaning.
3. Re-establish the hit point every time the spindle is attached/detached.
Figure A-6
Brookeld Engineering Laboratories, Inc. Page 97 Manual No. M98-211-E0912
Brookeld Engineering Laboratories, Inc. Page 97 Manual No. M/98-211-B0104
Page 98

A.4 VERIFYING CALIBRATION
Cone Sample Volume
Par t No.
CPA-40 0.5 ml
CPA-41 2.0 ml
CPA-42 1.0 ml
CPA-51 0.5 ml
CPA-52 0.5 ml
Table A6
1. Determine the appropriate sample volume.
Refer to Table A-1 to determine the correct
sample volume required for the spindle to be
utilized.
2. Select a Brookeld Viscosity Standard uid
that will give viscosity readings between
10% and 100% of full scale range. Refer
to Appendix B for viscosity ranges of cone
Table A-1
spindles; ranges listed apply to CPA cones.
Do not use a silicone viscosity standard uid with a viscosity value greater than 5000 cP with a
Cone/Plate. Brookeld offers a complete range of mineral oil viscosity standards suitable for
use with Cone/Plates for viscosities above 5,000 cP or shear rates above 500 sec
-1
; see Table E-2
in Appendix E for a list of available uids.
It is best to use a viscosity standard uid that will be close to the maximum viscosity for a given
cone spindle/speed combination.
Example: LVDV-III Ultra Viscometer, Cone Spindle CPE-42, Brookeld Silicone
Viscosity Standard having a viscosity of 9.7 cP at 25°C
At 60 RPM, the full scale viscosity range is 10.0 cP. Thus, the Viscometer reading should be
97% torque and 9.7 cP viscosity ± 0.197 cP. The allowable error (±0.197 cP) is a combination
of Viscometer accuracy and uid tolerance (refer to Interpretation of Calibration Test Results
at the end of Appendix E).
3. Set the gap as described in Section A.3.
4. With the motor off, remove the sample cup and place the viscosity standard uid into the cup.
5. Attach the sample cup to the Viscometer and allow sufcient time for the sample, cup and cone
to reach temperature equilibrium.
6. Turn the motor on. Set the desired speed(s). Measure the viscosity and record the reading in
both % torque and centipoise (cP).
Note: The cone spindle must rotate at least ve (5) times before a viscosity
reading is taken.
7. Verify that the viscosity reading is within the allowable 1% deviation, as explained earlier, for
the specic viscosity standard uid(s) that you are using.
* The CPE designation on the cone spindle indicates use with Electronic Gap Setting Cone/Plate
Viscometers/Rheometers only.
Brookeld Engineering Laboratories, Inc. Page 98 Manual No. M98-211-E0912
Page 99

APPENDIX B - Viscosity Ranges
The table below (Universal Spindle Ranges) lists the Spindle Range Coefcients for all spindles used
on DV-III Ultra Rheometers. Dividing the coefcient number by any of the 2,500 Rheometer speeds
will give the full scale viscosity range for a Rheometer/spindle/speed combination.
Universal Spindle Ranges
Spindle Entry Code
LV RV HA HB
RV1 01 937 10,000 20,000 80,000
RV2 02 3,750 40,000 80,000 320,000
RV3 03 9,375 100,000 200,000 800,000
RV4 04 18,750 200,000 400,000 1,600,000
RV5 05 37,500 400,000 800,000 3,200,000
RV6 06 93,750 1,000,000 2,000,000 8,000,000
RV7 07 375,000 4,000,000 8,000,000 32,000,000
HA1 01 937 10,000 20,000 80,000
HA2 02 3,750 40,000 80,000 320,000
HA3 03 9,375 100,000 200,000 800,000
HA4 04 18,750 200,000 400,000 1,600,000
HA5 05 37,500 400,000 800,000 3,200,000
HA6 06 93,750 1,000,000 2,000,000 8,000,000
HA7 07 375,000 4,000,000 8,000,000 32,000,000
HB1 01 937 10,000 20,000 80,000
HB2 02 3,750 40,000 80,000 320,000
HB3 03 9,375 100,000 200,000 800,000
HB4 04 18,750 200,000 400,000 1,600,000
HB5 05 37,500 400,000 800,000 3,200,000
HB6 06 93,750 1,000,000 2,000,000 8,000,000
HB7 07 375,000 4,000,000 8,000,000 32,000,000
SPINDLE RANGE COEFFICIENT
Rheometer Series
LV1 61 6,000 64,000 128,000 512,000
LV2 62 30,000 320,000 640,000 2,560,000
LV3 63 120,000 1,280,000 2,560,000 10,240,000
LV4 64 600,000 6,400,000 12,800,000 51,200,000
LV5 65 1,200,000 12,800,000 25,600,000 102,400,000
T-A 91 18,750 200,000 400,000 1,600,000
T-B 92 37,440 400,000 800,000 3,200,000
T-C 93 93,600 1,000,000 2,000,000 8,000,000
T-D 94 187,200 2,000,000 4,000,000 16,000,000
T-E 95 468,000 5,000,000 10,000,000 40,000,000
T-F 96 936,000 10,000,000 20,000,000 80,000,000
Brookeld Engineering Laboratories, Inc. Page 99 Manual No. M98-211-E0912
Brookeld Engineering Laboratories, Inc. Page 99 Manual No. M/98-211-B0104
Page 100

Universal Spindle Ranges (cont.)
Spindle Entry Code
LV RV HA HB
Spiral 70 98,400 1,050,000 2,100,000 8,400,000
ULA 00 600 6,400 12,800 51,200
DIN-81 81 3,420 36,500 73,000 292,000
DIN-82 82 3,420 36,500 73,000 292,000
DIN-83 83 11,340 121,300 242,600 970,400
DIN-85 85 1,144 12,200 24,400 97,600
DIN-86 86 3,420 36,500 73,000 292,000
SC4-14 14 117,200 1,250,000 2,500,000 10,000,000
SC4-15 15 46,880 500,000 1,000,000 4,000,000
SC4-16 16 120,000 1,280,000 2,560,000 10,240,000
SC4-18 18 3,000 32,000 64,000 256,000
SC4-21 21 4,688 50,000 100,000 400,000
SC4-25 25 480,000 5,120,000 10,240,000 40,960,000
SC4-27 27 23,400 250,000 500,000 2,000,000
SC4-28 28 46,880 500,000 1,000,000 4,000,000
SC4-29 29 93,750 1,000,000 2,000,000 8,000,000
SC4-31 31 30,000 320,000 640,000 2,560,000
SC4-34 34 60,000 640,000 1,280,000 5,120,000
SC4-37 37 234,000 250,000 500,000 2,000,000
SPINDLE RANGE COEFFICIENT
Rheometer Series
CP/CPE/CPA-40 40 307 3,270 6,540 26,160
CP/CPE/CPA-41 41 1,151 12,280 24,560 98,240
CP/CPE/CPA-42 42 600 6,400 12,800 51,200
CP/CPE/CPA-51 51 4,854 51,780 103,560 414,240
CP/CPE/CPA-52 52 9,300 99,220 198,440 793,760
V-71 71 2,456 26,200 52,400 209,600
V-72 72 10,404 111,000 222,000 888,000
V-73 73 50,146 535,000 1,070,000 4,280,000
V-74 74 508,954 5,430,000 10,860,000 43,440,000
Note: RV spindle ranges are calculated with the RV Guardleg in use.
LV spindle ranges are calculated with the LV Guardleg in use.
Example 1: Determine the full scale viscosity range of the LV3 spindle running on an RV series
Rheometer at 45 RPM.
Spindle Speed = 45 RPM
Brookeld Engineering Laboratories, Inc. Page 100 Manual No. M98-211-E0912
 Loading...