

Page 1
N
Revision 6 Feb/2009
006-18237-0000
Multi-Function Display
KMD 550/850
Flight Information Services
(FIS)
Pilot’s Guide Addendum
B
For Software Version 02/02 and later
Page 2

WARNING
The enclosed technical data is eligible for export under License Designation
NLR and is to be used solely by the individual/organization to whom it is
addressed. Diversion contrary to U.S. law is prohibited.
COPYRIGHT NOTICE
Copyright © 2001, 2002, 2004, 2007, 2009 Honeywell International Inc.
All rights reserved.
Reproduction of this publication or any portion thereof by any means without
the express written permission of Honeywell International Inc. is prohibited. For
further information contact the Manager, Technical Publications; Honeywell,
One Technology Center, 23500 West 105th Street, Olathe, Kansas 66061.
Telephone: (913) 782-0400.
The information contained in this manual is for reference use only. If
any information contained herein conflicts with similar information
contained in the Airplane Flight Manual Supplement, the information in
the Airplane Flight Manual Supplement shall take precedence.
Page 3

R-1
Revision History
Manual KMD 550/850 Flight Information Services (FIS)
Pilot’s Guide Addendum
Revision 6, February 2009
Part Number 006-18237-0000
Summary
Added XM products:
Precipitation Type (at Surface)
Freezing Levels
Winds Aloft
Translated Metars
Temporary Flight Restrictions (TFR’s)
Page 4

R-2
Revision History
Manual KMD 550/850 Flight Information Services (FIS)
Pilot’s Guide Addendum
Revision 5, March 2007
Part Number 006-18237-0000
Summary
Added XM Receiver functionality.
Page 5

R-3
Revision History
Manual KMD 550/850 Flight Information Services (FIS)
Pilot’s Guide Addendum
Revision 4, November 2004
Part Number 006-18237-0000
Summary
Add FIS Area Products (AIRMETs, SIGMETs, Convective SIGMETs
and Alert Weather Watches).
MODE Softkey now displays product selection menu on FIS product
displays
Control Knob now allows cycling through graphical FIS products
Airport icons and identifiers are now displayed on FIS graphical product map displays per setting on Map Setup Page (2)
Added VOR icons and identifiers to FIS graphical product map displays (except graphical METARs) per setting on Map Setup Page (2)
Extended Track Line on Graphical Weather page
Page 6

R-4
Revision History
Manual KMD 550/850 Flight Information Services (FIS)
Pilot’s Guide Addendum
Revision 3, June 2004
Part Number 006-18237-0000
Summary
METARs and SPECIs now expire after 120 minutes
Graphical METAR LIFR now displayed as magenta color
Miscellaneous corrections
Page 7

R-5
Revision History
Manual KMD 550/850 Flight Information Services (FIS)
Pilot’s Guide Addendum
Revision 2, November 2002
Part Number 006-18237-0000
Summary
Added FIS subscription management
Changed FIS Text Page format
Changed FIS METARs time-out
Airports now shown on NEXRAD Page
Changed FIS Network Page
Miscellaneous corrections
Page 8

R-6
Revision History
Manual KMD 550/850 Flight Information Services (FIS)
Pilot’s Guide Addendum
Revision 1, May 2002
Part Number 006-18237-0000
Summary
Complete manual revision
Page 9

Revision History
Manual KMD 550/850 Flight Information Services (FIS)
Pilot’s Guide Addendum
Revision 0, November 2001
Part Number 006-18237-0000
Summary
This is the original release of this publication.
R-7
Page 10

Revision 6 Feb/2009
KMD 550/850 FIS Addendum
Table of Contents
INTRODUCTION . . . . . . . . . . . . . . . . . . . . . . . . . . . . . . . . . . . . . . . . . . . . . . . .1
CONCEPT OF OPERATION . . . . . . . . . . . . . . . . . . . . . . . . . . . . . . . . . . .1
EQUIPMENT OVERVIEW . . . . . . . . . . . . . . . . . . . . . . . . . . . . . . . . . . . . .4
DATALINK WEATHER FUNCTION STATUS ICONS . . . . . . . . . . . . . . . .5
BASIC SERVICE WEATHER PRODUCTS . . . . . . . . . . . . . . . . . . . . . . . . . . .6
METAR . . . . . . . . . . . . . . . . . . . . . . . . . . . . . . . . . . . . . . . . . . . . . . . . . . .6
SPECI . . . . . . . . . . . . . . . . . . . . . . . . . . . . . . . . . . . . . . . . . . . . . . . . . . .7
TAF . . . . . . . . . . . . . . . . . . . . . . . . . . . . . . . . . . . . . . . . . . . . . . . . . . .8
PIREP (VDL ONLY) . . . . . . . . . . . . . . . . . . . . . . . . . . . . . . . . . . . . . . . . . .9
AIRMET . . . . . . . . . . . . . . . . . . . . . . . . . . . . . . . . . . . . . . . . . . . . . . . . . . .9
SIGMET . . . . . . . . . . . . . . . . . . . . . . . . . . . . . . . . . . . . . . . . . . . . . . . . . .10
CONVECTIVE SIGMET . . . . . . . . . . . . . . . . . . . . . . . . . . . . . . . . . . . . . .10
ALERT WEATHER WATCHES (VDL ONLY) . . . . . . . . . . . . . . . . . . . . .11
VALUE ADDED SERVICE WEATHER PRODUCTS . . . . . . . . . . . . . . . . . . .12
NEXRAD . . . . . . . . . . . . . . . . . . . . . . . . . . . . . . . . . . . . . . . . . . . . . . . . . .12
NEXRAD Abnormalities . . . . . . . . . . . . . . . . . . . . . . . . . . . . . . . . . .13
NEXRAD Limitations . . . . . . . . . . . . . . . . . . . . . . . . . . . . . . . . . . . . .14
Intensity . . . . . . . . . . . . . . . . . . . . . . . . . . . . . . . . . . . . . . . . . . . . . . .15
PRECIPITATION TYPE AT SURFACE . . . . . . . . . . . . . . . . . . . . . . . . . .16
FREEZING LEVELS . . . . . . . . . . . . . . . . . . . . . . . . . . . . . . . . . . . . . . . . .17
WINDS ALOFT . . . . . . . . . . . . . . . . . . . . . . . . . . . . . . . . . . . . . . . . . . . . .19
GRAPHICAL METAR . . . . . . . . . . . . . . . . . . . . . . . . . . . . . . . . . . . . . . . .22
GRAPHICAL AIRMET . . . . . . . . . . . . . . . . . . . . . . . . . . . . . . . . . . . . . . .23
GRAPHICAL SIGMET . . . . . . . . . . . . . . . . . . . . . . . . . . . . . . . . . . . . . . .23
GRAPHICAL CONVECTIVE SIGMET . . . . . . . . . . . . . . . . . . . . . . . . . . .24
GRAPHICAL ALERT WEATHER WATCHES (VDL ONLY) . . . . . . . . . .24
STARTUP . . . . . . . . . . . . . . . . . . . . . . . . . . . . . . . . . . . . . . . . . . . . . . . . . .25
SUBSCRIPTIONS . . . . . . . . . . . . . . . . . . . . . . . . . . . . . . . . . . . . . . . . . . . . . .25
VDL SUBSCRIPTIONS . . . . . . . . . . . . . . . . . . . . . . . . . . . . . . . . . . . . . .25
Setting Up a VDL Subscription . . . . . . . . . . . . . . . . . . . . . . . . . . . . .27
Checking FIS VDL Subscriptions . . . . . . . . . . . . . . . . . . . . . . . . . . .30
XM WX SUBSCRIPTIONS . . . . . . . . . . . . . . . . . . . . . . . . . . . . . . . . . . . .31
Setting Up An XM WX Subscription . . . . . . . . . . . . . . . . . . . . . . . . .31
Checking XM WX Subscriptions . . . . . . . . . . . . . . . . . . . . . . . . . . . .32
i
Page 11

Revision 6 Feb/2009
KMD 550/850 FIS Addendum
NORMAL OPERATION . . . . . . . . . . . . . . . . . . . . . . . . . . . . . . . . . . . . . . . . . .34
NEXRAD PAGE . . . . . . . . . . . . . . . . . . . . . . . . . . . . . . . . . . . . . . . . . . . .35
NEXRAD Page Operational Controls . . . . . . . . . . . . . . . . . . . . . . . .36
Selecting And Using The NEXRAD Page . . . . . . . . . . . . . . . . . . . . .36
PRECIPITATION TYPE AT SURFACE . . . . . . . . . . . . . . . . . . . . . . . . . .40
PRECIPITATION TYPE Page Operational Controls . . . . . . . . . . . .41
FREEZING LEVELS . . . . . . . . . . . . . . . . . . . . . . . . . . . . . . . . . . . . . . . . .42
FREEZING LEVELS Page Operational Controls . . . . . . . . . . . . . . .43
WINDS ALOFT . . . . . . . . . . . . . . . . . . . . . . . . . . . . . . . . . . . . . . . . . . . . .44
WINDS ALOFT Page Operational Controls . . . . . . . . . . . . . . . . . . .45
GRAPHICAL METARS PAGE . . . . . . . . . . . . . . . . . . . . . . . . . . . . . . . . .46
Graphical METARs Page Operational Controls . . . . . . . . . . . . . . . .47
Selecting And Using The Graphical METARs Page . . . . . . . . . . . . .47
GRAPHICAL AIRMETS PAGE . . . . . . . . . . . . . . . . . . . . . . . . . . . . . . . .50
Graphical AIRMETs Page Operational Controls . . . . . . . . . . . . . . .51
Selecting And Using The Graphical AIRMETs Page . . . . . . . . . . . .51
GRAPHICAL SIGMETS PAGE . . . . . . . . . . . . . . . . . . . . . . . . . . . . . . . .54
Graphical SIGMETs Page Operational Controls . . . . . . . . . . . . . . .54
Selecting And Using The Graphical SIGMETs Page . . . . . . . . . . . .55
GRAPHICAL CONVECTIVE SIGMETS PAGE . . . . . . . . . . . . . . . . . . . .58
Graphical Convective SIGMETs Page Operational Controls . . . . . .59
Selecting And Using The Graphical Convective SIGMETs Page . .59
GRAPHICAL ALERT WEATHER WATCHES PAGE (AWW)
(VDL ONLY) . . . . . . . . . . . . . . . . . . . . . . . . . . . . . . . . . . . . . . . . . . . . . . .62
Graphical Alert Weather Watches Page Operational Controls . . . .63
Selecting And Using The Graphical Alert Weather Watches Page .63
FIS TEXT PAGE . . . . . . . . . . . . . . . . . . . . . . . . . . . . . . . . . . . . . . . . . . . .66
FIS Text Page Operational Controls . . . . . . . . . . . . . . . . . . . . . . . . .67
Using The FIS TEXT Page . . . . . . . . . . . . . . . . . . . . . . . . . . . . . . . .68
Changing Modes & Area . . . . . . . . . . . . . . . . . . . . . . . . . . . . . .69
Selecting Identifiers Using The DATA/SCAN Knob . . . . . . . . .70
Scanning Flightplan Waypoints . . . . . . . . . . . . . . . . . . . . .70
Finding User Defined Areas By Identifier . . . . . . . . . . . . . .70
Finding User Defined Areas by Name or City . . . . . . . . . .72
FIS NETWORK STATUS PAGE (VDL ONLY) . . . . . . . . . . . . . . . . . . . .76
ii
Table of Contents
Page 12

iii
MESSAGES . . . . . . . . . . . . . . . . . . . . . . . . . . . . . . . . . . . . . . . . . . . . . . . . . .79
FIS ALERT, NO VALID FIS SUBSCRIPTIONS . . . . . . . . . . . . . . . . . . . .79
NO DATA RECEIVED FROM FIS RECEIVER . . . . . . . . . . . . . . . . . . . .79
(PRODUCT) NOT AVAILABLE, DATA NOT RECEIVED . . . . . . . . . . . .79
NO (PRODUCT) AVAILABLE IN SELECTED AREA . . . . . . . . . . . . . . .80
FIS ALERT, FIS DATA NOT RECEIVED FOR 15 MINUTES . . . . . . . . .80
NO (PRODUCT) AVAILABLE, DATA NOT RECEIVED . . . . . . . . . . . . .80
INVALID ENTRY, PLEASE CHECK CODE (VDL ONLY) . . . . . . . . . . . .81
ERROR PROCESSING SUBSCRIPTION CODE (VDL ONLY) . . . . . . .81
FIS DECRYPTION FAILURE. UNABLE TO ACCEPT A NEW . . . . . . . . .
SUBSCRIPTION CODE (VDL ONLY) . . . . . . . . . . . . . . . . . . . . . . . . . . .81
NETWORK STATUS NOT AVAILABLE, DATA NOT RECEIVED
(VDL ONLY) . . . . . . . . . . . . . . . . . . . . . . . . . . . . . . . . . . . . . . . . . . . . . . .82
FIS ALERT, ONE OR MORE FIS SUBSCRIPTIONS ARE CLOSE TO
EXPIRING. PLEASE REVIEW YOUR SUBSCRIPTIONS (VDL ONLY) .82
FIS ALERT, ONE OR MORE FIS SUBSCRIPTIONS HAVE EXPIRED.
PLEASE REVIEW YOUR SUBSCRIPTIONS (VDL ONLY) . . . . . . . . . .82
FIS ALERT, DATA CARD UPDATE REQUIRED FOR CONTINUED
RECEPTION OF FIS DATA (VDL ONLY) . . . . . . . . . . . . . . . . . . . . . . . .83
FIS ALERT, NEW DATA CARD NOT YET VALID. UNABLE TO
RECEIVE FIS DATA (VDL ONLY) . . . . . . . . . . . . . . . . . . . . . . . . . . . . . .83
FIS ALERT, DATA CARD HAS EXPIRED. UNABLE TO RECEIVE
FIS DATA (VDL ONLY) . . . . . . . . . . . . . . . . . . . . . . . . . . . . . . . . . . . . . .83
FIS ALERT, FIS SUBSCRIPTION ERROR. SWITCH OFF AND
REPLACE DATA CARD (VDL ONLY) . . . . . . . . . . . . . . . . . . . . . . . . . . .84
FIS ALERT, FIS DECRYPTION ERROR. UNABLE TO RECEIVE
FIS DATA (VDL ONLY) . . . . . . . . . . . . . . . . . . . . . . . . . . . . . . . . . . . . . .84
APPENDIX A, UNDERSTANDING TEXTUAL AVIATION WEATHER
REPORTS . . . . . . . . . . . . . . . . . . . . . . . . . . . . . . . . . . . . . . . . . . . . . . . . .A-1
APPENDIX B, COMMON WEATHER ABBREVIATIONS . . . . . . . . . . . . . .B-1
Revision 6 Feb/2009
KMD 550/850 FIS Addendum
Table of Contents
Page 13

iv
Revision 6 Feb/2009
KMD 550/850 FIS Addendum
Table of Contents
Intentionally left blank
Page 14
Revision 6 Feb/2009
KMD 550/850 FIS Addendum
1
INTRODUCTION
CONCEPT OF OPERATION
The Flight Information Services (FIS) system supplies real-time weather
information and other flight advisory information to pilots to enhance situation awareness.
FIS or XM weather is not intended to replace voice radio services. Voice
communication of weather and meteorological information, in accordance with FAA operating rules, is still required.
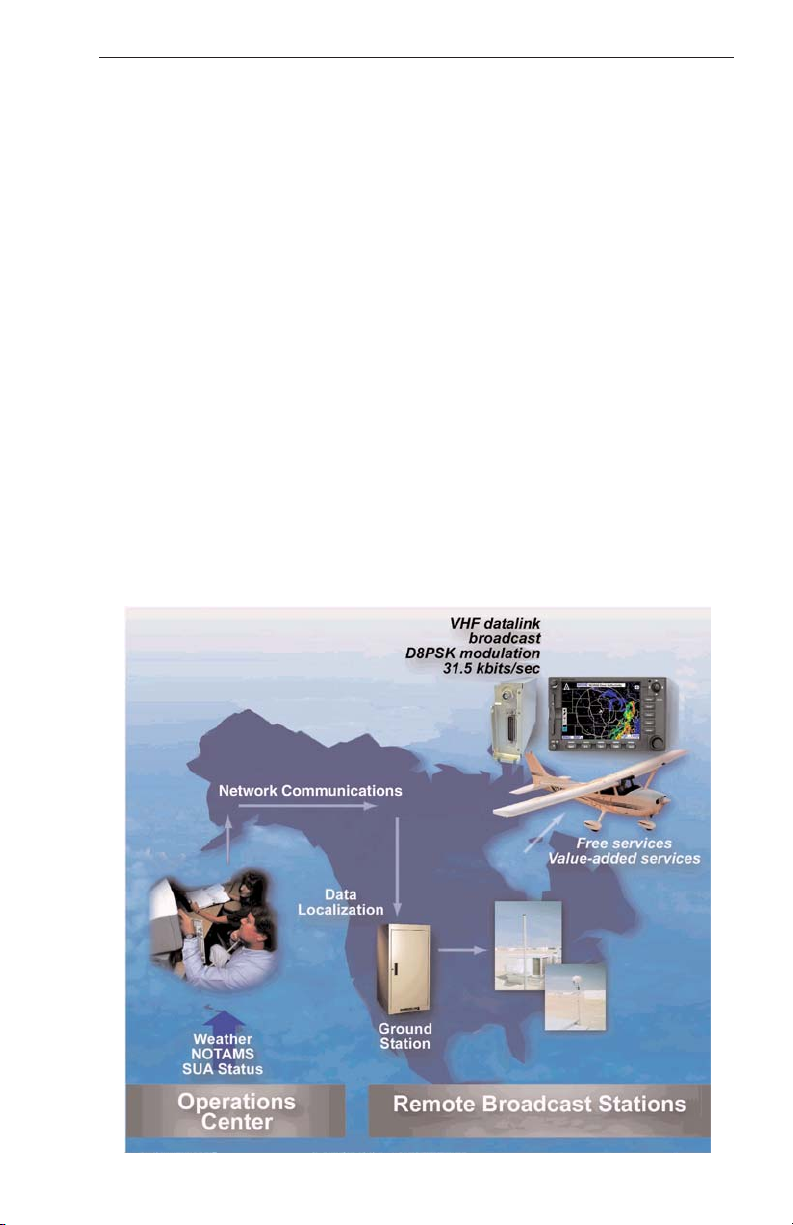
Real-time weather is available 24 hours / day, 7 days / week. Two different systems are available for delivery of the weather data: a groundbased VHF Data Link (VDL) network and Baron WxWorx weather delivered via the XM Radio satellite system. Data acquired from FAA
approved weather sources is processed and then distributed to VDL
Ground Stations and to the XM satellite network. The Ground Stations
broadcast the information over a VHF Data Link (VDL) to aircraft within
line-of-sight utilizing VDL mode 2 transmitters at a bit rate up to 31.5
kbps. The XM satellite network uses two geosynchronous satellites to
broadcast network weather to aircraft at S-band (2.3 GHz) frequencies.
This diagram illustrates how FIS VDL data is received in the aircraft.
Introduction
Page 15
2
Revision 6 Feb/2009
KMD 550/850 FIS Addendum
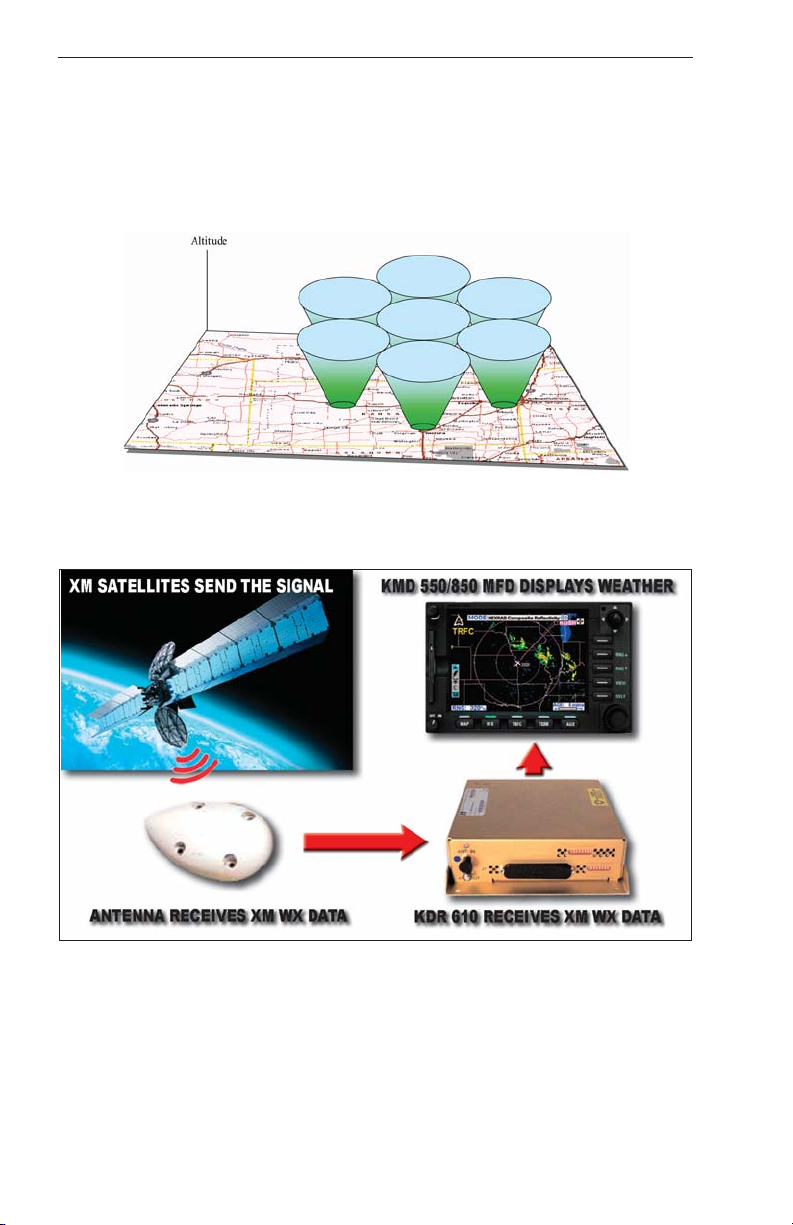
See our website at www.bendixking.com for VDL network status and
coverage. Continuous coverage of most of the continental US is possible
at altitudes as low as 5,000 ft. AGL, except for regions of precipitous terrain. As with all VHF communications, the line-of-sight range increases
with altitude. However, there is no appreciable increase in coverage
above 17,500 ft MSL. The following illustration shows how altitude influences FIS VDL coverage.
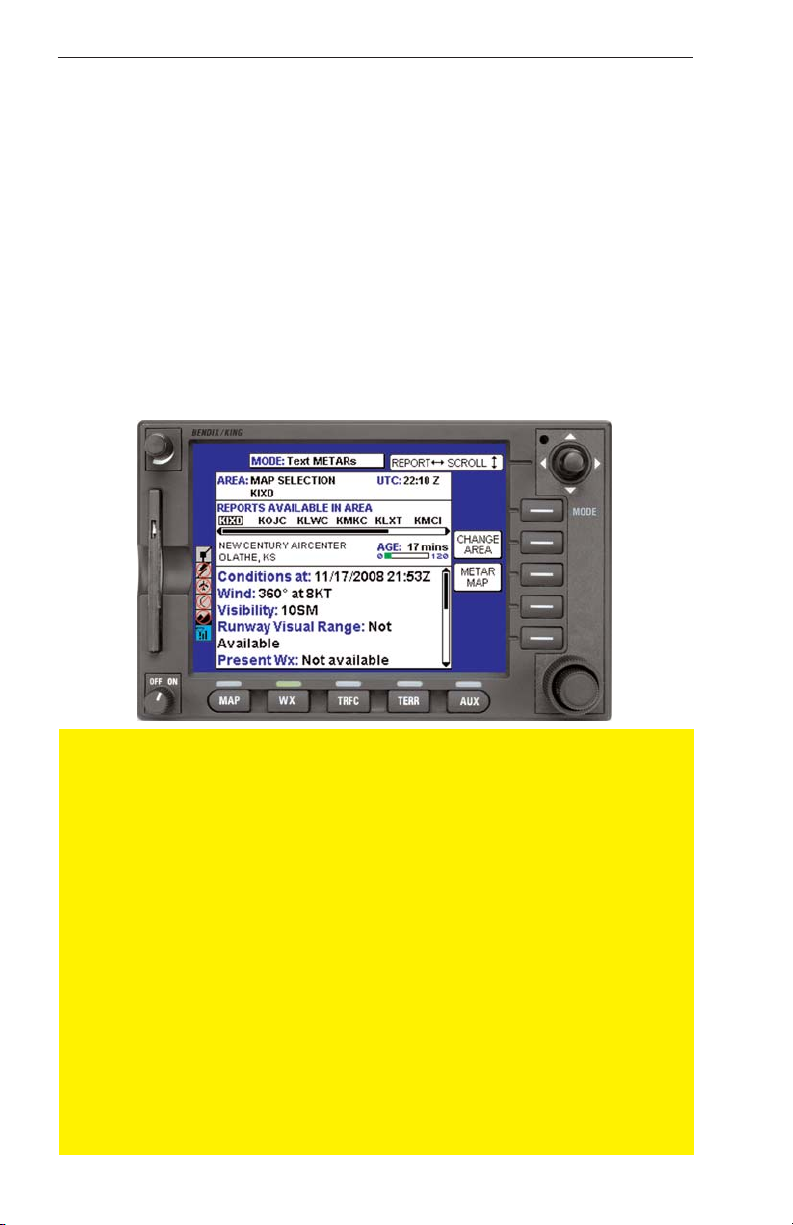
The following diagram illustrates how XM Wx data is received in the aircraft.
The XM Satellite Radio weather system provides continuous coverage
down to ground level over the entire continental United States. A good
view of the southern horizon must be available in order to receive at least
one of the two satellites.
To receive FIS or XM WX products, an aircraft must be equipped with a
compatible VDL receiver (KDR 510) or XM receiver (KDR 610), dedicated VHF antenna or satellite antenna, and appropriate display (KMD
550/850). FIS VDL uses a one-way (ground-to-air) broadcast protocol.
Introduction
Page 16

Revision 6 Feb/2009
KMD 550/850 FIS Addendum
3
XM WX uses one-way (satellite network to air) broadcast protocol. Data
is continually broadcast without the need to request information, nor
acknowledge receipt.
Both basic (no-cost) and value added fee-based products are transmitted
by VDL. Basic VDL products are displayed using standard ICAO/WMO
textual format.
The VDL ground station network and the XM satellite network repetitively
broadcast the same product until either newer data is available or the
information has exceeded a pre-determined expiration time. Basic products are broadcast at least once every 5 minutes by the VDL system.
Products are broadcast once every 5 - 12 minutes (depending on the
product) by the XM system.
NOTE: Due to inherent delays, areas of coverage and relative age and
availability of the data that can be experienced, weather data cannot
be viewed as an absolute depiction of conditions at a specific location.
Introduction
No-cost VDL Subscription Fee-based XM Subscription
Aviation Routine Weather Reports (METARs) Aviation Routine Weather Reports (METARs)
Aviation Selected Special Weather Reports
(SPECIs)
Aviation Selected Special Weather Reports
(SPECIs)
Terminal Area Forecasts (TAFs) Terminal Area Forecasts (TAFs)
Pilot Reports (PIREPs)
AIRMETs AIRMETs
SIGMETs SIGMETs
Convective SIGMETs Convective SIGMETs
Alert Weather Watches (AWW)
Fee-based VDL Subscription
NEXRAD Base Reflectivity NEXRAD Composite Reflectivity
Graphical METARs Graphical METARs
Graphical AIRMETs Graphical AIRMETs
Graphical SIGMETs Graphical SIGMETs
Graphical Convective SIGMETs Graphical Convective SIGMETs
Graphical Alert Weather Watches
Precipitation Type, Freezing Levels, Winds
Aloft, Severe Weather Storm Track SCITs,
Temporary Flight Restrictions TFR's
Page 17
4
Revision 6 Feb/2009
KMD 550/850 FIS Addendum
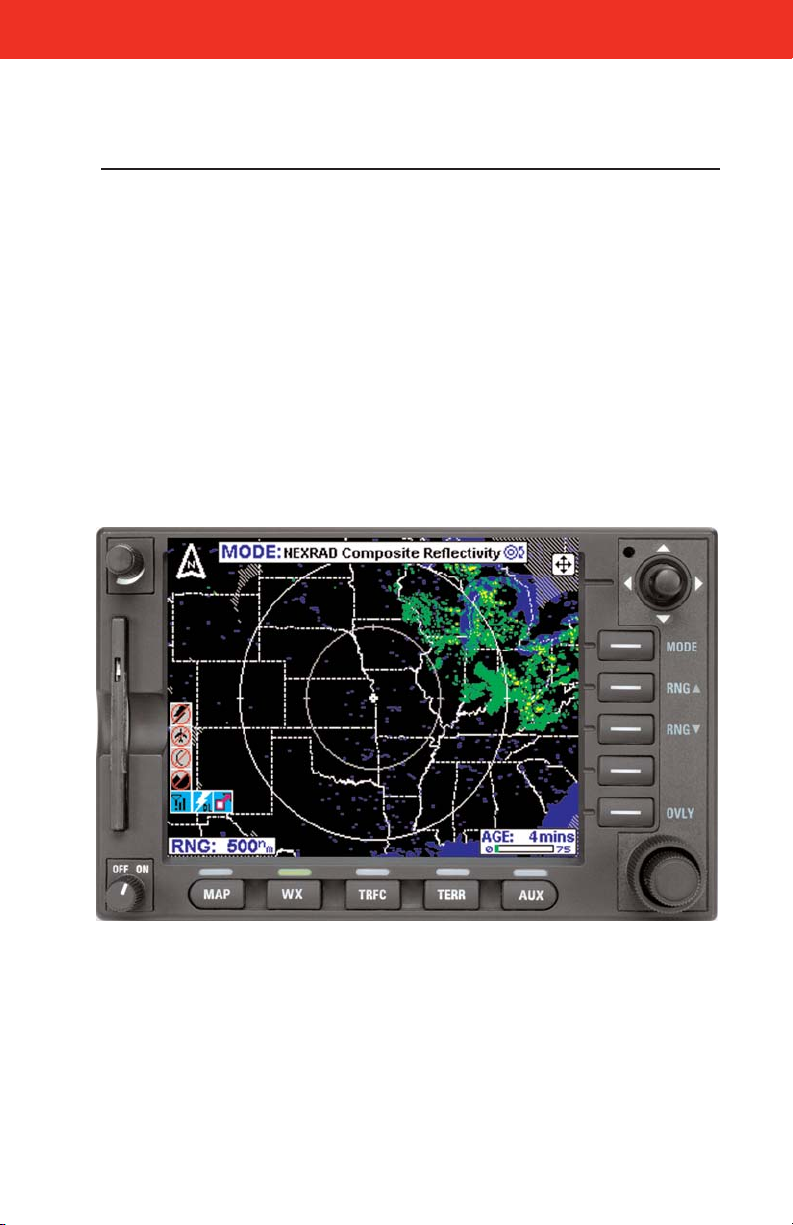
EQUIPMENT OVERVIEW
The Datalink Weather Function of the Bendix/King KMD 550/850 Multi
Function Display allows for the display and control of textual and graphical weather information received from the Honeywell KDR 510 VDL
Receiver or the KDR 610 XM satellite receiver. The choice of VDL or XM
receiver is made during installation. A single display can display only
VDL weather or only XM weather, not both.
This Pilot’s Guide Addendum describes the operation of the KMD
550/850 display and discusses the proper use of the displayed data for
strategic weather planning. The detailed description of the general operation of the KMD 550/850 is contained in the KMD 550/850 Pilot’s Guide.
The Bendix/King KMD 550/850 is shown below with the Text METAR
Page selected.
CAUTION
Datalink weather information is to be used as a strategic planning
tool for pilot decisions on avoiding inclement weather areas that
are beyond visual range or where poor visibility precludes visual
acquisition of inclement weather. Datalink weather information may
be used as follows:
a. To aid the pilot in situational awareness of hazardous meteo-
rological conditions.
b. As a cue to the pilot to communicate with the ATC controller,
AFSS specialist, Operator Dispatch, or Airline Operations Control
Center (AOCC) to get further information about the current meteorological conditions. In no case should the pilot take any evasive
action based solely upon the datalink weather display.
The datalink weather information is intended for assistance in
strategic flight planning purposes only and lacks sufficient resolution and updating necessary for tactical maneuvering.
Introduction
Page 18
Revision 6 Feb/2009
KMD 550/850 FIS Addendum
5
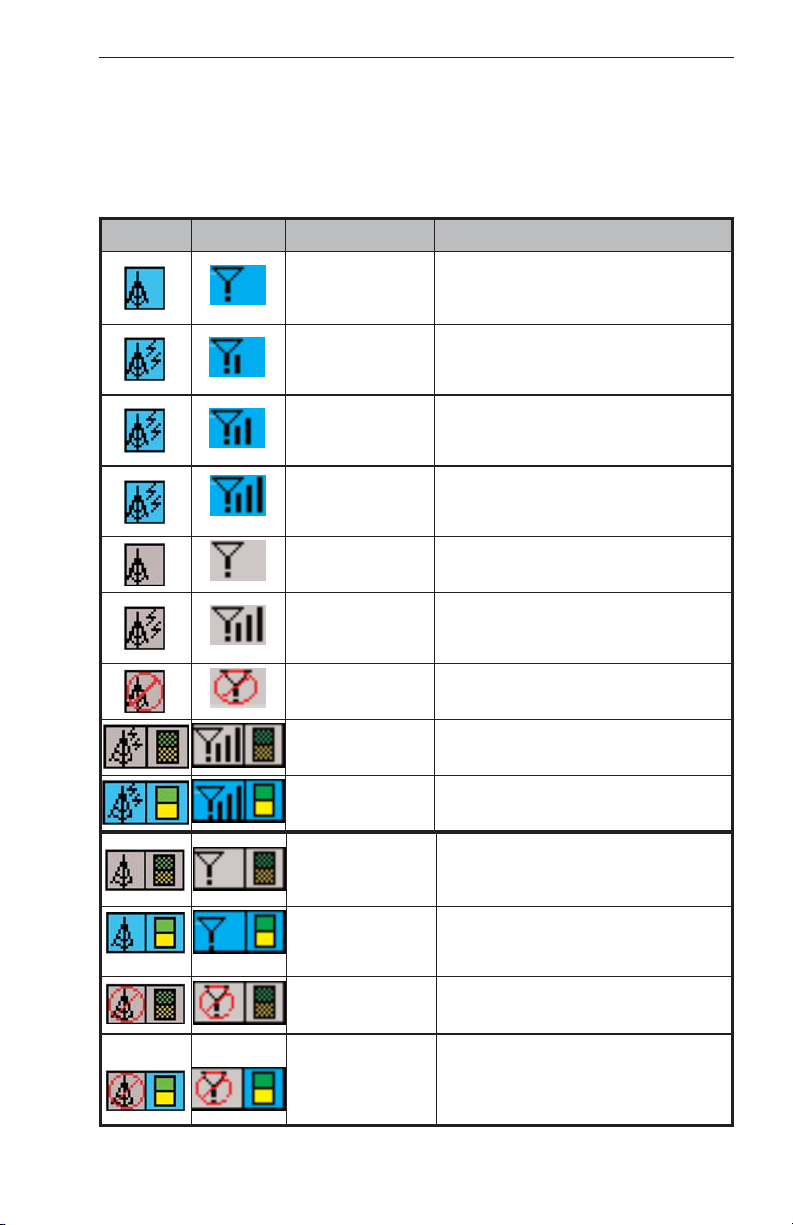
DATALINK WEATHER FUNCTION STATUS ICONS
The Datalink Weather Function Status Icons are located in the lower left
of the display. They are used to indicate whether or not the KMD
550/850 is currently receiving and/or displaying weather information. The
following table shows the various icons and their meanings.
Basic Service Weather Products
VDL Icon XM Icon Colors Description
Black on a cyan
background.
No weather data is currently being
received but previously received data is
being displayed on the present page.
Black on a cyan
background.
Weather data is currently being received
from a signal and displayed on the present
page. XM signal is weak.
Black on a cyan
background.
Weather data is currently being received
from a signal and displayed on the present
page. XM signal is marginal.
Black on a cyan
background.
Weather data is currently being received
from a signal and displayed on the present
page. XM signal is good.
Black on gray. Weather data not being received nor dis-
played on the present page.
Black on gray. Weather data is currently being received
from a signal but not displayed on the present page.
Black on gray with
red slash.
Fault with connection or data link radio.
Black on gray. Graphical METAR overlay is available but
not displayed.
Black, green and
yellow on cyan.
Graphical METAR overlay is enabled and
displayed.
Black on gray. Weather data not being received.
Graphical METAR overlay is available but
not displayed.
Black, green and
yellow on cyan.
Weather data not being received.
Graphical METAR overlay is enabled and
displayed.
Black on gray with
red slash.
Radio Fault. Graphical METAR overlay is
available but not displayed.
Black on gray with
red slash; Black,
green and yellow on
cyan.
Radio Fault. Graphical METAR overlay is
enabled and displayed.
Page 19
6
Revision 6 Feb/2009
KMD 550/850 FIS Addendum
BASIC SERVICE WEATHER PRODUCTS
The following is a discussion of weather products offered with the basic
no-fee VDL service. Accessing and navigating these services will be discussed in detail later in this addendum.
All basic and value-added products (except those identified as VDL Only)
can also be obtained through a single fee-based XM subscription service.
METAR
A METAR (Aviation Routine Weather Report) describes the specific
weather conditions at a particular airport at a given time. The KMD 550
provides a translated version of the METAR data. This is a readable version of the METAR data derived from the actual METAR. The raw
METAR data is played at the end of the translated version. The elements of a METAR are in order as follows:
1. Type of report
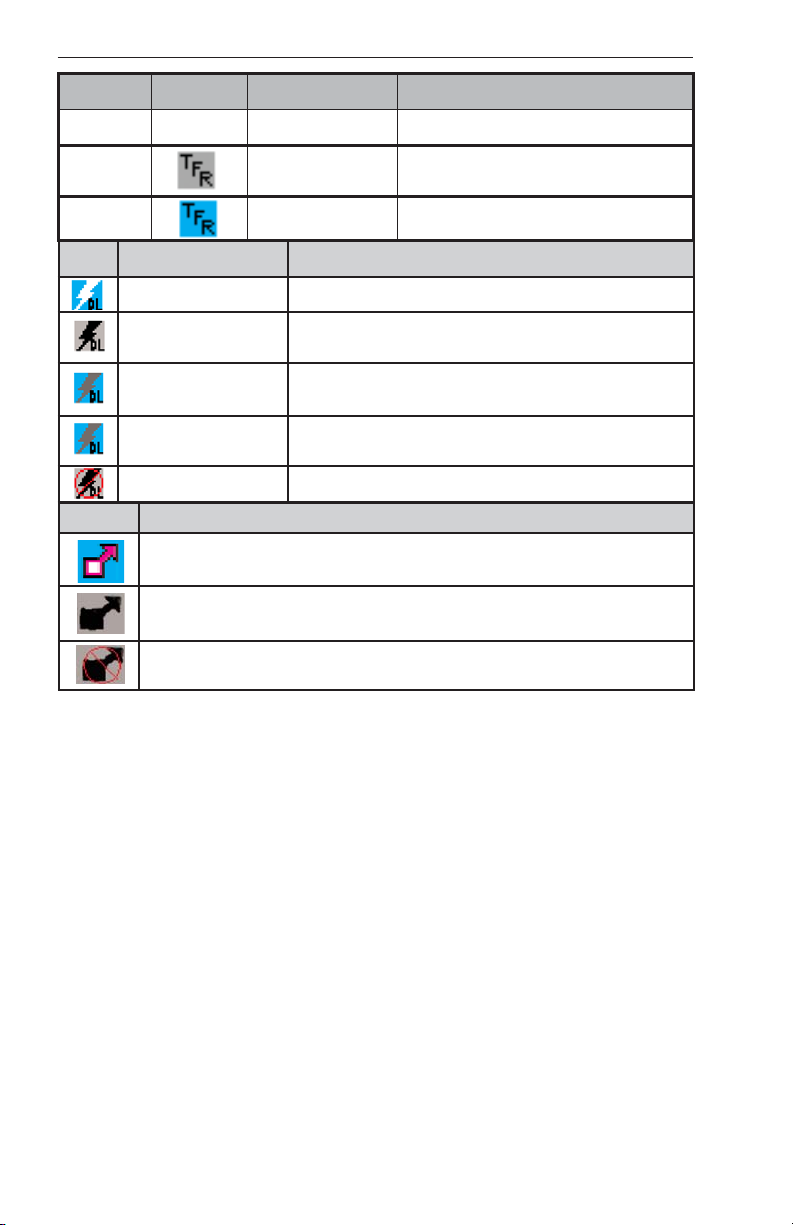
Basic Service Weather Products
Icon Description
Severe Weather Storm track information being received and displayed.
Severe Weather Storm track information being received but not displayed.
Severe Weather Storm track information not being received / data invalid.
VDL Icon XM Icon Colors Description
TFR data is not being received.
Black on gray. TFR data is being received but is not cur-
rently being displayed.
Black on cyan.
TFR data is being received and displayed.
N/A No TFR Icon
present.
N/A
N/A
Icon Description
0 min – 15 min Datalink lightning information received and displayed.
0 min – 15 min Datalink lightning information received but not dis-
played.
15 min – 30 min Datalink lightning information received and displayed
but data is more than 15 minutes old.
15 min – 30 min Datalink lightning information received but not dis-
played and data is more than 15 minutes old.
> 30 min Datalink lightning is not being received.
Page 20

Revision 6 Feb/2009
KMD 550/850 FIS Addendum
7
2. ICAO station identifier
3. Date and time of issue
4. Modifier (AUTO if automated report or COR if corrected observation)
5. Wind
6. Visibility
7. Runway visual range (as required)
8. Weather phenomena
9. Sky condition
10. Temperature/dew point group
11. Altimeter
12. Remarks (as required)
METARs available within the selected range of the selected area will be
displayed up to a maximum of 25 reports. These reports are displayed in
an encoded textual format. METARs displayed graphically on the map
are offered through a subscription service.
NOTE: When a specific element of METAR data is not available, it is
omitted from the report. The user must know the sequence of data to
recognize omissions. METAR observations older than 120 minutes will
be discarded.
See Appendix A for instructions on decoding textual METARs.
SPECI
A SPECI (Aviation Selected Special Weather Report) is related to the
METAR. SPECIs are issued when certain specific conditions or events
have been observed at a particular location, usually an airport. A SPECI
will contain the same elements as a METAR and will generally be issued
for the following reasons:
1. Sudden, extreme changes in wind speed and/or direction.
2. Changes in surface visibility, especially those that change the flying
category at the reporting site.
3. Changes in runway visibility above or below 2,400 feet.
4. Appearance or termination of significant weather or natural atmospheric events such as tornados, waterspouts, funnel clouds, thunderstorms, squalls and volcanic eruptions.
5. Changes in precipitation intensity or form.
6. Changes to ceilings when previously reported ceilings were at or
below 3,000 feet, or the formation of a ceiling below 3,000 feet.
Also, new formation of cloud layers or other obscuring phenomenon
that occur below 1,000 feet.
7. Aircraft mishaps.
8. Other meteorological conditions that the agency or the observer
determine as critical.
Basic Service Weather Products
Page 21

8
Revision 6 Feb/2009
KMD 550/850 FIS Addendum
Refer to the section on METARs for an explanation of the elements. The
element sequence and content will be the same as those in a METAR
report with the exception of the first element denoting report type.
“SPECI” will be seen in place of “METAR”. The KMD 550 provides a
translated version of the SPECI data. This is a readable version of the
SPECI data derived from the actual SPECI. The raw SPECI data is
played at the end of the translated version.
NOTE: When a specific element of SPECI data is not available, it is
omitted from the report. The user must know the sequence of data to
recognize omissions. SPECI observations older than 120 minutes will be
discarded.
Basic service SPECIs are offered in the encoded textual format.
See Appendix A for instructions on decoding textual METAR/SPECIs.
TAF
A TAF (Terminal Area Forecast) is a statement of expected meteorological conditions at an airport during a specified period of time. Many
aspects of the TAF are the same as a METAR. Abbreviations are the
same as in a METAR with addition of a few more discussed later. Many
of the data elements are formatted as those in a METAR report. A TAF
will contain elements in the following order:
1. Type of report
2. ICAO station identifier
3. Date and time of issue
4. Date and time valid
5. Wind
6. Visibility
7. Weather phenomena
8. Sky conditions
9. Wind shear (as required)
10. Forecast weather change indicator
TAFs available within the selected range of the selected area will be displayed up to a maximum of 25 reports. These reports are displayed in an
encoded textual format.
NOTE: TAFs older than the forecast validity period are discarded.
Amended or corrected TAFs generated within the issuance period are
provided as soon as they are available, and the previous outdated TAF
is no longer transmitted.
See Appendix A for instructions on decoding textual TAFs.
Basic Service Weather Products
Page 22

Revision 6 Feb/2009
KMD 550/850 FIS Addendum
9
PIREP (VDL ONLY)
A PIREP (Pilot Weather Report) is an observation of conditions at a specific location or along a specific route. These conditions are reported by
pilots when communications are established with ground facilities such
EFAS, AFSS/FSS, ARTCC or ATC. Abbreviations are the same as in a
METAR. Pilots are encouraged to promptly volunteer these reports. A
PIREP will contain elements in the following order:
1. Type of message (urgent or routine)
2. Location in relation to an airport or VHF NAVAID
3. Time observed
4. Flight Level (may not always be present)
5. Type of aircraft (may not always be present)
6. Sky cover (may not always be present)
7. Weather conditions (may not always be present)
8. Temperature (may not always be present)
9. Wind direction and speed (may not always be present)
10. Turbulence (may not always be present)
11. Icing (may not always be present)
12. Remarks (may not always be present)
PIREPs available within the selected range of the selected area will be
displayed up to a maximum of 25 reports. These reports are displayed in
an encoded textual format.
NOTE: PIREPs older than 120 minutes are discarded.
See Appendix A for instructions on decoding textual PIREPs.
AIRMET
An AIRMET (Airman’s Meteorological Information) is an advisory of significant weather that could be hazardous to single engine, light aircraft
and VFR pilots. However, parameters are such that the phenomena
does not require issuance of a SIGMET. AIRMETs address details
regarding IFR, extensive mountain obscuration, turbulence, strong surface winds, icing and freezing levels. AIRMETs are considered widespread because they must either be affecting or forecast to affect an
area at least 3,000 square miles. However, during the forecast period,
the actual affected area may be much smaller. AIRMETs are issued
every six hours and the maximum forecast period is 6 hours. An
AIRMET will contain elements in the following order:
1. Forecast Area
2. Report Type
Basic Service Weather Products
Page 23

10
Revision 6 Feb/2009
KMD 550/850 FIS Addendum
3. Date and time issued
4. Report designation and reason for issuance
5. Validity period
6. Area of coverage
7. Weather phenomenon details.
These reports are displayed in an encoded textual format.
NOTE: AIRMETs may be issued up to 15 minutes prior to the start of the
validity period. The system will display the data age as zero until the start
of the validity period. AIRMETs older than 360 minutes are discarded.
Amended, updated or corrected AIRMETs generated withing the
issuance period are provided as soon as they are available, and the previous outdated AIRMET is no longer transmitted.
When an AIRMET is cancelled, neither the original report nor the cancelation message can be displayed.
See Appendix A for instructions on decoding textual AIRMETs.
SIGMET
A SIGMET (Significant Meteorological Information) is an advisory of nonconvective weather that is potentially hazardous to all aircraft. SIGMETs
address details regarding severe icing not associated with thunderstorms, severe or extreme turbulence not associated with thunderstorms,
dust or sand storms lowering visibility to less than 3 miles, volcanic ash.
SIGMETs are considered widespread because they must either be
affecting or forecast to affect an area at least 3,000 square miles.
However, during the forecast period, the actual affected area may be
much smaller. SIGMETs are issued as needed and the maximum forecast period is 4 hours, except for 6 hours for conditions associated with
hurricanes. A SIGMET will contain elements in the following order:
1. Forecast Area
2. Report Type
3. Date and time issued
4. Report designation and reason for issuance
5. Validity period
6. Area of coverage
7. Location of weather phenomenon
8. Weather phenomenon details.
These reports are displayed in an encoded textual format.
NOTE: SIGMETs older than the forecast period are discarded.
Amended, updated or corrected SIGMETs generated withing the
issuance period are provided as soon as they are available, and the previous outdated SIGMET is no longer transmitted.
Basic Service Weather Products
Page 24

Revision 6 Feb/2009
KMD 550/850 FIS Addendum
11
Basic Service Weather Products
When an SIGMET is cancelled, neither the original report nor the cancelation message can be displayed.
See Appendix A for instructions on decoding textual SIGMETs.
CONVECTIVE SIGMET
A Convective SIGMET (Convective Significant Meteorological Information)
is an advisory of convective weather that the forecaster believes hazardous to all aircraft. Convective SIGMETs address details regarding
severe thunderstorms, embedded thunderstorms, a line of thunderstorms,
or thunderstorms producing heavy precipitation affecting an area 40 percent or more of an area at least 3,000 square miles. Convective SIGMETs
are issued hourly with a maximum forecast period of 2 hours. A
Convective SIGMET will contain elements in the following order:
1. Region Identifier and issue date and time
2. Report designator
3. Validity period
4. Area of coverage
5. Location details
6. Weather phenomena details
NOTE: Convective SIGMETs older than the forecast period are discarded. Amended, updated or corrected Convective SIGMETs generated
withing the issuance period are provided as soon as they are available,
and the previous outdated Convective SIGMET is no longer transmitted.
See Appendix A for instructions on decoding textual Convective
SIGMETs.
ALERT WEATHER WATCHES (VDL ONLY)
Alert Weather Watches (AWW) are Alert Severe Weather Watch
Bulletins that describe areas of possible severe thunderstorm or tornado
development. These are watches, not warnings; and are issued as
needed. Severe weather may not actually develop. An Alert Weather
Watch will contain elements in the following order:
1. Report designation and date and time of issuance
2. Watch number, reason for issuance, area of coverage and validity
period.
3. Watch coordinates
4. Forecast
NOTE: Alert Weather Watches older than the forecast period are discarded.
See Appendix A for instructions on decoding textual Alert Weather
Watches.
Page 25

12
Revision 6 Feb/2009
KMD 550/850 FIS Addendum
VALUE ADDED SERVICE WEATHER PRODUCTS
The following is a discussion of weather products offered with the value
added VDL subscription service. Accessing and navigating these services will be discussed in detail later in this addendum.
All basic and value-added products (except those identified as VDL
Only) can also be obtained through a single fee-based XM subscription
service.
NOTE: Airport and VOR icons, with their identifiers, will be displayed on
the graphical FIS maps at the range settings selected on Map Setup
Page (2). However, only airport identifiers will be displayed on the
Graphical METARs map display.
NEXRAD
Next Generation Radar (NEXRAD) is formally designated WSR-88D,
which stands for Weather Service Radar (Doppler) and was commissioned in 1988.
FIS VDL provides NEXRAD base reflectivity and XM WX provides
NEXRAD composite reflectivity. Each NEXRAD ground radar site scan is
composed of separate beam scans at several elevation angles for 360°
around the site. Base reflectivity is the highest precipitation echo (reflectivity) contained in the lowest NEXRAD radar elevation angle scan (5°).
Composite reflectivity provides the highest precipitation echoes within all
of the elevation scan angles. The NEXRAD base or composite reflectivity
modes provide a display of echo intensity depicted by colors. NEXRAD
information is good for identifying precipitation intensity.
CAUTION: NEXRAD data must be used for strategic planning purposes only. Due to inherent delays and relative age of the data
that can be experienced, NEXRAD data cannot be used for tactical
avoidance of weather.
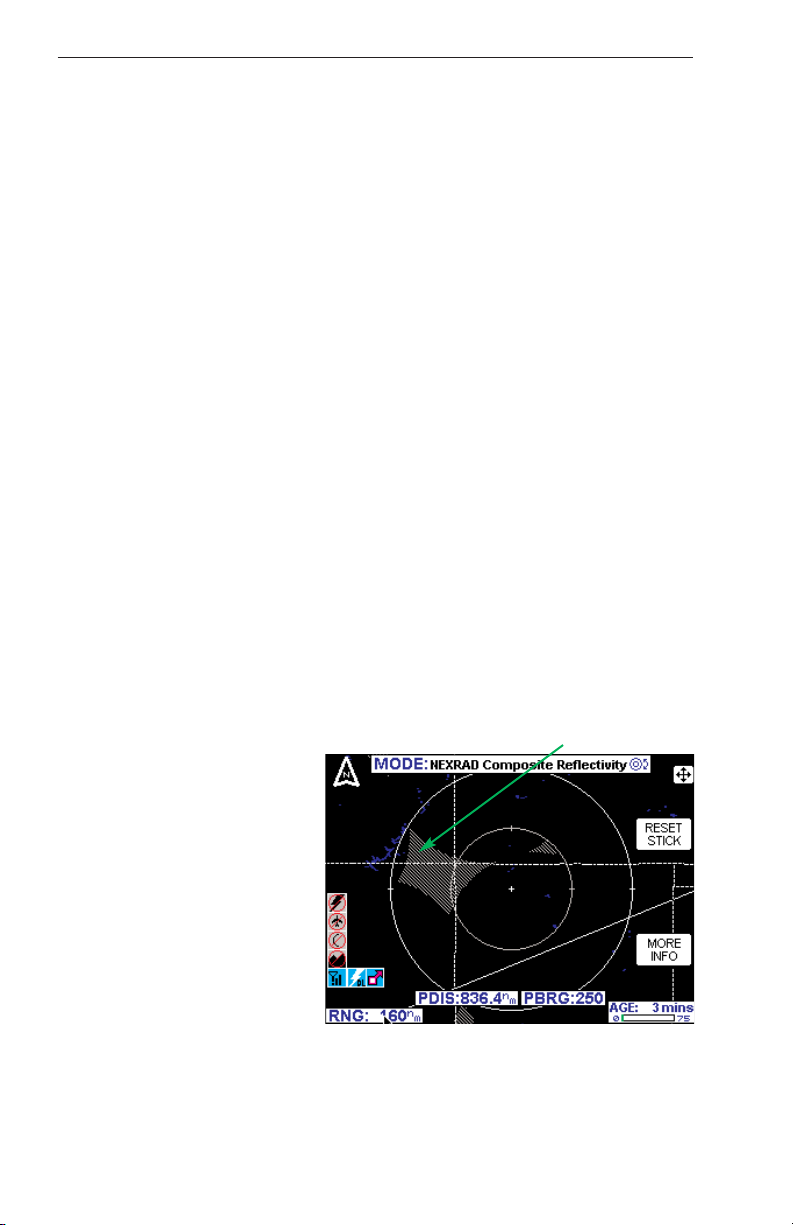
NEXRAD reflectivity images
older than 75 minutes are
discarded and no longer displayed.
Figure 1 shows a typical
NEXRAD display. Political
boundaries, rivers, lakes,
and oceans are depicted in
conjunction with weather.
The NEXRAD data map is
always displayed in a north
up orientation.
Value Added Service Weather Products
Figure 1
Page 26

Revision 6 Feb/2009
KMD 550/850 FIS Addendum
13
The display range may be changed to zoom in on a specific area to get
a more detailed weather picture, or zoom out to display a wider range.
NEXRAD ABNORMALITIES
The following is a list of NEXRAD abnormalities that may be experienced:
1. Each NEXRAD site can operate in two modes, "Clear Air" mode or
"Precipitation" mode. When no significant precipitation exists in the scanning area of the radar a NEXRAD site produces images in the "Clear Air"
mode. In this mode the radar is very sensitive to small targets, making it
possible to detect minute particles such as pollen, smoke and dust.
2. Ground clutter is detected when nearby buildings, trees, and towers
reflect radar energy back to the NEXRAD site. Because NEXRAD is a
Doppler radar, many stationary targets are filtered out. However, if a
tower or tree sways slightly in the wind, it will show up on the scan as a
target. These “moving” objects are the targets referred to as ground
clutter. Radar returns from very near the site (within a radius 20-30 nautical miles) indicating very high reflectivities often include ground clutter.
3. Strobes are spurious radar data caused primarily by defractive
bending of the beam back down to the ground. This often happens in
areas where cool air interacts with prevailing warm air, such as along
coastlines and over oceans or other large bodies of water. Blocky and
linear features are characteristics of strobes within the displayed data.
4. Sun strobes occur when a radar antenna points directly at the sun.
This shows up as high reflectivity for one or two radials. Sun strobes are
shown as bright colored spikes on the display.
5. Military planes deploy metallic dust known as 'chaff' to diffuse their
radar signatures and mask their presence on radar. Pilots frequently
practice laying chaff trails over open ocean, although these trails often
drift over land causing alterations in weather radar scans.
6. When a solid object, such as a mountain, intersects a radar beam, it
blocks any reflectivity beyond that point and produces a shadow within
the display.
7. When a building near a NEXRAD site is taller than the tower on
which the radar antenna resides, it can block the beam, casting a long,
narrow shadow (blank space) in the display.
8. NEXRAD sites sometimes return data that is entirely spurious. This
is known as "going critical" and usually does not last longer than a few
hours.
9. Atmospheric temperature inversions cause radar returns from the
Earth's surface resulting in Anomalous Propagation (AP) echoes on the
radar display.
Value Added Service Weather Products
Page 27
14
Revision 6 Feb/2009
KMD 550/850 FIS Addendum
10. Echoes from migrating birds, bats, and insects will be displayed as
circular patterns of level 1 reflectivity centered near NEXRAD sites.
11. Significant variation in humidity with altitude can cause reflections
from the Earth's surface. These reflections are also displayed as large
circular or oval areas of uniform low intensity.
12. Differences will be noted between the base reflectivity (VDL) and
composite (XM) products. The base reflectivity product displays the
lower extent of cloud masses, so the extent of water droplets appears to
be less. The composite product provides more airborne water reflection
seen at higher angles as viewed from the NEXRAD ground sites, so
higher level features of the convective activity will be given. For example,
the "blowout" portion of thunderstorms (the anvil portion) containing high
altitude ice particles is often depicted as light precipitation and might be
confused for lower altitude light precipitation. Either base or composite
product provide accurate, but somewhat time delayed depiction of high
levels of precipitation for fully developed or late stage thunderstorms.
NEXRAD LIMITATIONS
The following are limitations on the use of NEXRAD data:
1. NEXRAD does not provide sufficient information to determine cloud
layers, precipitation characteristics (frozen vs. liquid, hail vs. rain, etc),
nor does it provide information on turbulence, only the amount of
reflected energy from the precipitation.
2. The displayed NEXRAD product does not provide sufficient detail to
infer future weather trends. Due to delays involved in product creation
and transmittal, the pilot should always review the age bar to determine
information currency.
3. Due to NEXRAD site
location limitations, terrestrial
blockages and outages,
NEXRAD coverage gaps
exist. Coverage gaps are displayed as a cross hatched
pattern as shown in Figure 2.
Lack of reflectivity in a coverage gap area should not be
construed as a lack of precipitation. Coverage gaps are
portrayed indentically on
either VDL or XM.
4. The resolution of NEXRAD VDL data is 4 kilometers (km).Thus,
when zoomed in on the display, each square block is 4 km on a side.
The intensity level reflected by the square will be the highest level sampled within the 4 km area.
Value Added Service Weather Products
Figure 2
Coverage Gap
Page 28
Revision 6 Feb/2009
KMD 550/850 FIS Addendum
15
The resolution of NEXRAD XM data is 2 km. Thus, when zoomed in on
the display, each square block is 2 km on a side. The intensity level
reflected by the square will be the highest level sampled within the 2 km
area.
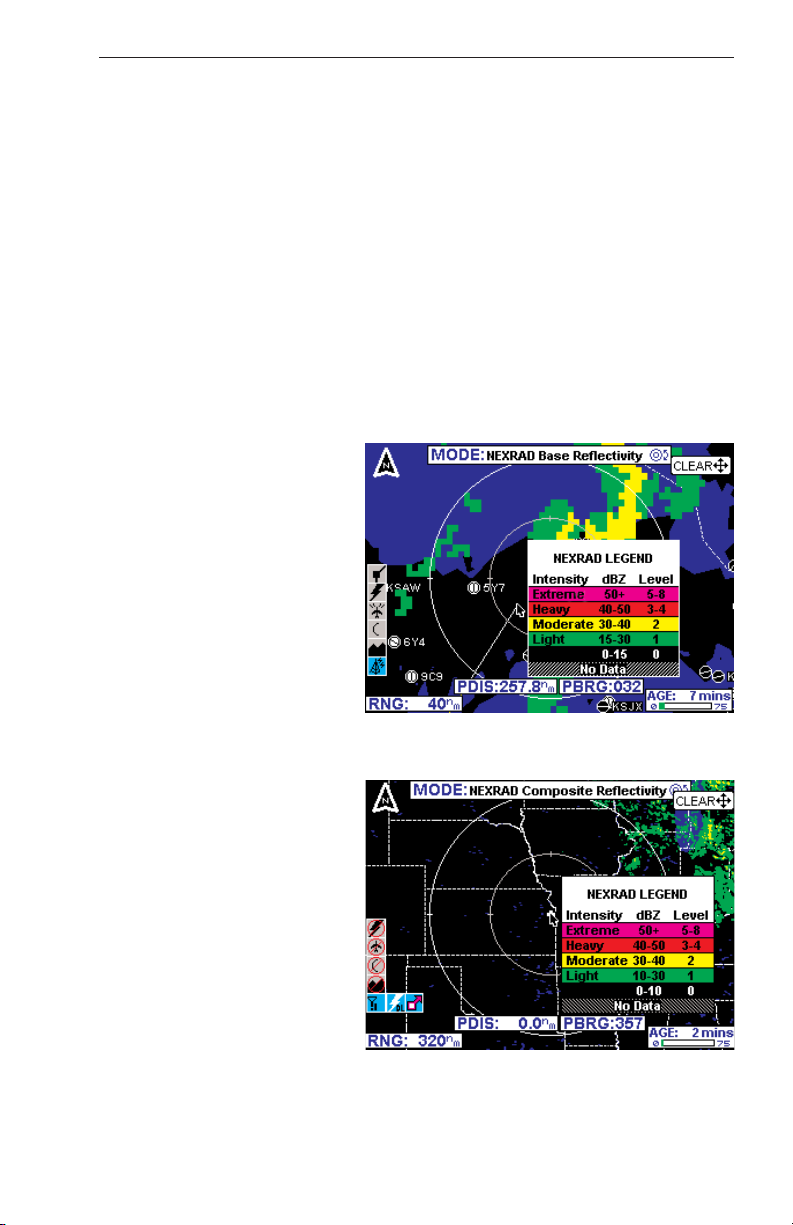
INTENSITY
Precipitation intensity is depicted using colors as follows:
Green Light Level 1 15-30 dBz (10-30 dBz for XM))
Yellow Moderate Level 2 30-40 dBz
Red Heavy Level 3-4 40-50 dBz
Magenta Extreme Level 5-8 50+ dBz
The NEXRAD dBz levels, descriptions and colors are consistent with
FAA guidelines.
Moving the joystick and
pressing the MORE INFO
softkey will display the
NEXRAD legend as shown
in Figure 3a (FIS VDL) and
3b (XM WX).
The column labeled dBz is a
measure of the radar echo
intensity.
The strength of a radar
return signal typically varies
as a function of distance
(i.e., weaker from distant targets, stronger from those
nearby) and the object size.
Many weather sources available on the internet use
color coding that is different
than the KMD 550/850 color
coding. The dBz and intensity level can be used to
compare intensity levels
between different sources of
NEXRAD information since
many internet weather
providers will include a
legend with dBz values indicated.
No Data, as shown in the legend, indicates the lack of coverage for
reasons discussed previously.
Figure 3a
Value Added Service Weather Products
Figure 3b
Page 29
16
Revision 6 Feb/2009
KMD 550/850 FIS Addendum
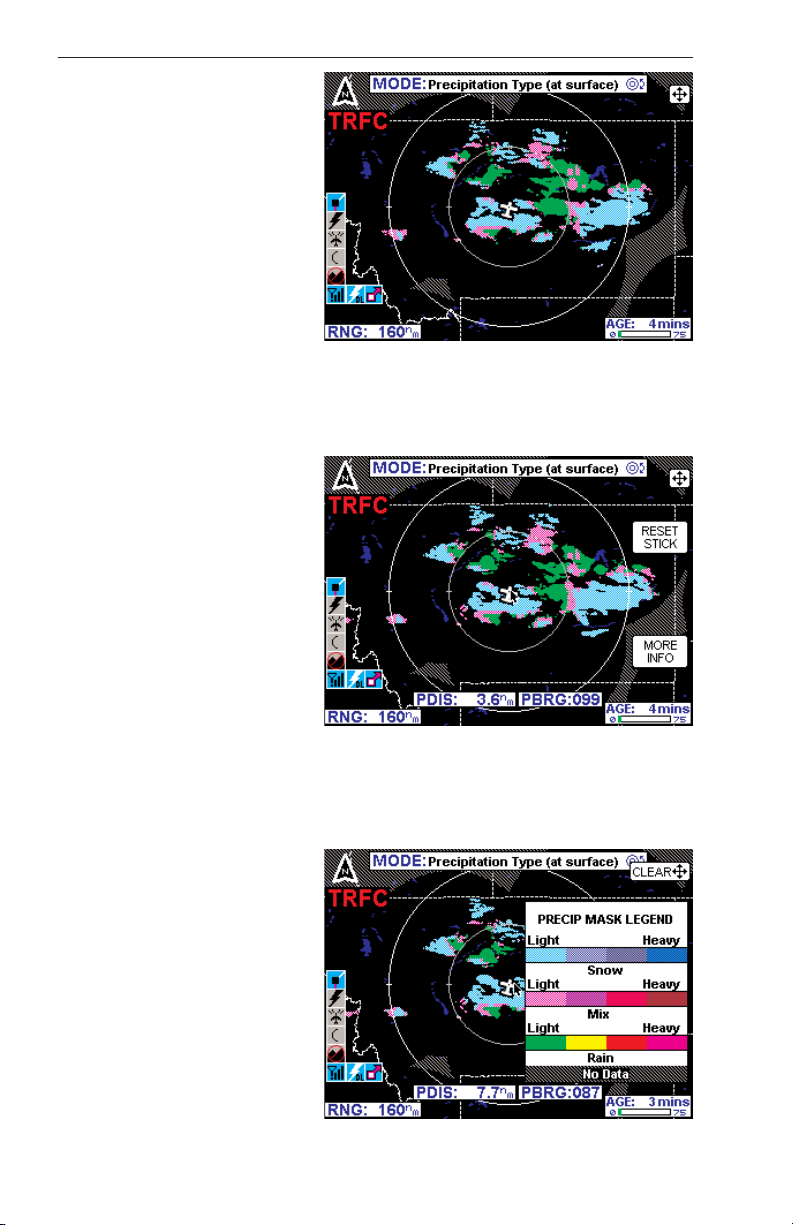
PRECIPITATION TYPE
(AT SURFACE)
(XM ONLY)
The Precipitation Type (At
Surface) product is decoded
the same as the NEXRAD
information is. It is displayed
as shown in Figure 4.
Moving the joy stick in any
direction displays the MORE
INFO soft key on the right
side of the screen. Pressing
the RESET STICK soft key
or waiting 30 seconds will
return the screen to the previous Precipitation Type
selection.
When the MORE INFO soft
key is pressed the Legend
window is shown as in
Figure 6.
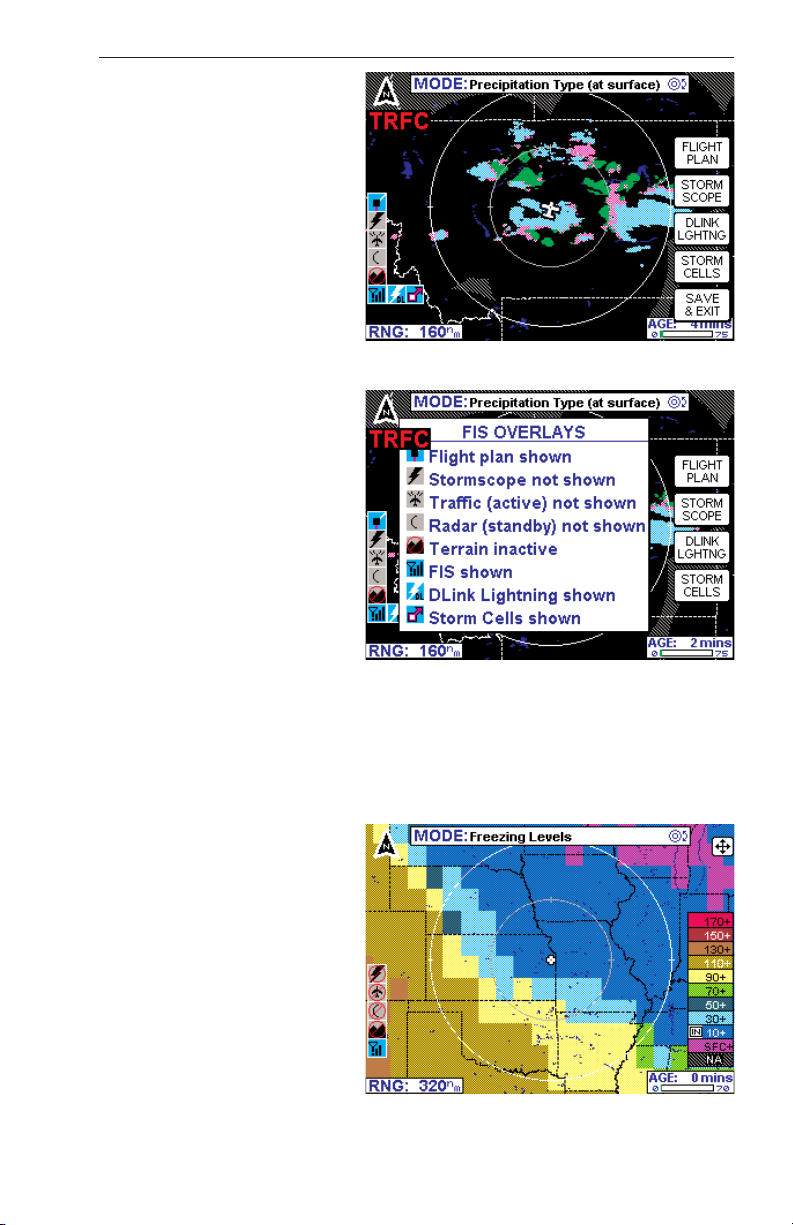
Pressing the OVERLAY
button displays overlay
selection soft keys on the
right side of the screen. This
allows selection of any of the
five different overlays
(depending upon availability)
for the Precipitation Type
screen. Overlay types are
Flight Plan, Storm Scope (if
installed), Data Link
Lightning and Severe
Weather Storm Track/Storm
Cells. The overlay selections
are highlighted on the
legend on the left side of the
screen. Press SAVE & EXIT
to complete the selection.
Figure 4
Figure 5
Figure 6
Value Added Service Weather Products
Page 30
Revision 6 Feb/2009
KMD 550/850 FIS Addendum
17
Pressing and holding the
OVERLAY key will display
the FIS Overlays window.
This window displays the
status of the overlays that
are available to the
Precipitation Type screen as
shown in Figure 8. The
window will no longer be displayed when the overlay key
is released.
FREEZING LEVELS
(XM ONLY)
The Freezing Level product
decoded and displayed in a
graphical format as shown in
Figure 9. The color code for
each altitude level is indicated in the legend box on
the right of the display.
Additionally the “IN” box in
the legend indicates the current level the aircraft is in.
Figure 9
Figure 8
Figure 7
Value Added Service Weather Products
Page 31

18
Revision 6 Feb/2009
KMD 550/850 FIS Addendum
Moving the Joy stick will
cause the MORE INFO and
RESET STICK soft keys to
be displayed on the right.
Pressing the MORE INFO
soft key will display the full
Freezing Levels Legend.
This includes the range of
each level. Moving the joy
stick in any direction will
revert the display back to the
Freezing Levels screen or it
will return to it in 30 seconds.
Pressing the OVERLAY
button displays the overlay
selection soft keys on the
right side of the screen. This
allows the flight plan to be
overlaid on the Freezing
Levels screen. The selection
is made by pressing FLIGHT
PLAN soft key on the right
side of the screen. The
overlay selection is highlighted on the legend on the
left side of the screen. Press
SAVE & EXIT to complete
the selection.
Figure 12
Figure 10
Figure 11
Value Added Service Weather Products
Page 32

Revision 6 Feb/2009
KMD 550/850 FIS Addendum
19
Pressing and holding the
OVERLAY key will display
the FIS Overlays window.
This window displays the
status of the overlays of the
Freezing Levels screen as
shown in Figure 13. The
window will no longer be displayed when the overlay key
is released.
WINDS ALOFT
(XM ONLY)
The Winds Aloft product
shows wind speed and
direction on the surface and
at the selected altitudes.
Displayed altitudes are at
the surface (SFC) and from
3000ft to 18,000ft in 3000ft
increments and from
24,000ft to 42,000ft in 6000ft
increments. The displayed
level can be changed by
pressing either the Flight
Level up (FL UP) or Flight
Level down (FL DN) soft
keys on the right of the display as shown in Figure 14.
The Winds Aloft Screen will
display at zoom levels from
50 to 500 NM. At the 320
and 500 NM range only the
wind barb for the maximum
magnitude within the area is
displayed.
When winds aloft information isn’t available for part of
a selected area, a hash gradient will highlight that area
as shown in Figure 15.
Figure 14
Figure 15
Figure 13
Value Added Service Weather Products
Page 33

20
Revision 6 Feb/2009
KMD 550/850 FIS Addendum
This condition will always be
true in the Rocky mountain
area at 3000ft and below.
When there is not any wind
data available for the
selected Flight Level the
message “WINDS ALOFT
DATA AT THIS FLIGHT
LEVEL NOT AVAILABLE
DATA NOT RECEIVED” as
shown in Figure 16.
Moving the joystick in any
direction displays the MORE
INFO soft key as shown in
Figure 17. Pressing the
RESET STICK soft key or
after 30 seconds the display
returns to the previous
Winds Aloft selection.
Moving the joystick over
Wind Bar markers displays
the Speed and wind direction information associated
with that particular marker.
See Figure 18. Pressing the
RESET STICK soft key or
after 30 seconds the display
returns to the previous
Winds Aloft selection.
Figure 18
Figure 17
Figure 16
Value Added Service Weather Products
Page 34

Revision 6 Feb/2009
KMD 550/850 FIS Addendum
21
Pressing the MORE INFO
key displays the Winds Aloft
Legend as shown in Figure
19. Moving the joy Stick or
after 30 seconds the display
returns to the previous
Winds Aloft selection.
Figure 19
Value Added Service Weather Products
Page 35

22
Revision 6 Feb/2009
KMD 550/850 FIS Addendum
GRAPHICAL METAR
The graphical METAR is
derived from the most currently received textual
METAR or SPECI data from
reporting sites. This is displayed on a map background to enhance situational awareness as shown
on Figure 20.
The graphical METAR icon
is gray when the textual
METAR or SPECI report
exceeds 75 minutes (AGED),
but is less than the textual METAR expiration time of 120 minutes.
Look at the textual report for ceiling and visibillty information.
CAUTION: Graphical METAR data must be used for strategic planning purposes only. Due to inherent delays, areas of coverage
and relative age and availability of the data that can be experienced, Graphical METAR data cannot be viewed as an absolute
depiction of conditions at a specific location.
Graphical METARs are shown using two color coded boxes, one indicating ceiling (upper box), the other visibility (lower box). Next to the
boxes is the ICAO station identifier for the airport to which the METAR
pertains. Color coding for the boxes is specified in the table below:
Moving the joystick pointer to an area that will not highlight a specific
report then pressing the MORE INFO softkey will display the graphical
METAR legend as shown in Figure 21.
Value Added Service Weather Products
Figure 20
Page 36

Revision 6 Feb/2009
KMD 550/850 FIS Addendum
23
GRAPHICAL AIRMET
The graphical AIRMET is
derived from the location
description (if provided) in
the textual AIRMET and displayed as a boundary box
with the appropriate color for
the condition as shown in
the legend (for a description,
see AIRMETs in the Basic
Weather Services section).
The “IN” box in the legend
indicates the current aircraft
position is within the corresponding forecast condition.
The boundaries are displayed on a map background to enhance situational awareness as shown
on Figure 22. Low Level
Wind Shear and Freezing
Level information will not be
displayed on the GRAPHICAL AIRMET; check the
textual AIRMETs for this
information.
NOTE: If no location description is provided in the textual AIRMET the AIRMET cannot be depicted
graphically. These AIRMETs are denoted by displaying the AIRMET
identifier in green within the textual AIRMET.
GRAPHICAL SIGMET
The graphical SIGMET is
derived from the location
description in the textual
SIGMET and displayed as a
boundary box with the
appropriate color for the
condition (for a description,
see SIGMETs in the Basic
Weather Services section).
This is displayed on a map
background to enhance situational awareness as shown
on Figure 23.
Value Added Service Weather Products
Figure 22
Figure 23
Figure 21
Page 37

24
Revision 6 Feb/2009
KMD 550/850 FIS Addendum
GRAPHICAL CONVECTIVE SIGMET
The graphical Convective
SIGMET is derived from the
location description in the
textual Convective SIGMET
and displayed as a yellow
boundary box (for a description, see CONVECTIVE
SIGMETs in the Basic
Weather Services section).
The “IN” box in the legend
indicates the current aircraft
position is within the corresponding forecast condition.
The boundaries are displayed on a map background
to enhance situational
awareness as shown on
Figure 24.
GRAPHICAL ALERT WEATHER WATCHES (VDL ONLY)
The graphical Alert Weather
Watches (AWWs) are
derived from the location
description in the textual
AWW and displayed as a
boundary box with the
appropriate color for the condition as shown in the legend
(for a description, see
ALERT WEATHER
WATCHES in the Basic
Weather Services section).
The “IN” box in the legend
indicates the current aircraft
position is within the corresponding forecast condition.
The boundaries are displayed on a map background
to enhance situational awareness as shown on Figure 25.
Figure 25
Figure 24
Value Added Service Weather Products
Page 38

Revision 6 Feb/2009
KMD 550/850 FIS Addendum
25
STARTUP
If a display such as Figure
26 is seen at startup, perform the steps in Setting Up
a FIS Subscription.
Figure 27 is displayed at the
end of the startup process
on the KMD 550/850 if a FIS
system is installed. Press
OK to acknowledge that it is
understood that FIS information is to be used as a
strategic planning tool for
pilot decisions on avoiding
inclement weather areas
which are beyond visual
range or where poor visibility
precludes visual acquisition
of inclement weather.
Due to inherent delays,
areas of coverage and relative age and availability of
the data that can be experienced, weather data cannot
be viewed as an absolute
depiction of conditions at a specific location.
SUBSCRIPTIONS
A current subscription (VDL or XM) and a current data card (VDL only)
are required to receive services. Subscriptions are used to gain access
to services. Some VDL services are offered at no cost and others are fee
based. All XM weather services are provided on a fee basis. All services
not identified as VDL Only are available with an XM subscription.
VDL SUBSCRIPTIONS
A subscription must be set up to continue receiving FIS VDL services,
including
no-charge products. This process can be performed either via
website, (http://www.bendixking.com) select Wingman Services, Data
Link Weather, or alternatively by contacting Wingman Services at 800247-0230 (or 913-712-3145). During this process, you will have the
option to subscribe to fee-based products, such as NEXRAD and
Graphical METARs, and/or may choose to subscribe to basic textual
products, such as TAFs, METARs/SPECIs, and PIREPs, which will continue to remain free-of-charge.
Figure 27
Figure 26
Startup
Page 39

26
Revision 6 Feb/2009
KMD 550/850 FIS Addendum
NOTE: Although the basic textual products are free of charge, they still
require a subscription to receive the service as well as a current data
card.
To accommodate users with varying service needs (for example, during
different flying seasons over the course of a year), the display unit allows
storage for up to four individual subscriptions, in much the same way that
a computer can support multiple user accounts with different passwords.
Once entered, the display unit manages selection of the appropriate subscription without any operator intervention. A subscription code must be
entered into the display unit whenever you add or renew a subscription.
When subscribing for a FIS VDL service package, you may specify the
date when service shall commence and the duration. If you subscribe to
multiple packages, the start date and duration of each can differ (if
desired). For instance, a user may select the free text weather package
for an entire year and also choose a graphical weather package for part
of the year.
During the subscription process, you will receive 1 to 4 subscription
codes which you must enter into your display unit to permit access to all
products. A subscription code is an alphanumeric sequence that permits
access to the FIS VDL broadcast network in much the same way that a
computer password permits access to a computer network. When you
subscribe for FIS VDL services, the online system will ask for a FIS
Display ID in order to provide you with the subscription code. The FIS
Display ID is a unique alphanumeric serial number associated with your
display unit. This ID is obtained by viewing the FIS Subscription Status
page on your display unit. After obtaining the subscription code (from
either bendixking.com or via a phone call to Wingman Services), enter
this code into your display unit. The subscription code tells the display
the service(s) to which you have subscribed and for what period of time.
Also, the data card must be updated at least once a year for continuance
of FIS subscription service. The validity period for the subscription data
on the data card is shown on the FIS Caution page at power on and also
on the FIS Subscription Status Page. The data card contains both subscription data that is needed to access FIS products as well as the latest
operating software. By updating the data card at least once a year prior
to the expiration date you will ensure uninterrupted FIS service and also
have the latest version of software to utilize new FIS products as they
become available. Note that data card updates are available every 28
days and also include the latest version of Jeppesen navigation data.
FIS Subscriptions
Page 40

Revision 6 Feb/2009
KMD 550/850 FIS Addendum
27
SETTING UP A VDL
SUBSCRIPTION
NOTE: The following details
require selection of a KDR510 as the source for
datalink weather data.
At least one subscription
must be set up, even to
receive the no-charge services. Up to four different
concurrent subscriptions can
be set up depending on the
service packages desired.
NOTE: Entering more than
four subscriptions will cause
previous subscriptions to be
overwritten.
To set up a subscription, perform the following steps:
1. Press the AUX Function
Select Key to display the
Auxiliary Mode Cover Page
as shown in Figure 28.
2. Press the WX SETUP
softkey to display the WX
Setup Cover Page as shown
in Figure 29.
FIS Subscriptions
Figure 28
Figure 29
How to Subscribe to FIS VDL Services
Get Display ID
from unit in airplane
Select the desired
services
Update Data Card if needed.
Update at least once per year
to ensure continued FIS Services
Go to Bendixking.com
or call 1-800-247-0230
to subscribe to FIS Services
Receive Subscription
Code(s) and print them
out
Enjoy flying with FIS
Services!
Enter Display ID during
registration
(This is only required first
time you subscribe)
Take printed out code(s)
to the airplane and enter
code(s) on the FIS Subscription
Status Page
Page 41

28
Revision 6 Feb/2009
KMD 550/850 FIS Addendum
3. Press the FIS softkey to
display the FIS Setup Cover
Page as shown in Figure 30.
4. Press the FIS SUBSCR
softkey to display Figure 31.
On initial subscription setup
the subscription window will
show only blank spaces as
shown in Figure 31, unless
services were pre-provisioned at the factory. In this
case some lines may not be
blank. If adding another subscription, one or more previous subscriptions may be
displayed with the associated validity period and
status.
The unique identifier for the
individual KMD 550/850 is
displayed in the FIS Display
ID window. The unique ID
shown here is 0H0H0
00KX0.
Obtain the unique ID for your
system and visit the Wingman
Services website on
www.bendixking.com or call
1-800-247-0230. This ID will
be used to obtain a
Subscription Access Code.
NOTE: For uninterrupted FIS
VDL services, the data card
must be updated by the date
shown in “Data card update
required by” field.
5. After obtaining the
Subscription Code, press the
ADD SUBSCR softkey to display Figure 32.
FIS Subscriptions
Figure 31
Figure 32
Figure 30
Page 42

Revision 6 Feb/2009
KMD 550/850 FIS Addendum
29
6. The inner Control Knob
selects the alphanumeric
character and the outer
Control Knob selects the
character position. Turn the
inner Control Knob until the
first character of the
Subscription Code is displayed in first space. Turn
the outer Control Knob clockwise to move to the next
space to the right. Turn the
inner Control Knob until the
second character of the
Subscription Code is displayed. Continue this
sequence until the entire
Subscription Code has been
entered as shown in Figure
33.
After selecting the last character space of the
Subscription Code the
ENTER softkey is now available.
7. After entering the last
Subscription Code character,
press the ENTER softkey.
The subscription should be
accepted and processed as
shown in Figure 34.
If an incorrect code has been
entered, a message like that
shown in Figure 35 will be
displayed.
FIS Subscriptions
Figure 33
Figure 34
Figure 35
Page 43

30
Revision 6 Feb/2009
KMD 550/850 FIS Addendum
8. After the subscription has
been accepted, Figure 36 will
be displayed showing the
subscription validity period
and status. If the subscription
has been entered prior to the
beginning of subscription service, the entered subscription
will begin when subscription
services are turned on.
CHECKING FIS VDL
SUBSCRIPTIONS
To check FIS VDL subscription validity or status perform
the following steps:
1. Repeat steps 1 through 3
in the Setting Up a FIS VDL
Subscription section.
2. Press the FIS SUBSCR
softkey. A screen similar to
Figure 37 should be displayed. In this case subscription #1 has expired and subscription #2 is still valid.
The symbols that may appear in the Status column, and their meanings,
are shown in Figure 38a. Again, subscriptions will only be valid when FIS
subscription service is turned on.
NOTE: Only the validity period for subscriptions is shown on the display.
To determine which products are available with each subscription,
access the account on Wingman Services at www.bendixking.com.
FIS Subscriptions
Figure 37
Figure 38a
Figure 36
Page 44

Revision 6 Feb/2009
KMD 550/850 FIS Addendum
31
XM WX SUBSCRIPTIONS
An XM subscription must be set up to receive XM WX services. This
process involves accessing the XM Radio website and a toll-free phone
call to XM Radio.
SETTING UP AN XM WX SUBSCRIPTION
NOTE: The following details require selection of an XM receiver (such
as a KDR-610 ) as the source for datalink weather data.
Setting up an XM WX subscription can be accomplished by following
these steps:
1a.Retrieve the 8-digit ID from the KDR 610 label (should be attached to
the opposite end of the receiver from the connectors)
OR
1b.Apply power to the display and receiver, select the AUX key, the WX
SETUP softkey, the FIS softkey, and finally the FIS SUBSCRIPTION
softkey. Record the 8-digit receiver ID displayed at the bottom of the
FIS Subscription Status page.
2. Go to the website
www.xmradio.com/weather/get_xm_wx.html
to
select your weather subscription package.
3. Apply power to the XM receiver, and place the receiver's antenna
where the signal can be received from the XM satellites. Make certain
the antenna has a good view of the southern horizon.
4. With the Receiver ID and desired subscription package in hand, contact XM Radio at 1-800-985-9200 for assistance in activating your
receiver and setting up a weather product subscription. The receiver
Figure 38b
FIS Subscriptions
Page 45

32
Revision 6 Feb/2009
KMD 550/850 FIS Addendum
should remain in view of the satellites during the subscription
process.
5. Verify the activation of the receiver and the subscription validity by
selecting and viewing the “FIS Subscription Status Page” on the
KMD screen.
If for any reason the receiver was not exposed to the XM signal within
the initial 24 hour broadcast period, or is not successfully authorized for
some other reason, a subsequent 15 minute resend of the subscription
information can be obtained. Get the receiver ID (instructions in step 1a
or 1b above), go to the website
http://www.xmradio.com/refresh/
, and
follow the instructions.
CHECKING XM WX SUBSCRIPTIONS
To check the FIS XM subscription and receiver status,
apply power to the display
and receiver, select the AUX
key, then the WX SETUP
softkey, the FIS softkey, and
finally the FIS SUBSCR
softkey, as in step 1b previously.
The Application IDs are displayed along with the
receiver activation and subscription status. The
Application IDs provide the groupings of products that are part of the
subscription package. Green checkmarks indicate those App IDs or
product groups that are contained in the subscription package for the XM
receiver. Contact XM Radio at 1-800-985-9200 with the App ID information if the subscribed products are not received and displayed.
Figure 38c
Symbol Subscription Status Description
—
(white)
No Information
The XM FIS receiver subscription
information message has not
been received.
Not Subscribed
The user is not authorized for the
Application ID.
Subscribed
The user is authorized for the
Application ID.
FIS Subscriptions
Page 46

Revision 6 Feb/2009
KMD 550/850 FIS Addendum
33
The following table lists the XM Radio assignment of App IDs for weather
products. Assignments within the broadcast data stream may change
and the most current assignments may not be reflected below. Contact
XM concerning App ID information if the powered receiver has been in
view of the satellites for 10 minutes or more and the correct products are
not received. Those products that are currently displayed on the KMD
550/850 with the XM capable software release installed are set in bold
font.
FIS Subscriptions
App ID Product
App ID 10
Radar Coverage, METARs, County Warnings, City
Forecasts
App ID 231 NEXRAD Radar, TAFs, Freezing Level, TFRs
App ID 232
SCITs, Lightning, Storm (Echo) Tops, Surface
Precipitation, Winds Aloft, AIRMETs, SIGMETs,
Cloud Tops
Page 47

34
Revision 6 Feb/2009
KMD 550/850 FIS Addendum
Normal Operation
NORMAL OPERATION
To display the FIS pages, press the WX Function Select Key. Each
press will cycle through Weather Radar (KMD 850 only), Stormscope®
(if installed), FIS Graphics Page (Graphical METAR, NEXRAD,
AIRMETs, SIGMETs, Convective SIGMETs and Alert Weather Watches
(VDL Only) depending on what was last selected) and FIS Text Page.
The MODE Power Key may
be used to select any of the
available FIS weather pages
by displaying the SELECT
FIS PRODUCT Menu as
shown in Figure 39a (Figure
39b and Figure 39c for XM).
MODE will only be available
when the KMD 550/850 is
actively receiving weather
data. On startup, this may
take a few minutes. Available
weather products will be displayed in black text. Products
that are not yet available will
be displayed in blue text and
will not be selectable until
they are available. Wx
Watches and PIREPs are not
available for XM WX and will
not be listed.
Use the Joystick or the
inner/outer Control Knobs to
select the desired weather
product. After the desired product is
selected, press the SELECT Softkey.
☞
Figure 39a
Figure 39b
WX Radar
Stormscope
Datalink Wx
Graphical
Products
Datalink Wx
Textual
Products
KMD 850 Only
®
Only if Stormscope® is installed
Page 48

Revision 6 Feb/2009
KMD 550/850 FIS Addendum
35
When the Control
Knob Icon is dis-
played in the MODE
field at the top of the display,
as shown here, either the
inner or outer Control Knob
may be used to select and
cycle through the available
graphical weather products
without having to use the
SELECT FIS PRODUCT
Menu.
NEXRAD PAGE
The following illustration describes the NEXRAD VDL display. The
NEXRAD XM display is the same except the FIS Icon is different and
Composite Reflectivity is shown instead of Base Reflectivity.
Normal Operation
Figure 39c
4
3
2
1
5
6
VDL System
4
3
2
1
5
XM WX System
10 Aircraft Symbol - Indicates present aircraft position and heading (if
available) or track.
11 Age of Data - Age of the data based on current time minus NEXRAD
issue time.
12 Age Status Bar - Indicates percentage of age versus elapsed time
before expiration. The bar will be green the first 50% then turn yellow.
1 Range Scale - Indicates
selected range.
7
2 Available Functions -
Displays icons representing
8
data available (black) and
displayed (color).
9
3 North Pointer - Indicates
10
north.
4 Range Rings - Outer ring
11
radius is selected range
and inner ring radius is one
12
half the selected range.
5 MODE - Indicates the
weather produ
6
displayed.
6 Control Knob Icon -
7
Displayed when the Control
Knobs are available for
cycling through the graphical
9
weather products.
7 Joystick Label - Indicates
10
joystick is active and can be
used to pan map.
11
8 No Coverage Area -
Crosshatch pattern indicates
12
area of no coverage.
9 Precipitation - NEXRAD
precipitation returns.
ct being
Page 49

36
Revision 6 Feb/2009
KMD 550/850 FIS Addendum
Normal Operation
NEXRAD PAGE OPERATIONAL CONTROLS
CAUTION: NEXRAD data must only be used for strategic planning
purposes. Due to inherent delays and relative age of the data that
can be experienced, NEXRAD data cannot be used for tactical
avoidance of weather.
MODE - Displays the Select FIS Product Menu.
Joystick - Moving the joystick allows panning of
the map and placement of the pointer over the
desired weather activity to be viewed.
RNG
▲▲//
RNG▼▼- Displays ZOOMING TO ### nm and
advances the indicator to the next range. The upper
button increases range, the lower button decreases it.
The selected range is displayed in the lower left corner
of the display with the outer range ring the displayed
range and the inner range ring is half the displayed
range. The RNG button labels will not be displayed when their respective
range limits are reached.
OVLY - Allows selection of flight plan and Datalink
Lightning and Storm Cell Identification and Tracking
(SCIT) lightning data (if Stormscope® equipment is
installed) for overlay on the FIS map.
Control Knobs - Used to select and/or cycle through the
available graphical weather products displays.
SELECTING AND USING
THE NEXRAD PAGE
1. Press the WX Function
Select Key until the FIS
Graphics Page is displayed.
If necessary, turn the Control
Knob to obtain the NEXRAD
display as shown in Figure
40. NEXRAD Base
Reflectivity (NEXRAD
Composite Reflectivity for XM) will be displayed in the MODE field
located at the top center of the display.
Figure 40
Page 50

Revision 6 Feb/2009
KMD 550/850 FIS Addendum
37
NOTE: If a message such as
that shown in Figure 41 is
displayed, it may be that the
system has not had time to
acquire a signal or has
acquired a signal and not yet
received all the data for a
NEXRAD image. If this message is still present after
more than 5-10 minutes,
refer to the Messages section of this addendum.
Always make note of the age of the data displayed in the bottom right
corner. Remember, the older the age the more suspect the accuracy of
the data. The colored bar will be green the first 50% of the expiration
time period for the displayed data then turn yellow. Also, delays occurring prior to the weather distributor time stamping the data are not
reflected in the displayed age. These delays can range from one to
seven minutes.
If no data update has been received for 75 minutes the NEXRAD image
is discarded and no longer displayed.
2. Press the RNG
▲▲//
RNG▼▼Key to zoom in on the display. The map is
centered on the present position indicated by the symbolic aircraft.
3. To view a specific area of weather, move the joystick in the desired
direction. A pointer will appear on the display connected to the symbolic
aircraft with a flashing line (see Figure 42). The distance and bearing
between present position
and the pointer is shown at
the bottom center of the display. As the joystick is held
the pointer will continue to
move. When the pointer
reaches the edge of the display the map will pan to keep
up with pointer movement.
Release the joystick to stop
moving the pointer. Press the
RNG
▲▲//
RNG▼▼keys to zoom
in or out on the pointer position.
Figure 42
Figure 41
Normal Operation
Page 51

38
Revision 6 Feb/2009
KMD 550/850 FIS Addendum
Normal Operation
Pressing the MORE INFO
softkey will display the VDL
NEXRAD LEGEND (Figure
43a) or the XM NEXRAD
LEGEND (Figure 43b). To
clear the legend from the display, move the joystick. The
XM legend reflects the lower
limit of 10 dBz for light precipitation.
Press the RESET STICK
softkey to return to the present position display. If no
actions are taken for a period
of 30 seconds, the display will
return to the present position.
4. Press the OVLY Key to
overlay flightplan or lightning
data on the NEXRAD map
(see Figure 44). Lightning
overlay capability will only be
available if a Stormscope® is
installed with the system.
The FLIGHT PLAN and
STORMSCOPE softkeys
toggle the respective overlay
on or off as in Figure 45.
Figure 45
Figure 44
Figure 43a
Figure 43b
Page 52

Revision 6 Feb/2009
KMD 550/850 FIS Addendum
39
Press the SAVE & EXIT
softkey to retain the selections on the display (see
Figure 46).
If the severe weather storm
track (SCIT) overlay is active
the SCIT icon will be displayed in the legend on the
left side of the screen.
Where ever severe weather
is located the SCIT icon will
be displayed on the screen.
The arrow of the icon will indicate the forecasted track of
the weather (see Figure 47).
If the cursor is moved by the
joy stick over any of the SCIT
icons on the screen a pop up
screen showing Storm Top
(in kft), Movement: (direction,
speed in knots), Hail: (Max
hail size in inches) and Age
Icon: (also indicated expiration time). (Figure 48).
Figure 46
Normal Operation
Figure 47
Figure 48
Page 53

40
Revision 6 Feb/2009
KMD 550/850 FIS Addendum
1 Range Scale - Indicates selected range.
2 Available Functions - Displays icons representing data available (black)
and displayed (color).
3 Age Status Bar - Indicates percentage of age versus elapsed time
before expiration. The bar will be green the first 50% then turn yellow.
4 North Pointer - Indicates north.
5 MODE - Indicates the weather product being displayed.
6 Control Knob Icon - Displayed when the Control Knobs are available for
cycling through the graphical weather products.
7 Joystick Label - Indicates joystick is active and can be used to pan map.
8 Range Rings - Outer ring radius is selected range and inner ring radius
is one half the selected range.
9 Aircraft Symbol - Indicates present aircraft position and heading (if
available) or track.
10 No Coverage Data Available - Indicates there is not any Freezing Levels
available in that area.
4
2
9
5
1
3
7
8
6
PRECIPITATION TYPE PAGE
PRECIPITATION TYPE COLOR CODING
Normal Operation
Page 54

Revision 6 Feb/2009
KMD 550/850 FIS Addendum
41
PRECIPITATION TYPE PAGE OPERATIONAL CONTROLS
MODE - Displays the Select FIS Product Menu.
Joystick - Moving the joystick allows panning of
the map and placement of the pointer over the
desired PRECIPITATION TYPE icon to be
viewed.
RNG
▲▲//
RNG▼▼- Displays ZOOMING TO ### nm and
advances the indicator to the next range. The upper
button increases range, the lower button decreases it.
The selected range is displayed in the lower left corner
of the display with the outer range ring the displayed
range and the inner range ring is half the displayed
range. The RNG button labels will not be displayed
when their respective range limits are reached.
OVLY - Allows selection of flight plan data for overlay
on the FIS map.
Control Knobs - Used to select and/or cycle through the
available graphical weather products displays.
Normal Operation
Page 55

42
Revision 6 Feb/2009
KMD 550/850 FIS Addendum
Normal Operation
1 Range Scale - Indicates selected range.
2 Available Functions - Displays icons representing data available (black)
and displayed (color).
3 Age Status Bar - Indicates percentage of age versus elapsed time
before expiration. The bar will be green the first 50% then turn yellow.
4 North Pointer - Indicates north.
5 MODE - Indicates the weather product being displayed.
6 Control Knob Icon - Displayed when the Control Knobs are available
for cycling through the graphical weather products.
7 Joystick Label - Indicates joystick is active and can be used to pan map.
8 Range Rings - Outer ring radius is selected range and inner ring radius
is one half the selected range.
9 Aircraft Symbol - Indicates present aircraft position and heading (if
available) or track.
10 Freezing Level Color Key - Colors indicating Freezing Levels at the
height shown.
4
2
9
5
1
3
7
8
6
FREEZING LEVELS PAGE
FREEZING LEVELS COLOR CODING
Page 56

Revision 6 Feb/2009
KMD 550/850 FIS Addendum
43
FREEZING LEVELS PAGE OPERATIONAL CONTROLS
MODE - Displays the Select FIS Product Menu.
Joystick - Moving the joystick allows panning of
the map and placement of the pointer over the
desired FREEZING LEVELS icon to be viewed.
RNG
▲▲//
RNG▼▼- Displays ZOOMING TO ### nm and
advances the indicator to the next range. The upper
button increases range, the lower button decreases it.
The selected range is displayed in the lower left corner
of the display with the outer range ring the displayed
range and the inner range ring is half the displayed
range. The RNG button labels will not be displayed when their respective
range limits are reached.
OVLY - Allows selection of flight plan data for overlay
on the FIS map.
Control Knobs - Used to select and/or cycle through the
available graphical weather products displays.
Normal Operation
Page 57

44
Revision 6 Feb/2009
KMD 550/850 FIS Addendum
Normal Operation
1 Range Scale - Indicates selected range.
2 Available Functions - Displays icons representing data available (black)
and displayed (color).
3 Age Status Bar - Indicates percentage of age versus elapsed time
before expiration. The bar will be green the first 50% then turn yellow.
4 North Pointer - Indicates north.
5 MODE - Indicates the weather product being displayed.
6 Control Knob Icon - Displayed when the Control Knobs are available
for cycling through the graphical weather products.
7 Joystick Label - Indicates joystick is active and can be used to pan map.
8 Range Rings - Outer ring radius is selected range and inner ring radius
is one half the selected range.
9 Aircraft Symbol - Indicates present aircraft position and heading (if
available) or track.
10 FL UP and FL DN – Increments the Winds Aloft flight level that is being
played.
4
2
9
5
1
3
7
8
6
WINDS ALOFT PAGE
WINDS ALOFT SCALE
Page 58

Revision 6 Feb/2009
KMD 550/850 FIS Addendum
45
WINDS ALOFT PAGE OPERATIONAL CONTROLS
MODE - Displays the Select FIS Product Menu.
Joystick - Moving the joystick allows panning of
the map and placement of the pointer over the
desired WINDS ALOFT icon to be viewed.
RNG
▲▲//
RNG▼▼- Displays ZOOMING TO ### nm and
advances the indicator to the next range. The upper
button increases range, the lower button decreases it.
The selected range is displayed in the lower left corner
of the display with the outer range ring the displayed
range and the inner range ring is half the displayed
range. The RNG button labels will not be displayed when their respective
range limits are reached.
OVLY - Allows selection of flight plan data for overlay
on the FIS map.
Control Knobs - Used to select and/or cycle through the
available graphical weather products displays.
Normal Operation
Page 59

46
Revision 6 Feb/2009
KMD 550/850 FIS Addendum
Normal Operation
GRAPHICAL METARS PAGE
The following illustration describes the Graphical METARs display. The
only difference between VDL and XM is the Datalink Wx Status icon.
5
6
7
4
3
8
9
2
10
1
1 Range Scale - Indicates selected range.
2 Available Functions - Displays icons representing data available (black)
and displayed (color).
3 Graphical METAR Icon - Ceiling indicated in top box, visibility in the
bottom box and ICAO identifier of issuing airport. Note that ICAO identifiers
are not displayed on all range settings.
4 North Pointer - Indicates north.
5 MODE - Indicates the weather product
6 Control Knob Icon - Displayed when the Control Knobs are available for
cycling through the graphical weather products.
7Joystick Label - Indicates joystick is active and can be used to pan map.
8 Range Rings - Outer ring radius is selected range and inner ring radius
is one half the selected range.
9 Aircraft Symbol - Indicates
available) or track.
10 METAR Color Key - Colors indicating flight rules pertaining to ceiling
and visibility.
present aircraft position and heading (if
being displayed.
Page 60

GRAPHICAL METARS PAGE OPERATIONAL CONTROLS
MODE - Displays the Select FIS Product Menu.
Joystick - Moving the joystick allows panning of
the map and placement of the pointer over the
desired METAR icon to be viewed.
RNG
▲▲//
RNG▼▼- Displays ZOOMING TO ### nm and
advances the indicator to the next range. The upper
button increases range, the lower button decreases it.
The selected range is displayed in the lower left corner
of the display with the outer range ring the displayed
range and the inner range ring is half the displayed
range. The RNG button labels will not be displayed when their respective
range limits are reached.
OVLY - Allows selection of flight plan data for overlay
on the FIS map.
Control Knobs - Used to select and/or cycle through the
available graphical weather products displays.
SELECTING AND USING THE GRAPHICAL METARS PAGE
1. Press the WX Function
Select Key until the FIS
Graphics Page is displayed.
If necessary, turn the Control
Knob to obtain the Graphical
METARs display as shown in
Figure 49. Graphical
METARs will be displayed in
the MODE field located at the
top center of the display.
NOTE: This page will not be
accessible until a valid FIS
signal has been acquired and
processed by the system.
Figure 49
Normal Operation
Revision 6 Feb/2009
KMD 550/850 FIS Addendum
47
Page 61

48
Revision 6 Feb/2009
KMD 550/850 FIS Addendum
Normal Operation
2. Press the RNG
▲▲//
RNG
▼▼
Key to zoom in on the display. The map is centered on
the present position indicated
by the symbolic aircraft.
3. To view a specific
METAR, move the joystick in
the desired direction. A
pointer will appear on the display connected to the symbolic aircraft with a flashing
line (see Figure 50). The distance and bearing between
present position and the
pointer is shown at the
bottom center of the display.
As the joystick is held the
pointer will continue to move.
When the pointer reaches the
edge of the display the map
will pan to keep up with
pointer movement. Release
the joystick to stop moving
the pointer. When the pointer
moves over a graphical
METAR icon, a box will pop
up containing the IDENT,
NAME and CITY/STATE
pertaining to the location and
the AGE of the report (see
Figure 51).
4. Press the RNG
▲▲//
RNG
▼▼
keys to zoom in or out on the
pointer position.
5. Press the MORE INFO
softkey to display the Text
METAR Page for the displayed location as in Figure
52.
6. Press the METAR MAP softkey to return to the previous display.
7. Press the RESET STICK softkey to return to the present position display. If no actions are taken for a period of 30 seconds, the display will
return to the aircraft present position display.
Figure 50
Figure 51
Figure 52
Page 62

Revision 6 Feb/2009
KMD 550/850 FIS Addendum
49
8. To view the graphical
METAR LEGEND, move the
joystick pointer to an area
with no icons and press the
MORE INFO softkey. The
legend will be displayed as in
Figure 53. Move the joystick
to remove the legend from
the display.
9. Press the OVLY Key to
overlay flightplan data on the
Graphical METAR map (see
Figure 54).
The FLIGHT PLAN softkey
toggles the overlay on or off
as in Figure 55.
Press the SAVE & EXIT
softkey to retain the selection
on the display.
Figure 53
Figure 55
Figure 54
Normal Operation
Page 63

50
Revision 6 Feb/2009
KMD 550/850 FIS Addendum
Normal Operation
GRAPHICAL AIRMETS PAGE
The following illustration describes the Graphical AIRMETs display. The
only difference between VDL and XM is the Datalink Wx Status icon.
4
5
6
3
7
8
2
9
10
1
1 Range Scale - Indicates selected range.
2 Available Functions - Displays icons representing data available (black)
and displayed (color).
3 North Pointer - Indicates north.
4 MODE - Indicates the weather product being displayed.
5 Control Knob Icon - Displayed when the Control Knobs are available for
cycling through the graphical weather products.
6Joys
7 Range Rings - Outer ring radius is selected range and inner ring radius
8 Aircraft Symbol - Indicates present aircraft position and heading (if
9 AIRMET Boundary - Color coded line indicating the boundaries of an
10 AIRMET Color Key
11 I N - Indicates the current aircraft position is ìIN ” an IFR AIRMET.
tick Label - Indicates joystick is active and can be used to pan map.
is one half the selected range.
available) or track.
AIRMET.
- Colors indicating AIRMET type.
11
Page 64

Revision 6 Feb/2009
KMD 550/850 FIS Addendum
51
GRAPHICAL AIRMETS PAGE OPERATIONAL CONTROLS
MODE - Displays the Select FIS Product Menu.
Joystick - Moving the joystick allows panning of
the map and placement of the pointer over the
desired AIRMET to be viewed.
RNG
▲▲//
RNG▼▼- Displays ZOOMING TO ### nm and
advances the indicator to the next range. The upper
button increases range, the lower button decreases it.
The selected range is displayed in the lower left corner
of the display with the outer range ring the displayed
range and the inner range ring is half the displayed
range. The RNG button labels will not be displayed when their respective
range limits are reached.
OVLY - Allows selection of flight plan and lightning data
(if Stormscope® equipment is installed) for overlay on
the FIS map.
Control Knobs - Used to select and/or cycle through the
available graphical weather products displays.
SELECTING AND USING THE GRAPHICAL AIRMETS PAGE
1. Press the WX Function
Select Key until the FIS
Graphics Page is displayed.
If necessary, turn the Control
Knob to obtain the Graphical
AIRMETs display as shown
in Figure 56. Graphical
AIRMETs will be displayed in
the MODE field located at the
top center of the display.
NOTE: This page will not be
accessible until a valid FIS
signal has been acquired and
processed by the system.
2. Press the RNG
▲▲//
RNG▼▼Key to zoom in on the display. The map is
centered on the present position indicated by the symbolic aircraft.
Figure 56
Normal Operation
Page 65

52
Revision 6 Feb/2009
KMD 550/850 FIS Addendum
Normal Operation
3. To view a specific
AIRMET, move the joystick in
the desired direction and
place the pointer on the
desired AIRMET border (see
Figure 57). A box will pop up
containing the AIRMET designator, TYPE and the AGE
of the report.
4. Press the RNG
▲▲//
RNG
▼▼
keys to zoom in or out on the
pointer position.
5. Press the MORE INFO
Softkey to display the Text
AIRMET Page for the displayed location as in Figure
58. The text describing
AIRMET location is displayed
in green to help differentiate
between location information
and weather information.
When the text report is
accessed from the map, the
text will automatically be
scrolled to the beginning of
the weather information.
Some report identifiers may
be highlighted in green
(CHIZ02 and SLCZ01).
These are AIRMET reports
that contain insufficient location information to be displayed on the AIRMET Map.
6. Press the AIRMET MAP
Softkey to return to the previous display.
7. Press the RESET STICK
Softkey to return to the present position display. If no actions are taken for a period of 30 seconds,
the display will return to the aircraft present position display.
8. To view the graphical AIRMET LEGEND, move the joystick pointer to
an empty area on the map and press the MORE INFO softkey. The
legend will be displayed as in Figure 59. Move the joystick to remove the
legend from the display.
Figure 59
Figure 58
Figure 57
Page 66

Revision 6 Feb/2009
KMD 550/850 FIS Addendum
53
9. Press the OVLY Key to
overlay flightplan and/or
Stormscope® data on the
Graphical AIRMET map (see
Figure 60). If a Stormscope®
system is not installed, the
STORMSCOPE Softkey will
not be displayed.
The FLIGHT PLAN softkey
toggles the overlay on or off
as in Figure 61. The
STORMSCOPE Softkey will
toggle the lightning display
symbols on or off (if a
Stormscope® is installed).
Press the SAVE & EXIT
softkey to retain the selection
on the display.
Figure 61
Figure 60
Normal Operation
Page 67

54
Revision 6 Feb/2009
KMD 550/850 FIS Addendum
Normal Operation
GRAPHICAL SIGMETS PAGE
The following illustration describes the Graphical SIGMETs display. The
only difference between VDL and XM is the Datalink Wx Status icon.
4
5
6
3
7
8
2
1
1 Range Scale - Indicates selected range.
2 Available Functions - Displays icons representing data available (black)
and displayed (color).
3 North Pointer - Indicates north.
4 MODE - Indicates the weather product being displayed.
5 Control Knob Icon - Displayed when the Control Knobs are available for
cycling through the graphical weather products.
6Joys
7 Range Rings - Outer ring radius is selected range and inner ring radius
8 Aircraft Symbol - Indicates present aircraft position and heading (if
9 SIGMET Boundary - Color coded line indicating the boundaries of a
10 SIGMET Color Key - Colors indicating SIGMET type.
tick Label - Indicates joystick is active and can be used to pan map.
is one half the selected range.
available) or track.
SIGMET.
9
10
Page 68

Revision 6 Feb/2009
KMD 550/850 FIS Addendum
55
GRAPHICAL SIGMETS PAGE OPERATIONAL CONTROLS
MODE - Displays the Select FIS Product Menu.
Joystick - Moving the joystick allows panning of
the map and placement of the pointer over the
desired SIGMET to be viewed.
RNG
▲▲//
RNG▼▼- Displays ZOOMING TO ### nm and
advances the indicator to the next range. The upper
button increases range, the lower button decreases it.
The selected range is displayed in the lower left corner
of the display with the outer range ring the displayed
range and the inner range ring is half the displayed
range. The RNG button labels will not be displayed when their respective
range limits are reached.
OVLY - Allows selection of flight plan and lightning data
(if Stormscope® equipment is installed) for overlay on
the FIS map.
Control Knobs - Used to select and/or cycle through the
available graphical weather products displays.
SELECTING AND USING THE GRAPHICAL SIGMETS PAGE
1. Press the WX Function
Select Key until the FIS
Graphics Page is displayed.
If necessary, turn the Control
Knob to obtain the Graphical
SIGMETs display as shown
in Figure 62. Graphical
SIGMETs will be displayed in
the MODE field located at the
top center of the display.
NOTE: This page will not be
accessible until a valid FIS
signal has been acquired and
processed by the system.
Figure 62
Normal Operation
Page 69

56
Revision 6 Feb/2009
KMD 550/850 FIS Addendum
Normal Operation
2. Press the RNG
▲▲//
RNG
▼▼
Key to zoom in on the display. The map is centered on
the present position indicated
by the symbolic aircraft.
3. To view a specific
SIGMET, move the joystick in
the desired direction and
place the pointer on the
desired SIGMET border (see
Figure 63). A box will pop up
containing the SIGMET designator, TYPE and the AGE
of the report.
4. Press the RNG
▲▲//
RNG
▼▼
keys to zoom in or out on the
pointer position.
5. Press the MORE INFO
Softkey to display the Text
SIGMET Page for the displayed location as in Figure
64. The text describing
SIGMET location is displayed
in green to help differentiate
between location information
and weather information.
When the text report is
accessed from the map, the
text will automatically be
scrolled to the beginning of
the weather information.
6. Press the SIGMET MAP
Softkey to return to the previous display.
7. Press the RESET STICK
Softkey to return to the present position display. If no
actions are taken for a period of 30 seconds, the display will return to the
aircraft present position display.
8. To view the graphical SIGMET LEGEND, move the joystick pointer to
an empty area on the map and press the MORE INFO softkey. The
legend will be displayed as in Figure 65. Move the joystick to remove the
legend from the display.
Figure 63
Figure 64
Figure 65
Page 70

Revision 6 Feb/2009
KMD 550/850 FIS Addendum
57
9. Press the OVLY Key to
overlay flightplan and/or
Stormscope® data on the
Graphical SIGMET map (see
Figure 66). If a Stormscope®
system is not installed, the
STORMSCOPE Softkey will
not be displayed.
The FLIGHT PLAN softkey
toggles the overlay on or off
as in Figure 67. The
STORMSCOPE Softkey will
toggle the lightning display
symbols on or off (if a
Stormscope® is installed).
Press the SAVE & EXIT
softkey to retain the selection
on the display.
Figure 66
Figure 67
Normal Operation
Page 71

58
Revision 6 Feb/2009
KMD 550/850 FIS Addendum
Normal Operation
GRAPHICAL CONVECTIVE SIGMETS PAGE
The following illustration describes the Graphical Convective SIGMETs
display. The only difference between VDL and XM is the Datalink Wx
Status icon.
4
5
6
3
7
8
2
9
10
1
11
1 Range Scale - Indicates selected range.
2 Available Functions - Displays icons representing data available (black)
and displayed (color).
3 North Pointer - Indicates north.
4 MODE - Indicates the weather product being displayed.
5 Control Knob Icon - Displayed when the Control Knobs are available for
cycling through the graphical weather products.
6Joys
7 Range Rings - Outer ring radius is selected range and inner ring radius
8 Aircraft Symbol - Indicates present aircraft position and heading (if
9 Convective SIGMET Boundary - Color coded line indicating the boundaries
10 IN - Indicates the current aircraft position is “IN” a thunderstorm Convective
11 Convective SIGMET Color Key - Colors indicating Convective SIGMET
tick Label - Indicates joystick is active and can be used to pan map.
is one half the selected range.
available) or track.
of a Convective
SIGMET.
type.
SIGMET.
Page 72

Revision 6 Feb/2009
KMD 550/850 FIS Addendum
59
GRAPHICAL CONVECTIVE SIGMETS PAGE OPERATIONAL
CONTROLS
MODE - Displays the Select FIS Product Menu.
Joystick - Moving the joystick allows panning of
the map and placement of the pointer over the
desired Convective SIGMET to be viewed.
RNG
▲▲//
RNG▼▼- Displays ZOOMING TO ### nm and
advances the indicator to the next range. The upper
button increases range, the lower button decreases it.
The selected range is displayed in the lower left corner
of the display with the outer range ring the displayed
range and the inner range ring is half the displayed
range. The RNG button labels will not be displayed when their respective
range limits are reached.
OVLY - Allows selection of flight plan and lightning data
(if Stormscope® equipment is installed) for overlay on
the FIS map.
Control Knobs - Used to select and/or cycle through the
available graphical weather products displays.
SELECTING AND USING THE GRAPHICAL CONVECTIVE
SIGMETS PAGE
1. Press the WX Function
Select Key until the FIS
Graphics Page is displayed.
If necessary, turn the Control
Knob to obtain the Graphical
Convective SIGMETs display
as shown in Figure 68.
Graphical Conv SIGMETs
will be displayed in the
MODE field located at the top
center of the display.
NOTE: This page will not be
accessible until a valid FIS
signal has been acquired and processed by the system.
2. Press the RNG
▲▲//
RNG▼▼Key to zoom in on the display. The map is
centered on the present position indicated by the symbolic aircraft.
Figure 68
Normal Operation
Page 73

60
Revision 6 Feb/2009
KMD 550/850 FIS Addendum
Normal Operation
3. To view a specific
Convective SIGMET, move
the joystick in the desired
direction and place the
pointer on the desired
Convective SIGMET border
(see Figure 69). A box will
pop up containing the
Convective SIGMET designator, TYPE and the AGE of
the report.
4. Press the RNG
▲▲//
RNG
▼▼
keys to zoom in or out on the
pointer position.
5. Press the MORE INFO
Softkey to display the Text
Convective SIGMET Page
for the displayed location as
in Figure 70. The text
describing Convective
SIGMET location is displayed
in green to help differentiate
between location information
and weather information.
When the text report is
accessed from the map, the
text will automatically be
scrolled to the beginning of
the weather information.
6. Press the C-SIG MAP
Softkey to return to the previous display.
7. Press the RESET STICK
Softkey to return to the present position display. If no
actions are taken for a period
of 30 seconds, the display
will return to the aircraft present position display.
8. To view the graphical CONV SIGMET LEGEND, move the joystick
pointer to an empty area on the map and press the MORE INFO softkey.
The legend will be displayed as in Figure 71. Move the joystick to
remove the legend from the display.
Figure 69
Figure 70
Figure 71
Page 74

Revision 6 Feb/2009
KMD 550/850 FIS Addendum
61
9. Press the OVLY Key to
overlay flightplan and/or
Stormscope® data on the
Graphical Convective
SIGMET map (see Figure
72). If a Stormscope®
system is not installed, the
STORMSCOPE Softkey will
not be displayed.
The FLIGHT PLAN softkey
toggles the overlay on or off
as in Figure 73. The
STORMSCOPE Softkey will
toggle the lightning display
symbols on or off (if a
Stormscope® is installed).
Press the SAVE & EXIT
softkey to retain the selection
on the display.
Figure 72
Figure 73
Normal Operation
Page 75

62
Revision 6 Feb/2009
KMD 550/850 FIS Addendum
Normal Operation
GRAPHICAL ALERT WEATHER WATCHES PAGE (AWW)
(VDL ONLY)
The following illustration describes the Graphical Alert Weather Watches
(AWW) display.
4
5
6
3
7
8
2
9
10
1
11
1 Range Scale - Indicates selected range.
2 Available Functions - Displays icons representing data available (black)
and displayed (color).
3 North Pointer - Indicates north.
4 MODE - Indicates the weather product being displayed.
5 Control Knob Icon - Displayed when the Control Knobs are available for
cycling through the graphical weather products.
6Joys
7 Range Rings - Outer ring radius is selected range and inner ring radius
8 Aircraft Symbol - Indicates present aircraft position and heading (if
9 Weather Watch Boundary - Color coded line indicating the boundaries
10 IN - Indicates the current aircraft position is “IN” a severe thunderstorm
11 Weather Watch Color Key - Colors indicating Alert Weather Watch type.
tick Label - Indicates joystick is active and can be used to pan map.
is one half the selected range.
available) or track.
of an Alert Wea
watch area.
ther Watch.
Page 76

Revision 6 Feb/2009
KMD 550/850 FIS Addendum
63
GRAPHICAL ALERT WEATHER WATCHES PAGE
OPERATIONAL CONTROLS
MODE - Displays the Select FIS Product Menu.
Joystick - Moving the joystick allows panning of
the map and placement of the pointer over the
desired Weather Watch to be viewed.
RNG
▲▲//
RNG▼▼- Displays ZOOMING TO ### nm and
advances the indicator to the next range. The upper
button increases range, the lower button decreases it.
The selected range is displayed in the lower left corner
of the display with the outer range ring the displayed
range and the inner range ring is half the displayed
range. The RNG button labels will not be displayed when their respective
range limits are reached.
OVLY - Allows selection of flight plan and lightning data
(if Stormscope® equipment is installed) for overlay on
the FIS map.
Control Knobs - Used to select and/or cycle through the
available graphical weather products displays.
SELECTING AND USING
THE GRAPHICAL
ALERT WEATHER
WATCHES PAGE
1. Press the WX Function
Select Key until the FIS
Graphics Page is displayed.
If necessary, turn the Control
Knob to obtain the Graphical
Alert Weather Watches display as shown in Figure 74. Wx Watches (AWW) will be displayed in the
MODE field located at the top center of the display.
NOTE: This page will not be accessible until a valid FIS signal has been
acquired and processed by the system.
2. Press the RNG
▲▲//
RNG▼▼Key to zoom in on the display. The map is
centered on the present position indicated by the symbolic aircraft.
Figure 74
Normal Operation
Page 77

64
Revision 6 Feb/2009
KMD 550/850 FIS Addendum
Normal Operation
3. To view a specific Alert
Weather Watch, move the
joystick in the desired direction and place the pointer on
the desired Weather Watch
border (see Figure 75). A box
will pop up containing the
Weather Watch designator,
TYPE and the AGE of the
report.
4. Press the RNG
▲▲//
RNG
▼▼
keys to zoom in or out on the
pointer position.
5. Press the MORE INFO
Softkey to display the Text
Alert Weather Watch Page
for the displayed location as
in Figure 76. The text
describing AWW location is
displayed in green to help differentiate between location
information and weather
information. When the text
report is accessed from the
map, the text will automatically be scrolled to the beginning of the weather information.
6. Press the AWW MAP
Softkey to return to the previous display.
7. Press the RESET STICK
Softkey to return to the present position display. If no
actions are taken for a period
of 30 seconds, the display
will return to the aircraft present position display.
8. To view the graphical Wx
WATCH (AWW) LEGEND,
move the joystick pointer to an empty area on the map and press the
MORE INFO softkey. The legend will be displayed as in Figure 77. Move
the joystick to remove the legend from the display.
Figure 75
Figure 76
Figure 77
Page 78

Revision 6 Feb/2009
KMD 550/850 FIS Addendum
65
9. Press the OVLY Key to
overlay flightplan and/or
Stormscope® data on the
Graphical Alert Weather
Watch map (see Figure 78).
If a Stormscope® system is
not installed, the STORM-
SCOPE Softkey will not be
displayed.
The FLIGHT PLAN softkey
toggles the overlay on or off
as in Figure 79. The
STORMSCOPE Softkey will
toggle the lightning display
symbols on or off (if a
Stormscope® is installed).
Press the SAVE & EXIT
softkey to retain the selection
on the display.
Figure 78
Figure 79
Normal Operation
Page 79

66
Revision 6 Feb/2009
KMD 550/850 FIS Addendum
Normal Operation
FIS TEXT PAGE
Press the WX Function Select Key until the FIS Text Page is displayed.
The following illustration describes the FIS Text Page display. The only
difference between VDL and XM is the Datalink Wx Status icon.
1 Text Field - The translated METARS data is displayed first in this window
followed by the encoded weather report is displayed in this field.
2 Available Functions - Displays icons representing data available (black)
and displayed (color).
3 Selected Report Info - Displays name, city and state of selected report.
4 Selected Area Identifier - Displays the identifier of the area selection.
5 Area Selection - Pressing the CHANGE AREA soft key cycles between
Destination, Flightplan WPT, Nearest and User Defined.
6 Mode - Pressing the MODE key will display the SELECT FIS PRODUCT
Menu.
7UTC- Current UTC time.
8 Report - Each horizontal movement of the joystick will move the cursor
over the next report in the AVAILABLE REPORTS field.
9 Available Reports - Shows available reports based on the selection in the
AREA field. Special, urgent or amended reports are highlighted in yellow.
10 Scroll Bar Left/Right - Indicates there are more available reports than can
be displayed on the screen. Move the joystick left/right to cycle through the
reports.
11 Change Area Soft Key - Cycles the AREA field between Destination,
Flightplan Waypoint (FLPN WPT), Nearest and User Defined.
12 METAR Map Soft Key - When this key is pressed the graphical METAR
page is displayed with the map centered on the selected METAR. This is
only available when valid data for graphical METARs is being received.
13 Age of Report - Age of report based on UTC time minus time of report.
The bar indicates percentage of age versus elapsed time before expiration.
The bar will be green the first 50% then turn yellow.
14 Knob Function Label - Indicates the knob function is set to DATA input
(USER DEFINED) or SCAN data (FLPN WPT).
15 Scroll Bar Up/Down - Indicates there is more available data in this report
than can be displayed on the screen. Move the joystick Up/Down to cycle
through the reports.
6
7
8
5
9
4
10
3
11
13
2
12
15
1
14
Page 80

Revision 6 Feb/2009
KMD 550/850 FIS Addendum
67
FIS TEXT PAGE OPERATIONAL CONTROLS
MODE - Displays the Select FIS Product Menu.
Joystick - Moving the joystick right or left
moves the cursor through the available
reports.
CHANGE AREA - Pressing the CHANGE
AREA softkey will cycle through the four
options available for the AREA field in the
upper right of the display. Available selections
are DESTINATION, NEAREST, FLPN WPT and USER DEFINED. The
closest available weather reports for the selected AREA will be displayed in the REPORTS AVAILABLE IN AREA field.
(
PRODUCT
) MAP - This softkey is available
when viewing textual weather products that are
available graphically and will reflect the
selected weather product (METAR, AIRMET, SIGMET, etc.). When this
softkey is pressed, the corresponding graphical weather product map will
be displayed with the map centered on the location of the selected
report.
SCAN/DATA - The SCAN feature is only
available when FLPN WPT is the selected
AREA. The DATA feature is available when
USER DEFINED is selected. When the
Control Knob function is set to SCAN, the
inner knob cycles through the available flight plan waypoints. When the
Control Knob function is set to DATA, the outer knob moves the cursor
to the desired character in the desired field. The inner knob allows the
selection of the desired letter or number in each field.
Normal Operation
Page 81

68
Revision 6 Feb/2009
KMD 550/850 FIS Addendum
Normal Operation
USING THE FIS TEXT PAGE
Press the WX Function
Select Key until the FIS Text
Page is displayed as shown
in Figure 80.
NOTE: If a message such as
that shown in Figure 81
(METARs or other weather
product) is displayed, it may
be that the system has not
had time to acquire a signal.
If this message is still present
after 5-10 minutes, refer to
the Messages section of this
addendum.
If no report for the selected
weather product is available
in the selected area, NO
(Selected Product) AVAIL-
ABLE IN SELECTED AREA
will be displayed.
When viewing FIS textual
reports of Area Products,
such as AIRMETs (as in
Figure 82), SIGMETs,
Convective SIGMETs and
Weather Watches (VDL
Only), the description of the
affected area will be displayed in green. The description of the weather phenomenon will be displayed in
black. If the textual page is
accessed from one of the
graphical area product
pages, the page will automatically be scrolled to the
beginning of the weather
description.
NOTE: If an AIRMET report
identifier in the REPORTS
AVAILABLE IN AREA field is highlighted in green, the description of the
affected area does not represent a polygon (e.g. area along and 25 nm
either side of a line from...) and cannot be displayed on the AIRMET
map.
Figure 80
Figure 81
Figure 82
Page 82

Revision 6 Feb/2009
KMD 550/850 FIS Addendum
69
CHANGING MODES & AREA
1. Press the MODE Key to
display the SELECT FIS
PRODUCT Menu as shown
in Figure 83. Use the Joystick
or the Control Knobs to
select the desired textual
product.
The type of report selected is
then displayed in the MODE
field at the top of the display.
Figure 84 shows the relationship between the selected AREA and the selected MODE. The system
filters and then displays reports for the selected MODE based on the distance from the selected AREA. The REPORTS AVAILABLE IN AREA
field lists closest first, furthest last.
For instance, the display shown in Figure 80 lists all available METARs
within 50nm of KIXD (the selected AREA). KIXD is also a reporting station which is listed first in the REPORTS AVAILABLE IN AREA. Use the
joystick to scroll across through the available reports. Urgent, special or
amended reports will be highlighted in yellow.
Note that the displayed report in Figure 80 is 61 minutes old. The bar
indicates a percentage of time left before expiration. The bar will be
green the first 50%, then turn yellow.
Figure 85
Figure 84
Figure 83
Normal Operation
METARs
TAFs
Selected Area
0 50 100 150
Radius in Nautical Miles of Selected Area
PIREPs & Area Products
Destination
☞ ☞ ☞
Flightplan
Waypoint
☞
Nearest
User
Defined
Page 83

70
Revision 6 Feb/2009
KMD 550/850 FIS Addendum
Normal Operation
2. Press the CHANGE AREA softkey to view reports for either
NEAREST to present position, USER DEFINED location, DESTINATION (last waypoint in a flightplan) or FPLN WPT (any waypoint in an
active flightplan). The softkey cycles through the AREAs as shown in
Figure 85.
These four selectable areas are used to make it easier to find all the
reports near a specific location without having to know the exact identifier
of the reporting station. Again, refer to Figure 84 to understand the relationship between the selected AREA and the selected MODE.
SELECTING IDENTIFIERS
USING THE DATA/SCAN
KNOB
Scanning Flightplan
Waypoints
If FPLN WPT is selected in
the AREA field (as shown in
Figure 86), the SCAN Knob
can be used to sequence
through all the waypoints on
the active flightplan. The next
waypoint from the current position will be displayed.
Turn the inner knob clockwise to sequence forward through the waypoints. Turn the inner counter-clockwise to sequence backward through
the waypoints.
Finding User Defined
Areas By Identifier
If USER DEFINED has been
selected, as in Figure 87, use
the Control Knob to enter
data (note cursor position in
Figure 87) or scan through
available location options.
The following is an example
of using this feature.
Figure 87
Figure 86
Page 84

Revision 6 Feb/2009
KMD 550/850 FIS Addendum
71
1. The cursor will be over
the first character of the waypoint identifier. Select the
desired character by turning
the inner knob. The screen
will change to that shown in
Figure 88.
2. Turn the outer knob one
click clockwise to move the
cursor to the next character
field as shown in Figure 89.
Turn the inner knob to select
the desired character.
3. Turn the outer knob one
click clockwise to move the
cursor to the next character
field. Turn the inner knob to
select the desired character.
See Figure 90.
4. Turn the outer knob one
click clockwise to move the
cursor to the next character
field. Turn the inner knob to
select the desired character.
Figure 90
Figure 89
Figure 88
Normal Operation
Page 85

72
Revision 6 Feb/2009
KMD 550/850 FIS Addendum
Normal Operation
5. Press the OK softkey
when finished making selections. The display will be as
shown in Figure 91.
6. Move the joystick right or
left to view available reports.
NOTE: Available reports
highlighted in yellow, like
KMCW in Figure 91, indicates the report is a special
report, urgent report or an
amended or corrected report.
7. Press the METAR MAP
softkey to display the
selected report location (in
this case KCAV) centered on
the Graphical METAR display as shown in Figure 92.
NOTE: The METAR MAP
softkey is only available
when viewing METARs and
valid data for graphical
METARs is being received.
Finding User Defined Areas by Name or City
When the identifier of the desired location is known, the method previously described can be used to select it. However, if the identifier is not
known, the name of the location can be entered. The system will also
allow entry of just the first few characters of the location name to help
find it in the database. If neither the identifier nor the
location name is known, the
city/state can be scanned.
To Enter Location Name:
The following example shows
entering EAGLE GROVE
MUN as a location.
1. Turn the outer Control
Knob one click clockwise.
Figure 93 will be displayed.
Figure 92
Figure 93
Figure 91
Page 86

Revision 6 Feb/2009
KMD 550/850 FIS Addendum
73
2. Continue to turn the outer
knob clockwise to highlight
the N as shown in Figure 94.
3. Turn the inner knob counterclockwise until an E is
selected as shown in Figure
95.
4. Turn the outer knob clockwise until the cursor is positioned for the next character.
Turn the inner knob to select
a A as in Figure 96.
Figure 96
Figure 95
Figure 94
Normal Operation
Page 87

74
Revision 6 Feb/2009
KMD 550/850 FIS Addendum
Normal Operation
5. Turn the outer knob clockwise until the cursor is positioned for the next character
entry.
Turn the inner knob to select
a G as in Figure 97.
6. Turn the outer knob clockwise until the cursor is positioned for the next desired
character entry.
7. Turn the inner knob clockwise to select a G as shown
in Figure 98. The desired
location is now displayed
because it is the first instance
in the database with a G in
this field.
To Scan for Location
Name:
Sometimes, only a portion of
the airport name may come
to mind. The following
example shows scanning for
EAGLE GROVE MUN when
EAGLE is the only portion of
the name remembered.
1. Repeat Step 1 through 6
of the previous procedure.
2. Press the KNOB SCAN
softkey. The Control Knob
label will now display SCAN .
The knob label will now show
SCAN as in Figure 99.
3. Turn the outer knob clockwise until the cursor is positioned as in Figure 99.
Figure 97
Figure 98
Figure 99
Page 88

Revision 6 Feb/2009
KMD 550/850 FIS Addendum
75
4. Turn the inner knob to
sequence through all the
location names in the database beginning with EAGLE.
stopping at the desired name
as in Figure 100.
NOTE: This same method
may be used with the name
of the city where the airport is
located.
This method is also used to
choose the desired airport
among those of identical
names, but located in different cities.
Figure 100
Normal Operation
Page 89

76
Revision 6 Feb/2009
KMD 550/850 FIS Addendum
Normal Operation
FIS NETWORK STATUS PAGE
(VDL ONLY)
The FIS Network Status Page displays the location and identifier of
installed VDL ground stations. This page can also be used to determine
which stations are being received and the status of each station.
The following illustration describes the FIS Network Status Page display.
5
6
4
7
3
8
9
2
10
1
- Indicates selected range.
Page 90

Revision 6 Feb/2009
KMD 550/850 FIS Addendum
77
1. Press the AUX Function Select Key
to display the Auxiliary Mode Cover
Page as shown in Figure 101.
2. Press the WX SETUP
softkey to display the WX
Setup Cover Page as shown
in Figure 102.
3. Press the FIS softkey to
display the FIS Setup Cover
Page as shown in Figure
103.
Figure 101
Figure 102
Figure 103
Normal Operation
Page 91

78
Revision 6 Feb/2009
KMD 550/850 FIS Addendum
Normal Operation
4. Press the FIS STATUS
softkey to display the FIS
Network Status Page as
shown in Figure 104. A
ground station icon with
“transmitting rays” emanating
from that location is a station
from which data was
received within the last 30
seconds.
NOTE: At any given moment
the FIS receiver may not be
receiving the closest transmitting site. This is not a
problem since all stations
transmit the same data.
5. Ground station status and
it’s identifier number can be
viewed by moving the joystick to position the pointer
over the desired ground station as shown in Figure 105.
NOTE: Visit Wingman Services at www.bendixking.com to view the
latest information about network transmitter locations and to cross-reference ground station IDs with the location names.
Figure 104
Figure 105
Page 92

MESSAGES
The following are descriptions of messages that may be displayed.
FIS ALERT, NO VALID
FIS SUBSCRIPTIONS
The message shown in
Figure 106 would indicate
that no subscriptions have
been set up or previously
entered subscriptions have
expired or will become valid
at a future date. This is the
only indication received when
an XM WX subscription has
expired.
NO DATA RECEIVED
FROM FIS RECEIVER
If the KMD 550/850 display is
unable to communicate with
the KDR 510 VDL Receiver
or the KDR 610 XM
Receiver, a message such
as that shown in Figure 107
will be displayed.
If this message persists, it
may indicate a problem with
the Receiver or the wiring
between the KDR 510/610
and the KMD 550/850.
(PRODUCT)
NOT
AVAILABLE, DATA
NOT RECEIVED
If no valid graphical FIS data
is received, a message such
as the NEXRAD Image
product example in Figure
108 will be displayed.
This message usually means that the system is not in FIS VDL coverage, or the XM WX signal strength is poor.
The message can also occur while in coverage if not all of the data for a
weather product has been received.
Messages
Figure 107
Figure 106
Figure 108
Revision 6 Feb/2009
KMD 550/850 FIS Addendum
79
Page 93

80
Revision 6 Feb/2009
KMD 550/850 FIS Addendum
NO
(PRODUCT)
AVAILABLE IN SELECTED
AREA
A message such as the
METARs example shown in
Figure 109 will be displayed if
no data for the FIS product
selected is available in the
selected area.
This message means that
the FIS system is working
properly, there are simply no
reports of the selected mode
within the area.
FIS ALERT, FIS DATA
NOT RECEIVED FOR
15 MINUTES
This message will be displayed (Figure 110) if FIS
data has previously been
received, but it has been 15
minutes or more since the
last reception. The message
can be cleared by pressing
the OK softkey. The message will not appear again
unless data is again received
then again lost for 15 minutes.
NO
(PRODUCT)
AVAILABLE, DATA NOT
RECEIVED
This message will be displayed as in the METARs
example in Figure 111 if no
FIS product data has been
received.
This message means the FIS system has not received any data for the
selected FIS weather product. This may be due to not being in FIS coverage or to poor signal strength.
Messages
Figure 111
Figure 110
Figure 109
Page 94

Revision 6 Feb/2009
KMD 550/850 FIS Addendum
81
INVALID ENTRY,
PLEASE CHECK
CODE
(VDL ONLY)
This message will be displayed (Figure 112) if an
invalid Subscription Code is
entered. This may be due to
an error entering the
Subscription Code. Also, it
may be due to a Subscription
Code being entered that is
associated with a different
Display ID.
ERROR PROCESSING
SUBSCRIPTION CODE
(VDL ONLY)
This message will be displayed (Figure 113) when
there is a problem processing
the Subscription Code.
Cycling power to the unit and
re-entering the code usually
resolves the problem. If this
message persists, the
problem may be with the
Database Card or the
decryption hardware.
FIS DECRYPTION
FAILURE. UNABLE TO
ACCEPT A NEW SUBSCRIPTION CODE
(VDL ONLY)
This message will be displayed (Figure 114) if the
internal decryption hardware
has failed or is otherwise not
responding to commands.
Messages
Figure 112
Figure 113
Figure 114
Page 95

82
Revision 6 Feb/2009
KMD 550/850 FIS Addendum
NETWORK STATUS
NOT AVAILABLE,
DATA NOT RECEIVED
(VDL ONLY)
This message will be displayed (Figure 115) if no
valid network status data is
available.
FIS ALERT, ONE OR
MORE FIS SUBSCRIPTIONS ARE CLOSE TO
EXPIRING. PLEASE
REVIEW YOUR SUBSCRIPTIONS
(VDL ONLY)
This message will be displayed (Figure 116) if the
system detects at least one
subscription is within 7 days
of it’s displayed ending date.
FIS ALERT, ONE OR
MORE FIS SUBSCRIPTIONS HAVE
EXPIRED. PLEASE
REVIEW YOUR SUBSCRIPTIONS
(VDL ONLY)
This message will be displayed (Figure 117) if the
system detects at least one
subscription is within the 1
day of it’s displayed ending
date. Services pertaining to
this subscription will still be
accessible.
Messages
Figure 115
Figure 116
Figure 117
Page 96

Revision 6 Feb/2009
KMD 550/850 FIS Addendum
83
FIS ALERT, DATA
CARD UPDATE
REQUIRED FOR CONTINUED RECEPTION
OF FIS DATA
(VDL
ONLY)
If the system detects that the
system date is within 30 days
of the ending date of the data
card a message such as that
shown in Figure 118 will be
displayed. This is a reminder.
FIS services will continue to
function until reaching the
ending date of the data card.
FIS ALERT, NEW DATA
CARD NOT YET
VALID. UNABLE TO
RECEIVE FIS DATA
(VDL ONLY)
This message will be displayed (Figure 119) if the
system detects the system
date is prior to the starting
date of the data card.
FIS ALERT, DATA
CARD HAS EXPIRED.
UNABLE TO RECEIVE
FIS DATA
(VDL ONLY)
If the system detects the
system date is after the
ending date of the data card
a message such as that
shown in Figure 120 will be
displayed. FIS services will
not be accessible.
Messages
Figure 118
Figure 119
Figure 120
Page 97

84
Revision 6 Feb/2009
KMD 550/850 FIS Addendum
FIS ALERT, FIS SUBSCRIPTION ERROR.
SWITCH OFF AND
REPLACE DATA CARD
(VDL ONLY)
A message such as that
shown in Figure 121 will be
displayed if there is a
problem internal to the data
card.
FIS ALERT, FIS
DECRYPTION ERROR.
UNABLE TO RECEIVE
FIS DATA
(VDL ONLY)
This message is similar in
appearance to that shown in
Figure 121. This message
indicates that a decryption
hardware failure has
occurred after system startup
and a successful self-test.
Figure 121
Messages
Page 98

Revision 6 Feb/2009
A-1
KMD 550/850 FIS Addendum
Appendix A
Understanding Weather Reports
APPENDIX A
UNDERSTANDING TEXTUAL AVIATION
WEATHER REPORTS
UNDERSTANDING METARS
Refer to the numbers on the following diagram to find the appropriate
descriptions.
1. Type of Report: METAR (SPECI will be seen here if this is a
Special Weather Report)
2. ICAO Station Identifier: KPIT
This is the location for which the METAR pertains.
3. Date and Time of Issue: 201955Z
The 20th day of the month at 1955Zulu or UTC.
4. AUTO indicates the reporting station is an automated station. If the
reporting station is a manned station this element will be omitted.
Also, if a report from an automated station is modified by a person
this element will be omitted. “COR” indicates a corrected report.
5. Wind: 22015G25KT
220 is the 3 digit true direction to the nearest 10°. Airport advisory
service, ATIS and ATC towers report wind direction as magnetic.
“VRB” in this place indicates variable winds less than or equal to 6
knots. If wind direction is varying more than 60° with speeds over 6
knots, an entry similar to “180V260” will be displayed in this place.
This example actually shows wind direction varying by 80°.
15 is the 2 or 3 digit wind speed (in knots).
25 is the 2 or 3 digit wind gust speed in knots (KT) because it follows a
G (Gust).
6. Visibility: 3/4SM R28R/2600FT
3/4 indicates 3/4 statute mile (SM) visibility.
Runway Visual Range (RVR) for R28R (runway 28 right) is 2600
13452678
METAR KPIT 201955Z AUTO 22015G25KT 3/4SM R28R/2600FT TSRA OVC010CB
18/16 A2992 RMK SLPO13 T01760158 PK WND 22030/15 $
910 11
12
Page 99

feet (2600FT). An “M” in this distance number indicates visibility is
less than the lowest reportable sensor value. A “P” indicates visibility
is greater than the highest reportable sensor value.
NOTE: Only reported at those locations with certified RVR reporting
capability.
7. Significant Present Weather: TSRA
TS is a two letter designation for thunderstorm. Other possible des-
ignations could be as follows:
BC Patches
BL Blowing
DR Low Drifting
FZ Supercooled/Freezing
MI Shallow
PR Partial
SH Showers
The second two letter designator, RA, indicates moderate rain.
Moderate is indicated by the absence of a “+”, “-” or “VC” preceding
the designation. These preceding designations represent the following:
+ Heavy
- Light
VC In the vicinity
Other possible designations could be as follows:
BR Mist
DS Dust Storm
DU Widespread Dust
DZ Drizzle
FC Funnel Cloud
+FC Tornado/Water Spout
FG Fog
FU Smoke
GR Hail
GS Small Hail/Snow Pellets
HZ Haze
IC Ice Crystals
PE Ice Pellets
PO Dust/Sand Whirls
PY Spray
SA Sand
SG Snow Grains
SN Snow
SQ Squall
SS Sandstorm
UP Unknown Precipitation (Automated Observations)
VA Volcanic Ash
A-2
Revision 6 Feb/2009
KMD 550/850 FIS Addendum
Appendix A
Understanding Weather Reports
Page 100

Revision 6 Feb/2009
A-3
KMD 550/850 FIS Addendum
Appendix A
Understanding Weather Reports
8. Sky Condition: OVC010CB
OVC indicates the sky is overcast. Cloud cover is based on the sky
being divided into eighths or octas. Overcast means the sky is 8
octas covered. The cloud cover designators are as follows:
SKC Sky Clear
CLR Clear below 12,000 ft. (automated observing systems)
FEW 1-2 Octas
SCT 3-4 Octas
BKN 5-7 Octas
OVC 8 octas
“VV” may also be encountered here indicating an indefinite ceiling.
For example, VV004 would indicate a vertical visibility of 400 feet.
010 indicates clouds are at 1000 feet.
CB denotes cloud type is cumulonimbus. “TCU” is another possible
designator meaning towering cumulus. CI is cirrus.
9. Temperature/Dew Point: 18/16
18 indicated the temperature is 18° Celsius. An “M” preceding the
temperature means the temperature is below 0° Celsius.
16 indicated the dew point is 16° Celsius. An “M” preceding the dew
point means the dew point is below 0° Celsius.
10. Altimeter Setting: A2992
A indicates the setting is in inches of mercury.
2992 is the altimeter setting. The first two digits are inches and the
second two are hundredths.
11. Remarks: RMK SLP013 T01760158 PK WND 22030/15
RMK designates the beginning of the remarks. Remarks can con-
tain anything, but often include the following:
SLP indicates sea level pressure in millibars from selected stations.
013 indicates pressure is 1001.3 millibars.
T01760158. Selected stations may also include a 9 place code indi-
cating temperature and dewpoint to the nearest 1/10 degree. T
denotes temperature. 0 indicates temperature is above 0° Celsius.
A “1” in this position indicates a temperature below 0° Celsius. 176
indicates a temperature of 17.6° Celsius. The next 0 indicates the
dew point is above 0° Celsius. A “1” in this position indicates a dew
point below 0° Celsius. 158 indicates a dewpoint of 15.8° Celsius.
PK WND 22030/15. Selected stations may include peak wind observations which will appear in the remarks element.
 Loading...