

Page 1

Understanding Aviation
Weather Reports
B
N
Page 2

WARNING
The enclosed technical data is eligible for export under License Designation NLR
and is to be used solely by the individual/organization to whom it is addressed.
Diversion contrary to U.S. law is prohibited.
COPYRIGHT NOTICE
Copyright © 2001, 2003 Honeywell International Inc. All rights reserved.
Reproduction of this publication or any portion thereof by any means without the
express written permission of Honeywell International Inc. is prohibited. For further information contact the Manager, Technical Publications; Honeywell; One
Technology Center; 23500 West 105th Street; Olathe, Kansas 66061.
Telephone: (913) 712-0400.
Page 3

TABLE OF CONTENTS
UNDERSTANDING METARS . . . . . . . . . . . . . . . . . . . . . . . . . . . . . . . . .1
UNDERSTANDING TAFS . . . . . . . . . . . . . . . . . . . . . . . . . . . . . . . . . . . .4
UNDERSTANDING PIREPS . . . . . . . . . . . . . . . . . . . . . . . . . . . . . . . . . .6
UNDERSTANDING AIRMETS . . . . . . . . . . . . . . . . . . . . . . . . . . . . . . . . .8
UNDERSTANDING SIGMETS . . . . . . . . . . . . . . . . . . . . . . . . . . . . . . . .10
UNDERSTANDING CONVECTIVE SIGMETS . . . . . . . . . . . . . . . . . . .12
UNDERSTANDING ALERT WEATHER WATCHES (AWW) . . . . . . . .14
APPENDIX A COMMON WEATHER ABBREVIATIONS . . . . . . . . . .A-1
APPENDIX B INFLIGHT ADVISORY LOCATOR CHARTS . . . . . . . .B-1
Rev 1 Oct. 2003
i
Page 4

This page intentionally left blank
Rev 1 Oct. 2003
ii
Page 5
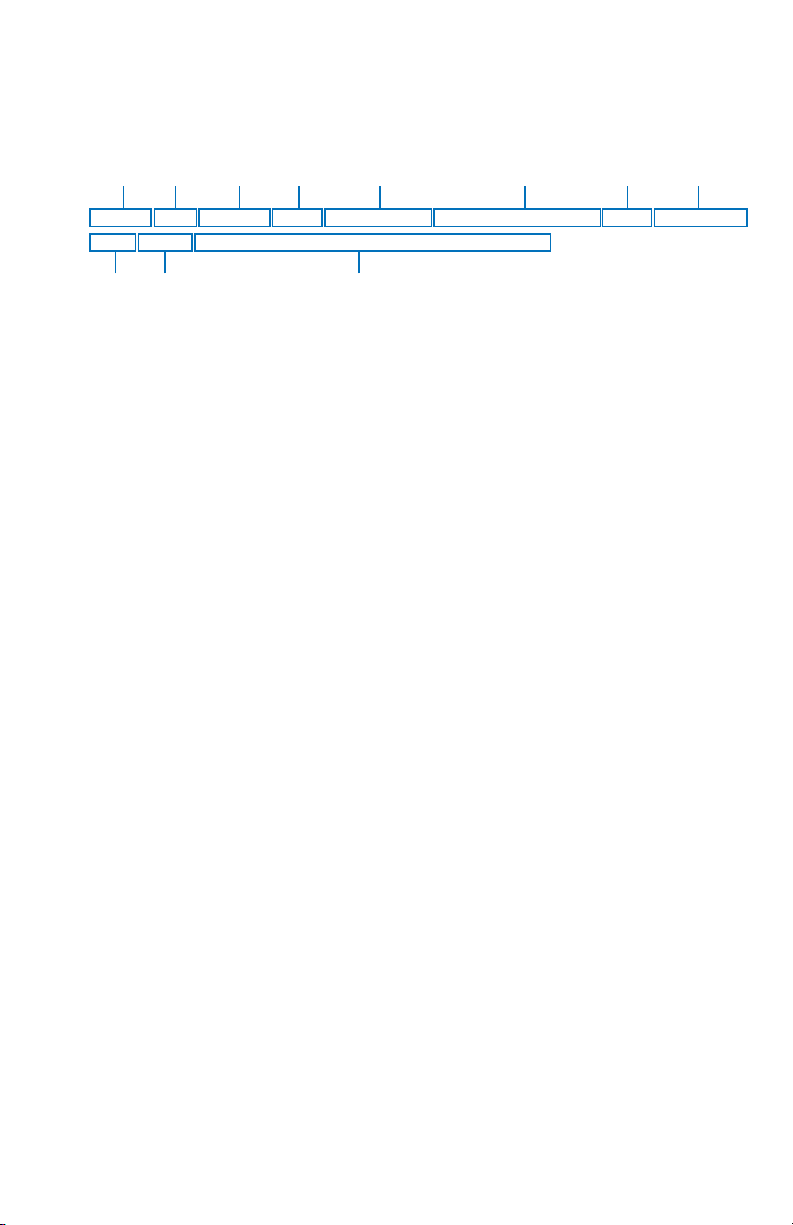
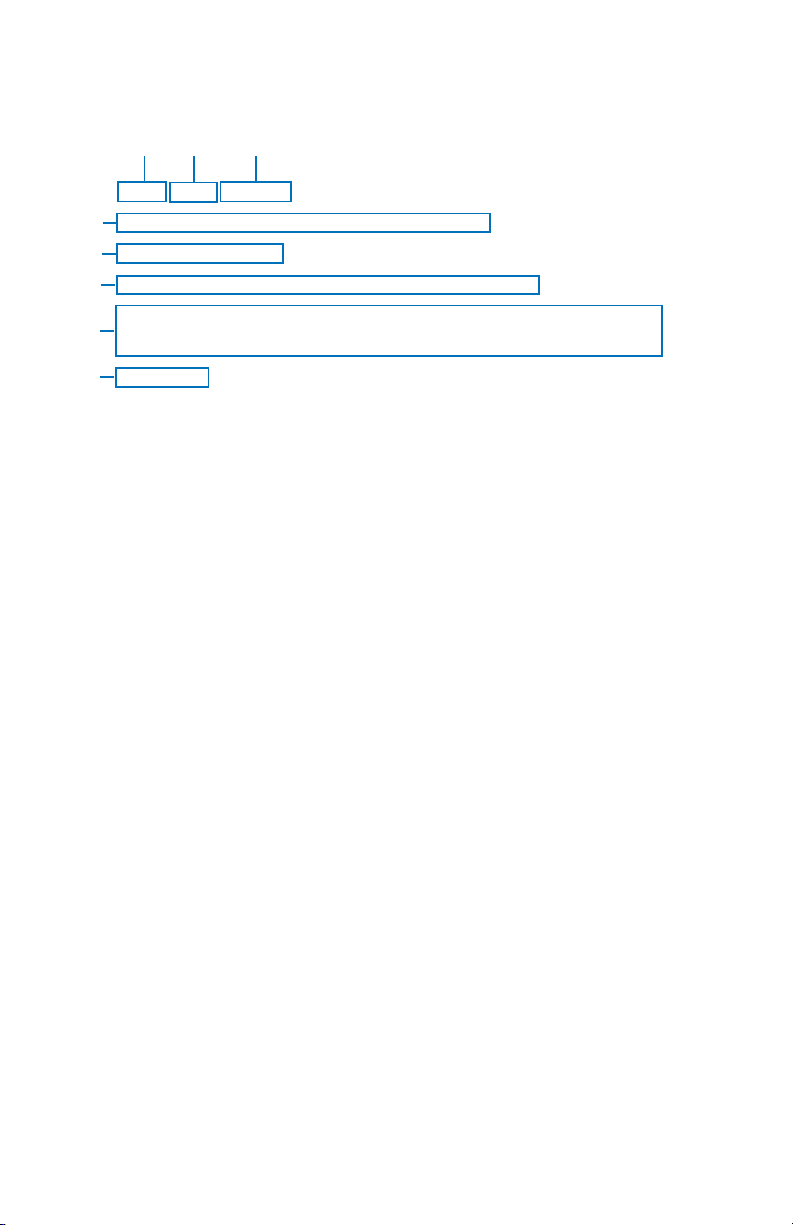
UNDERSTANDING METARS
Refer to the numbers on the following diagram to find the appropriate
descriptions.
13452678
METAR KPIT 201955Z AUTO 22015G25KT 3/4SM R28R/2600FT TSRA OVC010CB
18/16 A2992 RMK SLPO13 T01760158 PK WND 22030/15
910 11
1. Type of Report: METAR (SPECI will be seen here if this is a Special
Weather Report)
2. ICAO Station Identifier: KPIT
This is the location for which the METAR pertains.
3. Date and Time of Issue: 201955Z
The 20th day of the month at 1955Zulu or UTC.
4. AUTO indicates the reporting station is an automated station. If the
reporting station is a manned station this element will be omitted. Also,
if a report from an automated station is modified by a person this element will be omitted. “COR” indicates a corrected report.
5. Wind: 22015G25KT
220 is the 3 digit true direction to the nearest 10°. Airport advisory ser-
vice, ATIS and ATC towers report wind direction as magnetic. “VRB” in
this place indicates variable winds less than or equal to 6 knots. If wind
direction is varying more than 60° with speeds over 6 knots, an entry
similar to “180V260” will be displayed in this place. This example
actually shows wind direction varying by 80°.
15 is the 2 or 3 digit wind speed (in knots).
25 is the 2 or 3 digit wind gust speed in knots (KT) because it follows a G
(Gust).
6. Visibility: 3/4SM R28R/2600FT
3/4 indicates 3/4 statute mile (SM) visibility.
Runway Visual Range (RVR) for R28R (runway 28 right) is 2600 feet
(2600FT). An “M” in this distance number indicates visibility is less than
the lowest reportable sensor value. A “P” indicates visibility is
greater than the highest reportable sensor value.
NOTE: Only reported at those locations with certified RVR reporting capability.
Rev 1 Oct. 2003
1
Page 6

7. Significant Present Weather: TSRA
TS is a two letter designation for thunderstorm. Other possible desig-
nations could be as follows:
BC Patches
BL Blowing
DR Low Drifting
FZ Supercooled/Freezing
MI Shallow
PR Partial
SH Showers
The second two letter designator, RA, indicates moderate rain.
Moderate is indicated by the absence of a “+”, “-” or “VC” preceding the
designation. These preceding designations represent the following:
+ Heavy
- Light
VC In the vicinity
Other possible designations could be as follows:
BR Mist
DS Dust Storm
DU Widespread Dust
DZ Drizzle
FC Funnel Cloud
+FC Tornado/Water Spout
FG Fog
FU Smoke
GR Hail
GS Small Hail/Snow Pellets
HZ Haze
IC Ice Crystals
PE Ice Pellets
PO Dust/Sand Whirls
PY Spray
SA Sand
SG Snow Grains
SN Snow
SQ Squall
SS Sandstorm
UP Unknown Precipitation (Automated Observations)
VA Volcanic Ash
8. Sky Condition: OVC010CB
OVC indicates the sky is overcast. Cloud cover is based on the sky
being divided into eighths or octas. Overcast means the sky is 8 octas
covered. The cloud cover designators are as follows:
SKC Sky Clear
Rev 1 Oct. 2003
2
Page 7

CLR Clear below 12,000 ft. (automated observing systems)
FEW 1-2 Octas
SCT 3-4 Octas
BKN 5-7 Octas
OVC 8 octas
“VV” may also be encountered here indicating an indefinite ceiling. For
example, VV004 would indicate a vertical visibility of 400 feet.
010 indicates clouds are at 1000 feet.
CB denotes cloud type is cumulonimbus. “TCU” is another possible
designator meaning towering cumulus. CI is cirrus.
9. Temperature/Dew Point: 18/16
18 indicated the temperature is 18° Celsius. An “M” preceding the tem-
perature means the temperature is below 0° Celsius.
16 indicated the dew point is 16° Celsius. An “M” preceding the dew
point means the dew point is below 0° Celsius.
10. Altimeter Setting: A2992
A indicates the setting is in inches of mercury.
2992 is the altimeter setting. The first two digits are inches and the
second two are hundredths.
11. Remarks: RMK SLP013 T01760158 PK WND 22030/15
RMK designates the beginning of the remarks. Remarks can contain
anything, but often include the following:
SLP indicates sea level pressure in millibars from selected stations.
013 indicates pressure is 1001.3 millibars.
T01760158. Selected stations may also include a 9 place code indi-
cating temperature and dewpoint to the nearest 1/10 degree. T
denotes temperature. 0 indicates temperature is above 0° Celsius. A
“1” in this position indicates a temperature below 0° Celsius. 176 indicates a temperature of 17.6° Celsius. The next 0 indicates the dew
point is above 0° Celsius. A “1” in this position indicates a dew point
below 0° Celsius. 158 indicates a dewpoint of 15.8° Celsius.
PK WND 22030/15. Selected stations may include peak wind observations which will appear in the remarks element.
PK WND denotes peak wind.
200 indicates wind direction from 200°.
30/15 indicates a maximum instantaneous wind of 30 knots occurred at
15 minutes past the hour.
Rev 1 Oct. 2003
3
Page 8
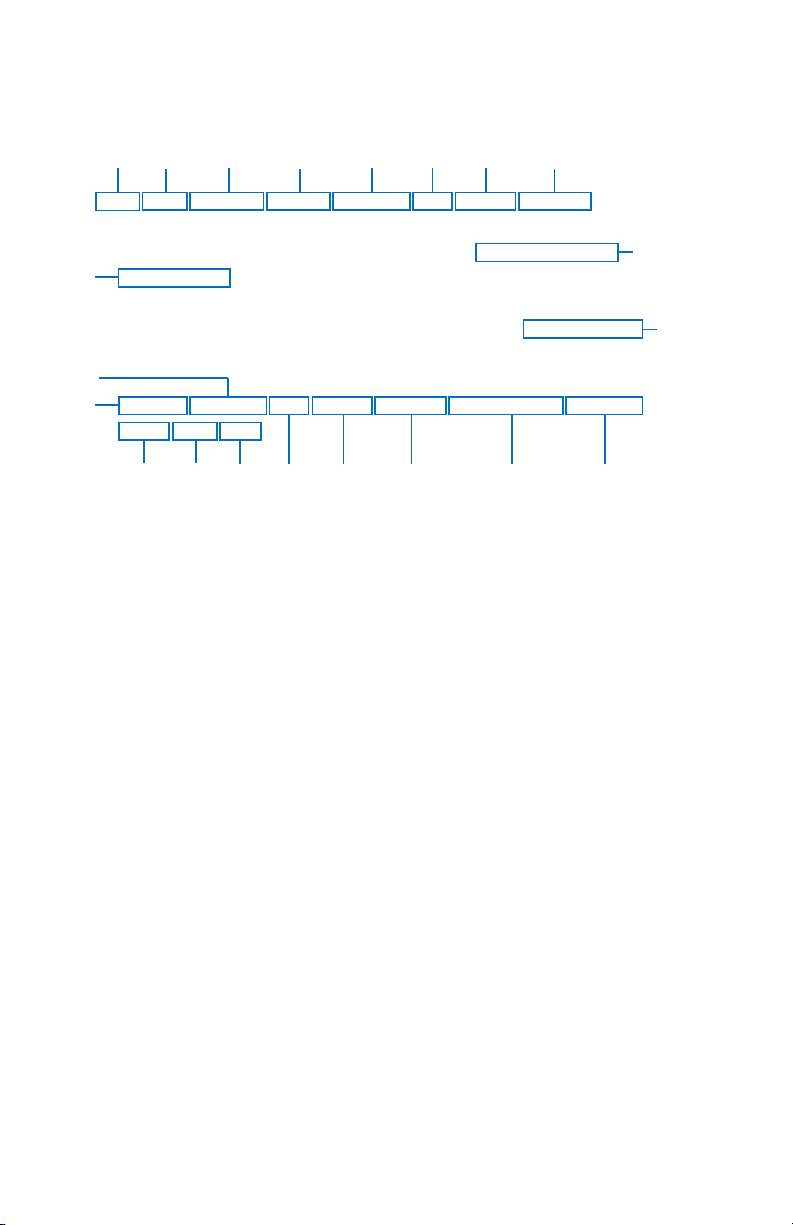
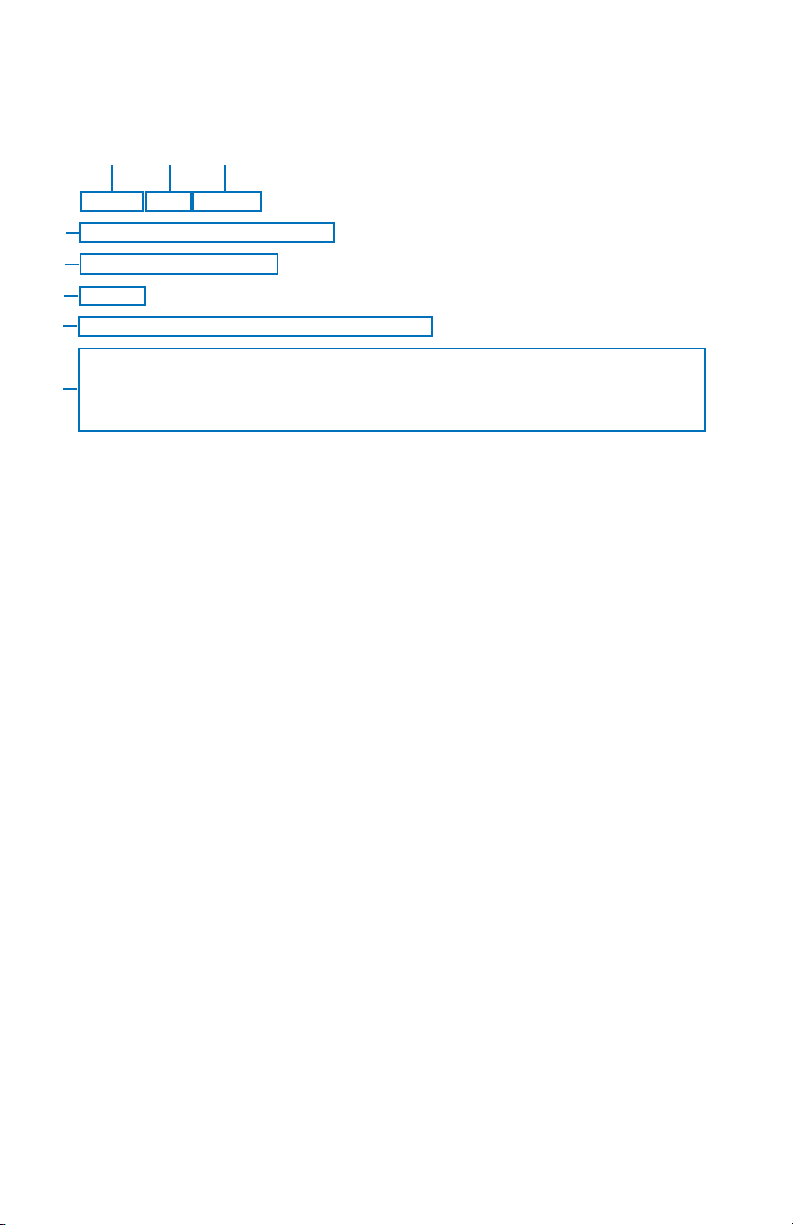
UNDERSTANDING TAFS
Refer to the numbers on the following diagram to find the appropriate
descriptions.
6
1345
2
TAF KPIT 091730Z 091818 22020KT 3SM -SHRA BKN020
7
8
FM2030 30015G25KT 3SM SHRA OVC015 WS015/30045KT
19
TEMPO 2022 1/2SM TSRA OVC008CB
FM0100 27008KT 5SM -SHRA BKN020 OVC040 PROB40 0407
00000KT 1SM -RA BR
10
FM1000 22010KT 5SM -SHRA OVC020 BECMG 1315 20010KT
9
P6SM NSW SKC
11
1514131216 17 18
1. Type of Report: TAF
TAF indicates a Terminal Area Forecast. TAF AMD indicates an
amended forecast.
2. ICAO Station Identifier: KPIT
This is the airport for which the TAF pertains.
3. Date and Time of Issue: 091730Z
The 9th day of the month at 1730Zulu or UTC.
4. Date and Time Valid: 091818
The 9th day of the month, valid for 24 hours from 091800Z to 101800Z.
An amended forecast (TAF AMD) will be valid for only the time interval
remaining, usually less than 24 hours.
5. Forecast Wind: 22020KT
See #5 in the UNDERSTANDING METARs section for details.
6. Forecast Visibility: 3SM
See #6 in the UNDERSTANDING METARs section for details, except
RVR is not included in a TAF
7. Forecast Weather Phenomenon: -SHRA
See #7 in the UNDERSTANDING METARs section for details.
8. Sky Conditions: BKN020
See #8 in the UNDERSTANDING METARs section for details.
9. Beginning of Changed Forecast Conditions: FM1000
20
21
Rev 1 Oct. 2003
4
Page 9

FM denotes “from” and 1000 indicates 1000Z. “From” means a significant change in prevailing conditions is expected. The described conditions follow this element and supercede all previous forecast conditions.
10. Forecast Wind: 22010KT
See #5 in the UNDERSTANDING METARs section for details.
11. Forecast Visibility: 5SM
See #6 in the UNDERSTANDING METARs section for details.
12. Forecast Weather Phenomenon: -SHRA
See #7 in the UNDERSTANDING METARs section for details.
13. Forecast Sky Conditions: OVC020
See #8 in the UNDERSTANDING METARs section for details.
14. Change in Conditions: BECMG 1315
BECMG indicates “becoming” over the time interval between 1300Z
(13) and 1500Z (15). “Becoming” describes a gradual change in forecast conditions. The described conditions follow this element and
supercede previously reported like elements.
15. Wind Becoming: 20010KT
See #5 in the UNDERSTANDING METARs section for details. This
element may be omitted if no change is expected.
16. Visibility Becoming: P6SM
See #6 in the UNDERSTANDING METARs section for details. This
element may be omitted if no change is expected.
17. Weather Phenomenon Becoming: NSW
NSW indicates “No Significant Weather”. See #7 in the UNDER-
STANDING METARs section for details.
18. Sky Conditions Becoming: SKC
See #8 in the UNDERSTANDING METARs section for details. This
element may be omitted if no change is expected.
19. Change in Conditions: TEMPO 2022
TEMPO indicates “temporary” changes expected as described between
2000Z (20)and 2200Z (22). “Temporary” indicates a temporary fluctuation in conditions, usually lasting less than one hour. The described
conditions follow this element.
20. Low Level Windshear: WS015/30045KT
WS indicates “windshear” not associated with convective activity. 015
indicates the windshear is expected at 1500 feet. AGL Wind is
expected from 300° (300) at 45 knots (45KT).
21. Change in Conditions: PROB40 0407
PROB40 indicates a 40% “probability” of described conditions occurring
between 0400Z (04)and 0700Z (07). The described conditions follow
this element.
Rev 1 Oct. 2003
5
Page 10
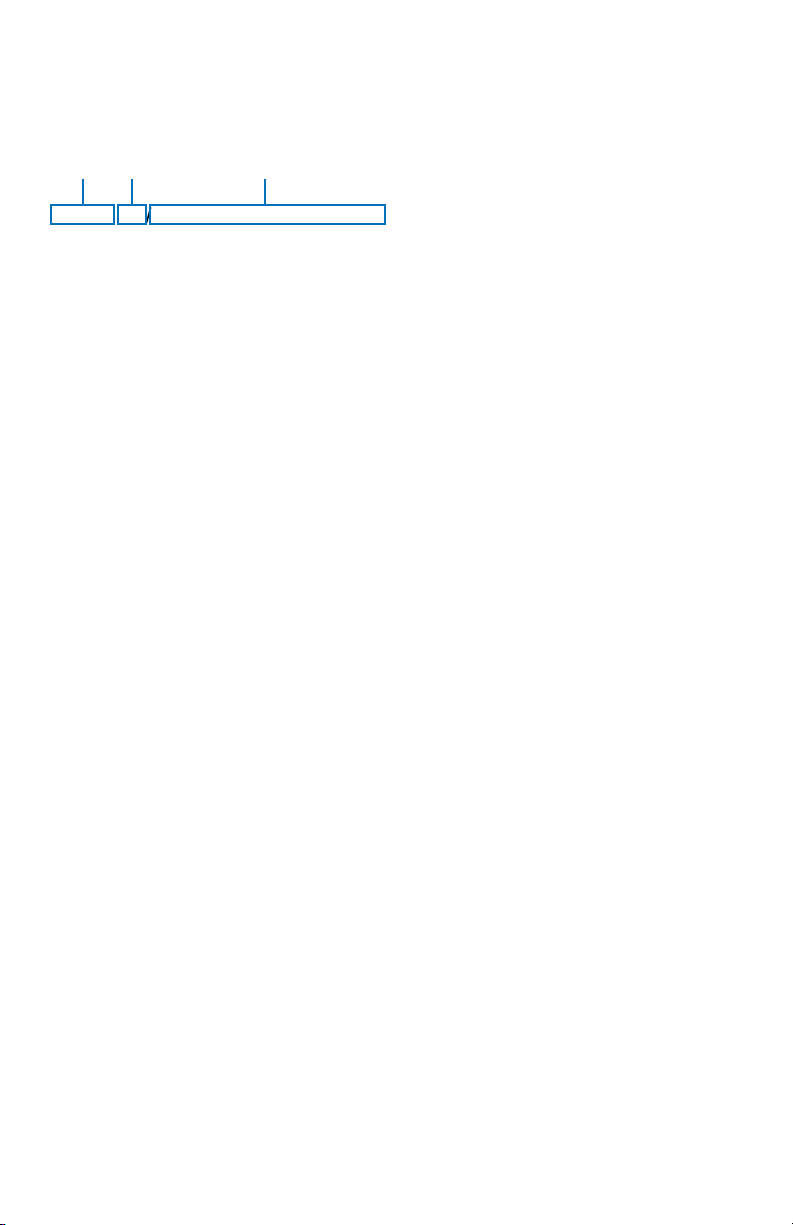
UNDERSTANDING PIREPS
The following is an example of a typical PIREP with an explanation of the
elements.
13
2
KCRW UA/OV KBKW 360015-KCRW/TM 1815/FL120/TP BE99/SK IMC/
WX RA/TA M08/WV 290030/TB LGT-MDT/IC LGT RIME/RM MDT MXD
ICG DURGC KROA NWBND FL080-100 1750Z
1. Station Identifier: KCRW
This is the station identifier of the nearest weather reporting location to
the reported conditions.
2. Report Type: UA
Reports will be routine (UA) or urgent (UUA).
3. Location: OV KBKW 360015-KCRW
OV indicates the report is in relation to a VOR. KBKW is the VOR iden-
tifier, in this case Beckley VOR. 360015-KCRW indicates position as
related to the VOR. In this case, 15 miles out on the 360 degree radial.
KCRW indicates this is a leg to the Charleston, West Virginia VOR.
The next series of elements contain data that is read much like that in
METARs and TAFs. Each element starts with a 2-letter designator which
denotes the type of data with that element. The following defines the element designators:
/TM: Time as Coordinated Universal Time
/FL: Altitude as Flight Level
/TP: Aircraft Type
/SK: Sky Cover (may include cloud height and coverage)
/WX: Weather Phenomenon (can include flight visibility, precipitation
and restrictions to visibility.
/TA: Outside air temperature at altitude in degrees Celsius.
/WV: Wind (direction in degrees magnetic north and speed in knots)
/TB: Turbulence (refer to the Airman’s Information Manual)
CAT - Clear Air Turbulence
CHOP - Choppy Turbulence
OCNL - Occasional
NEG - No Turbulence
ABV - Above
BLO - Below
Rev 1 Oct. 2003
6
Page 11

LGT - Light - Momentarily causes slight, erratic changes in altitude and/or attitude.
MOD - Moderate - Greater intensity changes in altitude and/or
attitude, but aircraft remains in positive control at all times.
Usually causes changes in indicated airspeed.
SEV - Severe - Causes large and abrupt changes to aircraft altitude and/or attitude. Large variations in indicated airspeed and
momentary loss of control.
EXTRM - Extreme - Aircraft is violently tossed about and is nearly
impossible to control. May cause structural damage.
/IC: Icing (refer to the Airman’s Information Manual)
CLR - Clear
MX - Mixed (combination of rime and clear icing)
NEG - No Icing
ABV - Above
BLO - Below
Trace - Ice becomes perceptible. Rate of evaporation is almost
equal to the rate of accumulation. Deicing/anti-icing equipment is
not utilized unless encountered for a period of time greater than 1
hour.
LGT - Light - Rate of accumulation may be a problem if flight is
prolonged for longer than 1 hour without deicing/anti-icing equipment. Deicing/anti-icing removes and/or prevents accumulation.
MOD - Moderate - The rate of accumulation is such that even
short encounters become potentially hazardous. Use of
deicing/anti-icing equipment or diversion is necessary.
SEV - Severe - Flight diversion is necessary. Deicing/anti-icing
equipment is not effective.
/RM: Remarks (for reporting elements not included or to clarify previ-
ously reported items). Remarks can include anything. The
example translates to “moderate (MDT) mixed (MXD) icing during
climb (DURGC) from Roanoke, VA (KROA) northwestbound
(NWBND) between Flight Level 080 and 100 (FL080100) at
1750Z”.
Rev 1 Oct. 2003
7
Page 12
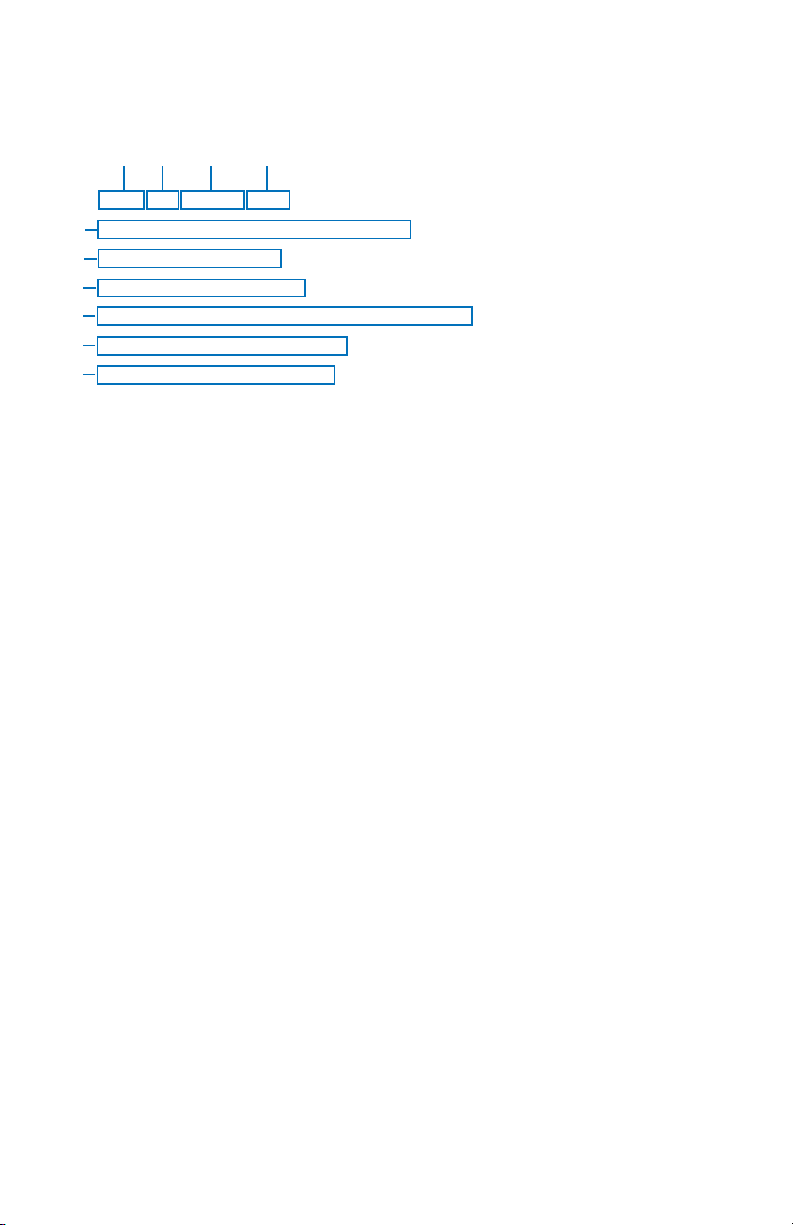
UNDERSTANDING AIRMETS
The following is an example of a typical AIRMET with an explanation of the
elements.
134
2
CHIT WA 151900 AMD
AIRMET TANGO UPDT 2 FOR TURB
5
VALID UNTIL 160100
6
AIRMET TURB...KS MO
7
FROM MCI TO STL TO SGF TO ICT TO MCI
8
9
MOD TURB BLW 100 EXPCD
CONDS IPVG AFT 160000Z
10
1. Forecast Area: CHIT
This is the station identifier of the issuing Weather Service Forecast
Office.
BOS Boston
CHI Chicago
DFW Dallas/Ft. Worth
MIA Miami
SFO San Fransisco
SLC Salt Lake City
The T denotes the reason for the AIRMET. This could be one of the
following:
S Sierra IFR Ceilings less than 1,000 feet and/or visi-
bility less than 3 miles affecting over 50%
of the area at one time or extensive mountain obscuration.
T Tango Turbulence Moderate turbulence, sustained surface
winds of 30 knots or more at the surface
or low level windshear.
Z Zulu Icing Moderate icing and/or freezing levels.
AIRMET items are considered widespread. Widespread is considered
an area of at least 3,000 square miles.
2. Report Type: WA
WA identifies an AIRMET.
3. Date and Time Issued: 151900
15 indicates the 15th day of the month. 1900 indicates UTC.
Rev 1 Oct. 2003
8
Page 13

4. AMD indicates an amended report. Reports can be amended due to
changing weather conditions or issuance/cancelation of a SIGMET.
COR in this field would indicate a corrected AIRMET. RTD indicates a
delayed AIRMET.
5. This line indicates that there is a second (2) update (UPDT) to this
AIRMET issued for turbulence (FOR TURB). More than one meteoro-
logical condition may be addressed as shown in the following:
FOR IFR AND MTN (mountain) OBSCN (obscuration)
FOR ICE AND FRZLVL (freezing level)
FOR STG (strong) SFC (surface) WINDS AND LLWS (low level
wind shear)
6. This updated AIRMET is valid until 0100 UTC on the 16th day (16) of
the month. An AIRMET does not contain an explicit validity start time.
7. This AIRMET forecasts turbulence (TURB) for the states of KS
(Kansas) and MO (Missouri). Geographic areas are also covered such
as CSTL WTRS (coastal waters). Other geographic abbreviations are
used as well (see Appendix A).
8. The affected area is defined by lines FROM MCI (Kansas City) TO STL
(St. Louis) TO SGF (Springfield) TO ICT (Wichita) and back TO MCI.
Areas can be defined by lines between points which are airport or
navaid identifiers.
9. Moderate (MOD) turbulence (TURB) below (BLW) 10,000 feet
expected (EXPCD).
10. Conditions (CONDS) improving (IPVG) after (AFT) the 16th day (16) of
the month 0000 UTC.
If conditions end more than one hour prior to the indicated expiration time,
an amended AIRMET will be issued stating it’s cancellation. If conditions
end within one hour of the indicated expiration time, the AIRMET will be
allowed to expire without cancellation.
Rev 1 Oct. 2003
9
Page 14
UNDERSTANDING SIGMETS
CHIR UWS 041430
SIGMET ROMEO 1 VALID UNTIL 041830
KY TN WV VA OH
FROM CVG TO EKN TO PSK TO VXV TO CVG
OCNL SEV TURB BTN 300 AND 360. RPRTD BY AIRCRAFT.
CONDS CONTG BYD 1830Z.
SLM/GTB
13
4
5
2
6
7
8
The following is an example of a typical SIGMET issued for turbulence with
an explanation of the elements.
1. Forecast Area: CHIR
This is the station identifier of the issuing Weather Service Forecast
Office.
BOS Boston
CHI Chicago
DFW Dallas/Ft. Worth
MIA Miami
SFO San Fransisco
SLC Salt Lake City
The R denotes report ROMEO. A new alphabetic designator is given
each time a SIGMET is issued for a new weather phenomenon. The
order of issuance is as follows:
N NOVEMBER
O OSCAR
P PAPA
Q QUEBEC
R ROMEO
U UNIFORM
V VICTOR
W WHISKEY
X XRAY
Y YANKEE
SIGMETs are issued for:
Severe icing not associated with thunderstorms
Severe or extreme turbulence or clear air turbulence (CAT)
Dust storms or sandstorms lowering visibilities to < 3 miles
Volcanic ash
2. Report Type: UWS
UWS indicates this is the first issuance of report ROMEO. Subsequent
reports for ROMEO would display WS.
Rev 1 Oct. 2003
10
Page 15

3. Date and Time Issued: 041430.
04 indicates the 4th day of the month. 1430 indicates UTC.
4. This line indicates that SIGMET ROMEO 1 is VALID UNTIL the 4th day
(04) of the month at 1830 UTC.
Each subsequent report issued for this same weather phenomenon
designated ROMEO would increment the number. For example,
ROMEO 2, ROMEO 3 and so on.
5. Area of coverage by state or geographic area. In addition to state
abbreviations, other area abbreviations may be seen here, such as, TX
CSTL WTRS (Texas Coastal Waters).
6. Location of weather phenomenon. Three letter designators for navaids
or airports are used to describe boundaries of coverage. If the weather
phenomenon extends across multiple forecast areas, the location is
described as if no boundaries exist.
7. Details of weather phenomenon. The example is typical of a synopsis
for turbulence:
OCNL (occasional) SEV (severe) TURB (turbulence) BTN (between)
300 (30,000 feet) AND 360 (36,000 feet). RPRTD (reported) BY AIR-
CRAFT. CONDS (conditions) CONTG (continuing) BYD (beyond
1830Z.
More typical examples of descriptors used in other SIGMET weather
phenomenon are as follows:
MOD (moderate) TO
STG (strong) UDDFS (updrafts and downdrafts)
UPDFTS (updrafts)
DWNDFTS (downdrafts)
INVOF (in vicinity of) MTNS (mountains)
BLO (below) 360
BTWN (between) FRZLVL (freezing level) AND 360
ABV (above) 360
RPRTD (reported) BY ACFT(aircraft) IN VCNTY (vicinity)
RPRTD BY SVRL (several) ACFT
8. Issuers initials.
If conditions end more than one half hour prior to the indicated expiration
time, and the report does not state that conditions will continue, a cancellation will be issued with CNCL SIGMET as the report designator. If conditions are expected to continue, a new SIGMET will be issued. If conditions
end within one half hour of the indicated expiration time, the SIGMET will be
allowed to expire without cancellation.
Rev 1 Oct. 2003
11
Page 16
UNDERSTANDING CONVECTIVE SIGMETS
The following is an example of a typical Convective SIGMET with an explanation of the elements.
13
2
MKCC WST 221855
CONVECTIVE SIGMET 20C
4
V ALID UNTIL 2055Z
5
ND SD
6
FROM 60W MOT-GFK-ABR-90W MOT
7
INTSFYG AREA SVR TSTMS MOVG FROM 2445. TOPS ABV FL450.
8
WIND GUSTS TO 60KT RPRTD. TORNADOES…HAIL TO 2 IN…WIND
GUSTS TO 65KT PSBL ND PTN.
1. Station Identifier: MKCC
MKC is the station identifier of the Aviation Weather Center (AWC) in
Kansas City.
The C denotes the report is for the Central portion of the continental
United States. The choices are as follows:
C Central
E East
W West
Convective SIGMETs are issued for:
Severe weather including: (a)Surface winds ≥ 50 knots,
(b) Surface hail ≥ 3/4 inch in diameter or (c) Tornadoes
Embedded thunderstorms (obscured by haze or other phenomena)
Line of thunderstorms
Thunderstorms ≥ VIP level 4 affecting ≥ 40% of an area ≥ 3000 sq. mi.
2. Report Type: WST
WST indicates this is a convective SIGMET.
3. Date and Time Issued: 221855.
22 indicates the 22nd day of the month. 1855 indicates UTC.
4. This line is the identifying number of the Convective SIGMET.
Numbering begins daily at 0000 UTC. The C denotes the Central portion of the country.
5. This line indicates that CONVECTIVE SIGMET 20C is VALID UNTIL
2055Z time. Expiration time is two hours after issuance, but Convective
Rev 1 Oct. 2003
12
Page 17

SIGMETs are issued hourly and replace the previous hour’s product.
Each subsequent report issued for this same weather phenomenon
would increment the number. For example, 21C, 22C and so on.
6. Area of coverage by state ND (North Dakota) and SD (South Dakota)
or geographic area. In addition to state abbreviations, other area abbreviations may be seen here, such as FL CSTL WTRS (Florida Coastal
Waters).
7. Location of weather phenomenon (may be an area, single cell or line).
Three letter designators for navaids or airports are used to describe
boundaries of coverage.
The starting and ending point are identical for an area of thunderstorms, like this: FROM 90W MOT-GFK-ABR-90W MOT (from 90 nm
west of Minot, ND to Grand Forks, ND to Aberdeen, SD to 90 nm west
of Minot, ND).
A Single Cell
this: 35WMKC
A Line
70NE TXK-50NE LFK (from 90 nm southeast of Springfield, MO to 70
nm northeast of Texarkana, AR to 50 nm northeast of Lufkin, TX).
8. Details of weather phenomenon. Convective SIGMET details are
mostly in plain language with some abbreviations. This example is typical for an area of severe thunderstorms:
INTSFYG (intensifying) AREA (of) SVR TSTMS (severe thunderstorms) MOVG (moving) FROM 2445 (240 degrees at 45 knots). Storm
TOPS ABV (above) FL450 (flight level 4-5-0). WIND GUSTS TO 60KT
(knots) RPRTD (reported). TORNADOES…HAIL TO 2 IN (inches in
diameter)…WIND GUSTS TO 65 KT (knots) PSBL (possible) in the ND
PTN (North Dakota portion).
For a single cell thunderstorm:
ISOLD (isolated) SVR TSTM (severe thunderstorm) D30 (30 nm in
diameter) MOVG (moving) FROM 2520 (250 degrees at 20 knots).
Storm TOPS ABV (above) FL450 (flight level 4-5-0). HAIL TO 2 IN
(inches in diameter) WIND GUSTS TO 65 KT (knots) PSBL (possible).
For a line of thunderstorms 25 nm wide:
LINE (line of) SVR TSTMS (severe thunderstorms) 25 MI WIDE MOVG
(moving) FROM 2745 (270 degrees at 45 knots). Storm TOPS ABV
(above) FL450 (flight level 4-5-0). WIND GUSTS TO 60KT (knots)
RPRTD (reported). TORNADOES…HAIL TO 2 IN (inches in
diameter)…WIND GUSTS TO 65 KT (knots) PSBL (possible).
thunderstorm 35 nm west of Kansas City would look like
of severe thunderstorms would look like this: FROM 90SE SGF-
Rev 1 Oct. 2003
13
Page 18

UNDERSTANDING ALERT WEATHER WATCHES (AWW)
The following is an example of a typical Alert Weather Watch with an explanation of the elements.
13
2
5
SPC AWW 162236
WW 1162 SEVERE TSTM MS AL FL AND ADJ CSTL WTRS
4
162300Z - 170400Z
6
AXIS..75 STATUTE MILES NORTH AND SOUTH OF LINE..
7
45SW MOB/MOBILE AL/ - 30SSE DHN/DOTHAN AL/
8
..AVIATION COORDS.. 65NM N/S /37SW MOB - 51WNW TLH/
HAIL SURFACE AND ALOFT..1 1/4 INCHES. WIND GUSTS..60
9
KNOTS. MAX TOPS TO 400. MEAN WIND VECTOR 23035.
1. Station Identifier: SPC
SPC is the station identifier for the Storm Prediction Center in Norman,
Oklahoma.
AWWs are issued for:
Tornado
Damaging winds or winds > 58 knots
Hail ≥ 3/4 inch in diameter.
2. Report Type: AWW
AWW indicates this is an Alert Weather Watch.
3. Date and Time Issued: 162236.
16 indicates the 16th day of the month. 2236 indicates UTC.
4. WW 1162 is the identifying number of the Alert Weather Watch.
Numbering begins yearly at 0000.
5. This line indicates the type of weather and the affected areas. SEVERE
TSTM (severe thunderstorm) for MS (Mississippi) AL (Alabama) FL
(Florida) AND ADJ CSTL WTRS (adjacent coastal waters).
6. This line indicates that the watch is valid from 162300Z - 170400Z (the
16th at 2300 Zulu to the 17th at 0400 Zulu).
Rev 1 Oct. 2003
14
Page 19

7. Coordinates of the watch box area. Draw a line 75 STATUTE MILES
NORTH AND SOUTH OF A LINE.. The endpoints of the line are
45SSW MOB/MOBILE AL/-30SSE DHN/DOTHAN AL/ (45 miles
south-southwest of Mobile, Alabama and 30 miles south-southeast of
Dothan, Alabama). Connect the lines to form the box. Sometimes it
might be defined as EAST AND WEST OF A LINE.. or EITHER SIDE
OF A LINE..
8. Aviation coordinates of the watch box area. Draw a line 65NM N/S / (65
nautical miles north and south) of a line). The endpoints of the line are
37SW MOB - 51WNW TLH/ (37 nautical miles southwest of Mobile,
Alabama and 51 nautical miles west-northwest of Tallahassee, Florida).
Connect the lines to form the box.
9. Details of the forecast weather. AWW details are mostly in plain lan-
guage with some abbreviations. This is an example of a typical product.
HAIL SURFACE AND ALOFT..1 1/4 INCHES (hail diameter potential
of one and one quarter inches) WIND GUSTS..60 KNOTS (wind gust
potential of 60 knots) MAX TOPS TO 400 (maximum tops of the storms
is 40,000 feet). MEAN WIND VECTOR 23035 (motion of storm is 230
degrees at 35 knots).
Rev 1 Oct. 2003
15
Page 20

This page intentionally left blank
Rev 1 Oct. 2003
16
Page 21

APPENDIX A
COMMON WEATHER ABBREVIA TIONS
ABNDT Abundant
ABNML Abnormal
ABT About
ABV Above
AC Convective outlook
or altocumulus
ACC Altocumulus castel-
lanus clouds
ACCAS Altocumulus castel-
lanus clouds
ACFT MSHP Aircraft Mishap
ACCUM Accumulate
ACFT Aircraft
ACLT Accelerate
ACLTD Accelerated
ACLTG Accelerating
ACLTS Accelerates
ACPY Accompany
ACRS Across
ACSL Altocumulus
standing lenticular
ACTV Active
ACTVTY Activity
ACYC Anticyclone
ADJ Adjacent
ADL Additional
ADQT Adequate
ADQTLY Adequately
ADRNDCK Adirondack
ADVCT Advect
ADVCTD Advected
ADVCTG Advecting
ADVCTN Advection
ADVCTS Advects
ADVN Advance
ADVNG Advancing
ADVY Advisory
ADVYS Advisories
AFCT Affect
AFCTD Affected
AFCTG Affecting
AFDK After dark
AFOS Automated Field
Operations System
AFSS Automated Flight
Service Station
AFT After
AFTN Afternoon
AGL Above ground level
AGN Again
AGRD Agreed
AGRS Agrees
AGRMT Agreement
AHD Ahead
AIRMET Airman’s Meteoro-
logical Information
AK Alaska
AL Alabama
ALF Aloft
ALG Along
ALGHNY Allegheny
ALP Airport Location
Point
ALQDS All quadrants
ALSTG Altimeter setting
ALT Altitude
ALTA Alberta
ALTHO Although
ALTM Altimeter
ALUTN Aleutian
AMD Amend
AMDD Amended
AMDG Amending
AMDT Amendment
AMP Amplify
AMPG Amplifying
AMPLTD Amplitude
AMS Air mass
Rev 1 Oct. 2003
A-1
Appendix A
Page 22

AMT Amount
ANLYS Analysis
ANS Answer
AO1 Automated
Reporting Station
AO2 Automated
Reporting Station
AOA At or above
AOB At or below
AP Anomalous
Propagation
APCH Approach
APCHG Approaching
APCHS Approaches
APLCN Appalachian
APLCNS Appalachians
APPR Appear
APPRG Appearing
APPRS Appears
APRNT Apparent
APRNTLY Apparently
APRX Approximate
APRXLY Approximately
AR Arkansas
ARL Air Resources Lab
ARND Around
ARPT Airport
ASAP As soon as possible
ASL Above Sea Level
ASMD As Amended
ASOS Automated Surface
Observing System
ASSOCD Associated
ASSOCN Association
ATCT Air Traffic Control
Tower
ATLC Atlantic
ATTM At this time
ATTN Attention
AUTO Automated report
AVBL Available
AVG Average
AVN Aviation model
AWC Aviation Weather
Center
AWIPS Advanced Interactive
Weather Processing
System
AWOS Automated Weather
Observing system
AWT Awaiting
AWW Alert Weather Watch
AZ Arizona
AZM Azimuth
B Began
BACLIN Baroclinic
BAJA Baja, California
BATROP Barotropic
BC British Columbia or
patches (descriptor
used with FG)
BCFG Patchy fog
BCH Beach
BCKG Backing
BCM Become
BCMG Becoming
BCMS Becomes
BD Blowing dust
BDA Bermuda
BDRY Boundary
BECMG Becoming
BFDK Before dark
BFR Before
BGN Begin
BGNG Beginning
BGNS Begins
BHND Behind
BINOVC Breaks in overcast
BKN Broken
BL Blowing
BLD Build
BLDG Building
BLDS Builds
BLDUP Buildup
BLKHLS Black Hills
BLKT Blanket
Rev 1 Oct. 2003
A-2
Appendix A
Page 23

BLKTG Blanketing
BLKTS Blankets
BLO Below or below
clouds
BLW Below
BLZD Blizzard
BN Blowing sand
BND Bound
BNDRY Boundary
BNDRYS Boundaries
BNTH Beneath
BOOTHEEL Bootheel
BR Branch or mist
(METAR, used only
for visibility between
5/8 and 6 miles)
BRF Brief
BRG Branching
BRK Break
BRKG Breaking
BRKHIC Breaks in higher
clouds
BRKS Breaks
BRKSHR Berkshire
BRKSHRS Berkshires
BRM Barometer
BRN Bulk Richardson
Number
BRS Branches
BS Blowing snow
BTWN Between
BWER Bounded weak
echo region
BYD Beyond
C Celsius
CA California or cloud-
to-air lightning in
PIREPs
CAA Cold air advection
CAPE Convective available
potential energy
CARIB Caribbean
CAS Committee for
Aviation Services
CASCDS Cascades
CAT Clear air turbulence
CAVOK Ceiling and visibility
OK
CAVU Ceiling and visibility
unlimited
CB Cumulonimbus
CBMAM Cumulonimbus
Mammatus clouds
CC Cirrocumulus
CCCC Generic WMO format
code group for a
four-letter location
identifier
CCL Convective conden-
sation level
CCLDS Clear of clouds
CCLKWS Counterclockwise
CCSL Cirrocumulus
standing lenticular
CCx Code used in the
WMO abbreviated
heading to indicate
a corrected forecast,
where x is the letter
A through X
CDFNT Cold front
CDFNTL Cold frontal
CFP Cold front passage
CG Cloud to ground
(lightning)
CHC Chance
CHCS Chances
CHG Change
CHGD Changed
CHGG Changing
CHGS Changes
CHI Cloud-Height
indicator
CHINO Sky condition at
secondary location
not available
CHOP Turbulence type
characterized by
rapid, rhythmic jolts
CHSPK Chesapeake
CI Cirrus
Rev 1 Oct. 2003
A-3
Appendix A
Page 24

CIG Ceiling
CIGS Ceilings
CIN Convective inhibition
CLD Cloud
CLDNS Cloudiness
CLDS Clouds
CLKWS Clockwise
CLR Clear
CLRG Clearing
CLRS Clears
CMPLX Complex
CNCL Cancel
CNCLD Canceled
CNCLG Canceling
CNCLS Cancels
CNDN Canadian
CNTR Center
CNTRD Centered
CNTRLN Centerline
CNTRS Centers
CNTRL Central
CNTY County
CNTYS Counties
CNVG Converge
CNVGG Converging
CNVGNC Convergence
CNVTN Convection
CNVTV Convective
CNVTVLY Convectively
CONFDC Confidence
CO Colorado
COMPAR Compare
COMPARG Comparing
COMPARD Compared
COMPARS Compares
COMPR Compare
COMPRG Comparing
COMPRD Compared
COMPRS Compares
COND Condition
CONS Continuous
CONT Continue
CONTD Continued
CONTLY Continually
CONTG Continuing
CONTRAILS Condensation trails
CONTS Continues
CONTDVD Continental Divide
CONUS Continental U.S.
COORD Coordinate
COR Correction
CPBL Capable
CPC Climate Prediction
Center
CRC Circle
CRCLC Circulate
CRCLN Circulation
CRLC Circulate
CRLN Circulation
CRNR Corner
CRNRS Corners
CRS Course
CS Cirrostratus
CSDR Consider
CSDRBL Considerable
CST Coast
CSTL Coastal
CT Connecticut
CTC Contact
CTGY Category
CTSKLS Catskills
CU Cumulus
CUFRA Cumulus fractus
CVR Cover
CVRD Covered
CVRG Covering
CVRS Covers
CWSU Center Weather
Service Units
CYC Cyclonic
CYCLGN Cyclogenesis
DABRK Daybreak
DALGT Daylight
Rev 1 Oct. 2003
A-4
Appendix A
Page 25

DBL Double
DC District of Columbia
DCR Decrease
DCRD Decreased
DCRG Decreasing
DCRGLY Decreasingly
DCRS Decreases
DE Delaware
DEG Degree
DEGS Degrees
DELMARVA Delaware-Maryland-
Virginia
DFCLT Difficult
DFCLTY Difficulty
DFNT Definite
DFNTLY Definitely
DFRS Differs
DFUS Diffuse
DGNL Diagonal
DGNLLY Diagonally
DIGG Digging
DIR Direction
DISC Discontinue
DISCD Discontinued
DISCG Discontinuing
DISRE Disregard
DISRED Disregarded
DISREG Disregarding
DKTS Dakotas
DLA Delay
DLAD Delayed
DLT Delete
DLTD Deleted
DLTG Deleting
DLY Daily
DMG Damage
DMGD Damaged
DMGG Damaging
DMNT Dominant
DMSH Diminish
DMSHD Diminished
DMSHG Diminishing
DMSHS Diminishes
DNDFTS Downdrafts
DNS Dense
DNSLP Downslope
DNSTRM Downstream
DNWND Downwind
DP Deep
DPND Deepened
DPNG Deepening
DPNS Deepens
DPR Deeper
DPTH Depth
DR Low Drifting
(descriptor used
with DU, SA or SN
DRDU Drifting dust
DRFT Drift
DRFTD Drifted
DRFTG Drifting
DRFTS Drifts
DRSA Low drifting sand
DRSN Low drifting snow
DRZL Drizzle
DS Duststorm
DSCNT Descent
DSIPT Dissipate
DSIPTD Dissipated
DSIPTG Dissipating
DSIPTN Dissipation
DSIPTS Dissipates
DSND Descend
DSNDG Descending
DSNDS Descends
DSNT Distant
DSTBLZ Destabilize
DSTBLZD Destabilized
DSTBLZG Destabilizing
DSTBLZS Destabilizes
DSTBLZN Destabilization
DSTC Distance
DTRT Deteriorate
Rev 1 Oct. 2003
A-5
Appendix A
Page 26

DTRTD Deteriorated
DTRTG Deteriorating
DTRTS Deteriorates
DU Widespread dust
storm
DURC During climb
DURD During descent
DURG During
DURGC During climb
DURGD During descent
DURN Duration
DVLP Develop
DVLPD Developed
DVLPG Developing
DVLPMT Development
DVLPS Develops
DVRG Diverge
DVRGG Diverging
DVRGNC Divergence
DVRGS Diverges
DVV Downward vertical
velocity
DWNDFTS Downdrafts
DWPNT Dew point
DWPNTS Dew points
DX Duplex
DZ Drizzle (METAR)
E East
EBND Eastbound
EFCT Effect
ELNGT Elongate
ELNGTD Elongated
ELSW Elsewhere
EMBD Embedded
EMBDD Embedded
EMERG Emergency
ENCTR Encounter
ENDG Ending
ENE East-northeast
ENELY East-northeasterly
ENERN East-northeastern
ENEWD East-northeastward
ENHNC Enhance
ENHNCD Enhanced
ENHNCG Enhancing
ENHNCS Enhances
ENHNCMNT Enhancement
ENRT Enroute
ENTR Entire
ERN Eastern
ERY Early
ERYR Earlier
ESE East-southeast
ESELY East-southeasterly
ESERN East-southeastern
ESEWD East-southeastward
ESNTL Essential
ESTAB Establish
EST Estimate
ESTS Estimates
ETA Estimated time of
arrival or ETA
model
ETC Et cetera
ETIM Elapsed time
EVE Evening
EWD Eastward
EXCLV Exclusive
EXCLVLY Exclusively
EXCP Except
EXPC Expect
EXPCD Expected
EXPCG Expecting
EXTD Extend
EXTDD Extended
EXTDG Extending
EXTDS Extends
EXTN Extension
EXTRAP Extrapolate
EXTRAPD Extrapolated
EXTRM Extreme
EXTRMLY Extremely
Rev 1 Oct. 2003
A-6
Appendix A
Page 27

EXTSV Extensive
F Fahrenheit
FA Aviation area fore-
cast
FAH Fahrenheit
FAM Familiar
FC Funnel cloud
(+FC = Tornado or
water spout)
FCST Forecast
FCSTD Forecasted
FCSTG Forecasting
FCSTR Forecaster
FCSTS Forecasts
FEW Few (used to
describe cloud
cover or weather
phenomena, >0
octas to 2 octas
cloud amount)
FG Fog (METAR, only
when visibility is
less than 5/8 mile)
FIBI Filed but impracti-
cable to transmit
FIG Figure
FILG Filling
FIR Flight information
region
FIRAV First available
FIS Flight Information
Service
FIS-B Flight Information
Service - Broadcast
FIRST First observation
after a break in cov-
erage at manual
station
FL Florida or flight level
FLG Falling
FLRY Flurry
FLRYS Flurries
FLT Flight
FLW Follow
FLWG Following
FM From
FMGGgg From the time (UTC)
indicated by GGgg.
Generic WMO format
code group, indicating a significant
and rapid (in less
than 1 hour) change
to a new set of
prevailing conditions
FMT Format
FNCTN Function
FNT Front
FNTL Frontal
FNTS Fronts
FNTGNS Frontogenesis
FNTLYS Frontolysis
FORNN Forenoon
FPM Feet per minute
FQT Frequent
FQTLY Frequently
FRM Form
FRMG Forming
FRMN Formation
FROPA Frontal passage
FROSFC Frontal surface
FRQ Frequent
FRST Frost
FRWF Forecast wind factor
FRZ Freeze
FRZLVL Freezing level
FRZN Frozen
FRZG Freezing
FT Feet or
Terminal Forecast
FTHR Further
FU Smoke
FV Flight visibility
FVRBL Favorable
FWD Forward
FYI For your information
FZ Freezing
FZRANO Freezing rain
sensor not available
G Gust
Rev 1 Oct. 2003
A-7
Appendix A
Page 28

GA Georgia
GEN General
GENLY Generally
GEO Geographic
GEOREF Geographical refer-
ence
GF Fog
GICG Glaze icing
GLFALSK Gulf of Alaska
GLFCAL Gulf of California
GLFMEX Gulf of Mexico
GLFSTLAWR Gulf of St.
Lawrence
GND Ground
GNDFG Ground fog
GOES Geostationary
Operational
Environmental
Satellite
GR Hail (greater than
1/4 inch in diam-
eter)
GRAD Gradient
GRDL Gradual
GRDLY Gradually
GRT Great
GRTLY Greatly
GRTR Greater
GRTST Greatest
GRTLKS Great Lakes
GS Small hail or snow
pellets (smaller than
1/4 inch in diameter)
GSTS Gusts
GSTY Gusty
GTS Global Telecommuni-
cation System
GV Ground visibility
HAZ Hazard
HCVIS High clouds visible
HDFRZ Hard freeze
HDSVLY Hudson Valley
HDWND Head wind
HGT Height
HI High or Hawaii
HIER Higher
HIFOR High level forecast
HLF Half
HLTP Hilltop
HLSTO Hailstones
HLYR Haze layer
HND Hundred
HPC Hydrometeorological
Prediction Center
HR Hour
HRS Hours
HRZN Horizon
HTG Heating
HURCN Hurricane
HUREP Hurricane report
HV Have
HVY Heavy
HVYR Heavier
HVYST Heaviest
HWVR However
HWY Highway
HZ Haze
IA Iowa
IC Ice crystals or ice
ICAO International Civil
Aviation
Organization
ICG Icing
ICGIC Icing in clouds
ICGICIP Icing in clouds and
in precipitation
ICGIP Icing in precipitation
ID Idaho
IFR Instrument flight
rules
IL Illinois
IMC Instrument meteo-
rolgical conditions
IMDT Immediate
IMDTLY Immediately
IMPL Impulse
IMPLS Impulses
Rev 1 Oct. 2003
A-8
Appendix A
Page 29

IMPT Important
INCL Include
INCLD Included
INCLG Including
INCLS Includes
INCR Increase
INCRD Increased
INCRG Increasing
INCRGLY Increasingly
INCRS Increases
INDC Indicate
INDCD Indicated
INDCG Indicating
INDCS Indicates
INDEF Indefinite
INFO Information
INLD Inland
INSTBY Instability
INTCNTL Intercontinental
INTER Intermittent
INTL International
INTMD Intermediate
INTMT Intermittent
INTMTLY Intermittently
INTR Interior
INTRMTRGN Intermountain
region
INTS Intense
INTSFCN Intensification
INTSFY Intensify
INTSFYD Intensified
INTSFYG Intensifying
INTSFYS Intensifies
INTSTY Intensity
INTVL Interval
INVRN Inversion
IOVC In overcast
INVOF In vicinity of
IP Ice pellets
IPV Improve
IPVG Improving
IR Infrared
ISOL Isolate
ISOLD Isolated
JCTN Junction
JTSTR Jet stream
KFRST Killing frost
KLYR Smoke layer aloft
KOCTY Smoke over city
KS Kansas
KT Knots
KY Kentucky
L Left
LA Louisiana
LABRDR Labrador
LAPS Local Analysis and
Prediction System
LAMP Local AWIPS MOS
Program
LAST Last observation
before a break in
coverage at a
manual station
LAT Latitude
LAWRS Limited aviation
weather reporting
station
LCL Local or Lifted
condensation level
LCLY Locally
LCTD Located
LCTN Location
LCTMP Little change in
temperature
LDG Landing
LEVEL Level
LFM Limited fine mesh
model
LFTG Lifting
LGRNG Long-range
LGT Light
LGTR Lighter
LGWV Long wave
LI Lifted Index
Rev 1 Oct. 2003
A-9
Appendix A
Page 30

LIFR Low instrument
flight rules
LIS Lifted Indices
LK Lake
LKS Lakes
LKLY Likely
LLJ Low level jet
LLWAS Low-level wind
shear alert system
LLWS Low-level wind
shear
LMTD Limited
LMTG Limiting
LMTS Limits
LN Line
LNS LInes
LO Low
LONG Longitude
LONGL Longitudinal
LRG Large
LRGLY Largely
LRGR Larger
LRGST Largest
LST Local standard time
LTD Limited
LTG Lightning
LTGCA Lightning cloud-to-
air
LTGCC Lightning cloud-to-
cloud
LTGCG Lightning cloud-to-
ground
LTGCCCG Lightning cloud-to-
cloud cloud-to-
ground
LTGCW Lightning cloud-to-
water
LTGIC Lightning in cloud
LTL Little
LTLCG Little change
LTR Later
LTST Latest
LV Leaving
LVL Level
LVLS Levels
LWR Lower
LWRD Lowered
LWRG Lowering
LYR Layer
LYRD Layered
LYRS Layers
M Minus or Less than
lowest sensor value
MA Massachusetts
MAN Manitoba
MAX Maximum
MB Millibars
MCD Mesoscale discus-
sion
MD Maryland
MDFY Modify
MDFYD Modified
MDFYG Modifying
MDL Model
MDLS Models
MDT Moderate
MDTLY Moderately
ME Maine
MED Medium
MEGG Merging
MESO Mesoscale
MET Meteorological
METAR Aviation Routine
Weather Report
METRO Metropolitan
MEX Mexico
MHKVLY Mohawk Valley
MI Michigan , shallow,
or mile
MID Middle
MIDN Midnight
MIL Military
MIN Minimum
MIFG Shallow fog
MISG Missing
Rev 1 Oct. 2003
A-10
Appendix A
Page 31

MLTLVL Melting level
MN Minnesota
MNLD Mainland
MNLY Mainly
MO Missouri
MOD Moderate
MOGR Moderate or greater
MOS Model Output
Statistics
MOV Move
MOVD Moved
MOVG Moving
MOVMT Movement
MOVS Moves
MPH Miles per hour
MRGL Marginal
MRGLLY Marginally
MRNG Morning
MRTM Maritime
MS Mississippi
MSG Message
MSL Mean sea level
MST Most
MSTLY Mostly
MSTR Moisture
MT Montana
MTN Mountain
MTNS Mountains
MULT Multiple
MULTILVL Multilevel
MVFR Marginal visual
flight rules
MWO Meteorological
Watch Office
MX Mixed (character-
ized as a combina-
tion of clear and
rime ice
MXD Mixed
N North
N/A Not applicable
NAB Not above
NAT North Atlantic
NATL National
NAV Navigation
NAVAID Electronic naviga-
tion aid facility (limited to VOR or
VORTAC for
PIREPs)
NB New Brunswick
NBND Northbound
NBRHD Neighborhood
NC North Carolina
NCDC National Climatic
Data Center
NCEP National Center of
Environmental
Prediction
NCO NCEP Central
Operations
NCWX No change in
weather
ND North Dakota
NE Northeast
NEB Nebraska
NEC Necessary
NEG Negative
NEGLY Negatively
NELY Northeasterly
NERN Northeastern
NEWD Northeastward
NEW ENG New England
NFLD Newfoundland
NGM Nested grid model
NGT Night
NH New Hampshire
NHC National Hurricane
Center
NIL None
NJ New Jersey
NL No layers
NLT Not later than
NLY Northerly
NM New Mexico
NMBR Number
NMBRS Numbers
Rev 1 Oct. 2003
A-11
Appendix A
Page 32

NMC National
Meteorological
Center
NML Normal
NMRS Numerous
NNE North-northeast
NNELY North-northeasterly
NNERN North-northeastern
NNEWD North-northeast-
ward
NNW North-northwest
NNWLY North-northwesterly
NNWRN North-northwestern
NNWWD North-northwest-
ward
NNNN End of message
NOAA National Oceanic
and Atmospheric
Administration
NOPAC Northern Pacific
NOS National Ocean
Service
NOSPECI No SPECI reports
are taken at station
NPRS Nonpersistent
NR Near
NRLY Nearly
NRN Northern
NRW Narrow
NS Nova Scotia
NSC No significant cloud
NSW No significant
weather
NTFY Notify
NTFYD Notified
NV Nevada
NVA Negative vorticity
advection
NW Northwest
NWD Northward
NWLY Northwesterly
NWRN Northwestern
NWS National Weather
Service
NY New York
NXT Next
OAT Outside air temper -
ature
OBND Outbound
OBS Observation
OBSC Obscure
OBSCD Obscured
OBSCG Obscuring
OCFNT Occluded front
OCLD Occlude
OCLDS Occludes
OCLDD Occluded
OCLDG Occluding
OCLN Occlusion
OCNL Occasional
OCNLY Occasionally
OCR Occur
OCRD Occurred
OCRG Occurring
OCRS Occurs
OFC Office
OFCM Office of the
Federal Coordinator
for Meteorology
OFP Occluded frontal
passage
OFSHR Offshore
OH Ohio
OHD Overhead
OK Oklahoma
OMTNS Over mountains
ONSHR On shore
OR Oregon
ORGPHC Orographic
ORIG Original
OSV Ocean station
vessel
OTLK Outlook
OTP On top
OTR Other
OTRW Otherwise
Rev 1 Oct. 2003
A-12
Appendix A
Page 33

OUTFLO Outflow
OV Over
OVC Overcast
OVHD Overhead
OVNGT Overnight
OVR Over
OVRN Overrun
OVRNG Overrunning
OVTK Overtake
OVTKG Overtaking
OVTKS Overtakes
P Higher than greatest
sensor value
P6SM Visibility forecast to
be greater than 6
statute miles
PA Pennsylvania
PAC Pacific
PATWAS Pilot's automatic
telephone weather
answering service
PBL Planetary boundary
layer
PCPN Precipitation
PD Period
PDS Periods
PDMT Predominant
PE Ice pellets
PEN Peninsula
PERM Permanent
PGTSND Puget Sound
PHYS Physical
PIBAL Pilot balloon obser-
vation
PIREP Pilot weather report
PK WND Peak wind
PL Ice pellets
PLNS Plains
PLS Please
PLTO Plateau
PM Postmeridian
PNHDL Panhandle
PNO Precipitation amount
not available
PO Dust/ sand swirls
POS Positive
POSLY Positively
PPINA Radar weather
report not available
PPINE Radar weather
report no echoes
observed
PPSN Present position
PR Partial
PRBL Probable
PRBLY Probably
PRBLTY Probability
PRECD Precede
PRECDD Preceded
PRECDG Preceding
PRECDS Precedes
PRES Pressure
PRESFR Pressure falling
rapidly
PRESRR Pressure rising
rapidly
PRFG Partial fog
PRIM Primary
PRIN Principal
PRIND Present indications
are...
PRJMP Pressure jump
PROB Probability
PROBC C Forecaster’s
assessment of the
probability of occur-
rence of a thunder-
storm or precipita-
tion event, along
with associated
weather elements
(wind, visibility,
and/or sky condi-
tion) whose occur-
rences are directly
related to, and con-
temporaneous with,
the thunderstorm or
precipitation event
Rev 1 Oct. 2003
A-13
Appendix A
Page 34

PROC Procedure
PROD Produce
PRODG Producing
PROG Forecast
PROGD Forecasted
PROGS Forecasts
PRSNT Present
PRSNTLY Presently
PRST Persist
PRSTS Persists
PRSTNC Persistence
PRSTNT Persistent
PRVD Provide
PRVDD Provided
PRVDG Providing
PRVDS Provides
PS Plus
PSBL Possible
PSBLY Possibly
PSBLTY Possibility
PSG Passage
PSN Position
PSND Positioned
PTCHY Patchy
PTLY Partly
PTNL Potential
PTNLY Potentially
PTNS Portions
PUGET Puget Sound
PVA Positive vorticity
advection
PVL Prevail
PVLD Prevailed
PVLG Prevailing
PVLS Prevails
PVLT Prevalent
PWB Pilot weather
briefing
PWINO Precipitation identi-
fier sensor not avail-
able
PWR Power
PY Spray
QN Question
QPFERD NCEP excessive
rainfall discussion
QPFHSD NCEP heavy snow
discussion
QPFSPD NCEP special
precipitation discus-
sion
QSTNRY Quasistationary
QTR Quarter
QUAD Quadrant
QUE Quebec
R Right (with reference
to runway designa-
tion) or rain
RA Rain (METAR)
RADAT Radiosonde addi-
tional data
RAOB Radiosonde obser-
vation
RCA Reach Cruising
Altitude
RCH Reach
RCHD Reached
RCHG Reaching
RCHS Reaches
RCKY Rocky
RCKYS Rockies
RCMD Recommend
RCMDD Recommended
RCMDG Recommending
RCMDS Recommends
RCRD Record
RCRDS Records
RCV Receive
RCVD Received
RCVG Receiving
RCVS Receives
RDC Reduce
RDGG Ridging
RDR Radar
RDVLP Redevelop
RDVLPG Redeveloping
Rev 1 Oct. 2003
A-14
Appendix A
Page 35

RDVLPMT Redevelopment
RE Regard
RECON Reconnaissance
REF Reference
RES Reserve
REPL Replace
REPLD Replaced
REPLG Replacing
REPLS Replaces
REQ Request
REQS Requests
REQSTD Requested
RESP Response
RESTR Restrict
RGD Ragged
RGL Regional model
RGLR Regular
RGN Region
RGNS Regions
RGT Right
RH Relative humidity
RHINO RHI not operative
RI Rhode Island
RIME Type of icing char-
acterized by a rough,
milky, opaque
appearance
RIOGD Rio Grande
RLBL Reliable
RLTV Relative
RLTVLY Relatively
RM Remarks
RMK Remark
RMN Remain
RMND Remained
RMNDR Remainder
RMNG Remaining
RMNS Remains
RNFL Rainfall
RNG Range
ROT Rotate
ROTD Rotated
ROTG Rotating
ROTS Rotates
RPD Rapid
RPDLY Rapidly
RPLC Replace
RPLCD Replaced
RPLCG Replacing
RPLCS Replaces
RPRT Report
RPRTD Reported
RPRTG Reporting
RPRTS Reports
RPT Repeat
RPTG Repeating
RPTS Repeats
RQR Require
RQRD Required
RQRG Requiring
RQRS Requires
RRx Code used in the
WMO abbreviated
heading to indicate
a delayed forecast,
where x is the letter
A through X
RS Receiver station
RSG Rising
RSN Reason
RSNG Reasoning
RSNS Reasons
RSTR Restrict
RSTRD Restricted
RSTRG Restricting
RSTRS Restricts
RTRN Return
RTRND Returned
RTRNG Returning
RTRNS Returns
RUC Rapid Update Cycle
RUF Rough
RUFLY Roughly
RVR Runway Visual
Range
Rev 1 Oct. 2003
A-15
Appendix A
Page 36

RVRNO RVR system not
available
RVS Revise
RVSD Revised
RVSG Revising
RVSS Revises
RW Rain shower
RWY Runway
RY Runway
S South
SA Sand (METAR)
SAB Satellite Analysis
Branch
SAO Surface observation
SASK Saskatchewan
SATFY Satisfactory
SBND Southbound
SBSD Subside
SBSDD Subsided
SBSDNC Subsidence
SBSDS Subsides
SC South Carolina or
stratocumulus
SCND Second
SCNDRY Secondary
SCSL Stratocumulus
standing lenticular
SCT Scatter or Scattered
(describing cloud
cover or weather
phenomena, 3 to 4
octas cloud amount
SCTD Scattered
SCTR Sector
SD South Dakota
SE Southeast
SEC Second
SELY Southeasterly
SEPN Separation
SEQ Sequence
SERN Southeastern
SEV Severe
SEWD Southeastward
SFC Surface
SFERICS Atmospherics
SG Snow grains
SGFNT Significant
SGFNTLY Significantly
SH Showers
SHFT Shift
SHFTD Shifted
SHFTG Shifting
SHFTS Shifts
SHLD Shield
SHLW Shallow
SHRT Short
SHRTLY Shortly
SHRTWV Shortwave
SHUD Should
SHWR Shower
SIERNEV Sierra Nevada
SIG Signature
SIGMET Significant meteoro-
logical information
SIMUL Simultaneous
SK Sky cover
SKC Sky clear
SKED Schedule
SLD Solid
SLGT Slight
SLGTLY Slightly
SLO Slow
SLOLY Slowly
SLOR Slower
SLP Slope or sea level
pressure
SLPG Sloping
SLPNO Sea-level pressure
not available
SLT Sleet
SLW Slow
SLY Southerly
SM Statute mile
SMK Smoke
SML Small
Rev 1 Oct. 2003
A-16
Appendix A
Page 37

SMLR Smaller
SMRY Summary
SMS Sunchronous mete-
orological satellite
SMTH Smooth
SMTHR Smoother
SMTHST Smoothest
SMTM Sometime
SMWHT Somewhat
SN Snow
SNBNK Snowbank
SND Sand
SNFLK Snowflake
SNGL Single
SNOINCR Snow increase
SNOINCRG Snow increasing
SNST Sunset
SNW Snow
SNWFL Snowfall
SOP Standard operating
procedure
SP Snow pellets
SPC Storm Prediction
Center
SPCLY Especially
SPD Speed
SPECI Special observation
SPENES Satellite precip.
estimate statement
SPKL Sprinkle
SPLNS Southern Plains
SPRD Spread
SPRDG Spreading
SPRDS Spreads
SPRL Spiral
SQ Squall
SQAL Squall
SQLN Squall line
SR Sunrise
SRN Southern
SRND Surround
SRNDD Surrounded
SRNDG Surrounding
SRNDS Surrounds
SS Sunset or sand
storm (METAR)
SSE South-southeast
SSELY South-southeasterly
SSERN South-southeastern
SSEWD South-southeastward
SSW South-southwest
SSWLY South-southwesterly
SSWRN South-southwestern
SSWWD South-southwest-
ward
ST Stratus
STAGN Stagnation
STBL Stable
STBLTY Stability
STD Standard
STDY Steady
STFR Stratus fractus
STFRM Stratiform
STG Strong
STGLY Strongly
STGR Stronger
STGST Strongest
STLT Satellite
STM Storm
STMS Storms
STN Station
STNRY Stationary
SUB Substitute
SUBTRPCL Subtropical
SUF Sufficient
SUFLY Sufficiently
SUG Suggest
SUGG Suggesting
SUGS Suggests
SUP Supply
SUPG Supplying
SUPR Superior
SUPSD Supersede
SUPSDG Superseding
Rev 1 Oct. 2003
A-17
Appendix A
Page 38

SUPSDS Supersedes
SVG Serving
SVR Severe
SVRL Several
SW Southwest
SW- Light snow shower
SW+ Heavy snow shower
SWD Southward
SWLG Swelling
SWLY Southwesterly
SWODY1 SPC Severe
Weather Outlook for
Day 1
SWOMCD SPC Mesoscale
discussion
SWRN Southwestern
SWWD Southwestward
SX Stability index
SXN Section
SYNOP Synoptic
SYNS Synopsis
SYS System
T Thunder
TA Temperature
TACAN UHF Tactical Air
Navigation Aid
TAF Terminal Area
Forecast
TB Turbulence
TCNTL Transcontinental
TCU Towering cumulus
TDA Today
TEI Text element indi-
cator
TEMP Temperature
TEMPO Temporary
THD Thunderhead
THDR Thunder
THK Thick
THKNG Thickening
THKNS Thickness
THKR Thicker
THKST Thickest
THN Thin
THNG Thinning
THNR Thinner
THNST Thinnest
THR Threshold
THRFTR Thereafter
THRU Through
THRUT Throughout
THSD Thousand
THTN Threaten
THTND Threatened
THTNG Threatening
THTNS Threatens
TIL Until
TKOF Takeoff
TM Time
TMPRY Temporary
TMPRYLY Temporarily
TMW Tomorrow
TN Tennessee
TNDCY Tendency
TNDCYS Tendencies
TNGT Tonight
TNTV Tentative
TNTVLY Tentatively
TOC Top of Climb
TOP Top of Clouds
TOPS Tops
TOVC Top of overcast
TP Type of aircraft
TPG Topping
TRBL Trouble
TRIB Tributary
TRKG Tracking
TRML Terminal
TRMT Terminate
TRMTD Terminated
TRMTG Terminating
TRMTS Terminates
TRNSP Transport
TRNSPG Transporting
Rev 1 Oct. 2003
A-18
Appendix A
Page 39

TROF Trough
TROFS Troughs
TROP Tropopause
TRPCD Tropical continental
air mass
TRPCL Tropical
TRRN Terrain
TRSN Transition
TRW Thunderstorm
TRW+ Thunderstorm with
heavy rain shower
TS Thunderstorm
(METAR)
TS + Thunderstorm with
heavy snow
TSFR Transfer
TSFRD Transferred
TSFRG Transferring
TSFRS Transfers
TSHWR Thundershower
TSNO Thunderstorm infor-
mation not available
TSNT Transient
TSQLS Thundersquall
TSTM Thunderstorm
TSW Thunderstorm with
snow showers
TSW+ Thunderstorm with
heavy snow showers
TURBC Turbulence
TURBT Turbulent
TWD Toward
TWDS Towards
TWI Twilight
TWR Tower
TWRG Towering
TX Texas
UA Pilot weather reports
UDDF Up- and downdrafts
UN Unable
UNAVBL Unavailable
UNEC Unnecessary
UNKN Unknown
UNL Unlimited
UNRELBL Unreliable
UNRSTD Unrestricted
UNSATFY Unsatisfactory
UNSBL Unseasonable
UNSTBL Unstable
UNSTDY Unsteady
UNSTL Unsettle
UNSTLD Unsettled
UNUSBL Unusable
UP Unknown precipita-
tion (used only by
automated sites
incapable of discrimi-
nation)
UPDFTS Updrafts
UPR Upper
UPSLP Upslope
UPSTRM Upstream
URG Urgent
USBL Usable
UT Utah
UTC Universal Time
Coordinate
UUA Urgent PIREP
Weather Reports
UVV Upward vertical
velocity
UWNDS Upper winds
V Varies
VA Virginia or Volcanic
Ash
VAAC Volcanic Ash
Advisory Center
VAAS Volcanic Ash
Advisory Statement
VAD Velocity azimuth
display
VAL Valley
VARN Variation
VC Vicinity
VCNTY Vicinity
VCOT VFR conditions on
top
Rev 1 Oct. 2003
A-19
Appendix A
Page 40

VCTR Vector
VCTS Thunderstorms in
the vicinity
VDUC VAS Data Utilization
Center (NSSFC)
VFR Visual flight rules
VFY Verify
VFYD Verified
VFYG Verifying
VFYS Verifies
VHF Very High Frequency
VIS Visibility
VSNO Visibility at second-
ary location not avail-
able
VLCTY Velocity
VLCTYS Velocities
VLNT Violent
VLNTLY Violently
VLY Valley
VMC Visual meteorolog-
ical conditions
VOL Volume
VOR VHF
Omnidirectional
Radio Range
VORT Vorticity
VORTAC VOR and TACAN
combination
VR Veer
VRB Variable
VRG Veering
VRBL Variable
VRISL Vancouver Island,BC
VRS Veers
VRT MOTN Vertical motion
VRY Very
VSB Visible
VSBY Visibility
VSBYDR Visibility decreasing
rapidly
VSBYIR Visibility increasing
rapidly
VT Vermont
VV Vertical velocity or
vertical visibility
VWP VAD Wind profiler
W West
WA Washington
WAA Warm air advection
WAFS Word Area Forecast
System
WBND Westbound
WDLY Widely
WDSPRD Widespread
WEA Weather
WFO Weather Forecast
Office
WFSO Weather Forecast
Service Office
WFP Warm front passage
WI Wisconsin
WIBIS Will be issued
WINT Winter
WK Weak
WKDAY Weekday
WKEND Weekend
WKNG Weakening
WKNS Weakens
WKR Weaker
WKST Weakest
WKN Weaken
WL Will
WLY Westerly
WMO World Meteorological
Organization
WND Wind
WNDS Winds
WNW West-northwest
WNWLY West-northwesterly
WNWRN West-northwestern
WNWWD West-northwest-
ward
WO Without
WPLTO Western Plateau
WRM Warm
WRMG Warming
Rev 1 Oct. 2003
A-20
Appendix A
Page 41

WRMR Warmer
WRMST Warmest
WRMFNT Warm front
WRMFNTL Warm frontal
WRN Western
WRNG Warning
WRS Worse
WS Wind shear
WSHFT Windshift
WSFO Weather Service
Forecast Office
WSO Weather service
office
WSR-88D NWS Doppler
Radar
WSTCH Wasatch Range
WSW West-southwest
WSWLY West-southwesterly
WSWRN West-southwestern
WSWWD West-southwest-
ward
WTR Water
WTSPT Waterspout
WUD Would
WV West Virginia or wind
WVS Waves
WW Severe weather
watch
WWAMKC SPC status report
WWD Westward
WWS Severe weather
watches
WX Weather
WY Wyoming
XCP Except
XPC Expect
XPCD Expected
XPCG Expecting
XPCS Expects
XPLOS Explosive
XTND Extend
XTNDD Extended
XTNDG Extending
XTRM Extreme
XTRMLY Extremely
YDA Yesterday
YKN Yukon
YLSTN Yellowstone
Z Zulu time
ZL Freezing drizzle
ZN Zone
ZNS Zones
ZR Freezing rain
Rev 1 Oct. 2003
A-21
Appendix A
Page 42

This page intentionally left blank
Rev 1 Oct. 2003
A-22
Appendix A
Page 43

APPENDIX B
INFLIGHT ADVISORY LOCATOR CHARTS
Rev 1 Oct. 2003
East Sector Identifier Map
B-1
Appendix B
Page 44

East Sector Location Identifiers
Rev 1 Oct. 2003
B-2
Appendix B
Page 45

Central Sector Identifier Map
Rev 1 Oct. 2003
B-3
Appendix B
Page 46

Central Sector Location Identifiers
Rev 1 Oct. 2003
B-4
Appendix B
Page 47

West Sector Identifier Map
Rev 1 Oct. 2003
B-5
Appendix B
Page 48

West Sector Location Identifiers
Rev 1 Oct. 2003
B-6
Appendix B
Page 49

Aviation Area Forecasts FA Locations for AIRMETs/SIGMETs
Rev 1 Oct. 2003
B-7
Appendix B
Page 50

This page intentionally left blank
Rev 1 Oct. 2003
B-8
Appendix B
Page 51

Honeywell International Inc.
One Technology Center
23500 West 105th Street
Olathe, Kansas 66061
FAX 913-791-1302
Telephone: (913) 712-0400
Copyright ©2001, 2003 Honeywell International Inc.
All rights reserved.
006-18274-0000
Rev. 1 10/03
N
 Loading...