

Page 1

User’s Guide
Agilent Technologies 14761A
Harmonic and Flicker Emissions Tests
for
EN 61000-3-2, EN 61000-3-3,
and EN 60555 Part 2
Agilent Part No. 5962-0831
Microfiche Number 5962-0832
Printed in USA May, 2000
Page 2

Notice
This document contains proprietary information protected by copyright. All rights are reserved. No part of this
document may be photocopied, reproduced, or translated into another language without the prior consent of Agilent
Technologies. The information contained in this document is subject to change without notice.
Copyright 1995 -1998, 2000 Agilent Technologies, Inc.
Windows is a registered trademark of Microsoft Corporation.
Warranty
This Agilent Technologies software product is warranted against defects in materials and workmanship for a period
of 90 days from date of delivery. During the warranty period, Agilent Technologies will, at its option either repair or
replace parts which prove to be defective.
Agilent Technologies makes no express or implied warranty of any kind, including, but not limited to the implied
warranties of merchantability or fitness for a particular purpose, with regard to the program material contained
herein. Agilent Technologies shall not be liable for incidental or co nsequential damages in connection with or arising
out of the furnishing, performance, or use of this software.
Use of the supplied manual and software is restricted to Agilent ac source products only. The software is copyrighted
and may not be copied except for archival purposes, to replace a defective copy, or for program error verification.
Agilent Technologies warrants that this software designed for use with a personal computer, will execute its
programming instructions when properly installed on that personal computer. Agilent Technologies does not warrant
that the operation of the personal computer , software, or ac source will be uninterrupted or error free.
Limitation of Warranty
The foregoing warra nty shall not apply to defects resulting from: misuse, unauthorized modifica tion, operation or
storage outside the environmental specifications for the product, in-transit damage, improper maintenance, or defects
resulting from use of non-Agilent software, accessories, media, or such items not designed for use with the product.
Revisions
Revision codes on the Agilent 14761A HFTS software indicate the current revision. Minor changes to the software
such as bug fixes usually do not require a change to the manual. Therefore, the revision number of the software may
be higher than the software revision number shown below, yet the information in the manual still applies.
Software changes that require a change to the manual will be accompanied either by a new edition of the manual or
an update packet documenting the changes. In that case, the software revision number shown below will be updated
to agree with the revision number of the software.
This manual applies to software revision... A.05.03
Printing History
The manual printing date indicates the current edition. The printing date changes with each new edition or update.
Update packets or change sheets may be issued between editions to correct or add information. Minor corrections
incorporated at reprint do not cause a new edition.
August, 1995.........First Edition
October, 1995........Update 1
February, 1997.......Second Edition
June, 1997..............Third Edition
December, 1998......Fourth Edition
May, 2000...............Fifth Edition
2
Page 3

Table of Contents
Notice 2
Warranty 2
Limitation of Warranty 2
Revisions 2
Printing History 2
Table of Contents 3
1 INTRODUCTION 7
How to Use this Manual 7
The Agilent 6800-Series AC Power Source/Analyzer 8
The Agilent 14761A Harmonic/Flicker Test System Software 8
EN 61000-3-2 and EN 60555 Part 2 Regulations 9
Compliance Testing Implementation 9
EN 61000-3-3 Regulation 10
Compliance Testing Implementation 10
2 INSTALLATION 11
Install the Software 11
Connect the Equipment 11
Installing Interface Card Drivers for Windows 3.1 or 3.11 Systems 12
Installing Interface Card Drivers for Windows 95 Systems 12
Installing Interface Card Drivers for Windows NT 4.0 Systems 12
Verify the Configuration 12
Default Settings 14
Getting Around in the Application 14
Drop-down Menu 14
Menu Tabs 16
3 SETTING UP THE TEST 17
Select a Test Type 17
Create a Template 19
Select the Test Setup Options for Quasi-stationary or Fluctuating Harmonics 20
Standard Test Options 20
Advanced Test Options 21
Test Termination Options 23
Select the Test Options for Voltage Fluctuations 24
Standard Test Options 24
Advanced Test Options 25
Test Termination Options 26
4 RUNNING THE TEST 27
To Run a Pre-test for Quasi-stationary or Fluctuating Harmonics 27
Pre-Te st Summary 27
Pre-Test Power Statistics 29
Pre-Test Source Harmonics 30
To Run a Pre-test for Voltage Fluctuations 31
Pre-Te st Summary 31
Pre-test Measurements 32
To Run a Test 33
Test Status Information 35
Validation Mode 36
3
Page 4

5 VIEWING TEST DATA 37
Navigator Toolbar 37
Viewing Quasi-stationary and Fluctuating Harmonics 38
Graph Display 38
Table Display 41
Time-Series Display 42
Statistics Display 45
Probability Display (for Quasi-stationary or Fluctuating harmonics) 46
Viewing 2.5 Minute Window Failures 47
Viewing Voltage Fluctuations 49
Pst Display 49
Probability Display (for Voltage Fluctuations and Flicker) 50
Distribution Display 52
RMS Display 53
Flicker Display 54
Editing the Graph Attributes 56
Copying Graphs and Tables to the Clipboard 57
Using the Print Screen keyboard key 57
Using the Copy Commands 57
Viewing Reports 58
Causes for Non-compliant EN 61000-3-2 or EN 60555-2 Tests 58
Causes for Non-compliant EN 61000-3-3 Tests 58
Short Form Report 59
Long Form Report 60
Remarks Report 63
6 SEARCHING FOR SPECIFIC TEST DATA 65
Searching for Data While the Test is Running 65
Searching for Data After the Test has Completed 65
Using the Span Control 66
Using the Zoom Control 67
Obtaining Detailed Failure and Error Information 68
7 PRINTING 69
Printing Graphs and Tables 69
Using the Print Pre-test command 69
Using the Print Graph/Table command 69
Printing Reports 69
From the File menu 69
From the Report window 70
Printing Reports to a File 70
A SPECIFICATIONS 73
Supported or Referenced EN 61000-3-2 and EN 60555 Part 2 Standards 73
Supported or Referenced EN 61000-3-3 Standards 73
PC Requirements 73
Supported GPIB Interfaces 73
Supported Equipment 73
Equipment Specifications (IEC Mode) 74
B GLOSSARY 77
4
Page 5

C IEC MODE COMMAND SUMMARY 81
Introduction 81
Using the SENSe:CURRent:ACDC:RANGe command 81
CALCulate:INTegral:TIME 83
CALCulate:SMOothing 83
CALCulate:LIMit:UPPer 84
FORMat 85
FORMat:BORDer 86
MEASure:ARRay:CURRent:HARMonic? 87
MEASure:ARRay:VOLTage:FLUCtuations:ALL? 88
MEASure:ARRay:VOLTage:FLUCtuations:FLICker? 90
MEASure:ARRay:VOLTage:FLUCtuations:PST? 91
SENSe:CURRent:PREFerence 92
SENSe:WINDow 92
SYSTem:CONFigure 93
D CLASS DETERMINATION 95
Class A Device Selected 96
Class B Device Selected 97
Class C Device Selected 98
Class D Device Selected 99
EN 60555 Part 2 Regulation Selected 100
INDEX 101
5
Page 6

Page 7

1
Introduction
How to Use this Manual
This manual describes the operation of the Agilent 14761A Harmonic/Flicker Test System (HFTS)
software when used in conjunction with the Agilent 6800-Series AC Power Source/Analyzers. Its
primary function is as a reference manual. If you have a question about a specific screen or how to
perform a certain task, simply turn to the appropriate section of the manual. The manual is organized
according to the procedure that you would follow if you were to run a compliance test. This manual
assumes that you are familiar with the EN 61000-3-2 and EN 61000-3-3 regulations and their
requirements. It also assumes that you are familiar with operating a personal computer in a Microsoft
Windows environment.
The manual is organized as follows:
Chapter 1 provides an overview of the regulations and how compliance testing to these regulations is
implemented with the Agilent 14761A HFTS software.
Chapter 2 describes how to install the software and get it running. It describes some pitfalls to avoid so
that operation of the software will be glitchless and error-free.
Chapter 3 describes what you need to do to before you can run a test. There is certain information that
you need to provide about the Device Under Test as well as setting up the Agilent 6800-Series AC Power
Source/Analyzer.
Chapter 4 explains what happens when the pre-test and the compliance test is run.
Chapter 5 describes how to view the test data both while the test is running and after the test completes.
Chapter 6 describes the software tools available to find and display specific test data.
Chapter 7 explains how to print graphs and test reports.
Appendix A lists the product specifications
Appendix B is a glossary of terms related to the EN 61000-3-2 and EN 61000-3-3 Regulations.
Appendix C is for programmers. It describes the SCPI programming commands that implement the
harmonic/flicker tests.
Appendix D explains the class determination logic of the Agilent 14761A HFTS software, and how this
logic is used to set test limits.
7
Page 8
1 - Introduction
The Agilent 6800-Series AC Power Source/Analyzers
The Agilent 6800-Series AC Power Source/Analyzers are specifically designed for testing products
compliant to the IEC low-frequency emissions regulations for quasi-stationary current harmonics,
fluctuating current harmonics, and voltage fluctuations and flicker. The following models provide up to
full power coverage of the single-phase regulatory requirements:
Model rms Voltage rms Current peak Current VA
Agilent 6812B
Agilent 6841A
Agilent 6813B
Agilent 6842A
Agilent 6843A
230 Vrms (compliance)
300 Vrms (maximum)
230 Vrms (compliance)
300 Vrms (maximum)
230 Vrms (compliance)
300 Vrms (maximum)
3.3 Arms (compliance)
6.5 Arms (maximum)
7.6 Arms (compliance)
13 Arms (maximum)
16 Arms (compliance)
32 Arms (maximum)
40 A 750 VA
80 A 1750 VA
96 A (low range)
48 A (high range)
4800 VA
Each one-box test system contains the capabilities of a stand-alone ac source, power analyzer, flicker
meter, and line impedance network. Unlike multiple-box ac source and measurement configurations, the
power generation and measurement of the Agilent 6800-Series are controlled by a common internal
timebase, and are truly synchronized. This allows precise measurement of harmonics.
In addition to compliance testing, you can also use the Agilent 6800-Series AC Power Source/Analyzers
as standard ac sources. The units have a SYSTem:CONFigure command that that lets you switch
between IEC mode and Normal mode (the default), where the units behave as standard ac sources. When
you run the Agilent 14761A HFTS software, the units automatically switch from Normal to IEC mode.
The Agilent 14761A Harmonic/Flicker Test System Software
The Agilent 14761A Harmonic/Flicker Test System (HFTS) software application supports EN 61000-32,
EN 61000-3-3, and EN 60555 Part 2 compliance testing requirements. The Agilent 14761A HFTS
software provides an intuitive graphical user-interface from which you can:
ñ Set up and run compliance-level tests. The setting up of many IEC details is facilitated through
the use of embedded standards expertise.
ñ Collect real-time test data from the Agilent 6800-Series AC Power Source/Analyzer.
ñ Display and monitor ongoing test results.
ñ Save test results.
ñ Terminate tests based on user-defined criteria.
ñ Analyze failures or marginal results using advanced test, display, and search options.
ñ Evaluate the long-term test results compared to pass/fail criteria.
ñ Print reports and graphs.‘
See Appendix A for a complete list of supported standards and regulations.
Note A selection in the Options/Default menu lets you compliance test to the older
EN 60555 Part 2 (IEC 555-2) regulation. The EN 60555-3 (IEC 555-3) regulation is no
longer a requirement and has officially been replaced by EN 61000-3-3.
8
Page 9

Introduction - 1
EN 61000-3-2 and EN 60555 Part 2 Regulations
EN 61000-3-2 and EN 60555 Part 2 regulate the magnitude of harmonic currents drawn by products
from the ac line. For example, harmonic currents can occur as a result of high peak currents drawn by
switch-mode power supplies. Power companies, particularly in Europe, have led a regulatory initiative to
limit harmonic current generation at the product level because of a variety of undesirable effects on the
mains environment such as: interference with other equipment, overheating of conductors and power
factor correction networks, and power transmission losses. Personal computers, peripherals, and variable
speed motor drives are examples of the types of products addressed by the regulations.
EN 61000-3-2 and EN 60555 Part 2 actually cover two categories of harmonic currents: quasi-stationary
harmonics and fluctuating harmonics. Power supply manufacturers, for example, may be concerned
primarily with the first category while product manufacturers may be concerned with both categories.
Different measurement techniques are used for determining compliance for the two categories, with more
stringent testing requirements applied to testing fluctuating harmonics. In particular, compliance testing
for fluctuating harmonics requires non-stop harmonic analysis over extended periods of time. The EN
61000-3-2 regulation applies to class A, B, C, D, and motor-driven equipment.
The EN 60555 Part 2 regulation only applies to class A and class B equipment. This regulation is
selected in the Options/Defaults menu. See appendix D for information about class determination.
Compliance Testing Implementation
The Agilent 14761A HFTS software compliance tests to EN 61000-3-2 / EN 60555 Part 2 as follows:
ñ It initializes and programs the Agilent 6800-Series AC Power Source/Analyzer.
ñ After the pre-test, the software displays one cycle of voltage and current, which represents the
average of all half-cycle measurements made during the pre-test, with Class D envelope
information superimposed over the waveshapes. Rms voltage, frequency, rms current, peak
current, real power, apparent power, power factor, voltage distortion, current distortion, and
percent in envelope are displayed as well. An additional display indicates if the harmonic-by-
harmonic voltage distortion is either “IN SPEC” or ”OUT OF SPEC” as per the regulations for
source distortion. This is based on the worst-case results obtained during the pre-test.
ñ During the compliance test, the software produces a real-time bar graph that represents either the
absolute magnitudes of 40 harmonics, or the magnitudes of 40 harmonics expressed as a
percentage of the applicable limits. The graph display shows both the maximum measured value
and the value of the present data record. The value of the present data record is continually
updated while the test is running. A time-series graph is available to display test data for a
specific harmonic.
ñ The software also produces a table that displays either the absolute magnitudes of 40 harmonics,
or the magnitudes of 40 harmonics expressed as a percentage of the applicable limits in real-time.
The table shows both the peak data values and the present data values. Note that you can also
display the data of any individual harmonic versus time, either as an absolute magnitude or as a
percentage of the allowable limits.
ñ When testing fluctuating harmonics, the software uses a 2.5 minute sliding window. Within this
window harmonic peaks of up to 150% of the steady-state harmonic limits are allowed, provided
that these samples do not total more than 10% of the total samples (or 15 seconds of time) within
any 2.5 minute observation period. Samples that contribute to a 2.5 minute window failure must
fall between 100% and up to 150% of the steady-state harmonic limits. Values greater than 150%
of the limits are counted as individual failures.
9
Page 10

1 - Introduction
EN 61000-3-3 Regulation
EN 61000-3-3 regulates the magnitude, rate, and time-duration of voltage fluctuations and flicker
caused by products connected to the ac line. Voltage fluctuations are created by time-varying current
drains working against branch circuit impedance that exists in all power distribution networks. Flicker
occurs when an incandescent lamp changes in intensity due to the frequency and amplitude of voltage
fluctuations in the same branch circuit.
Because flicker is annoying, and for certain individuals presents a health hazard, the regulation seeks to
regulate flicker generation to an imperceptible level. A specialized instrument called a flickermeter,
which is built into the Agilent 6800-Series AC Power Source/Analyzer, is used to measure flicker in
terms of human perceptibility. A perceptibility level of 1 represents the threshold of perception for the
average individual.
Note that the EN 60555-3 (IEC 555-3) regulation is no longer a requirement and has officially been
replaced by EN 61000-3-3.
Compliance Testing Implementation
The Agilent 14761A HFTS software compliance tests to EN 61000-3-3 as follows:
ñ It initializes and programs the Agilent 6800-Series AC Power Source/Analyzer.
ñ After the pre-test, the software shows one cycle of voltage and current, which represents the
average of all half-cycle measurements made during the pre-test, with Class D envelope
information superimposed over the waveshapes. Note that the envelope waveshape is provided
for information only, the regulation does not require Equipment Under Test (EUT)
classification. Therefore, no Percent in Envelope information or Volt THD IN SPEC/OUT of
SPEC information is provided. However, information about rms voltage, frequency, rms current,
peak current, real power, apparent power, power factor, voltage distortion, and current distortion
is provided.
ñ When the compliance test is run, the software generates a bar graph which displays the short-
term flicker (Pst) compared to the predetermined test limits at the end of each integration period.
The graph shows the maximum measured value and the present value .
ñ During the compliance test, the software produces a bar graph that displays the selected time
range of rms voltage values. This graph effectively shows the time-series of rms voltage
variations produced by the varying load currents flowing through the reference impedance.
ñ Probability and distribution graphs reflect a statistical view of the raw data used to generate the
Pst graph at the end of each integration period. Note that long term flicker (Plt) data is generated
during post processing after the test has completed . This information is included in the long
form report.
ñ Summary values for maximum rms voltage deviation (Dmax), steady-state voltage change (Dc),
and the time interval during which the voltage deviation exceeds the prescribed limit (Dt), are
displayed at the bottom of each display. These are the maximum values for each parameter
within the presently displayed integration period.
ñ The software also displays the time-series for instantaneous flicker, which can be useful for
diagnosing faults in the equipment under test.
10
Page 11

Installation
Install the Software
NOTE: A README.TXT file is included on the installation disks. It contains product updates or
corrections that are not documented in this manual. Use any text editor to read this file.
The Agilent 14761A HFTS software (p/n 5063-2363) comes on two disks. When installed, it requires 5
Mbytes of hard disk space, 8 Mbytes of RAM, and 512 Kbytes of conventional memory. It also requires
the correct interface card drivers to be installed on your PC. See “Installing Interface Card Drivers”.
1. Place Disk #1 in the A drive of your computer.
2. In the Windows Program Manager, run A:\SETUP
3. Follow the directions on your screen. During the installation procedure, you will be asked to
specify an installation directory on your hard disk (the default is C:\HFTS5).
4. You will also be asked to select default voltage and frequency settings for the equipment that you
will be testing (choose either 120 Vac/ 60 Hz or 230 Vac/ 50 Hz). This option may help in avoiding
the accidental applications of damaging voltages to the equipment under test. This option may
changed at any time in the Standard Test Options window.
2
NOTE: Before you run the Agilent 14761A HFTS software, make sure that:
ñ No LAN software is running
ñ No screen savers are running. Press Ctrl Esc to check the Windows Task List. Also
check the Control Panel Desktop application.
ñ If you have Power Management Software running on your PC, make sure that any power
management modes such as Sleep or Standby are turned off while the tests are running.
Connect the Equipment
To use the Agilent 14761A HFTS software, install or connect the following equipment to your computer.
1.Make sure that an Agilent GPIB or a National GP-IB interface card with the appropriate drivers has
been installed in your computer. See “Installing Interface Card Drivers”.
2 Install the Agilent 6800-Series AC Power Source/Analyzer and connect it to the computer.
3.Set up the AC Power Source/Analyzer for remote sensing at the input terminals of the equipment
under test. Failure to do this will result in inaccurate output voltage programming.
4.Turn on your computer and Agilent 6800-Series AC Power Source/Analyzer. Setup is complete.
However, in order for this software to operate, you must install a driver for your GPIB card.
11
Page 12

2 - Installation
Installing Interface Card Drivers for Windows 3.1 or 3.11 Systems
ñ If you are using an Agilent 82335 GPIB card, install the driver software from the I/O Libraries
CD-ROM (E2094) that came with the card. Open the \win31\disk1 directory on the CD-ROM
and run setup.exe. If you do not have this CD-ROM, you may purchase it through a local Agilent
Sales and Support office.
ñ If you are using an Agilent 82340, 82341, or 82350 GPIB card, the CD-ROM that came with the
card (Agilent E2094F) may contain driver software only for Windows 95 and Windows NT. In
that case you should obtain the latest version of this CD-ROM (Rev F.01.02 or later), which also
contains drivers for Windows 3.1. Open the \win31\disk1 directory on the CD-ROM and run
setup.exe.
ñ If you are using a National Instruments GPIB card, install the associated Windows 3.x driver.
You may have received a disk containing this driver when you purchased the card. Also, at the
time this guide was written, the newest drivers were available from www.ni.com. Install the
latest version of NI-488.2.
Installing Interface Card Drivers for Windows 95 Systems
ñ If you are using an Agilent 82335, 82340, 82341, or 82350 GPIB card, install the driver software
from the I/O Libraries CD-ROM that came with the card. If this CD-ROM is an E2094F or later,
run setup.exe in the CD-ROM’s root directory. If the CD-ROM is an E2094E, open the
\win95nt\disk1 directory on the CD-ROM and run setup.exe. If you do not have this CD-ROM,
you may purchase it through a local Agilent Sales and Support office.
ñ If you are using a National Instruments GPIB card, install the associated Windows 95/98 driver.
You may have received a disk containing this driver when you purchased the card. Also, at the
time this guide was written, the newest driver was available from www.ni.com. Install the latest
version of NI-VISA or NI-488.2.
Installing Interface Card Drivers for Windows NT 4.0 Systems
ñ If you have an Agilent 82335 GPIB card, this card will NOT operate under Windows NT. You
should purchase an Agilent 82340, 82341, or 82350 GPIB card through a local Agilent Sales and
Support office.
ñ If you are using an Agilent 82340, 82341, or 82350 GPIB card, install the software from the I/O
Libraries CD-ROM that came with the card. If this CD-ROM is an Agilent E2094F or later, run
setup.exe in the CD-ROM’s root directory. If this CD-ROM is an E2094E, open the
\win95nt\disk1 directory on the CD-ROM and run setup.exe. If you do not have this CD-ROM,
you may purchase it through a local Agilent Sales and Support office.
ñ If you are using a National Instruments GPIB card, install the associated Windows NT driver.
You may have received a disk containing this driver when you purchased the card. Also, at the
time this guide was written, the newest driver was available from www.ni.com. Install the latest
version of NI-VISA or NI-488.2.
Verify the Configuration
Once your equipment and software are installed, click on the Start button and select Programs |
Regulatory Test Solution | Harmonic and Flicker Emissions. (For Windows 3.1, click on the HFTS
12
Page 13
Installation - 2
icon to run the software.) When the software is run, it automatically searches for an interface card and
queries the Agilent 6800-Series AC Power Source/Analyzer for its model number. Verify that your
configuration is correct as follows:
1. Select the New button in the Welcome Window
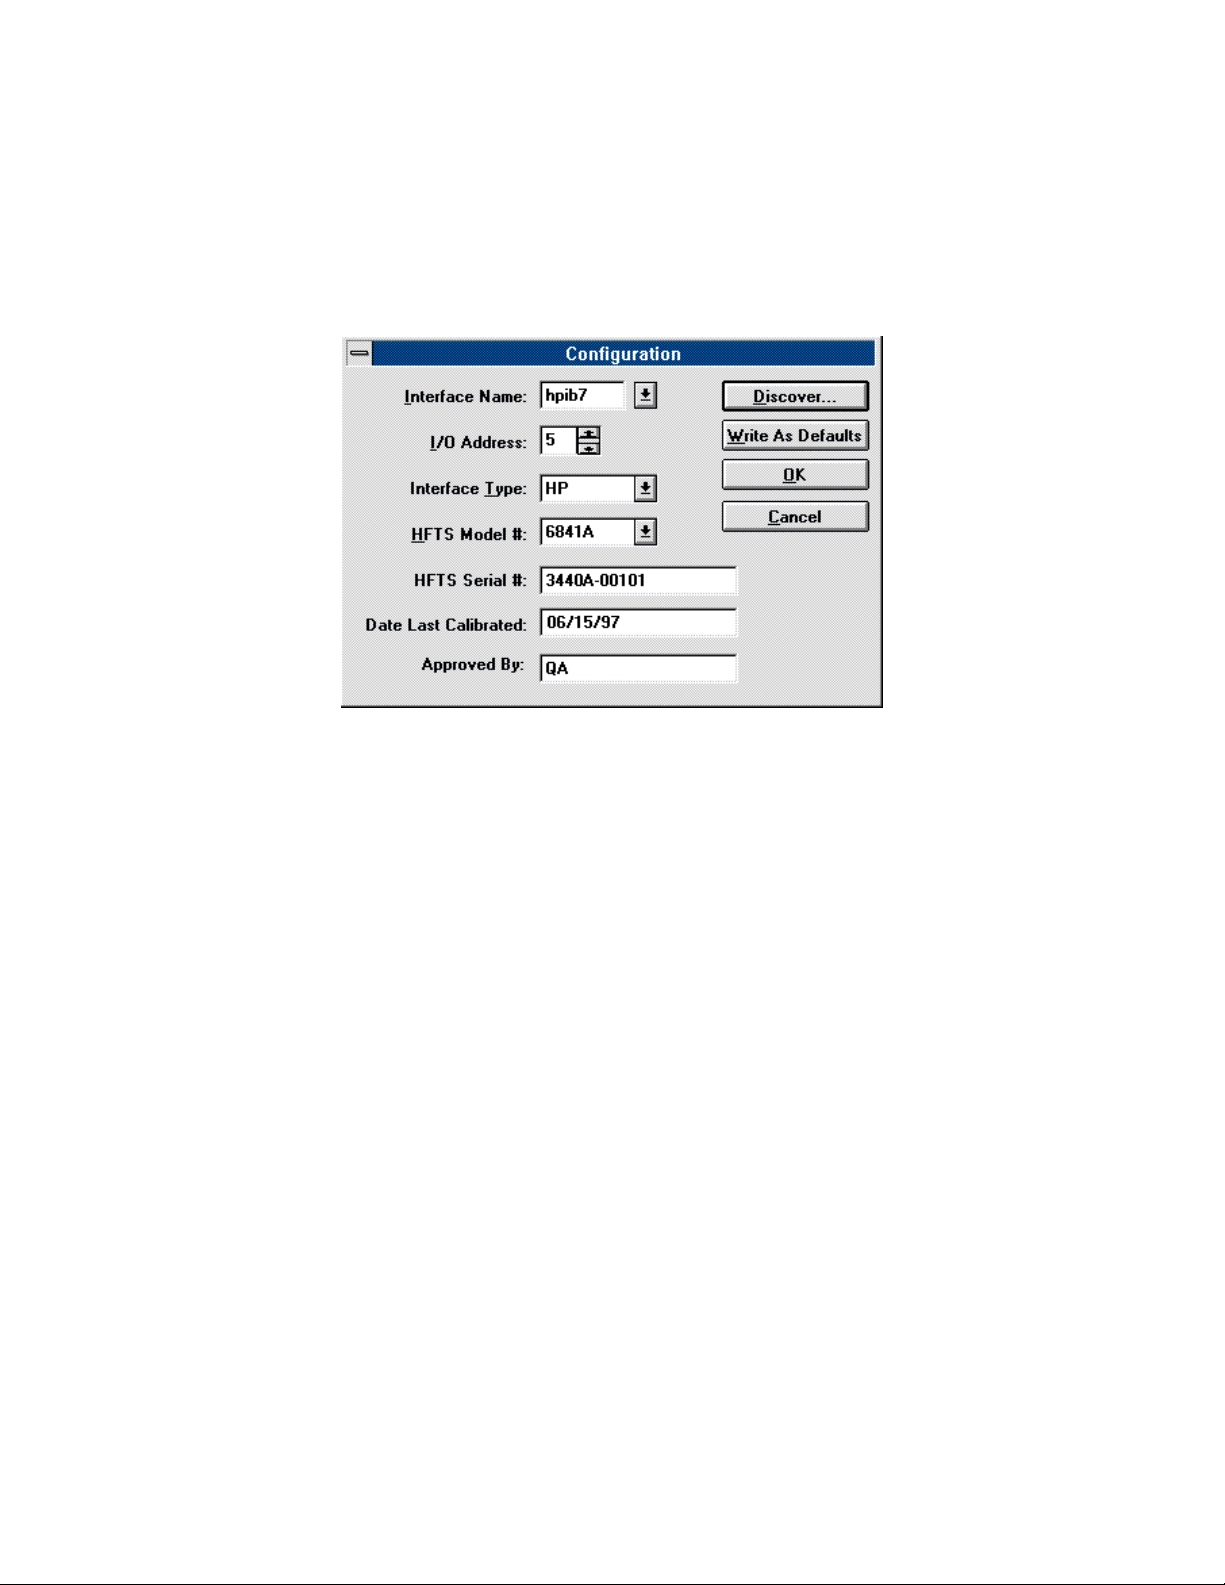
2. In the Options menu, select the Configure... command. This displays a Configuration dialog box
on the screen. The Configuration Dialog box contains the following fields:
ñ The Interface Name identifies the interface session when using an SICL interface. The
application determines the default interface name by checking which interface driver is installed
in your system. If “HP” is the interface type, the Interface Name list box displays all of the SICL
names presently configured in the Windows 95 system. (SICL interface names are assigned to
the ac source in the interface card’s configuration utility.) For Windows NT systems, the list box
displays hpib7 as the default interface name. If “National” is the interface type, the Interface
Name box displays the following pre-defined GPIB names: GPIB0, GPIB1, GPIB2,or GPIB3.
ñ The I/O Address displays the address of the Agilent 6800-Series AC Power Source/Analyzer.
The instrument address can be read or set using the front panel Address key.
ñ The Interface Type is either HP, National, or File only.
ñ The HFTS Model # is the instrument model that you are controlling.
ñ The HFTS Serial # is where you enter the serial number of instrument that you are
controlling.(this is optional)
ñ Enter the date the instrument was last calibrated (this is optional)
ñ Enter the calibration approvel name (this is optional)
Pressing the Discover button causes the software to search for an interface card and query the Agilent
6800-Series AC Power Source/Analyzer for its model number. Any equipment that is located is then
displayed in the appropriate fields in the configuration dialog box.
Pressing Write as Defaults updates the HFTS.INI file with the information that has been entered in this
dialog box either by the user or by the Discover feature. These default values are used during subsequent
start-ups of the Agilent 14761A HFTS software to confirm system configuration.
Press OK to accept the changes, or Cancel to cancel the changes and exit the dialog box.
13
Page 14
2 - Installation
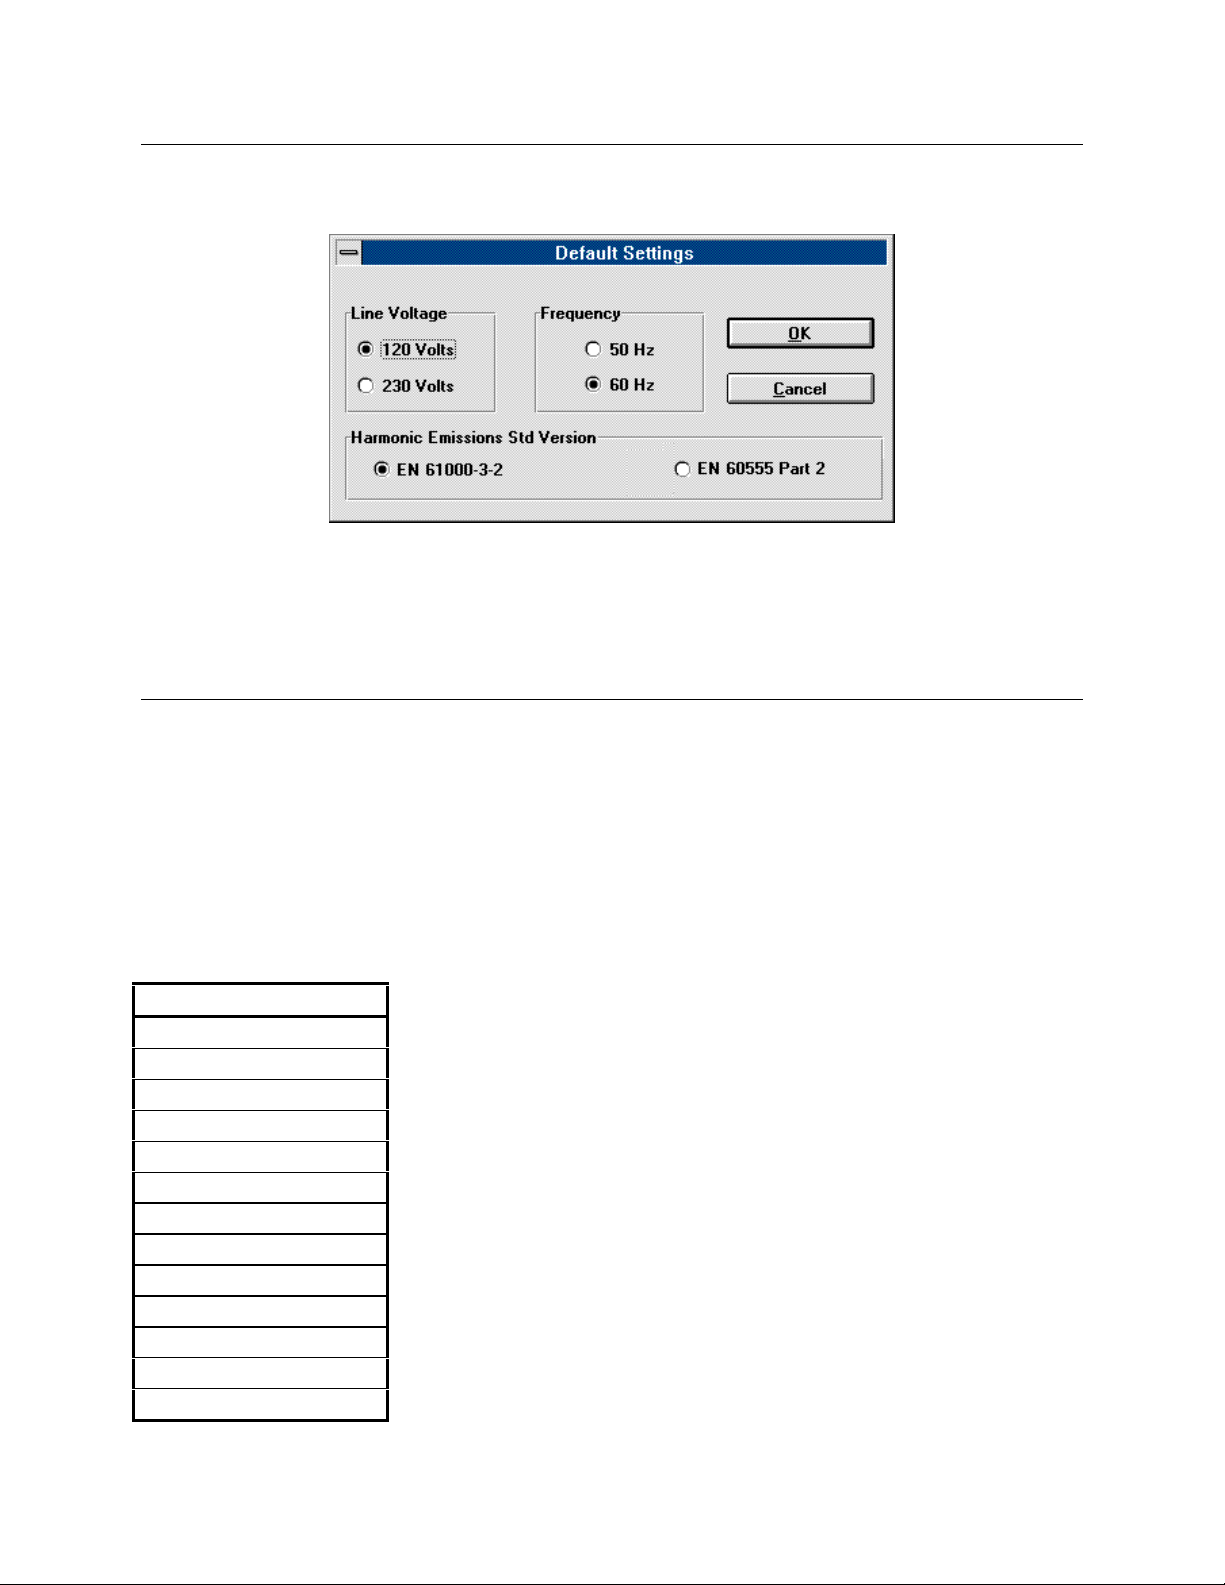
Default Settings
In the Options menu, select Defaults to view the default settings. The following settings are configurable:
ñ The line voltage and frequency that will be applied to the equipment under test.
ñ The quasi-stationary/fluctuating harmonics regulations version that you will be testing to.
Select either EN 61000-3-2 or the older EN 60555 Part 2 regulation.
Press OK to accept the defaults, or Cancel to cancel the changes and exit the dialog box.
Getting Around in the Application
There are two ways to access the various functions of this application:
1. From the drop-down menus at the top of the screen, or
2. From the menu tabs at the bottom of the screen.
The menu tabs at the bottom of the screen are the same as the View menu commands.
Drop-down Menu
The following commands are located in the drop-down menus at the top of the screen.
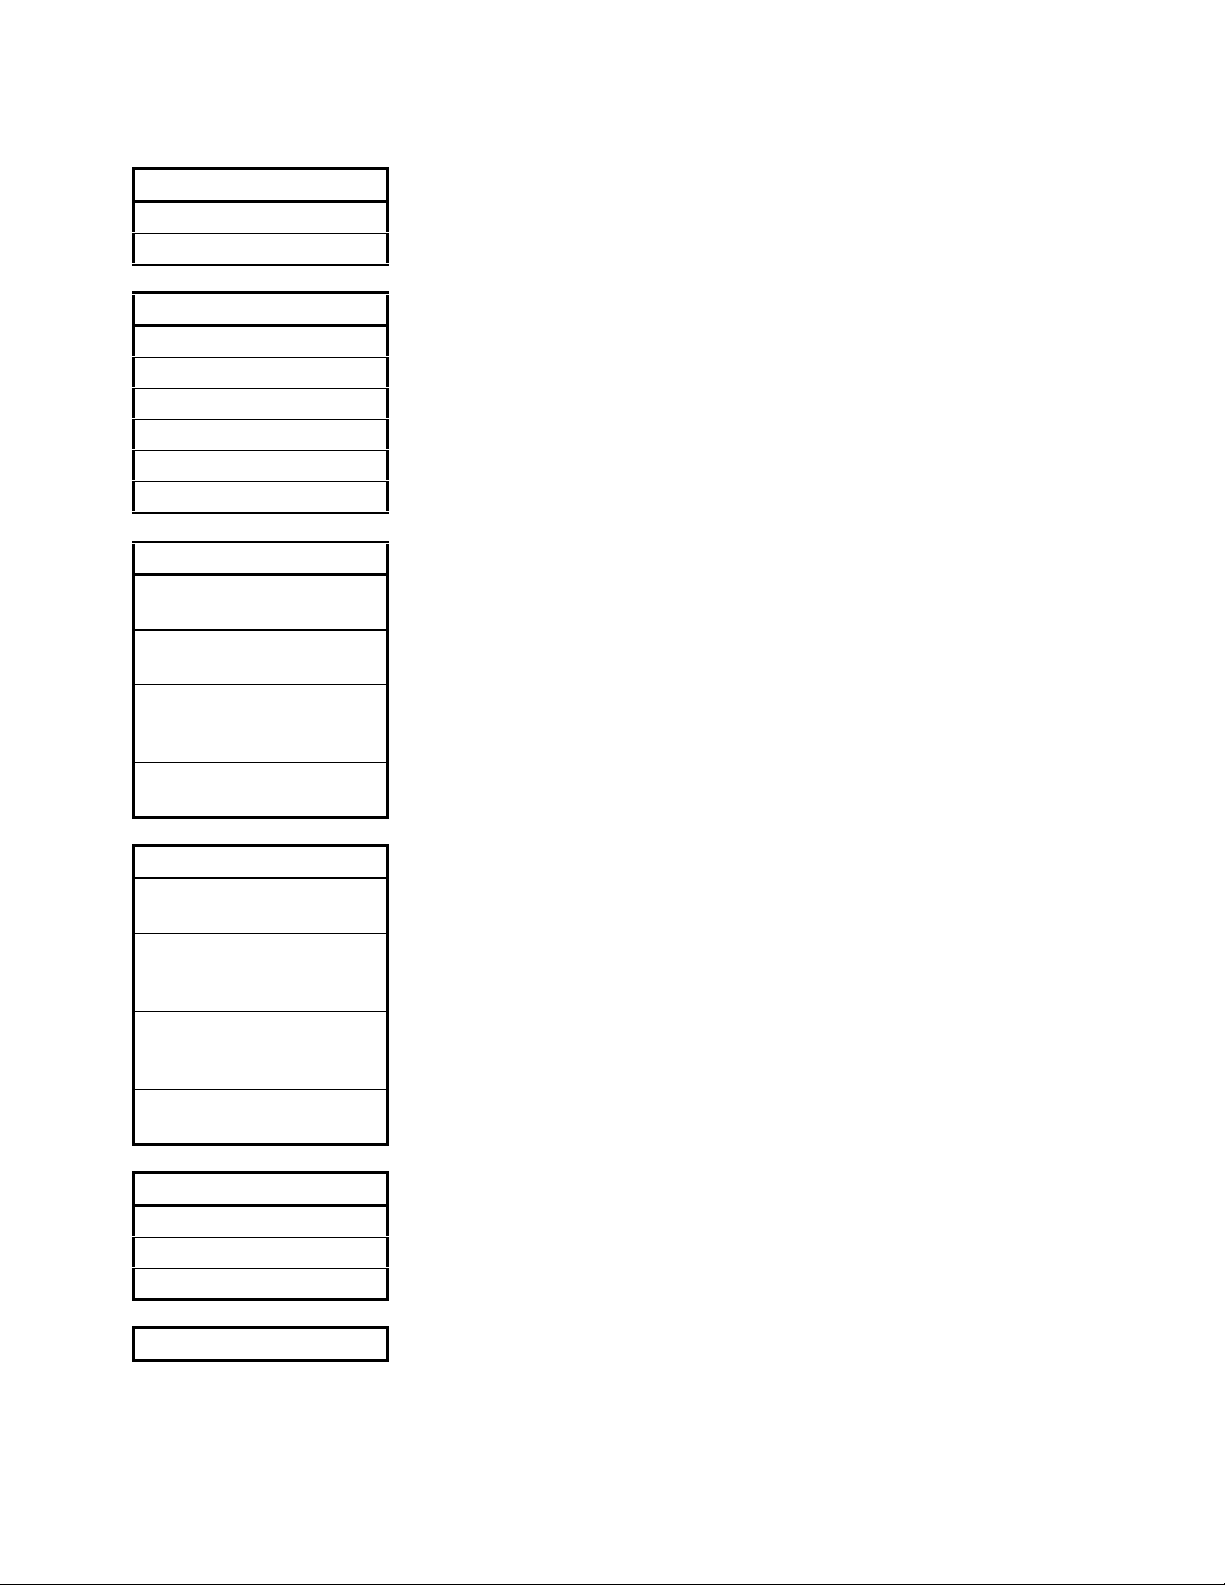
File
New...
New From Template...
Open...
Save
Save As...
Lock Test File
Edit Template..
Save As Template...
Print Pre-test
Print Report...
Print Graph/Table...
Printer Setup...
Exit
Lets you select a new test
Lets you select a new test but applies an existing set-up template
Opens an existing test
Saves the presently opened test
Saves the present test under a new name
Sets the attribute of a completed test file to read only
Lets you edit a template
Saves only the template information of the presently opened test
Lets you print the currently displayed pre-test screen
Lets you print the currently displayed report
Lets you print the currently displayed graph or table
Lets you change the printer setup
Exits the application
14
Page 15
Edit
Copy Table
Copy Graph
View
Main
Test Setup >
Pre-test
Test
Display >
Report >
Options
Local Lockout
Validation Mode
Configure...
Defaults...
Installation - 2
Copies highlighted information from the table to the Clipboard
Copies the presently displayed graph to the Clipboard
Lets you select the type of test to run
Lets you select the test set-up parameters
Lets you run the pre-test
Lets you run the test
Lets you view specific test results
Lets you view the test report
Lets you disable the front panel keys of the Agilent 6800-Series AC Power
Source/Analyzer.
Lets you run a special mode used to validate current harmonics testing
methodology.
Lets you specify the I/O slot address of the interface, the instrument address,
the interface type, and the Agilent 6800-Series AC Power Source/Analyzer
model number.
Lets you view and change the default values for line voltage, frequency, and
test standards.
Mains
Auto On/Auto Off
Auto On/Manual Off
Manual On/Auto Off
Manual On/Manua l O ff
Help
Contents
Using Help
About
Mains ON/ Mains Off
Automatically controls the output of the Agilent 6800-Series AC Power
Source/Analyzer while the test is running.
Lets you manually turn off the output of the Agilent 6800-Series AC Power
Source/Analyzer from the Test window. Provides automatic turn-on at the
beginning of pretests and tests.
Lets you manually turn on the output of the Agilent 6800-Series AC Power
Source/Analyzer from the Test window. Provides automatic turn-off at the
completion of pretests and tests.
Lets you manually control the output of the Agilent 6800-Series AC Power
Source/Analyzer from the Test window.
Accesses the Help contents.
Explains how to use the on-line help.
Displays the Agilent 14761A HFTS software revision.
Indicates the present state of the ac source output.
15
Page 16
2 - Installation
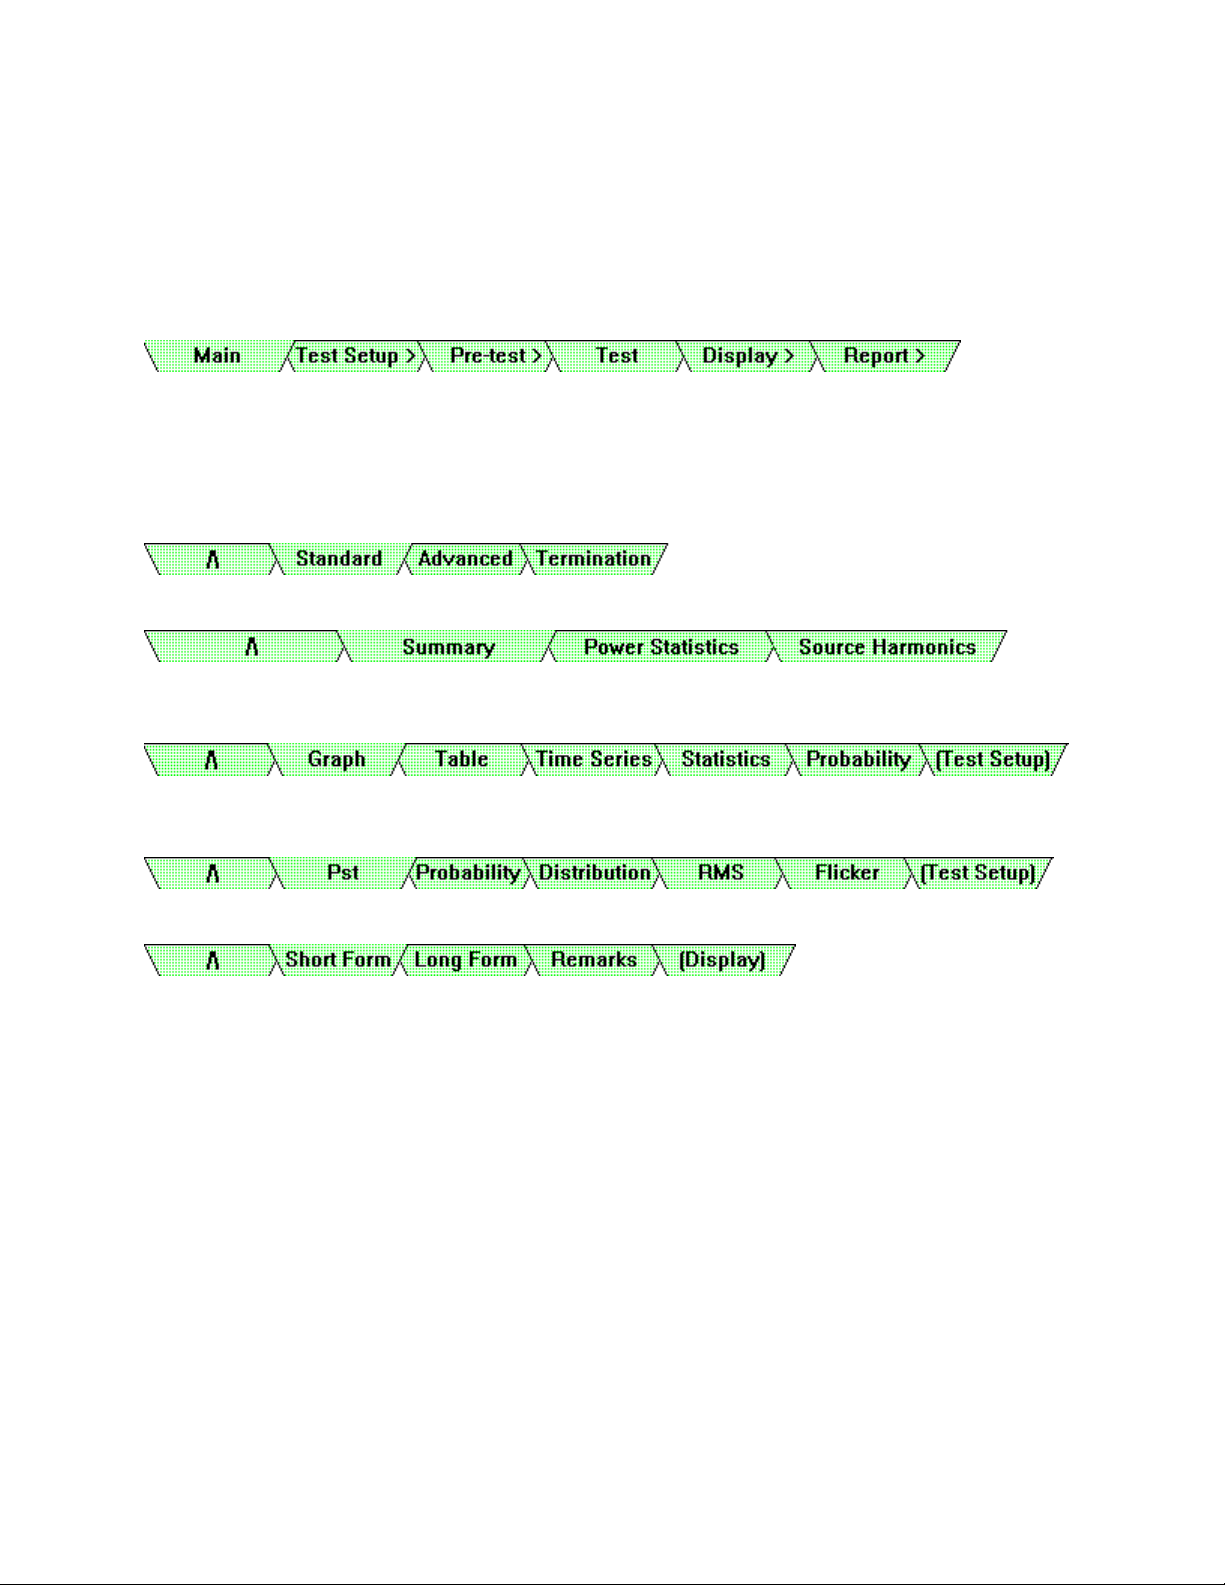
Menu Tabs
The menu tabs that are located at the bottom of the screen let you easily access the primary functions of
the Agilent 14761A HFTS software. These functions are also available from the file menus. Altogether,
there are five groups of menu tabs:
The Main level group accesses the following functions:
The > symbol in the tab label indicates a lower-level of tabs, which access a number of additional
screens. Once at the lower level, the /\ tab returns you to the Main Level. When active, the [last tab] in
the series jumps to the last lower-level tabs that you had previously accessed.
The following tabs appear in the Test Setup> group. Each tab accesses its respective function.
The following tabs appear in the Pre-test> group. Each tab accesses its respective function.
The following tabs appear in the Display> group for Quasi-stationary or Fluctuating Harmonic testing.
Each tab accesses its respective function.
The following tabs appear in the Display> group for Voltage Fluctuation testing. Each tab accesses its
respective function.
The following tabs appear in the Report> group. Each tab accesses its respective function.
16
Page 17
3
Setting Up the Test
If you have not already done so, click on the Agilent HFTS icon to run the software. Now you can set up your
test. If the Agilent HFTS icon does not appear on your computer, go back to chapter 2 and install the Agilent
14761A HFTS software.
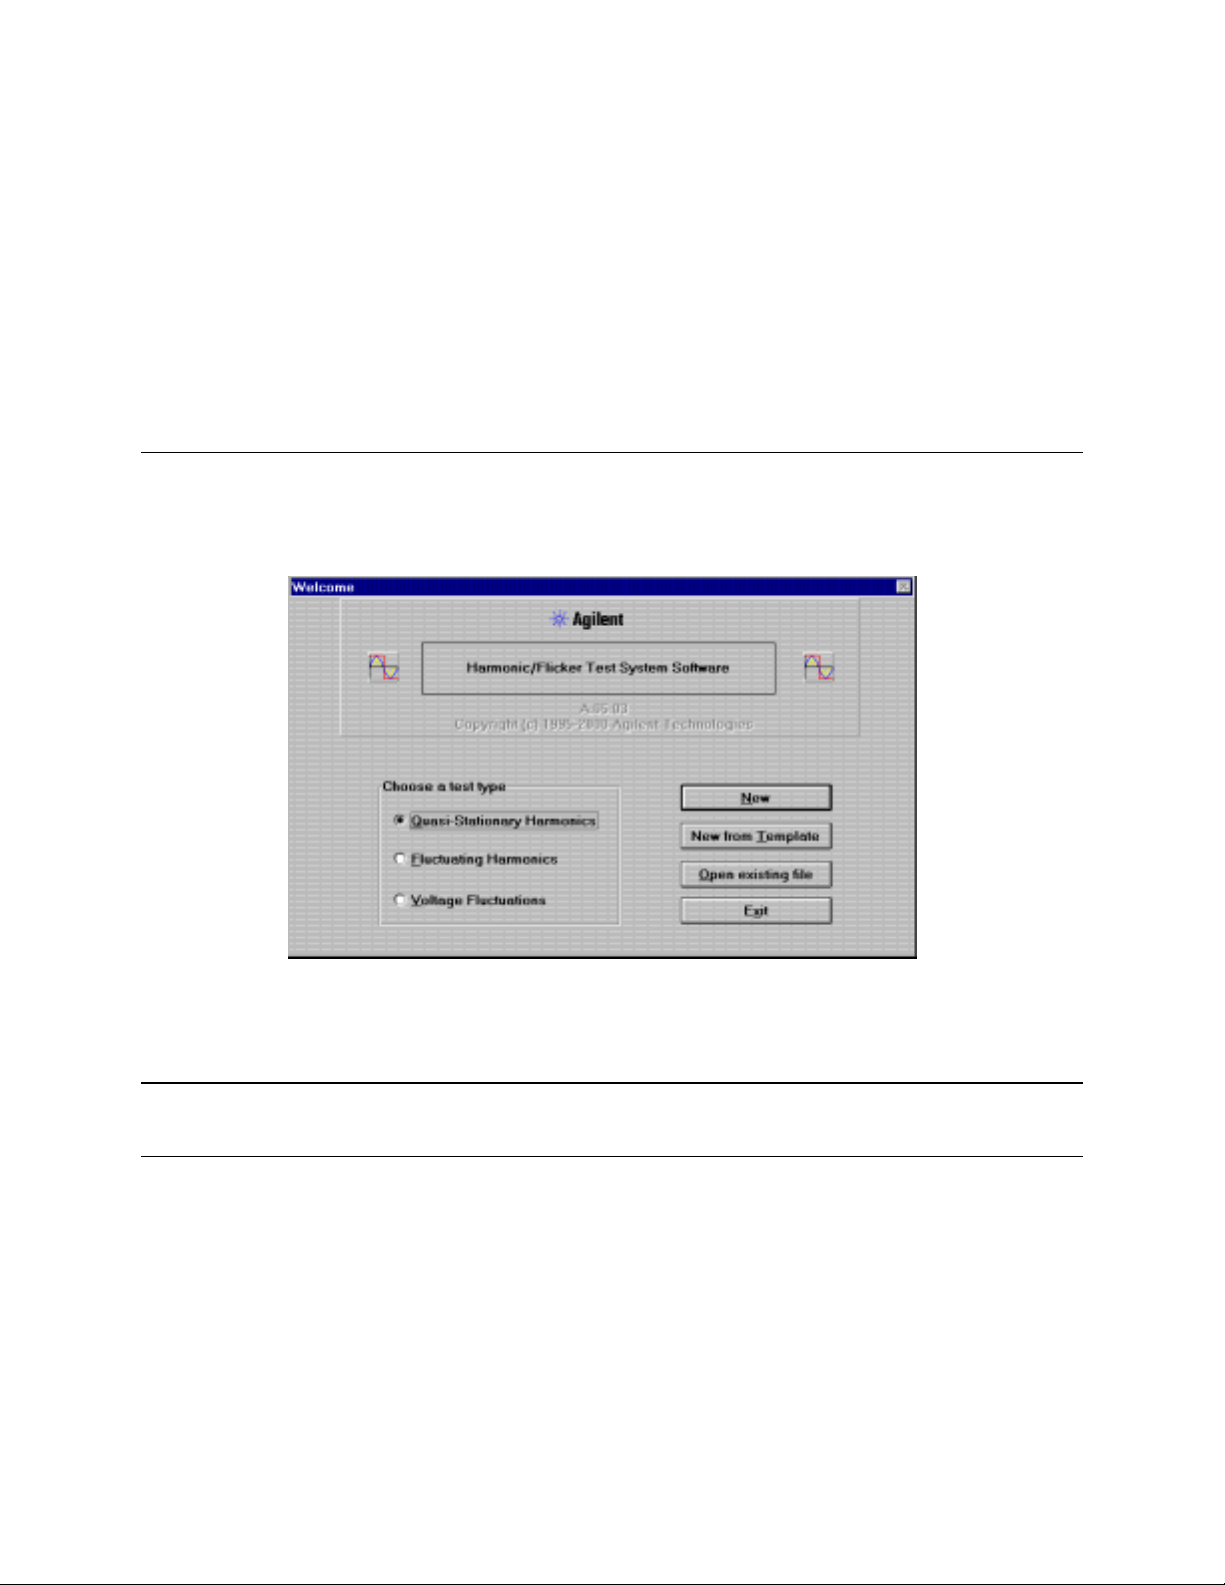
Select a Test Type
When you first run the Agilent 14761A HFTS software, the Welcome window appears.
Select a test type from the Welcome Window.
1. Click on either Quasi-stationary Harmonics, Fluctuating Harmonics, or Voltage Fluctuations
Note To select a different test after you get past the Welcome window, use the drop-down File
menu commands
2. Choose to configure a new test, run an existing test, or configure a new test based on an existing
template. Note that these selections are also available in the File menu.
ñ Selecting New opens the Main window, in which you start entering test setup information about
the test that you will be running. If you want to run other tests of the same type using the same
setup information, consider saving this information to a template file once the setup has been
established.
17
Page 18

3 - Setting Up the Test
ñ Selecting New From Template opens a dialog box that lets you select a template file which
contains previously-configured test setup information. This template information will be copied
into your new data file. The template itself is not changed unless you make subsequent changes
to your setup and save them into the template using “Save as Template.”. When you run the test,
the test data will then be added to the information obtained from the template. You can modify
the template defaults and set up data as required for the new test or use the values supplied by the
template. The following file extensions are used to identify template files:
.stt template files for quasi-stationary harmonic tests
.flt template files for fluctuating harmonic tests
.fkt template files for voltage fluctuation tests
The default directory for template files is C:\hfts\template
ñ Selecting Open Existing File opens a dialog box that lets you select a data file which contains
setup information and may or may not contain pre-test as well as test data. This lets you examine
previously run test data or replace old test data with data obtained from a new test run. The
following file extensions are used to identify data files:
.sta data files for quasi-stationary harmonic tests
.flu data files for fluctuating harmonic tests
.flk data files for voltage fluctuation tests
The default directory for data files is C:\hfts
Note Running a pre-test or a test after opening an existing file will cause all existing data to be
overwritten with new data. You can prevent this from occurring by checking the Make
test data read-only option in the Test window before running a test, or by using the
Lock Test File command in the File menu.
18
Page 19
Setting Up the Test - 3
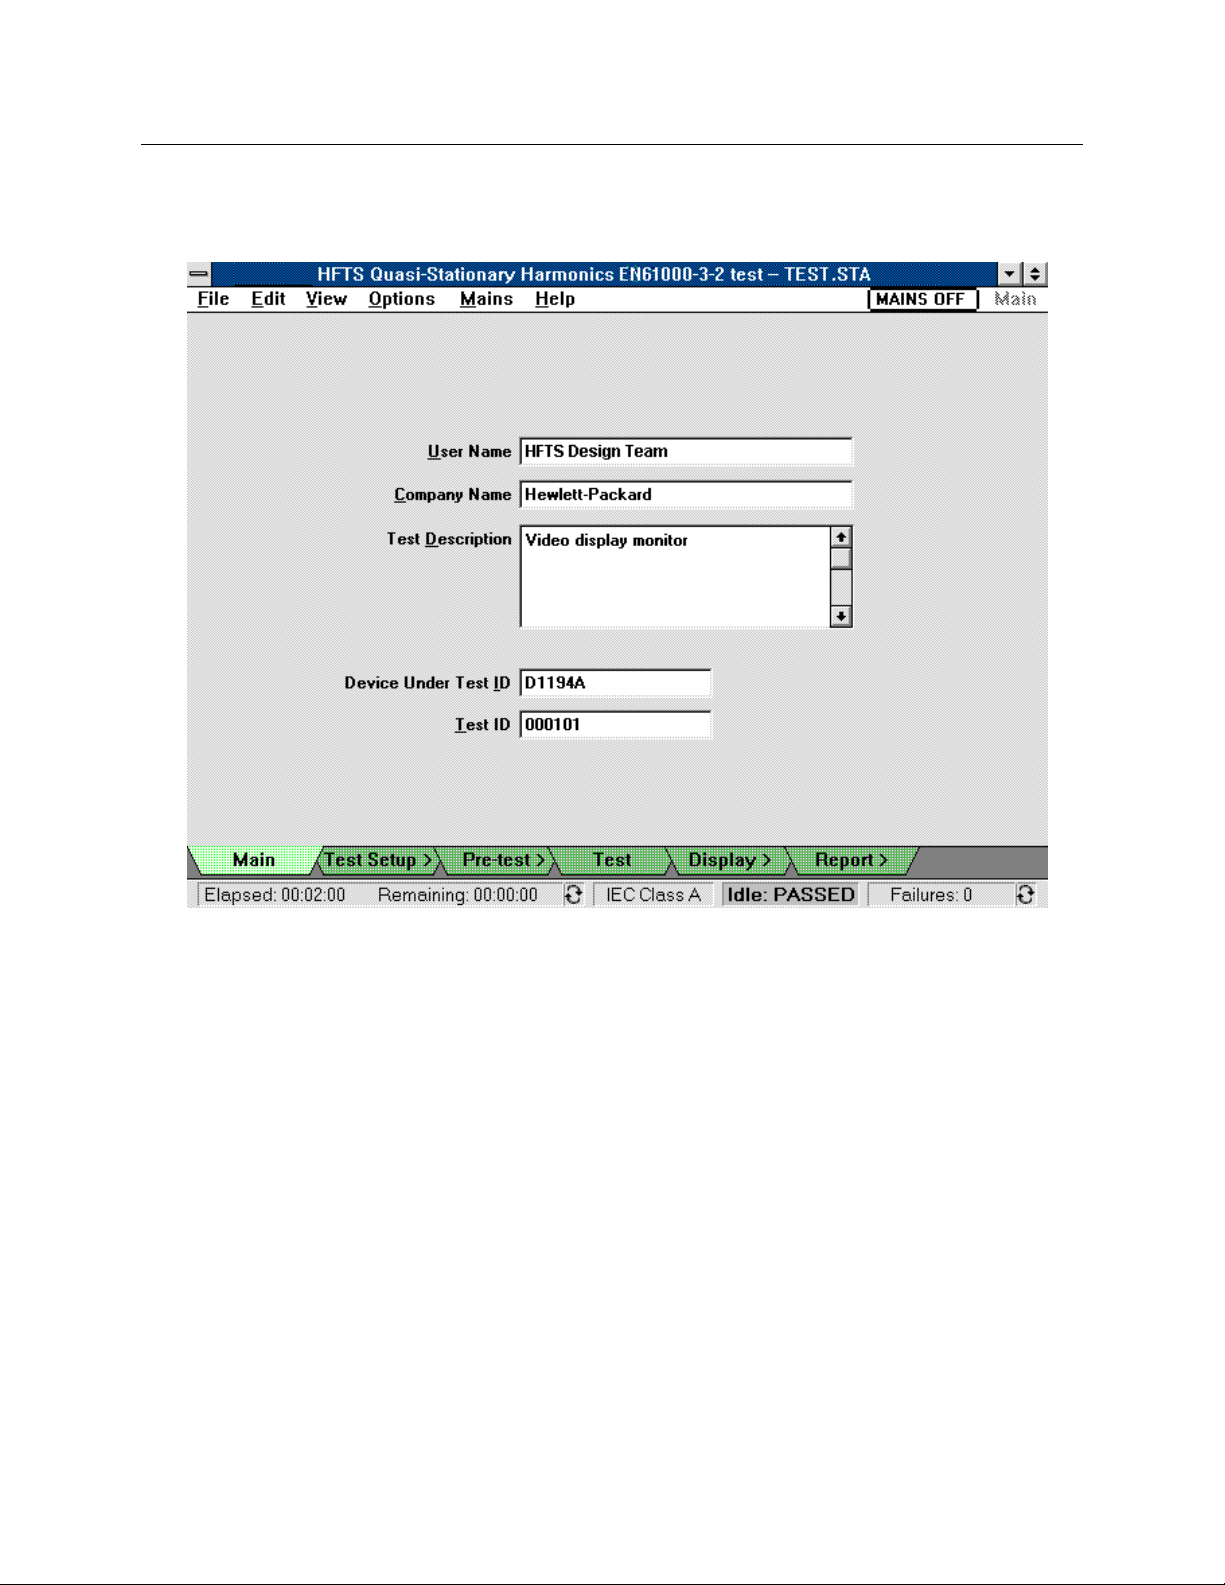
Create a Template
Template files contain setup information for the test that you will be running. Using templates can save
valuable time by eliminating the need to enter repetitive data each time you set up a test.
Create a template by entering information into the Main and the Test Setup windows. Use the Tab key
to move among the different fields.
1. Enter the following information into the text boxes of the Main window:
your name
the company name
a brief description of the test procedure that you will be running
a device ID such as a model number
a test ID such as a serial number or test number that uniquely identifies the test
2. Use the menu tabs on the bottom of the screen to access the Test Setup windows. Note that you
can also access the Test Setup windows from the View Menu.
3. Starting with the Standard Test Setup window, select and configure each of the following Test
Setup windows as needed: Standard, Advanced, and Termination
4. Select Save as Template in the File menu to create a template file. Once created, the template
file may be used to quickly create new tests by adding or editing only the information that must
be changed for each test. This is useful if you are conducting a series of tests or testing similar
equipment that is subject to a standardized test.
19
Page 20
3 - Setting Up the Test
Select the Test Setup Options for Quasi-stationary or
Fluctuating Harmonics
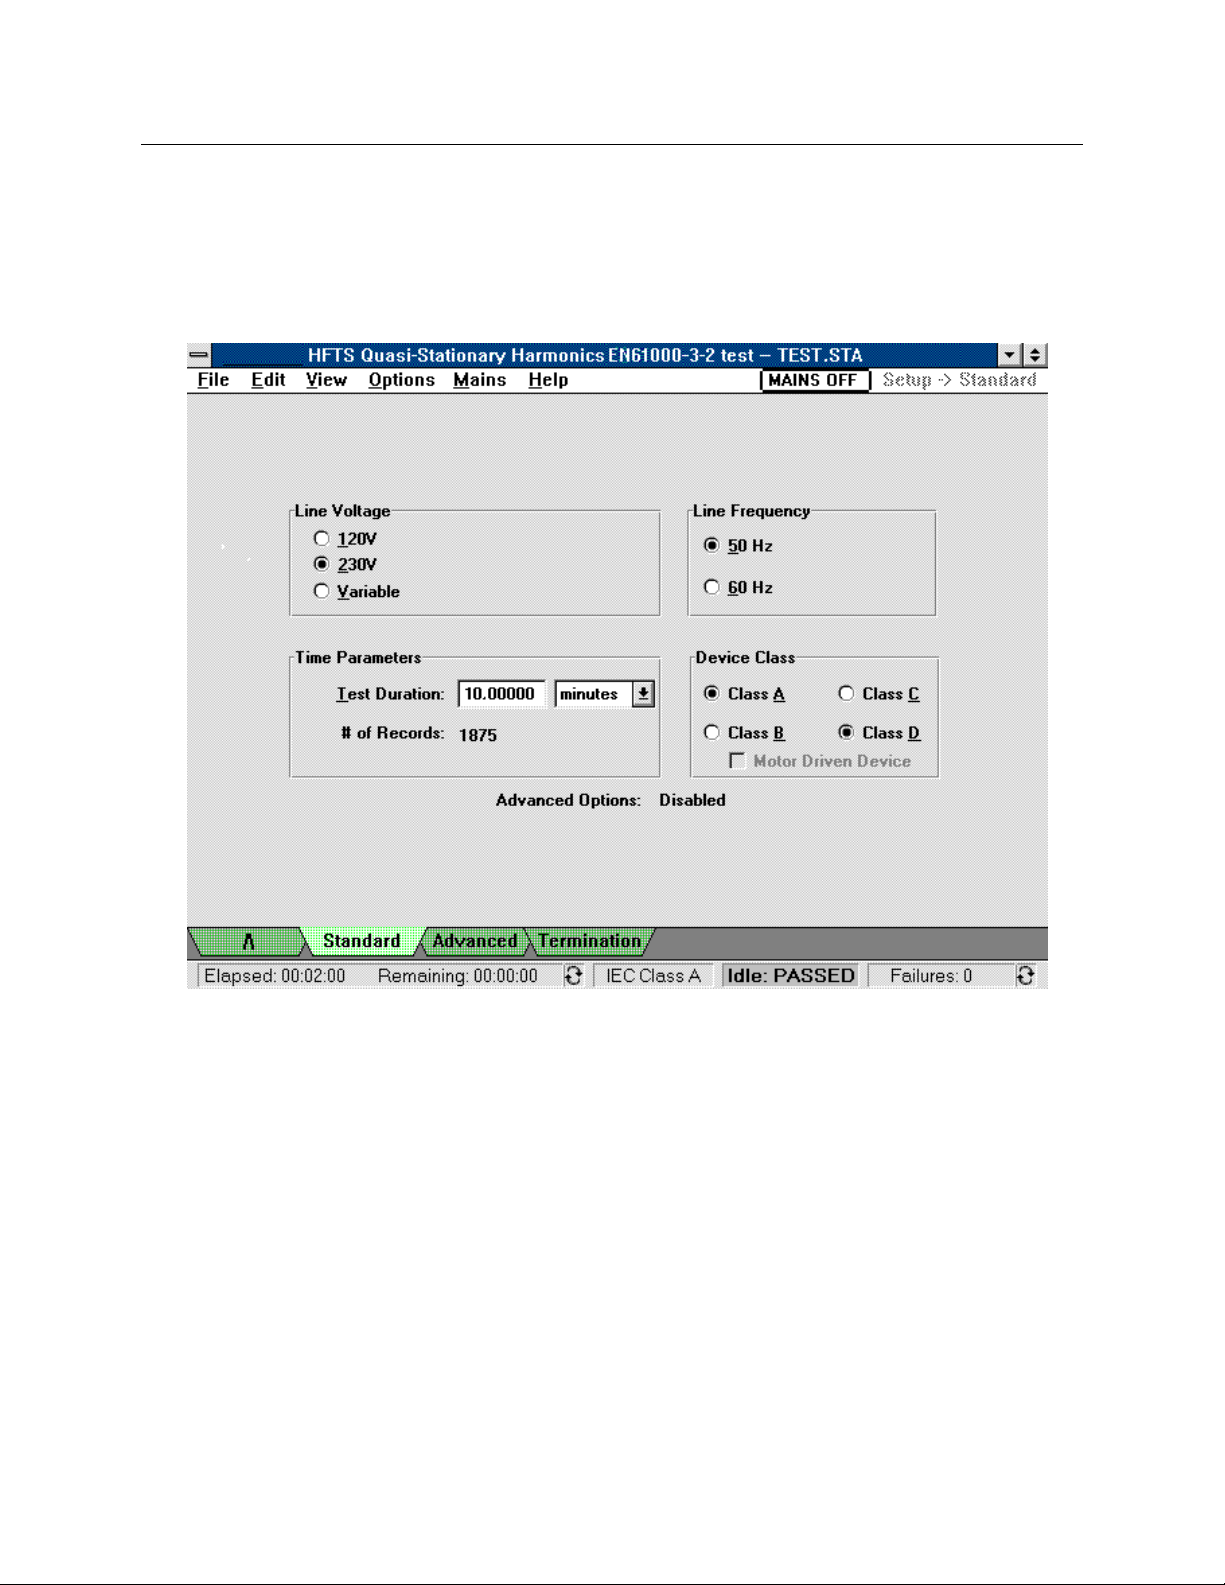
Standard Test Options
Standard options specify the line voltage, line frequency, test time, and device class for compliance tests.
They are selected in the Standard window.
ñ Select the line voltage that will be applied to the equipment under test.
Selecting Variable lets you enter a value other than 120 Vac or 230 Vac.
ñ Select the line frequency (50 or 60 Hz) that will be applied to the equipment under test.
ñ Select the test duration in seconds, minutes, hours, or days.
The # of Records field displays the number of data records that will be taken during the test time
that you have specified. Note that the relationship between time and the number of records per
second is a function of line frequency and measurement window type. The measurement window
type is specified in the Advanced Test Setup window, and is set to a default of Rectangular.
ñ Select from one of the following device classes for your equipment under test to which the EN
61000-3-2 regulation applies:
Class A: All equipment except that stated in one of the remaining three classes.
Class B: Portable electrical tools, which are hand held during normal operation and used for a
short time (a few minutes) only.
Class C: Lighting equipment, including dimming devices.
20
Page 21
Setting Up the Test - 3
Class D: Equipment having an input current with a "special wave shape" (e.g. equipment with
off-line capacitor-rectifier ac input circuitry and switch-mode power supplies) and an active input
power ≤ 600 W. The active power is defined as Watts. For the Class D mA/W limits to apply, the
active power must also be greater than 75 W.
Motor Driven Device: Check this box if the equipment you are testing is a motor-driven device.
This will cause class A limits to be used in accordance with EN 61000-3-2 regardless of the input
current waveshape.
Note The EN 60555 Part 2 regulation only applies to Class A and Class B equipment. The
Agilent 14761A HFTS software will reflect this based on the regulations selection made
in the Options/Defaults menu. See appendix D for information about class
determination.
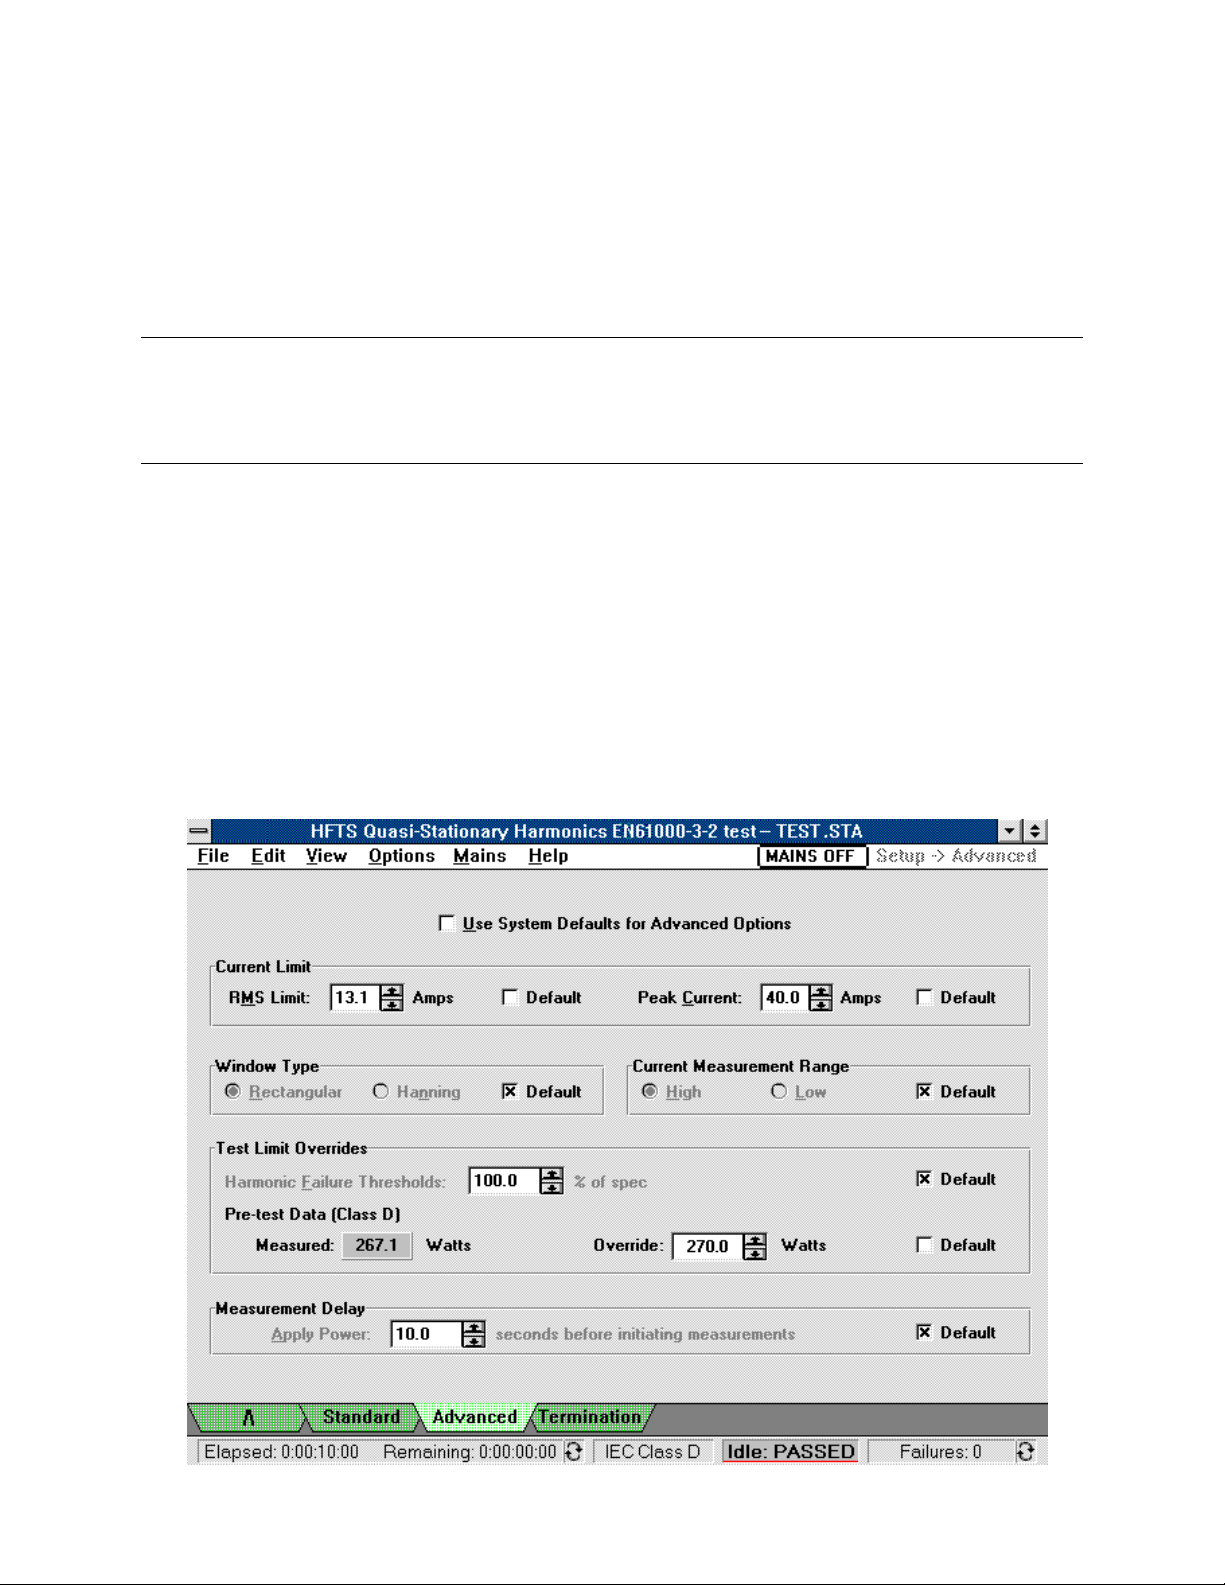
Advanced Test Options
The advanced test options may be used to modify test conditions outside the range permitted for
compliance tests. They are selected in the Advanced window. Generally, you would not change the
factory default settings if you are doing compliance testing because the changes may invalidate the test.
As an exception to the above statement, the Current Measurement Range setting and the Current Limit
settings may be changed without invalidating the compliance test as long as the changed settings do not
cause current limiting to occur during the test. Current limiting may occur during the time period when
power is initially applied but before the test is run. This time delay may be specified in the Advanced
Setup window for tests, and in the Pre-test window for pre-tests. Current limit errors are detected and
displayed if they occur during the test. Note that you can also set test limit overrides < 100% without
automatically flagging the test as non-compliant.
21
Page 22

3 - Setting Up the Test
ñ Select the rms and peak current limit of the Agilent 6800-Series AC Power Source/Analyzer that
you will be applying to the equipment under test. (The Agilent Model 6843A only has rms
current limit control, therefore, the peak current limit control does not appear.) Generally, it is
best to leave these parameters set to their maximum default values. Although the function of the
current limit is to protect the equipment under test, if the ac source goes into current limit during
a normal test the test will be invalid. Default maximum current limit values are automatically
established based on the model number that you entered into the Main window.
Note The Agilent 6800-Series AC Power Source/Analyzer can supply brief peak currents that
exceed its current capability. If this occurs for an extended time with Agilent
6812B/6841A and 6813B/6842A models, the units may activate an internal protection
circuit (the SOA limit) to turn the output off. If the equipment that you are testing causes
the Agilent 6800-Series AC Power Source/Analyzer to turn its output off, you may need
to lower the peak current limit setting. This will clip the output current of the Agilent
6800-Series AC Power Source/Analyzer during inrush but if properly set, will not
interfere with the normal running of the pre-test and tests.
ñ Select the measurement window type (Rectangular or Hanning)
ñ Select the peak current measurement range of the Agilent 6800-Series AC Power
Source/Analyzer
Low Range
High Range
6812B
6841A
8 A peak 8 A peak 9.6 A peak
80 A peak 80 A peak 96 A peak
6813B
6842A
6843A
Because of its better measurement resolution, use the low range when testing low power
equipment. However, be careful that the equipment under test never exceeds the peak currents
indicated in the above chart or the test results will be invalid.
ñ Select a test limit override for the harmonic failure threshold. This is specified as a percent of
the limit as defined by the applicable regulation. For Class C, test limits are also a function of the
measured (or user-specified) power factor and the line current at the fundamental frequency. If
necessary, you can override the power factor measured in the pre-test. For Class D, test limits are
also a function of real power (or watts). If necessary you can also override the watts measured in
the pre-test. Overrides are useful to prevent minor changes in measured values from changing the
test limits each time the test is run.
ñ Select a measurement delay from the time power is applied to the equipment under test until the
time that the Agilent 6800-Series AC Power Source/Analyzer starts measuring data. According
to EN 61000-3-2, this delay must be 10 seconds or less for compliance level fluctuating harmonic
tests. Note that the measurement delay has no consequential impact on test results. This is
because during the "delay to start of test" portion of both the pre-test and main test, test results
are not recorded and current limiting events are ignored. However, once the actual acquisition of
measurement data begins, current limit events are again treated as errors that invalidate the test.
Since high inrush currents usually occur only during the first few mains cycles following
application of mains voltage, a properly set current limit threshold will not be crossed once the
"delay to start of test" period has ended.
22
Page 23
Setting Up the Test - 3
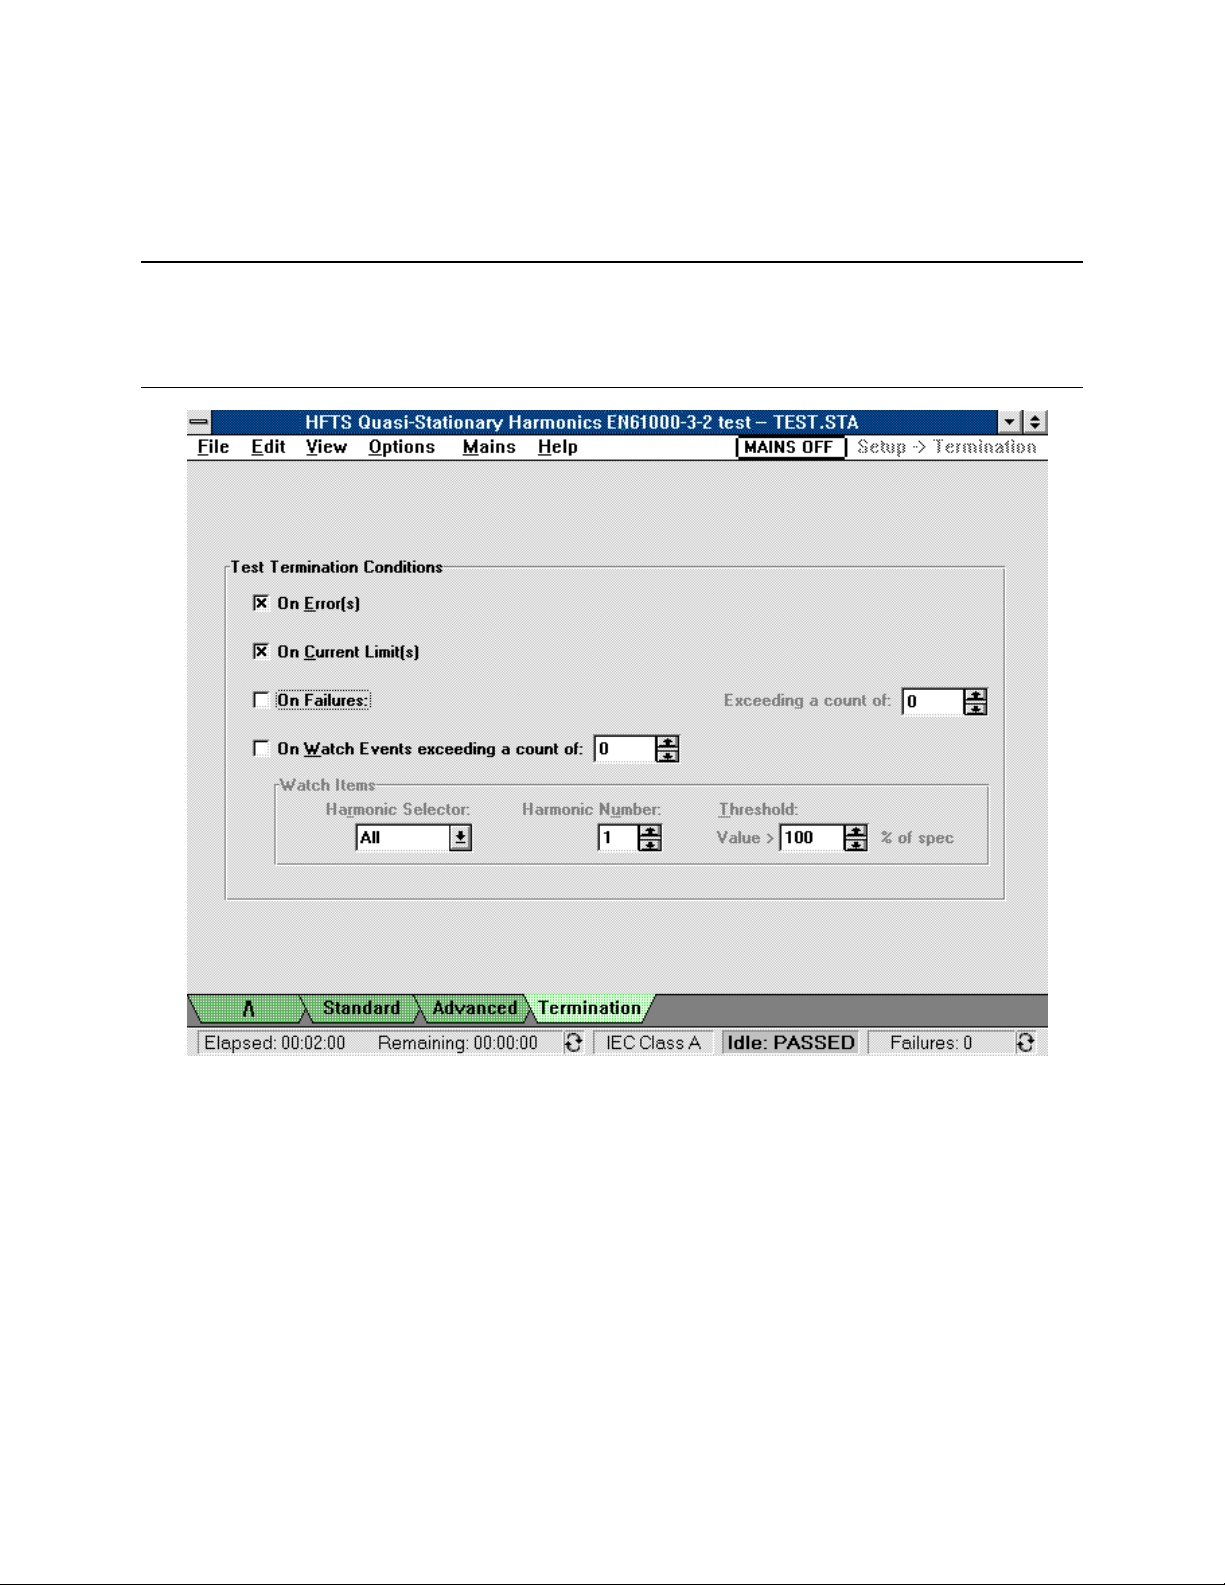
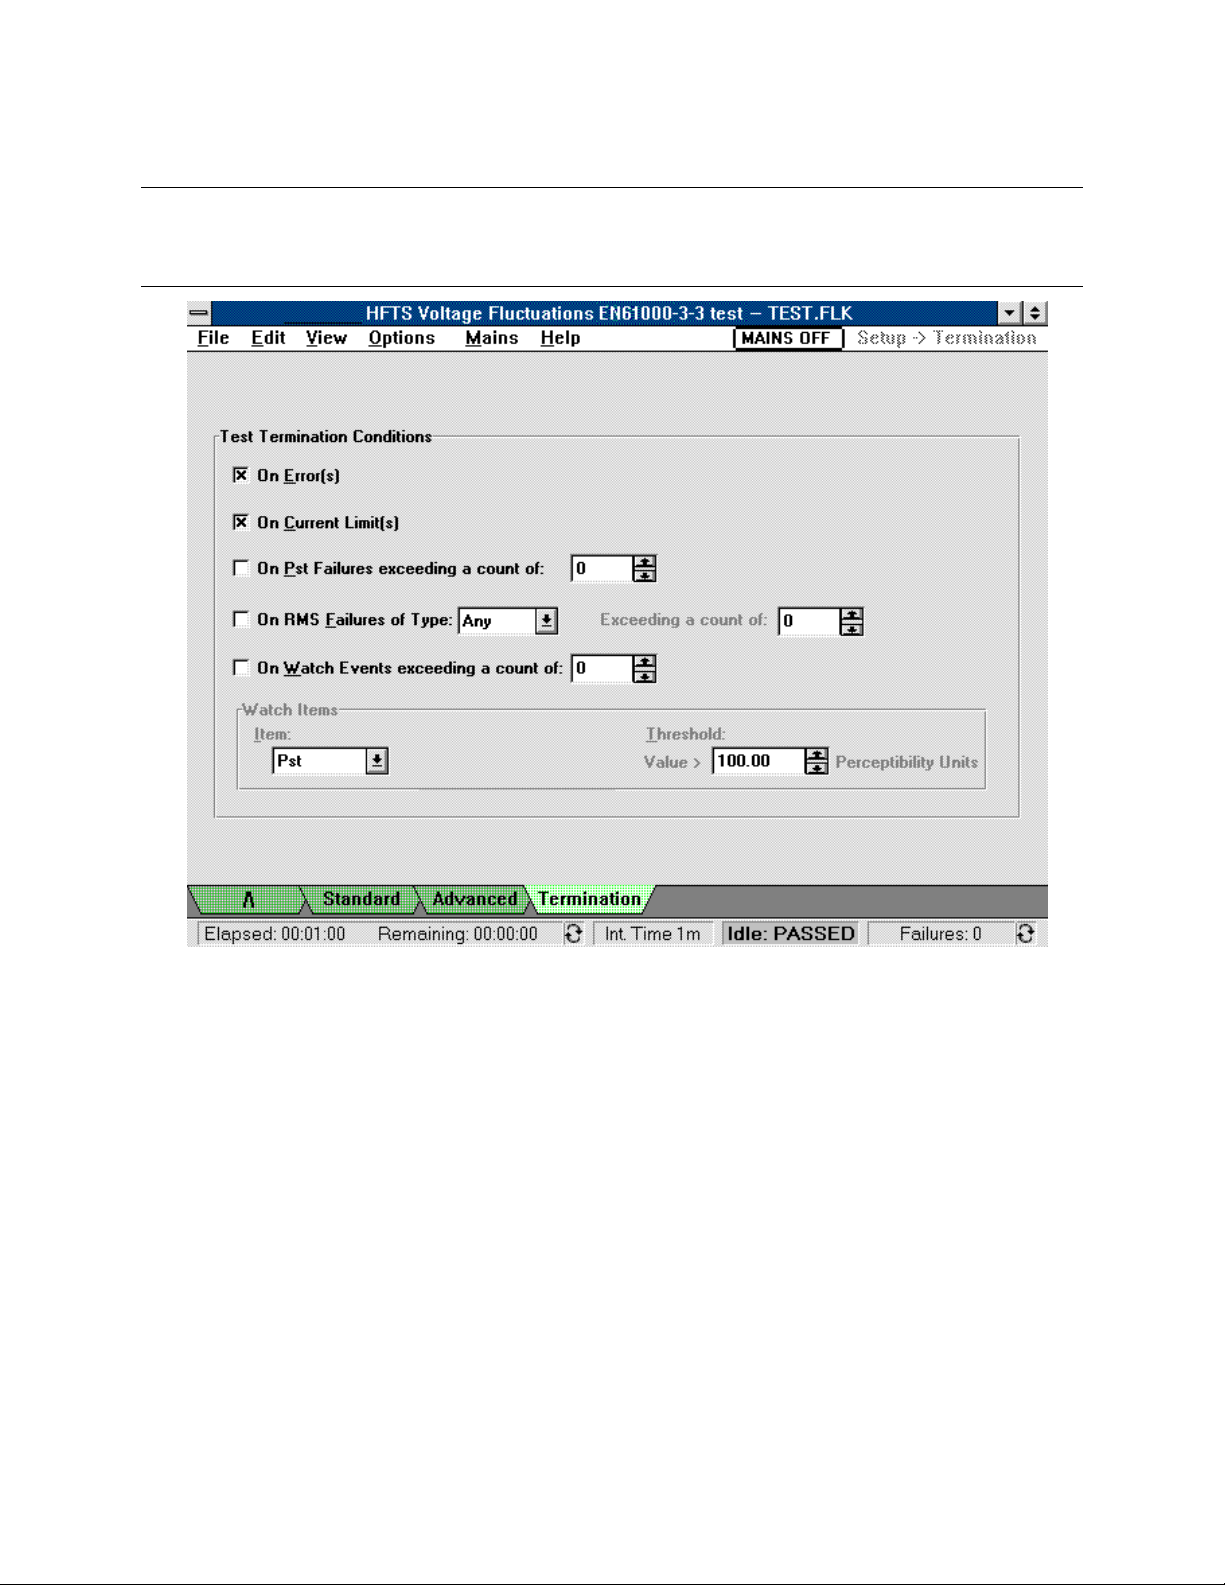
Test Termination Options
Termination options let you select the conditions that will terminate the test. They are selected in the
Termination window.
Note The following conditions terminate any test automatically if the Agilent 6800-Series AC
Power Source/Analyzer operating limits are exceeded: Rail fault condition,
Overtemperature, Overvoltage, and SOA. Refer to the applicable ac source User’s
Guide for an explanation of these conditions.
ñ Select termination on errors. One error will terminate the test when this is selected:
UNR - when the output becomes unregulated.
ñ Select termination when the current limit is exceeded. The two current limit conditions that will
terminate the test when this occurs are: CL - when the output goes into current limit mode, and
CP - when the output current limit protection has tripped.
ñ Select termination upon exceeding a specified number of failures. When testing fluctuating
harmonics and this box is checked, you can specify failures:
of any type,
with a 2.5 minute window
without a 2.5 minute window.
ñ Select termination on exceeding a specified number of watch events. Each event that satisfies the
selected criteria is counted as one event occurrence.
23
Page 24
3 - Setting Up the Test
If termination On Watch Events is enabled, you can select the following Watch Items criteria:
ñ All harmonics greater than the specified percent of threshold
ñ Odd harmonics greater than the specified percent of threshold
ñ Odd ≤ 19 harmonics greater than the specified percent of threshold
ñ Even harmonics greater than the specified percent of threshold
ñ Nth, a specific Harmonic Number that is greater than the specified percent of threshold
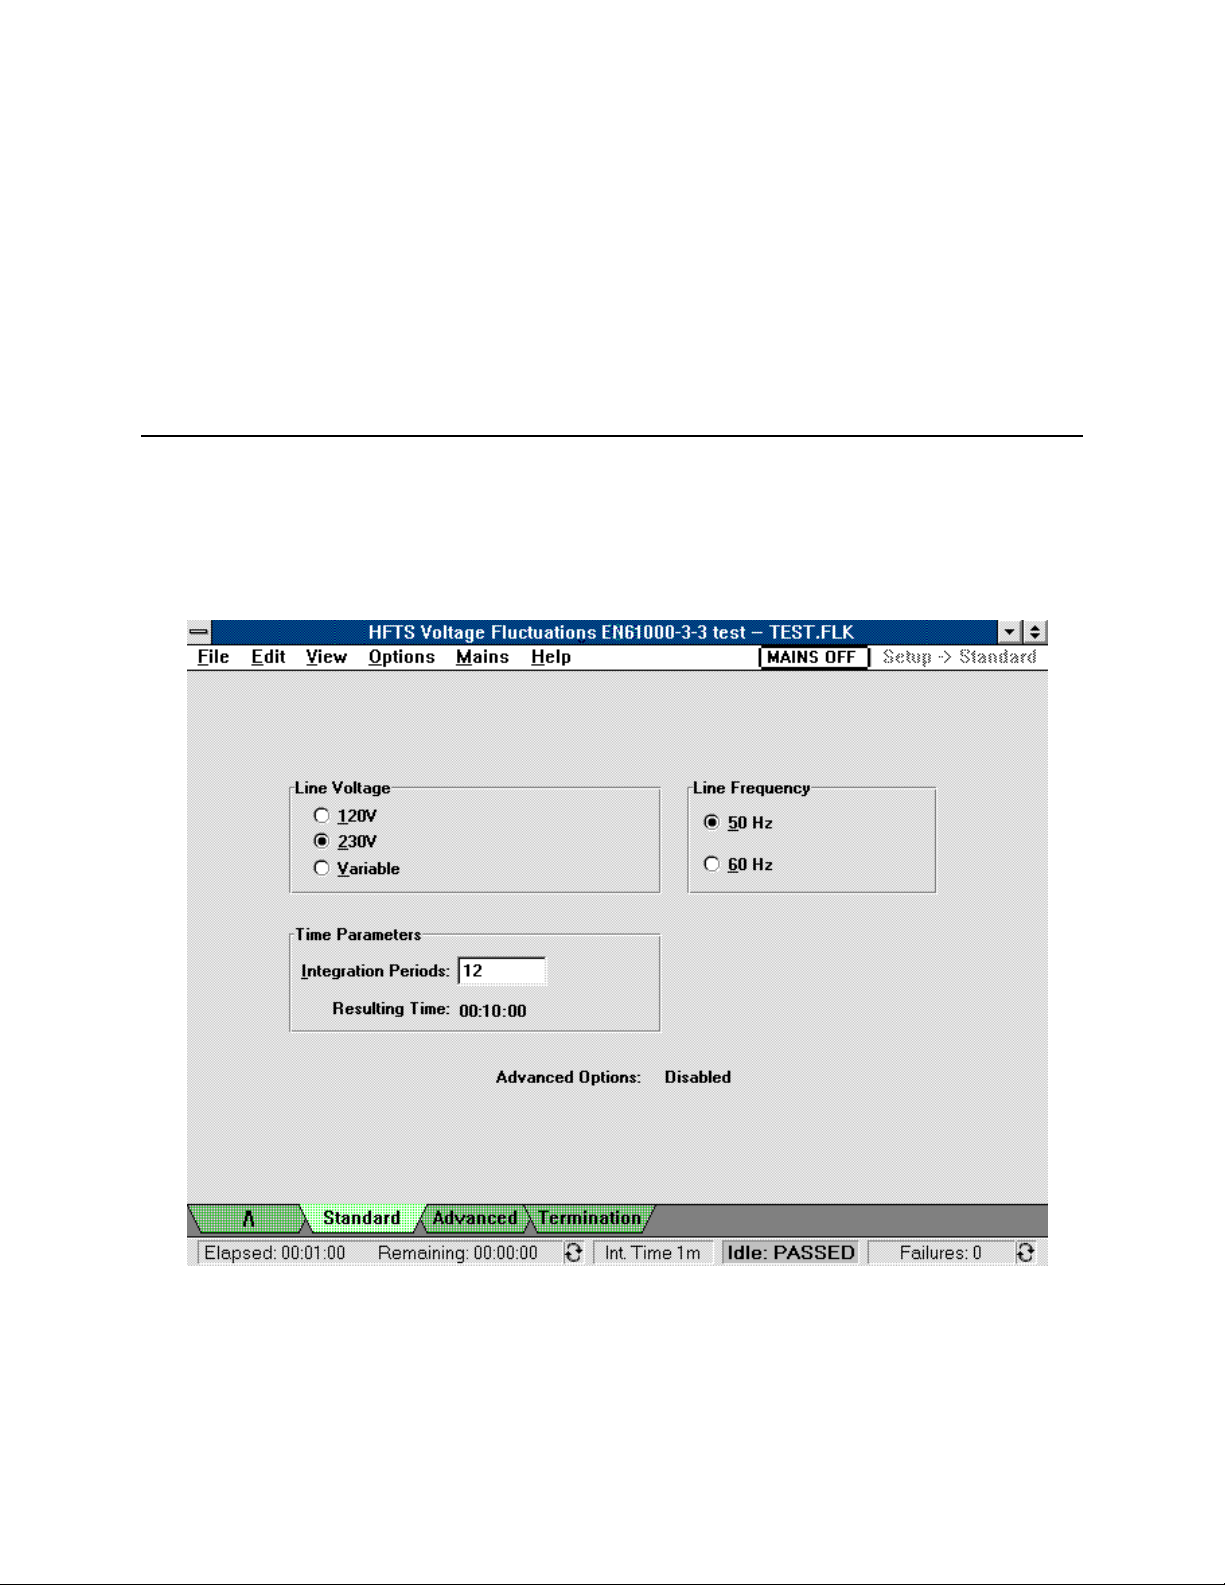
Select the Test Options for Voltage Fluctuations
Standard Test Options
Standard options specify the line voltage, line frequency, and test time for compliance tests. They are
selected in the Standard window.
ñ Select the line voltage that you will be applying to the equipment under test.
Selecting Variable lets you enter a value other than 120 Vac or 230 Vac.
ñ Select the line frequency (50 or 60 Hz) that will be applied to the equipment under test.
24
Page 25
Setting Up the Test - 3
ñ Select the number of integration periods to be acquired during the test. The Resulting Time
field displays the test duration based on the number of integration periods as well as the Pst
integration time that you have specified in the Advanced window. The Pst integration time is set
to a default of 10 minutes with the Advanced options disabled.
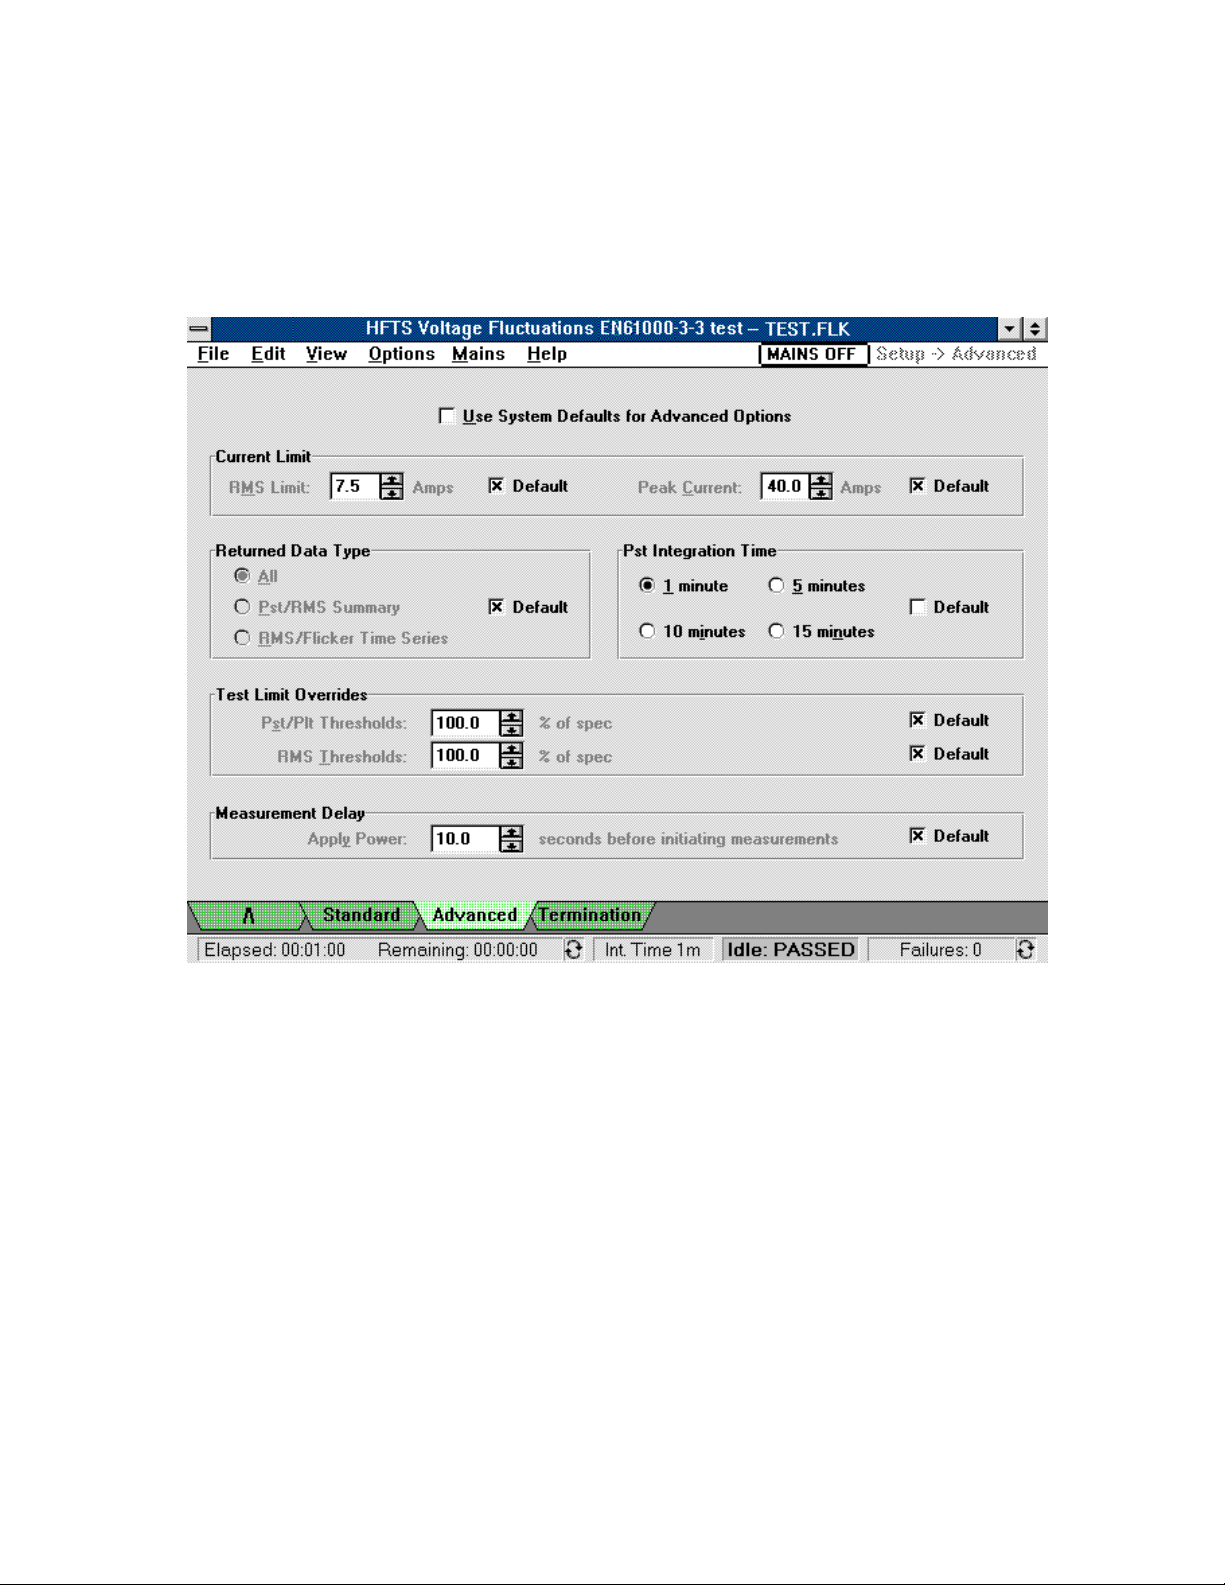
Advanced Test Options
ñ Select the rms and peak current limit of the Agilent 6800-Series AC Power Source/Analyzer that
you will be applying to the equipment under test. Generally, it is best to leave these parameters
set to their maximum default values. Although the function of the current limit is to protect the
equipment under test, if the unit does go into current limit during a normal test, the test will be
invalid.
ñ Select the returned data type (All, Pst/Rms Summary, or Rms/Flicker Time Series)
ñ Select the Pst (or short-term) flicker integration time.
ñ Select a test limit override for the Pst/Plt Thresholds (short-term/long-term flicker) and Rms
Thresholds. This is specified as a percent of the specification in the applicable regulation.
ñ Select a measurement delay from the time power is applied to the equipment under test until the
time that the Agilent 6800-Series AC Power Source/Analyzer starts measuring data.
25
Page 26
3 - Setting Up the Test
Test Termination Options
Note The following conditions terminate any test automatically if the Agilent 6800-Series AC
Power Source/Analyzer operating limits are exceeded: Rail fault condition, Overtemperature,
Overvoltage, and SOA. Refer to the ac source User’s Guide for more information.
ñ Select termination on errors. One error will terminate the test when this is selected:
UNR - when the output becomes unregulated.
ñ Select termination when the current limit is exceeded. Two current limit conditions will
terminate the test when this occurs: CL - when the output goes into current limit mode; CP when the output current limit protection has tripped.
ñ Select termination on exceeding a specified number of Pst failures
ñ Select termination on exceeding a specified number of Rms voltage failures. You can specify
Rms voltage failures: of any type
Dmax failures
Dc failures
Dt failures.
ñ Select termination on exceeding a specified number of watch events. Each event that satisfies the
selected criteria is counted as one event occurrence.
If termination On Watch Events is enabled, you can select the following Watch Items criteria:
ñ Pst values greater than the specified perceptibility units
ñ Instantaneous Flicker values greater than the specified perceptibility units
26
Page 27
4
Running the Test
Before actual test data can be acquired, the pre-test must be run. This is accomplished in the Pre-Test
window. As its name implies, the Pre-Test window centralizes functions that, following test setup, need
to be performed prior to running an actual test. This includes running preliminary tests to measure
quantities that are subsequently used to set test limits for Class C and Class D devices. Once the pre-test
data is available, the main test can be started. This is accomplished in the Test window. Test status
information is displayed in the Status bar on the bottom of the screen. Note that you must always have
pre-test results present before running the main test.
To Run a Pre-test for Quasi-stationary or Fluctuating
Harmonics
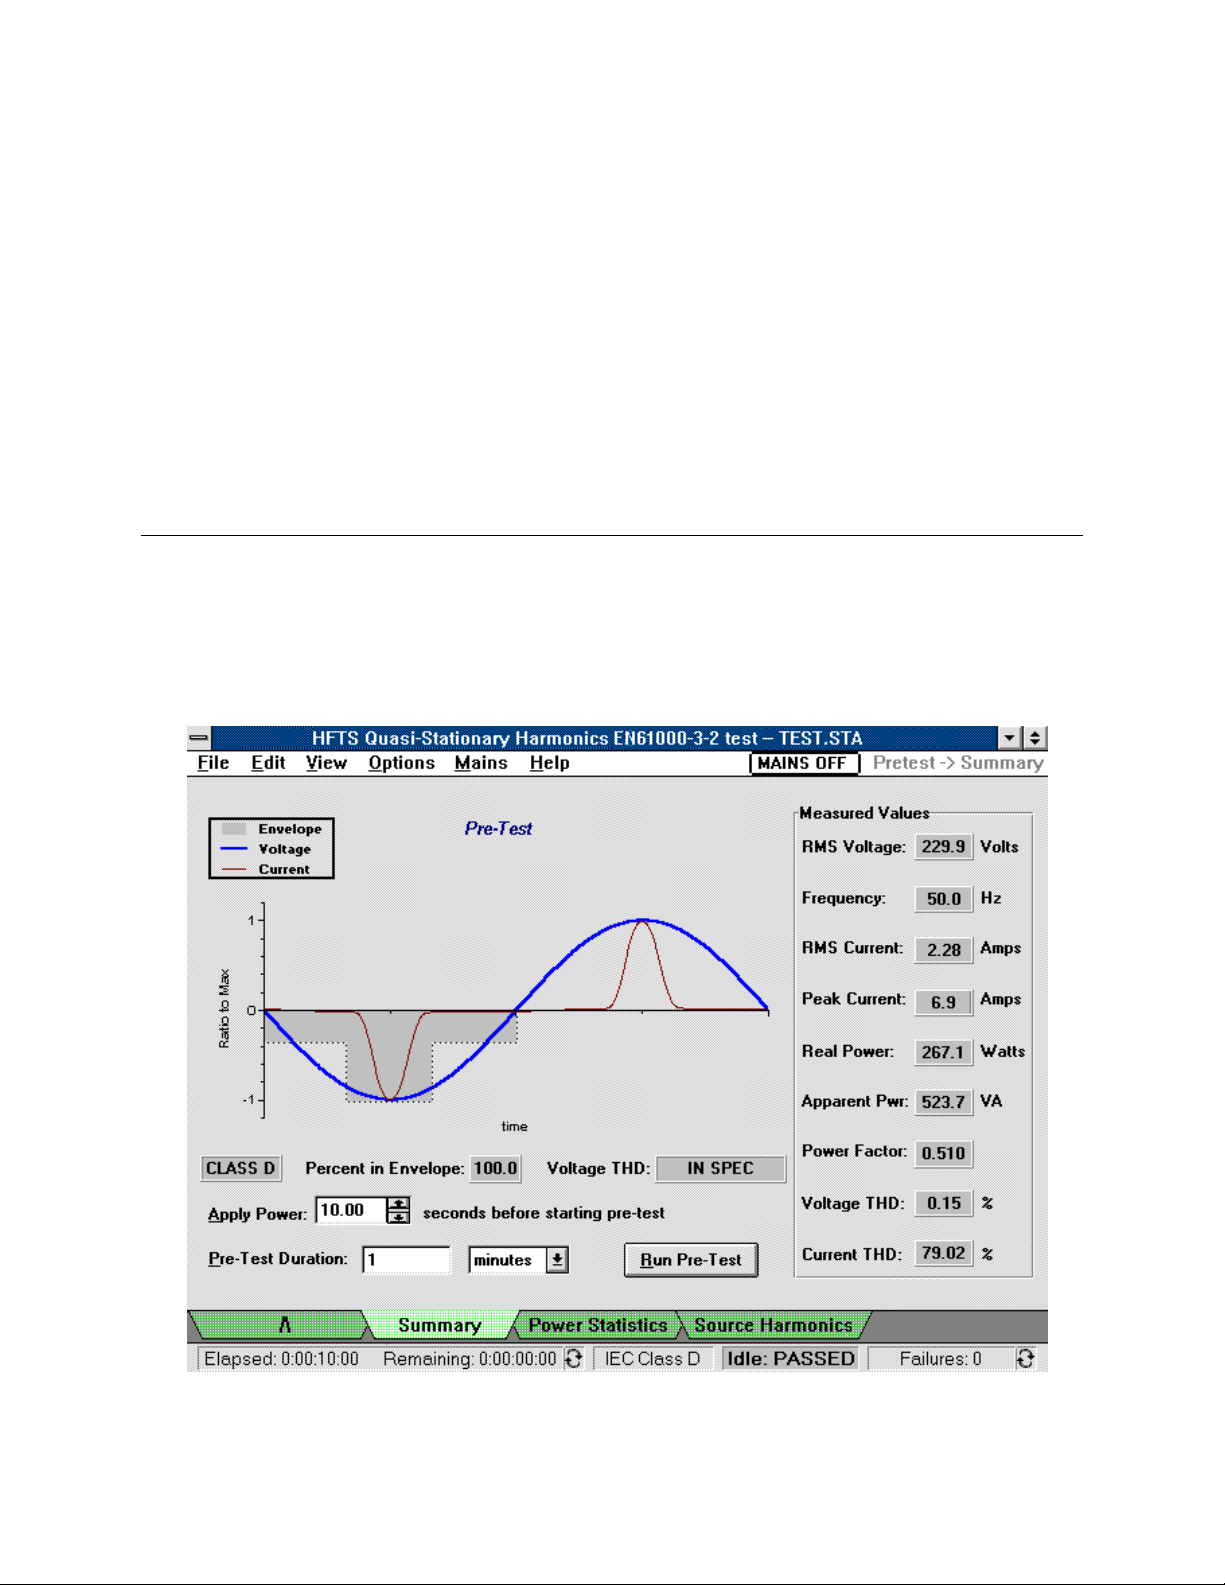
Pre-Test Summary
1. Select the Pre-test menu tab on the bottom of the screen to access the Pre-test Summary
window. You can also access the Pre-test window from the View/Pre-test menu.
2. If desired, change the time delay from when power is applied until the pre-test is run. The default
pre-test time is 10 seconds.
27
Page 28

4 - Running the Test
3. It is also possible to increase the duration of the pre-test. One purpose of running a longer pre-
test is to obtain more data over which the test results are averaged. Additional data more
accurately characterizes the worst-case operation of the equipment under test (see “Pre-test
Measurements” for more information).
4. Press the Run Pre-test button to run the pre-test.
Note Running a pre-test from a file that already contains data will not only overwrite the pre-
test data, but will also delete the existing test data.
5. Use the Print Screen command located in the File menu to print the Pre-test window.
For Quasi-stationary and Fluctuating Harmonic tests, the pre-test checks if you have correctly classified
your equipment as Class D versus any other class in the Standard Test Setup window. It displays the
input-current waveshape of the equipment under test, which lets you examine the waveshape for “fit”
into the Class D special waveshape window.
ñ The Pre-test graph displays one cycle of voltage and current, superimposed on the Class D
waveshape window. The current cycle that is superimposed in the Class D waveshape window is
the half-cycle having the highest peak value within a single 16-cycle snapshot taken at the end of
the pre-test interval (see “one-shot measurements” later in this chapter for more information).
Press the Power Statistics tab if you need to configure the active power requirements for
determining Class D limits, or if you need to display additional power measurement information.
ñ The Class Indicator displays a green background if the data collected from the equipment under
test matches the Class selection. If the data collected from the equipment under test does not
match the Class selection, the Class indicator displays a red background. In this case you should
return to the Standard Test Setup window, select the correct class, and rerun the pre-test. Refer to
appendix D for information about the class determination logic of the Agilent 14761A HFTS
software.
NOTE: Class D equipment must have input power > 75 W and ≤ 600 W, and 95% of its input-
current waveshape must fall within the Class D waveshape window. For EN 61000-3-2
testing, devices generating Class D waveforms but NOT meeting all Class D input power
criteria will be tested using Class A limit values for odd harmonics. If testing against
limits for even harmonics is also desired, select Class A. Testing a device that meets the
Class D "special waveshape" with Class A selected, results in compliant test reports if
the "Motor Driven Device" checkbox, available for EN 61000-3-2 testing, is also
selected.
ñ The Percent in Envelope indicator displays the percentage of waveform data within the Class D
waveshape standard if Class A or Class D has been selected.
ñ The Voltage THD “IN SPEC” or “OUT OF SPEC” indicator summarizes the results of testing to
determine if the output voltage of the ac source is within the harmonic voltage limits as specified
in EN 61000-3-2/EN 60555-2. The voltage THD results are based on measurements of
individual voltage harmonics up to the 40th harmonic, and a comparison of these measurements
to the limits specified in the regulations. Select the Source Harmonics tab to display the
individual worst-case voltage harmonics that occurred during the pre-test.
ñ The Measured Values area on the right side of the display summarizes nine of the most common
mains input characteristics (see “Pre-test Measurements” for more information).
28
Page 29
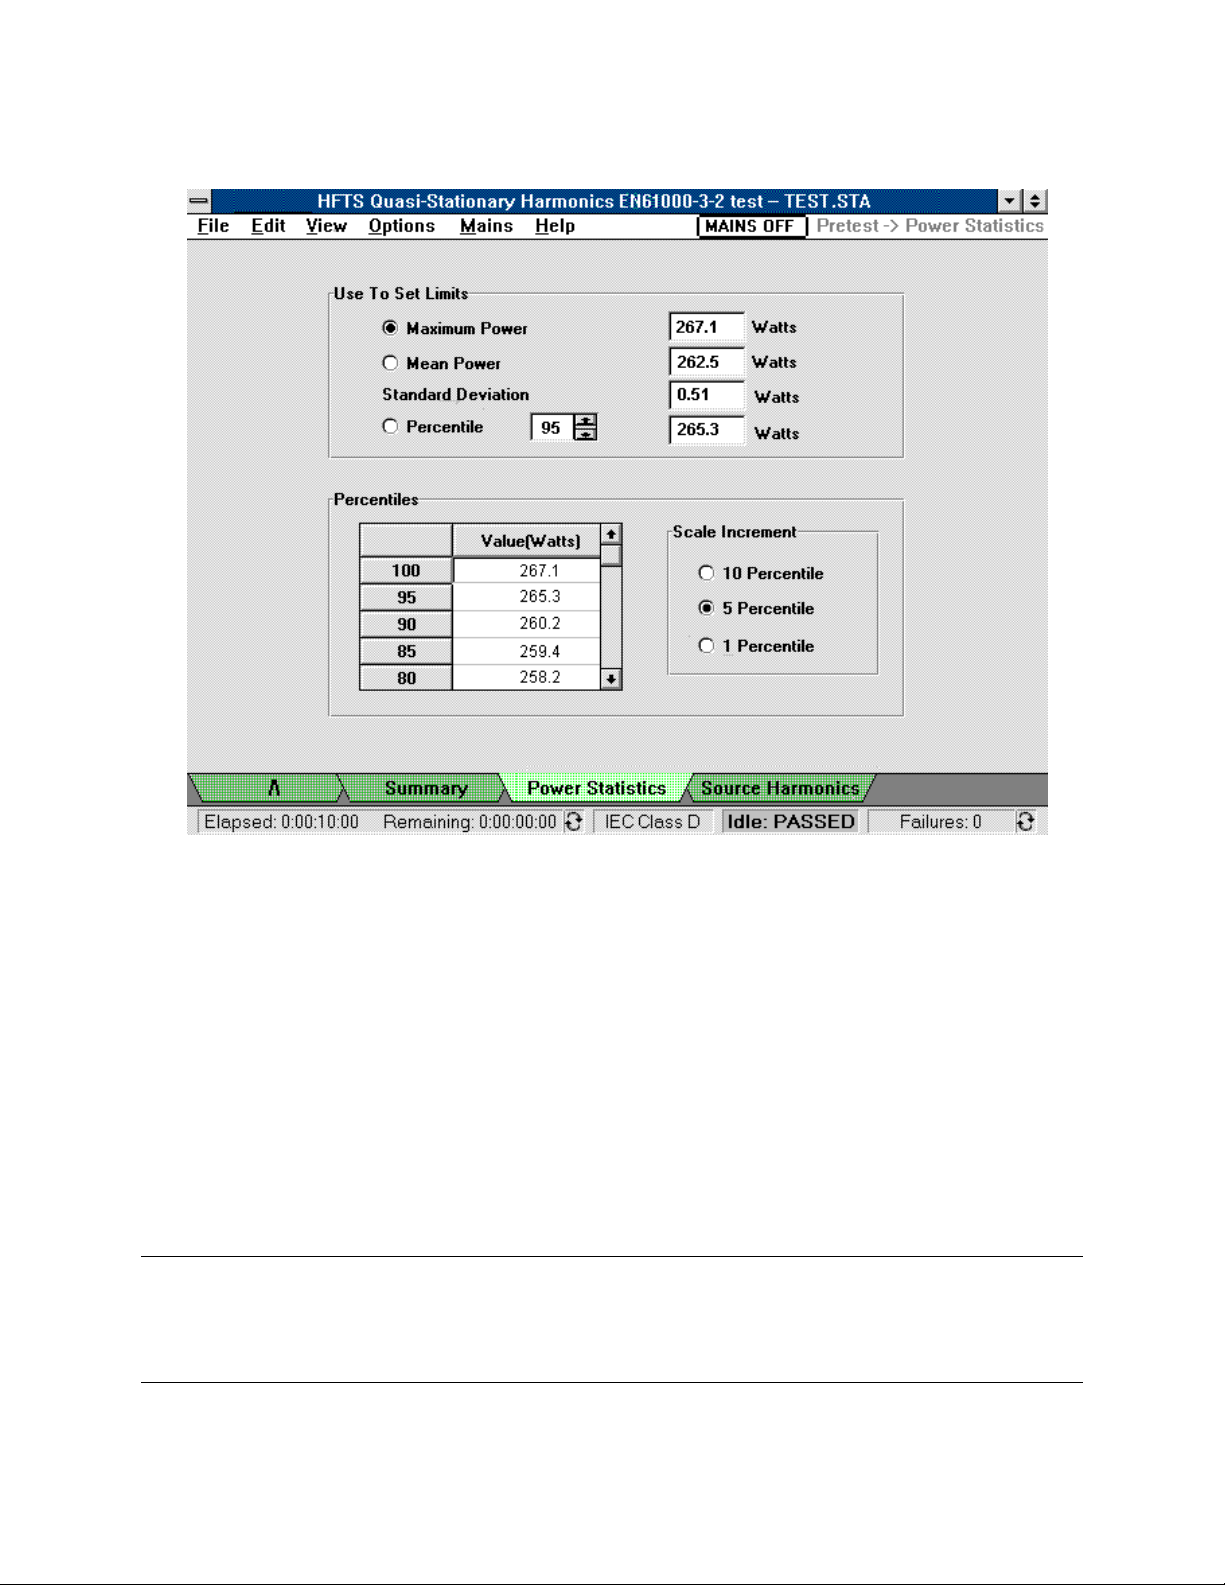
Pre-Test Power Statistics
Running the Test - 4
This screen provides additional information about the active input power of the device under test. It
displays the following power measurements, which are calculated at the end of the pre-test:
- Maximum Power in watts (default selection for setting Class D limits)
- Mean Power in watts
- Standard Deviation in watts
- specified Percentile in watts
The Percentiles area displays the results of a statistical evaluation of the active input power during the
pre-test. Percentile values are displayed according to the selected scale increment. Scale increments of
10, 5, or 1 may be specified. A scale increment of 1 displays all percentile values.
If you are testing Class D equipment, the Use to set limits area is active, letting you specify what type of
Watts measurement will be used by the Agilent 14761A HFTS software as the basis for calculating Class
D test limits. Select from: Maximum Power (the default), Mean Power, or specified Percentile. This
provides you with greater flexibility for specifying Class D test limits.
Note: Based on your selection, you can see what the Class D test limits will be by acccessing
the Display Table window. The Class D limits are shown in the Limits column.
You can also override the pre-test watts measurement later in the Advanced Test Setup
window in the Test Limit Overrides section.
29
Page 30
4 - Running the Test
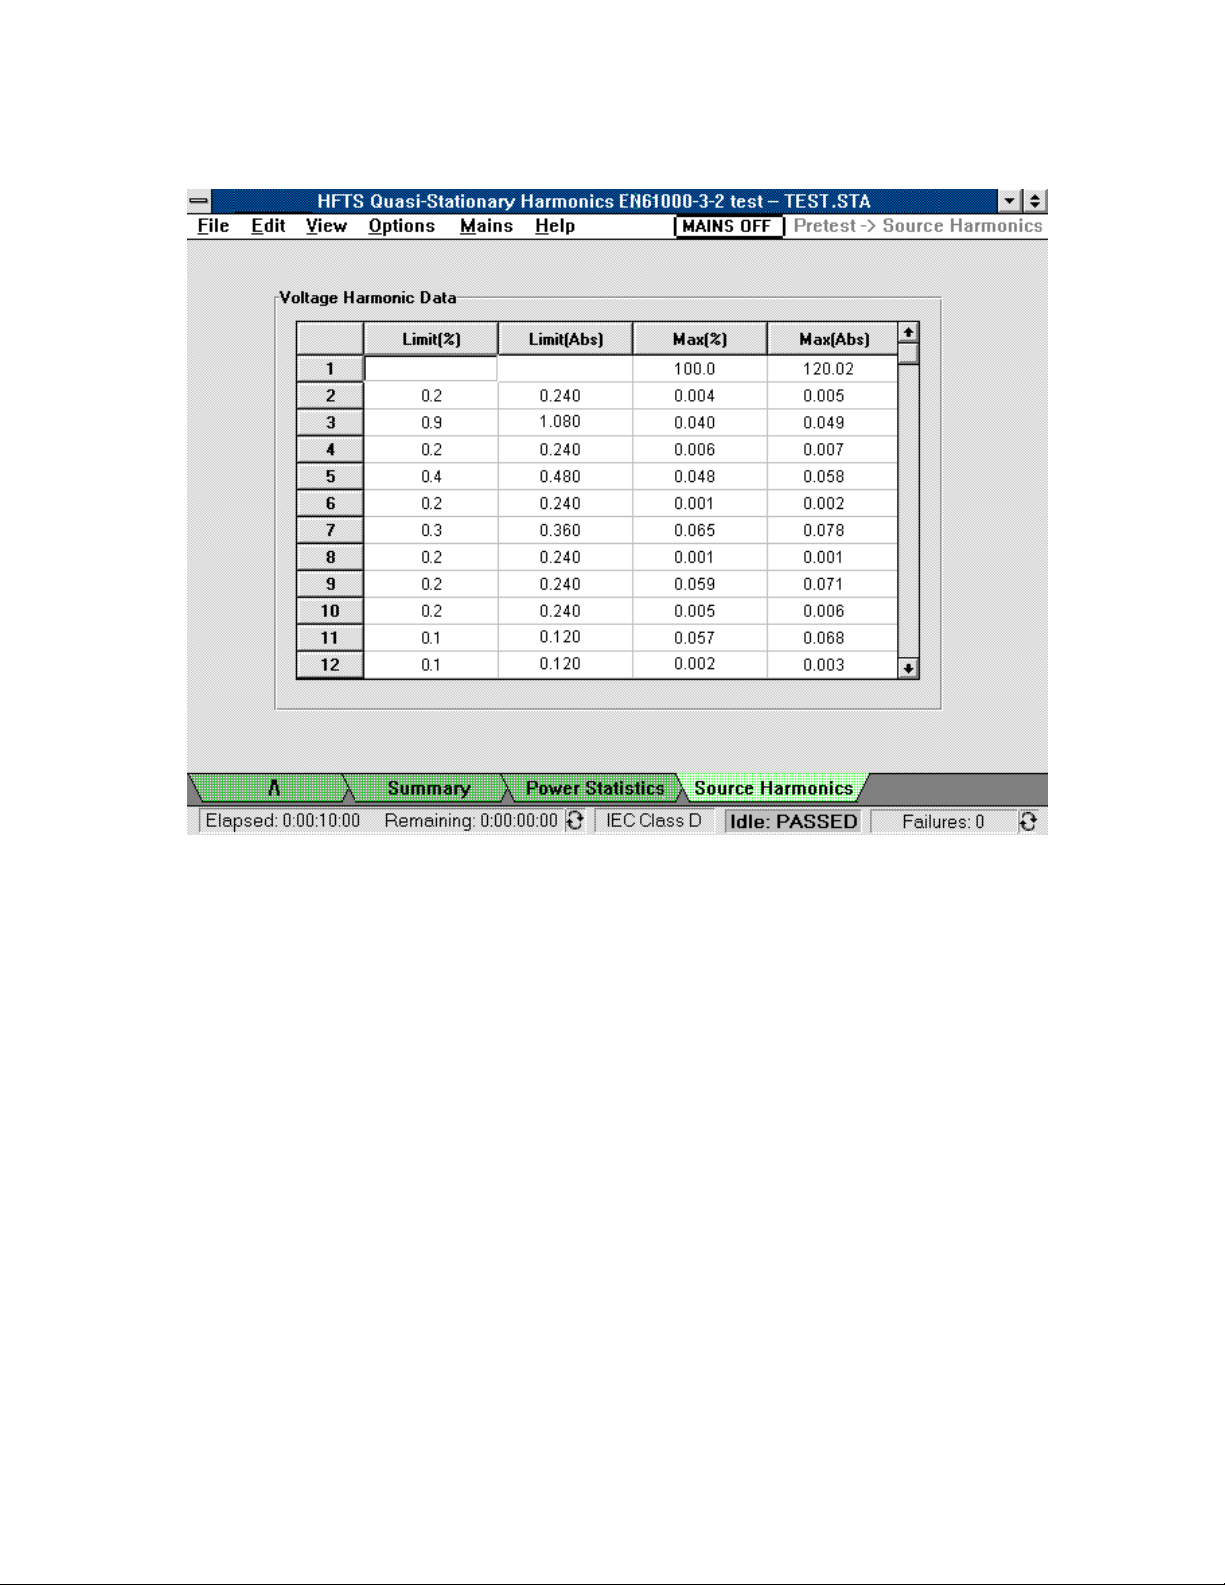
Pre-Test Source Harmonics
This screen displays the pre-test voltage data for harmonics 1-40 on a worst-case basis. The Limit(%)
column indicates the permissible limits for each harmonic expressed as percentages of the fundamental
voltage. For 230 V/50 Hz power distribution systems, these are:
- No limits for the 1st harmonic (the fundamental)
- 0.9% of V
- 0.4% of V
- 0.3% of V
- 0.2% of V
- 0.1% of V
- 0.1% of V
fundamental
fundamental
fundamental
fundamental
fundamental
fundamental
for 3rd harmonic
for 5th harmonic
for 7th harmonic
for 9th harmonic
for even harmonics from 2 to 10
for all harmonics from 11 to 40
The Limit(Abs) column indicates the permissible limits for each harmonic expressed as absolutes (in
volts). These values are obtained by multiplying the %limits divided by 100 times the measured
minimum value for the fundamental component. There are no limits for the fundamental.
The Max(%) column indicates the maximum pre-test values for harmonics 2 through 40 expressed as
percentages. These values are obtained by dividing the maximum harmonic values by the minimum
fundamental value and multiplying by 100. Failures are indicated in red.
The Max(Abs) column indicates the maximum pre-test values for harmonics 2 through 40 expressed as
absolutes (in volts). These values are simply the maximum values of the voltage harmonic data returned
during the pre-test. Failures are indicated in red.
30
Page 31

Running the Test - 4
To Run a Pre-test for Voltage Fluctuations
Pre-Test Summary
1. Select the Pre-test menu tab on the bottom of the screen to access the Pre-test Summary
window. You can also access the Pre-test window from the View/Pre-test menu.
2. If desired, change the time delay from when power is applied until the pre-test is run. The default
pre-test time is 10 seconds.
3. It is also possible to increase the duration of the pre-test. One purpose of running a longer pre-
test is to obtain more data over which the test results are averaged. Additional data more
accurately characterizes the worst-case operation of the equipment under test (see “Pre-test
Measurements” for more information).
4. Press the Run Pre-test button to run the pre-test.
NOTE: Running a pre-test from a file that already contains data will not only overwrite the pre-
test data, but will also delete the existing test data.
5. Use the Print Screen command located in the File menu to print the Pre-test window.
For the Voltage Fluctuations test, the pre-test waveform display is not required by EN 1000-3-3. It does
however, provide information about the input waveform and other measured parameters for the
equipment under test. For example, any abnormalities in the input waveform will be apparent in this
31
Page 32

4 - Running the Test
V
display. The tabular data displayed in this window provides a permanent record of the test conditions that
existed at the time of the voltage fluctuations test.
ñ The Measured Values area on the right side of the display provide a record of the test conditions
at the time the voltage fluctuations pre-test was run.
ñ The Output Impedance of the Harmonic/ Flicker Test System is automatically set to the
requirements of IEC 1000-3-3 when testing for Voltage fluctuations. For 230 V/50 Hz power
distribution systems, the reference value is 0.4 + j 0.25 Ω (lumped phase and neutral per IEC
725). This corresponds to 796 µH for the inductive component.
NOTE: The output impedance is set to a minimum during the pre-test. This is done to permit
evaluation of ac source performance under the worst-case loading condition possible for
the equipment under test.
Pre-test Measurements
Pre-test measurement data is collected using the following measurement processes:
Measurement Method Measurement Method
Rms voltage
Frequency
Rms current
Peak Current
Real power
Apparent power
Rms
One-shot
Rms
Estimated
Average
Vrms x Irms
Power factor
Voltage THD
Current THD
Voltage harmonics
Current waveform
Watts/VA
One-shot
One-shot
Peak
One-shot
Average, rms, and peak measurements are based on a long-term acquisition process that is
determined by the duration time specified in the Pre-test window. Varying the test duration time
increases the amount of data upon which the measurements are based.
ñ Average measurements are made by acquiring N measurements, totaling the acquired values, and
multiplying by 1/N.
ñ Rms measurements are made by acquiring N measurements, totaling the square of the values,
multiplying by 1/N, and then taking the square root. Vrms and Irms values returned with the pretest data are used to calculate Vrms and Irms over integration periods specified by the pre-test
duration control.
ñ Peak method measurements are made by returning the highest value obtained during the
specified integration period.
2
∑
()
Max harmonic
_
nto
=
ñ Voltage THD is calculated by:
For voltage harmonics, this is the highest rms value encountered during the pre-test for each
individual voltage harmonic.
ñ The Estimated peak current measurement is implemented by multiplying the integrated Irms
value by the crest factor of the current waveform. Crest factor is calculated by dividing the peak
THD
240
=
rms
n
100
*
32
Page 33

Running the Test - 4
value of the waveform by a one-shot rms current value obtained from the waveform data record.
The quality of this measurement is a function of the variability of the current waveform crest
factor over the integration period used for the corresponding rms current measurement.
ñ VA, and Power Factor measurements are made by using rms and average results in calculations
One-shot measurements are based on the acquisition of a single snapshot measurement, which is
acquired from a single acquisition buffer of 4096 data points. The number of cycles of the mains
frequency is determined by the mains frequency selection in the Standard Test Setup window, and the
measurement window selection in the Advanced Test Setup window. Refer to the discussion of the
MEAS:ARRAY:CURR:HARM command in Appendix C for details about the sample rate based on the
aforementioned selections. Note that one-shot measurements are not affected by test duration time.
To Run a Test
1. Select the Test menu tab on the bottom of the screen to access the Test window. Note that you
can also access the Test window from the View menu.
2. You can instruct the Agilent 14761A HFTS software to save the test data in a read-only file.
Selecting this option will permit subsequent review and analysis of the test results, but will
prevent running a new test that will overwrite the test data. This action may be taken after the
test is run by using the Lock Test File command in the File menu.
33
Page 34
4 - Running the Test
3. Select Perform post processing automatically at end of test execution to process test data
immediately after the completion of the test. Post processing is required to generate test reports
and to generate data for the Statistics and Probability displays. Depending on the length of the
test, the post processing of data may require considerable time. Alternatively, you can post
process the test data at a later time by opening the test file and pressing the Run Post processing
button.
4. Press the Run Test button to run the test.
Note The drop-down menu commands are not available while the test is running.
The Test window presents a summary of the test setup for the selected test type. The progress bar on the
screen indicates the remaining time until completion of the test. Pressing the Abort Test button lets you
abort the test at any time. All of the information up to the time that the test is aborted is saved in the data
file.
If Perform post processing automatically is checked, post processing will automatically be performed
on all test data even if the test is aborted.
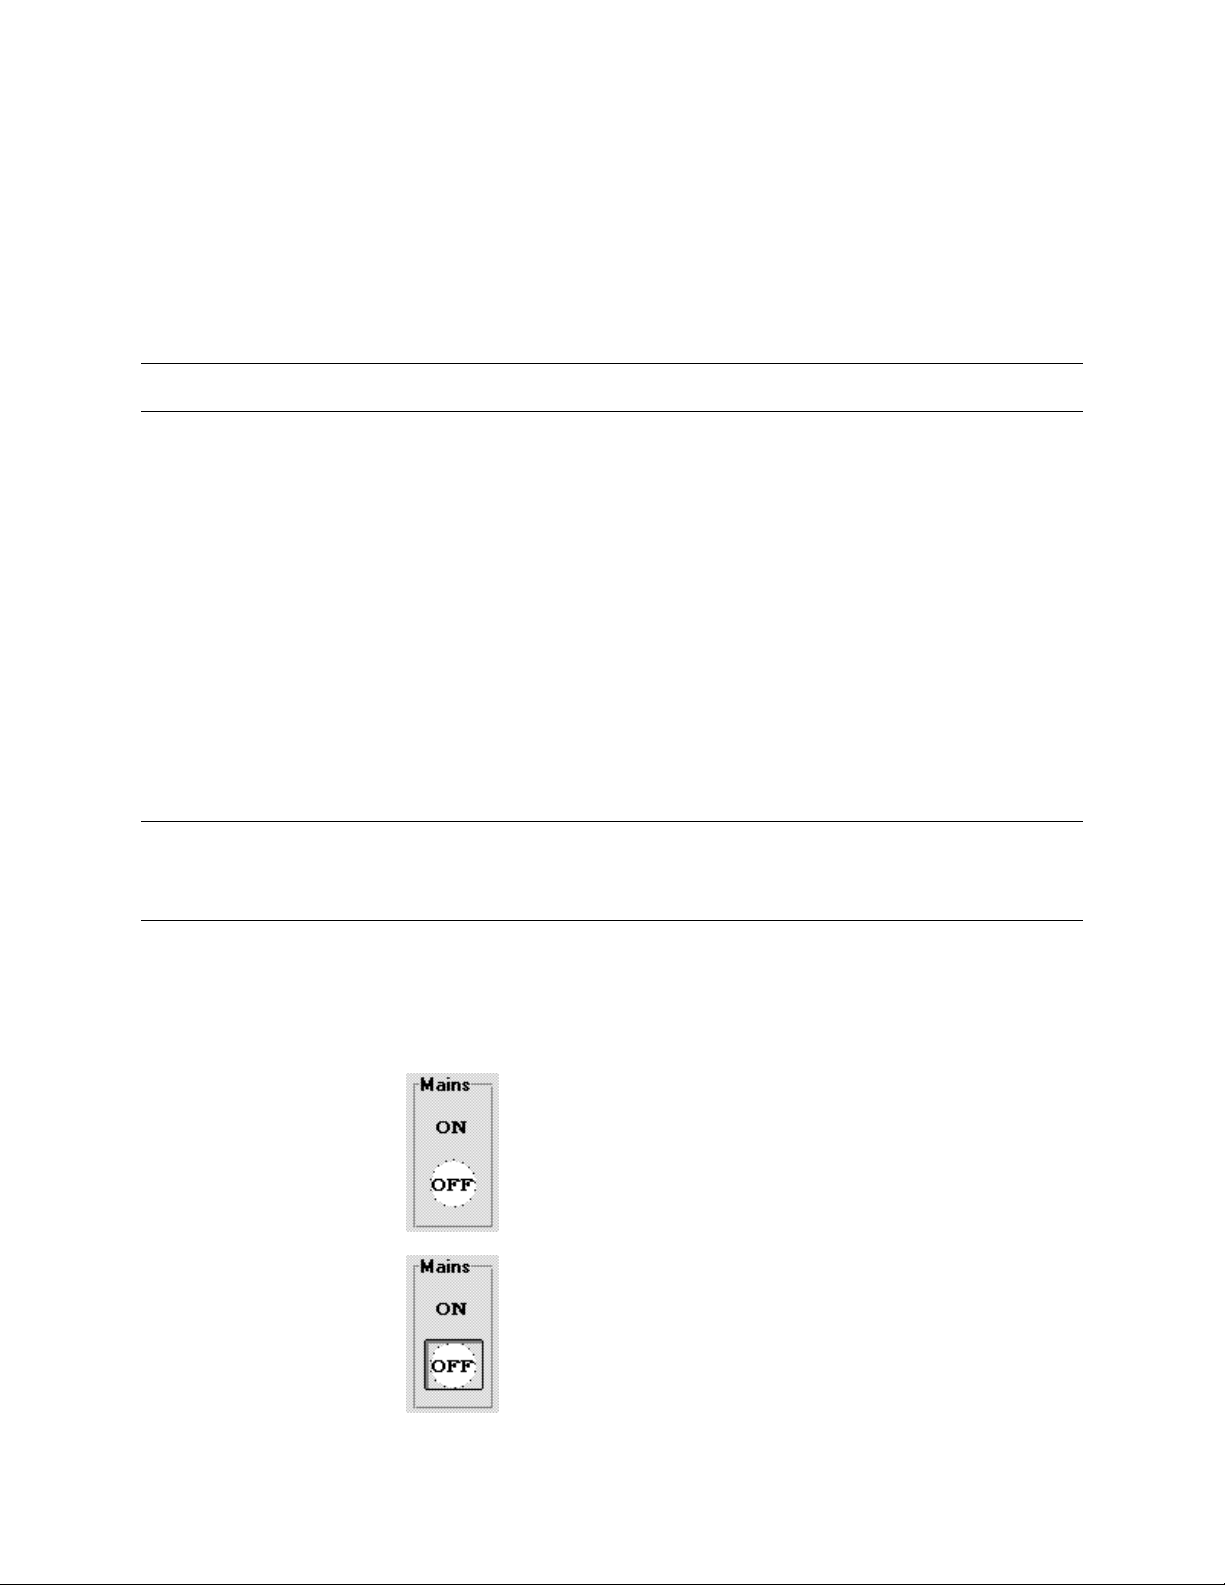
The Mains control lets you control the output from the Agilent 6800-Series AC Power Source/Analyzer.
This software control acts the same as the Output On/Off button on the front panel of the unit. Use the
Mains menu to configure the Mains control. Pushbuttons appear in the mains control area when it is
active. When the control is inactive, the pushbuttons do not appear but are replaced by a round circle that
indicates the output state. A white circle indicates the output is off. A red circle indicates the output is
on. The Mains field on the menu bar at the top of the screen also indicates the present state of the output.
Note If you use the Output On/Off button on the front panel of the unit to turn the output on or
off, the Mains control does not reflect the changed condition on the output until you exit
and then re-enter the Test window. This action updates the Mains control display.
Configure the Mains control using the Mains menu. Note that the configuration of the Mains control
is saved when you exit the Agilent 14761A HFTS software. When you run the Agilent 14761A HFTS
software again, the unit will wake up with the output set according to the state in which you left the
Mains switch .
Auto On/Auto Off
The output of the Agilent 6800-Series AC Power
Source/Analyzer is automatically controlled by the Agilent
14761A HFTS software while pre-tests and tests are
running. No pushbuttons appear on the control. The pictured
control indicates that the output is presently off.
Auto On/Manual Off
The OFF pushbutton is active, letting the operator manually
turn the output of the Agilent 6800-Series AC Power
Source/Analyzer off from the Test window. The output is
never automatically removed from the equipment under test
if Auto On/Manual Off is selected. The pictured control
indicates that the output is presently off.
34
Page 35

Running the Test - 4
Manual On/Auto Off
(see caution)
Manual On/Manual Off
(see caution)
CAUTION: To guarantee uninterrupted ac power to the device under test when using Manual On mode,
it is essential to place the Agilent 6800-Series AC Power Source/Analyzer in IEC mode
before applying power to the device under test. In other words, do not apply power to the
device under test unless you are already running the Agilent 14761A HFTS software.
The ON pushbutton is active, letting the operator manually
turn the output of the Agilent 6800-Series AC Power
Source/Analyzer on from the Test window. The pictured
control indicates that the output is presently off.
Both OFF and ON pushbuttons are active, providing full
manual control of the output of the Agilent 6800-Series AC
Power Source/Analyzer from the Test window. When
Manual On/Manual Off is selected, the operator must use
the Mains control to manually apply and remove the ac
output from the equipment under test. The pictured control
indicates that the output is presently off.
Test Status Information
Refer to the Status Bar on the bottom of the screen for more information about the test. The status bar
contains the following information:
Elapsed:
Remaining:
or
Records:
Remaining:
IEC Class
or
INT:Time
Idle
or
Running
Errors
or
Failures
This field displays the elapsed time of the test and the remaining time of the
test. It may also display the number of data records that have accumulated
since the start of the test and the number yet to be acquired.
Clicking on switches between Elapsed/Remaining time and
Records/Remaining.
During compliance testing for Quasi-stationary or Fluctuating harmonics,
this field displays the device class that you selected in the Standard testsetup window. During compliance testing for Voltage fluctuations, this field
displays the Pst integration time that is specified in the Advanced test-setup
window .
This field displays whether the test is idle or running. It also indicates if a
test has been aborted.
This field displays a running total of errors and failures that occur when the
test is running.
Clicking inside this field with the mouse brings up a dialog box that displays
a more complete report of failure types and errors.
Clicking on
and the number of Failures.
switches the status bar field between the number of Errors
35
Page 36

4 - Running the Test
Validation Mode
Validation Mode is a special mode used to validate the software, hardware, and test method used to test
to the harmonic current emissions regulation. It is not intended to be a formal proof of performance.
Validation Mode should only be used with the Quasi-Stationary Harmonics test type selected. It cannot
be used with Voltage Fluctuations. Additionally, validation of Voltage Fluctuations can be accomplished
without running Validation Mode.
Note Validation Mode is intended to be used with a high-power resistive load connected to the
6800-Series AC Power Source/Analyzer output, and should never be used with typical
equipment under test connected to the output. The 6800-Series AC Power
Source/Analyzer must have firmware revision A.00.07 or later.
To access Validation Mode:
1. Click on the Options drop-down menu at the top of the screen.
2. Click on “Validation Mode” to place a check mark next to the menu item. The checkmark indicates
that Validation Mode is on.
3. Run the harmonic current Pre-test or Test with Validation Mode turned on. Validation Mode limits
the Pre-Test and Test duration to a maximum of 30 seconds.
The intent of Validation Mode is to provide a controlled output current of known harmonic content,
which is subsequently measured during a harmonic current test. This is accomplished by applying the
Gibbs Phenomenon to an output voltage squarewave. In this case, the resulting validation waveform is a
squarewave function with all harmonic content above the 39
th
harmonic removed. The waveform has
overshoots and ringing near the square wave transitions. This output voltage is used to drive a highpower resistive load, resulting in an output current of known harmonic content.
The harmonic current test methodology can be validated by comparing the measured test results from a
30 second harmonic current test with the known theoretical values of the validation waveform. The
measured test results must be evaluated to ensure the measurements do not exceed the total error allowed
by the harmonic current emissions regulation. Contact your local Agilent Sales and Support Office for
more information.
36
Page 37

5
Viewing Test Data
During test runs, data is continuously acquired and displayed in the various Display windows. Use the
menu tabs on the bottom of the screen or the View menu to access the various displays. Use the
Navigator toolbar on the top of the screen to scroll through the test record or search for specific test data
in the test record.
Note Refer to chapter 7 for information on printing graphs, tables and reports. Chapter 7 also
explains how to print reports to a file.
Navigator Toolbar
The toolbar on the top of the screen, referred to as the Navigator toolbar, contains the following controls:
Rolling |
Fixed
Zoom | Span
Cursor
This control toggles between Rolling and Fixed. Rolling indicates that the
display is continually being updated with the latest data. Fixed indicates that
either the test has completed, or the display is not presently being updated with
new data. If a test is underway , the test is still busy collecting data in the
background although the display has stopped updating.
Clicking on Rolling stops updating the display and sets the control to “Fixed”.
If a test is presently underway, clicking on Fixed returns the display to
“Rolling“, where the display resumes being updated with the latest data. When
the test has completed the control remains set to “Fixed”.
This field is only active when the display is set to Fixed.
Span lets you specify the range of test data that you want to examine. The span
can be specified in units of time (seconds, minutes, or hours) or by data record.
Refer to the Glossary for more information about the information contained in
each data record according to test type.
Zoom lets you zoom in on individual data values in the time-series test data
displays.
Clicking on
This field is only active when the display is set to Fixed. It lets you position the
cursor at a specific location in the test data. You can position the cursor by time
or at a specific data record. Refer to the Glossary for more information about the
information contained in each data record according to test type.
switches between units of time and record number.
37
Page 38

5 - Viewing Test Data
Search
Parameters
Reset Max
Scroll Bar
For Quasi-stationary or Fluctuating harmonic tests, the following data display formats are available:
Graph, Table, Time-Series, Statistics, and Probability. Information appears in the Statistics and
Probability windows only after the test has completed and post processing has been performed.
This control is only active when the display is set to Fixed. It puts up a dialog
box that lets you search for specific items in the test data that you are presently
viewing. Clicking on the red button initiates a search backward in time from
the present cursor location. Clicking on the red ® button initiates a search
forward in time from the present cursor location.
This control only applies to the harmonic Graph and Table displays. It is only
active when the display is set to Rolling. It resets the maximum values in the
Graph and Table displays to the to the present value, which eliminates any
previous peak hold settings.
Note that this button only affects the display; it does not change any of the test
data that is being stored in the database by the present test.
The scroll bar is only active when the display is set to Fixed. It lets you access
all of the data in the test. Clicking on the black and ® buttons slides the scroll
button through the data. Each time the and ® buttons are clicked, the
cursor moves one data record. You can also click on the scroll bar to move the
button through the data, or drag the button directly. Each time the scroll bar is
clicked, the cursor moves one span width.
For Voltage Fluctuations tests, the following data display formats are available: Pst, Probability,
Distribution, RMS, and Flicker. Data in the Pst, Probability, and Distribution windows is updated only
at the end of each integration period or at the end of the test.
Viewing Quasi-stationary and Fluctuating Harmonics
Graph Display
The Graph display is used to view quasi-stationary or fluctuating harmonic data. Note that the amount of
test data displayed in the graph may be limited by the Span control. See “Using the Span Control” in
chapter 6 for details.
Note To edit the graph, click with the right mouse button on any area of the graph. This puts
up the Edit Graph Attributes dialog box, which lets you configure items such as the
graph axes and the graph span. Refer to “Editing the Graph Attributes” later in this
chapter for details.
38
Page 39

Viewing Test Data - 5
The Graph display presents the following test data in a graphical format:
ñ 40 harmonics including the fundamental, along the X axis.
ñ the harmonic magnitude along the Y axis in absolute values. You can edit the graph to display
the data according to % of limit on the Y-axis as described in the next section.
ñ the maximum measured value of each harmonic is indicated by the height of each bar. When
the test is running (Rolling mode), the top of the bar is the maximum peak-hold value. When the
test has finished or if Fixed mode is selected during a test run, this value is the maximum value
within the selected span.
Light green indicates that the maximum value is within the regulation’s specification. Light red
indicates that one or more measured values are outside the specification.
ñ the present value of each harmonic is indicated by the solid part of each bar. When the test is
running (Rolling mode), this value is always the latest measured value. After the test has
finished, or if Fixed mode is selected during a running test, this value is the value at the present
cursor location.
Green indicates that the present value is within the regulation’s specification.
Red indicates that the present value is outside the specification.
ñ detailed information on any bar can be obtained by holding down the Shift key and double-
clicking on a bar. This highlights the selected bar in white and puts up a dialog box which
displays a complete report of data points, failure types, and errors for the selected harmonic.
39
Page 40

5 - Viewing Test Data
Displaying Data According to % of Limit on the Y-Axis
Click with the right mouse button on any area of the graph. This puts up the Edit Graph Attributes dialog
box, in which you can reformat the y axis to display the data in percent of the specification limits rather
than in absolute values. In this case the display appears as follows:
The red line that appears across the display indicates the specification’s limits. All values above the line
are outside the specification’s limits.
Search Parameters
When the display is set to Fixed, you can perform search functions on specific test data. Search options
let you
ñ Search for specific items such as:
single failures
2.5 minute failures (only applies to fluctuating harmonics)
all failures (only applies to fluctuating harmonics)
harmonic magnitudes > than the specified value (specify AMPS or % of Spec. in the Edit
Graphs dialog box)
ñ specify Harmonic Selection criteria for the following harmonics:
Odd harmonics
Even harmonics
Odd ≤ 19 harmonics
All harmonics
Nth harmonic (specify a harmonic number)
40
Page 41

Viewing Test Data - 5
Table Display
The Table display is used to view Quasi-stationary or Fluctuating harmonic data. Note that the amount
of test data displayed in the table may be limited by the Span control. See “Using the Span Control” in
chapter 6 for details.
Note: You must have run post-processing in the Test window to generate data for the standard
deviation column as well as the 50%, 75%, 90%, and 95% failure count columns of the
table. This information is calculated from all of the test data after the test completes.
The Table display presents the following test data for each of the 40 harmonics in a tabular format:
ñ the harmonic number is indicated in the left-most column.
ñ the regulation’s harmonic limits.
ñ the magnitude of the most recently measured harmonic in amperes and as a percent of either the
regulation’s harmonic limits or the limits derived from the user-specified limit overrides.
ñ the mean value of data within the span in amperes and as a percent of the regulation’s limits.
ñ the standard deviation of each harmonic within the span in amperes and as a percent of the
regulation’s limits.
ñ the maximum peak value of each harmonic within the span in amperes and as a percent of the
regulation’s limits.
41
Page 42

5 - Viewing Test Data
ñ the number of failures for individual harmonics in the test to-date, as well as the number of
failures for individual harmonics in the 2.5 minute window criteria.
ñ the failure count that exceeds 50%, 75% , 90%, and 95% of the regulation’s limits.
Failures are indicated in red and are enclosed in parentheses. When the data is sent to a printer, failures
are enclosed in parentheses. Color printers will also print errors in red.
Search Parameters
When the display is set to Fixed, you can perform search functions on specific test data. Search options
let you:
ñ Search for specific items such as:
single failures
2.5 minute failures (only applies to fluctuating harmonics)
all failures (only applies to fluctuating harmonics)
harmonic magnitudes > than the specified value (specify AMPS or % of Spec. in the Edit
Graphs dialog box)
ñ specify Harmonic Selection criteria for the following harmonics:
Odd harmonics
Even harmonics
Odd ≤ 19 harmonics
All harmonics
Nth harmonic (specify a harmonic number)
Time-Series Display
The Time-series display is used to view quasi-stationary or fluctuating harmonic data of a specific
harmonic. Depending on the selected zoom factor, each bar may represent a single data point, or multiple
data points. For example, if the zoom factor is 1:10 (shown as 10 in the zoom field), each bar represents
10 data points.
Note To edit the graph, click with the right mouse button on any area of the graph. This puts
up the Edit Graph Attributes dialog box, which lets you configure items such as the
graph axes, the zoom factor, and lets you select a specific harmonic to review. Refer to
“Editing the Graph Attributes” later in this chapter for details.
42
Page 43

Viewing Test Data - 5
The Time-series display presents the following data for the selected harmonic:
ñ the total time of the selected span along the X axis.
ñ the magnitude of the specified harmonic along the Y axis in absolute values. You can edit the
graph to display the data according to % of limit on the Y-axis as described in the following
section.
If the bar is green, it means that the present value is within the regulation’s specification. If the
bar is red, it means that the present value is outside the regulation’s specification.
ñ You can zoom in on any area of the graph by drawing a zoom area with the left mouse button
and then double-clicking inside the area. The zoom has a minimum range of one data point per
bar, and a maximum range of 10 minutes within the total display window.
The red line that appears across the display indicates the specification’s limits. All values above the line
are outside the specification’s limits.
The blue line indicates the maximum measured value within the range selected by the zoom control.
Note By definition, there are no limits for Harmonic #1 (the fundamental). All bars will be
green, and the red line indicating the specification limits will not appear.
43
Page 44

5 - Viewing Test Data
Displaying Data According to % of Limit on the Y-Axis
Click with the right mouse button on any area of the graph. This puts up the Edit Graph Attributes dialog
box, in which you can reformat the y axis to display the data in percent of the specification limits rather
than in absolute values. In this case the display appears as follows:
The red line that appears across the display indicates the specification’s limits. All values above the red
line are outside the specification’s limits.
Note By definition, there are no limits for Harmonic #1 (the fundamental). No data will appear
in the graph when viewing harmonic #1 according to % of limit on the Y-axis.
Search Parameters
When the display is set to Fixed, you can perform search functions on specific test data. Search options
let you:
ñ Search for specific items such as:
single failures
2.5 minute failures (only applies to fluctuating harmonics)
all failures (only applies to fluctuating harmonics)
harmonic magnitudes > than the specified value (specify AMPS or % of Spec. in the Edit
Graphs dialog box)
44
Page 45

Viewing Test Data - 5
Statistics Display
The Statistics display presents a summary of the Quasi-stationary or Fluctuating harmonic data for the
entire test.
Note: If no data appears in this display, go back to the Test window and press the Run Post
processing button to generate the statistics data. Statistics are generated from all of the
test data when the test run is complete.
The following data is presented for each of the 40 harmonics including the fundamental:
ñ the mean in both absolute amperes and as a percent of the regulation’s limits for each harmonic.
ñ the standard deviation of each harmonic in both absolute amperes and as a percent of the
regulation’s limits.
ñ the maximum peak value of each harmonic in both absolute amperes and as a percent of the
regulation’s limits.
ñ the number of failures for individual harmonics as well as the number of failures for individual
harmonics in the 2.5 minute window criteria.
ñ the failure count that exceeds 50%, 75% , 90%, and 95% of the regulation’s limits.
Failures are indicated in red and are enclosed in brackets. When the data is sent to a printer, failures are
enclosed in parentheses. Color printers will also print errors in red.
45
Page 46

5 - Viewing Test Data
Probability Display (for Quasi-stationary or Fluctuating harmonics)
The Probability display shows the cumulative failure probability (or percentile) of the quasi-stationary or
fluctuating harmonic data for the entire test.
Note: If no data appears in this display, go back to the Test window and press the Run Post
processing button to generate the probability data.. Probability calculations are
performed from all of the test data.
The following data is presented for each of the 40 harmonics:
ñ the mean in amperes and as a percent of the regulation’s limits for each harmonic.
ñ the standard deviation of each harmonic in amperes and as a percent of the regulation’s limits.
ñ magnitudes for the 50th, 90th, 95th, 99th, and 100th percentiles in amperes and as a percent of
the regulation’s limits.
Failures are indicated in red and are enclosed in brackets. When the data is sent to a printer, failures are
enclosed in parentheses. Color printers will also print errors in red.
46
Page 47

Viewing Test Data - 5
Viewing 2.5 Minute Window Failures
For fluctuating harmonic tests, limit values are more complex than those for quasi-stationary harmonics.
The regulation for fluctuating harmonics allows values up to 1.5 times the limits for quasi-stationary
harmonics during a maximum of 10% of any observation period of 2.5 minutes. This corresponds to 15
seconds.
A 2.5 minute sliding window is used to check that values between 100% and 150% of the regulation’s
limits do not persist for more than 15 seconds in any 2.5 minute window. If this limit is exceeded, then
that particular harmonic has failed the test.
The 2.5 minute window applies to both the Graph and the Time Series displays. The failure band is
defined by the area between the yellow line, which indicates 100% of the regulation’s limits; and the red
line, which indicates 150% the regulation’s limits. The following conditions are valid for the 2.5 minute
window failure band:
ñ Bars that stop below the yellow line (100% of the regulation’s limits) are always green.
ñ Bars that appear between the yellow line and the red line (150% of the regulation’s limits) may
be either red or green. A bar is green if the total number of values within the two lines occur
during a time period of 15 seconds or less within the 2.5 minute window prior to the present
cursor location. A bar is red if the total number of values within the two lines occur during a
time period greater than 15 seconds within a 2.5 minute window prior to the present cursor
location.
ñ Bars that continue above the red line are always red. These values have exceeded 150% of the
regulation and represent individual failures by themselves.
Important Values that exceed 150% of the regulation are not included in the calculations that
determine the maximum event count that cannot exceed 10% of any 2.5 minute window.
47
Page 48

5 - Viewing Test Data
2.5 Minute Failures On the Gr aph Display
2.5 Minute Failures On the Time-Series Display
48
Page 49

Viewing Test Data - 5
Viewing Voltage Fluctuations
Pst Display
The Pst display is used to view voltage fluctuations and flicker data. When the test is running, the Pst
display is updated at the completion of each integration period. Note that the amount of test data
displayed may be limited by the Span control. See “Using the Span Control” in chapter 6 for details.
Note To edit the graph, click with the right mouse button on any area of the graph. This puts
up the Edit Graph Attributes dialog box, which lets you configure items such as the
graph axes and the graph span. Refer to “Editing the Graph Attributes” later in this
chapter for details.
The Pst display presents the following test data:
ñ Pst, and the five component percentile values used to derive Pst, for the selected integration
period along the X axis.
ñ the magnitude of Pst and the component percentiles in flicker perceptibility units along the Y
axis (Pst=1 is the threshold of irritability)
ñ the maximum measured value of each component by integration period is indicated by the
height of each bar. When the test is running (Rolling mode), this value is the maximum peakhold value. After the test has finished, or when Fixed mode is selected during a running test, this
value is the maximum value within the selected span. The span control indicates how many
integration periods are represented in the display.
49
Page 50

5 - Viewing Test Data
Light green indicates that the maximum value is within the regulation’s specification. Light red
indicates that one or more measured values are outside the regulation’s specification. The
maximum component percentiles are always light green, since no failure criteria is specified for
these by the regulation.
ñ the present value of each component is indicated by the solid part of each bar. When the test is
running (Rolling mode), this value is always the latest measured value. After the test has
finished, or if Fixed mode is selected during a running test, this value is the value at the present
cursor location within the selected span. The cursor indicates the presently displayed integration
period or test time.
Green indicates that the present value is within the regulation’s specification. Red indicates that
one or more measured values are outside the regulation’s specifications. The component
percentiles are always green, since no failure criteria is specified for these by the regulation.
ñ detailed pst information can be obtained by holding down the Shift key and double-clicking on
the Pst bar. This puts up a dialog box which indicates the number of Pst failures in the selected
span, the Perceptibility Unit value at the present cursor location, and the minimum and maximum
Perceptibility Unit values in the selected span.
ñ the Rms Measurement area on the bottom of the screen provides a summary value of
Dmax, Dc, and Dt failures. Summary values are the maximum value for each type within the
presently displayed integration period. If dashes are displayed in the Rms Measurement area, it
means that the test either never achieved or never exited the “steady-state” required by the
regulation. Refer to the Glossary for information about steady-state.
Search Parameters
When the display is set to Fixed, you can perform search functions on specific test data. Search options
let you:
ñ Search for specific summary items such as:
Pst according to perceptibility units
Dmax as a percent of the nominal voltage
Dc as a percent of the nominal voltage
Dt by time threshold (seconds).
You can specify searches by Failures, or by Magnitudes > than the specified value.
Probability Display (for Voltage Fluctuations and Flicker)
The Probability display presents a summary of the cumulative probability of the voltage fluctuations data.
When the test is running, the Probability display is updated at the completion of each integration period.
Note that the amount of test data displayed may be limited by the Span control. See “Using the Span
Control” in chapter 6 for details. The Search Parameters control is not active in this display.
Note To edit the graph, click with the right mouse button on any area of the graph. This puts
up the Edit Graph Attributes dialog box, which lets you configure items such as the
graph axes and the graph span. Refer to “Editing the Graph Attributes” later in this
chapter for details.
50
Page 51

Viewing Test Data - 5
The Probability display presents the following test data:
ñ the magnitude of flicker perceptibility along the X axis (Pst = 1 is the threshold of irritability).
The value is the flicker perceptibility level that is exceeded for x% of the samples as indicated by
the corresponding Y-axis values.
ñ the cumulative probability in percent along the Y axis. This data represents the flicker level
associated with a given probability of occurrence. Stated another way, the data represents the
percentile magnitudes for the total population of measured flicker levels in each Pst integration
period. The span control can span multiple integration periods. The cursor indicates the present
integration period or time.
The dark green area represents the present value. The light green area is
span. This graph does not display failures.
the peak value in the
ñ the Rms Measurement area on the bottom of the screen provides a summary value of Dmax,
Dc, and Dt voltage fluctuation failures. Summary values are the maximum value for each type
within the presently displayed integration period. If dashes are displayed in the Rms
Measurement area, it means that the test either never achieved or never exited the “steady-state”
required by the regulation. Refer to the Glossary for information about steady-state.
51
Page 52

5 - Viewing Test Data
Distribution Display
The Distribution display presents a summary of the Voltage fluctuations and Flicker test data. When the
test is running, the Distribution display is updated at the completion of each integration period. Note that
the amount of test data displayed may be limited by the Span control. See “Using the Span Control” in
chapter 6 for details. Also, the Search Parameters control is not active in this display.
Note To edit the graph, click with the right mouse button on any area of the graph. This puts
up the Edit Graph Attributes dialog box, which lets you configure items such as the
graph axes and the graph span.
The Distribution display presents the following test data:
ñ the magnitude of flicker perceptibility along the X axis (Pst = 1 is the threshold of irritability)
ñ the number of counts along the Y axis. This data represents the distribution of instantaneous
flicker levels associated with the 1024 logarithmically weighted bins that are accumulated for
each Pst integration period. The span control can span multiple integration periods. The cursor
indicates the present integration period or time.
The dark green area represents the present value. The light green area is the peak value in the
span. This graph does not display failures.
52
Page 53

Viewing Test Data - 5
ñ the Rms Measurement area on the bottom of the screen provides a summary value of
Dmax, Dc, and Dt voltage fluctuation failures. Summary values are the maximum value for each
type within the presently displayed integration period. If dashes are displayed in the Rms
Measurement area, it means that the test either never achieved or never exited the “steady-state”
required by the regulation. Refer to the Glossary for information about steady-state.
RMS Display
The Rms display is used to view the minimum and maximum values of summarized rms voltage data.
When the test is running, the Rms display is updated at the completion of time periods equal to one half
of the x-axis span. Depending on the selected zoom factor, each bar may represent a single data point, or
multiple data points. For example, if the zoom factor is 1:10 (shown as 10 in the zoom field), each bar
represents 10 data points.
Note To edit the graph, click with the right mouse button on any area of the graph. This puts
up the Edit Graph Attributes dialog box, which lets you configure items such as the
graph axes and the zoom factor. Refer to “Editing the Graph Attributes” later in this
chapter for details.
The Rms display presents the following test data:
ñ the total time of the selected range along the X axis.
ñ the minimum and maximum rms voltage values along the Y axis.
53
Page 54

5 - Viewing Test Data
A green bar means that all values summarized by the bar are within the regulation’s
specification. A red bar means that one or more values summarized by the bar are outside the
regulation’s specification.
ñ detailed rms information can be obtained by holding down the Shift key and double-clicking
on a bar. This highlights the selected bar in white and puts up a dialog box which displays a
report of the Dc failures, Dmax failures, or Dt failures represented by the bar. The minimum and
maximum rms voltage is also given.
ñ the Rms Measurement area on the bottom of the screen provides a summary value of
Dmax, Dc, and Dt failures. Summary values are the maximum value for each type within the
presently displayed integration period. If dashes are displayed in the Rms Measurement area, it
means that the test either never achieved or never exited the “steady-state” required by the
regulation. Refer to the Glossary for information about steady-state.
ñ You can zoom in on any area of the graph by drawing a zoom area with the left mouse button
and then double-clicking inside the area. Zoom factors are incremented in steps of five’s, for
example 1, 5, 10, and so on. Note that the zoom has a minimum range of one data point/bar (or
one second of the total span), and a maximum range of one Pst integration time. Integration times
of 1, 5, 10, or 15 minutes can be specified in the Advance Test Options window before the test is
run. The cursor indicates the present data record or time. Each data record corresponds to one
second of the total test time.
To determine in which integration period the present data record is located, click on Pst,
Probability, or Distribution and see which integration period is indicated in the Cursor field.
Search Parameters
When the display is set to Fixed, you can perform search functions on specific test data. Search options
let you:
ñ Search for specific items such as:
Dmax failures as a percent of the nominal voltage
Dc failures as a percent of the nominal voltage
Dt failures by time threshold
Any failures.
Flicker Display
The Flicker display is used to view the values of instantaneous flicker data. When the test is running, the
Flicker display is updated at the completion of time periods equal to one half of the x-axis span.
Depending on the selected zoom factor, each bar may represent a single data point, or multiple data
points. For example, if the zoom factor is 1:10 (shown as 10 in the zoom field), each bar represents 10
data points. Note that this graph does not display failures.
Note To edit the graph, click with the right mouse button on any area of the graph. This puts
up the Edit Graph Attributes dialog box, which lets you configure items such as the
graph axes and the zoom factor.
54
Page 55

Viewing Test Data - 5
The Flicker display presents the following data:
ñ the total time of the selected range along the X axis.
ñ the magnitude of flicker perceptibility units along the Y axis. This graph does not display
failures.
ñ the Rms Measurement area on the bottom of the screen provides a summary value of
Dmax, Dc, and Dt voltage fluctuation failures. Summary values are the maximum value for each
type within the presently displayed integration period. If dashes are displayed in the Rms
Measurement area, it means that the test either never achieved or never exited the “steady-state”
required by the regulation. Refer to the Glossary for information about steady-state.
ñ You can zoom in on any area of the graph by drawing a zoom area with the left mouse button
and then double-clicking inside the area. Note that the zoom has a minimum range of one data
point/bar (or one second of the total span), and a maximum range of one Pst integration time.
Integration times of 1, 5, 10, or 15 minutes can be specified in the Advance Test Options
window. The cursor indicates the present data record or time. Each data record corresponds to
one second of the total test time.
To determine in which integration period the present data record is located, click on Pst,
Probability, or Distribution and see which integration period is indicated in the Cursor field.
Search Parameters
When the display is set to Fixed, you can perform search functions on specific test data. Search options
let you:
ñ Search for specific items such as Flicker according to perceptibility units.
55
Page 56

5 - Viewing Test Data
Editing the Graph Attributes
To change the attributes or the settings of any of the graphs,
ñ Click with the right mouse button on any area of the graph.
This puts up the Edit Graph Attributes dialog box.
From this dialog box you can select:
ñ the Maximum values of the x and the y axes. These are specified in the units that are presently
displayed on the axes. The X axis is not configurable in all graphs. In the Rms graph for example,
only the Y axis is configurable for minimum and maximum voltage.
ñ the Y Axis Values as either a percent of the specification’s limits, or as an absolute value in the units
that apply to the presently displayed graph.
ñ either the Span of the data, from which you can specify:
Entire Test; the data range of the entire test
Custom; a range of time or data records
ñ or the Zoom factor of the graph. You can zoom in on any selected area of the graph by drawing an
area with the left mouse button and double-clicking inside the area.
ñ a time-series harmonic, which is specific to the time series graph.
56
Page 57

Viewing Test Data - 5
Copying Graphs and Tables to the Clipboard
Using the Print Screen keyboard key
The easiest way to put screen information into the clipboard is to use the Print Screen keyboard key.
This puts all of the information that is displayed on the screen into the Clipboard. From the Clipboard
you can then paste the captured screen information into any application that accepts Clipboard graphics
such as Freelance Graphics or Windows Paintbrush.
This method of capturing information has two limitations:
ñ When capturing graphs, the Print Screen keyboard key captures the entire screen. You cannot
capture just the graph by itself.
ñ When capturing table data, not all of the data in the table is displayed on screen at the same time.
The information not shown is not captured. Also, you may want to capture table data in text
format and import the information into a spreadsheet. Print Screen only captures data in
graphical format.
Using the Copy commands located in the Edit menu overcomes both of these limitations.
Using the Copy Commands
Edit
Copy Table
Copy Graph
Note: The Print Screen command located in the File menu does not copy screen information
to the clipboard. It prints the currently displayed screen graphics on the default printer.
Selecting this command copies highlighted information from the table
to the Clipboard. You can use the mouse to select a specific column or
row to copy to the Clipboard. Click on the column or row headings to
do this. You can select the entire table by clicking on the blank
rectangle in the upper left-hand corner of the table.
Note that the information in the headings is not copied to the
Clipboard.
Selecting this command copies the presently accessed graph to the
Clipboard. All of the information in the graph as well and the X and Y
axis information is copied to the Clipboard.
57
Page 58

5 - Viewing Test Data
Viewing Reports
Reports are available in either Short form or Long form, and can be previewed in the Report window. User
remarks can be added to a test file by selecting the Remarks menu tab. Menu tabs on the bottom of the screen
let you quickly access each area. The Printer button sends your report to the default printer.
NOTE: You must run Post processing to generate data for the long form reports.
If your test report indicates that your test was non-compliant, it may be due to one of the following
conditions:
Causes for Non-compliant EN 61000-3-2 or EN 60555-2 Tests
ñ The results of a pre-test indicate that the voltage distortion of the ac source is "OUT OF SPEC".
ñ The user set the test limit override to a value > 100%.
ñ The user specified a Class A device, but a Class D waveform is detected, the active power is
within Class D boundaries, and the "Motor Driven Device" checkbox is NOT checked.
ñ A data collection error was detected.
ñ A current limit was detected.
ñ A "Protection" error such as OVP was detected.
Causes for Non-compliant EN 61000-3-3 Tests
ñ The user set the integration time (or Observation Period) to a value other than 10 minutes
ñ The user set any or all Pst/Plt or RMS thresholds to a value > 100%
ñ A data collection error was detected.
ñ A current limit was detected.
ñ A "Protection" error such as OVP was detected.
58
Page 59

Viewing Test Data - 5
Short Form Report
The Short Form report includes summary information about the current test. This information fits on one page.
The following is a sample short form report of a Fluctuating Current Harmonics test:
IEC 1000-3-2/EN 61000-3-2 Fluctuating Current Harmonics Test
Date Performed: 06/15/97
Test Executed By: A.C. Testright
Company Name: True Test Laboratories
Device Under Test ID: Model 12345 Modular Power Supply
Test ID: 00123
Approved by: QA
Signature:________________________________________________________ Date:__________________
Final Test Result: FAIL
Settings and Test Conditions Compliant to the Standard: Yes
Test Equipment Used:
Agilent 6842A Harmonic/Flicker Test System with serial number 3440A-00101
Agilent 14761A HFTS software Version: A.00.05
Date Last Calibrated: June 6, 1997
Test Equipment Settings:
-----------------------Line Voltage: 230.00 V Current Measurement Range: High
Line Frequency: 50 Hz Measurement Delay: 10.0 seconds
Device Class: D Fluctuating Harmonics Test Duration: 2.00 minutes
Class Determination Pre-test Duration: 10.00 seconds
Overrides:
---------Test Limit Source (Power Measurements/Statistics): Maximum
Power Overrides: None
Test Limit Overrides: None
Pre-test Results for Class Determination:
-----------------------------------------
Percent in Envelope: 100.0% Fundamental Current: 1.343 A
Class D Equipment?: Yes Real Power: 148.8 W
Voltage THD Out-of-Specification?: No Power Factor: 0.387
Maximum Power: 148.8 W Mean Power: 146.7 W
Total Number of Failures: Total Number of Errors:
------------------------- -------------------------
4505 Failures None
Remarks
-------
59
Page 60

5 - Viewing Test Data
Long Form Report
The long form report presents all of the information as the short-form report but also includes all of the
final test data, which appears on subsequent pages of the report.
of a Fluctuating Current Harmonics test:
Long-Form Report page #1
IEC 1000-3-2/EN 61000-3-2 Fluctuating Current Harmonics Test
Date Performed: 05/10/96
Test Executed By: A.C. Testright
Company Name: True Test Laboratories
Device Under Test ID: Model 12345 Modular Power Supply
Test ID: 00123
Approved by: QA
Signature:________________________________________________________ Date:__________________
Final Test Result: FAIL
Settings and Test Conditions Compliant to the Standard: Yes
Test Equipment Used:
Agilent 6842A Harmonic/Flicker Test System with serial number 3440A-00101
Agilent 14761A HFTS software Version: A.00.05
Date Last Calibrated: June 6, 1997
Test Equipment Settings:
-----------------------Line Voltage: 230.00 V Current Measurement Range: High
Line Frequency: 50 Hz Measurement Window Type: Rectangular
Device Class: D Measurement Delay: 10.0 seconds
RMS Current Limit: 13.1 A Fluctuating Test Duration: 2.00 minutes
Peak Current Limit: 80.8 A Class Determination Pre-test Duration: 10.00 seconds
Number of Records: 375
Overrides:
---------Test Limit Source (Power Measurements/Statistics): Maximum
Power Overrides: None
Test Limit Overrides: None
Pre-test Results for Class Determination:
---------------------------------------- Percent in Envelope: 100.0% Voltage THD Out-of-Specification?: No
Class D Equipment?: Yes Fundamental Current: 1.343 A
RMS Voltage: 229.8 V RMS Current: 1.7 A Real Power: 148.8 W
Frequency: 50.0 Hz Peak Current: 5.2 A Apparent Power: 384.2 VA
Voltage THD: 0.10% Current THD: 80.68% Power Factor: 0.387
Maximum Power: 148.8 W Mean Power: 146.7 W
Active Power Statistics:
-----------------------100th percentile: 148.8 W 99th Percentile: 147.3 W 95th Percentile: 147.3 W
90th Percentile: 147.3 W 50th Percentile: 146.2 W
Total Number of Failures: Total Number of Errors:
------------------------- ------------------------ 4505 Failures None
The following is a sample long form report
60
Page 61

Viewing Test Data - 5
Long-Form Report page #2
Pre-Test Source Harmonics Data:
------------------------------Harmonic Limit Limit Max Max
Number (%) (Abs) (%) (Abs)
===========================================================================================
Fund. 100 120.020
2 0.2 0.240 0.004 0.005
3 0.9 1.080 0.040 0.049
4 0.2 0.240 0.006 0.007
5 0.4 0.480 0.048 0.058
6 0.2 0.240 0.001 0.002
7 0.3 0.360 0.065 0.078
8 0.2 0.240 0.001 0.001
9 0.2 0.240 0.059 0.071
10 0.2 0.240 0.005 0.006
11 0.1 0.120 0.057 0.068
12 0.1 0.120 0.002 0.003
13 0.1 0.120 0.038 0.046
14 0.1 0.120 0.003 0.003
15 0.1 0.120 0.032 0.038
16 0.1 0.120 0.004 0.004
17 0.1 0.120 0.014 0.017
18 0.1 0.120 0.004 0.005
19 0.1 0.120 0.016 0.019
20 0.1 0.120 0.002 0.002
21 0.1 0.120 0.020 0.024
22 0.1 0.120 0.002 0.002
23 0.1 0.120 0.020 0.024
24 0.1 0.120 0.002 0.003
25 0.1 0.120 0.019 0.022
26 0.1 0.120 0.001 0.001
27 0.1 0.120 0.011 0.013
28 0.1 0.120 0.001 0.002
29 0.1 0.120 0.011 0.013
30 0.1 0.120 0.002 0.002
31 0.1 0.120 0.011 0.014
32 0.1 0.120 0.002 0.002
33 0.1 0.120 0.010 0.012
34 0.1 0.120 0.002 0.002
35 0.1 0.120 0.012 0.014
36 0.1 0.120 0.002 0.003
37 0.1 0.120 0.011 0.013
38 0.1 0.120 0.002 0.003
39 0.1 0.120 0.007 0.009
40 0.1 0.120 0.002 0.002
61
Page 62

5 - Viewing Test Data
Note For Voltage Fluctuations reports, depending on the number and length of the integration
periods, the Final Test Data section of the report may include up to several dozen pages.
Long-Form Report page #3
Final Test Data:
--------------- Standard Maximum Maximum Mean Mean Standard Standard Pass(P)
Harmonic Limit Value Value Value Value Deviation Deviation or
Number (A rms) (A rms) (% Limit) (A rms) (% Limit) (A rms) (% Limit) Fail(F)
===========================================================================================
Fund. 1.1096 0.8333 0.1817
2 0.0074 0.0045 0.0011
3 0.5058 (0.9661) (191.0) (0.7151) (141.4) 0.1640 32.4 F
4 0.0062 0.0038 0.0009
5 0.2826 (0.8228) (291.1) (0.6165) (218.1) 0.1354 47.9 F
6 0.0052 0.0033 0.0007
7 0.1488 (0.6409) (430.9) (0.4920) (330.8) 0.0990 66.5 F
8 0.0033 0.0022 0.0004
9 0.0744 (0.4427) (595.2) (0.3543) (476.3) 0.0605 81.3 F
10 0.0019 0.0013 0.0002
11 0.0521 (0.2586) (496.7) (0.2245) (431.3) 0.0265 51.0 F
12 0.0015 0.0011 0.0002
13 0.0440 (0.1278) (290.2) (0.1158) (263.0) 0.0099 22.4 F
14 0.0010 0.0005 0.0002
15 0.0382 (0.0846) (221.4) (0.0630) (164.7) 0.0121 31.6 F
16 0.0011 0.0006 0.0002
17 0.0336 (0.0836) (248.8) (0.0729) (216.9) 0.0072 21.5 F
18 0.0010 0.0005 0.0002
19 0.0302 (0.0828) (274.1) (0.0637) (210.8) 0.0112 37.0 F
20 0.0008 0.0004 0.0001
21 0.0272 (0.0559) (205.2) (0.0403) (148.1) 0.0093 34.3 F
22 0.0008 0.0005 0.0001
23 0.0248 0.0211 84.8 0.0139 55.8 0.0043 17.4 P
24 0.0007 0.0004 0.0001
25 0.0229 0.0137 59.7 0.0125 54.4 0.0011 4.7 P
26 0.0006 0.0003 0.0001
27 0.0213 (0.0331) (155.4) (0.0270) (127.0) 0.0035 16.6 F
28 0.0007 0.0004 0.0001
29 0.0198 (0.0377) (190.4) (0.0307) (155.0) 0.0041 20.8 F
30 0.0007 0.0003 0.0001
31 0.0184 (0.0292) (158.2) (0.0251) (135.9) 0.0026 14.2 F
32 0.0006 0.0003 0.0001
33 0.0174 0.0173 99.4 0.0143 82.1 0.0016 9.2 P
34 0.0004 0.0002 0.0001
35 0.0164 0.0119 73.0 0.0102 62.5 0.0011 6.9 P
36 0.0004 0.0002 0.0001
37 0.0155 (0.0176) (113.8) (0.0135) (87.5) 0.0027 17.2 F
38 0.0004 0.0002 0.0001
39 0.0147 (0.0188) (127.6) (0.0123) (83.8) 0.0041 27.8 F
40 0.0006 0.0002 0.0001
62
Page 63

Viewing Test Data - 5
Long-Form Report page #4
Final Test Statistics:
--------------------- Standard Maximum Maximum >50% >75% >90% >95% >100% 2.5-min
Harmonic Limit Value Value of Limit of Limit of Limit of Limit of Limit Failures
Number (A rms) (A rms) (% Limit) (Count) (Count) (Count) (Count) (Count) (Count)
=================================================================================================
Fund. 1.1096
2 0.0074 0 0 0 0 0 0
3 0.5058 (0.9661) (191.0) 369 369 368 367 161 124
4 0.0062 0 0 0 0 0 0
5 0.2826 (0.8228) (291.1) 371 370 369 369 367 0
6 0.0052 0 0 0 0 0 0
7 0.1488 (0.6409) (430.9) 374 372 371 371 369 0
8 0.0033 0 0 0 0 0 0
9 0.0744 (0.4427) (595.2) 374 374 373 373 371 0
10 0.0019 0 0 0 0 0 0
11 0.0521 (0.2586) (496.7) 375 374 374 374 372 0
12 0.0015 0 0 0 0 0 0
13 0.0440 (0.1278) (290.2) 375 374 374 374 372 0
14 0.0010 0 0 0 0 0 0
15 0.0382 (0.0846) (221.4) 374 374 373 373 232 80
16 0.0011 0 0 0 0 0 0
17 0.0336 (0.0836) (248.8) 374 373 373 372 368 0
18 0.0010 0 0 0 0 0 0
19 0.0302 (0.0828) (274.1) 373 370 369 369 364 0
20 0.0008 0 0 0 0 0 0
21 0.0272 (0.0559) (205.2) 369 368 368 364 186 109
22 0.0008 0 0 0 0 0 0
23 0.0248 0.0211 84.8 228 60 0 0 0 0
24 0.0007 0 0 0 0 0 0
25 0.0229 0.0137 59.7 335 0 0 0 0 0
26 0.0006 0 0 0 0 0 0
27 0.0213 (0.0331) (155.4) 372 369 368 368 21 285
28 0.0007 0 0 0 0 0 0
29 0.0198 (0.0377) (190.4) 373 370 369 369 220 87
30 0.0007 0 0 0 0 0 0
31 0.0184 (0.0292) (158.2) 373 371 369 368 47 260
32 0.0006 0 0 0 0 0 0
33 0.0174 0.0173 99.4 372 318 82 26 0 0
34 0.0004 0 0 0 0 0 0
35 0.0164 0.0119 73.0 369 0 0 0 0 0
36 0.0004 0 0 0 0 0 0
37 0.0155 (0.0176) (113.8) 369 280 176 142 0 45
38 0.0004 0 0 0 0 0 0
39 0.0147 (0.0188) (127.6) 326 223 166 148 0 65
40 0.0006 0 0 0 0 0 0
Remarks Report
The Remarks report can be used to enter descriptive information about the test to the data file. These remarks
are appended to both the short form and the long form report when they are printed.
After entering or editing the remarks, click on Save to save the remarks to the present file.
63
Page 64

Page 65

6
Searching for Specific Test Data
The toolbar on top of the display screen, which is referred to as the Navigator toolbar and is described in the
beginning of chapter 5, is used to search for specific data in the test record. There are two ways to search for
specific test data.
Searching for Data While the Test is Running
Using the Navigator toolbar while the test is running may prove to be slow unless you have a very fast PC with
lots of memory. This is caused by the constant processing of incoming data from your Agilent 6800-Series AC
Power Source/Analyzer. If this processing proves to be too slow on your PC, you may choose to wait until
after the test has completed before using the Navigator toolbar.
1. Click on the Rolling button to stop updating the display. Clicking on “Rolling” changes the button to
“Fixed”.
2. Search for specific data by one of the following methods:
ñ Click on the Search Parameters button. Select a specific item to search for in the dialog box that
appears on the screen and click OK. Use the red
for the specified item.
and ® buttons to search either direction in time
ñ For the Harmonics graph and table displays, the Pst display, the Probability display, and the
Distribution display, e
that is of interest.
ñ For the Time Series, Rms, and Flicker displays, hold down the left mouse button to zoom in on a
specific area of the graph
3. Click on the Fixed button to return the display to “Rolling“, where it resumes being updated with the latest
data.
nter a span and a cursor location to examine the portion of the test record
(see Using the Zoom Control).
Searching for Data After the Test has Completed
Search for specific data by one of the following methods:
ñ Click on the Search Parameters button. Select a specific item to search for in the dialog box that
appears on the screen and click OK. Use the red
for the specified item.
ñ For the Harmonics graph and table displays, the Pst display, the Probability display, and the
Distribution display, e
that is of interest.
ñ For the Time Series, Rms, and Flicker displays, hold down the left mouse button to zoom in on a
specific area of the graph
nter a span and a cursor location to examine the portion of the test record
(see Using the Zoom Control).
and ® buttons to search either direction in time
65
Page 66

6 - Searching for Specific Test Data
Using the Span Control
The span control applies to the Harmonics graph and table displays, the Pst display, the Probability
display, and the Distribution display. It
relation to the present cursor location. This is illustrated in the following figure.
As shown in the following figure, the solid-colored part of each bar (either green or red), indicates the
value at the present cursor position. The top of each bar indicates the maximum measured value of the
entire data span. When you increase or decrease the span, you affect the range of data for which the
maximum value is displayed. Note that changing the span does not affect the value at the present cursor
position.
determines the range of test data that you want to examine in
66
Page 67

Searching for Specific Test Data - 6
Using the Zoom Control
The zoom control applies to the Time Series display, the Rms display, and the Flicker display. The time-
series display only shows a limited number of data bars. Zooming in lets you view individual data points in the
time series. Zooming out lets you view summarized information for larger blocks of measurement data.
When the zoom factor is greater than 1:1, each bar represents the maximum value of two or more data
points. This is illustrated in the following figure
To use the zoom control,
1. Hold down the left mouse button and drag the cursor to define an area on the graph in which to zoom in on
2. Draw a rectangle outlining the area that you want to zoom in on, as shown in the following screen.
3. When you double-click inside the rectangle you just drew, the area inside it will zoom in and fill the
display area.
4. To zoom back out, double-click on any area of the graph. Each time you double-click you will zoom
out by a factor of ten until you reach the maximum zoom limit.
.
67
Page 68

6 - Searching for Specific Test Data
Obtaining Detailed Failure and Error Information
Note: This feature is not available for the Flicker Display.
For detailed failure and error information about a specific bar in a graphical display, proceed as follows:
1. Press the Shift key
2. While holding down the shift key, click on the bar for which you desire more information with the
left mouse button. The following figure shows how a data bar is highlighted after it has been selected.
3. While still holding down the shift key, double-click on the highlighted bar with the left mouse button.
An information dialog box will appear, containing information such as:
ñ the type and total number of failures
ñ the value at the present cursor location as well as the minimum and maximum values in the data span
ñ the size of the data span by records and by time
68
Page 69

Printing
Printing Graphs and Tables
Using the Print Pre-test command
The Print Pre-test command prints the currently displayed Pre-test screen to the default printer. The
printout is slightly reformatted from what you see on the display. Note that the Print Pre-test command
does not copy any information to the Clipboard.
1. Select the Pre-test menu tab on the bottom of the screen and access the Pre-test Summary
window. If no information appears in the display, run the pretest or open an existing test.
2. Select the Print Pre-test command from the File menu.
3. In the Print Reports dialog box, select the document properties, page range, number of copies, or
if you want collated copies. If you have access to more than one printer, click on the downarrow
to choose a different printer.
Using the Print Graph/Table command
7
All display graphs except the pre-test graph can be printed using the Print Graph or Print Table
command in the File menu. These commands print all of the data that comprises each graph or table.
Note however, that the printout is not in the same format as the data on the display.
1. Display the graph or table that you want to print using either the View menu keys or the
appropriate menu tabs on the bottom of the screen.
2. Select the Print Graph/Table command from the File menu.
3. In the Print Reports dialog box, select the document properties, page range, number of copies, or
if you want collated copies. If you have access to more than one printer, click on the downarrow
to choose a different printer.
Printing Reports
Reports can be printed in one of two ways as explained below. You can also transfer a report to a file,
which can then be accessed by a word processor. This allows printing to be done at a later time, stores
test reports in a file format for repeated printing, and allows test reports to be easily sent electronically.
From the File menu
1. Select the Print Report command from the File menu.
2. Select the type of report in the Choose Report dialog box (Short form or Long form).
69
Page 70

7 - Printing
3. In the Print Report dialog box, select the document properties, page range, number of copies, or
if you want collated copies. If you have access to more than one printer, click on the downarrow
to choose a different printer.
From the Report window
1. Select a Report window from either the View menu, or the Report menu tabs. (Short form or
Long form).
2. In the Report window, click on the Print button. The entire report will automatically be sent to
your default printer.
Printing Reports to a File
Note Do not use this feature for any graphics output. Select your regular printer for any
graphics output or for directly printing reports to your printer.
To print reports to a file, you must use the Windows “Generic / Text only” printer driver. The following
instructions explain how to install this driver and after it is installed, how to print reports to a file.
1. Run the Control Panel application and select “Printers”.
2. Click on the Add button, which will bring up a list of available printers.
3. Select the “Generic / Text only” and click on the Install button. This will place the Generic
driver in your list of available printers on LPT1. (In Windows 3.1, the “Generic / Text only”
driver is second in the list., after “Install Unlisted or Updated Printer”.)
Note Adding the Generic driver WILL NOT affect your normal printing, provided you do not
make it your default printer. If the Generic driver is not already on your hard disk, follow
the instructions to load it from your Windows floppies or CD.
4. Once it has been installed to LPT1, you must move it to the destination of “FILE:” To do this
select the Connect button. This brings up a choice of printer ports.
5. Use the scroll bars to select “FILE:” Once this has been done, exit the Control Panel application.
Now that you have added the Generic driver, you will be able to select it as the target printer in the
Agilent 14761A HFTS software.
1. Select the Print Report command from the File menu. Then select either the Short from or the
Long form report. If you are already viewing a report in the Report window, simply click on the
Print button
2. The “Generic / Text only” printer should appear at the top of the Print Report dialog box. If
“Generic / Text only” does not appear, click on Setup and select it from the list of Specific
Printers that appears in the Print Setup dialog box.
3. In Windows 3.1, click on the Options button and check the “Wide Carriage” option. You need to
do this to prevent clipping of text columns when printing the reports.
70
Page 71

Printing
4. Click on OK to print the report.
5. Enter a filename in the dialog box that appears on the screen. The report will be saved in ASCII
format in the file you specified. Until you change your printer selection to a different printer, the
request for a filename dialog box will come up whenever you use any printing feature of the
Agilent 14761A HFTS software.
If you want to print your report file, you may use any standard text editor such as Windows Notepad to
load the file and then print it on your default system printer. In some cases, an MS-DOS Copy or Print
command can also be used. If these commands do not work, use the text editor method.
71
Page 72

Page 73

Specifications
Supported or Referenced EN 61000-3-2 and EN 60555 Part 2 Standards
IEC 555-2 EN 61000-3-2
EN 60555 Part 2 IEC 1000-3-2
IEC 1000-4-7
Supported or Referenced EN 61000-3-3 Standards
IEC 725 EN 61000-3-3
IEC 868 IEC 1000-3-3
IEC 868 Amendment 1
PC Requirements
A
Minimum:
Recommended:
486DX 33 Mhz
512 Kbytes of conventional memory
8 Mbytes of RAM
210 Mbyte IDE Hard Disk1 (4 Mbytes required for installation)
Windows 3.1, or Windows for Workgroups 3.11
Networking disabled
486DX4 100 Mhz or Pentium
512 Kbytes of conventional memory
16 Mbytes of RAM
1.2 Gbyte IDE PCI Hard Disk
Windows 95 workstation
Networking disabled
1
Accommodates data storage for the maximum possible test length of 7 days.
2
For Windows 95, plug and play I/O cards are recommended.
1
(4 Mbytes required for installation)
2
, or Windows NT 4.0 workstation
Supported GPIB Interfaces
Agilent 82335B, 82340B, 82341C/D, 82350A GPIB Interface
National Instruments AT-GPIB/TNT, AT-GPIB/TNT PnP (Windows 95 only), AT-GPIB/TNT PCMCIA
Supported Equipment
Agilent 6812B AC Power Source/Analyzer (300 V, 6.5 Arms max., single-phase)
Agilent 6813B AC Power Source/Analyzer (300 V, 13 Arms max., single-phase)
Agilent 6841A Harmonic/Flicker Test System (300 V, 6.5 Arms max., single-phase)
Agilent 6842A Harmonic/Flicker Test System (300 V, 13 Arms max., single-phase)
Agilent 6843A Harmonic/Flicker Test System (300 V, 16 Arms max., single-phase)
73
Page 74

A - Specifications
Equipment Specifications (IEC Mode)
IEC mode specifications are warranted over the ambient temperature range of 0 to 40° C.
Model Agilent 6812B, 6841A Agilent 6813B, 6842A Agilent 6843A
Number of Phases
Maximum Output Ratings
Output Power
rms Voltage
rms Current
Peak Current
Output Frequency
Load Regulation
Line Regulation
Ma ximum Voltage THD
Reference Impedance
Accuracy
Ripple & Noise
(20 kHz - 10 Mhz)
Vrms relative to full scale
Vrms
Output Voltage Harmonic
Content
Programming Accuracy
rms Voltage
Frequency
111
750 VA
300 V
6.5 A
40 A
50 Hz/60 Hz 50 Hz/60 Hz 50 Hz/60 Hz
0.5% of full scale
0.1% of full scale
0.25% 0.25% 1%
3% @ 0.4 Ω and 796 mH
1% @ 0.4 Ω, 796 mH, and 25° C
- 60 dB
300 mV
Compliant with IEC 868
and IEC 1000-3-2
0.15% + 0.3 V
0.01% + 10 mHz
1750 VA
300 V
13 A
80 A
0.5% of full scale
0.1% of full scale
4800 VA
150 V (low range)
300 V (high range)
32 A (low range)
16 A (high range)
96 A (low range)
48 A (high range)
0.5% of full scale
0.3% of full scale
Measurement Accuracy
Current Fundamental
low range
high range
Current Harmonics 2-40
low range
high range
rms Voltage
Power (VA) low range
Power (VA) high range
Power (W) low range
Power (W) high range
Measurement/Generation
Synchronization Error
Flicker and
Flicker perceptibility (Pst)
Current Shunt Burden
Harmonic Smoothing
Filter Time Constant
Pst Integration Time
0.03% + 1.5 mA
0.05% + 5 mA
0.03% + 1 mA + 0.2%/kHz
0.05% + 3 mA + 0.2%/kHz
0.03% + 100 mV
0.1% + 1.5 VA
0.1% + 3.5 VA
0.1% + 0.3 W
0.1% + 0.3 W
< 1 ppm
compliant with IEC 868
0 volts
1.5 seconds
1, 5, 10, or 15 minutes
0.03% + 1.5 mA
0.05% + 5 mA
0.03% + 1 mA + 0.2%/kHz
0.05% + 3 mA + 0.2%/kHz
0.03% + 100 mV
0.1% + 1.5 VA
0.1% + 3.5 VA
0.1% + 0.3 W
0.1% + 0.3 W
0.03% + 3 mA
0.05% + 6 mA
0.03% + 2 mA + 0.2%/kHz
0.05% + 3 mA + 0.2%/kHz
0.05% + 250 mV
0.15% + 1.8 VA
0.15% + 9 VA
0.15% + 1.8 W
0.15% + 9 W
74
Page 75

Ac Input Ratings and supplemental information
Model Agilent 6841A Agilent 6842A Agilent 6843A
Specifications - A
Voltage Range (Vac)
Maximum Input Current
(rms)
Input Power (max)
Input Frequency
Net Weight
Shipping Weight
*input power configuration for the standard unit
87 - 106 Vac
104 - 127 Vac*
174 - 220 Vac
191 - 254 Vac
24 A (at 120 Vac)
28 A (at 100 Vac)
15 A (at 200/208 Vac)
13 A (at 230 Vac)
2500 VA/1400 W 3800 VA/2600 W 8900 VA/6550 W
47 - 63 Hz 47 - 63 Hz 47 - 63 Hz
28.2 kg (62 lb) 32.7 kg (72 lb) 87.7 kg (193 lb)
31.8 kg (70 lb) 36.4 kg (80 lb) 127.3 kg (280 lb)
174 - 220 Vac*
191 - 254 Vac
22 A (at 200/208 Vac)
20 A (at 220/230/240 Vac)
180 - 254 V
342 - 456 V
25 A per phase
15 A per phase
L-L
L-L
(3Φ)*
(3Φ)
IEC Mode Measurement System Characteristics for Agilent 6841A, 6842A, 6843A
Measurement Window Sample Rate Acquisition Window Acquisition Overlap
50 Hz operation
RECTangular
HANNing
60 Hz operation
RECTangular
HANNing
12.8 kHz
8.533 kHz
15.360 kHz
7.680 kHz
320 ms (16 cycles)
480 ms (24 cycles)
266.7 ms (16 cycles)
533.3 ms (32 cycles)
None
50%
None
50%
75
Page 76

Page 77

B
Glossary
Quasi-stationary Harmonics
Quasi-stationary or steady-state harmonic currents are produced by electronic equipment that generates
non-varying levels of current distortion, where the amplitude of each harmonic remains constant over
time. This equipment appears as an unchanging load on the ac mains. Examples include test and
measurement instrumentation such as oscilloscopes and multimeters, electronic ballasts, and video
display equipment.
Fluctuating Harmonics
Fluctuating harmonic currents are caused by electronic equipment that represents time-varying loading
on the ac mains. This equipment generates varying levels of current consumption or drain where the
amplitude of individual harmonics change over time. Examples include microwave ovens, dishwashers,
laser printers and photocopiers.
Voltage Fluctuations and Flicker
When loads that have automatic turn on/turn off controls such as thermostats and timers cycle on and off,
they cause frequent changes of the load to the supply. Kitchen appliances, space heaters, air conditioners,
copiers and other equipment include these type of controls. When such a fluctuating load is in a branch
circuit with other loads, these changes cause rms voltage fluctuations that affect all of the loads in the
branch. In particular, variations in voltage amplitude cause changes in the light output of any filament
lamps in the branch circuit. Because the output of a filament lamp is proportional to the square of the
applied voltage, changes in light intensities can be significant even for small changes in voltage.
This effect of variation in light output as perceived by the human observer is referred to as flicker.
Flicker can be random, or it can be a regular modulation of light intensity. Because flicker is annoying,
and for some individuals presents a health hazard (persons that have epilepsy for example), the regulation
seeks to
Data Files
Data files may contain the following types of data:
Data files are created or selected at the beginning of each test. Template or setup data is entered or
copied into the data file before the test is run. This information may be saved and the file re-opened at a
later time to run the pre-test or the test. Test result data is entered into these files when the pre-test and
the test is running. Report data is entered into the data files at the completion of the test. Completed test
files may be opened at any time to review or print test results.
regulate flicker generation to an acceptable level.
ñ test setup (or template) information only
ñ test setup and pre-test data
ñ test setup, pre-test data, test data, and report data
77
Page 78

B - Glossary
Template Files
Template files contain test-setup data that may be used in multiple tests. By eliminating a portion of the
setup task, using template files can streamline the test process. Template information is included with the
test data when the test is run. At the beginning of each test you can elect to use an existing template file
when running your test, or you can create a new template for the test by entering new setup information
in the Main and Test Setup screens. You may also choose not to use template files and enter entirely new
information when setting up a test.
Integration Period
The integration period specifies the time during which instantaneous flicker values are accumulated for
subsequent evaluation as short-term flicker or Pst. The integration period is determined by the selected
Pst integration time. The Pst integration time can be specified as 1, 5, 10, or 15 minutes. The resulting
time (total test time) equals the number of integration periods multiplied by the Pst integration time. For
example if the Pst integration time is specified as 10 minutes, and 12 integration periods have been
selected, the total time of the test will be 2 hours.
Data Records
The number of data records acquired by the Agilent 14761A application. Records are numbered
sequentially beginning with one at the start of each test. The number of completed data records may be
displayed in the status bar on the bottom of the screen. Data records contain the following information:
For Quasi-stationary or Fluctuating harmonics
ñ Each Rectangular-window record contains data from 16 cycles of the fundamental frequency at
50 and 60 Hz. 40 current harmonic values, rms current, rms voltage, and real power is calculated
for each data record.
ñ Each Hanning-window record contains data from 24 cycles of the fundamental frequency at 50
Hz, and data from 32 cycles of the fundamental frequency at 60 Hz. 40 current harmonic values,
rms current, rms voltage, and real power is calculated for each data record.
For Voltage Fluctuations
ñ Each Rms/Instantaneous Flicker record contains rms data and instantaneous flicker data acquired
at a rate of one record per second. Each Rms voltage record contains 100 data points at 50 Hz
(120 data points at 60 Hz), integrated over half-cycle periods. Each Instantaneous Flicker record
contains 100 data points at 50 Hz (120 data points at 60 Hz), sampled once every 10 ms at 50 Hz
(once every 8.33 ms at 60 Hz).
ñ Each Pst/Probability/Distribution data record contains “time-at-level” occurrences for
instantaneous flicker data acquired during one integration period (which may be specified as 1, 5,
10, or 15 minutes in length). The data is accumulated into 1024 logarithmically scaled bins,
which are log-weighted by flicker level in the range of 0.01 to 10000 perceptibility units. Based
on this data, Pst values are calculated for each integration period.
Watch Events
Watch events are test parameters that you can specify to trigger the termination of the test. Watch events
may or may not result in failures. For example, when testing Quasi-stationary Harmonics, you may
configure the test to terminate when a specific harmonic approaches 95% of the regulation. In this way
you can examine the test results that existed at the time the test terminated.
78
Page 79

Glossary - B
Failures
Failures are those conditions that will cause a test to fail the regulations. The number of failures are
displayed in the status bar on the bottom of the screen. You can override the failure criteria by specifying
an override percent in the Test Setup Advanced Options window. Test limits may be adjusted above or
below the values specified by the regulation, but any adjustment above 100% will flag the test as invalid
in the test report.
Errors
These are the instrument-specific errors that are returned by the Agilent 14761A application. Errors are
displayed in the status bar on the bottom of the screen. Errors can also be displayed on the front panel of
the unit by pressing the Shift and the Error key. Typical errors include current limit errors, or saturation
of the current measurement circuits when operating a high power load in the low current range. These
error messages may require you to refer to the Agilent 6800 Series Programming Guide or the 6800
Series User’s Guide for additional information.
Error messages that are not instrument specific may appear on the screen when you are using the Agilent
14761A application. These error messages are accompanied by an explanation that describes what has
occurred, and in some cases the appropriate action to take.
Percent of Threshold
Specifies a threshold as a percent of the regulatory specification. For example, if the regulation specifies
that any measurement of a third harmonic current above 2.3 amperes is a failure, a 90% threshold may be
used to specify that values greater than 2.07 amperes may either be evaluated as failures or used to
generate a watch event.
2.5 Minute Window
A sliding 2.5 minute observation period that is applied to the entire test data. For fluctuating (or
transitory) even harmonics from 2 through 10 and odd harmonics from 3 through 19, harmonic
amplitudes can be 1.5 times the regulation’s limits for a maximum of 15 seconds during any 2.5 minute
period.
Pst (Short-term Flicker)
The flicker severity evaluated over a short period of time (10 minutes). Pst = 1 is the conventional
threshold of irritability, and therefore the limit.
Plt (Long-term Flicker)
The flicker severity evaluated over a long period (typically 2 hours) using successive Pst values. Plt =
0.65 is the conventional threshold of irritability, and therefore the limit.
Dc (Relative Steady-state Voltage Change)
The difference between two adjacent steady-state voltages relative to the nominal voltage. Dc must be ≤
3%.
79
Page 80

B - Glossary
D(t) (Relative Voltage Change Characteristic)
The change in rms voltage, relative to the nominal voltage, as a function of time and between periods
when the voltage is in a steady-state condition for at least 1 second. D(t) must not be
> 3% for more than 200 milliseconds continuously during a voltage change event.
Dmax (Maximum Relative Voltage Change)
The difference between maximum and minimum rms values of the voltage change characteristic relative
to the nominal voltage. Dmax must be ≤ 4%.
Steady-state
According to EN 1000-3-3, successive half-cycle rms voltage measurements must meet some criteria for
at least one second to qualify as "steady-state". What is not given in IEC 1000-3-3 is a definition of the
amplitude characteristic of "steady-state".
Agilent Technologies’ inferred definition is +/- 0.15% of the nominal line voltage (Un). This was chosen
for the following reason: The error allocation for measuring instrumentation is 5% while the stated limit
for Dc is 3%. Taking both specifications into account (i.e. 5% of 3%) suggests that a tolerance band for
a "steady-state" of 0.15% is a reasonable guess at the regulation’s intent. This band is also consistent
with the output noise performance of ac sources and readily permits detection of steady-state equipmentunder-test behavior.
Since setting this tolerance band is critical to detection of voltage change events, and to avoid imposing a
specific interpretation of steady-state, the Agilent 14761A application uses an entry in the hfts.ini file
that contains initialization information for the application to set the tolerance band. The entry is factory
set to 0.003 (i.e. 0.3% for the total tolerance band), but may be easily changed to another value in this
file.
Agilent Technologies has made two additional interpretive inferences that are directed towards meeting
the intent of the regulation while permitting a practical implementation:
1. Steady-state conditions may never be achieved during a test, in which case values for Dmax, Dc, and
Dt will not be reported.
2. In the situation where steady-state conditions are established, Agilent Technologies’ solution reports
the maximum Dmax, Dc, and Dt events occurring within each Pst integration period. These values are
then compared to the specifications stated in IEC 1000-3-3 to determine pass/fail.
80
Page 81

C
IEC Mode Command Summary
Introduction
The Agilent 6800-Series AC Power Source/Analyzer is designed to operate in Normal as well as IEC
mode. In Normal mode, the ac source responds to all of the commands that program ac source operation.
Normal mode commands are documented in the Agilent 6800 Series Programming Guide. In IEC mode,
the Agilent 6800-Series AC Power Source/Analyzer provides full EN 61000-3-2/EN 60555 Part 2 and
EN 61000-3-3 compliance test capability. The SYSTem CONFigure command details the differences
between Normal and IEC mode.
When the Agilent 6800-Series AC Power Source/Analyzer is being used in IEC mode, the Agilent
14761A HFTS software handles all of the communication between the user and the Agilent 6800-Series
AC Power Source/Analyzer. The Agilent 14761A HFTS software must be loaded and running in
Microsoft Windows on a personal computer that is connected to the Agilent 6800-Series AC Power
Source/Analyzer.
The IEC commands that are described in this appendix are for those users who need to directly program
the IEC functions of the Agilent 6800-Series AC Power Source/Analyzer without using the Agilent
14761A HFTS software. Be aware that these commands will return “raw” IEC data from the Agilent
6800-Series AC Power Source/Analyzer. It is the programmer’s responsibility to interpret the data
according to the IEC standards.
Using the SENSe:CURRent:ACDC:RANGe command
The SENSe:CURRent:ACDC:RANGe command is documented in the Agilent
6811B/12B/13B/14B/34B/43A Programmer’s Guide. When using this command in IEC mode, you must
always initialize it before making any Array measurements by sending a Meas:Curr? command. For
example:
SENSe:CURRent:ACDC:RANGe
MEASure:CURRent?
ENTER
81
Page 82

C - Command Summary
Command Syntax
CALCulate
:INTegral
:TIME <Nrf+>
:LIMit
:UPPer
[:DATA] <Nrf+>
:SMOothing <bool>
FORMat
[:DATA] <type>
:BORDer <type>
MEASure
:ARRay
:CURRent
:HARMonic? <NRf+>
:VOLTage
:FLUCtuations
:FLICker? <NRf+>
:PST? <NRf+>
:ALL? <NRf+>
selects the Pst integration time for flicker measurements
sets various limits associated with rms voltage
fluctuation testing for IEC 1000-3-3
turns the 1.5 second smoothing filter on or off
specifies the response data format ( ASCii | REAL )
sets the byte order of the floating point values returned
( NORMal | SWAPped )
returns an array of current harmonic magnitudes
returns rms and instantaneous flicker values
returns Pst summary values
returns both rms/flicker and Pst summary values
SENSe
:CURRent
:PREFerence <type>
:WINDow
[:TYPE] <type>
SYSTem
:CONFigure <mode>
sets the phase reference for current harmonic phase
measurements ( VOLTage | CURRent )
selects the window function used in the harmonic
measurements ( HANNing | KBESsel | RECTangular )
selects the operating mode of the HFTS system
( NORMal | IEC )
82
Page 83

Command Summary - C
CALCulate:INTegral:TIME
This command selects the Pst integration time for IEC Flicker measurements. The parameter may only
assume values of 1, 5, 10, and 15 minutes in accordance with IEC 868. The command will be accepted
and may be queried, but will have no meaningful function unless the ac source is placed in IEC mode
using the SYSTem:CONFigure command.
Command Syntax
Parameters
*RST Value
Examples
Query Syntax
Returned Parameters
Related Commands
CALCulate:INTegral:TIME <NRf+>
1, 5, 10, & 15 minutes
10 minutes
CALC:INT:TIME 10
CALCulate:INTegral:TIME?
<NR3>
SYSTEM:CONF MEAS:ARR:VOLT:FLUC:FLIC?
MEAS:ARR:VOLT:FLUC:PST?
MEAS:ARR:VOLT:FLUC:ALL?
CALCulate:SMOothing
This command turns on or off a smoothing filter for current harmonic measurements. The filter transfer
function is equivalent to a single pole lowpass function with a 1.5 second time constant and is applied
only to current harmonic measurements made when IEC mode is selected with SYSTem:CONF.
Command Syntax
Parameters
*RST Value
Examples
Query Syntax
Returned Parameters
Related Commands
CALCulate:SMOothing <Bool>
0 | 1 | ON | OFF
OFF
CALC:SMO ON
CALCulate:SMOothing?
<CRD>
MEAS:ARR:CURR:HARM? SYST:CONF
MEAS:CURR:HARM?
83
Page 84

C - Command Summary
CALCulate:LIMit:UPPer
This command sets various limits associated with rms voltage fluctuations testing for IEC 1000-3-3. as
described in the following table. All five parameters are type NRf. The order in which the five
parameters are entered must correspond to the order in the table.
vss delta Sets the maximum peak-to-peak variation of relative voltage
“steady-state”. At *RST this value is set to 0.003
2
. Note that this number is
1
that defines
not specified by IEC 1000-3-3.
dmax limit Sets the maximum relative voltage1 change allowed before a dmax error is
flagged. At *RST this value is set to 0.04 (see note
dc limit Sets the maximum relative steady-state voltage change allowed before a dc
error is flagged. At *RST this value is set to 0.03 (see note
2
).
2
).
dt limit Sets the maximum time in seconds that the relative voltage1 can exceed the
dt limit before a dt error is flagged. At *RST this value is set to 0.2 seconds.
dt limit Sets the maximum relative voltage1 that must be exceeded for dt limit
seconds before a dt error is flagged. At *RST this value is set to 0.03 (see
2
note
).
1
The expression “relative voltage” as used above is the measured rms voltage divided by the programmed
voltage.
2
This value is the ratio with respect to Un (the European nominal line voltage). For example, a value of
.03 represents 6.9 volts if U
Command Syntax
Parameters
*RST Value
Examples
Returned Parameters
= 230 volts. (Ratio * 100 = % of Un )
n
CALCulate:LIMit:UPPer[:DATA] <NRf>,<NRf>,<NRf>,<NRf>,<NRf>
see table
see table
CALC:LIM:UPP .003, .04, .03, .2, .03
<NR3>
84
Page 85

Command Summary - C
FORMat
This command specifies the response data format for the following queries:
MEASure:ARRay:CURRent:DC?
MEASure:ARRay:VOLTage:DC?
MEASure:ARRay:CURRent:HARMonic[:AMPLitude]?
MEASure:ARRay:VOLTage:FLUCutations:ALL?
MEASure:ARRay:VOLTage:FLUCutations:FLICker?
MEASure:ARRay:VOLTage:FLUCutations:PST?
When ASCii is selected, the response format for these queries is NR3 Numeric Response Data. This
format is selected at *RST. The only valid argument for <length> is 0, which means that the ac source
selects the number of significant digits to be returned.
When REAL is selected, the response format is Definite Length Arbitrary Block Response Data. The
data within the Arbitrary Block is coded as IEEE single precision floating point, with 4 bytes per value.
The second argument to the FORMat:DATA command specifies the number of bits in the returned data.
Only the value 32 is permitted in ac source instruments. The byte order within a single value is
determined by the FORMat:BORDer command. Definite Length Arbitrary Block Response Data format
begins with a header that describes the number of data bytes in the response. The header begins with a
pound sign, followed by a single non-zero digit that defines the number of digits in the block length,
followed by the digits contained in the block.
For example: The response to the query "MEAS:ARR:CURR:HARM? 1" which returns 45 numeric
values when SYSTem:CONFigure is set to IEC would be as follows:
’#’ ’3’ ’1’ ’8’ ’0’ <byte1> <byte2> ... <byte180> <newline>
When a query requests a number of response blocks, each block is separated by the Response Data
Separator (comma). For example: The response to the query "MEAS:ARR:CURR:HARM? 2" given
under the same conditions described in the example above would be as follows:
’#’ ’3’ ’1’ ’8’ ’0’ <byte1> <byte2> ... <byte180> ’,’ ’#’ ’3’ ’1’ ’8’ ’0’ <byte1> <byte2> ... <byte180> <newline>
Command Syntax
Parameters
*RST Value
Examples
Query Syntax
Returned Parameters
Related Commands
FORMat[:DATA] <CRD>
ASCii | REAL
ASCii
FORM REAL
FORMat?
<CRD>
FORM:BORD MEAS:ARR:CURR:DC?
MEAS:ARR:VOLT:DC? MEAS:ARR:CURR:HARM [:AMPL]?
MEAS:ARR:VOLT:FLUC:ALL?
MEAS:ARR:VOLT:FLUC:FLIC?
MEAS:ARR:VOLT:FLUC:PST?
85
Page 86

C - Command Summary
FORMat:BORDer
This command sets the byte order of IEEE floating point values returned within Arbitrary Block
Response Data. When NORMal is selected, the first byte sent is the sign bit and seven most significant
bits of the exponent, and the last byte sent is the least significant byte of the mantissa. This ordering is
most useful for big-endian controllers such as those that use Motorola processors.
When SWAPped is selected, the least significant byte of the mantissa is sent first and the sign bit and
seven most significant bits of the exponent are sent last. This ordering is most useful for little-endian
controllers such as those that use Intel processors.
Command Syntax
Parameters
*RST Value
Examples
Query Syntax
Returned Parameters
Related Commands
FORMat:BORDer <CRD>
NORMal | SWAPped
NORMal
FORM:BORD SWAP
FORMat:BORDer?
<CRD>
FORM[:DATA] MEAS:ARR:CURR:DC?
MEAS:ARR:VOLT:DC? MEAS:ARR:CURR:HARM[:AMPL]?
MEAS:ARR:VOLT:FLUC:ALL?
MEAS:ARR:VOLT:FLUC:FLICker?
MEAS:ARR:VOLT:FLUC:PST?
86
Page 87

Command Summary - C
MEASure:ARRay:CURRent:HARMonic?
This query returns an array of current harmonic magnitudes. Operation of the query is modified by the
SYSTem:CONF command (see summary table under SYSTem:CONFigure). The parameter specifies the
number of harmonic arrays to be returned in response to the query. If SYSTem:CONFigure specifies
NORMal operation, the parameter is ignored (ie it is forced to 1). If SYSTem:CONFigure specifies IEC
operation, the SOURce:FREQuency and SENSe:WINDow commands are coupled to modify operation of
the measurement underlying the query as shown in the following table:
Acquisition
SOURce:FREQ SENSe:WINDow Sample Rate
Window
50 Hz RECTangular 12.8 KHz 320 ms None
50 Hz HANNing 8.533 KHz 480 ms 50%
60 Hz RECTangular 15.360 KHz 266.7 ms None
60 Hz HANNing 7.680 KHz 533.3 ms 50%
SYSTem:CONFigure also impacts availability of the RMS Current, RMS Voltage, Real Power values. If
SYSTem:CONFigure is set to NORMal, these values are not available. If SYSTem:CONFigure is set to
IEC, the values are returned with the harmonic data. The integration time for these values equals the
acquisition window period.
Acquisition
Overlap
IEC mode operation conforms to IEC and EN requirements for compliance testing of harmonic currents
(EN 60555 Part 2 and related regulations). The ac source will accept parameters in the range shown
below, however, values greater or equal to (2^31)-1 will be interpreted as infinity. Record numbering
begins with one. The figure below defines the structure of the data returned by this query:
Fundamental
↓
40th Harmonic
Rms Current
Rms Voltage
Real Power
Record Number
Error Code
Command Syntax
Parameters
Examples
Related Commands
40 harmonic values
,
,
repeat <n> times
MEASure:ARRay:CURRent:HARMonic? <NRf+>
1 to 9.9E37
MEAS:ARR:CURR:HARM? 1024
ABORt SYST:CONF INST:NSEL SENS:WIND
SOUR:FREQ
87
Page 88

C - Command Summary
MEASure:ARRay:VOLTage:FLUCtuations:ALL?
This query measures voltage fluctuations in accordance with the IEC 868 standard. It is only available
when IEC mode is selected with SYSTem:CONFigure. The parameter specifies the number of Pst
integration periods during which data will be returned in response to the query.
This query returns the data structures associated with both the MEAS:ARR:VOLT:FLUC:FLIC query
and the MEAS:ARR:VOLT:FLUC:PST query. The Pst structure includes flicker perceptibility values
for the component percentiles making up Pst, the Pst value itself, various RMS voltage values (Dmax,
Dc, and Dt), together with indices for these RMS values that give their approximate location in the RMS
time series for the corresponding integration period.
An additional structure consisting of a 1024 point array of bins whose indices correspond to a set of
logarithmically weighted ranges of instantaneous flicker is returned for each Pst integration period. The
array covers a flicker perceptibility range of 0.01 to 10000 and the individual bins contain counts equal to
the accumulated number of occurrences of flicker within the bin range during the Pst integration period.
RMS voltage and instantaneous flicker values are returned once a second, while Pst data and the 1024
point arrays are returned once per Pst integration period. The data is always returned in order (i.e. the Pst
summary data immediately follows the last array of RMS voltage and flicker values for a given
integration period).
The total quantity of data returned by this query is demonstrated by the following example (assuming
50Hz operation): If CALCulate:INTegral:TIME specifies 10 minutes and <n> is set to 12, a 2 hour
measurement is initiated (10 minutes times 12) and a total of 1,466,856 data points are returned (202
times 60 times 10 plus the 14 item Pst summary record plus 1024 log points all times 12 Pst integration
periods).
This command is closely related to two similar commands that return different data (see
MEAS:ARR:VOLT:FLUC:FLIC and MEAS:ARR:VOLT:FLUC:ALL). The figure below defines the
structure of the data returned by this query:
88
Page 89

Command Summary - C
0
↓ voltage values
99
0
↓ flicker values
99
Record Number
Error Code
P_0.1
P_1s
P_3s
P_10s
P_50s
Pst
Dmax
Dmax index
Dc
Dc index
Dt
Dt index
Record Number
Error Code
0
↓
1023
,
100 (120) instantaneous
,
,
,
,
100 (120) rms
12 point Pst array
1024 log weighted bins
repeat 60 times
CALC:INT:TIME times <n>
,
repeat
<n> times
Command Syntax
Parameters
Examples
Returned Parameters
Related Commands
MEASure:ARRay:VOLTage:FLUCtuations:ALL? <NRf+>
1 to 1008
MEAS:ARR:VOLT:FLUC:ALL? 12
13,158 to 220,588,704 values
ABORt SYSTEM:CONF INST:NSEL
MEAS:ARR:VOLT:FLUC:PST?
MEAS:ARR:VOLT:FLUC:ALL?
89
Page 90

C - Command Summary
MEASure:ARRay:VOLTage:FLUCtuations:FLICker?
This query measures voltage fluctuations in accordance with the IEC 868 standard. It is only available
when IEC mode is selected with SYSTem:CONFigure. The parameter specifies the number of Pst
integration periods during which voltage fluctuation arrays will be returned in response to the query. The
data contained within the arrays represents RMS voltage values integrated over successive half line
cycles and the corresponding instantaneous flicker values. This query returns structured data at a rate of
one packet per second, with each packet contained 202 (50Hz) or 242 (60Hz) data points, for a period of
time determined by the specified CALCulate:INTegral:TIME and the parameter specifying the number of
Pst integration periods.
For example (assuming 50Hz operation): If CALCulate:INTegral:TIME specifies 10 minutes and <n> is
set to 12, a 2 hour measurement is initiated (10 minutes times 12) and 1,454,400 (202 points/sec times 60
times 10 minutes times 12) data points are returned.
This command is closely related to two similar commands that return different types of data (see
MEAS:ARR:VOLT:FLUC:PST and MEAS:ARR:VOLT:FLUC:ALL). Record numbering begins with
one. The figure below defines the structure of the data returned by this query:
0
↓ voltage values
99
0
↓ flicker values
99
Record Number
Error Code
Command Syntax
Parameters
Examples
Returned Parameters
Related Commands
,
100 (120) inst antaneous
,
,
100 (120) rms
repeat 60 times
CALC:INT:TIME times <n>
MEASure:ARRay:VOLTage:FLUCtuations:FLICker? <NRf+>
1 to 1008
MEASure:ARRay:VOLTage:FLUCtuations:FLICker? 12
12120 to 219,542,400 values
ABORt SYSTEM:CONF INST:NSEL
MEAS:ARR:VOLT:FLUC:PST?
MEAS:ARR:VOLT:FLUC:ALL?
90
Page 91

Command Summary - C
MEASure:ARRay:VOLTage:FLUCtuations:PST?
This query measures voltage fluctuations in accordance with the IEC 868 standard. It is only available
when IEC mode is selected with SYSTem:CONFigure. The parameter specifies the number of Pst
integration periods for which data will be returned in response to the query. This query returns 1 data
structure per specified integration period for a total of <n> structures.
For example: If CALCulate:INTegral:TIME specifies 10 minutes and <n> is set to 12, a 2 hour
measurement is initiated (10 minutes times 12) and 12 structures are returned. Since there are 14 data
points per structure, a total of 168 points are returned. The structure includes flicker perceptibility values
for the component percentiles making up Pst, the Pst value itself, various RMS voltage values (Dmax,
Dc, and Dt), together with indices for these RMS values that give their approximate location in the RMS
time series for the corresponding integration period.
This command is closely related to two similar commands that return different types of data (see
MEAS:ARR:VOLT:FLUC:FLIC and MEAS:ARR:VOLT:FLUC:ALL). Record numbering begins with
one. The figure below defines the structure of the data returned by this query:
P_0.1
P_1s
P_3s
P_10s
P_50s
Pst
Dmax
Dmax index
Dc
Dc index
Dt
Dt index
Record Number
Error Code
Command Syntax
Parameters
Examples
Returned Parameters
Related Commands
,
,
12 point Pst array
repeat <n> times
MEASure:ARRay:VOLTage:FLUCtuations:PST? <NRf+>
1 to 1008
MEAS:ARR:VOLT:FLUC:PST? 12
14 to 14,112 values
ABORt SYSTEM:CONF INST:NSEL
MEAS:ARR:VOLT:FLUC:FLIC?
MEAS:ARR:VOLT:FLUC:ALL?
91
Page 92

C - Command Summary
SENSe:CURRent:PREFerence
This command sets the phase reference for current harmonic phase measurements. If VOLTage is
selected, the reference is the fundamental component of the measured output voltage. If CURRent is
selected, the reference is the fundamental component of the measured output current.
Command Syntax
Parameters
*RST Value
Examples
Query Syntax
Returned Parameters
Related Commands
SENSe:CURRent:PREFerence <CRD>
VOLTage | CURRent
CURRent
SENS:CURR:PREF CURR
SENSe:CURRent:PREF?
<CRD>
ABORt MEAS:ARR:CURR:PHAS
SENSe:WINDow
This command sets the window function which is used in harmonic measurements. The choice of
parameters is affected by the SYSTem:CONF command. If NORMal is selected, HANNing, KBESsel,
or RECTangular may be selected. IF IEC mode is selected, only HANNing and RECTangular may be
selected. KBESsel is the preferred window and should be used for most measurements in NORMal
mode. HANNing and RECTangular are available for making harmonic current measurements that
comply with the regulatory requirements.
Command Syntax
Parameters
*RST Value
Examples
Query Syntax
Returned Parameters
Related Commands
SENSe:WINDow [:TYPE] <window>
HANNing | KBESsel | RECTangular
KBESsel
(RECTangular is the default setting when the HFTS software is run)
SENS:WIND RECT
SENSe:WINDow?
<CRD>
MEASure:ARRay:CURRent:HARMonic? SYSTem:CONF
MEASure:CURRent:HARMonic?
MEASure:ARRay:VOLTage:HARMonic?
MEASure:VOLTage:HARMonic?
92
Page 93

Command Summary - C
SYSTem:CONFigure
This command sets the overall operating mode for the Agilent 6800-Series AC Power Source/Analyzers.
The choices are normal mode, which causes the product to operate as a standard ac source, or IEC mode,
which modifies the basic behavior of the transient and measurement systems to facilitate IEC
measurements. SYSTem:CONFigure has a variety of global consequences that are summarized below:
NORMAL MODE IEC MODE
Base Sampling Rate
Output Frequency
Freq/Window/Fs Mode
Transient System
Slew Operation
MEASure:ARRay:CURRent
:HARM?
CALCulate:SMOothing
MEASure:ARRay:VOLTage
:FLUCtuations
CALCulate:INTegral:TIME
39.920792 kHz 38.400000 kHz
DC - 1000 Hz 50 Hz & 60 Hz Only
Independent Coupled
FIXEd/STEP/PULSe/LIST
Modes
AC & DC Voltage; Frequency AC Voltage Only
DC, Fundamental, and
Harmonics to 50th
Not/Available 1.5 Second Smoothing on/off
Not/Available FLICker | PST | ALL?
Not/Available 1 | 5 | 10 | 15 MINutes
FIXEd Mode Only
Fundamental and Harmonics
to 40th plus RMS Current,
RMS Voltage & Real Power
Transmission of a SYSTem:CONFigure command implies ABORt and terminates any transient or
measurement actions previously initiated.
Command Syntax
Parameters
*RST Value
Examples
Query Syntax
Returned Parameters
Related Commands
SYSTem:CONFigure <CRD>
NORMal | IEC
NORMal
SYST:CONF NORM
SYSTem:CONFigure?
<CRD>
ABORt MEAS:ARR:CURR MEAS:ARR:VOLT CALC:SMO
CALC:INT SENS:WIND
93
Page 94

Page 95

D
Class Determination
The following flowcharts document the class determination used by the Agilent 14761A HFTS software.
Class determination is a function of the Pre-test. The flowcharts illustrate
ñ the class determination process according to the device class that was selected in the Standard
Options window
ñ how a test is flagged as non-compliant based on class selection
ñ how the pre-test limits are calculated.
The A, B, C, and D class determination flowcharts are only valid for IEC 1000-2-2/EN 61000-2-2 Quasistationary harmonics.
The last flowchart in the series documents the class determination used for the older EN 60555 Part 2
(IEC 555-2) regulation. This regulation is selected in the Options menu, under Defaults.
95
Page 96

D - Class Determination
.+/+65.+/+65.+/+618'44+&'
(.#)6'56010%1/2.+#06
Class A Device Selected
56#46
01
/'#574'&
8#.7'+0
$170&5!
(.#)%.#555'.'%6+10+08#.+&
(.#)6'56010%1/2.+#06
01
;'5
01
/1614
&4+8'0
&'8+%'!
#
%.#55
9#8'(14/!
75'
#
%.#55
.+/+65
;'5
;'5
96
.+/+6
'0#$.'&!
6'56
18'44+&'
;'5
01
.+/+6
01
'0&
'0&
Class A Limits Logic (EN 61000-3-2)
18'44+&'
;'5
'0&
Page 97

Class B Device Selected
!
56#46
75'
%.#55#
.+/+65
Class Determination - D
'0&
01
6'56
.+/+618'44+&'
'0#$.'&!
Class B Limits Logic (EN 61000-3-2)
'0&
;'5
.+/+65.+/+65.+/+618'44+&'
01
.+/+618'44+&'
;'5
(.#)6'56010%1/2.+#06
'0&
97
Page 98

D - Class Determination
!
(.#)6'56010%1/2.+#06
Class C Device Selected
56#46
.+/+65(70&#/'06#.%744'06
TF*#4/10+%.+/+6(70&#/'06#.%744'062(
01
01
219'4
(#%614
18'44+&'
'0#$.'&!
TF*#4/10+%.+/+6(70&#/'06#.%744'06219'4(#%61418'44+&'
6'56
.+/+618'44+&'
'0#$.'&!
;'5
(.#)18'44+&'219'4(#%61418'44+&'
;'5
98
'0&
.+/+65.+/+65.+/+618'44+&'
01
'0&
.+/+618'44+&'
Class C Limits Logic (EN 61000-3-2)
;'5
'0&
Page 99

Class D Device Selected
Class Determination - D
56#46
75'
%.#55#
(14#..
.+/+65
*#4/10+%5
(.#)%.#555'.'%6+10
+08#.+&
'0&
01
75'%.#55#
(141&&
.+/+65
*#4/10+%5
01
01
/'#574'&
8#.7'+0
$170&5!
.+/+65O#9/'#574'&8#.7'
;'5
%.#55
9#8'(14/!
&
9#665
18'44+&'
'0#$.'&!
75'
%.#55#
(141&&
.+/+65
*#4/10+%5
;'5
;'5
01
9#665
18'44+&'
8#.7'
$170&5!
.+/+65
(.#)
;'5
+0
O#99#66518'44+&'
18'44+&'9#66518'44+&'
01
'0&
.+/+6
'0#$.'&!
6'56
18'44+&'
;'5
.+/+65
01
.+/+65.+/+6518'44+&'
18'44+&'
.+/+6
;'5
6'56010%1/2.+#06
'0&
(.#)
'0&
Class D Limits Logic (EN 61000-3-2)
99
Page 100

D - Class Determination
.+/+65.+/+65.+/+618'44+&'
(.#)6'56010%1/2.+#06
75'%.#55#.+/+65
EN 60555 Part 2 Regulation Selected
56#46
75'
%.#55
#
.+/+65
.+/+65.+/+65/#+05 81.65
01
01
%.#55
$
&'8+%'!
/#+05
81.6#)'
8!
;'5
;'5
100
01
'0&
.+/+6
'0#$.'&!
6'56
18'44+&'
'0&
Limits Logic (EN 60555 Part 2)
;'5
01
.+/+6
18'44+&'
!
;'5
'0&
 Loading...