

Page 1

ti
TI-89 / TI-92 Plus / Voyage™ 200
Statistics with List Editor
Important Information
Where to Find Install ation Instructions
How to contact Support and Service
License Agreement
Table of Contents
The Statistics with List Editor application (Stats/List Editor) adds inferential
and more advanced statistics functionality to the TI-89 / TI-92 Plus /
Voyage™ 200 PLT through an easy-to-use list editor interface.
The Stats/List Editor is really two application in one. The list editor
provides a means for viewing, editing, and working with data lists. The
Statistics portion of the application provides basic inferential and
advanced statistics functionality. The two work together to let you view
and perform statistical analyses on data lists.
Copyright © 1999–2002 Texas Instruments Incorporated
Page 2

Important Information
Texas Instruments makes no warrant y, eithe r expressed or im plied, including but not
limited to any implied warranties of merchantability and fitnes s for a particular purpose,
regarding any programs or book materials and makes such mat e r ials available solely on
an “as-is” basis.
In no event shall Texas Instruments be liable to anyone for s pecial, c ollater al, incident al,
or consequential damages in connection with or arising out of the purchase or use of
these materials, and the sole and exclusive liability of Texas Instruments, regardless of
the form of act ion, shall not exceed the pur c hase pr ice of this product. Moreover, Texas
Instruments shall not be liable for any claim of any kind whatsoever against the use of
these materials by any other party.
This graphing product application ( APP) is licensed. See t he t er m s of the license
agreement.
Where to Find Ins tallation I nstructions
You can find detailed instructions on installing Flash applications at
education.ti.com/guides
.
Texas Instrume nts (TI) Support and Ser vice Information
For General Information
E-mail: ti-cares@ti.com
Phone: 1-800-TI-CARES (1-800-842-2737)
For U.S., Canada, Mexico, Puerto Rico, and Vi r gi n I s l ands onl y
Home Page: education.ti.com
For Technical Questions
Phone: 1-972-917-8324
For Product (hardware) Ser vice
Customers in the U.S., Canada, Mexico, Puert o Ri co and Vi r gi n I slands: Always
contact Texas Instruments Customer Support before returning a product for service.
All other customers: Refer t o t he leaflet enclosed with this product (hardware) or contac t
your local Texas Instruments retailer/d ist r ibutor.
Page 3

End-User License Agreement
BY INSTALLING THIS SOFTWARE YOU AGREE TO ABIDE BY THE FOLLOWING PROVISIONS.
1. LICENSE: Texas Instruments Incorporated (“TI”) grants you a license to use and copy the software program(s)
(“License Materials”) contained on this diskette/CD/web site. You, and any subsequent user, may only use the
Licensed Materials on Texas Instruments calculator products.
2. RESTRICTIONS: You may not reverse-assemble or reverse-compile the Licensed Materials. You may not sell,
rent, or lease copies that you make.
3. COPYRIGHT: The Licensed Materials and any accompanying documentation are copyrighted. If you make
copies, do not delete the copyright notice, trademark, or protective notices from the copies.
4. WARRANTY: TI does not warrant that the Licensed Materials or documentation will be free from errors or that
they will meet your specific requirements. THE LICENSED MATERIALS ARE PROVIDED “AS IS” TO YOU OR
ANY SUBSEQUENT USER.
5. LIMITATIONS: TI makes no warranty or condition, either expressed or implied, including but not limited to any
implied warranties of merchantability and fitness for a particular purpose, regarding the Licensed Materials.
IN NO EVENT SHALL TI OR ITS SUPPLIERS BE LIABLE FOR ANY INDIRECT, INCIDENTAL, OR
CONSEQUENTIAL DAMAGES, LOSS OF PROFITS, LOSS OF USE OR DATA, OR INTERRUPTION OF
BUSINESS, WHETHER THE ALLEGED DAMAGES ARE LABELED IN TORT, CONTRACT, OR INDEMNITY.
SOME STATES OR JURISDICTIONS DO NOT ALLOW THE EXCLUSION OR LIMITATION OF INCIDENTAL
OR CONSEQUENTIAL DAMAGES, SO THE ABOVE LIMITATION MAY NOT APPLY.
IF YOU AGREE TO BE BOUND BY THIS LICENSE, CL ICK ON THE “ACCEPT” BUTTON; IF YOU DO NOT AGREE TO BE
BOUND BY THIS LICENSE, CLICK ON THE “DECLINE” BUTTON TO EXIT THE INSTALLATION.
Page 4

Table of Contents
Getting Started: Read This First!
Running and Quitting Stats/List Editor................................................................................................2
Stats/List Editor CATALOG .................................................................................................................. 3
Stats/List Editor Screens......................................................................................................................4
Example: Pendulum Lengths and Periods..........................................................................................5
Example: Entering the Data...........................................................................................................6
Example: Plotting the Data............................................................................................................7
Example: Fitting a Line to the Data...............................................................................................8
Example: Producing a Scatter Plot of the Residuals ..................................................................9
Example: Producing a Power Regression..................................................................................11
Example: Producing Another Residual Plot with the New Data...............................................12
Example: Producing Magnitudes of the Residuals....................................................................13
Example: Making Predictions with the Model............................................................................14
Error Messages....................................................................................................................................15
List Editor
Using the List Editor............................................................................................................................ 18
Creating Lists.......................................................................................................................................20
Removing Lists....................................................................................................................................21
Editing a List Element.........................................................................................................................23
Formulas .............................................................................................................................................. 24
ƒ Tools Menu
Setup Editor ............................................. .. ... .. .. .. .. .. .. .. .. .. .. .. .. ... .. .. .. .. .. .. .. .. .. .. .. .. ... .. .. .. .. .. .. .. .. .. .. .. ... .. .. .. .. 28
Copy and Paste....................................................................................................................................29
Clear a-z............................................................................. .. .. ... .. .. .. .. .. .. .. .. .. .. .. .. ... .. .. .. .. .. .. .. .. .. .. .. ... .. .. .. .. 30
Clear Editor ................................................ ... .. .. .. .. .. .. .. .. .. .. .. .. ... .. .. .. .. .. .. .. .. .. .. .. .. ... .. .. .. .. .. .. .. .. .. .. .. ... .. .. .. .. 31
Format .................................................................................................................................................. 32
About ....................................................................................................................................................33
„ Plots Menu
Plot Setup..................................................................................................... .. .. ... .. .. .. .. .. .. .. .. .. .. .. ... .. .. .. .. 36
Norm Prob Plot (Normal Probability Plot).........................................................................................38
PlotsOff (Plots Off) and FnOff (Functions Off)..................................................................................40
… List Menu
Introduction..........................................................................................................................................42
Names Menu ........................................................................................................................................ 43
Ops (Operations) Menu.......................................................................................................................44
Sort List.........................................................................................................................................45
Sort List, Adjust All.......................................................................................................................46
dim(................................................................................................................................................47
Fill...................................................................................................................................................48
seq( ................................................................................................................................................ 49
cumSum( ....................................................................................................................................... 50
@List(.............................................................................................................................................. 51
TI-89 / TI-92 Plus / Voyage™ 200 PLT Statistics with List Editor App iv
Page 5

… List Menu (continued)
augment(........................................................................................................................................52
left(.................................................................................................................................................53
mid(................................................................................................................................................54
right(...............................................................................................................................................55
Math Menu.................................................................................................. .. .. .. ... .. .. .. .. .. .. .. .. .. .. .. ... .. .. .. .. 56
min(................................................................................................................................................57
max( ...............................................................................................................................................58
mean(.............................................................................................................................................59
median(.......................................................................................................................................... 60
sum(...............................................................................................................................................61
product(.........................................................................................................................................62
stdDev(...........................................................................................................................................63
variance(........................................................................................................................................64
stDevPop(...................................................................................................................................... 65
varPop( .......................................................................................................................................... 66
Attach List Formula................................................................................. .. .. .. .. ... .. .. .. .. .. .. .. .. .. .. .. ... .. .. .. .. 67
Delete Item ........................................................................................................................................... 68
† Calc Menu
Introduction..........................................................................................................................................70
1.Var Stats (One-Variable Statistics).................................................................................................71
2.Var Stats (Two-Variable Statistics).................................................................................................73
Regressions Menu...............................................................................................................................76
LinReg(a+bx).................................................................................................................................77
LinReg(ax+b).................................................................................................................................79
MedMed .........................................................................................................................................81
QuadReg........................................................................................................................................83
CubicReg....................................................................................................................................... 85
QuartReg ....................................................................................................................................... 87
LnReg.............................................................................................................................................89
ExpReg .......................................................................................................................................... 91
PowerReg ......................................................................................................................................93
Logist83......................................................................................................................................... 95
Logistic.......................................................................................................................................... 97
SinReg ........................................................................................................................................... 99
MultReg........................................................................................................................................101
Probability Menu................................................................................................................................102
rand83(.........................................................................................................................................103
nPr(...............................................................................................................................................104
nCr( .............................................................................................................................................. 105
! (factorial) ...................................................................................................................................106
randInt( ........................................................................................................................................ 107
.randNorm( .................................................................................................................................. 108
randBin(.......................................................................................................................................109
randSamp(...................................................................................................................................110
rand(.............................................................................................................................................111
RandSeed ....................................................................................................................................112
CorrMat (Correlation Matrix).............................................................................................................113
Show Stats ................................................. ... .. .. .. .. .. .. .. .. .. .. .. .. ... .. .. .. .. .. .. .. .. .. .. .. .. ... .. .. .. .. .. .. .. .. .. .. .. ... .. .. .. 114
TI-89 / TI-92 Plus / Voyage™ 200 PLT Statistics with List Editor App v
Page 6

‡ Distr (Distribution) Menu
Shade Menu .......................................................................................................................................116
Shade Normal..............................................................................................................................117
Shade t.........................................................................................................................................118
Shade Chi-square.......................................................................................................................119
Shade F........................................................................................................................................120
Inverse Menu......................................................................................................................................121
Inverse Normal............................................................................................................................122
Inverse t.......................................................................................................................................123
Inverse Chi-square .....................................................................................................................124
Inverse F......................................................................................................................................125
Normal Pdf ......................................................................................................................................... 126
Normal Cdf ............................................... .. ... .. .. .. .. .. .. .. .. .. .. .. .. ... .. .. .. .. .. .. .. .. .. .. .. .. ... .. .. .. .. .. .. .. .. .. .. .. ... .. .. .. 128
t Pdf..................................................................................................................................................... 129
t Cdf ....................................................................................................................................................131
Chi-square Pdf................................................................................................................................... 132
Chi-square Cdf......................................................................................... .. .. .. ... .. .. .. .. .. .. .. .. .. .. .. .. ... .. .. .. 133
F Pdf.................................................................................................................................................... 134
F Cdf ...................................................................................................................................................135
Binomial Pdf.................................................................. .. .. .. .. ... .. .. .. .. .. .. .. .. .. .. .. .. ... .. .. .. .. .. .. .. .. .. .. .. ... .. .. .. 136
Binomial Cdf....................................................................................................................................... 137
Poisson Pdf........................................................................................................................................137
Poisson Cdf........................................................................................................................................139
Geometric Pdf....................................................................................................................................140
Geometric Cdf....................................................................................................................................141
ˆ Tests Menu
Z-Test..................................................................................................................................................144
T-Test..................................................................................................................................................146
2-SampZTest......................................................................................................................................148
2-SampTTest......................................................................................................................................151
1-PropZTest........................................................................................................................................154
2-PropZTest........................................................................................................................................156
Chi2 GOF............................................................................................................................................ 158
Chi2 2-way..........................................................................................................................................160
2-SampFTest......................................................................................................................................163
LinRegTTest.......................................................................................................................................165
MultRegTests.....................................................................................................................................168
ANOVA................................................................................................................................................171
ANOVA2-Way..................................................................................................................................... 173
‰ Ints (Intervals) Menu
ZInterval..............................................................................................................................................178
TInterval..............................................................................................................................................180
2-SampZInt.........................................................................................................................................182
2-SampTInt.........................................................................................................................................184
1-PropZInt...........................................................................................................................................186
2-PropZInt...........................................................................................................................................188
LinRegTInt..........................................................................................................................................190
MultRegInt.......................................................................................................................................... 193
TI-89 / TI-92 Plus / Voyage™ 200 PLT Statistics with List Editor App vi
Page 7
Getting Started: Read This Fir st!
Running and Quitting Stats/List Editor................................................................................................2
Stats/List Editor CATALOG .................................................................................................................. 3
Stats/List Editor Screens......................................................................................................................4
Example: Pendulum Lengths and Periods..........................................................................................5
Example: Entering the Data...........................................................................................................6
Example: Plotting the Data............................................................................................................7
Example: Fitting a Line to the Data...............................................................................................9
Example: Producing a Scatter Plot of the Residuals ................................................................10
Example: Producing a Power Regression..................................................................................12
Example: Producing Another Residual Plot with the New Data...............................................13
Example: Producing Magnitudes of the Residuals....................................................................14
Example: Making Predictions with the Model............................................................................15
Error Messages....................................................................................................................................16
The Statistics with List Editor Application (Stats/List Editor) for the TI-89 /
TI-92 Plus / Voyage™ 200 PLT is two applications in one. Stats/List Editor
includes a list editor that provides a means for viewing, editing, and working
with statistical data in lists. Stats/List Editor also provides basic inferential
and advanced statistics functionality. The two work together to let you view
and perform statistical analyses on data lists.
Note: You must set your TI-89 / TI-92 Plus / Voyage 200 PLT to the AUTO or APPROXIMATE mode
when using the Stats/List Editor application.
TI-89 / TI-92 Plus / Voyage™ 200 PLT Statistics with List Editor App Getting Started 1
Page 8
Running and Quitting Stats/List Editor
Running Stats/List Editor
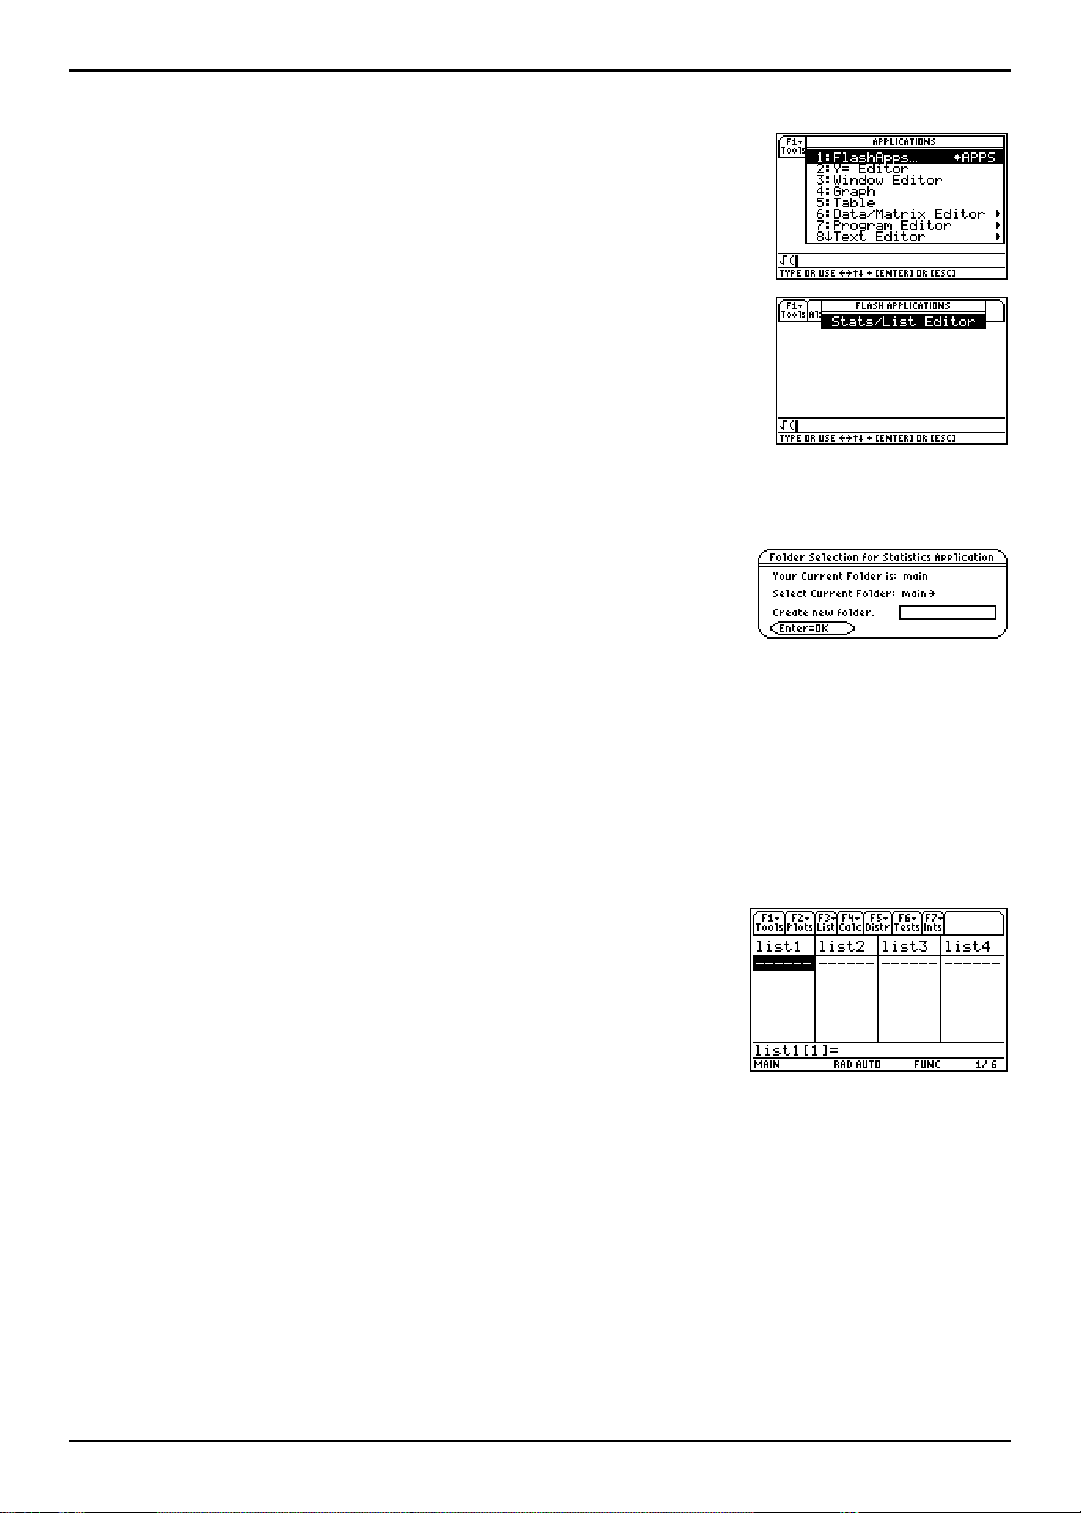
After installing Stats/List Editor:
1. Press 9.
2. Highlight Stats/List Editor.
3. Press ¸. The Folder Selection for Statistics Application
dialog box appears.
4. Press B to display the folders in the Select Current Folder
field. Highlight the
¸.
main folder, and then press ¸
Note: The Select Current Folder option always displays the folder
names 1:main and 2:statvars, but it displays other folders only if
you have created them. The statvars folder is primarily used by
the Stats/List Editor Application. It is recommended that you use
the main folder, or a folder that you have created as your current
folder. Refer to your guidebook for more information on creating,
setting, and deleting folders.
5. Press ¸ when you have selected or created a folder.
The list editor is displayed.
Quitting Stats/List Editor
To exit Stats/List Editor and return to the calculator Home screen:
¦ Press - l.
¦ Press O and select another application.
Tip: Press 2 a to toggle between applications.
Any lists or other variables that you or the application stored while using Stats/List Editor are
retained in memory. Variables that you created are stored in the current folder. Variables
generated by Stats/List Editor are stored in the
Tip: Press 2 ° from anywhere on the calculator to open the VAR-LINK [All] menu.
TI-89 / TI-92 Plus / Voyage™ 200 PLT Statistics with List Editor App Getting Started 2
STATVARS folder.
Page 9
Stats/List Editor CATALOG
Accessing the Flash Apps CATALOG
Most statistical capabilities provided by the Stats/List Editor Application are also
available for use from the Home screen and in programming.
Copy any function or instruction from the
and paste it into the entry line on the previous screen.
1. To access the
¦ ½ … (
¦ 2 ½ … (
CATALOG with all Flash Apps functions is displayed.
The
Flash Apps CATALOG, press:
Flash Apps) for the TIL89
Flash Apps) for the TI-92 Plus / Voyage™ 200 PLT
2. Use the up and down arrow keys (C D) to move the cursor (ú) to the Stats/List
Editor function that you want to use.
3. Press ¸ to paste the function or instruction to the entry line of previous
screenlist editor, Home screen, program, etc.
Tip: To find an item in the CATALOG quickly, press the first letter in the item name. (You do not have
to press j first.) The cursor (ú) moves to the first item that begins with that letter. Use C and D to
scroll the CATALOG until you find the item you are looking for.
Understanding the CATALOG Screen
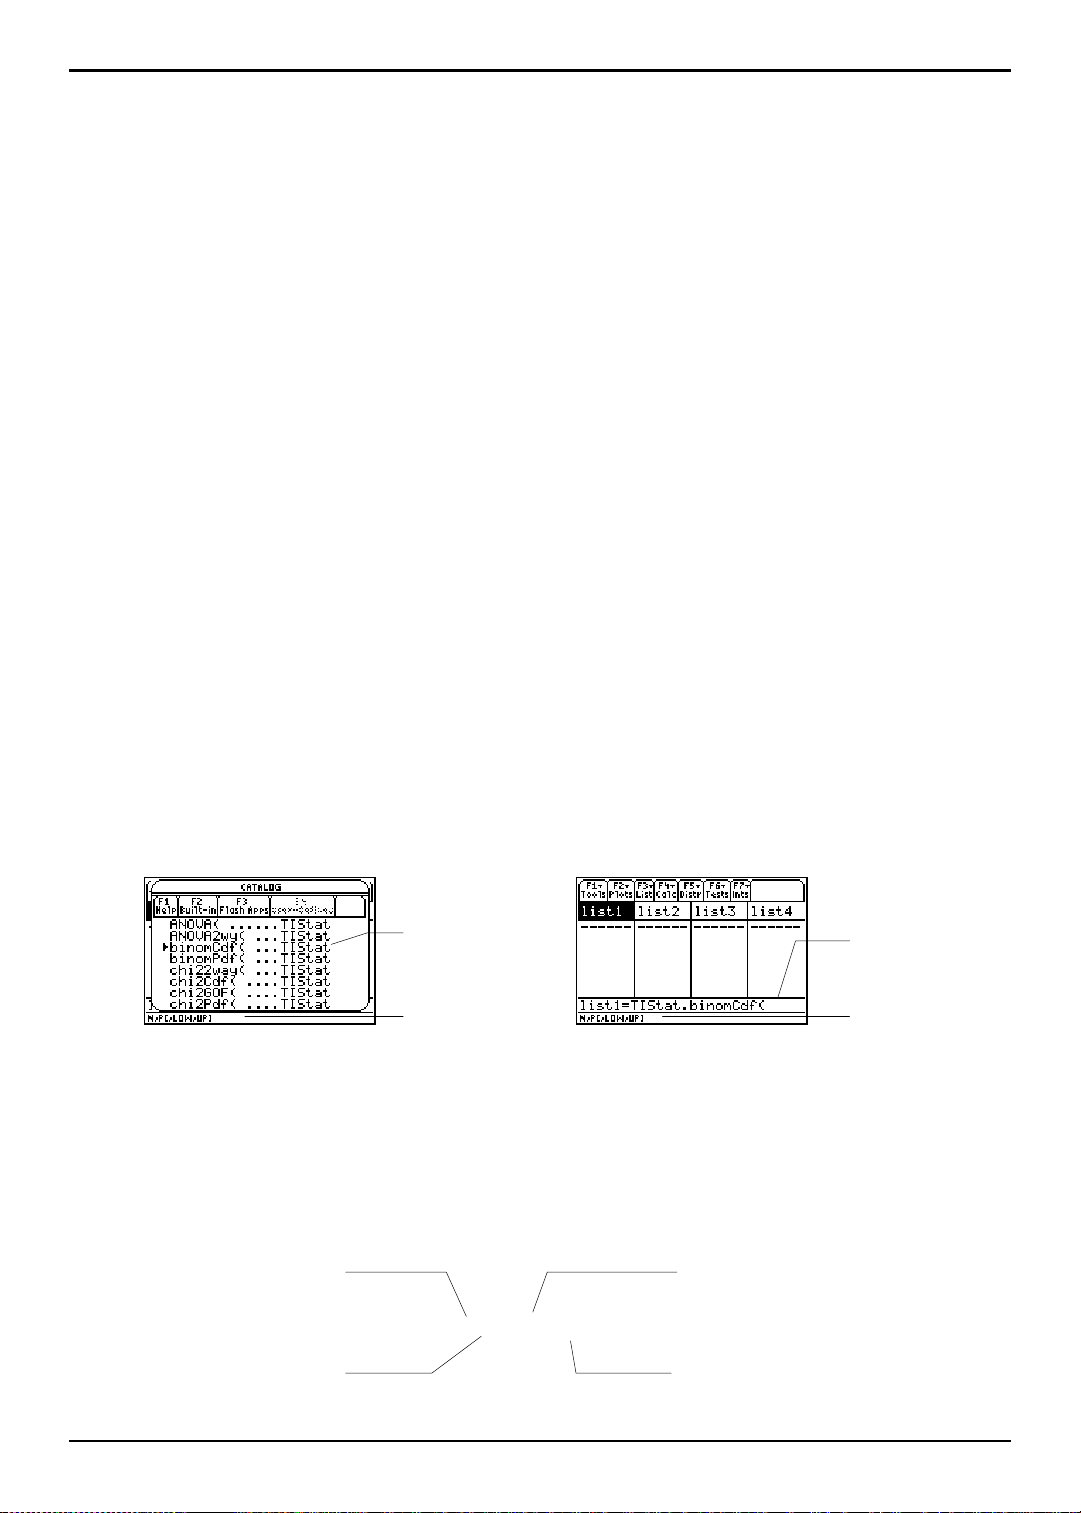
To resolve duplicate name conflicts from other applications, the application name is
combined with the function name. When viewed in the
application name follows the function name
line, the application name precedes the function name
CATALOG (including the Flash Apps CATALOG)
Flash Apps CATALOG, the
binomCdf(...TIStat. When placed in the entry
TIStat.binomCdf(.
Syntax
Flash Apps CATALOG with binomCdf( selected List editor with binomCdf( pasted to entry line
Function name
(binomCdf) with
application (TIStat)
identified
Status line containing
syntax for binomCdf
Function name (binomCdf)
with application prefix
(TIStat). Enter arguments
here.
Status line containing
syntax for binomCdf
In the CATALOG, each function’s syntax (all arguments and punctuation needed to
execute the function) is included in the status line to help enter you enter the correct
arguments for the function. This is especially useful for programming.
Tip: Press ƒ (Help) from the CATALOG to view the selected syntax statement at a larger size.
Example: binomCdf
N = Number of trials
LOW = Lower limit
N,P[,LOW,UP]
P = Probability of success
UP = Upper limit
Notes: Always separate arguments with commas. Arguments in brackets are optional.
TI-89 / TI-92 Plus / Voyage™ 200 PLT Statistics with List Editor App Getting Started 3
Page 10
Stats/List Editor Screens
Understanding the Stats/List Editor Screens
The three primary screens used in Stats/List Editor are shown below.
Note: All the screens used in this documentation were taken from the TI-89 calculator. The screens
displayed on the TI-92 Plus / Voyage™ 200 PLT are similar.
list editor menus dialog boxes
From the list editor
screen, you can:
¦ Store, display, and edit
statistical input data in
lists.
¦ Perform statistical
analyses and store
results in output lists.
From menus you can
access various statistical
operations. For example,
F4 Calc menu lets
the
you calculate:
¦ One- or two-variable
statistics.
¦ Several types of
regressions such as
exponential, linear, and
quadratic regressions.
In dialog boxes, you can
view:
¦ Prompts for data input.
¦ Data output of
statistical calculations.
¦ System messages.
You begin most of the procedures found in this guidebook at the list editor screen, where
you execute instructions, perform statistical analyses, and view the results.
TI-89 / TI-92 Plus / Voyage™ 200 PLT Statistics with List Editor App Getting Started 4
Page 11
Example: Pendulum Lengths and Periods
Problem Setup
This is a fast-paced introduction to solving problems with Stats/List Editor. Read the remaining
chapters for details.
A group of students is trying to determine the mathematical relationship between the length of
a pendulum and its period (one complete swing of a pendulum). The group makes a simple
pendulum from string and washers and then suspends it from the ceiling. They record the
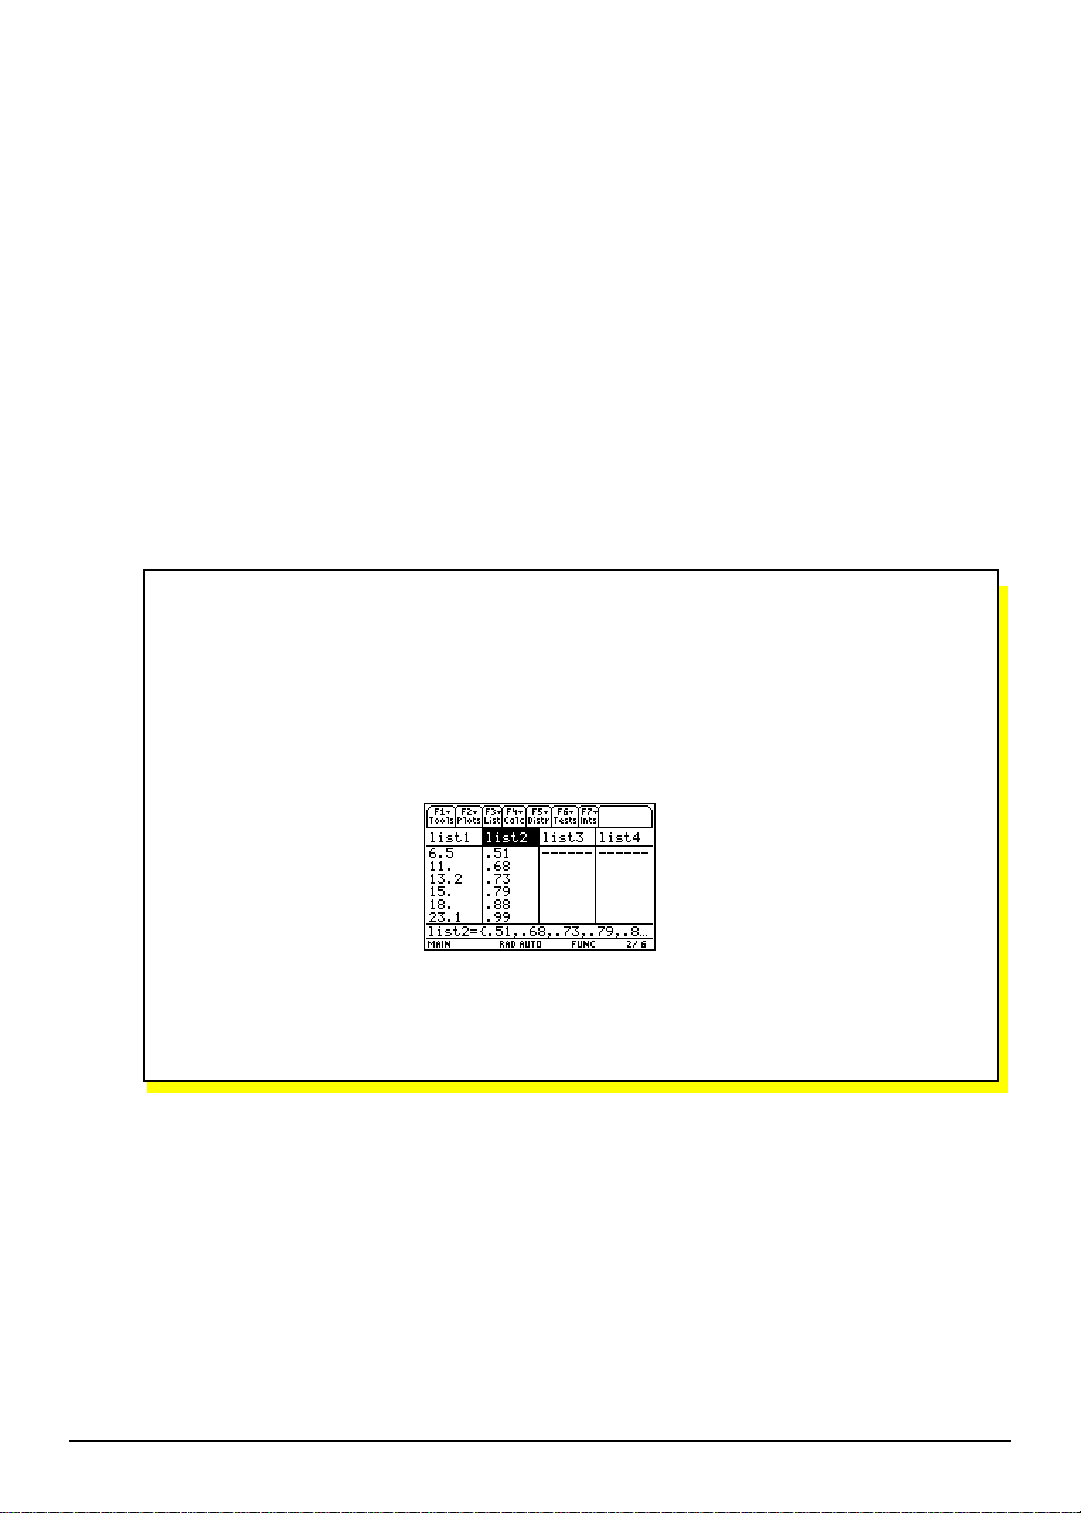
pendulum’s period for each of 12 string lengths.
Length (cm) Time (sec)
6.5 .51
11 .68
13.2 .73
15 .79
18 .88
23.1 .99
24.4 1.01
26.6 1.08
30.5 1.13
34.3 1.26
37.6 1.28
41.5 1.32
List Editor Setup
1. Display the list editor screen.
2. If necessary, press z B and then select
FUNCTION graphing mode.
the
1:Function to set
Press ¸ to return to the list editor screen.
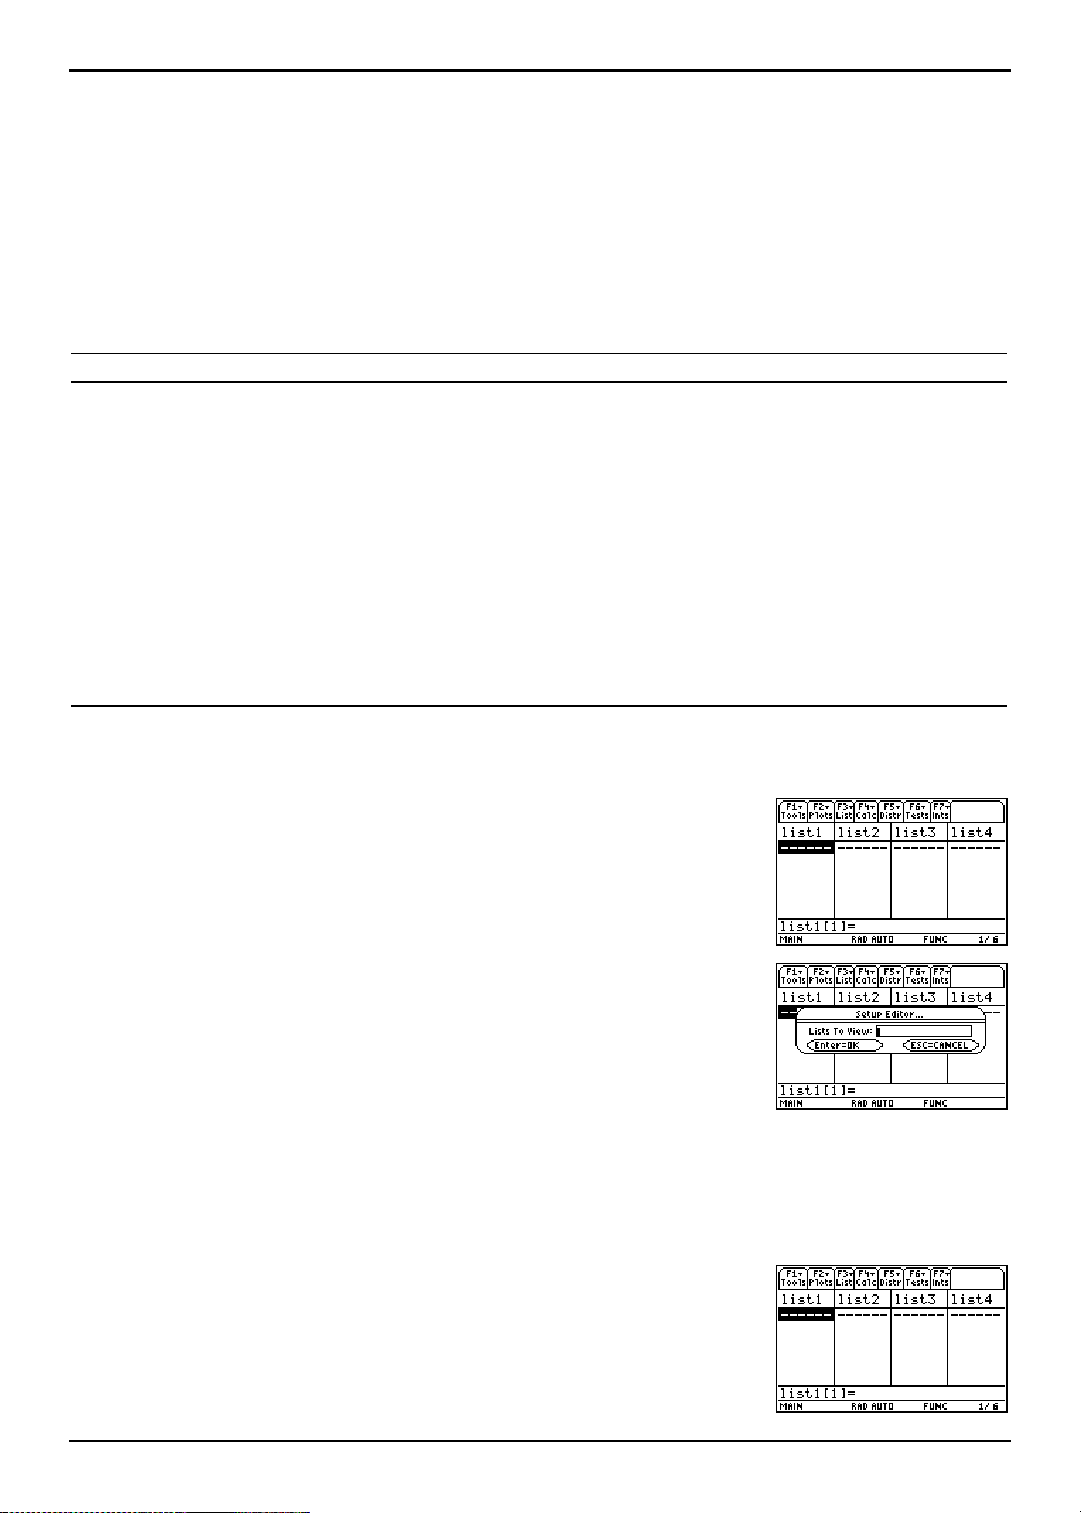
3. Press ƒ (Tools) and select 3:Setup Editor to display the
Setup Editor dialog box.
4. Press ¸ to close the Setup Editor dialog box without
entering any list names in the
Lists To View field.
This removes all lists from the list editor and restores the
list names list1 through list6 to columns 1 through 6.
Note: Removing lists from the list editor does not delete them from
memory. However, clearing elements from lists does delete the
elements permanently from memory.
5. If elements are stored in either list1 or list2, clear them.
Move the rectangular cursor onto
‘ B ‘ ¸ to clear
list1, and then press
list1 and list2.
TI-89 / TI-92 Plus / Voyage™ 200 PLT Statistics with List Editor App Getting Started 5
Page 12
Example: Entering the Data
1. Use the arrow keys (A B C D) to move the rectangular
cursor to the first element in
list1.
ress
P
6 Ë 5 Í
(6.5 cm) in
list1. The rectangular cursor moves to the next
to store the first pendulum string length
row.
Repeat this step to enter each of the 12 string length
values.
Length (cm):
6.5
11
13.2
15
18
23.1
24.4
26.6
30.5
34.3
37.6
41.5
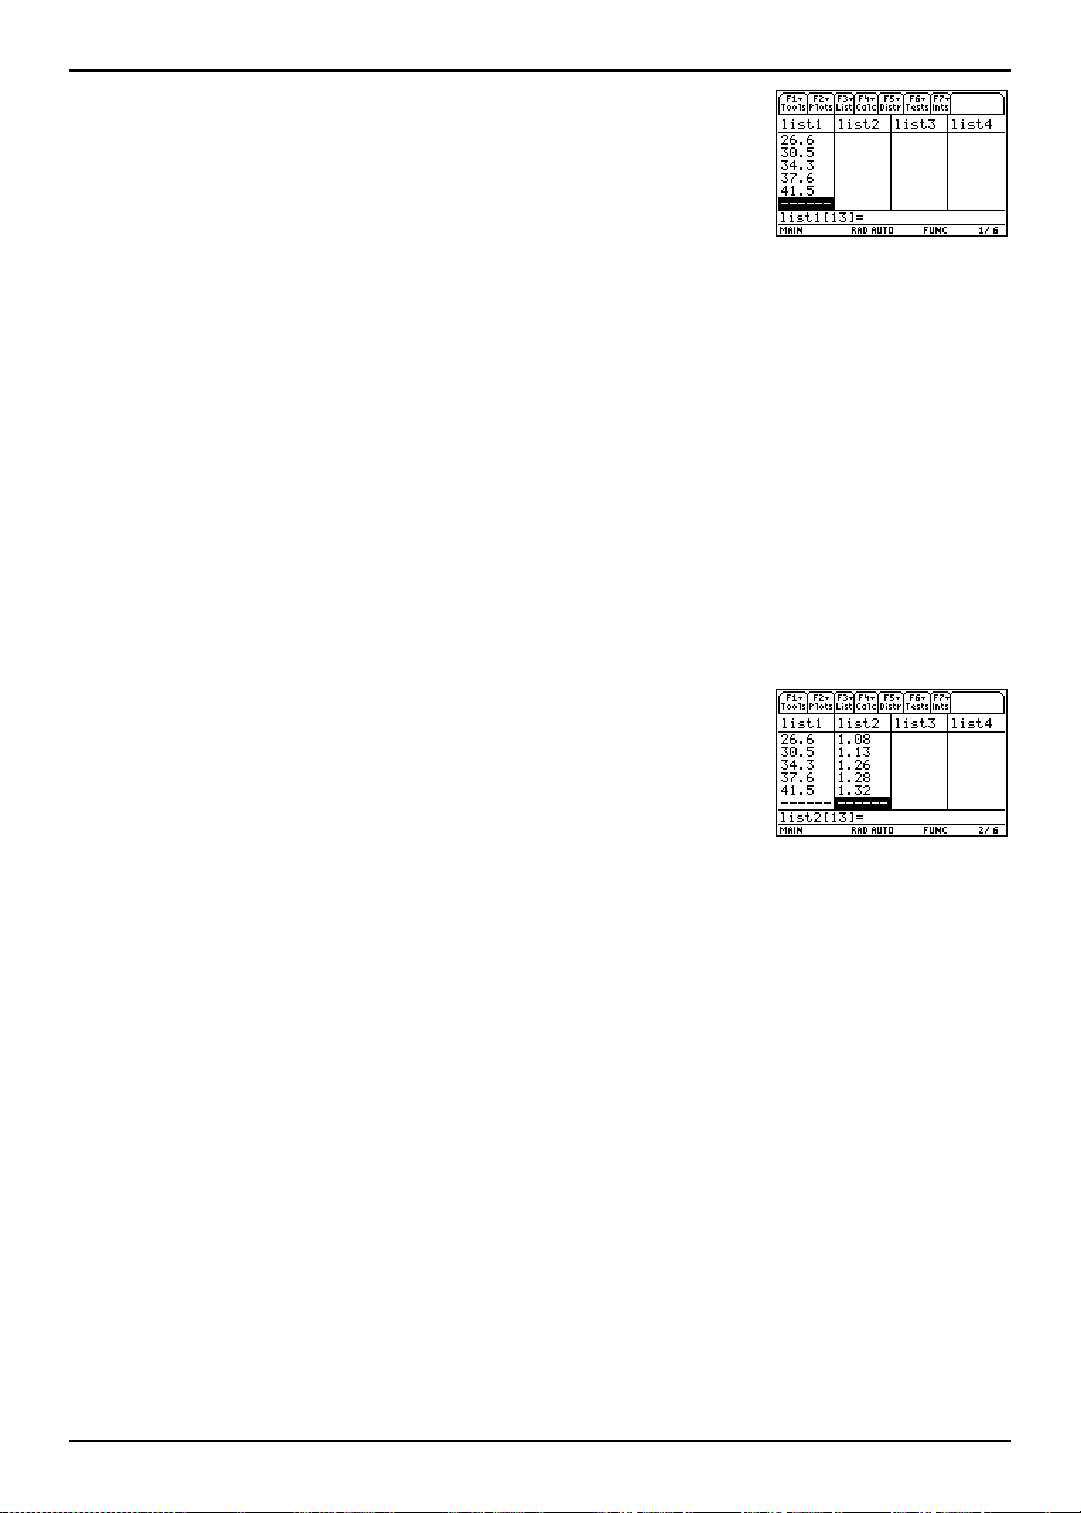
2. Use the arrow keys to move the rectangular cursor to the
first element in
list2.
Press Ë 51 Í to store the first time measurement (.51
sec) in
list2 and to move the rectangular cursor to the next
row.
Repeat this step to enter each of the 12 time values.
Time (sec):
.51
.68
.73
.79
.88
.99
1.01
1.08
1.13
1.26
1.28
1.32
TI-89 / TI-92 Plus / Voyage™ 200 PLT Statistics with List Editor App Getting Started 6
Page 13
Example: Plotting the Data
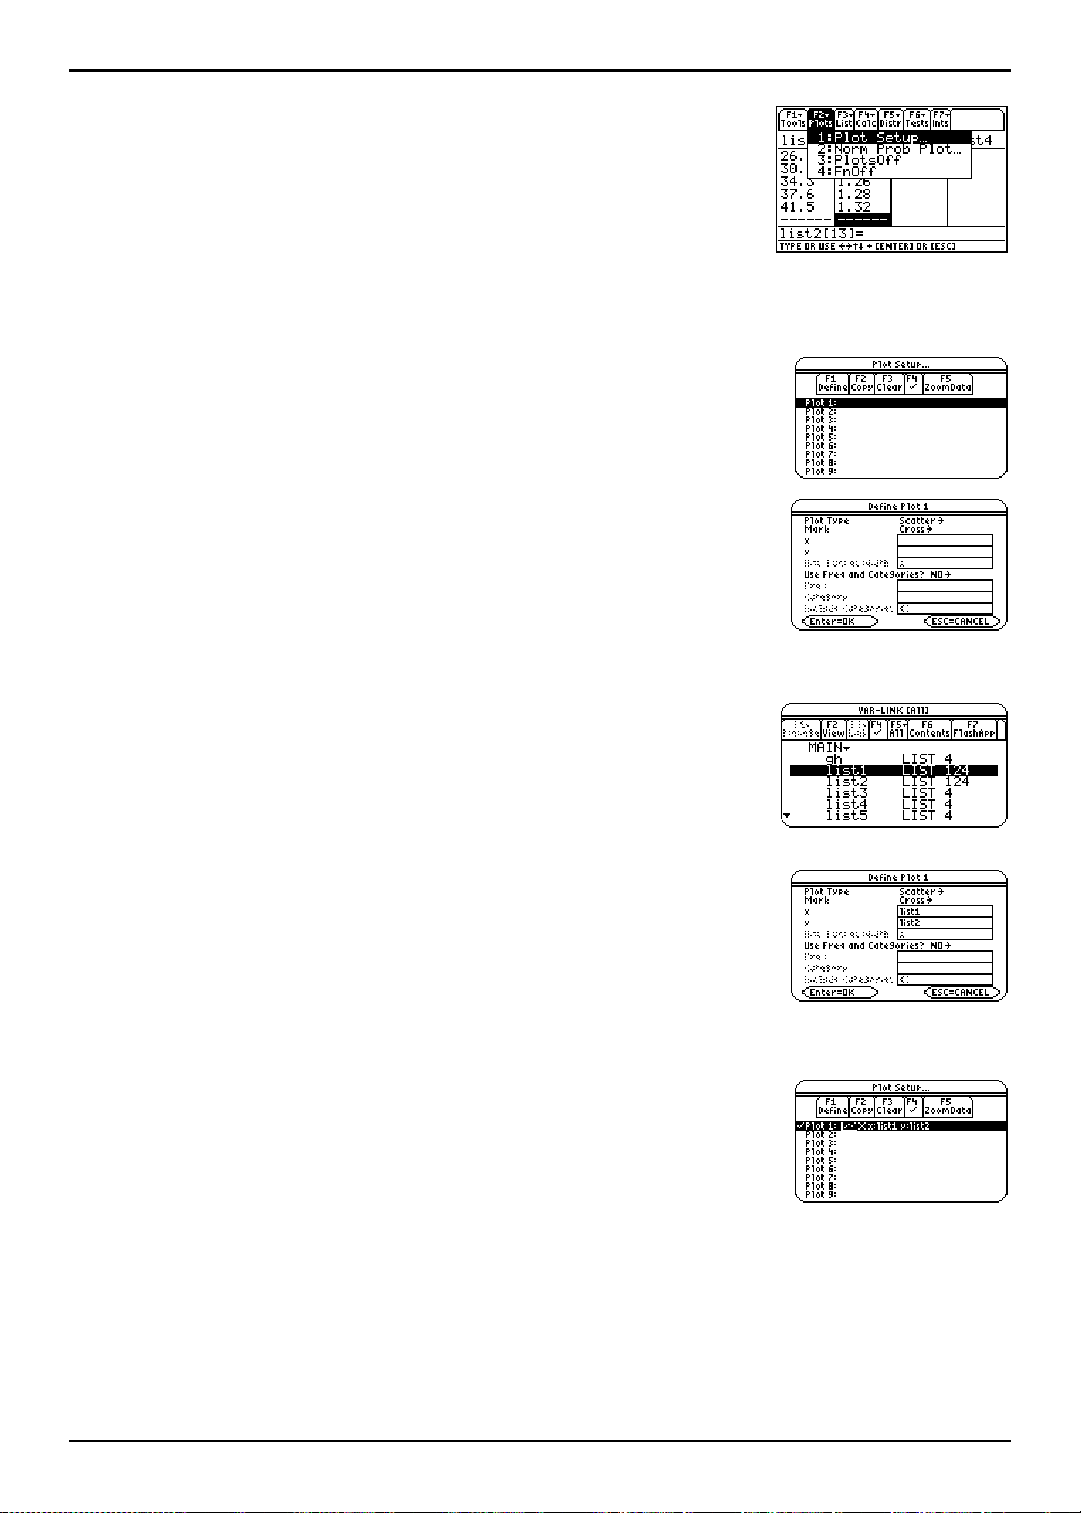
1. Press „ (Plots) to display the F2 Plots menu.
2. From the F2 Plots menu:
¦ Select 3:PlotsOff to turn off all plots.
¦ Select
4:FnOff to turn off all Y = functions.
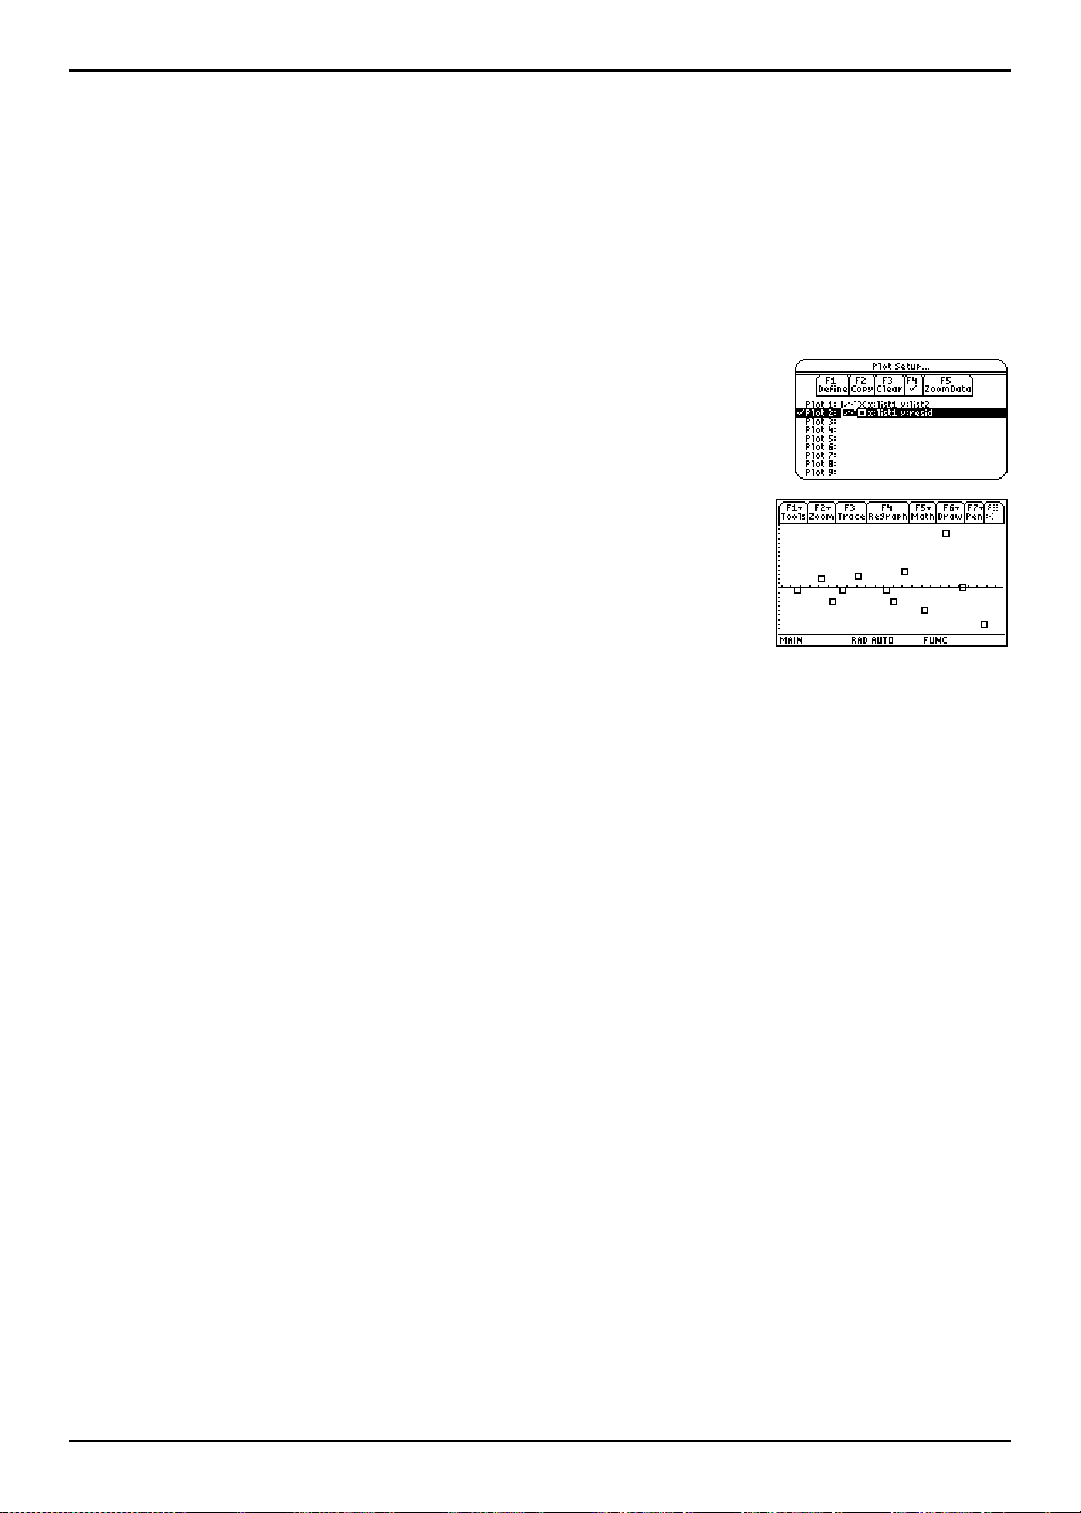
3. Press „ (
Plots). Select 1:Plot Setup to display the Plot Setup
dialog box.
Note: Your Plot Setup dialog box may not look exactly like the one
shown here.
4. Highlight Plot 1 and press ƒ (Define) to display the Define Plot 1
dialog box.
Scatter is not displayed, press B and select 1:Scatter.
5. If
6. Press D. If Cross is not displayed, press B and select
2:Cross (+) for the type of mark used for each data point on
the scatter plot.
7. Press D to move the cursor to the x field. Then press
2 ° to display the
list1 and press Í to paste list1 in the x value field.
Note: If the contents of the MAIN folder are not displayed, highligh t
the MAIN folder and then press B to expand it.
VAR-LINK [All] menu. Highlight
8. Press D to move the cursor to the y value field. Then press
2 ° to display the
Highlight
list2 and press Í to paste list2 in the y value
VAR-LINK [All] menu again.
field.
9. Press D to move the cursor to the Use Freq and Categories?
field. If
Categories?
NO is not displayed, press B and set Use Freq and
to NO.
10. Press Í to close the dialog box with changes saved.
Plot1 is selected.
Tip: The ¸ key evaluates an expression, executes an instruction, or
selects a menu item. When using the input examples in this guidebook
you may need to press ¸ more than once in order to calculate the
results. Press ¸ once to save your information, and then press ¸
again to close a dialog box.
TI-89 / TI-92 Plus / Voyage™ 200 PLT Statistics with List Editor App Getting Started 7
Page 14
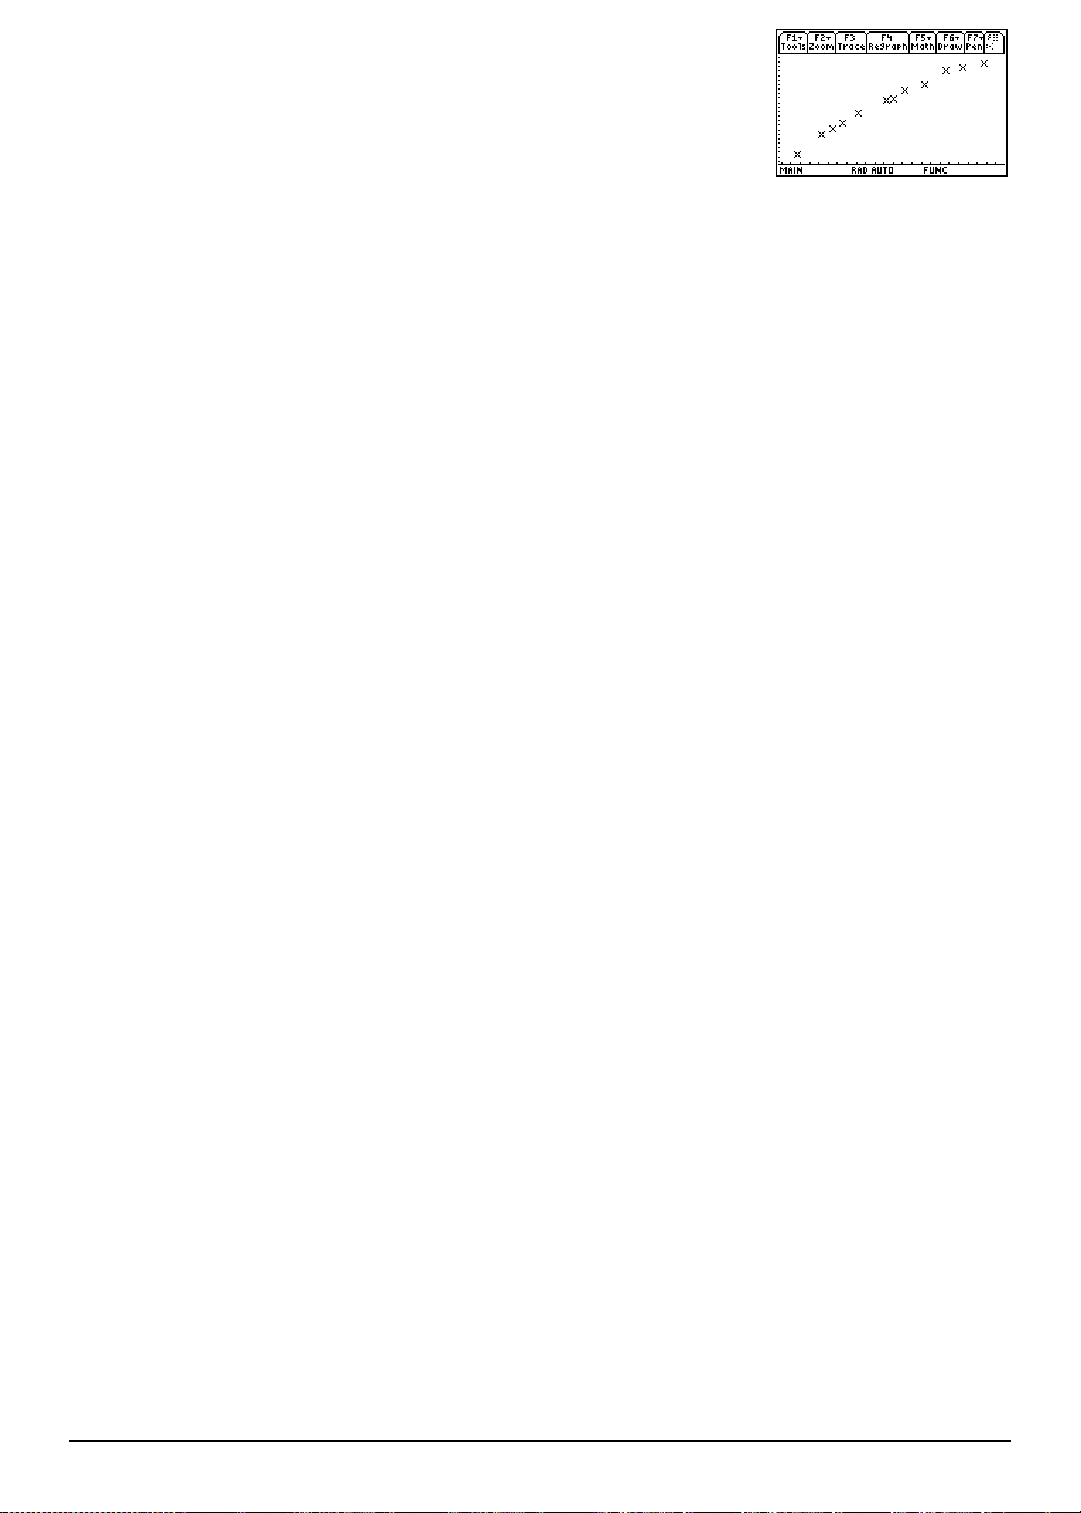
11. Press ‡ (ZoomData) to make sure the entire plot may be
viewed in the calculator screen and to begin plotting the
data.
Tip: To return to the list editor after graphing an equation or plotting
data, press 2 a.
TI-89 / TI-92 Plus / Voyage™ 200 PLT Statistics with List Editor App Getting Started 8
Page 15
Example: Fitting a Line to the Data
Since the scatter plot of time-versus-length data appears to be approximately linear, fit a line to the
data.
1. Press 2 a to return to the list editor.
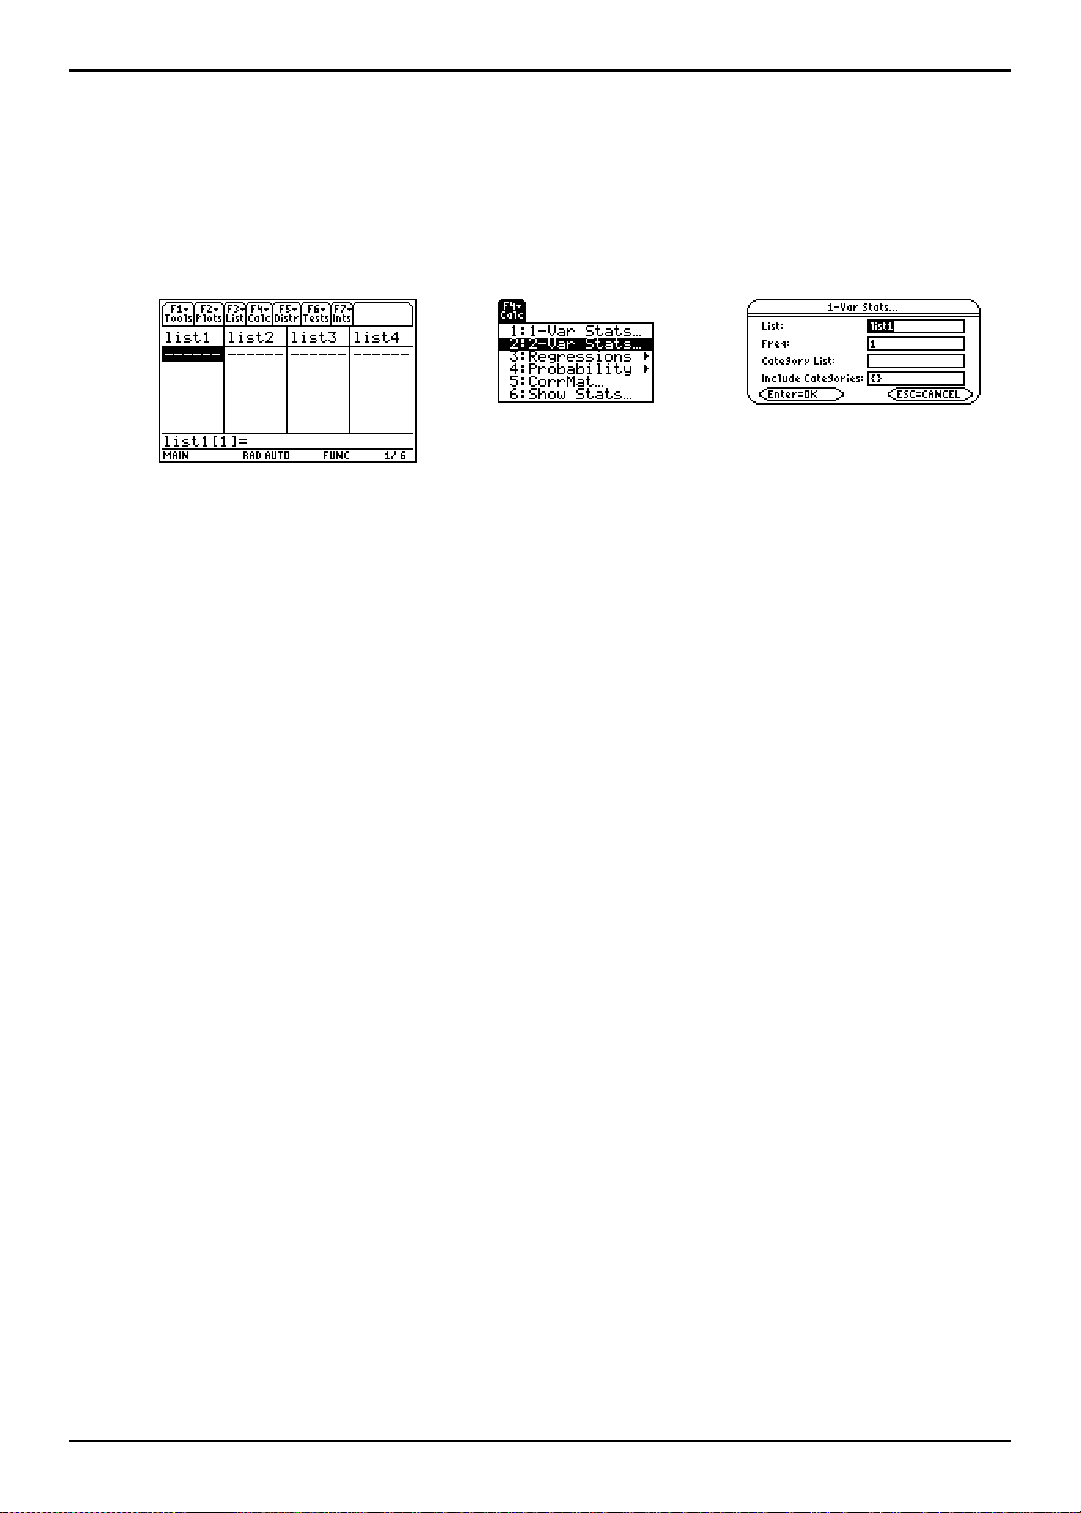
2. Press † (Calc) and select 3:Regressions to display the
Regressions menu. Then select
LinReg(a+bx) input dialog box.
the
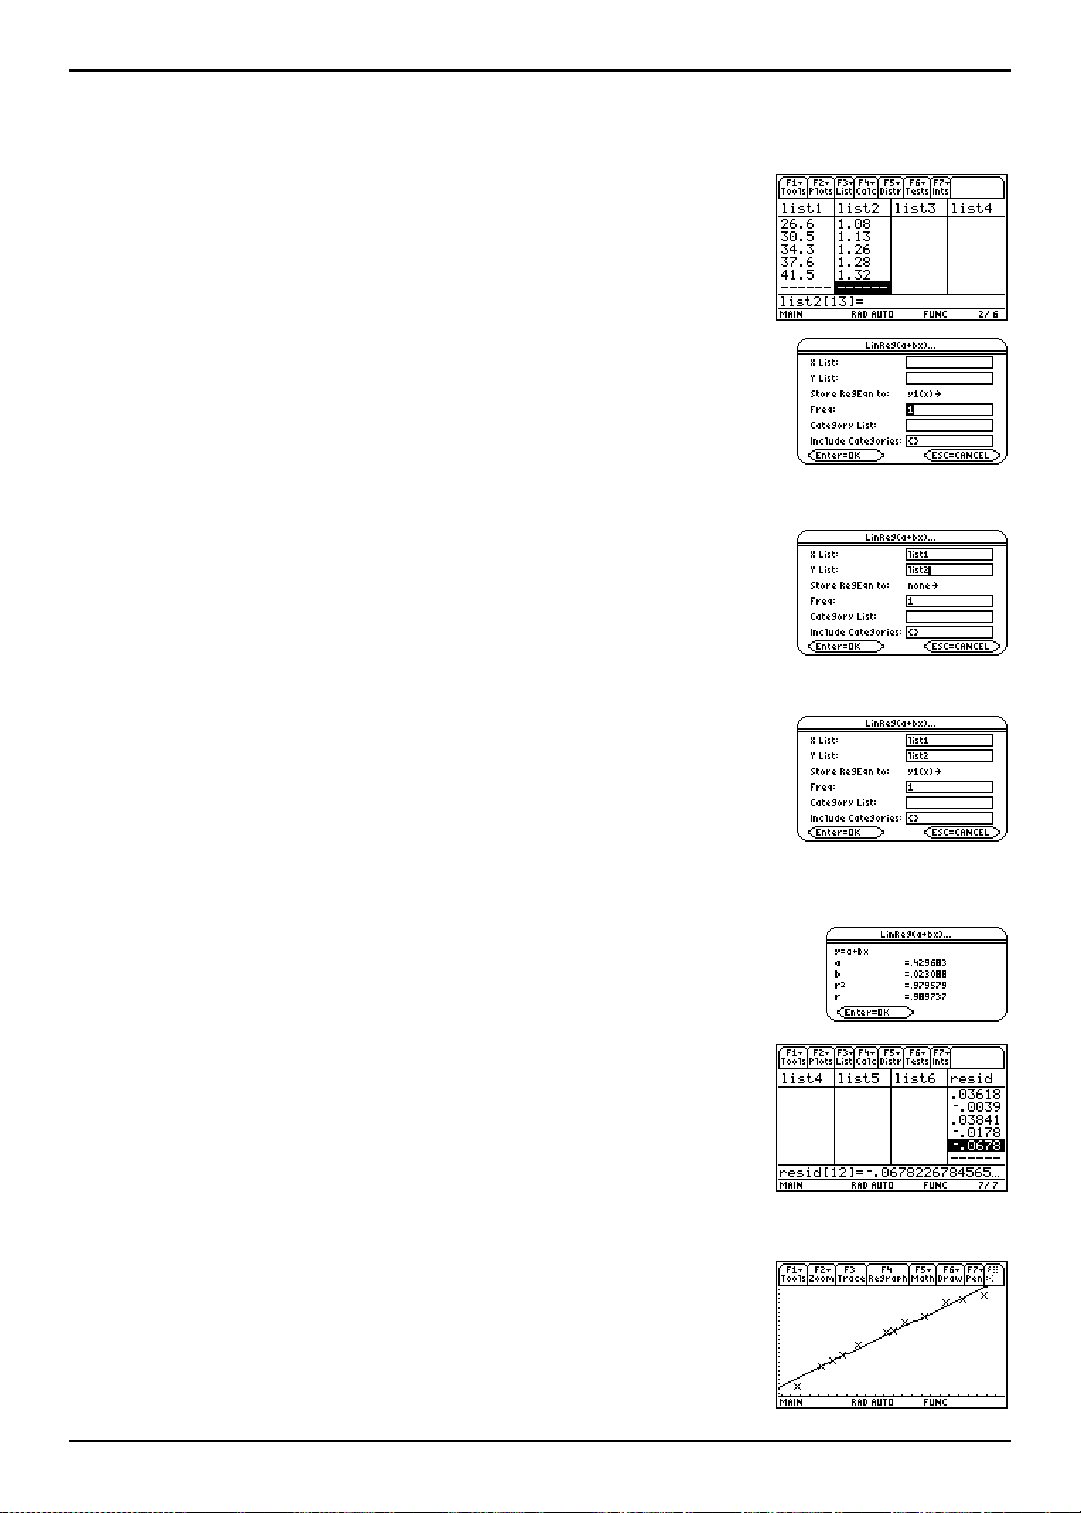
Note: This example shows all dialog boxes with no lists stored.
Your calculator screen may show prepopulated X List and Y List
fields.
3. Press 2 ° to display the VAR-LINK [All] menu.
Highlight
list1 and press Í to specify list1 for the X List
field.
1:LinReg(a+bx) to display
4. Press D to move the cursor to the Y List field. Press
2 ° to display the
list2, and press Í to specify list2 for the Y List.
VAR-LINK [All] menu, highlight
5. Press D to move the cursor to the Store RegEqn to field and
press B. Highlight
regression equation (
y1(x) and press Í to store the
RegEqn) variable to the y1(x) equation
variable.
6. Leave Freq, Category List, and Include Categories at their
defaults, as shown in the
LingReg(a+bx) dialog box to the
right.
7. Press Í to execute the linear regression LinReg(a+bx)
and display the results. The linear regression for the data
list1 and list2 is calculated. Values for a, b, r2, and r are
in
displayed. The linear regression equation is stored in
Y1.
8. Press Í. The residuals are calculated and stored
automatically in the
resid list, which is then pasted in the
last column of the list editor.
Note: To prevent the resid list from being pasted to the end of the
list editor, press ƒ 9:Format to display the FORMATS dialog box,
Change the Results->Editor setting to NO, and then press Í.
resid is stored in the STATVARS folder.
9. Press ¥ % to graph the data. The regression line and
the scatter plot are displayed.
TI-89 / TI-92 Plus / Voyage™ 200 PLT Statistics with List Editor App Getting Started 9
Page 16
Example: Producing a Scatter Plot of the Residuals
The regression line appears to fit the central portion of the scatter plot well. However, a
residual plot may provide more information about this fit.
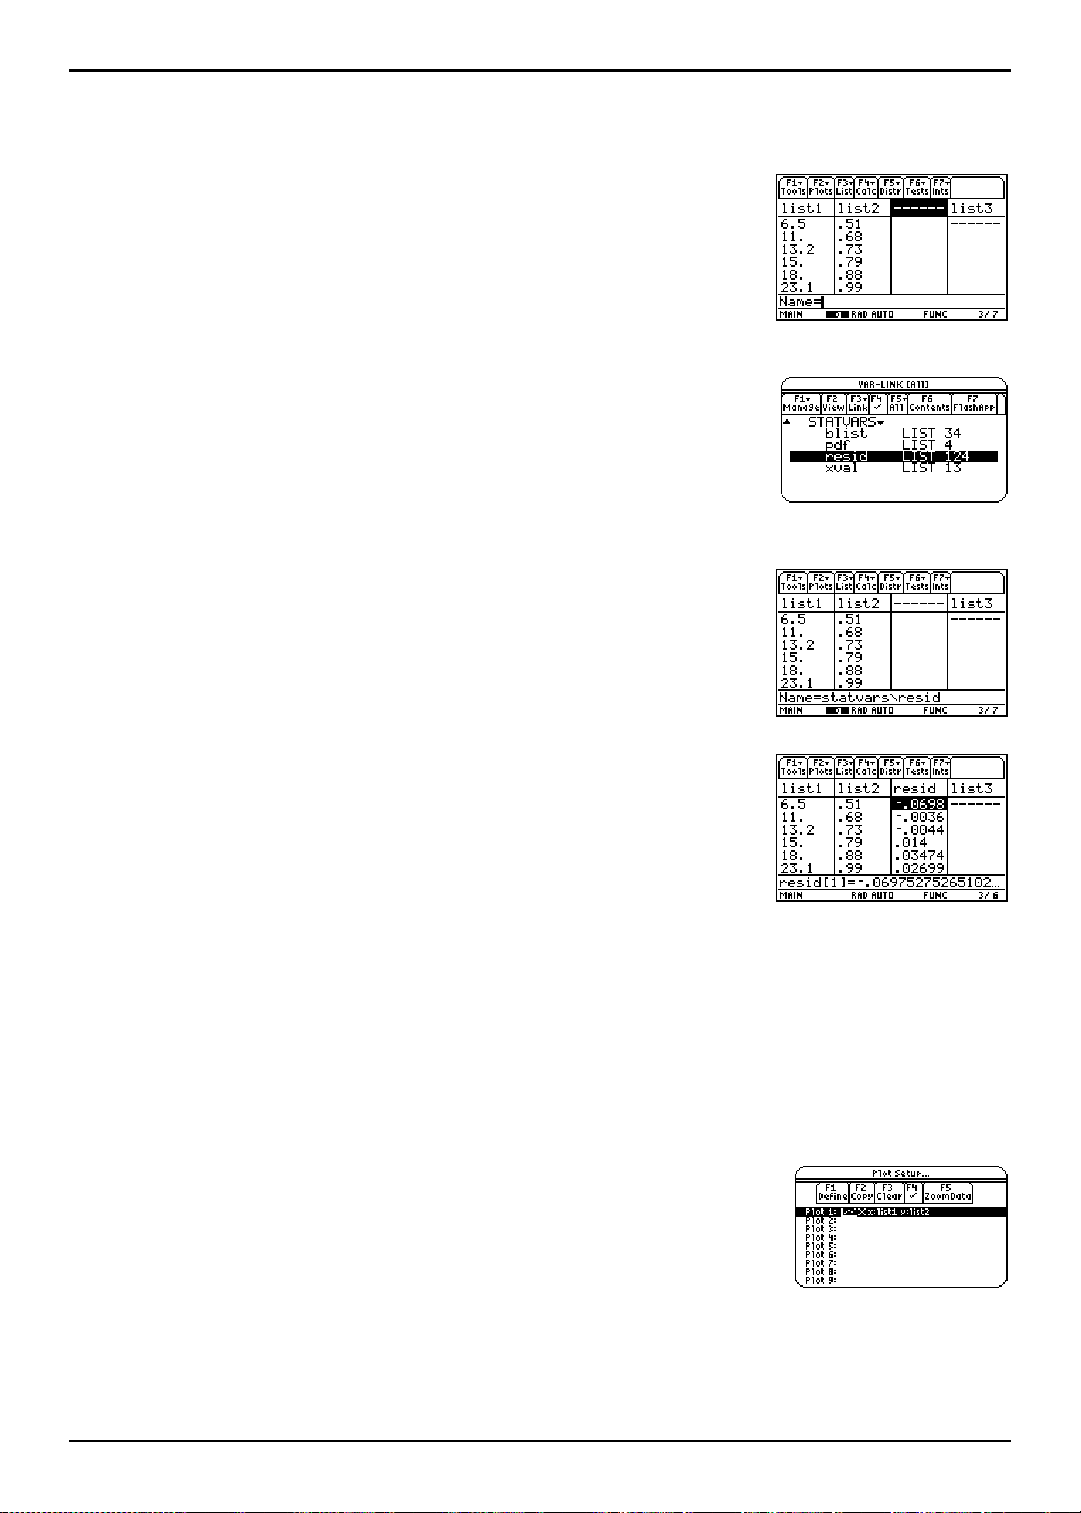
1. Press 2 a to return to the list editor.
Use the arrow keys to move the cursor onto
list3.
Press y /. An unnamed column is displayed in column
three, and the remaining lists shift to the right one
column. The
Name= prompt is displayed in the entry line,
and alpha-lock is on.
2. Press … (List) and select 1:Names to display the VAR-LINK
menu. Highlight the resid variable, which is stored in
[All]
STATVARS folder.
the
Note: If the contents of the STATVARS folder are not displayed,
highlight the STATVARS folder and press B to expand it. You can
then access resid.
3. Press Í to paste resid to the entry line.
Note: Notice the path name in the entry line. If you paste a variable
name that is not in the current folder, the variable’s path name is
pasted as well.
4. Press Í. resid is moved from the last column to column
three of the list editor.
Notice that the first three residuals are negative. They correspond to the shortest pendulum
string lengths in
negative. The latter correspond to the longer string lengths in
list1. The next five residuals are positive, and three of the last four are
list1. Plotting the residuals will
show this pattern more clearly.
5. Turn off all plots and functions.
¦ Press „ (
Plots) and select 3:PlotsOff to turn off all plots.
¦ Press „ (Plots) and select 4:FnOff to turn off all
Y = functions.
6. Press „ (Plots) and select 1:Plot Setup to display the Plot
dialog box.
Setup
TI-89 / TI-92 Plus / Voyage™ 200 PLT Statistics with List Editor App Getting Started 10
Page 17
Example: Producing a Scatter Plot of the Residuals (
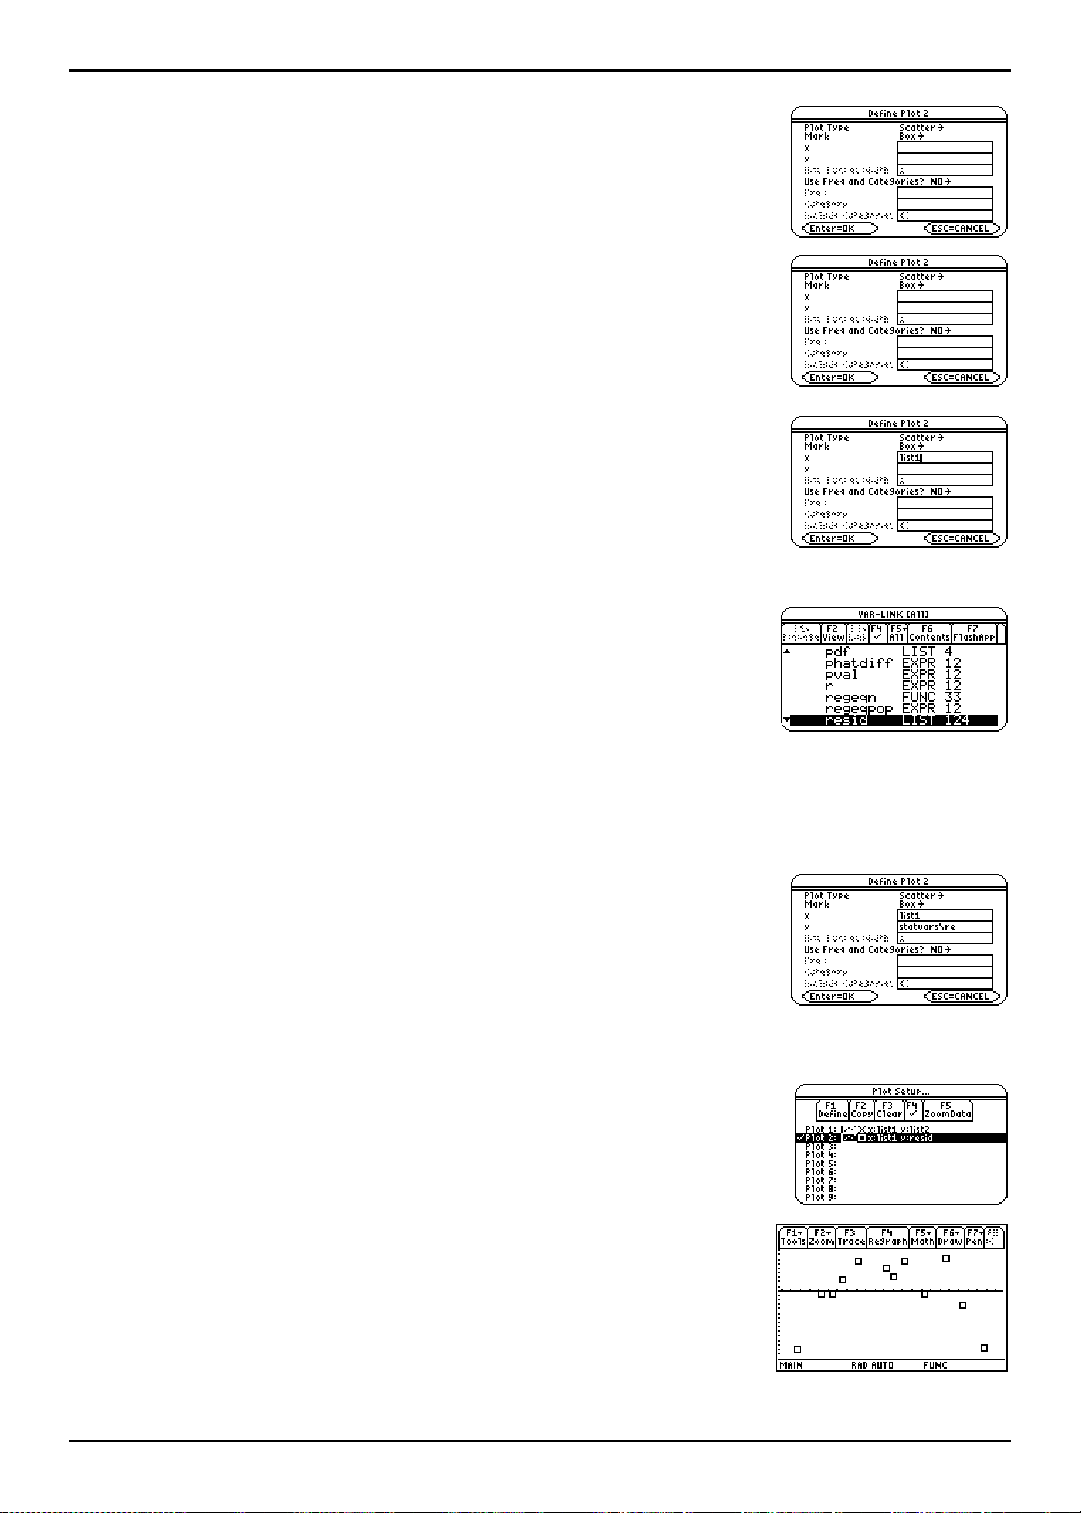
7. Highlight Plot2 and press ƒ (Define). The D efine Plot 2 dialog
box is displayed.
8. If Scatter is not already selected, press B and select
1:Scatter.
9. Press D. If Box is not already selected, press B and select
1:Box to use the Box (è) mark for each data point on the
scatter plot.
10. Press D to move the cursor to the x field. Press 2
° to display the
(in the MAIN folder) and press Í to specify list1 for the
x value field.
Note: If the contents of the MAIN folder are not displayed, highlight
the MAIN folder, and then press B to expand it.
11. Press D to move the cursor to the y field. Press 2
° to display the
resid list variable (in the STATVARS folder).
VAR-LINK [All] menu. Highlight list1
VAR-LINK [All] menu. Highlight the
continued)
Tip: If the MAIN folder is expanded, highlight MAIN, and then press
A to collapse the folder. You then have easy access to the
STATVARS folder. Additionally, you can type a letter to scroll
through a list. If there are any variable names that start with that
letter, the cursor moves to highlight the first of those variable
names.
12. Press Í to specify the statvars/resid variable for the y
field.
Note: If you paste a variable name that is not in the current folder,
the variable’s pathname is pasted as well.
13. If necessary, press D and set the Use Freq and Categories?
option to NO.
14. Press Í to close the dialog box with the changes saved.
Plot2 is selected.
15. Press ‡ (ZoomData). The window variables are adjusted
automatically and
Plot2 is displayed.
This is a scatter plot of the residuals.
TI-89 / TI-92 Plus / Voyage™ 200 PLT Statistics with List Editor App Getting Started 11
Page 18
Example: Producing a Power Regression
Notice the pattern of the residuals: a group of negative residuals, then a group of positive
residuals, and then another group of negative residuals. The residual pattern indicates a
curvature associated with this data set for which the linear model did not account. The residual
plot emphasizes a downward curvature, so a model that curves down with the data would be
more accurate. Perhaps a function such as square root would fit. Try a power regression to fit a
function of the form y = a ä x
1. Press 2 a to return to the list editor.
b
.
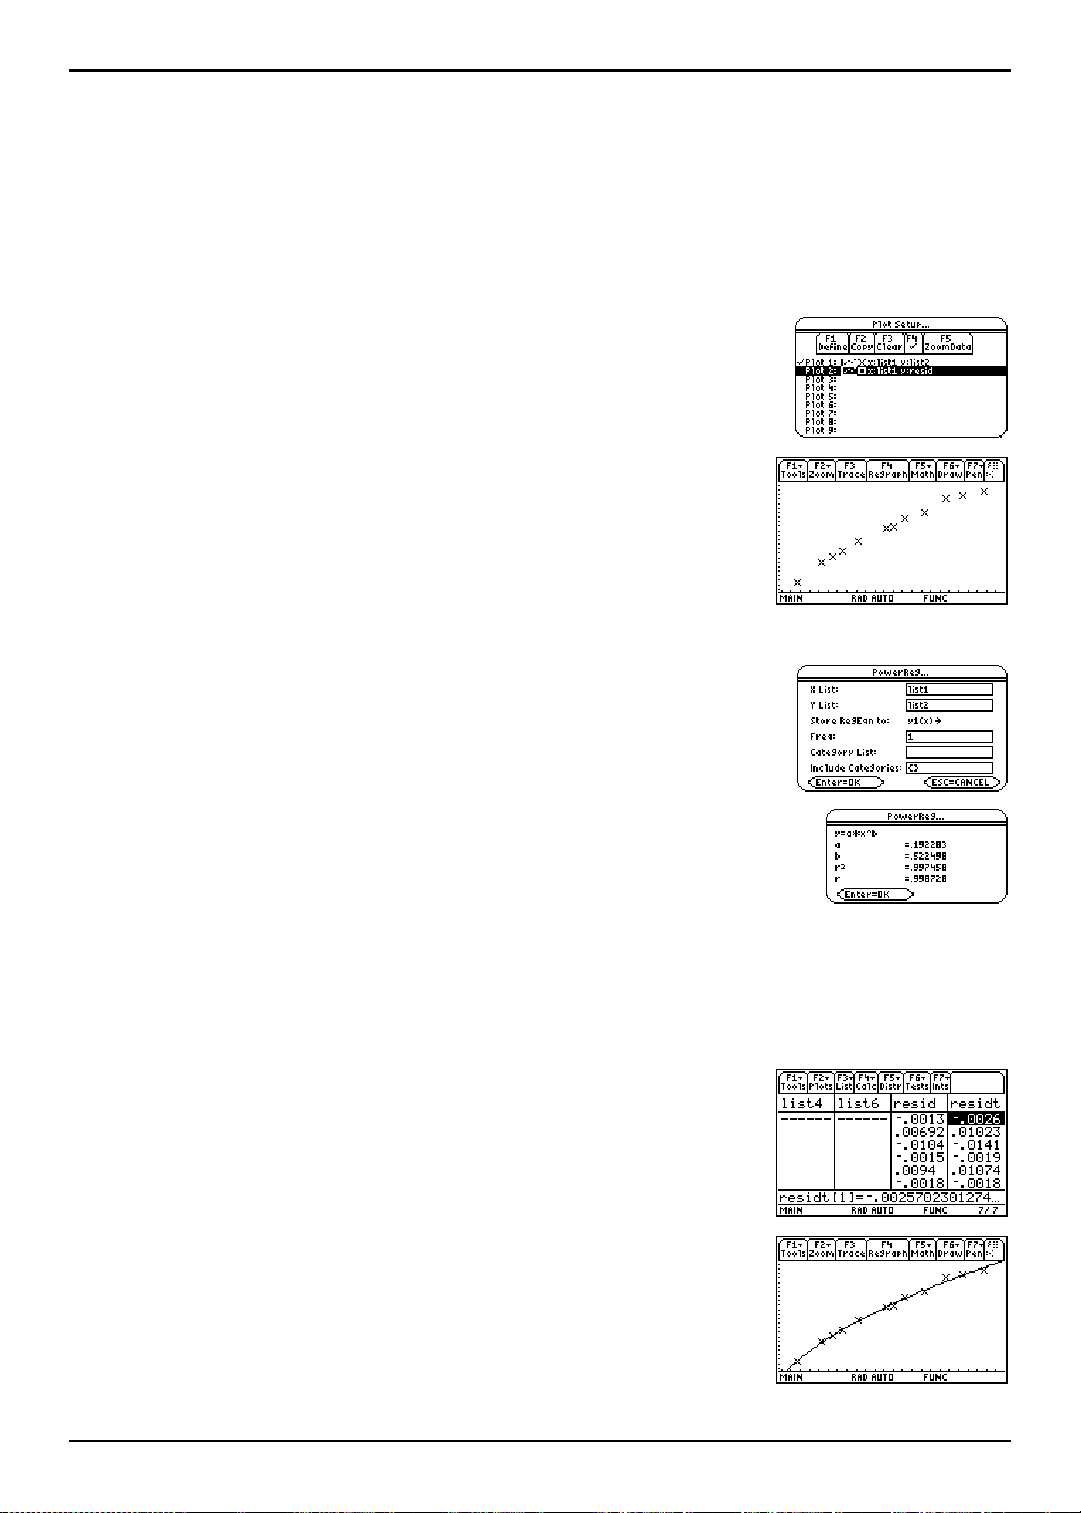
2. Press „ (
Plot Setup dialog box. Highlight Plot 1 and press † Ÿ to
turn it on. Press D † Ÿ to turn off
Plots) and select 1:Plot Setup to display the
Plot 2.
3. Press ‡ (ZoomData). The window variables are adjusted
automatically, and the original scatter plot of time-versuslength data (
Plot1) is displayed.
4. Press 2 a to return to the list editor.
5. Press † (
9:PowerReg to display the PowerReg input dialog box. X List
and
list1 and list2) to calculate this power regression. (See
(
Calc) and select 3:Regressions. Then select
Y List should be prepopulated with the correct lists
arguments as shown to the right.)
6. Press Í to close the dialog box and calculate the power
regression.
2
Values for a, b, r
, and r are displayed in the PowerReg
output dialog box. The power regression equation is stored
Y1. Residuals for the power regression are calculated
in
and placed in the
resid list. The previous contents of resid
are overwritten by the new data. Residuals associated
with the linear fit of the transformed data are calculated
and placed in the
residt list.
7. Press Í to close the dialog box and return to the list
editor.
Note: If the Results->Editor option in the ƒ (Formats) dialog box
is set to
editor.
ON, resid and res id t are pasted to the end of the list
8. Press ¥ s. The regression line and the scatter plot
are displayed.
TI-89 / TI-92 Plus / Voyage™ 200 PLT Statistics with List Editor App Getting Started 12
Page 19
Example: Producing Another Residual Plot with the New Data
The new function y1=.192283 … x^.522498 appears to fit the data well. To get more information,
examine a residual plot.
1. Press 2 a to return to the list editor.
2. Turn off all plots and functions.
¦ Press „ (
Plots) and select 3:PlotsOff to turn off all plots.
¦ Press „ (Plots) and select 4:FnOff to turn off all
Y = functions.
3. Press „ (Plots) and select 1:Plot Setup to display the Plot
dialog box. Highlight Plot 2 and press † Ÿ to select
Setup
it.
4. Press ‡ (ZoomData). The window variables are adjusted
automatically, and
Plot2 is displayed. This is a scatter plot
of the residuals.
The new residual plot shows that the residuals are random in sign, with the residuals
increasing in magnitude as the string length increases.
TI-89 / TI-92 Plus / Voyage™ 200 PLT Statistics with List Editor App Getting Started 13
Page 20
Example: Producing Magnitudes of the Residuals
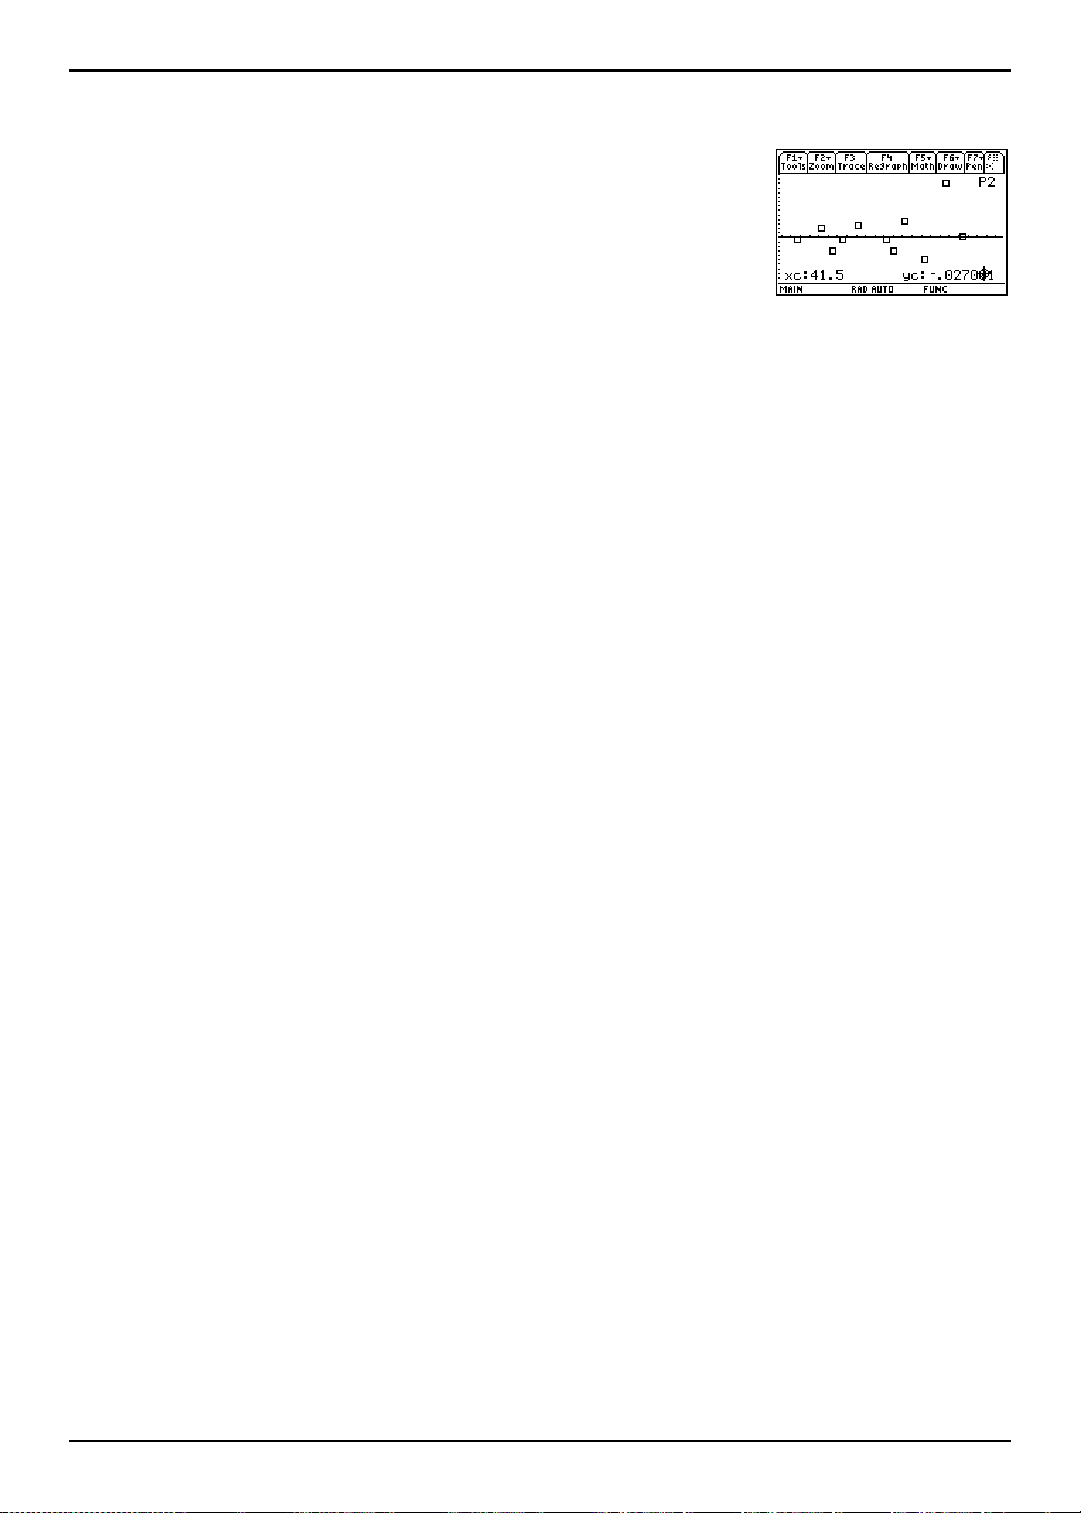
To see the magnitudes of the residuals, continue with these steps.
1. Press … (Trace).
2. Press B and A to trace the data. Observe the values for
at each point.
With this model, the largest positive residual is about .041 and the smallest negative
residual is about L.027. All other residuals are less than .02 in magnitude.
y
TI-89 / TI-92 Plus / Voyage™ 200 PLT Statistics with List Editor App Getting Started 14
Page 21
Example: Making Predictions with the Model
Now that you have a good model for the relationship between length and period, you can use
the model to predict the period for a given string length. To predict the periods for a pendulum
with string lengths of 20 cm and 50 cm, continue with these steps.
1. To display the Home screen, press:
¦ Press " for the TI-89
¦ Press ¥ " for the TI-92 Plus
¦ Press ¥ " for the Voyage™ 200 PLT
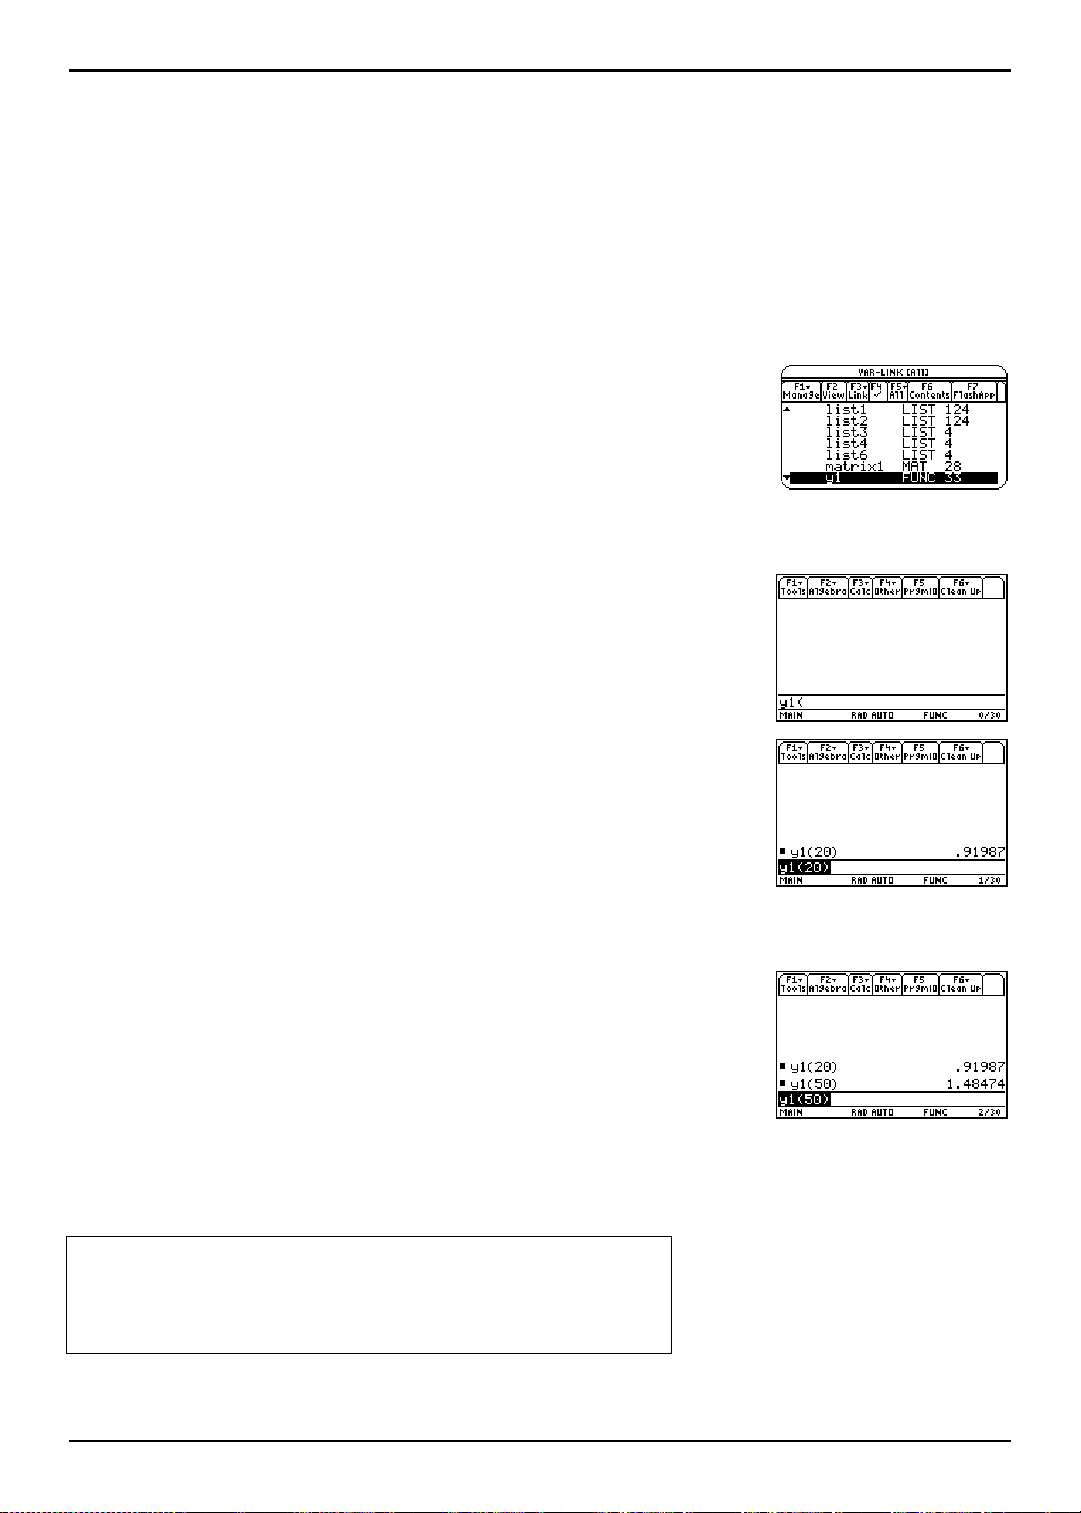
2. Press 2 ° to display the
Highlight the
Note: If the contents of the MAIN folder are not displayed, highlight
the MAIN folder, and then press B to expand it. You can then
access y1.
y1 variable.
VAR-LINK [All] menu.
3. Press ¸ to paste y1( to the entry line in Home screen.
4. Type 20 and press ¤ to enter a string length of 20 cm.
Press Í.
Based on the residual analysis, we would expect the prediction of about 0.92 seconds to be
within about 0.02 seconds of the actual value.
5. Since the last entry is still highlighted, press B A A 0 5
to change the string length to 50 cm.
6. Press Í to calculate the predicted time of about 1.48
seconds.
Since a string length of 50 cm exceeds the lengths in the data set, and since residuals
appear to be increasing as string length increases, we would expect more error with this
estimate.
From the text Contemporary Precalculus through Applications
Copyright 1999,1992. Everyday Learning Corporation
Exercise Set 6 from Chapter 1 . Data Analysis One, pages 21, 22, and
23
TI-89 / TI-92 Plus / Voyage™ 200 PLT Statistics with List Editor App Getting Started 15
Page 22

Error Messages
To correct this problem, unlock or unarchive the variable. If it is not
This section describes error messages that are displayed when input or internal errors
are encountered by the Stats/List Editor Application.
Error message Description
Problem accessing
configuration file, zzconfig,
in your current folder.
Variable is locked,
protected, archived, or
corrupted.
Problem accessing
STATVARS\\shostat. Please
delete the variable.
All plot numbers are in use.
Clear unnecessary plots.
The zzconfig file variable may be locked, archived, or corrupted.
This problem prevents the Stats List/Editor from accessing the
configuration file.
locked or archived, delete zzconfig from the current folder.
• Press 2 °.
• Highlight the
1:Delete
zzconfig variable and press ƒ (Manage). Select
to display the VAR-LINK dialog box.
• Press ¸ to delete the variable.
The shostat function has been invoked from the † (Calc) menu or
from the Home screen. The function failed to work properly.
To correct this problem, delete the
STATVARS folder.
shostat variable from the
• Press 2 °.
• Highlight the
1:Delete
shostat variable and press ƒ (Manage). Select
to display the VAR-LINK dialog box.
• Press ¸ to delete the variable.
To correct this problem, you must clear any unnecessary plots.
• Press „ (
Plots) and select 1:Plot Setup to display the Plot Setup
dialog box.
• Highlight any unnecessary plots and press … (
Clear).
TI-89 / TI-92 Plus / Voyage™ 200 PLT Statistics with List Editor App Getting Started 16
Page 23
List Editor
Using the List Editor............................................................................................................................ 18
Creating Lists.......................................................................................................................................20
Removing Lists....................................................................................................................................21
Editing a List Element.........................................................................................................................23
Formulas .............................................................................................................................................. 24
This chapter provides examples that demonstrate the Stats/List Editor
application list features. You can find more information about the lists in the
List Menu chapter.
…
TI-89 / TI-92 Plus / Voyage™ 200 PLT Statistics with List Editor App List Editor 17
Page 24
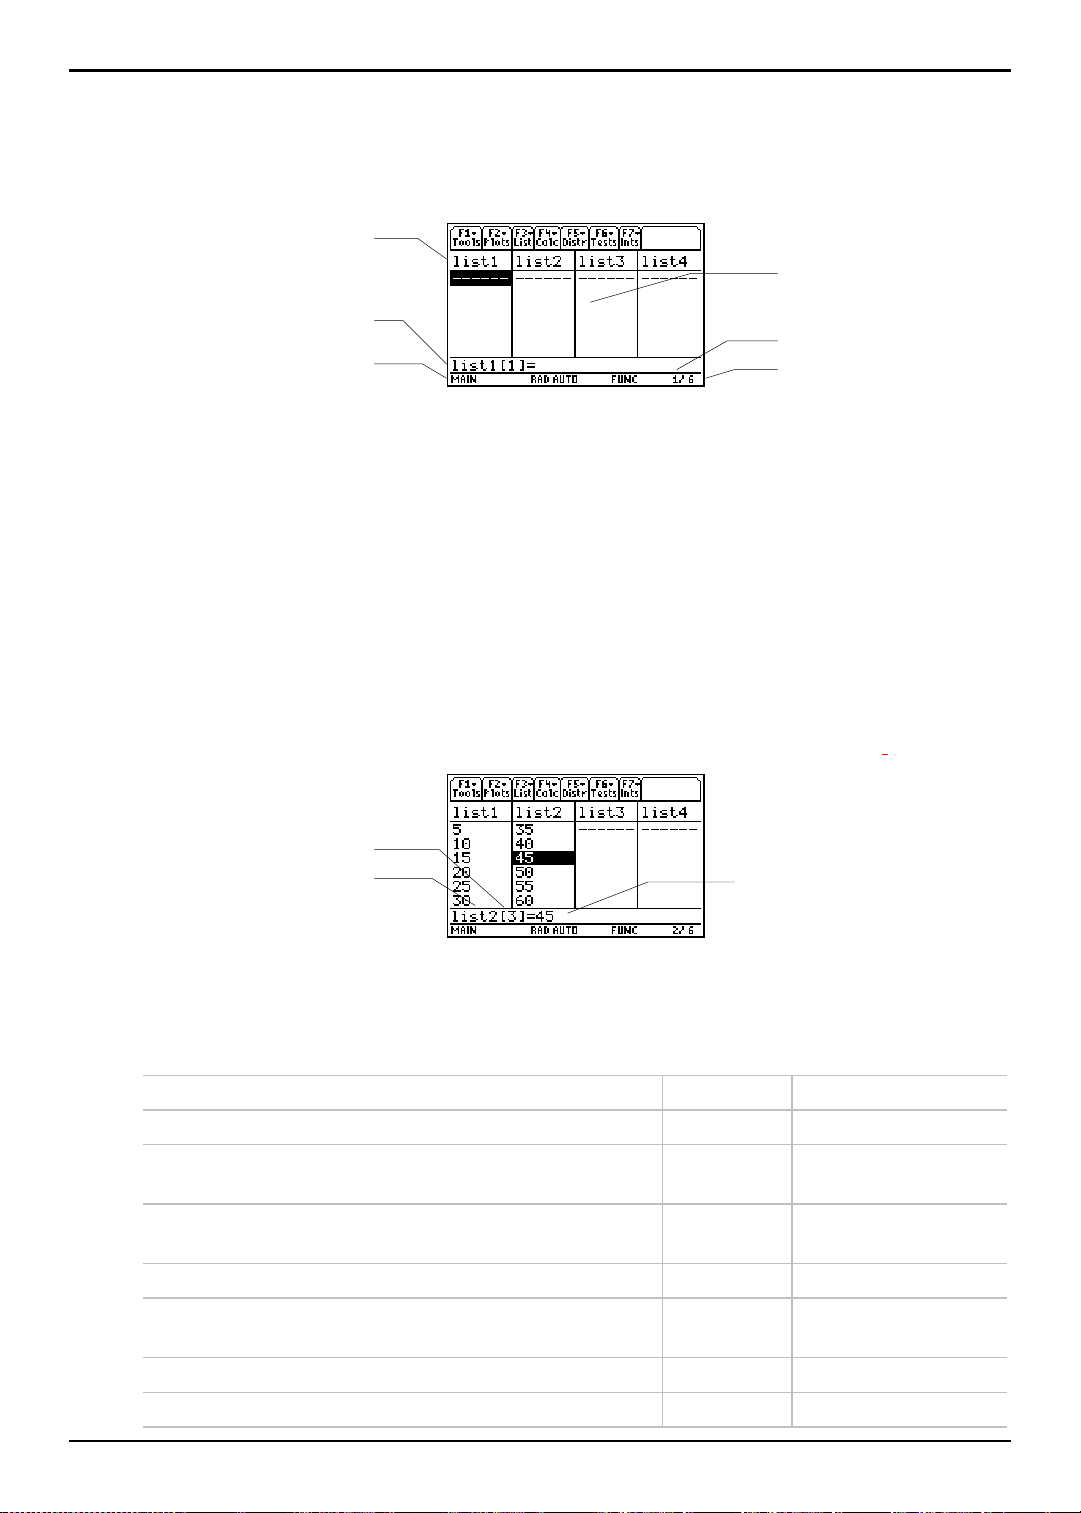
Using the List Editor
on of current (highlighted)
Entry line contains the currently
highlighted list name and element.
The List Editor Screen
Data for most statistical analyses in the Stats/List Editor application are stored in list
variables. The Stats/List Editor provides six list variables in memory,
ist names are displayed here.
L
Top line list1 through list6 are stored in columns 1 through 6 after a memory reset.
Center area On the TI-89, this area displays up to six elements of up to four lists. On
the T TI-92 Plus / Voyage™ 200 PLT, it displays up to eight elements of up to six lists.
Entry line All data entry occurs on this line. The characteristics of the entry line
change according to the current context: view elements, edit elements, view names, or
enter name.
Moving Around the List Edit or Scr e en
list1 through list6.
List elements are
displayed here.
Current column: 1
Number of open lists: 6 Status line
In view-elements context, the entry line displays the list name, the current element’s
place in that list, and the full value of the current element, up to 16 characters at a time
for the TI-89 and up to 20 characters at a time for the TI-92 Plus. An ellipsis (
...)
indicates that the element continues beyond 16 characters or 20 characters.
Positi
list element in the list: 3
List name: list2
Full value of current (highlighted) list
element: 45
The following table shows the keystrokes for moving quickly around the list editor screen.
To:
Move the cursor to the bottom of a list. ¥ D ¥ D
Move the cursor to the top of a list. ¥ C ¥ C
Page down six elements on the TI-89 or eight on the
On the TI-89
Press:
2 D 2 D
TI-92 Plus / Voyage 200 PLT.
Page up six elements on the TI-89 or eight on the
2 C 2 C
TI-92 Plus / Voyage 200 PLT.
On the TI-92 Plus /
Voyage 200 PLT Press:
Delete a list element. 0 or ¥ 8 0 or ¥ 8
Insert a new element. (Zero is the default value for a new
element.)
Move to the first list in the list editor. ¥ A ¥ A
Move to the last list in the list editor. ¥ B ¥ B
TI-89 / TI-92 Plus / Voyage™ 200 PLT Statistics with List Editor App List Editor 18
y [INS] y [INS]
Page 25
Using the List Editor (
entry line. You may enter a list name.
to view list names currently
Switching List Edit or Cont e xts
The list editor has four contexts: view elements, edit elements, view names, and enter
name. The list editor is first displayed in view-elements context.
View names Press C to move the cursor onto a list name.
Edit elements Press Í.
Continued)
The list name is highlighted. Press B and A
stored in other list editor columns.
The list name is still highlighted. The elements of the list are also
highlighted in the entry line. You may edit any element in a list.
View element Press Í again.
The first element of the list is highlighted. Press B, A, D, and C to
view other list elements. The current element’s full value is displayed in
the entry line.
Edit element Press Í again.
The element is highlighted in the entry line. You may edit the current element
in the entry line.
Enter name Press C until the cursor is on a list name, then press y [INS]. You can
also press B until you reach an unnamed column.
The new list name cell is highlighted. The Name= prompt is displayed in the
TI-89 / TI-92 Plus / Voyage™ 200 PLT Statistics with List Editor App List Editor 19
Page 26
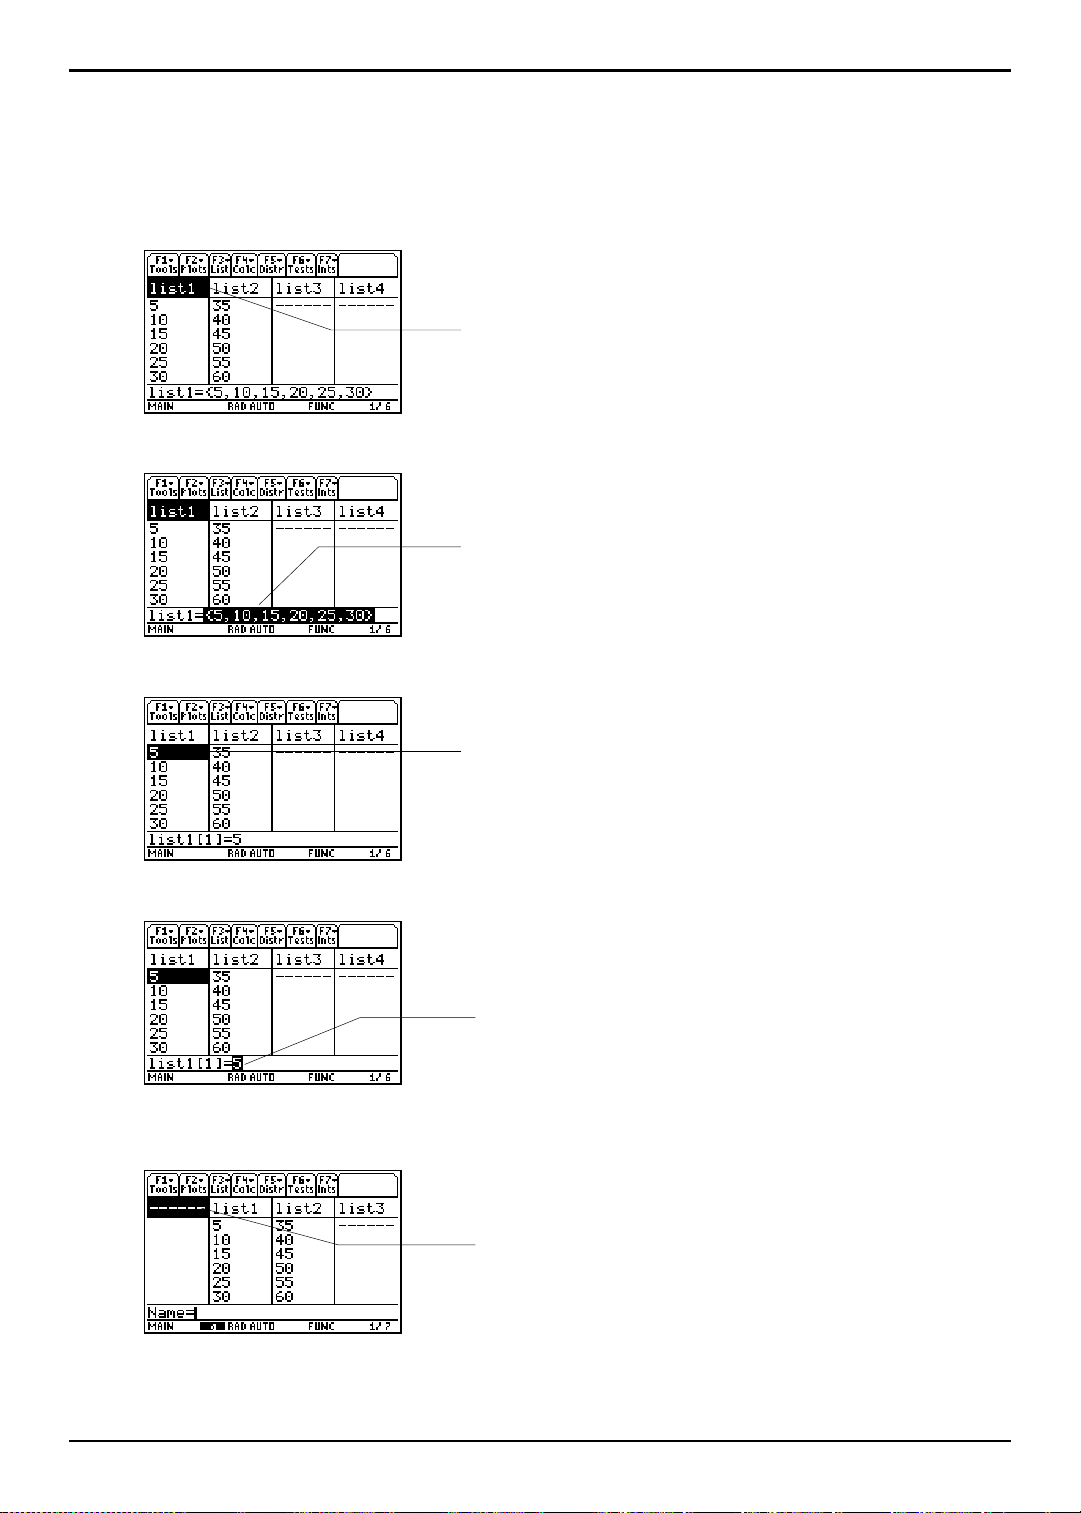
Creating Lists
Creating a New List in the List Edi t or
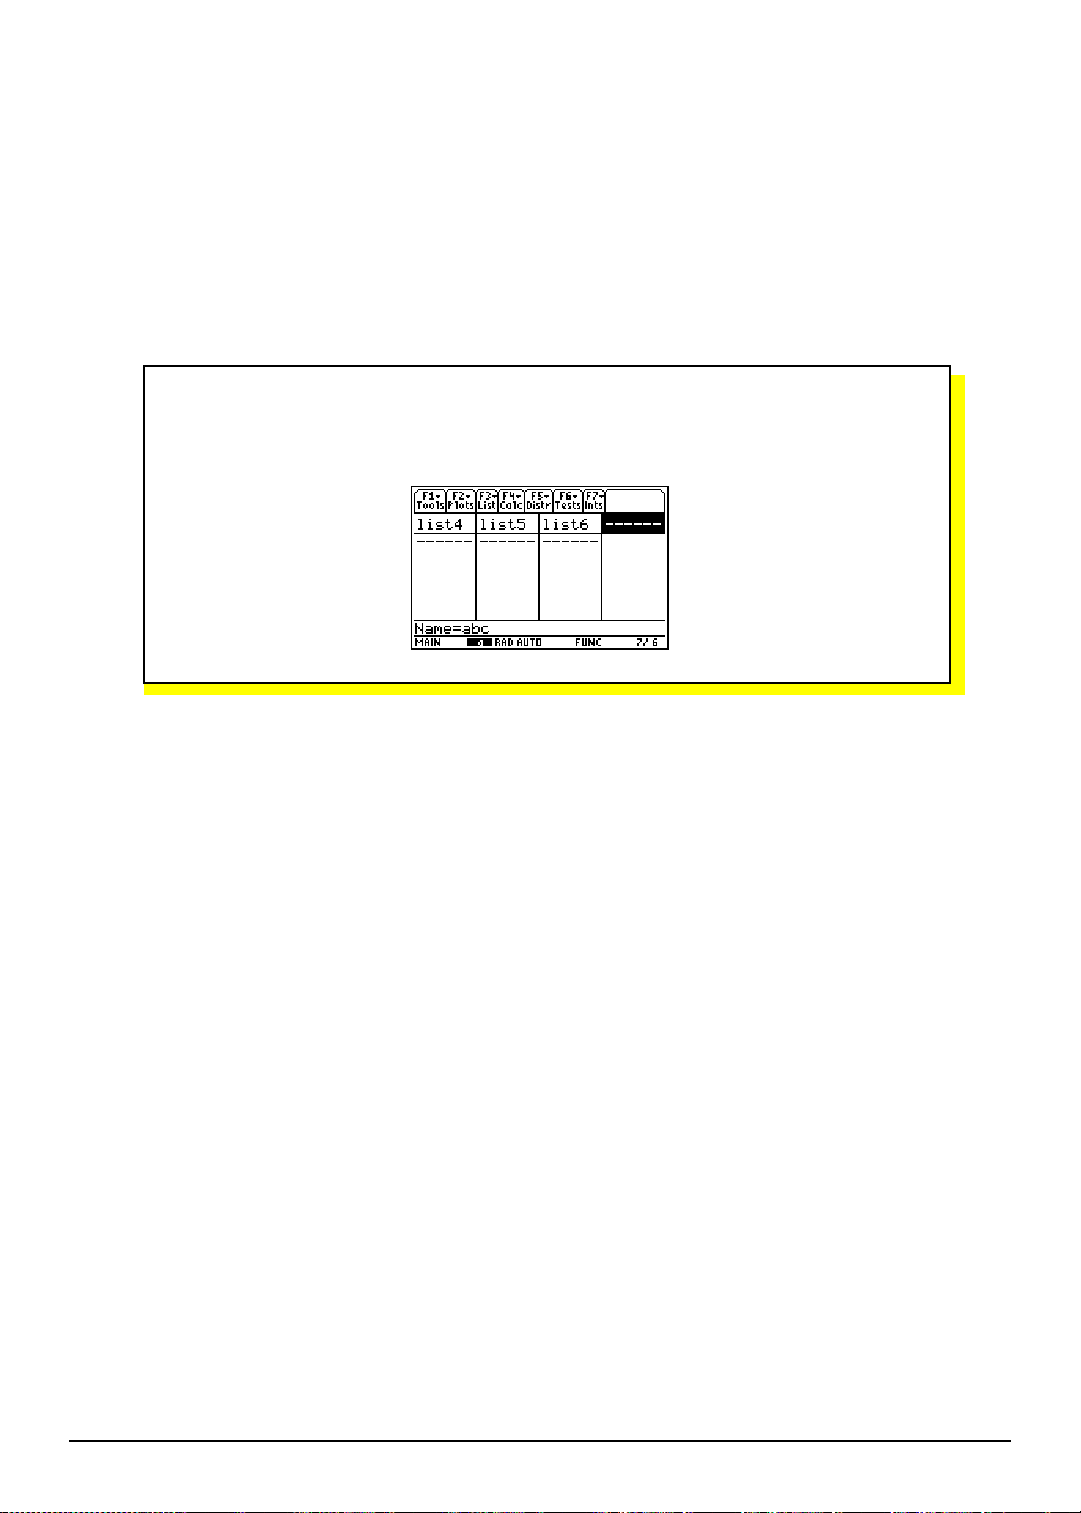
1. Display the Name= prompt in the entry line in either of these two ways.
¦ Move the cursor onto the list name in the column where you want to insert a list
and press y /. An unnamed column is displayed and the remaining lists
shift right one column.
¦ Move the cursor onto a list name and press B until you reach an unnamed
column. The
Tip: After moving the cursor onto a list name, press-¥ B to move to the rightmost list in the list editor.
2. Enter a valid list name in any of these three ways.
¦ Press … (List) and select 1:Names to display the VAR-LINK [ALL] menu. Highlight a
list name and press ¸ to select it.
¦ Enter an existing user-created list name directly from the keyboard.
Name= prompt is displayed.
a) Follow step 1 above to display the
Name= prompt.
b) Press [letter from A to Z or q] to enter the first letter of the name. A variable
name:
- Can have one to eight characters consisting of letters and digits,
including Greek letters (but not p), accented letters, and international
letters. Do not include spaces. The first character cannot be a number.
- Can have uppercase or lowercase letters; however, the names
aB22, and ab22 all refer to the same variable.
AB22, Ab22,
- Cannot be the same as a name that is preassigned by the TI-89 /
TI-92 Plus / Voyage™ 200 PLT. Preassigned names include built-in
functions (such as
variables (such as
abs), instructions (such as LineVert), and system
xmin and xmax.
c) Enter the remaining zero to seven characters to complete the new user-
created list name.
d) Press Í or D to store the list name in the current column of the list
editor.
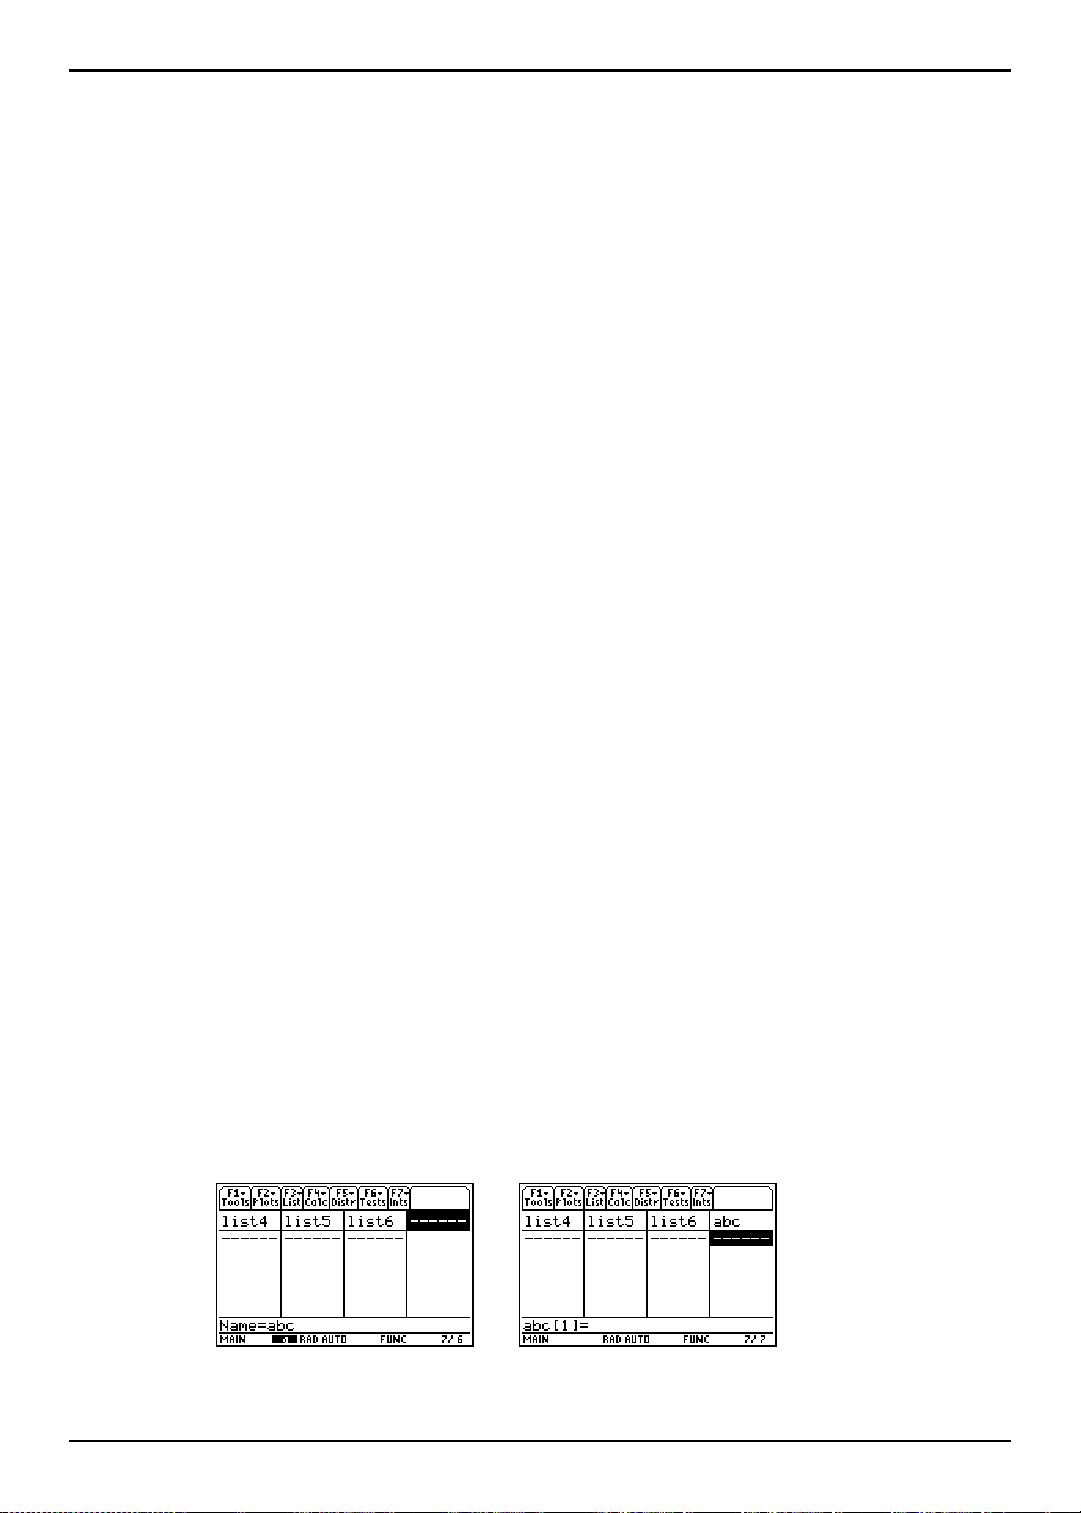
¦ Enter a new user-created list name from the keyboard at the Name= prompt.
Press y / and enter the list name (abc). Then press ¸ or D to store the
list name (
abc) and lists elements, if any, in the current column of the list editor.
Begin entering, scrolling , or editing list elements.
TI-89 / TI-92 Plus / Voyage™ 200 PLT Statistics with List Editor App List Editor 20
Page 27
Removing Lists
Removing a List Only from the List Editor
To remove a list only from the list editor, move the cursor onto the list name and press ¥
..
Note: The list is not deleted from
memory; it is only removed from
the list editor.
&
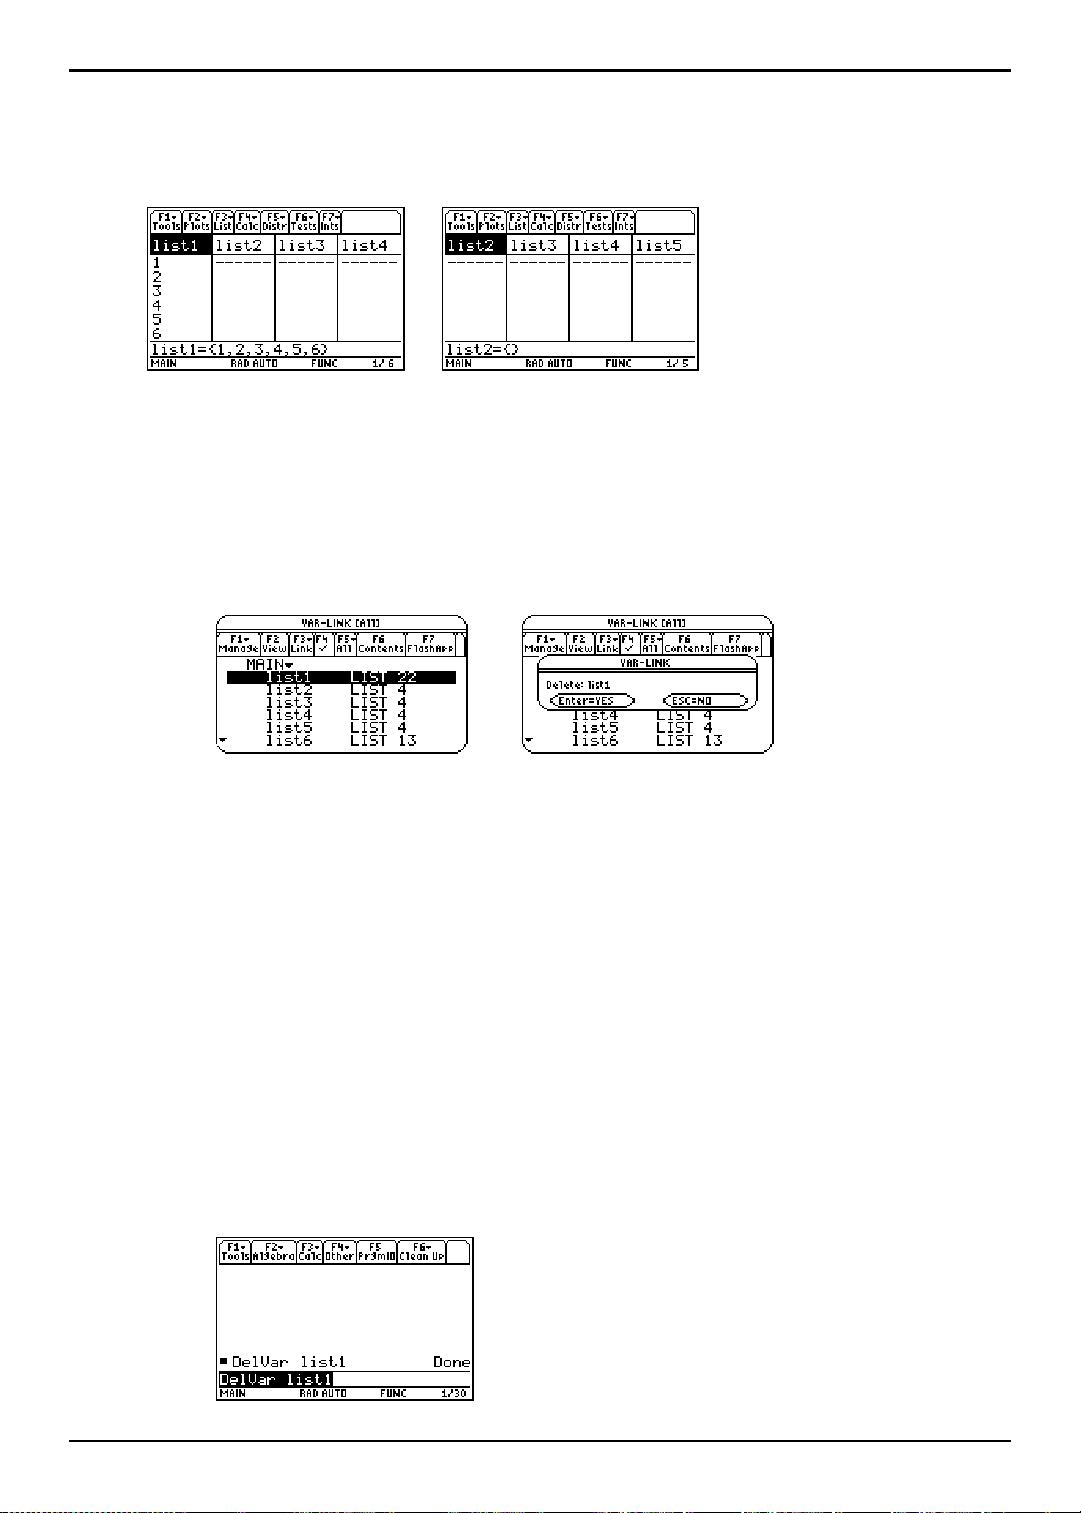
Removing a List from the List Editor and from Calculator Memory
¦ From the Stats/List Editor, use the VAR-LINK [All] menu to delete specified lists.
1. Press 2 ° to display the
2. Press ƒ (
¸ to delete the list (
Manage) and select 1:Delete to display the VAR-LINK dialog box. Press
list1) from the list editor and from the calculator memory.
VAR-LINK [All] menu. Highlight the list (list1).
Press N to retain the list.
&
¦ From the Home screen, use the DelVar command to delete specified lists.
1. To display the Home screen press,
- " for the TI-89
- ¥ " for the TI-92 Plus
- Press ¥ " for the Voyage™ 200 PLT
2. To select the
---- ½ D for the TI-89
---- 2 ½ D for the TI-92 Plus / Voyage 200 PLT
Then move the ú indicator to the
DelVar function from the CATALOG press,
DelVar command. Press ¸ to paste the DelVar
command to the entry line.
3. Press 2 ° to display the VAR-LINK [All] menu. Highlight the list (list1) and
press Í to paste the list (
list1) in the entry line.
4. Press ¸ to remove the list (list1) from the list editor and from the calculator
memory.
Note: If you archive a list, the Stats/List Editor lets you
open and view the list. You cannot store values to this
archived list. You must unarchive an archived list before
you can delete it.
TI-89 / TI-92 Plus / Voyage™ 200 PLT Statistics with List Editor App List Editor 21
Page 28
Removing Lists
(continued)
Removing All Lists and Restoring list1 through list6
To remove all user-created lists and restore list names list1- list6 to columns 1 - 6:
¦ Press ƒ (Tools) and select 3:Setup Editor to display the Setup Editor dialog box. Then
press ¸ to close the
Lists To View dialog box.
Setup Editor dialog box without entering any list names in the
¦ Reset all memory.
Note: Resetting the memory deletes all lists from memory.
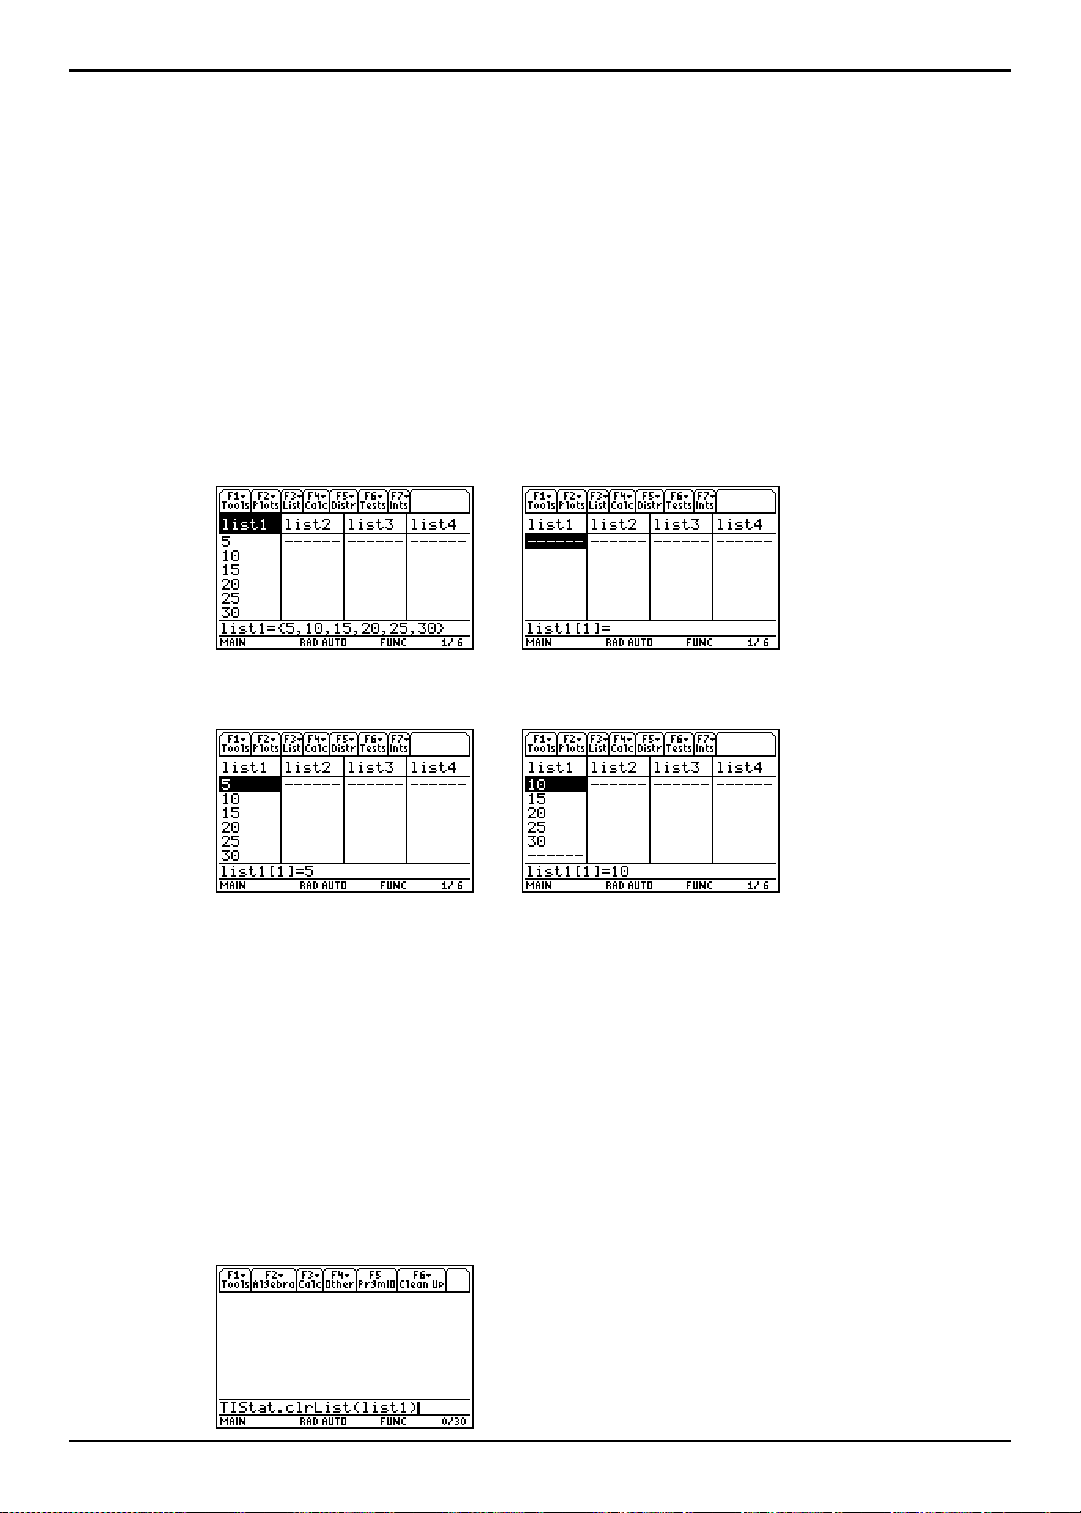
Clearing Elements from a List
¦ To clear list elements from the Stats/List Editor, use either of these two methods:
- ‘ Highlight the list (
list1). Press ‘ Í or ‘ A or B. Or, press
‘ D to clear the elements.
&
- 0 Highlight the first element of the list (list1). Press 0 to delete the element (5).
&
¦ To clear list elements of a specified list from the Home screen, use the clrList( command.
1. To display the Home screen press,
- " for the TI-89
- ¥ " for the TI-92 Plus
- Press ¥ " for the Voyage™ 200 PLT
2. To select the
- ½ … (
- 2 ½ … (
3. Move the ú indicator to the
entry line, enter the list name (
clrList( function from the … (Flash Apps) catalog press,
List) C for the TI-89
List) C for the TI-92 Plus / Voyage 200 PLT
clrList( function, press ¸ to paste clrList( to the
list1), press d, then and press ¸ to clear the
elements in the list.
Note: TIStat.clrlist(list1) and the Done message are
displayed when the list is cleared.
TI-89 / TI-92 Plus / Voyage™ 200 PLT Statistics with List Editor App List Editor 22
Page 29
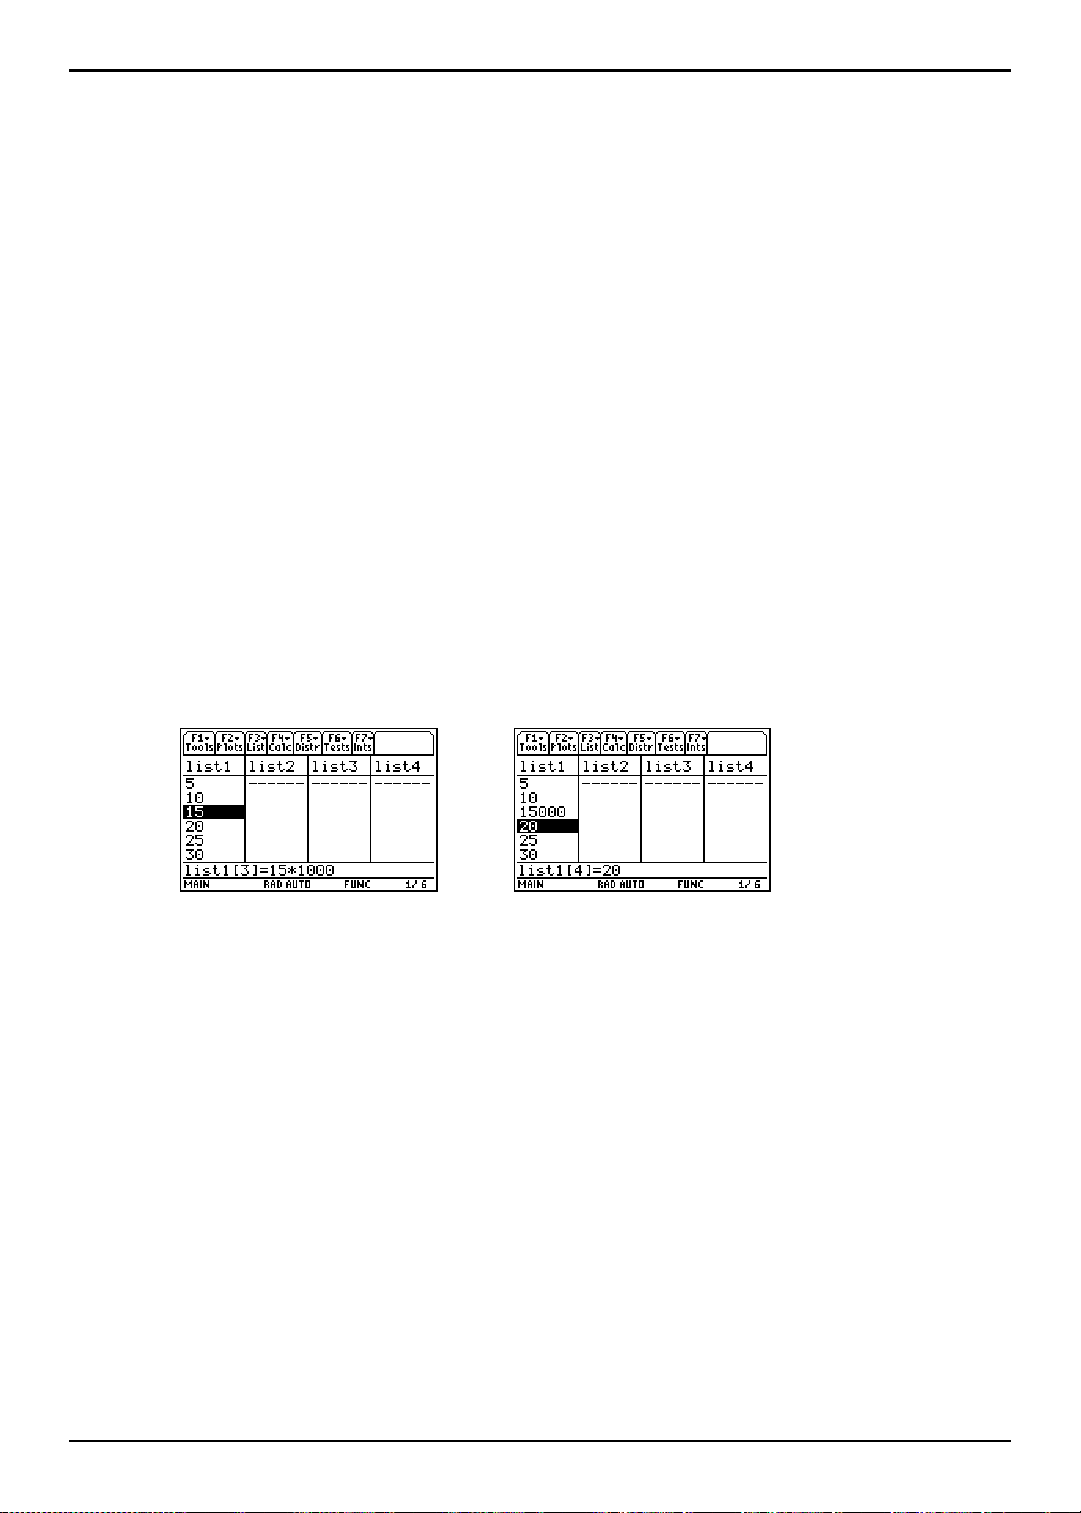
Editing a List Element
Example
To edit a list element, follow these steps.
1. Move the rectangular cursor onto the element you want to edit.
2. Press Í to highlight the element in the entry line.
Tip: If you want to replace the current value, you can enter a new value without first pressing
Í. When you enter the first character, the current value is cleared automatically.
3. Edit the element in the entry line in any of three ways:
¦ Press one or more keys to enter the new value. When you enter the first
character, the current value is cleared automatically.
¦ Press B to move the cursor to the character before which you want to insert, and
then enter one or more characters.
¦ Press B to move the cursor just after the character you want to delete, and then
press 0 to delete the character.
Note: To cancel any editing and restore the original element at the rectangular cursor, press N.
4. Press Í, C, or D to update the list. If you entered an expression, it is evaluated.
If you entered only a variable, the stored value is displayed as a list element. When
you edit a list element in the list editor, the list is updated in memory immediately.
&
Note: You can enter expressions (as shown above) and variables for list elements, but they must
resolve to a single value.
TI-89 / TI-92 Plus / Voyage™ 200 PLT Statistics with List Editor App List Editor 23
Page 30
Formulas
If a formula in quotation marks is displayed on the entry
line, a formula is already attached to the list name. To edit the
to use the Attach List Formula dialog box.
Attaching a Formula to a List Name
You can attach a formula to a list name so that each list element is a result of the
formula. The attaching procedure must be performed inside the Stats/List Editor
application.
¦ When executed, the calculation resulting from the attached formula must resolve to
a list.
¦ When anything in the attached formula changes, the list to which the formula is
attached is updated automatically.
¦ When you edit an element of a list that is referenced in the formula, the
corresponding element in the list to which the formula is attached is updated.
¦ When you edit the formula itself, all elements in the list to which the formula is
attached are updated.
Note: To view a formula that is attached to a list name, highlight the name of the list to which a formula
is attached. The list will have an attached formula symbol (é) next to the name.
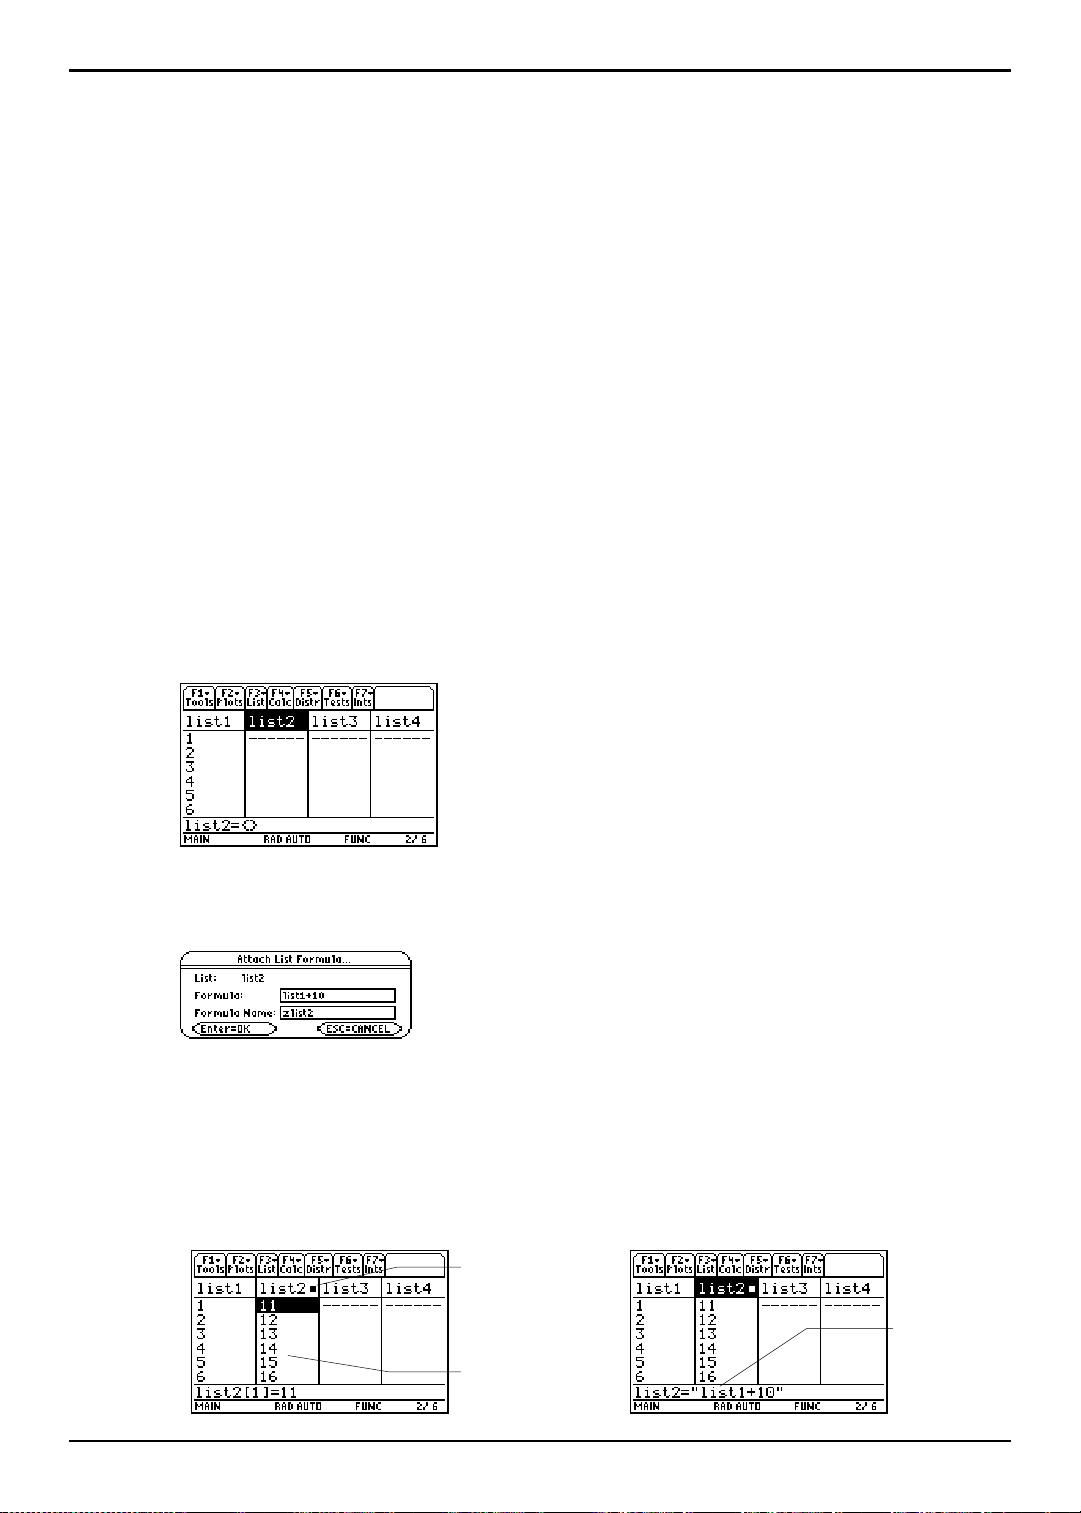
Example
1. In the list editor, enter: list1={1,2,3,4,5,6}
2. Press C, if necessary, to move the cursor to the top line. Press A or B to move the
cursor onto the list name to which you want to attach the formula.
Note:
formula, press Í, and then edit the formula in the entry
line, or press ¸
3. Press … (List) and select 4:Attach List Formula. The Attach List Formula dialog box is
displayed. The list you indicated (
in the
Formula field.
list2) is in the List field. Enter the formula (list1+10)
4. Press D. If the variable name to which you want to store the formula to is not
displayed in the
Note: The calculator chooses “z” plus the list name as the default formula variable name. It is
recommended that you accept this default naming convention. If you want to reattach this f ormula the
calculator will only prompt for this default variable. Do not use preassigned system var iable names.
Formula Name field, enter a new variable name.
5. Press Í.
The é after the list
name indicates that
a formula is
attached.
The calculator
calculates each
element according to
the formula (list1+10)
and stores it to the
target list (list2).
TI-89 / TI-92 Plus / Voyage™ 200 PLT Statistics with List Editor App List Editor 24
Highlight the list name
(list2)
to view the list
name and formula in
quotes in the entry line.
Page 31

Formulas
nce the formula (list1+10) attached
(Continued)
Using Formula-Generated Lists
When you edit an element of a list referenced in an attached formula, the TI-89 /
TI-92 Plus / Voyage™ 200 PLT updates the corresponding element in the list to which
the formula is attached.
1. Highlight the first element (
2. Enter the new value (
10) for the element and press ¸.
1) in the list (list1).
&
When a list with an attached formula is displayed and you edit or enter elements of
another displayed list, the TI-89 / TI-92 Plus / Voyage 200 PLT
accept each edit or entry. The TI-89 / TI-92 Plus / Voyage 200 PLT must recalculate the
elements with each addition or edit.
Tip: This lag time in editing entries can be avoided by pressing ¥ Í and setting Auto-calculate to NO.
Using a Formula without At t ac hing It to a List
You can use a formula or expression to create or edit a list without attaching it to the
list. The resulting list is simply a function of an existing list.
To use a formula or expression to create or edit a list:
Si
to list2 is based on list1, when
element 1 in list1 changes, element
1 in list2 also changes.
takes slightly longer to
1. Highlight the target list name (list2) where you want place the new list elements and
press ¸. The list (
list2) is highlighted in the entry line.
2. Enter the expression (list1+10) containing the source list and the calculation and
press ¸. The calculated values are pasted into the target list (
Note: The target list will not have the attach symbol (é), and the
formula (or expression) used to calculate the target list will not be
in quotation marks.
list2).
Note: When you use a formula (or expression) to generate or update a list, the resulting calculations
must resolve to a list.
TI-89 / TI-92 Plus / Voyage™ 200 PLT Statistics with List Editor App List Editor 25
Page 32

Formulas
(Continued)
Handling Errors Resulting f r om At t a che d For m ulas
You can use an expression to create or edit a list element. If the expression does not
resolve to a single value, a Data type error message is displayed.
You can also use an expression to create or edit a list. If the expression does not result
in a list, a
Data type error message is displayed.
You can use a formula that generates a different result each time, or example, a formula
that includes a random function or one that refers back to the list the formula is
attached to. The Stats/List Editor evaluates the formula and displays the results, but it
does not attach the formula. You must use … (
formula to a list.
On the Home screen, you can view a list with an attached formula; however, you cannot
edit the attached formula. You can only view and edit attached formulas from within
the Stats/List Editor.
You cannot sort a list with an attached formula. If you try to sort a list with an attached
formula, no error message is displayed; however, the sort function is not executed.
Tip: If an error message is returned when you attempt to display a formula-generated list in the list
editor, press N. Then edit the formula: 1) highlight the list name with the attached formula,
2) press Í, and 3) edit the formula in the entry line, or, press Í again and use the Attached
List Formula dialog box to edit the formula.
List) 4:Attach List Formula to attach a
Detaching a Formula from a List Name
You can detach (clear) a formula from a list name by using the M key or by editing
an element in a list to which a formula is attached.
¦ To detach a formula using the M key:
Move the cursor onto the name of the list (list2) to which a formula is attached.
Press ‘ Í. All list elements remain; however the formula is detached and
the attached formula symbol (é) disappears.
¦ To detach a formula by editing a list element:
Move the cursor onto an element (13) of the list (list2) to which a formula is attached.
Press ¸. Enter the new element value (
changes, the formula is detached, and the attached formula symbol (é) disappears.
&
26) and press ¸. The element
&
TI-89 / TI-92 Plus / Voyage™ 200 PLT Statistics with List Editor App List Editor 26
Page 33

ƒ Tools Menu
Setup Editor ............................................. .. ... .. .. .. .. .. .. .. .. .. .. .. .. ... .. .. .. .. .. .. .. .. .. .. .. .. ... .. .. .. .. .. .. .. .. .. .. .. ... .. .. .. .. 28
Copy and Paste....................................................................................................................................29
Clear a-z............................................................................. .. .. ... .. .. .. .. .. .. .. .. .. .. .. .. ... .. .. .. .. .. .. .. .. .. .. .. ... .. .. .. .. 30
Clear Editor ................................................ ... .. .. .. .. .. .. .. .. .. .. .. .. ... .. .. .. .. .. .. .. .. .. .. .. .. ... .. .. .. .. .. .. .. .. .. .. .. ... .. .. .. .. 31
Format .................................................................................................................................................. 32
About ....................................................................................................................................................33
The ƒ (Tools) menu lets you set up the Stats/List Editor. It includes the Copy
Paste command, which let you share data between different editors and
and
applications. These commands use the clipboard. It also includes several format
options that let you decide how your application interface will work, as well as
several commands that help you with management and cleanup.
TI-89 / TI-92 Plus / Voyage™ 200 PLT Statistics with List Editor App ƒ Tools Menu 27
Page 34

Setup Editor
Description
ƒ (Tools) Æ 3:Setup Editor
Using Setup Editor, you can:
¦ Place lists in the Stats/List Editor.
¦ Enter one or more list names to place in the Stats/List Editor columns, beginning in
column 1, in the order that you enter them. All list names currently in the
Stats/List Editor are removed.
¦ Remove all user-created lists from the Stats/List Editor and restore the list names
list1 through list6 to columns 1 through 6.
¦ Enter and view list names that are archived; however you cannot edit these archived
lists in the list editor.
Note: If you enter a list name that is not already stored in memory, the list name is created and stored
in memory; it becomes an item on the VAR-LINK [All] menu. Press
access this menu.
Example
… (List) and select 1:Names to
1. Press ƒ (Tools) and select 3:Setup Editor to display the Setup Editor dialog box.
2. Insert the list names (
list2,list3) into the Lists To View field as shown below.
Tip: You can press 2 °, highlight a list name, and then
¸ to paste a list name into this field. Be sure to
press
separate the arguments with a comma (
b).
3. Press ¸ to view the lists.
TI-89 / TI-92 Plus / Voyage™ 200 PLT Statistics with List Editor App ƒ Tools Menu 28
Page 35

Copy and Paste
to paste
Description
ƒ (Tools) Æ 5:Copy or 6:Paste
Copy lets you copy cell contents, list formulas, and list names into the calculator
clipboard. The
Paste places a copy of the clipboard contents into the current screen.
Note: When copying information to the clipboard, hold ¤ and press A or B to highlight characters to
the left or right of the cursor.
Example
Copy command leaves information in its current location.
1. Press
2. Press
C until the list name (list1) is highlighted and then press ¸.
ƒ (Tools), select 5:Copy, and then press ¸ to copy the contents of list1 to the
calculator clipboard.
3. Highlight list2 and then press ¸.
4. Press ƒ (Tools), select 6:Paste, and then press ¸ to paste the contents of list1 into
list2.
TI.89 Tip: You can press ¥6 to copy or ¥7
without having to use the ƒ toolbar menu.
TI
.92 Plus / Voyage™ 200 PLT Tip: You can press ¥ C to
copy or
menu.
¥ V to paste without having to use the ƒ toolbar
TI-89 / TI-92 Plus / Voyage™ 200 PLT Statistics with List Editor App ƒ Tools Menu 29
Page 36

Clear a-z
Description
ƒ (Tools) Æ 7:Clear a-z
Clear a-z deletes from calculator memory all single-character variable names (a-z) in the
current folder, unless the variables are locked or archived.
Single-character variable names are often used in symbolic calculations such as:
solve(aøxñ+bøx+c=0,x)
Note: If variables have already been assigned a value, the calculation may produce misleading results.
To prevent this, select 1:Clear a–z before starting the calculation.
Tip: You can make sure that a variable you want to keep is not inadvertently deleted by 7:Clear a-z.
Simply name any variable that you want to retain using multiple characters.
Example
1. Press ƒ (Tools) and select 7:Clear a-z to display the Clear a-z dialog box.
2. Press ¸ to clear all single-character variable names (a-z). Press N to abort the
action.
Note: You cannot use the Clear a-z command in a program; instead, use the DelVar command.
TI-89 / TI-92 Plus / Voyage™ 200 PLT Statistics with List Editor App ƒ Tools Menu 30
Page 37

Clear Editor
Description
ƒ (Tools) Æ 8:Clear Editor
Clear Editor clears all list values and list names from the Stats/List Editor. This function
removes the lists from the editor only.
memory.
Example
Clear Editor does not delete list names from
From the Stats/List Editor, press
ƒ (Tools) and select 8:Clear Editor. All lists are cleared
from the list editor, but not from memory.
Note: You can restore list1, list2, and list3 using Setup Editor.
1. Press
2. Enter the list names you want to display. Be sure to separate each list name with a comma.
3. Press
ƒ (Tools) and select 3:Setup Editor. The Setup Editor dialog box is displayed.
¸ to restore the specified lists.
Note: The Clear Editor command is not available under the CATALOG. In programs, you must use
SetupEd, ClrList, or DelVar commands.
TI-89 / TI-92 Plus / Voyage™ 200 PLT Statistics with List Editor App ƒ Tools Menu 31
Page 38

Format
Description
ƒ (Tools) Æ 9:Format
The four Format settings are shown below.
Settings
Example
Press ƒ (Tools) and select 9:Format to display the FORMATS dialog box. The defaults are
shown here.
Show Initial Dialog
(YES, NO)
Show Path Names
(YES, NO)
Results!Editor
(YES, NO)
Auto-Calculate
(YES, NO)
Shows or hides the initial help folder selection dialog box. By default,
Show Initial Dialog = YES.
Shows or hides path names to a variable. Use Show Path Names to aid in
working with lists from multiple folders. By default,
No.
Sets up the application to automatically append certain statistics
calculations produced by statistics functions to the Stats/List Editor. By
default,
Results!Editor = YES.
Sets the Auto-calculate feature for list and data variables. By default,
Auto-calculate = YES.
¦ When Auto-calculate is set to YES, the elements in a list to which a
formula is attached, are automatically updated when you update the
corresponding elements in a list that is referenced by the attached
formula.
¦ When Auto-calculate is set to YES, the elements in a list to which a
formula is attached, are automatically updated when you edit the
formula.
Show Path Names =
TI-89 / TI-92 Plus / Voyage™ 200 PLT Statistics with List Editor App ƒ Tools Menu 32
Page 39

About
Description
ƒ (Tools) Æ A:About
Displays the About dialog box, which contains the Stats/List Editor application version
and copyright information. Press
You may need information about the TI-89 / TI-92 Plus / Voyage™ 200 PLT, particularly
the software version. Future software versions will include maintenance upgrades, as
well as new applications and major software upgrades available from the TI web site:
education.ti.com
Example
Press:
¦ ƒ (Tools) j A for the TI-89
¦ ƒ (Tools) A for the TI-92 Plus / Voyage 200 PLT
¸ or N to close the dialog box.
Note: The About dialog box will not look exactly like the one
shown here.
TI-89 / TI-92 Plus / Voyage™ 200 PLT Statistics with List Editor App ƒ Tools Menu 33
Page 40

TI-89 / TI-92 Plus / Voyage™ 200 PLT Statistics with List Editor App ƒ Tools Menu 34
Page 41

„ Plots Menu
Plot Setup..................................................................................................... .. .. ... .. .. .. .. .. .. .. .. .. .. .. ... .. .. .. .. 36
Norm Prob Plot (Normal Probability Plot).........................................................................................38
PlotsOff (Plots Off) and FnOff (Functions Off)..................................................................................40
The „ (Plots) menu allows you to produce plots of your data. Plots are
graphical representations of data that have been stored in lists. Before you can
define plots, you must create the lists. Stat/List Editor application plot types
include Scatter, xyline, Box Plot, Histogram, Modified Box Plot, and Normal
Probability Plot.
Note: This chapter assumes that you know how to create lists using the Stats/List Editor application. If
necessary, review the information on creating lists in the Lists and … List Menu chapters in this user
guide.
TI-89 / TI-92 Plus / Voyage™ 200 PLT Statistics with List Editor App „ Plots Menu 35
Page 42

Plot Setup
ot types, plot symbols (marks),
Description
Plots) Æ 1:Plot Setup
„ (
Use Plot Setup to define and manage plots.
Plot Setup Menu
From the
function keys ƒ (
ƒ Define Lets you define a plot using applicable pl
„ Copy Lets you copy a plot to another plot.
… Clear Lets you clear a plot.
† Ÿ (Selec t) Lets you select a plot for graphing and then toggle it on or off.
‡ ZoomData Lets you redefine the viewing window to display all statistical data
Plot Setup menu, you can access the commands by pressing the calculator
Define), „ (Copy), … (Clear), † (Ÿ (Select)), and ‡ (ZoomData).
Defining a Plot Using ƒ Define
„ (Plots) Æ 1:Plot Setup Æ ƒ (Define)
In the Plot Setup dialog box, you select the plot type (Scatter, xyline, Box Plot, Histogram,
Modified Box Plot) and specify the options.
Plot Type Choose one of five plot types: Scatter, xyline, Box Plot, Histogram, Mod
Mark Select the symbol used to plot the data points: Box (›), Cross (x), Plus
lists, frequencies, and categories.
points and go to the graph automatically.
Box Plot
that are not applicable to a plot type are grayed out.
(+),
. The type you choose affects the remaining options. Options
Square (0), or Dot (ø).
x Type or insert the list name (list1, list2, etc.) used for x values, the
y Type or insert the list name used for y values, the dependent variable.
Hist. Bucket Width Specify the width of each bar in a histogram. For more information,
Use Freq and Categories? Select NO or YES. Freq, Category, and Include Categories are active
Freq Type or insert the list name that contains a “weight” value for each
Category Type or insert the list name that contains a category value for each data
Include Categories If you specify a Category list, you can use this field to limit the
TI-89 / TI-92 Plus / Voyage™ 200 PLT Statistics with List Editor App „ Plots Menu 36
independent variable.
This option is active only for
refer to the guidebook.
only when
Plot Type = Box Plot, Histogram, or Mod Box Plot.
data point. If you do not enter a list, all data points are assumed to
have the same weight (1).
point.
calculation to specified category values. For example, if you specify
1,4}, the calculation uses only data points with a category value of 1 or
{
4.
Use Freq and Categories? = YES. Freq is active only for
Plot Type = Scatter or xyline.
Page 43

Plot Setup
Example
1. Press „ (Plots) and select 1:Plot Setup to display the Plot Setup dialog box. Initially,
none of the plots are defined. However, current plot definitions may be displayed.
2. Highlight the plot number that you want to define, and then press ƒ (Define) to
define the plot.
Note: On the calculator, items are active only if they are valid for the current settings of Plot Type
and Use Freq and Categories?
3. Specify applicable settings for the active items.
Note: The Stats/List Editor lets you paste a list into either
the X value or Y value field. Press 2 °, highlight
a list, and then press ¸ to paste a list name into the
field.
4. Press ¸. The
Plot Setup screen is redisplayed, and the plot you defined is
automatically selected for graphing.
Note: The Stats/List Editor displays the ‡(ZoomData) in the Plot Setup menu. Selecting
‡ (ZoomData) lets you set the viewing window to display all statistical data points without having
to access this function in the Y= Editor, Window Editor, or Graph Screen.
TI-89 / TI-92 Plus / Voyage™ 200 PLT Statistics with List Editor App „ Plots Menu 37
Page 44

Norm Prob Plot (Normal Probability Plot)
Description
Plots) Æ 2:Norm Prob Plot
„ (
Norm Prob Plot
the standard normal distribution. If the plotted points lie close to a straight line, the
plot indicates that the data are normal.
Example
Use the .randNorm function in the † (Calc) menu to generate and display a list of
random numbers using m = 35, s = 2, and NUMTRIALS= 90.
randNorm(m, s[,NUMTRIALS])
Store the results to list1, and then use the Norm Prob Plot function to plot each
observation of
distribution.
plots each observation X in a list versus the corresponding quantile z of
Plot Number
List Enter a valid list name in the List field.
Data Axis
Mark
Store Zscores to Enter a list variable name where you want to store the zscores.
X in a list versus the corresponding quantile z of the standard normal
Select the plot number. Only the available (not already defined) plot
numbers are displayed.
Select
X or Y for the Data Axis field.
If you select
z-values on the y-axis. If you select
the y-axis and the z-values on the x-axis.
Select the Mark you want to use for the plot: Box (›), Cross (x), Plus
Square (0), or Dot (ø).
(+),
X, the calculator plots the data on the x-axis and the
(Plot 1...9)
Y, the calculator plots the data on
1. Press „ (Plots) and select 3:PlotsOff to turn off all plots for graphing. Press „ (Plots)
and select
4:FnOff to deselect all Y = functions.
2. Highlight list1, press † (Calc) and select 4:Probability. Then select 6:.randNorm( to
paste the
.randNorm( function to the entry line.
3. Enter the arguments for .randNorm( in the entry line as shown below.
TI-89 / TI-92 Plus / Voyage™ 200 PLT Statistics with List Editor App „ Plots Menu 38
Page 45

Norm Prob Plot (Normal Probability Plot) (continued)
Example (continued)
4. Press ¸ to build a list of random numbers.
5. Press „ (Plots) and select 2:Norm Prob Plot to display the Norm Prob Plot dialog box.
Use the arguments as shown below.
Note: Use the default list variable name in the Store Zscores to input box. The “statvars/zscores”
variable name is truncated in the screenshot above.
6. Press ¸ to paste the zscores to the end of the list editor.
7. Press „ (Plots) and select 1:Plot Setup to display the Plot Setup dialog box.
8. Press ‡ (ZoomData) to display the Norm Prob Plot (Normal Probability Plot).
TI-89 / TI-92 Plus / Voyage™ 200 PLT Statistics with List Editor App „ Plots Menu 39
Page 46

PlotsOff (Plots Off) and FnOff (Functions Off)
Description
PlotsOff
¦
„ (Plots) Æ 3:PlotsOff
¦
Examples
¦
¦ FnOff
PlotsOff
turns off all plots for graphing, but leaves the plot definitions intact. When
in 2-graph mode, it only affects the active graph.
FnOff
Plots) Æ 4:FnOff
„ (
Deselects all Y= functions for the current graphing mode.
PlotsOff
Press „ (Plots) and select 3:PlotsOff to turn off all plots.
Press „ (Plots) and select 4:FnOff to deselect all Y= functions.
TI-89 / TI-92 Plus / Voyage™ 200 PLT Statistics with List Editor App „ Plots Menu 40
Page 47

… List Menu
Introduction..........................................................................................................................................42
Names Menu ........................................................................................................................................ 43
Ops (Operations) Menu.......................................................................................................................44
Sort List.........................................................................................................................................45
Sort List, Adjust All.......................................................................................................................46
dim(................................................................................................................................................47
Fill...................................................................................................................................................48
seq( ................................................................................................................................................ 49
cumSum( ....................................................................................................................................... 50
@List(.............................................................................................................................................. 51
augment(........................................................................................................................................52
left(.................................................................................................................................................53
mid(................................................................................................................................................54
right(...............................................................................................................................................55
Math Menu.................................................................................................. .. .. .. ... .. .. .. .. .. .. .. .. .. .. .. ... .. .. .. .. 56
min(................................................................................................................................................57
max( ...............................................................................................................................................58
mean(.............................................................................................................................................59
median(.......................................................................................................................................... 60
sum(...............................................................................................................................................61
product(.........................................................................................................................................62
stdDev(...........................................................................................................................................63
variance(........................................................................................................................................64
stDevPop(...................................................................................................................................... 65
varPop( .......................................................................................................................................... 66
Attach List Formula................................................................................. .. .. .. .. ... .. .. .. .. .. .. .. .. .. .. .. ... .. .. .. .. 67
Delete Item ........................................................................................................................................... 68
The … (List) menu provides functions for creating, displaying, sorting editing,
inserting, moving, and deleting lists. Functions are also provided for attaching
formulas to lists and performing various statistical analyses with list data. The
Stats/List Editor Application lets you create up to 99 lists with up to 999
elements each, limited only by the amount of memory in the calculator.
TI-89 / TI-92 Plus / Voyage™ 200 PLT Statistics with List Editor App … List Menu 41
Page 48

Introduction
LIST
Entering Arguments for Funct i ons a nd Comm a nds
This chapter shows functions for which the arguments are entered in two different
ways.
¦ Functions followed by an open parenthesis for example,
nCr(.
You enter the arguments for these functions in the entry line of the current screen.
You must separate the arguments with commas, and you must close the function
with a close parenthesis. The arguments (or inputs) for these functions are described
in terms of a syntax statement for example,
Syntax for Input:
nCr(EXPR1,EXPR2)
nCr(EXPR1,EXPR2) ⇒ LIST.
Output:
¦ Functions that are not followed by an open parenthesis for example, SinReg.
You enter the arguments for these functions by placing the arguments in the fields
displayed in a dialog box. The arguments (or inputs) for these functions are
described in a table called
in a dialog box. These outputs are described in a table called
Inputs. The results (or outputs) are shown also displayed
Outputs.
SinReg input dialog box
SinReg output dialog box
Using the CATALOG to Access Functio ns a nd Commands
Many of the functions and commands used in the Stats/List Editor can also be used
from the Home screen.
To display a statistics function or command on the Home screen, simply copy it from the
CATALOG and paste it into the entry line.
For more information about the CATALOG and about syntax, see page 3 of Getting
Started.
TI-89 / TI-92 Plus / Voyage™ 200 PLT Statistics with List Editor App … List Menu 42
Page 49

Names Menu
Description
List) Æ 1:Names
… (
The Names menu displays the VAR-LINK [All] menu containing all the lists in all folders.
The current folder is expanded (indicated by 6) and all other folders are collapsed
(indicated by 8). This menu lets you manage, view, link, and select lists. For more
information about the
Example
VAR-LINK [All] menu, see guidebook.
Press … (
List) and select 1:Names to view all lists.
You can also view lists by pressing 2 °.
Note: When you select 1:Names from the … (List) menu, only list names are displayed, but when you
press 2 °, all variable types, including lists, are displayed.
TI-89 / TI-92 Plus / Voyage™ 200 PLT Statistics with List Editor App … List Menu 43
Page 50

Ops (Operations) Menu
Description
… (List) Æ 2:Ops
The options on the Ops menu are summarized in the table below. Details about each
function or instruction follow.
Ops Menu
Sort List Sorts elements in specified list(s) in ascending or descending order.
Sort List, Adjust All Sorts elements in all lists based on a specified key list.
dim( Returns the dimension (number of elements) of a list.
Fill Replaces each element in a list with a specified value.
seq( Returns a list in which each element is the result of the evaluation of an
expression with regard to a variable.
cumSum( Returns the cumulative sum, element by element, of all elements in a
specified list.
@List( Returns the difference between consecutive elements of a list.
augment( Appends a new list to an existing one.
left( Returns the leftmost specified elements in a list.
mid( Returns the middle specified elements in a list.
right( Returns the rightmost specified elements in a list.
TI-89 / TI-92 Plus / Voyage™ 200 PLT Statistics with List Editor App … List Menu 44
Page 51

Sort List
Description
List) Æ 2:Ops Æ 1:Sort Li st
… (
Sort List
You can specify more that one list when using Sort List. In this case, the first list
specified is the independent list; any following lists are dependent.
The calculator sorts the independent list first, and then sorts all the dependent lists by
placing their elements in the same order as their corresponding elements in the
independent list. This lets you keep sets of related data in the same order when you sort
lists. All arguments must be names of lists. When more than one list is specified, all
lists must have equal dimensions.
Example
Setup:
1. Highlight the list (list1) that you want to sort by moving the cursor to the list name.
2. Press … (List) and select 2:Ops. Then select 1:Sort List. The Sort List dialog box is
sorts the elements of a specified list in ascending or descending order.
list1={5,10,15,20,25,30}
displayed. The list (
List field. Press D B, and select the Sort Order (Descending).
the
list1) that you highlighted on the list editor screen is pasted into
3. Press ¸ to sort the list.
Note: If you want to sort more than one list, you can specify
additional lists by typing the list names into the List field or,
for each list, you can press 2 °, highlight the list
name, and press ¸ to paste the list name into the List
field. Separate each list name with a comma (b).
TI-89 / TI-92 Plus / Voyage™ 200 PLT Statistics with List Editor App … List Menu 45
Page 52

Sort List, Adjust All
Description
List) Æ 2:Ops Æ 2:Sort List, Adjust All
… (
Sort List, Adjust All is identical to Sort List, except this command sorts all other lists in the
editor in the same order as the
Example
Key (independent) List.
Setup:
list1={5,10,15,20,25,30} and list2={35,40,45,50,55,60}
1. Highlight the list (list2) that you want to sort by (the independent list).
2. Press … (List) and select 2:Ops. Then select 2:Sort List, Adjust All. The Sort List, Adjust
dialog box is displayed. The list that you highlighted, the key (or independent) list
All
list2), is pasted into the Key List field. Press D B and select the Sort Order
(
(Descending).
3. Press ¸. All lists are now in descending order, using the specified Key List.
TI-89 / TI-92 Plus / Voyage™ 200 PLT Statistics with List Editor App … List Menu 46
Page 53

dim(
Description
List) Æ 2:Ops Æ 3:dim(
… (
dim( returns a LIST with an element containing the dimension (number of elements) of
LIST1.
dim(LIST1) ⇒ LIST
Example
Setup:
list1={1,3,7,2,8}
1. Highlight the first element of the list (list2) where you want to display the
dimension.
2. Press … (List) and select 2:Ops. Then select 3:dim(.The dim( command is displayed in
the entry line. Enter the list (
list1) for which you want to show the dimension. Press
d.
Tip: You can press 2 °, highlight a list,
and then press ¸ to paste the list name into
the list editor. Be sure to close arguments with a
right parenthesis (d).
3. Press ¸ to display the dimension.
The dimension of list1 is 5.
TI-89 / TI-92 Plus / Voyage™ 200 PLT Statistics with List Editor App … List Menu 47
Page 54

Fill
All of the elements in list1 are replaced
Description
… (
Fill replaces each element in a List with a specified Value. (See the Fill dialog box below.)
Example
List) Æ 2:Ops Æ 4:Fill
Setup:
1. Highlight a list name or any element (
list1={1,2,3,4,5,6}
1) in a list.
2. Press … (List) and select 2:Ops. Then select 4:Fill to display the Fill dialog box. Enter
the list name (
want to fill the list with in the
list1) that you want to fill in the List field and the value (1.01) that you
Value field as shown.
Tip: You can press 2 °, highlight a list,
and then press ¸ to paste the list name into
the list editor. Be sure to close arguments with a
right parenthesis (d).
You can also press … (List) and select 1:Names
to display the VAR-LINK [All] menu.
3. Press ¸ to display the fill values.
TI-89 / TI-92 Plus / Voyage™ 200 PLT Statistics with List Editor App … List Menu 48
with the fill value 1.01
Page 55

seq(
To generate a decimal approximation of list1,
Description
… (
seq( increments VAR from LOW through HIGH by an increment of STEP, evaluates
EXPR, and returns the results as a LIST. The original contents of VAR are in tact after
the
STEP is 1.
seq(EXPR,VAR,LOW,HIGH[,STEP]) ⇒ LIST
Example
List) Æ 2:Ops Æ 5:seq(
seq( function is completed. VAR cannot be a system variable. The default value for
1. Highlight the list name (
2. Press … (
List) and select 2:Ops. Then select 5:seq(. The seq( command is displayed in
the entry line. Use the arguments for
list1) where you want to generate the sequence.
seq( as shown below.
EXPR = 1/x
AR = x
V
LOW = 1
HIGH = 10
STEP = 2
3. Press ¸ to calculate and display the sequence.
Note:
press ¥ ¸ for step 3. To generate a decimal
approximation for a single-element value, move the
cursor to the fraction for which you want the
approximate decimal, press ¸ to highlight it on
the entry line, and then press ¥ ¸.
You can also set the calculator to APPROXIMATE
mode. (Press 3 „ and then set Exact/Approx
to APPROXIMATE.)
TI-89 / TI-92 Plus / Voyage™ 200 PLT Statistics with List Editor App … List Menu 49
Page 56

cumSum(
element value,
to the fraction for which you want
to highlight
Description
List) Æ 2:Ops Æ 6:cumSum(
… (
cumSum( returns a LIST of the cumulative sums of the elements in LIST1, starting at
element 1.
cumSum(LIST1) ⇒ LIST
Example
Setup:
list1={1,1/3,1/5,1/7,1/9}
1. Highlight the list (list2) where you want to return the cumulative sums of the
elements.
2. Press … (List) and select 2:Ops. Then select 6:cumSum(. The cumSum( command is
displayed in the entry line. Enter the list (
list1) for which you want to calculate the
cumulative sums.
Tip: You can press 2 °, highlight a list,
and then press ¸ to paste the list name into
the list editor. Be sure to close arguments with a
right parenthesis (d).
You can also press … (List) and select 1:Names
to display the VAR-LINK [All] menu.
3. Press ¸ to calculate and display the cumulative sums.
TI-89 / TI-92 Plus / Voyage™ 200 PLT Statistics with List Editor App … List Menu 50
Note: To generate a decimal approximation of
list1, press ¥ ¸ for step 3. To generate a
decimal approximation for a singlemove the cursor
the approximate decimal, press ¸
it on the entry line, and then press ¥ ¸.
You can also set the calculator to
APPROXIMATE mode. (Press 3 „ and then
set Exact/Approx to APPROXIMATE.)
Page 57

@List(
Description
List) Æ 2:Ops Æ 7:@List(
… (
@List( returns a LIST containing the difference between consecutive elements in LIST1.
@List(LIST1) ⇒ LIST
Example
Setup:
list1={20,30,45,70}
1. Highlight the list (list2) where you want to return the difference between two
consecutive elements in a list.
2. Press … (List) and select 2:Ops. Then select 7:@List. The D
in the entry line. Enter the list (
list1) for which you want to calculate the difference
D List( command is displayed
DD
between consecutive elements.
Tip: You can press 2 °, highlight a list,
and then press ¸ to paste the list name into
the list editor. Be sure to close arguments with a
right parenthesis (d).
You can also press … (List) and select 1:Names
to display the VAR-LINK [All] menu.
3. Press ¸ to calculate and display the difference between consecutive elements.
The difference between element 1 and element 2 is 10; the
difference between element 2 and element 3 is 15, etc.
TI-89 / TI-92 Plus / Voyage™ 200 PLT Statistics with List Editor App … List Menu 51
Page 58

augment(
Description
List) Æ 2:Ops Æ 8:augment(
… (
augment( returns a new LIST that is LIST2 appended to the end of LIST1.
augment(LIST1,LIST2) ⇒ LIST
Example
Setup:
list1={1,2,3} and list2={4,5,6}
1. Highlight the list (list3) where you want to return the appended list.
2. Press … (List) and select 2:Ops. Then select 8:augment(. The augment( command is
displayed in the entry line. Enter the lists (
Tip: You can press 2 °, highlight a list,
and then press ¸ to paste the list name into
the list editor. Be sure to close arguments with a
right parenthesis (d).
You can also press … (List) and select 1:Names
to display the VAR-LINK [All] menu.
list1,list2) to append.
3. Press ¸.
TI-89 / TI-92 Plus / Voyage™ 200 PLT Statistics with List Editor App … List Menu 52
Page 59

left(
Description
List) Æ 2:Ops Æ 9:left(
… (
left( returns the leftmost NUMBER of the elements contained in LIST1. If you omit
NUMBER,
left(LIST1[,NUMBER]) ⇒ LIST
Example
left( returns all elements in LIST1.
Setup:
list={5,10,15,20,25,30}
1. Highlight the list (list2) where you want to return the leftmost elements.
2. Press … (
the entry line. Enter the list (
elements and the number of leftmost elements (
List) and select 2:Ops. Then select 9:left(. The left( command is displayed in
list1) from which you want to display the leftmost
3) you want to display.
Tip: You can press 2 °, highlight a list,
and then press ¸ to paste the list name into
the list editor. Be sure to close arguments with a
right parenthesis (d).
You can also press … (List) and select 1:Names
to display the VAR-LINK [All] menu.
3. Press ¸ to display the specified number of leftmost elements.
The 3 leftmost elements in list1 are 5, 10, and 15.
TI-89 / TI-92 Plus / Voyage™ 200 PLT Statistics with List Editor App … List Menu 53
Page 60

mid(
to paste the list name into the
Description
List) Æ 2:Ops Æ A:mid(
… (
mid( returns a LIST containing the number of elements (COUNT) from LIST1, beginning
with START. If COUNT is omitted or is greater than the dimension of LIST1,
all elements from LIST1, beginning with START. COUNT must be ‚ 0. If COUNT = 0,
returns an empty LIST.
mid(LIST1,START[,COUNT]) ⇒ LIST
Example
mid( returns
mid(
1. Highlight the list (
2. To select
A:mid( press:
list2) where you want to return the elements.
¦ … (List) 2 j A for the TI-89
¦ … (List) 2 A for the TI-92 Plus / Voyage™ 200 PLT
The mid( command is displayed in the entry line. Enter the list (list1) from which you
want to display the middle elements. Enter the number of elements you want to
display (
2) and the number of the element at which you want to start (3).
Tip: You can press 2 °, highlight a list,
and then press ¸
list editor. Be sure to close arguments with a right
parenthesis (d).
You can also press … (List) and select 1:Names to
display the VAR-LINK [All] menu.
3. Press ¸ to display the specified number of mid elements.
Beginning with the third element in list1, the two middle
elements are 15 and 20.
TI-89 / TI-92 Plus / Voyage™ 200 PLT Statistics with List Editor App … List Menu 54
Page 61

right(
Description
List) Æ 2:Ops Æ B:right(
… (
right( returns a LIST with the specified NUMBER of rightmost elements in LIST1. If you
omit NUMBER,
right(LIST1[,NUMBER]) ⇒ LIST
Example
right( returns the total NUMBER of elements of LIST.
1. Highlight the list (
2. To select
¦ … (List) 2 j B for the TI-89
¦ … (List) 2 B for the TI-92 Plus / Voyage™ 200 PLT
B:right( press:
list2) where you want to return the rightmost elements.
The right( command is displayed in the entry line. Enter the list (list1) from which
you want to display the rightmost elements. Enter the number of rightmost
elements (
3) that you want to display.
Tip: You can press 2 °, highlight a list,
and then press ¸ to paste the list name into
the list editor. Be sure to close arguments with a
right parenthesis (d).
You can also press … (List) and select 1:Names
to display the VAR-LINK [All] menu.
3. Press ¸ to display the specified number of rightmost elements.
The 3 rightmost elements in list1 are 20, 25, 30.
TI-89 / TI-92 Plus / Voyage™ 200 PLT Statistics with List Editor App … List Menu 55
Page 62

Math Menu
Description
… (List) Æ 3:Math
The options on the Math menu are summarized in the table below. Details about each
function or instruction follow.
Math Menu
min( Returns the minimum value of each pair of corresponding elements in
max( Returns the maximum value of each pair of corresponding elements in
mean( Returns the mean of the elements in a list.
median( Returns the median of the elements in a list.
sum( Returns the sum of the elements in a list.
product( Returns the product of the elements in a list.
stdDev( Returns the standard deviation of the elements in a list.
variance( Returns the variance of a list.
two lists.
two lists.
stDevPop( Returns the standard deviation of a population based on the sample
contained in the list.
varPop( Returns the variance of a population based on the sample contained in a
list.
TI-89 / TI-92 Plus / Voyage™ 200 PLT Statistics with List Editor App … List Menu 56
Page 63

min(
Description
List) Æ 3:Math Æ 1:min(
… (
If the argument is one list (LIST1), min( returns VALUE, which is the minimum element
of LIST1.
min(LIST1) ⇒ VALUE
If the arguments are two lists (LIST1 and LIST2), min( returns a LIST containing the
minimum value of each pair of corresponding elements.
min(LIST1,LIST2) ⇒ LIST
The example below shows
highlight a single list element cell in which to return the single minimum element. If you
use
must highlight the list name where you want to return the list of minimum elements.
Note: If you highlight a list name to return a single value to, or if you highlight a single cell to return a
list to, a Data type error is displayed.
Example
Setup: list1={5,10,15,20,25,30}
1. Highlight the first cell of the list (list2) where you want to display the minimum
2. Press … (List) and select 3:Math. Then select 1:min(. The min( command is displayed in
min( returning the minimum element of a single list. You must
min( to find the minimum value of each pair of corresponding elements in two lists, you
element in the list.
the entry line. Enter the list (
list1) from which you want to return the minimum
element.
Tip: You can press 2 °, highlight a list,
and then press ¸ to paste the list name into
the list editor. Be sure to close arguments with a
right parenthesis (d).
You can also press … (List) and select 1:Names
to display the VAR-LINK [All] menu.
3. Press ¸ to display the minimum element.
TI-89 / TI-92 Plus / Voyage™ 200 PLT Statistics with List Editor App … List Menu 57
Page 64

max(
Description
… (
If the argument is one list (LIST1), max( returns VALUE, which is the maximum element
of LIST1.
max(LIST1) ⇒ VALUE
List) Æ 3:Math Æ 2:max(
If the arguments are two lists (LIST1 and LIST2),
maximum value of each pair of corresponding elements.
max(LIST1,LIST2) ⇒ LIST
The example below shows
highlight a single list element cell in which to return the single maximum element. If you
use
you must highlight the list name where you want to return the list of maximum elements.
Note: If you highlight a list name to return a single value to, or if you highlight a single cell to return a
list to, a Data type error is displayed.
Example
Setup: list1={5,10,15,20,25,30}
1. Highlight the first cell of the list (list2) where you want to return the maximum of
max( returns a LIST containing the
max( returning the maximum element of a single list. You must
max( to find the maximum value of each pair of corresponding elements in two lists,
the list.
2. Press … (List) and select 3:Math. Then select 2:max(. The max( function is displayed in
the entry line. Enter the list (
list1) from which you want to display the maximum
element.
Tip: You can press 2 °, highlight a list,
and then press ¸ to paste the list name into
the list editor. Be sure to close arguments with a
right parenthesis (d).
You can also press … (List) and select 1:Names
to display the VAR-LINK [All] menu.
3. Press ¸ to display the maximum of the argument.
TI-89 / TI-92 Plus / Voyage™ 200 PLT Statistics with List Editor App … List Menu 58
Page 65

mean(
To generate a decimal approximation press
Description
… (
mean( returns a VALUE containing the mean of the elements in LIST1.
mean(LIST1) ⇒ VALUE
Example
List) Æ 3:Math Æ 3:mean(
Setup:
1. Highlight the first cell of a list (
list1={1,3,8,11,15}
list2) where you want to return the mean of the
elements.
2. Press … (List) and select 3:Math. Then select 3:mean(. The mean( function is displayed
in the entry line. Enter the list (
list1) from which you want to display the mean of the
elements.
Tip: You can press 2 °, highlight a list,
and then press ¸ to paste the list name into
the list editor. Be sure to close arguments with a
right parenthesis (d).
You can also press …
to display the VAR-LINK [All] menu.
(List) and select 1:Names
3. Press ¸ to calculate and display the mean.
TI-89 / TI-92 Plus / Voyage™ 200 PLT Statistics with List Editor App … List Menu 59
Note:
¥ ¸ for step 3. To generate a decimal
approximation for a single-element value, move
the cursor to the fraction for which you want the
approximate decimal, press ¸ to highlight it
on the entry line, and then press ¥ ¸.
You can also set the calculator to
APPROXIMATE mode. (Press 3 „ and then
set Exact/Approx to APPROXIMATE.)
Page 66

median(
Description
… (
median( returns a VALUE containing the median of the elements in LIST1.
median(LIST1) ⇒ VALUE
Note: All entries in LIST1 must simplify to numbers.
Example
List) Æ 3:Math Æ 4:median(
Setup:
list1={1,3,8,11,15}
1. Highlight the first cell of the list (list2) where you want to return the median of the
elements.
2. Press … (List) and select 3:Math. Then select 4:median(. The median( function is
displayed in the entry line. Enter the list (
list1) for which you want to display the
median of the elements.
Tip: You can press 2 °, highlight a list,
and then press ¸ to paste the list name into
the list editor. Be sure to close arguments with a
right parenthesis (d).
You can also press …
to display the VAR-LINK [All] menu.
(List) and select 1:Names
3. Press ¸ to calculate and display the median.
The median of the elements is 8.
TI-89 / TI-92 Plus / Voyage™ 200 PLT Statistics with List Editor App … List Menu 60
Page 67

sum(
Description
… (
sum( returns a VALUE containing the sum of the elements in LIST1.
sum(LIST1) ⇒ VALUE
Example
List) Æ 3:Math Æ 5:sum(
Setup:
1. Highlight the first cell of a list (
list1={1,2,3,4,5}
list2) where you want to return the sum of the
elements.
2. Press … (List) and select 3:Math. Then select 5:sum(. The sum( function is displayed in
the entry line. Enter the list (
list1) for which you want to calculate the sum of the
elements.
Tip: You can press 2 °, highlight a list,
and then press ¸ to paste the list name into
the list editor. Be sure to close arguments with a
right parenthesis (d).
You can also press …
to display the VAR-LINK [All] menu.
(List) and select 1:Names
3. Press ¸ to calculate and display the sum.
The sum of the elements is 15
TI-89 / TI-92 Plus / Voyage™ 200 PLT Statistics with List Editor App … List Menu 61
Page 68

product(
Description
List) Æ 3:Math Æ 6:product(
… (
product( returns a VALUE containing product of the elements in LIST1.
product(LIST1) ⇒ VALUE
Example
Setup:
1. Highlight the first cell of the list (
list1={1,2,3,4}
list2) where you want to return the product of the
elements.
2. Press … (List) and select 3:Math. Then select 6:product(. The product( function is
displayed in the entry line. Enter the list (
list1) for which you want to display the
product of the elements.
Tip: You can press 2 °, highlight a list,
and then press ¸ to paste the list name into
the list editor. Be sure to close arguments with a
right parenthesis (d).
You can also press … (List) and select 1:Names
to display the VAR-LINK [All] menu.
3. Press ¸ to calculate and display the product.
The product of the elements is 24.
TI-89 / TI-92 Plus / Voyage™ 200 PLT Statistics with List Editor App … List Menu 62
Page 69

stdDev(
To generate a decimal approximation press
Description
… (
stdDev( returns a VALUE containing the standard deviation of the elements in LIST1.
stdDev(LIST1) ⇒ VALUE
The statistics functions stdDev( and stDevPop( calculate the standard deviation of a
population differently.
Note: LIST1 must have at least two elements.
Example
List) Æ 3:Math Æ 7:stdDev(
StdDev( divides by n-1, and stDevPop( divides by n.
Setup:
list1={1,2,3,4,5,6}
1. Highlight the first cell of a list (list2) where you want to return the standard
deviation.
2. Press … (List) and select 3:Math. Then select 7:stdDev. The stdDev( function is
displayed in the entry line. Enter the list (
list1) for which you want to display the
standard deviation of the elements.
Tip: You can press 2 °, highlight a list,
and then press ¸ to paste the list name into
the list editor. Be sure to close arguments with a
right parenthesis (d).
You can also press … (List) and select 1:Names
to display the VAR-LINK [All] menu.
3. Press ¸ to calculate and display the standard deviation.
TI-89 / TI-92 Plus / Voyage™ 200 PLT Statistics with List Editor App … List Menu 63
Note:
¥ ¸ for step 3. To generate a decimal
approximation for a single-element value, move
the cursor to the fraction for which you want the
approximate decimal, press ¸ to highlight it
on the entry line, and then press ¥ ¸.
You can also set the calculator to
APPROXIMATE mode. (Press 3 „ and then
set Exact/Approx to APPROXIMATE.)
Page 70

variance(
To generate a decimal approximation press
Description
List) Æ 3:Math Æ 8:variance(
… (
variance( returns a LIST containing the variance of LIST1.
variance(LIST1) ⇒ LIST
The statistics functions variance( and varPop( calculate the variance of a population
differently.
Note: LIST1 must contain at least two elements
Example
variance( divides by n-1, and varPop( divides by n.
Setup:
list1={1,2,3,L6,3,L2}
1. Highlight the first cell of a list (list2) where you want to return the variance.
2. Press … (List) and select 3:Math. Then select 8:variance(. The variance( function is
displayed in the entry line. Enter the list (
list1) for which you want to display the
variance of the elements.
Tip: You can press 2 °, highlight a list,
and then press ¸ to paste the list name into
the list editor. Be sure to close arguments with a
right parenthesis (d).
You can also press … (List) and select 1:Names
to display the VAR-LINK [All] menu.
3. Press ¸ to calculate and display the variance.
TI-89 / TI-92 Plus / Voyage™ 200 PLT Statistics with List Editor App … List Menu 64
Note:
¥ ¸ for step 3. To generate a decimal
approximation for a single-element value, move
the cursor to the fraction for which you want the
approximate decimal, press ¸ to highlight it
on the entry line, and then press ¥ ¸.
You can also set the calculator to
APPROXIMATE mode. (Press 3 „ and then
set Exact/Approx to APPROXIMATE.)
Page 71

stDevPop(
to highlight it on
Description
List) Æ 3:Math Æ 9:stDevPop(
… (
stDevPop( returns a VALUE containing the standard deviation of a population based on
the sample contained in LIST1.
stDevPop(LIST1) ⇒ VALUE
The statistics functions
population differently.
Note: LIST1 must have at least two elements.
Example
Setup:
1. Highlight the first cell of a list (list2) where you want to return the standard
2. Press … (List) and select 3:Math. Then select 9:stDevPop(. The stDevPop( function is
stDevPop( and stdDev( calculate the standard deviation of a
stDevPop( divides by n, and StdDev( divides by n-1.
list1={1,2,3,L6,3,L2}
deviation of a population.
displayed in the entry line. Enter the list (
standard deviation of a population.
Tip: You can press 2 °, highlight a list,
and then press ¸ to paste the list name into
the list editor. Be sure to close arguments with a
right parenthesis (d).
list1) for which you want to display the
TI-89 / TI-92 Plus / Voyage™ 200 PLT Statistics with List Editor App … List Menu 65
You can also press … (List) and select 1:Names
to display the VAR-LINK [All] menu.
3. Press ¸ to calculate and display the standard deviation of a population.
Note: To generate a decimal approximation press
¥ ¸ for step 3. To generate a decimal
approximation for a single-element value, move
the cursor to the fraction for which you want the
approximate decimal, press ¸
the entry line, and then press ¥ ¸.
You can also set the calculator to APPROXIMATE
mode. (Press 3 „ and then set Exact/Approx
to APPROXIMATE.)
Page 72

varPop(
to highlight it on
Description
… (
varPop( returns a VALUE containing the variance of a population based on the sample
contained in LIST1.
varPop(LIST1) ⇒ VALUE
List) Æ 3:Math Æ A:varPop(
The statistics functions
differently.
Note: LIST1 must contain at least two elements
Example
Setup:
1. Highlight the first cell of a list (list2) where you want to return the variance of the
2. To select A:varPop( press:
The varPop( function is displayed in the entry line. Enter the list (list1) from which
varPop( and variance( calculate the variance of a population
varPop( divides by n, and variance( divides by n-1.
list1={5,10,15,20,25,30}
population.
¦ … (List) 3 j A for the TI-89
¦ … (List) 3 A for the TI-92 Plus / Voyage™ 200 PLT
you want to return the variance of the population.
TI-89 / TI-92 Plus / Voyage™ 200 PLT Statistics with List Editor App … List Menu 66
Tip: You can press 2 °, highlight a list,
and then press ¸ to paste the list name into
the list editor. Be sure to close arguments with a
right parenthesis (d).
You can also press … (List) and select 1:Names
to display the VAR-LINK [All] menu.
3. Press ¸ to calculate and display the variance of the population.
Note: To generate a decimal approximation press
¥ ¸ for step 3. To generate a decimal
approximation for a single-element value, move
the cursor to the fraction for which you want the
approximate decimal, press ¸
the entry line, and then press ¥ ¸.
You can also set the calculator to APPROXIMATE
mode. (Press 3 „ and then set Exact/Approx
to APPROXIMATE.)
Page 73

Attach List Formula
Description
List) Æ 4:Attach List Formula
… (
Attach List Formula attaches a formula to a specified list so that each list element is a
result of the formula, which resolves to a list when executed.
Example
Setup: list1={1,2,3,4,5,6}
1. Highlight the list (
list2) to which you want to attach a formula.
2. Press … (List) and select 4:Attach List Formula. Enter the formula (list1 + 10) and the
formula name (
zlist2) as shown below.
Tip: You can press 2 °, highlight a list,
and then press ¸ to paste the list name into
the list editor. Be sure to close arguments with a
right parenthesis (d).
You can also press … (List) and select 1:Names
to display the VAR-LINK [All] menu.
3. Press ¸ to display the list.
The square symbol next to the list
name means that the formula is
attached. If list1 changes, list2 is
updated.
You can create list2 using list1+10, but without attaching the formula.
1. With list2 name highlighted, enter the formula in the entry line (list2=list1+10).
2. Press ¸. The elements in list2 are updated.
The formula is not attached to list2; therefore, list2 is updated using list1+10 when you
press ¸, but
Note: In this case, the formula will not be in quotation marks in the entry line, and the lock symbol
(é) will not display next to list2.
list2 will not be updated whenever list1 is updated.
For more information about attaching a formula to a list, see Formulas in the List
chapter.
TI-89 / TI-92 Plus / Voyage™ 200 PLT Statistics with List Editor App … List Menu 67
Page 74

Delete Item
Description
List) Æ 5:Delete Item
… (
Delete Item deletes a specified list from the list editor but not from memory.
Example
Setup:
list1={1,2,3,4,5,6}
1. Highlight the list (list1) that you want to delete.
2. Press … (List) and select 5:Delete Item to delete the highlighted list.
Tip: You can press 2 °, highlight a list,
and then press ¸ to paste the list name into
the list editor. Be sure to close arguments with a
right parenthesis (d).
You can also press … (List) and select 1:Names
to display the VAR-LINK [All] menu.
TI-89 / TI-92 Plus / Voyage™ 200 PLT Statistics with List Editor App … List Menu 68
Page 75

† Calc Menu
Introduction..........................................................................................................................................70
1.Var Stats (One-Variable Statistics).................................................................................................71
2.Var Stats (Two-Variable Statistics).................................................................................................73
Regressions Menu...............................................................................................................................76
LinReg(a+bx).................................................................................................................................77
LinReg(ax+b).................................................................................................................................79
MedMed .........................................................................................................................................81
QuadReg........................................................................................................................................83
CubicReg....................................................................................................................................... 85
QuartReg ....................................................................................................................................... 87
LnReg.............................................................................................................................................89
ExpReg .......................................................................................................................................... 91
PowerReg ......................................................................................................................................93
Logist83......................................................................................................................................... 95
Logistic.......................................................................................................................................... 97
SinReg ........................................................................................................................................... 99
MultReg........................................................................................................................................101
Probability Menu................................................................................................................................102
rand83(.........................................................................................................................................103
nPr(...............................................................................................................................................104
nCr( .............................................................................................................................................. 105
! (factorial) ...................................................................................................................................106
randInt( ........................................................................................................................................ 107
.randNorm( .................................................................................................................................. 108
randBin(.......................................................................................................................................109
randSamp(...................................................................................................................................110
rand(.............................................................................................................................................111
RandSeed ....................................................................................................................................112
CorrMat (Correlation Matrix).............................................................................................................113
Show Stats ................................................. ... .. .. .. .. .. .. .. .. .. .. .. .. ... .. .. .. .. .. .. .. .. .. .. .. .. ... .. .. .. .. .. .. .. .. .. .. .. ... .. .. .. 114
The † (Calc) menu provides functions for calculating numerous regressions
(including multiple regression), random number generators, permutations,
combinations, factorials, and correlation matrices.
TI-89 / TI-92 Plus / Voyage™ 200 PLT Statistics with List Editor App † Calc Menu 69
Page 76

Introduction
L
IST
Entering Arguments for Funct i ons a nd Comm a nds
This section shows functions for which the arguments are entered in two different ways.
¦ Functions followed by an open parenthesis for example,
nCr(.
You enter the arguments for these functions in the entry line of the current screen.
You must separate the arguments with commas, and you must close the function
with a close parenthesis. The arguments (or inputs) for these functions are described
in terms of a syntax statement for example,
yntax for Input:
S
nCr(EXPR1,EXPR2)
nCr(EXPR1,EXPR2) ⇒ LIST.
utput:
O
¦ Functions that are not followed by an open parenthesis for example, SinReg.
You enter the arguments for these functions by placing the arguments in the fields
displayed in a dialog box. The arguments (or inputs) for these functions are
described in a table called
in a dialog box. These outputs are described in a table called
Inputs. The results (or outputs) are shown also displayed
Outputs.
SinReg input dialog box
SinReg output dialog box
Using the CATALOG to Access Functio ns a nd Commands
Many of the functions and commands used in the Stats/List Editor can also be used
from the Home screen.
To display a statistics function or command on the Home screen, simply copy it from the
CATALOG and paste it into the entry line.
For more information about the CATALOG and about syntax, see page 3 of Getting
Started.
TI-89 / TI-92 Plus / Voyage™ 200 PLT Statistics with List Editor App † Calc Menu 70
Page 77

1-Var Stats (One-Variable Statistics)
have equal weight or
) list is the frequency of occurrence for each corresponding
, you can use this item to limit the calculation
Description
Calc) Æ 1:1-Var Stats
† (
Inputs
1.Var Stats
List The name of list containing data for calculations. You can also key in the
Freq (optional) The name of the list containing the frequency values for the data in List.
Category List *
(optional)
Include Categories *
(optional)
produces statistics for one data list.
elements of the list, enclosed in brackets, (e.g., {1,2,3,4,5}) in this field.
The default is 1, which means that all values in
importance. All elements must be real numbers |0. Each element in the
frequency
data point in the input list specified in the List field.
A list that can be used to categorize the entries of the list specified in the
List field.
If you input a
to specified category values. For example, if you specify {1,4}, the
calculation uses only data points with a category value of 1 or 4.
(Freq
Category List
List
* For more information on using these inputs, see the example Studying Statistics:
Filtering Data by Categories in the Applications module.
Tip: In any field that requires a list, such as List, Freq, Category List, Include Categories, etc., you can
enter a list name or the list elements themselves. To enter the list elements in the field, simply key in
the elements inside the pair of braces ( {} ) in the field.
Outputs for List
All the statistics outputs are stored to the variable mat1var in the STATVARS folder.
mat1var is a matrix. The first column (c1) contains the descriptor (v, Gx, etc.). The second
column (
output statistics for each corresponding input list. The output statistics are arranged in
the same order as they appear in the output dialog box (the same order as shown in the
table).
See page 113, Correlation Matrix, for an example of how to access the data matrix.
c2) contains the calculations. Each additional column of the matrix contains the
TI-89 / TI-92 Plus / Voyage™ 200 PLT Statistics with List Editor App † Calc Menu 71
Page 78

1-Var Stats (
, highlight a list, and then
Outputs Stored to Description
v x_bar Mean of x values.
Gx sumx Sum of x values.
2
Gx
Sx sx_ Sample standard deviation of x.
sx sx Population standard deviation of x.
n n Number of data points.
MinX min_x Minimum of x values.
Q1X q1_x 1st Quartile of x.
MedX med_x Median of x.
Q3X q3_x 3rd Quartile of x.
MaxX max_x Maximum of x values.
2
G(x-v)
Example
1. In the list editor, enter: list1={1,2,3}
continued)
sumx2 Sum of x
ssdevx Sum of squares of deviations from the mean of x.
2
values.
2. Press † (Calc) and select 1:1-Var Stats to display the 1-Var Stats input dialog box.
Enter the arguments as shown below.
Tip: You can press 2 °
press ¸ to paste the list name into the list editor. Be
sure to close arguments with a right parenthesis (d).
You can also press … (List) and select 1:Names to
display the VAR-LINK [All] menu.
3. Press b to compute the data.
TI-89 / TI-92 Plus / Voyage™ 200 PLT Statistics with List Editor App † Calc Menu 72
Page 79

2-Var Stats (Two-Variable Statistics)
is 1. All
, you can use this item to limit the calculation
Description
Calc) Æ 2:2-Var Stats
† (
2.Var Stats (two.variable statistics) analyzes paired data.
Inputs
X List The independent variable.
Y List The dependent variable.
Freq
(optional)
Category List
(optional)
Include Categories
(optional)
The name of the list containing the frequency values. The default
elements must be real numbers |0. Each element in the frequency list is
the frequency of occurrence for each corresponding data point in the
input list specified in the
A list that can be used to categorize the entries of the specified list.
If you input a Category List
to specified category values. For example, if you specify {1,4}, the
calculation uses only data points with a category value of 1 or 4.
List field.
For more information on using these inputs, see the example Studying Statistics:
Filtering Data by Categories in the Applications module.
TI-89 / TI-92 Plus / Voyage™ 200 PLT Statistics with List Editor App † Calc Menu 73
Page 80

2-Var Stats (
continued)
Outputs for X List and Y List
Outputs Stored to Description
v x_bar Mean of x values.
Gx sumx Sum of x values.
Gx2 sumx2 Sum of x2 values.
Sx sx_ Sample standard deviation of x.
sx sx Population standard deviation of x.
n n Number of data points.
y y_bar Mean of y values.
Gy sumy Sum of y values.
2
Gy
Sy sy_ Sample standard deviation of y.
sy sigmay Population standard deviation of y.
Gxy sumxy Sum of x*y values.
MinX min_x Minimum of x values.
sumy2 Sum of y2 values.
Q1X q1_x 1st Quartile of x.
MedX med_x Median of x.
Q3X q3_x 3rd Quartile of x.
MaxX max_x Maximum of x values.
MinY min_y Minimum of y values.
Q1Y q1_y 1st Quartile of y.
MedY med_y Median of y.
Q3Y q3_y 3rd Quartile of y.
MaxY max_y Maximum of y values.
2
G(x-v)
G(y-w)
ssdevx Sum of squares of deviations from the mean of x.
2
ssdevy Sum of squares of deviations from the mean of y.
TI-89 / TI-92 Plus / Voyage™ 200 PLT Statistics with List Editor App † Calc Menu 74
Page 81

2-Var Stats (
Example
continued)
1. In the list editor, enter:
2. Press † (Calc) and select 2:2-Var Stats to display the 2-Var Stats input dialog box.
Enter the arguments as shown below.
3. Press b to compute the data.
list1={1,2,3} and list2={4,5,6}
Tip: You can press 2 °, highlight a list, and then
press ¸ to paste the list name into the list editor. Be
sure to close arguments with a right parenthesis (d).
You can also press … (List) and select 1:Names to display
the VAR-LINK [All] menu.
TI-89 / TI-92 Plus / Voyage™ 200 PLT Statistics with List Editor App † Calc Menu 75
Page 82

Regressions Menu
Description
Calc) Æ 3:Regressions
† (
The options in the Regressions menu are summarized in the table below. Details about
each option follow.
LinReg(a+bx)
linear regression
LinReg(ax+b)
linear regression
MedMed
median-median
QuadReg
quadratic regression
CubicReg
cubic regression
QuartReg
quartic regression
LnReg
logarithmic regression
ExpReg
exponential regression
PowerReg
power regression
Logist83
Calculates the linear regression, y = a+b*x on lists X and Y.
Calculates the linear regression, y = a*x+b on lists X and Y.
Fits the data to the model y=ax+b (where a is the slope, and b is the
y-intercept) using the median.median line, which is part of the resistant
line technique.
Calculates the quadratic polynomial regression, y=a*x^2+b*x+c on lists
X and Y.
Calculates the cubic polynomial regression, y=a*x^3+b*x^2+c*x+d on
lists X and Y.
Calculates the quartic polynomial regression, y =a*x^4+b*x^3+c*
x^2+d*x+e on lists X and Y.
Calculates the logarithmic regression, y = a+b*ln(x) on lists X and Y.
Calculates the exponential regression, y = a*(b)^x on lists X and Y.
Calculates the power regression, y = a*(x)^b on lists X and Y.
Fits the model equation y=c/(1+a*e^(-bx)) to the data in lists X and Y
using an iterative least-squares fit. It displays values for a,b, and c.
Logistic
logistic regression
SinReg
sinusoidal regression
Fits the data in lists X and Y to the model equation y=a/(1+b*e^(c*x))+d.
It displays values for a,b, and c.
Fits the model equation y=a*sin(bx+c)+d to the data in lists X and Y
using an iterative least-squares fit. It displays values a, b, c, and d. At
least four data points are required. At least two data points per cycle are
required in order to avoid aliased frequency estimates.
MultReg
multiple regression
Calculates multiple linear regression of Y list on X1, X2, . . . , X10 lists.
TI-89 / TI-92 Plus / Voyage™ 200 PLT Statistics with List Editor App † Calc Menu 76
Page 83

LinReg(a+bx)
imit the calculation
Description
Calc) Æ 3:Regressions Æ 1:LinReg(a+bx)
† (
Inputs
LinReg(a+bx)
(linear regression) calculates the linear regression, y = a+b*x on lists X and
Y.
X List, Y List Independent and dependent variable lists.
Store RegEqn to
(optional)
Freq
(optional)
Category List
(optional)
Include Categories
(optional)
Note: For more information on using Freq, Category List, and Include Categories inputs, see the
example Studying Statistics: Filtering Data by Categories in the Applications module.
Designated variable for storing the Regression Equation.
The name of the list containing the frequency values for the data in List.
The default is 1. All elements must be real numbers |0.
Each element in the frequency
(Freq) list is the frequency of occurrence
for each corresponding data point in the input list specified in the
field.
A list that can be used to categorize the entries of the list specified in the
List field.
If you input a Category List, you can use this item to l
to specified category values. For example, if you specify {1,4}, the
calculation uses only data points with a category value of 1 or 4.
List
Outputs
Outputs Stored to Description
a,b a,b Regression coefficients.
2
r
r r Correlation coefficient for linear model.
resid* resid Residuals of the curves fit: y - (a+b*x).
RegEqn regeqn
* Output variable is pasted to the end of the list editor when Results -> Editor option is YES, (located
in ƒ (Tools) 9:Format).
†
If RegEqn, Freq, Category List, or Include Categories are used as inputs, these are also outputs.
rsq Coefficient of determination.
†
Regression Equation: a+b*x.
†
xout
†
yout
freqout
List of data points in the modified X List actually used in the regression
based on restrictions of
Freq, Category List, and Include Categories.
List of data points in the modified Y List actually used in the regression
based on restrictions of
†
List of frequencies corresponding to xout and yout.
Freq, Category List, and Include Categories.
TI-89 / TI-92 Plus / Voyage™ 200 PLT Statistics with List Editor App † Calc Menu 77
Page 84

LinReg(a+bx) (
Example
continued)
1. In the list editor, enter:
list3={1,2,3,4, 5} and list4={2,4,5,8,11}
2. Press † (Calc)and select 3:Regressions. The select 1:LinReg(a+bx) to display the
LinReg(a+bx) input dialog box. Enter the arguments as shown below.
Note: You do not have to specify a Freq (frequency list), Category List, Include Categories list, or
Store RegEqn to function.
3. Press b to compute the data.
Note: When the Results->Editor option is YES (located in ƒ (Tools) 9:Format), the residuals (resid)
list is pasted to the end of the list editor after you close the output dialog box. To prevent the resid list
from being pasted to the end of the list editor, press ƒ (Tools) and select 9:Format to display the
FORMATS dialog box. Change the Results->Editor setting to NO and press Í.
TI-89 / TI-92 Plus / Voyage™ 200 PLT Statistics with List Editor App † Calc Menu 78
Page 85

LinReg(ax+b)
, you can use this item to limit the calculation
Description
Calc) Æ 3:Regressions Æ 2:LinReg(ax+b)
† (
LinReg(ax+b) (linear regression) calculates the linear regression, y = a*x+b on lists X and
Y.
Inputs
X List, Y List Independent and dependent variable lists.
Outputs
Store RegEqn to
Designated variable for storing the Regression Equation.
(optional)
Freq
(optional)
The name of the list containing the frequency values for the data in List.
The default is 1. All elements must be real numbers |0.
Each element in the frequency
(Freq) list is the frequency of occurrence
for each corresponding data point in the input list specified in the
field.
Category List
(optional)
Include Categories
(optional)
List that can be used to categorize the entries of the list specified in the
List field.
If you input a Category List
to specified category values. For example, if you specify {1,4}, the
calculation uses only data points with a category value of 1 or 4.
For more information on using these inputs, see the example Studying Statistics:
Filtering Data by Categories in the Applications module.
Outputs Stored to Description
a,b a,b Regression coefficients: y = a*x+b.
2
r
r r Correlation coefficient for linear model.
rsq Coefficient of determination.
List
resid* resid Residuals of the curves fit: y - (a*x+b).
RegEqn regeqn
xout
†
Regression Equation: a*x+b.
†
List of data points in the modified X List actually used in the regression
based on restrictions of
†
yout
List of data points in the modified Y List actually used in the regression
based on restrictions of
freqout
* Output variable is pasted to the end of the list editor when Results -> Editor option is YES, (located
in ƒ (Tools) 9:Format).
†
If RegEqn, Freq, Category List, or Include Categories are used as inputs, these are also outputs.
†
List of frequencies corresponding to xout and yout.
TI-89 / TI-92 Plus / Voyage™ 200 PLT Statistics with List Editor App † Calc Menu 79
Freq, Category List, and Include Categories.
Freq, Category List, and Include Categories.
Page 86

LinReg(ax+b) (
Example
continued)
1. In the list editor, enter:
2. Press † (Calc) and select 3:Regressions. Then select 2:LinReg(ax+b) to display the
LinReg(ax+b) input dialog box. Enter the arguments as shown below.
3. Press b to compute the data.
Note: When the Results->Editor option is YES (located in ƒ (Tools) 9:Format), the residuals (resid)
list is pasted to the end of the list editor after you close the output dialog box. To prevent the resid list
from being pasted to the end of the list editor, press ƒ (Tools) and select 9:Format to display the
FORMATS dialog box. Change the Results->Editor setting to NO and press Í.
list3={1,2,3,4,5} and list4={2,4,5,8,11}
TI-89 / TI-92 Plus / Voyage™ 200 PLT Statistics with List Editor App † Calc Menu 80
Page 87

MedMed
, you can use this item to limit the calculation
Description
Calc) Æ 3:Regressions Æ 3:MedMed
† (
MedMed (median-median) fits the data to the model y=ax+b (where a is the slope, and b
is the y-intercept) using the median.median line, which is part of the resistant line
technique.
Inputs
X List, Y List Independent and dependent variable lists.
Outputs
Store RegEqn to
Designated variable for storing the Regression Equation.
(optional)
Freq
(optional)
The name of the list containing the frequency values for the data in
The default is 1. All elements must be real numbers |0.
Each element in the frequency
(Freq) list is the frequency of occurrence
for each corresponding data point in the input list specified in the
field.
Category List
(optional)
Include Categories
(optional)
List that can be used to categorize the entries of the list specified in the
List field.
If you input a Category List
to specified category values. For example, if you specify {1,4}, the
calculation uses only data points with a category value of 1 or 4.
For more information on using these inputs, see the example Studying Statistics:
Filtering Data by Categories in the Applications module.
Outputs Stored to Description
a,b a,b Regression coefficients: y = a*x+b.
resid* resid Residuals of the curves fit = y - (a*x+b).
RegEqn regeqn
xout
yout
freqout
†
Regression Equation: a*x+b.
†
†
List of data points in the modified X List actually used in the regression
based on restrictions of
Freq, Category List, and Include Categories.
List of data points in the modified Y List actually used in the regression
based on restrictions of
†
List of frequencies corresponding to xout and yout.
Freq, Category List, and Include Categories.
List.
List
* Output variable is pasted to the end of the list editor when Results -> Editor option is YES, (located
in ƒ (Tools) 9:Format).
†
If RegEqn, Freq, Category List, or Include Categories are used as inputs, these are also outputs.
TI-89 / TI-92 Plus / Voyage™ 200 PLT Statistics with List Editor App † Calc Menu 81
Page 88

MedMed (
Example
continued)
1. In the list editor, enter:
2. Press † (Calc) and select 3:Regressions. Then select 3:MedMed to display the MedMed
input dialog box. Enter the arguments as shown below.
3. Press b to compute the data.
Note: When the Results->Editor option is YES (located in ƒ (Tools) 9:Format), the residuals (resid)
list is pasted to the end of the list editor after you close the output dialog box. To prevent the resid list
from being pasted to the end of the list editor, press ƒ (Tools) and select 9:Format to display the
FORMATS dialog box. Change the Results->Editor setting to NO and press Í.
list3={1,2,3,4,5} and list4={2,4,5,8,11}
TI-89 / TI-92 Plus / Voyage™ 200 PLT Statistics with List Editor App † Calc Menu 82
Page 89

QuadReg
, you can use this item to limit the calculation
Description
Calc) Æ 3:Regressions Æ 4:QuadReg
† (
QuadReg (quadratic regression) calculates the quadratic polynomial regression,
y=a*x^2+b*x+c on lists X and Y.
Inputs
X List, Y List Independent and dependent variable lists.
Outputs
Store RegEqn to
Designated variable for storing the Regression Equation.
(optional)
Freq
(optional)
The name of the list containing the frequency values for the data in List.
The default is 1. All elements must be real numbers |0.
Each element in the frequency
(Freq) list is the frequency of occurrence
for each corresponding data point in the input list specified in the
field.
Category List
(optional)
Include Categories
(optional)
List that can be used to categorize the entries of the list specified in the
List field.
If you input a Category List
to specified category values. For example, if you specify {1,4}, the
calculation uses only data points with a category value of 1 or 4.
For more information on using these inputs, see the example Studying Statistics:
Filtering Data by Categories in the Applications module.
Outputs Stored to Description
a,b,c a,b,c Regression coefficients.
2
R
resid* resid Residuals of the curves fit = y - (a*x^2+b*x+c).
RegEqn regeqn
rsq Coefficient of determination.
†
Regression equation: a*x^2+b*x+c.
†
xout
†
yout
freqout
List of data points in the modified X List actually used in the regression
based on restrictions of
Freq, Category List, and Include Categories.
List of data points in the modified Y List actually used in the regression
based on restrictions of
†
List of frequencies corresponding to xout and yout.
Freq, Category List, and Include Categories.
List
* Output variable is pasted to the end of the list editor when Results -> Editor option is YES, (located
in ƒ (Tools) 9:Format).
†
If RegEqn, Freq, Category List, or Include Categories are used as inputs, these are also outputs.
TI-89 / TI-92 Plus / Voyage™ 200 PLT Statistics with List Editor App † Calc Menu 83
Page 90

QuadReg (
Example
continued)
1. In the list editor, enter:
2. Press †(Calc) and select 3:Regressions. Then select 4:QuadReg to display the QuadReg
input dialog box. Enter the arguments as shown below.
3. Press b to compute the data.
Note: When the Results->Editor option is YES (located in ƒ (Tools) 9:Format), the residuals (resid)
list is pasted to the end of the list editor after you close the output dialog box. To prevent the resid list
from being pasted to the end of the list editor, press ƒ (Tools) and select 9:Format to display the
FORMATS dialog box. Change the Results->Editor setting to NO and press Í.
list1={L2,L1,0,1,2} and list2={18.2,3.5,0,3.9,16.1}
TI-89 / TI-92 Plus / Voyage™ 200 PLT Statistics with List Editor App † Calc Menu 84
Page 91

CubicReg
, you can use this item to limit the calculation
Description
Calc) Æ 3:Regressions Æ 5:CubicReg
† (
CubicReg (cubic regression) calculates the cubic polynomial regression,
y=a*x^3+b*x^2+c*x+d on lists X and Y.
Inputs
X List, Y List Independent and dependent variable lists.
Outputs
Store RegEqn to
Designated variable for storing the Regression Equation.
(optional)
Freq
(optional)
The name of the list containing the frequency values for the data in
The default is 1. All elements must be real numbers |0.
Each element in the frequency
(Freq) list is the frequency of occurrence
for each corresponding data point in the input list specified in the
field.
Category List
(optional)
Include Categories
(optional)
List that can be used to categorize the entries of the list specified in the
List field.
If you input a Category
List
to specified category values. For example, if you specify {1,4}, the
calculation uses only data points with a category value of 1 or 4.
For more information on using these inputs, see the example Studying Statistics:
Filtering Data by Categories in the Applications module.
Outputs Stored to Description
a,b,c,d a,b,c,d Regression coefficients.
2
R
resid* resid Residuals of the curves fit = y - (a*x^3+b*x^2+c*x+d).
RegEqn regeqn
rsq Coefficient of determination.
†
Regression equation: a*x^3+b*x^2+c*x+d.
†
xout
†
yout
freqout
List of data points in the modified X List actually used in the regression
based on restrictions of
Freq, Category List, and Include Categories.
List of data points in the modified Y List actually used in the regression
based on restrictions of
†
List of frequencies corresponding to xout and yout.
Freq, Category List, and Include Categories.
List.
List
* Output variable is pasted to the end of the list editor when Results -> Editor option is YES, (located
in ƒ (Tools) 9:Format).
†
If RegEqn, Freq, Category List, or Include Categories are used as inputs, these are also outputs.
TI-89 / TI-92 Plus / Voyage™ 200 PLT Statistics with List Editor App † Calc Menu 85
Page 92

CubicReg (
Example
continued)
1. In the list editor, enter:
2. Press † (Calc) and select 3:Regressions. Then select 5:CubicReg to display the
CubicReg input dialog box. Enter the arguments as shown below.
3. Press b to compute the data.
Note: When the Results->Editor option is YES (located in ƒ (Tools) 9:Format), the residuals (resid)
list is pasted to the end of the list editor after you close the output dialog box. To prevent the resid list
from being pasted to the end of the list editor, press ƒ (Tools) and select 9:Format to display the
FORMATS dialog box. Change the Results->Editor setting to NO and press Í.
list1={1,2,3,4,5} and list2={L1,0,1,7,25}
TI-89 / TI-92 Plus / Voyage™ 200 PLT Statistics with List Editor App † Calc Menu 86
Page 93

QuartReg
, you can use this item to limit the calculation
Description
Calc) Æ 3:Regressions Æ 6:QuartReg
† (
QuartReg (quartic regression) calculates the quartic polynomial regression,
y = a*x^4+b*x^3+c* x^2+d*x+e on lists X and Y.
Inputs
X List, Y List Independent and dependent variable lists.
Outputs
Store RegEqn to
Designated variable for storing the Regression Equation.
(optional)
Freq
(optional)
The name of the list containing the frequency values for the data in
The default is 1. All elements must be real numbers |0.
Each element in the frequency
(Freq) list is the frequency of occurrence
for each corresponding data point in the input list specified in the
field.
Category List
(optional)
Include Categories
(optional)
List that can be used to categorize the entries of the list specified in the
List field.
If you input a Category
List
to specified category values. For example, if you specify {1,4}, the
calculation uses only data points with a category value of 1 or 4.
For more information on using these inputs, see the example Studying Statistics:
Filtering Data by Categories in the Applications module.
Outputs Stored to Description
a,b,c,d,e a,b,c,d,e Regression coefficients.
R2 rsq Coefficient of determination.
resid* resid Residuals of the curves fit = y - (a*x^4+b*x^3+c* x^2+d*x+e).
RegEqn regeqn
xout
yout
freqout
†
Regression equation: a*x^4+b*x^3+c* x^2+d*x+e.
†
†
List of data points in the modified X List actually used in the regression
based on restrictions of
Freq, Category List, and Include Categories.
List of data points in the modified Y List actually used in the regression
based on restrictions of
†
List of frequencies corresponding to xout and yout.
Freq, Category List, and Include Categories.
List.
List
* Output variable is pasted to the end of the list editor when Results -> Editor option is YES, (located
in ƒ (Tools) 9:Format).
†
If RegEqn, Freq, Category List, or Include Categories are used as inputs, these are also outputs.
TI-89 / TI-92 Plus / Voyage™ 200 PLT Statistics with List Editor App † Calc Menu 87
Page 94

QuartReg (
Example
continued)
1. In the list editor, enter:
2. Press † (Calc) and select 3:Regressions. Then select 6:QuartReg to display the
QuartReg input dialog box. Enter the arguments as shown below.
3. Press b to compute the data.
Note: When the Results->Editor option is YES (located in ƒ (Tools) 9:Format), the residuals (resid)
list is pasted to the end of the list editor after you close the output dialog box. To prevent the resid list
from being pasted to the end of the list editor, press ƒ (Tools) and select 9:Format to display the
FORMATS dialog box. Change the Results->Editor setting to NO and press Í.
list1={L2,L1,0,1,2} and list2={18.2,3.5,0,3.9,16.1}
TI-89 / TI-92 Plus / Voyage™ 200 PLT Statistics with List Editor App † Calc Menu 88
Page 95

LnReg
, you can use this item to limit the calculation
Description
Calc) Æ 3:Regressions Æ 7:LnReg
† (
LnReg (logarithmic regression) calculates the logarithmic regression, y = a+b*ln(x) on
lists X and Y.
Inputs
X List, Y List Independent and dependent variable lists.
Outputs
Store RegEqn to
Designated variable for storing the Regression Equation.
(optional)
Freq
(optional)
The name of the list containing the frequency values for the data in
The default is 1. All elements must be real numbers |0.
Each element in the frequency
(Freq) list is the frequency of occurrence
for each corresponding data point in the input list specified in the
field.
Category List
(optional)
Include Categories
(optional)
List that can be used to categorize the entries of the list specified in the
List field.
If you input a Category
List
to specified category values. For example, if you specify {1,4}, the
calculation uses only data points with a category value of 1 or 4.
For more information on using these inputs, see the example Studying Statistics:
Filtering Data by Categories in the Applications module.
Outputs Stored to Description
a,b a,b Regression coefficients: y = a+b*ln(x).
2
r
r r Correlation coefficient for linear model.
rsq Coefficient of determination.
List.
List
resid* resid Residuals of the curves fit = yN(a+b*ln(x)).
residt* residt Residuals associated with linear fit of transformed data.
RegEqn regeqn
xout
†
Regression equation: a+b*ln(x).
†
List of data points in the modified X List actually used in the regression
based on restrictions of
†
yout
List of data points in the modified Y List actually used in the regression
based on restrictions of
freqout
* Output variable is pasted to the end of the list editor when Results -> Editor option is YES, (located
in ƒ (Tools) 9:Format).
†
If RegEqn, Freq, Category List, or Include Categories are used as inputs, these are also outputs.
†
List of frequencies corresponding to xout and yout.
TI-89 / TI-92 Plus / Voyage™ 200 PLT Statistics with List Editor App † Calc Menu 89
Freq, Category List, and Include Categories.
Freq, Category List, and Include Categories.
Page 96

LnReg (
Example
continued)
1. In the list editor, enter:
2. Press † (Calc) and select 3:Regressions. Then select 7:LnReg to display the LnReg
input dialog box. Enter the arguments as shown below.
3. Press b to compute the data.
Note: When the Results->Editor option is YES (located in ƒ (Tools) 9:Format), the residuals (resid)
list is pasted to the end of the list editor after you close the output dialog box. To prevent the resid list
from being pasted to the end of the list editor, press ƒ (Tools) and select 9:Format to display the
FORMATS dialog box. Change the Results->Editor setting to NO and press Í.
list1={1,2,3,3.5,4.5} and list2={4,5,6,7,8}
TI-89 / TI-92 Plus / Voyage™ 200 PLT Statistics with List Editor App † Calc Menu 90
Page 97

ExpReg
can use this item to limit the calculation
Description
Calc) Æ 3:Regressions Æ 8:ExpReg
† (
ExpReg (exponential regression) calculates the exponential regression, y = a*(b)^x on
lists X and Y.
Inputs
X List, Y List Independent and dependent variable lists.
Outputs
Store RegEqn to
Designated variable for storing the Regression Equation.
(optional)
Freq
(optional)
The name of the list containing the frequency values for the data in List.
The default is 1. All elements must be real numbers |0.
Each element in the frequency
(Freq) list is the frequency of occurrence
for each corresponding data point in the input list specified in the
field.
Category List
(optional)
Include Categories
(optional)
List that can be used to categorize the entries of the list specified in the
List field.
If you input a Category List, you
to specified category values. For example, if you specify {1,4}, the
calculation uses only data points with a category value of 1 or 4.
For more information on using these inputs, see the example Studying Statistics:
Filtering Data by Categories in the Applications module.
Outputs Stored to Description
a,b a,b Regression coefficients: y = a*(b)^x.
2
r
r r Correlation coefficient for linear model.
rsq Coefficient of determination.
List
resid* resid Residuals of the curves fit = y - a*(b)^x.
residt* residt Residuals associated with linear fit of transformed data.
RegEqn regeqn
xout
yout
freqout
* Output variable is pasted to the end of the list editor when Results -> Editor option is YES, (located
in ƒ (Tools) 9:Format).
†
If RegEqn, Freq, Category List, or Include Categories are used as inputs, these are also outputs.
†
†
†
†
TI-89 / TI-92 Plus / Voyage™ 200 PLT Statistics with List Editor App † Calc Menu 91
Regression equation: a*(b)^x.
List of data points in the modified X List actually used in the regression
based on restrictions of
Freq, Category List, and Include Categories.
List of data points in the modified Y List actually used in the regression
based on restrictions of
Freq, Category List, and Include Categories.
List of frequencies corresponding to xout and yout.
Page 98

ExpReg (
Example
continued)
1. In the list editor, enter:
2. Press † (Calc) and select 3:Regressions. Then select 8:ExpReg to display the ExpReg
input dialog box. Enter the arguments as shown below.
3. Press b to compute the data.
Note: When the Results->Editor option is YES (located in ƒ (Tools) 9:Format), the residuals (resid)
list is pasted to the end of the list editor after you close the output dialog box. To prevent the resid list
from being pasted to the end of the list editor, press ƒ (Tools) and select 9:Format to display the
FORMATS dialog box. Change the Results->Editor setting to NO and press Í.
list1={1,2,3,3.5,4.5} and list2={4,5,6,7,8}
TI-89 / TI-92 Plus / Voyage™ 200 PLT Statistics with List Editor App † Calc Menu 92
Page 99

PowerReg
, you can use this item to limit the calculation
Description
Calc) Æ 3:Regressions Æ 9:PowerReg
† (
PowerReg (power regression) calculates the power regression, y = a*(x)^b on lists X and
Y.
Inputs
X List, Y List Independent and dependent variable lists.
Outputs
Store RegEqn to
Designated variable for storing the Regression Equation.
(optional)
Freq
(optional)
The name of the list containing the frequency values for the data in
The default is 1. All elements must be real numbers |0.
Each element in the frequency
(Freq) list is the frequency of occurrence
for each corresponding data point in the input list specified in the
field.
Category List
(optional)
Include Categories
(optional)
List that can be used to categorize the entries of the list specified in the
List field.
If you input a Category
List
to specified category values. For example, if you specify {1,4}, the
calculation uses only data points with a category value of 1 or 4.
For more information on using these inputs, see the example Studying Statistics:
Filtering Data by Categories in the Applications module.
Outputs Stored to Description
a,b a,b Regression coefficients: y = a*(x)^b.
2
r
r r Correlation coefficient for linear model.
rsq Coefficient of determination.
List.
List
resid* resid Residuals of the curves fit = y - a*(x)^b.
residt* residt Residuals associated with linear fit of transformed data.
RegEqn regeqn
xout
†
Regression equation: a*(x)^b.
†
List of data points in the modified X List actually used in the regression
based on restrictions of
†
yout
List of data points in the modified Y List actually used in the regression
based on restrictions of
freqout
* Output variable is pasted to the end of the list editor when Results -> Editor option is YES, (located
in ƒ (Tools) 9:Format).
†
If RegEqn, Freq, Category List, or Include Categories are used as inputs, these are also outputs.
†
List of frequencies corresponding to xout and yout.
TI-89 / TI-92 Plus / Voyage™ 200 PLT Statistics with List Editor App † Calc Menu 93
Freq, Category List, and Include Categories.
Freq, Category List, and Include Categories.
Page 100

PowerReg (
Example
continued)
1. In the list editor, enter:
2. Press † (Calc) and select 3:Regressions. Then select 9:PowerReg. The PowerReg input
dialog box is displayed. Enter the arguments as shown below.
3. Press b to compute the data.
Note: When the Results->Editor option is YES (located in ƒ (Tools) 9:Format), the residuals (resid)
list is pasted to the end of the list editor after you close the output dialog box. To prevent the resid list
from being pasted to the end of the list editor, press ƒ (Tools) and select 9:Format to display the
FORMATS dialog box. Change the Results->Editor setting to NO and press Í.
list1={1,2,3,3.5,4.5} and list2={4,5,6,7,8}
TI-89 / TI-92 Plus / Voyage™ 200 PLT Statistics with List Editor App † Calc Menu 94
 Loading...