

Page 1
TUTORIALS FOR THE TI-84 PLUS FAMILY
Using a Manual Fit Line
Tutorial Overview
In this tutorial, you will learn how to use a manual fit line with the TI-84 Plus Graphing Calculator.
Action Screens
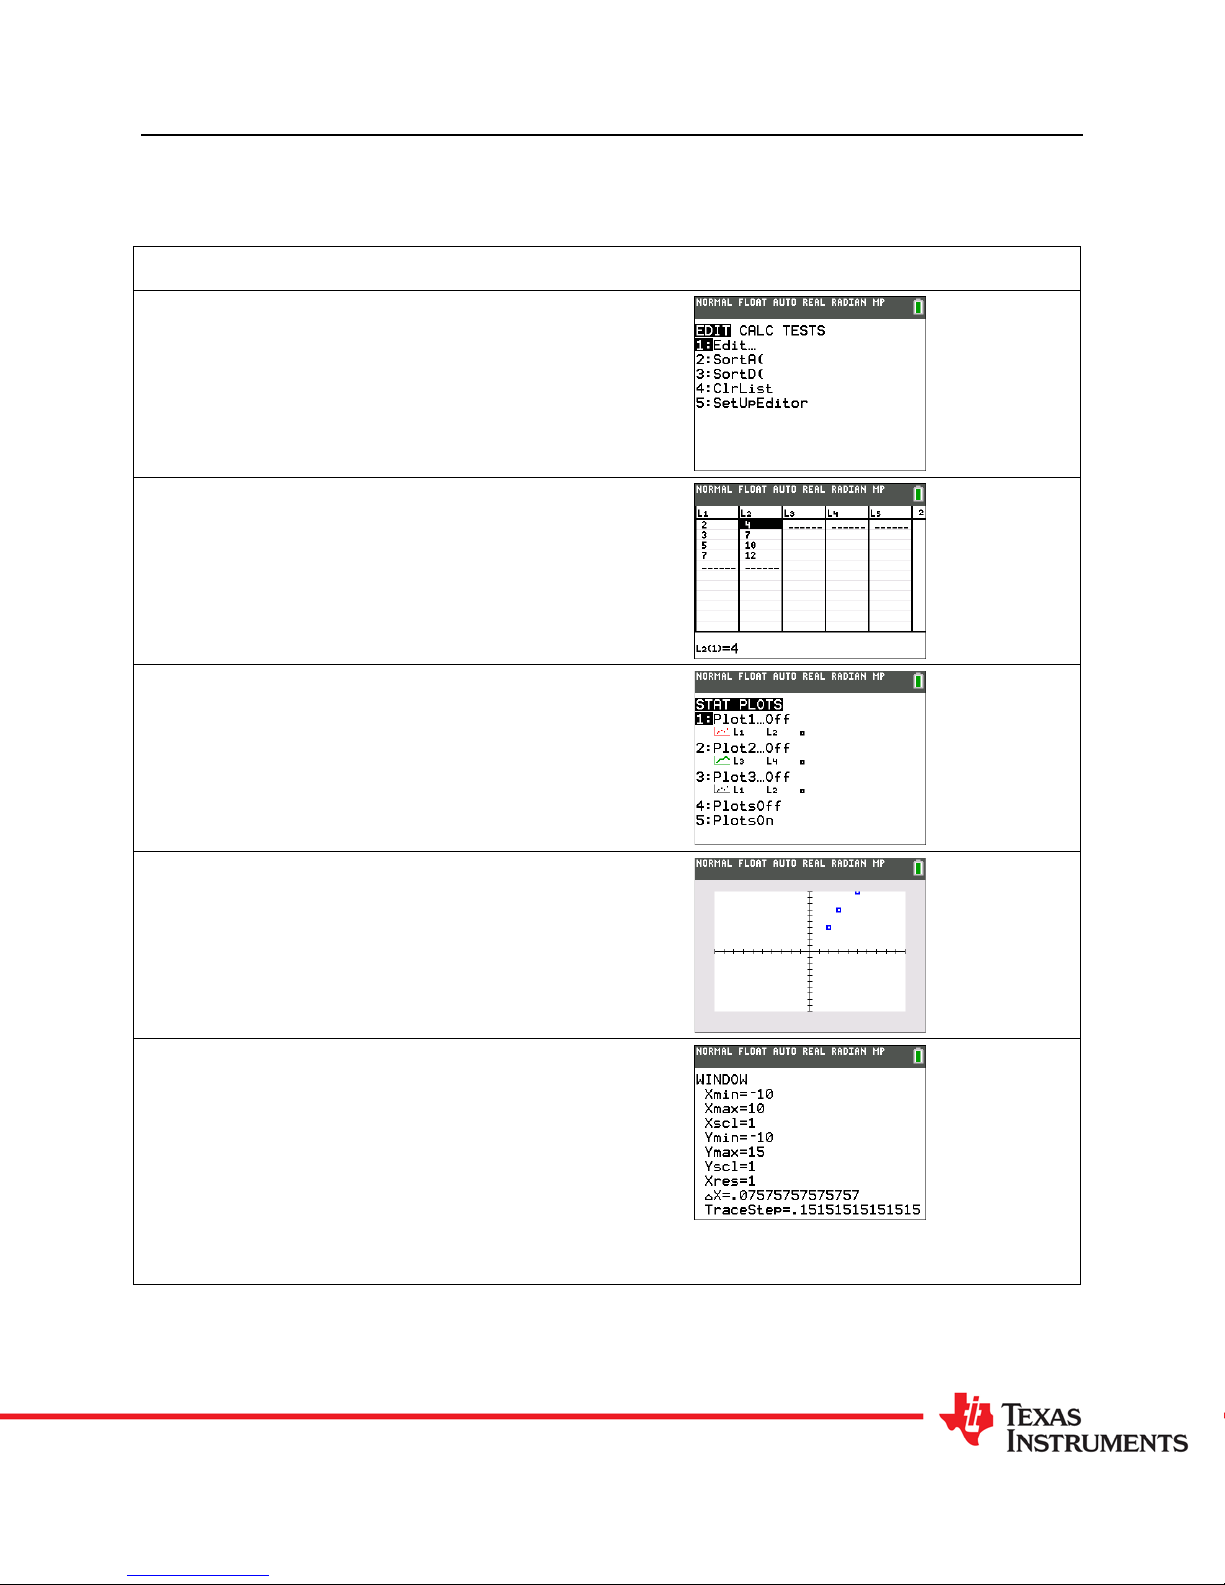
Step 1: Press STAT and select EDIT.
Step 2: Enter data in List 1 and List 2.
Step 3: Press 2nd STAT PLOT (this is the Y= key).
At this point, you can see if the plots are on or off.
All plots should be off except the one with which
you are working.
Step 4: Press GRAPH.
Step 5: All the data points may not be visible and
the window will need to be changed.
Press WINDOW to change the window settings.
You can change the minimums and maximums to
include all the data points.
©2014 Texas Instruments Incorporated 1 education.ti.com
CL3701.5
Page 2
Using a Manual Fit Line
Action Screens
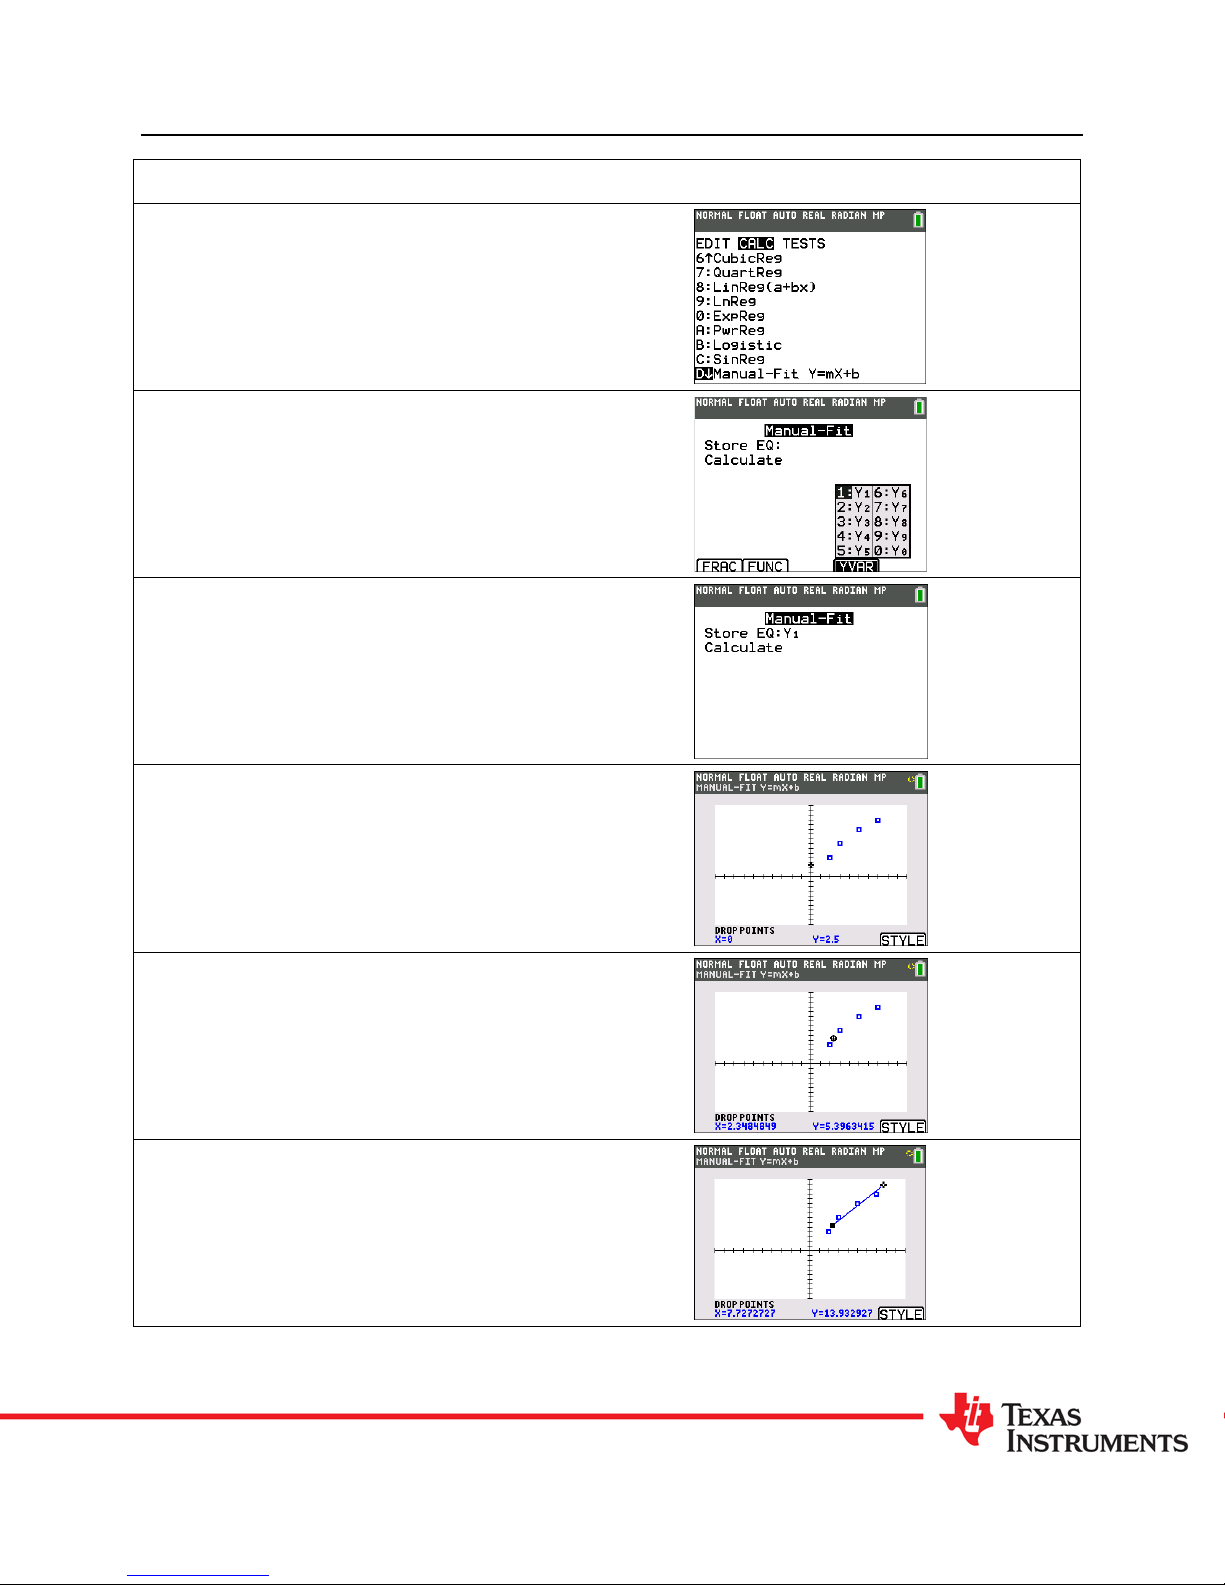
Step 6: To access the manual-fit line, press STAT
and right arrow to access the CALC menu.
Select Manual-Fit Y=mX + b.
Step 7: The screen that you will see shows that
you need to select a location in the y= (equation
editor) to store the result of calculator of the
manual-fit line. Press ALPHA F4 (this is the
TRACE button) and you will see the selections.
Press ENTER to select Y1.
Step 8: Down arrow to Calculate and press ENTER
to calculate the manual-fit line.
TUTORIALS FOR THE TI-84 PLUS FAMILY
Step 9: You will see a cursor in the center of the
screen. Use the arrows to move the cursor to a
location that you think will be on a trend line.
Step 10: Press ENTER to anchor the first point.
Continue to move the line using the arrows.
Step 11: When you have found a second point that
you think would be on the trend line, press ENTER.
©2014 Texas Instruments Incorporated 2 education.ti.com
CL3701.5
Page 3

Using a Manual Fit Line
Action Screens
Step 12: You will see the equation of the current
line appear on the screen with the slope
highlighted. Press ENTER if you would like to edit
the slope.
Step 13: You can right arrow to select the yintercept, press ENTER and edit that value as well.
When you are satisfied with the equation, Se lect
Done (this is the soft key associated with the
GRAPH button).
Step 14: Press Y= to see the equation stored in
Y1.
TUTORIALS FOR THE TI-84 PLUS FAMILY
©2014 Texas Instruments Incorporated 3 education.ti.com
CL3701.5
 Loading...