

Page 1

Reference Guide for the
TI-84 Plus CE Graphing Calculator
Catalog, Commands and Functions, Error Messages
Arithmetic Operations, Test Relations, and Symbols
To obtain the latest version of the documentation, go to
education.ti.com/go/download.
Page 2

Important Information
Except as otherwise expressly stated in the License that accompanies a program, Texas
Instruments makes no warranty, either expressed or implied, including but not limited
to any implied warranties of merchantability and fitness for a particular purpose,
regarding any programs or book materials and makes such materials available solely
on an “as-is” basis. In no event shall Texas Instruments be liable to anyone for special,
collateral, incidental, or consequential damages in connection with or arising out of the
purchase or use of these materials, and the sole and exclusive liability of Texas
Instruments, regardless of the form of action, shall not exceed the purchase price of
this product. Moreover, Texas Instruments shall not be liable for any claim of any kind
whatsoever against the use of these materials by any other party.
© 2006 - 2017 Texas Instruments Incorporated
Important Information ii
Page 3

Contents
Important Information ii
What's New 1
What's New in the TI-84 Plus CE Reference Guide: 1
Introduction 2
CATALOG, Strings, Hyperbolic Functions 3
What Is the CATALOG? 3
Browsing the TI-84 PlusCE Catalog 4
Using Catalog Help 6
Entering and Using Strings 8
Storing Strings to String Variables 9
String Functions and Instructions in the CATALOG 11
Hyperbolic Functions in the CATALOG 16
Commands and Functions Listing 18
Alpha CATALOG Listing 20
A 20
B 22
C 23
D 28
E 32
F 34
G 37
H 41
I 42
L 47
M 51
N 53
O 57
P 57
Q 64
R 64
S 69
T 79
U 83
V 84
W 85
X 86
iii
Page 4

Z 86
Arithmetic Operations, Test Relations, and Symbols 91
Error Messages 100
General Information 106
Texas Instruments S upport and Service 106
Service and Warranty Information 106
iv
Page 5
What's New
What's New in the TI-84 Plus CE Reference Guide:
All items listed are new or updated entries in the Reference Guide for the TI-84 Plus CE
Graphing Calculator.
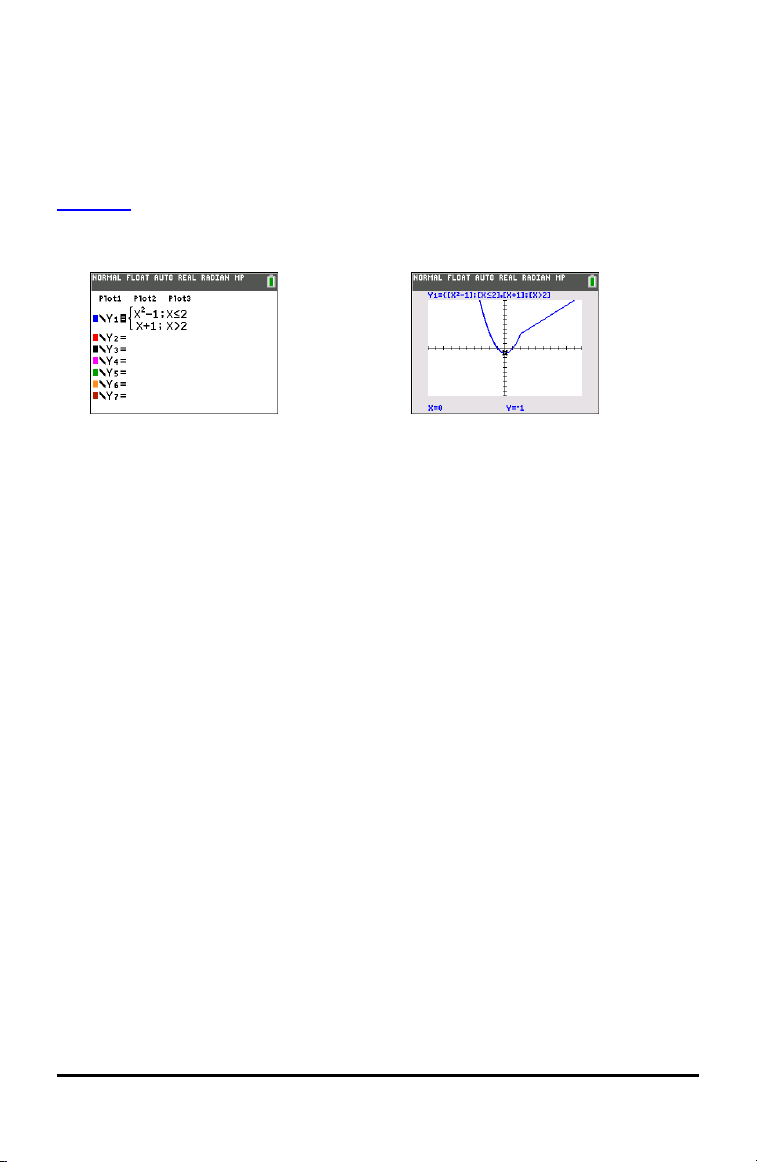
Piecewise
• New piecewise function to support entry of functions as they are seen in textbook.
This command can be found in » MATH B:piecewise(.
• New CONDITIONS submenu in y : supports faster entry of intervals for
piecewise functions.
• Available for use in all function graphing modes and all split screen modes.
What's New 1
Page 6

Introduction
In this Reference Guide you will find the following information:
• CATALOG, Strings, Hyperbolic Functions - Includes instructions on browsing, using,
entering strings, and other functions in the CATALOG.
• Commands and Functions Listing - Includes an alphabetical listing of all CATALOG
items, referencing:
- Function or Instruction/Arguments
- Results
- Key or Keys/Menu or Screen/Item
• Arithmetic Operations, Test Relations, and Symbols - Items whose names are not
alphabetic (such as +, !, and >).
• Error Messages - Includes a listing of error types with possible causes and
suggested remedies.
2 Introduction
Page 7

CATALOG, Strings, Hyperbolic Functions
What Is the CATALOG?
The CATALOG is an alphabetical list of all functions and instructions on the
TI-84PlusCE. You also can access each CATALOG item from a menu or the keyboard,
except:
• The six string functions
• The six hyperbolic functions
• The solve( instruction without the equation solver editor
• The inferential stat functions without the inferential stat editors
Note: The only CATALOG programming commands you can execute from the home
screen are GetCalc(, Get(, and Send(.
CATA LOG, Strings, Hyperbolic Functions 3
Page 8
Browsing the TI-84 PlusCE Catalog
Selecting an Item from the CATALOG
To browse and select a CATALOG item, follow these steps.
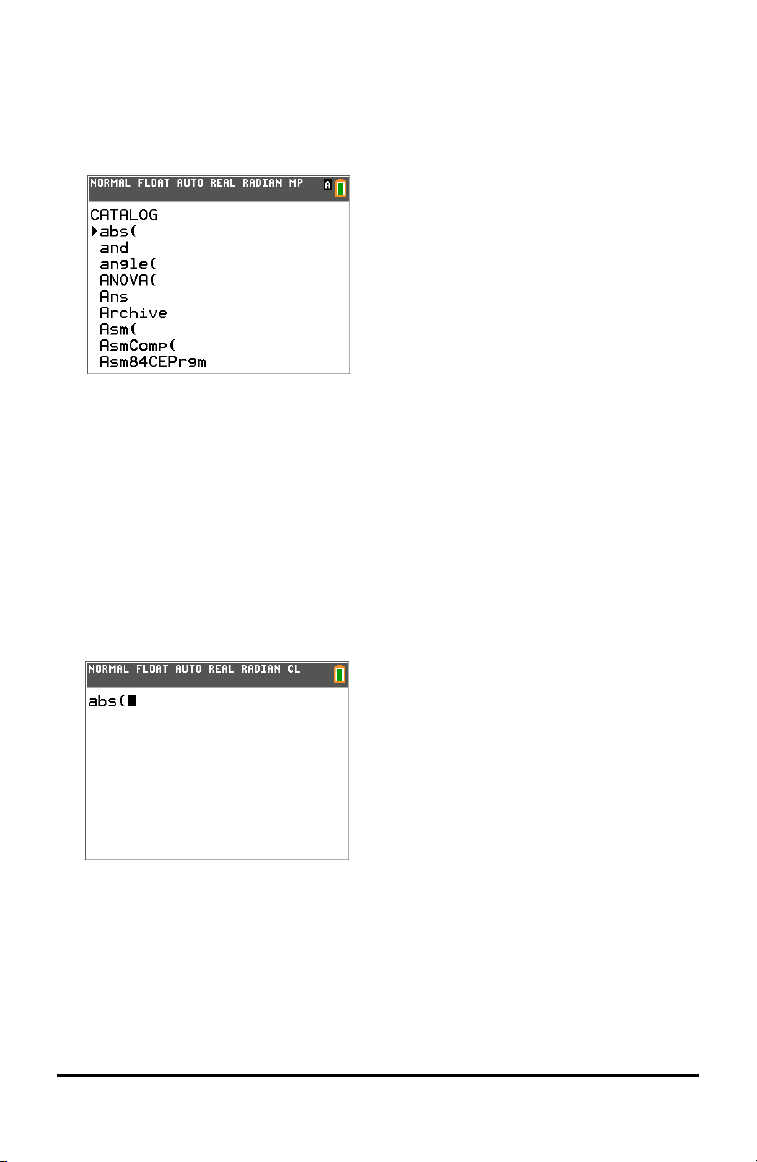
1. Press y Nto display the CATALOG.
The 4 in the first column is the selection cursor.
2. Press † or } to scroll the CATALOG until the selection cursor points to the item
you want.
• To jump to the first item beginning with a particular letter, press that letter;
alpha-lock is on.
• Items that begin with a number are in alphabetical order according to the first
letter after the number. For example, 2-PropZTest( is among the items that
begin with the letter P.
1
• Functions that appear as symbols, such as +,
that begins with Z. To jump to the first symbol, !, press [q].
3. Press Í to paste the item to the current screen.
L
, <, and $(, follow the last item
Note:
• From the top of the CATALOG menu, press } to move to the bottom. From the
bottom, press † to move to the top.
• When your TI-84PlusCE is in MathPrint™ mode, many functions will paste the
MathPrint™ template on the home screen. For example, abs( pastes the absolute
value template on the home screen instead of abs(.
4 CATALOG, Strings, Hyperbolic Functions
Page 9

MathPrint™
Classic
CATA LOG, Strings, Hyperbolic Functions 5
Page 10
Using Catalog Help
Displaying Catalog Help
You can display Catalog Help arguments for functions in two ways:
• Using an alpha/numeric function listing in the catalog (e.g, y N).
• Using the functions listed in certain menus (e.g, »).
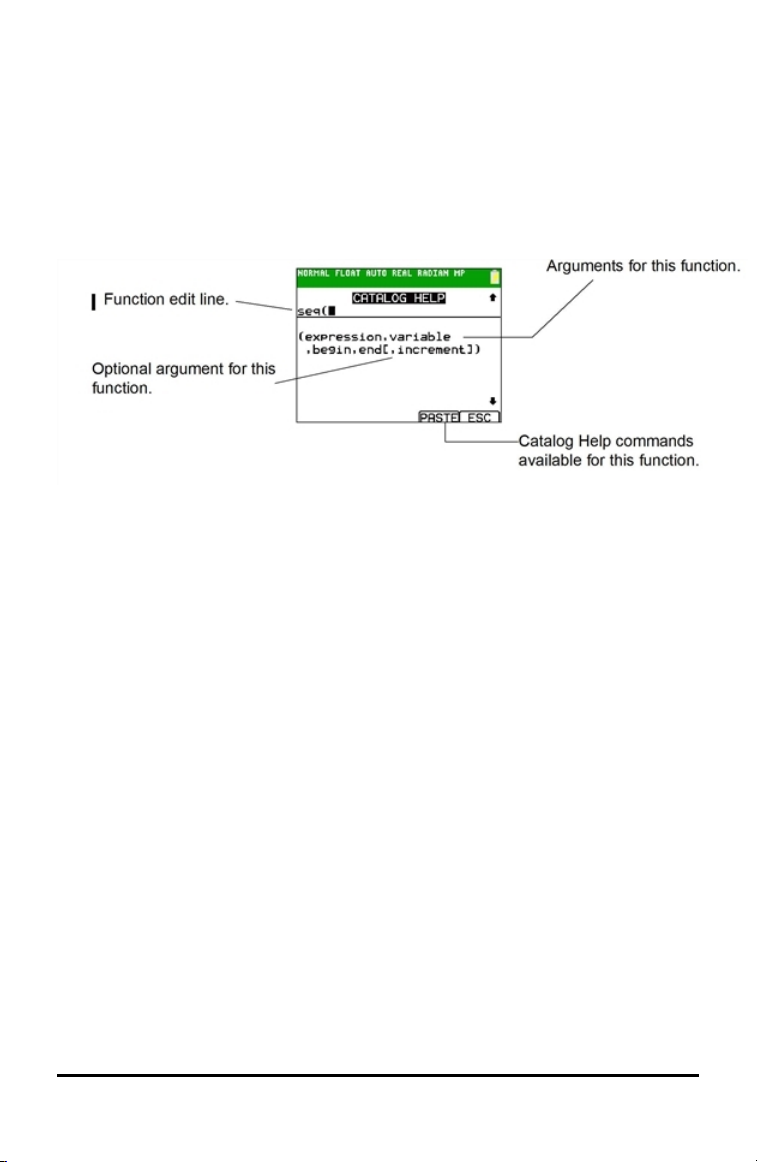
Catalog Help lists the valid arguments for the function under the edit line.
Arguments in brackets are optional.
1. Display the menu that contains the function.
2. Use } and/or † to move the cursor to the function.
3. Press à to display arguments for the function. The cursor is on the function edit
line.
Note:
• The catalog (y N) is displayed in alphabetical order. When you display the
catalog, the alpha-lock is turned on. Press the first letter of the function name to
skip function names that come before it alphabetically. Use } and/or † to move
the cursor to the function.
• Not all catalog functions have associated arguments. If the function does not
require an argument, Catalog Help displays the message “No arguments required
for this item.”
Catalog Help Commands
• Select MORE (if available) to display more arguments for the function.
6 CATALOG, Strings, Hyperbolic Functions
Page 11
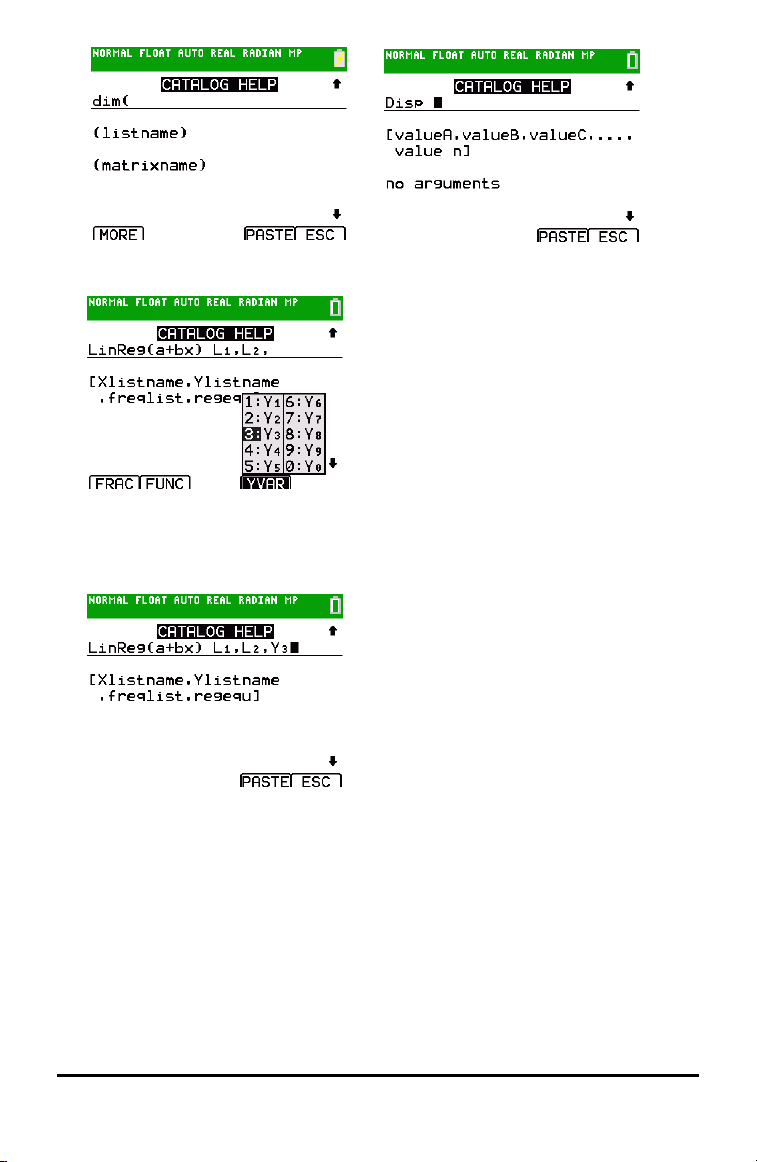
• Use shortcut menus ƒ ^ through a through for argument values if available.
• Enter your argument values on the function edit line, and then select PASTE to
paste the function and the argument values you entered.
Note: You can paste to most cursor locations.
• Select ESC to exit the Catalog Help screen.
CATA LOG, Strings, Hyperbolic Functions 7
Page 12

Entering and Using Strings
What Is a String?
A string is a sequence of characters that you enclose within quotation marks. On the
TI-84PlusCE, a string has two primary applications.
• It defines text to be displayed in a program.
• It accepts input from the keyboard in a program.
Characters are the units that you combine to form a string.
• Each number, letter, and space counts as one character.
• Each instruction or function name, such as sin( or cos(, counts as one character; the
TI-84PlusCE interprets each instruction or function name as one character.
Entering a String
To enter a string on a blank line on the home screen or in a program, follow these
steps.
1. Press ƒ W to indicate the beginning of the string.
2. Enter the characters that comprise the string.
• Use any combination of numbers, letters, function names, or instruction names
to create the string.
• To enter a blank space, press ƒ O.
• To enter several alpha characters in a row, press ƒ 7 to activate alphalock.
3. Press ƒ W to indicate the end of the string.
ãstringã
4. Press Í. On the home screen, the string is displayed on the next line without
quotations. An ellipsis (...) indicates that the string continues beyond the screen. To
scroll to see the entire string, press ~ and |.
Note: A string must be enclosed in quotation marks. The quotation marks do not count
as string characters.
8 CATALOG, Strings, Hyperbolic Functions
Page 13
Storing Strings to String Variables
String Variables
The TI-84PlusCE, has 10 variables to which you can store strings. You can use string
variables with string functions and instructions.
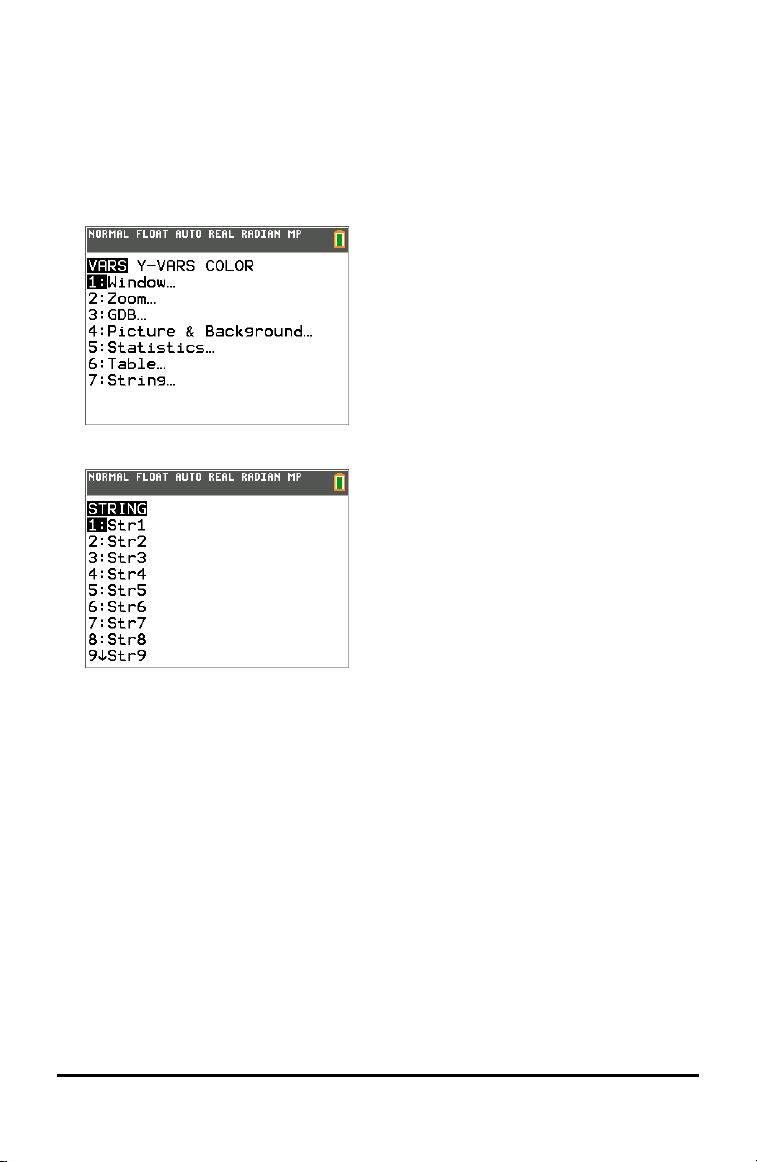
To display the VARS STRING menu, follow these steps.
1. Press ½ to display the VARS menu. Move the cursor to 7:String.
2. Press Í to display the STRING secondary menu.
Storing a String to a String Variable
To store a string to a string variable, follow these steps.
1. Press ƒ W, enter the string, and press ƒ W.
2. Press ¿.
3. Press ½ 7 to display the VARS STRING menu.
4. Select the string variable (from Str1 to Str9, or Str0) to which you want to store the
string.
CATA LOG, Strings, Hyperbolic Functions 9
Page 14
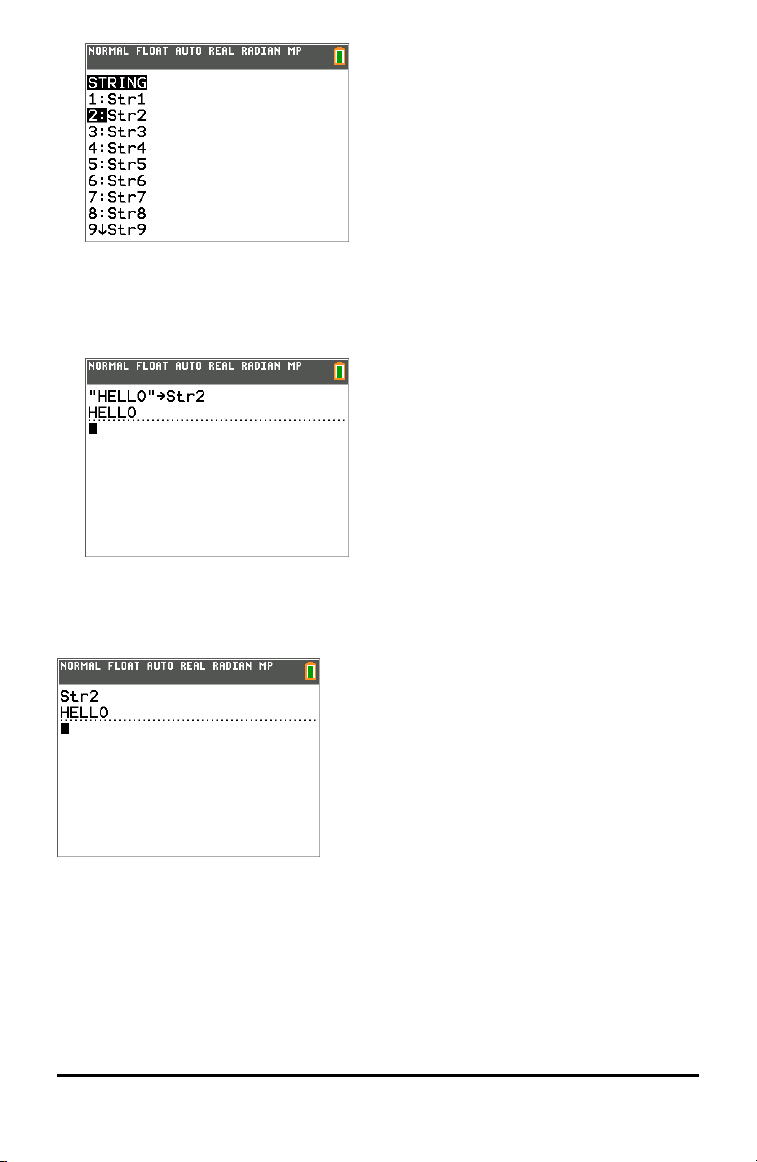
The string variable is pasted to the current cursor location, next to the store symbol
(!).
5. Press Í to store the string to the string variable. On the home screen, the
stored string is displayed on the next line without quotation marks.
Displaying the Contents of a String Variable
To display the contents of a string variable on the home screen, select the string
variable from the VARS STRING menu, and then press Í. The string is displayed.
10 CA TALOG, Strings, Hyperbolic Functions
Page 15
String Functions and Instructions in the CATALOG
Displaying String Functions and Instructions in the CATALOG
String functions and instructions are available only from the CATALOG. The table below
lists the string functions and instructions in the order in which they appear among the
other CATALOG menu items. The ellipses in the table indicate the presence of
additional CATALOG items.
CATALOG
...
Equ4String( Converts an equation to a string.
...
expr( Converts a string to an expression.
...
inString( Returns a character’s place number.
...
length( Returns a string’s character length.
...
String4Equ( Converts a string to an equation.
sub( Returns a string subset as a string.
...
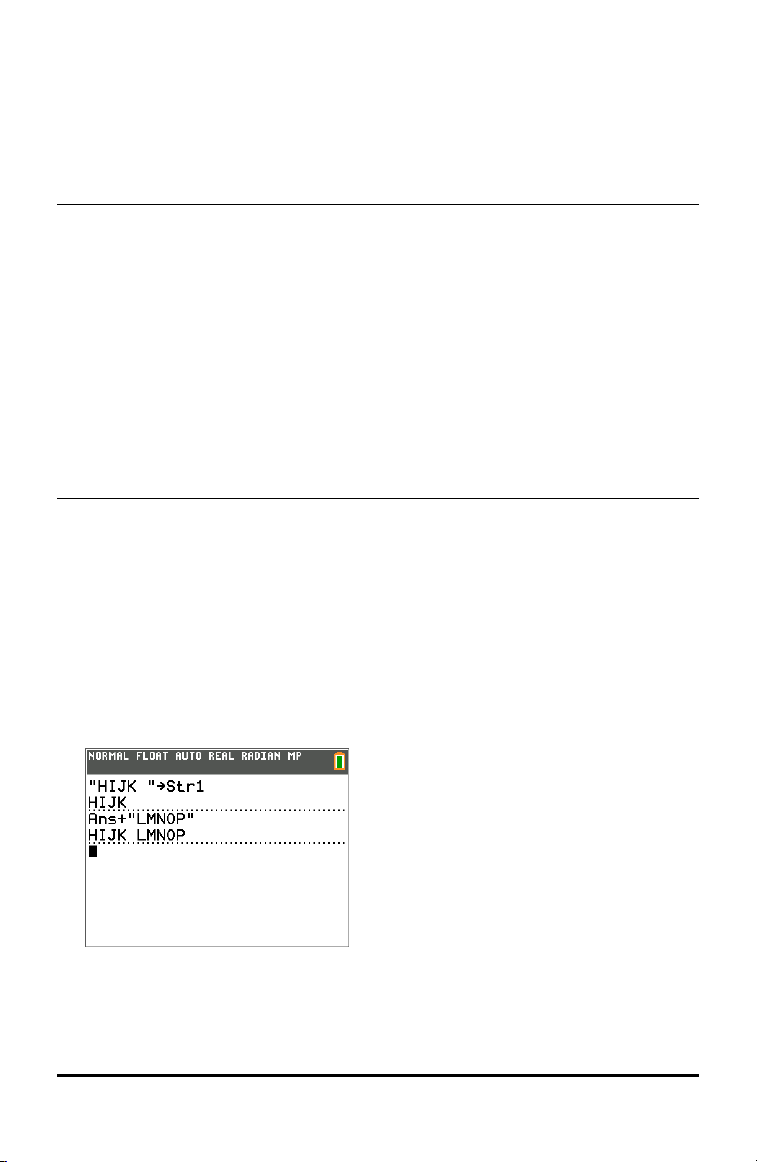
Concatenation
To concatenate two or more strings, follow these steps.
1. Enter string1, which can be a string or string name.
2. Press Ã.
3. Enter string2, which can be a string or string name. If necessary, press à and
enter string3, and so on.
string1+string2+string3...
4. Press Í to display the strings as a single string.
CATA LOG, Strings, Hyperbolic Functions 11
Page 16

Selecting a String Function from the CATALOG
To select a string function or instruction and paste it to the current screen, follow the
steps for selecting an item from the CATALOG.
Equ4String(
Equ4String( converts an equation to a string. The equation must be store in a
VARSY-VARS variable. Yn contains the equation. Strn (from Str1 to Str9, or Str0) is the
string variable to which you want the equation to be stored.
Equ4String(Yn,Strn)
expr(
expr( converts the character string contained in string to an expression and executes
the expression. string can be a string or a string variable.
expr(string)
inString(
inString( returns the character position in string of the first character of substring.
string can be a string or a string variable. start is an optional character position at
which to start the search; the default is1.
inString(string,substring[,start])
12 CA TALOG, Strings, Hyperbolic Functions
Page 17
Note: If string does not contain substring, or start is greater than the length of string,
inString( returns 0.
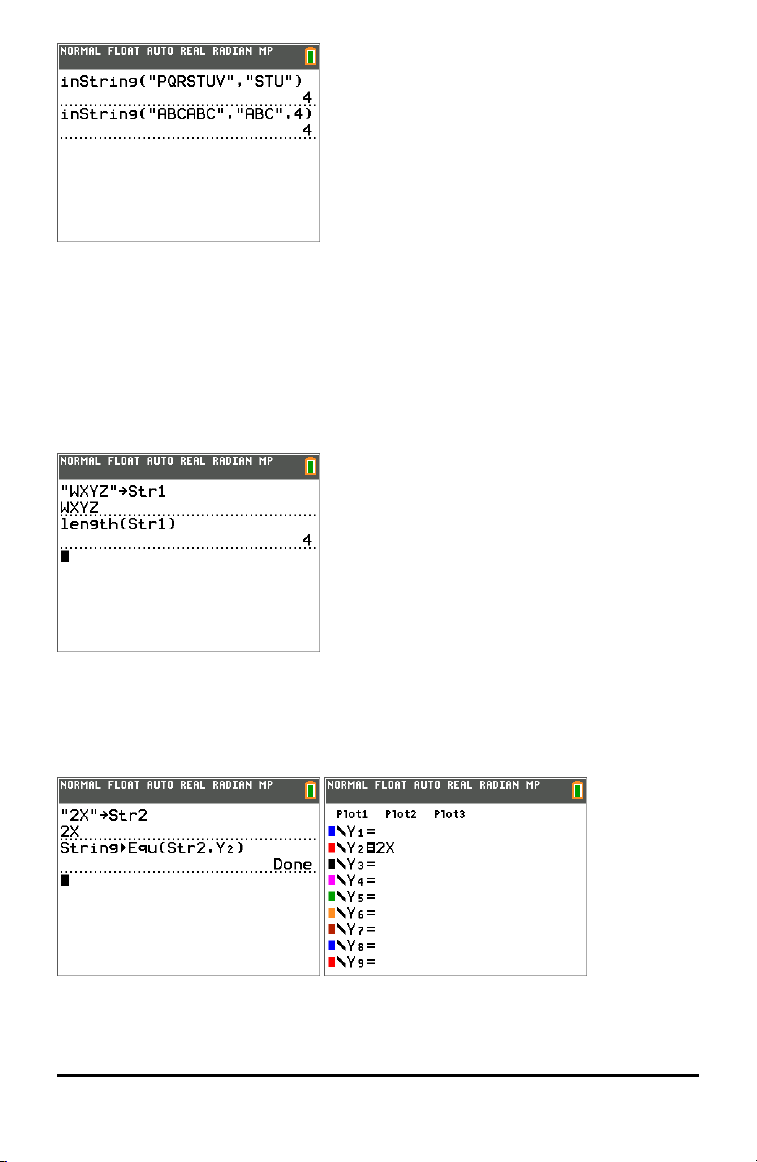
length(
length( returns the number of characters in string. string can be a string or string
variable.
Note: An instruction or function name, such as sin( or cos(, counts as one character.
length(string)
String4Equ(
String4Equ( converts string into an equation and stores the equation to Yn. string can
be a string or string variable. String4Equ( is the inverse of Equ4String(.
String4Equ(string,Yn)
CATA LOG, Strings, Hyperbolic Functions 13
Page 18
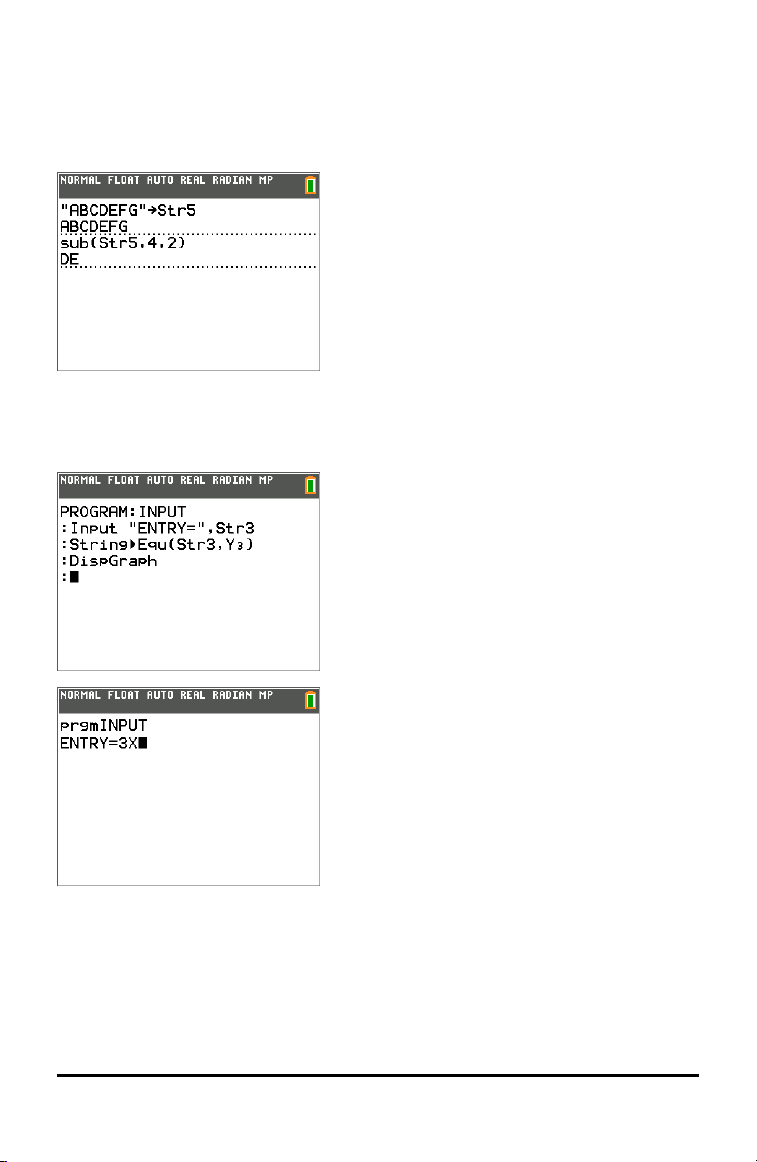
sub(
sub( returns a string that is a subset of an existing string. string can be a string or a
string variable. begin is the position number of the first character of the subset. length
is the number of characters in the subset.
sub(string,begin,length)
Entering a F unction to Graph during Program Execution
In a program, you can enter a function to graph during program execution using these
commands.
14 CA TALOG, Strings, Hyperbolic Functions
Page 19

Note: When you execute this program, enter a function to store to Y3 at the ENTRY=
prompt.
CATA LOG, Strings, Hyperbolic Functions 15
Page 20
Hyperbolic Functions in the CATALOG
Hyperbolic Functions
The hyperbolic functions are available only from the CATALOG. The table below lists
the hyperbolic functions in the order in which they appear among the other CATALOG
menu items. The ellipses in the table indicate the presence of additional CATALOG
items.
CATALOG
...
cosh( Hyperbolic cosine
cosh-1( Hyperbolic arccosine
...
sinh( Hyperbolic sine
sinh-1( Hyperbolic arcsine
...
tanh( Hyperbolic tangent
tanh-1( Hyperbolic arctangent
...
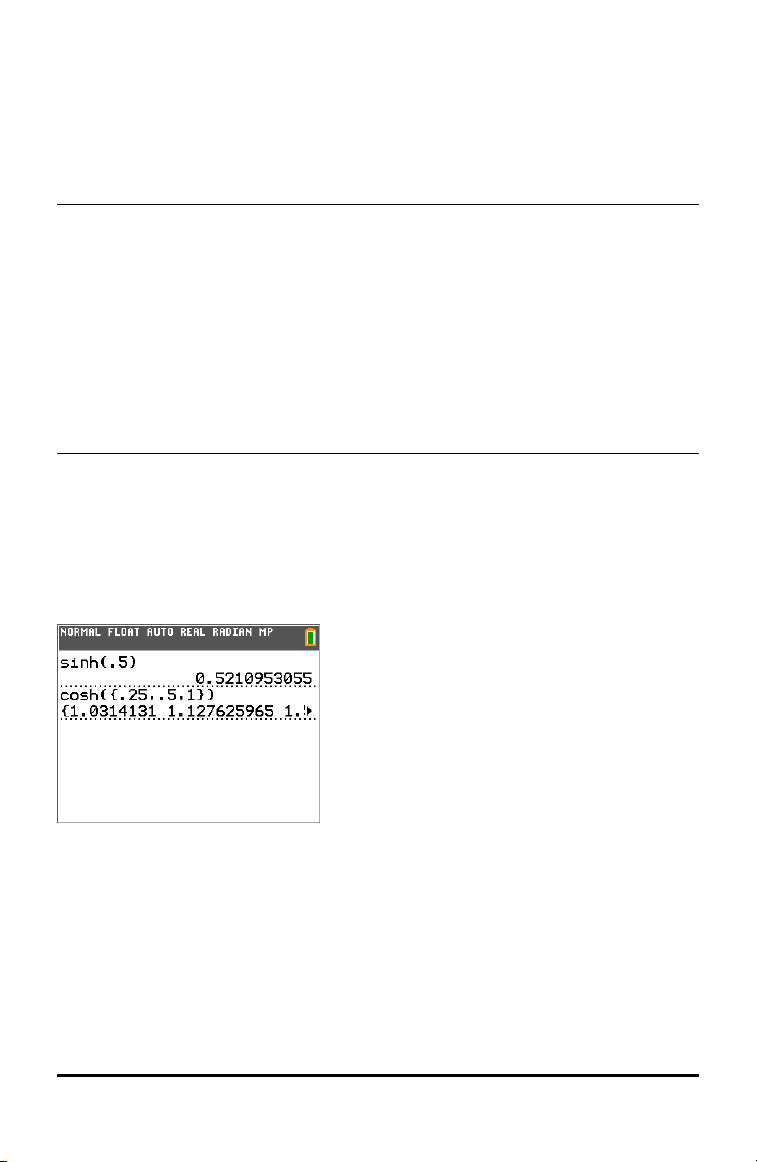
sinh(, cosh(, tanh(
sinh(, cosh(, and tanh( are the hyperbolic functions. Each is valid for real numbers,
expressions, and lists.
sinh(value)
cosh(value)
tanh(value)
sinh-1(, cosh-1(, tanh-1(
sinh-1( is the hyperbolic arcsine function. cosh-1( is the hyperbolic arccosine function.
tanh-1( is the hyperbolic arctangent function. Each is valid for real numbers,
expressions, and lists.
sinh-1(value)
cosh-1(value)
tanh-1(value)
16 CA TALOG, Strings, Hyperbolic Functions
Page 21

CATA LOG, Strings, Hyperbolic Functions 17
Page 22

Commands and Functions Listing
The purpose of this table of information is to provide a short description with syntax of
command arguments as appropriate and menu locations for each command or
function in the Catalog listing in the calculator.
This table is useful for executing commands when using the calculator or creating TIBasic programs.
Items whose names are not alphabetic (such as +, !, and >) are listed in the Arithmetic
Operations, Test Relations, and Symbols section. Unless otherwise specified, all
examples in this section were performed in the default reset mode, and all variables
are assumed to be the default value of 0.
From the CATALOG, you can paste any function or command to the home screen or to a
command line in the program editor.
The same syntax information for function and command arguments below is available
on the calculator and also in the TI Connect™ CE Program Editor.
• On the calculator, pressing [+] when a function or command is highlighted in the
menu listing will display the Catalog Help syntax editor to assist your entries.
• Using TI Connect™ CE Program Editor, the catalog listing also displays the syntax of
the arguments for functions and commands.
Note that some functions and commands are only valid when executed in a TI-Basic
program and not from the home screen.
The items in this table appear in the same order as they appear in the CATALOG (y
[catalog].)
In the table below, the † symbol indicates either keystrokes or certain commands
which are only available in the Program Editor mode on the calculator. Press ¼ and
select to EDIT an existing program or NEW to start a new program to set the calculator
in the Program Edit mode.
Some arguments are optional. Optional arguments will be indicated within [ ] in the
syntax help given in the table below. [ ] are not symbols on the calculator and are not
to be typed in. They are used here only to indicate an optional argument.
On the calculator, functions and commands paste as "tokens." This means they paste
as one character and not as individual letters, symbols and spaces. Do not attempt to
type in any function or command on the calculator. Just paste the token from menu
locations. Watch the cursor jump over tokens as you edit to get a better understanding
of tokens.
In TI Connect™ CE Program Editor, you can "feel" the same experience of pasting
tokens when using the Catalog tree provided in that editor. You also can type in the
functions and commands if you know the correct format and syntax. TI Connect™ CE
"tokenizes" the functions and commands when you send the program to the calculator.
However, you must type in the functions and commands exactly as the tokens. Note
that some commands will have spaces as part of the token which you might not see.
For example, Pause command as a token has a space at the end. Once you send the
18 Com mands and Functions Listing
Page 23
program to the calculator, you can run the program and if there are any syntax errors,
you can fix the issues on either the calculator or in TI Connect™ CE Program Editor.
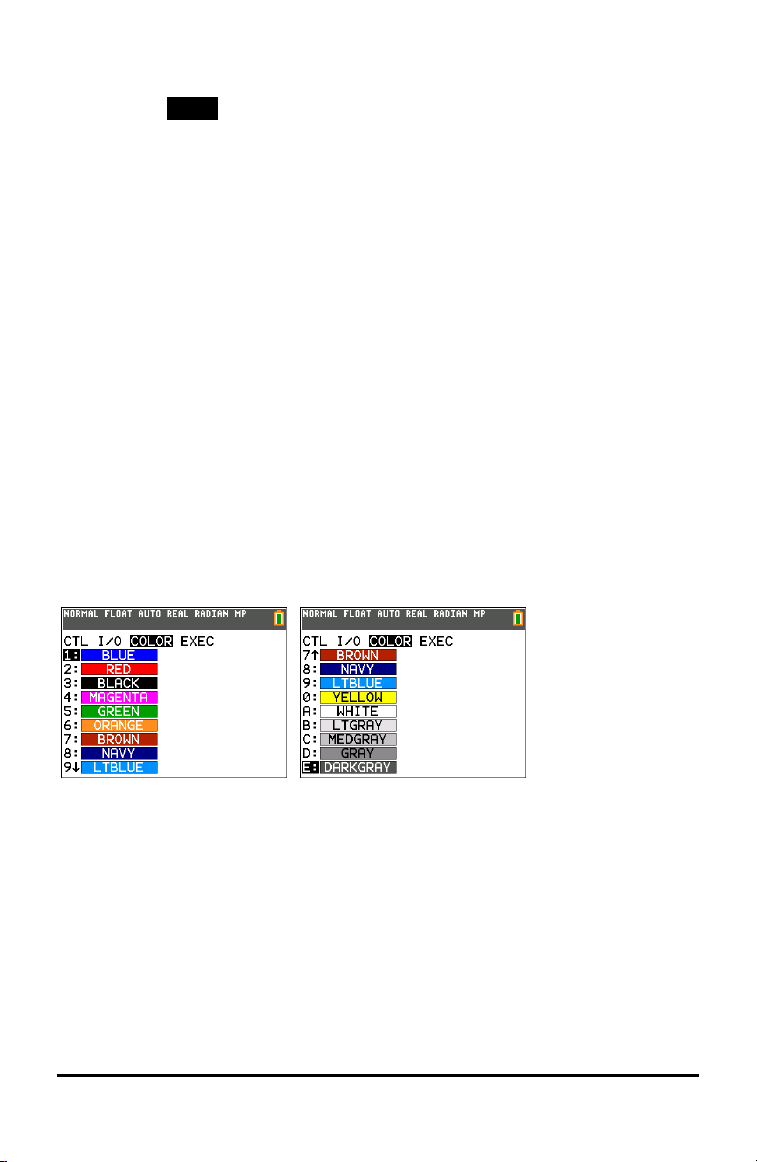
CTL I/O
COLOR
Color Numbers Names
EXEC
10 BLUE
11 RED
12 BLACK
13 MAGENTA
14 GREEN
15 ORANGE
16 BROWN
17 NAVY
18 LTBLUE
19 YELLOW
20 WHITE
21 LTGRAY
22 MEDGRAY
23 GRAY
24 DARKGRAY
You can also choose a name in the ½ menu (COLOR sub-menu).
GraphColor(function#,color#)
For exam ple, GraphColor(2,4) orGraphColor(2,MAGENTA).
Commands and Functions Listing 19
Page 24

Alpha CATALOG Listing
A
abs()
abs(value)
Returns the absolute value of a real number, expression, list, or matrix.
abs()
abs(complex value)
Returns the mag nitude of a com plex number or list.
and
valueA and valueB
Returns 1 (true) when both valueA and valueB are true. Otherwise,
return is 0 (false).
valueA and valueB ca n be rea l numbers, expressions, or lists.
TI Connect™ Program Editor Tip:
Notice the token is "_and_" where "_" is a space.
angle()
angle(value)
Returns the polar a ngle of a complex number or list of complex numbers.
»
NUM
1:abs(
»
CMPLX
5:abs(
y :
LOGIC
1:and
»
CMPLX
4:angle(
ANOVA()
ANOVA(list1,list2[,list3,...,list20])
Performs a one-way analysis of variance for compa ring the means
of two to 20 populations.
Ans
Ans
Returns the last answer.
20 Com mands and Functions Listing
…
TESTS
H:ANOVA(
y Z
Page 25

Archive
Archive variables
Moves the specified variable from RA M to the user data archive
memory.
Asm()
Asm(assemblyprgmname)
Executes a n assembly lang uag e program.
AsmComp()
AsmComp(prgmASM1, prgmASM2)
Compiles an assembly langua ge program written in ASCII and stores the
hex version.
Asm84CEPrgm
Asm84CEPrgm
Must be used a s the first line of a n assembly lang uag e program.
augment()
augment( matrixA ,matrixB )
Returns a matrix,which is matrixB appended to matrixA as new
columns.
y L
5:Archive
y
N
Asm(
y
N
AsmComp(
y N
Asm84CEPrgm
y >
MATH
7:augment(
augment()
augment(listA,listB)
Returns a list, which is listB concatena ted to the end of listA.
AUTO Answer
AUTO
Displays answers in a similar format a s the input.
AxesOff
AxesOff
y 9
OPS
9:augment(
z
Answers:
AUTO
† y
Commands and Functions Listing 21
Page 26

AxesOff
Turns off the g raph axes.
AxesOn
AxesOn[color#]
Turns on the g raph axes with color.The color option allows the color of the
axes to be specified.
Color#: 10 - 24 or color nam e pa sted from [vars] COLOR..
a+bi
a+bi
Sets the mode to rectang ular complex number format (a+bi).
B
BackgroundOff
BackgroundOff
Turns off background ima ge in the graph area.
BackgroundOn
BackgroundOn n
Displays a menu the Background Image Var n (Image#n) specified in
the graph a rea.
.
AxesOff
† y
.
AxesOn
† z
a+b i
† y <
BACKGROUND
2:BackgroundOff:
† y <
BACKGROUND
1:BackgroundOn
22 Com mands and Functions Listing
Page 27

bal(
bal(npmt[,roundvalue])
Computes the balance a t npmt for a n am ortization schedule using
stored values for PV, æ, and PMT and rounds the computation to
roundvalue.
binomcdf(
binomcdf(numtrials,p[,x])
Computes a cumulative probabilityat x for the discrete binomial
distribution with the specified numtrials and probabilityp of success on
each trial.
binompdf(
binompdf(numtrials,p[,x] )
Computes a probabilitya t x for the discrete binomial distribution with the
specified numtrials a nd probabilityp of success on e ach trial.
BorderColor
BorderColor[color#]
Turns on a border color s urrounding the graph area with the specified
color.Color#:1-4.
Œ
1:Finance
CALC
9:bal(
y =
DISTR
B:binomcdf(
y =
DISTR
A:binompdf(
† y
.
BorderColor
Boxplot
Boxplot Plot#(type,Xlist,[,freqlist,color#])
Defines Plot# (1, 2, or 3) of type
C
checkTmr(
checkTmr(starttime)
Returns the number of seconds since you used st art Tmr to start the
timer. The starttime is the value displayed by startTmr.
† y
,
TYPE
y N
checkTmr(
Commands and Functions Listing 23
Page 28

2
c
cdf(
2
c
cdf(lowerbound,upperbound,df)
Computes the c2distribution probability between lowerbound and
upperbound for the specified deg rees of freedom df.
2
c
pdf(
2
c
pdf(x,df)
Computes the probability density function (pdf) for the c2distribution a t
a specified x value for the specified degrees of freedom df.
c2LTest(
c2LTest(observedmatrix,expectedmatrix
[,drawflag,color#])
Performs a chi-square test. drawflag=1 draws results; drawflag=0
calculates results.
Color#: 10 - 24 or color nam e pa sted from [vars] COLOR.
2
c
GOF
2
c
GOF-Test(observedlist,expectedlist,df
[,drawflag,color#])
Performs a test to confirm that sam ple data is from a population that
conforms to a specified distribution.
Color#: 10 - 24 or color nam e pa sted from [vars] COLOR.
y =
DISTR
8: c2cdf(
y =
DISTR
7: c2pdf(
† …
TESTS
2
C: c
L Test
† …
TESTS
D: c2GOF L
Test(
(
Circle(
Circle( X,Y,radius[,color#,linestyle#])
Draws a circle with center (X,Y) and radius with specified
Color#: 10 - 24 or color nam e pa sted from [vars] COLOR.
linestyle#: 1-2.
24 Com mands and Functions Listing
y <
DRAW
9:Circle(
Page 29

CLASSIC
CLASSIC
Displays inputs and outputs on a single line, such a s 1/ 2+3/4.
Clear Entries
Clear Entries
Clears the contents of the Last Entrystorage area.
ClockOff
ClockOff
Turns off the clock display in the mode screen.
ClockOn
ClockOn
Turns on the clock display in the mode s creen.
ClrAllLists
ClrAllLists
Sets to 0 the dimension of all lists in memory.
z
CLASSIC
y L
MEMORY
3:Clear
Entries
y
N
ClockOff
y
N
ClockOn
y L
MEMORY
4:ClrAllLists
ClrDraw
ClrDraw
Clears all drawn elements from a g raph or drawing.
ClrHome
ClrHome
Clears the home screen.
y <
DRAW
1:ClrDraw
† ¼
I/O
8:ClrHome
Commands and Functions Listing 25
Page 30

ClrList
ClrListlistname1[,listname2, ...,listname n]
Sets the dimension of one or m ore listnames to 0.
ClrTable
ClrTable
Clears all values from the table.
conj(
conj(value)
Returns the complex conjugate of a complex number or list of com plex
numbers.
CoordOff
CoordOff
Turns off cursor coordinate value display.
CoordOn
CoordOn
Turns on cursor coordinate value display.
…
EDIT
4:ClrList
† ¼
I/O
9:ClrTable
»
CMPLX
1:conj(
† y
.
CoordOff
† y
.
CoordOn
cos(
cos(value)
Returns cosine of a rea l number, expression, or list.
L
1
cos
(
L
1
cos
(value)
Returns a rccosine of a real number, expression, or list.
cosh(
cosh(value)
26 Com mands and Functions Listing
™
y @
y
Page 31

cosh(
Returns hyperbolic cosine of a rea l number, expression, or list.
L
1
cosh
(
L
1
cosh
(value)
Returns hyperbolic a rccosine of a real number, expression, or list.
CubicReg
CubicReg [Xlistname,Ylistname,freqlist,regequ]
Fits a cubic reg ression model to Xlistname and Ylistname with
frequency freqlist, a nd stores the reg ression equa tion to regequ.
cumSum(
cumSum(list)
Returns a list of the cumulative sum s of the elements in list, s tarting with
the first element.
cumSum(
cumSum(matrix)
Returns a matrix of the cumulative sums of matrix e lements. Ea ch
element in the returned ma trix is a cumulative sum of a matrix column
from top to bottom.
N
cosh(
y
N
L
1
cosh
…
CALC
6:CubicReg
y 9
OPS
6:cumSum(
y >
MATH
0:cumSum(
(
Commands and Functions Listing 27
Page 32

D
dayOfWk(
dayOfWk(year,month,day)
Returns a n integer from 1 to 7, with e ach integer representing a day of
the week. Use dayOfWk( to determine on which day of the week a
particular date would occur.The year must be 4 digits; month and day
can be 1 or 2 digits.
dbd(
dbd(date1,date2)
Calculates the num ber of days between date1 and date2 using the
actual-day-count method.
DEC Answers
DEC
Displays answers as integers or decimal numbers.
4Dec
value4Dec
Displays a real or complex number, expression, list, or matrix in decimal
format.
y N
dayOfWk(
1:Sunday
2:Monday
3:Tuesday...
Œ
1:Finance
CALC
D:dbd(
z
Answers:
DEC
»
MATH
2: 4 Dec
Degree
Degree
Sets degree angle mode.
DelVar
DelVar variable
Deletes from memory the contents of variable.
DependAsk
DependAsk
Sets table to ask for dependent-variable values.
28 Com mands and Functions Listing
† z
Degree
† ¼
CTL
G:DelVar
† y -
Depend: Ask
Page 33

DependAuto
DependAuto
Sets table to generate dependent-variable values automatically.
det(
det(matrix)
Returns determinant of matrix.
DetectAsymOff
DetectAsymOff
Turns off checks for rational function asymptotes when graphing.
Impacts graph speed. Does not perform extra calculations to detect
asymptotes pixel to pixel while graphing. Pixels will connect a cross the
screen even a cross an asymptote.
DetectAsymOn
DetectAsymOn
Turns on checks for rational function asymptotes when graphing.
Impacts graph speed. Performs more calculations and will not connect
pixels across a n asymptote on a graph.
† y
-
Depend:
Auto
y
>
MATH
1:det(
† y .
DetectAsymOff
† y .
DetectAsymOn
DiagnosticOff
DiagnosticOff
Sets diagnostics-off mode; r, r2, a nd R2are not displayed as
regression model results.
y N
DiagnosticOff
Commands and Functions Listing 29
Page 34

DiagnosticOn
DiagnosticOn
Sets diagnostics-on m ode; r, r2, a nd R2are displayed a s regression
model results.
dim(
dim(listname)
Returns the dimension of listname.
dim(
dim(matrixname)
Returns the dimension of matrixname as a list.
dim(
length!dim(listname)
Assigns a new dimension (length) to a new or existing listname.
dim(
{rows,columns}!dim(matrixname)
Assigns new dimensions to a new or existing matrixname.
y N
DiagnosticOn
y 9
OPS
3:dim(
y
>
MATH
3:dim(
y 9
OPS
3:dim(
y >
MATH
3:dim(
Disp
Disp
Displays the home screen.
Disp
Disp [ valueA,valueB,valueC,...,value n]
Displays each value.
30 Com mands and Functions Listing
† ¼
I/O
3:Disp
† ¼
I/O
3:Disp
Page 35

DispGraph
DispGraph
Displays the graph.
DispTable
DispTable
Displays the table.
4DMS
value4DMS
Displays value in DMS format.
Dot-Thick
Dot-Thick
Sets dot plotting mode; rese ts all Y=editor g raph-style settings to DotThick.
Dot-Thin
Dot-Thin
Sets dot plotting mode; rese ts all Y=editor g raph-style settings to DotThin.
† ¼
I/O
4:DispGraph
† ¼
I/O
5:DispTable
y
;
ANGLE
4: 4 DMS
† z
Dot-Thick
† z
Dot-Thin
DrawF
DrawFexpression[,color#]
Draws expression (in terms of X ) on the graph with specified
Color#:10 - 24 or color name pasted from [vars] COLOR.
y <
DRAW
6:DrawF
Commands and Functions Listing 31
Page 36

DrawInv
DrawInvexpression[,color#]
Draws the inverse of expression by plotting X values on the y-axis and Y
values on the x-axis with specified
Color#: 10 - 24 or color nam e pa sted from [vars] COLOR.
DS<(
DS<(variable,value):commandA:commands
Decrements variable by 1; skips commandA if variable < value.
E
e
e
Returns decimal approximation of the constant e.
e^(
e^(power)
Returns e raised to power.
e^(
e^(list)
Returns a list of e raised to a listof powers.
y <
DRAW
8:DrawInv
† ¼
CTL
B:DS<(
y [e]
y J
y J
â
Exponent:
valueâexponent
Returns value times 10 to the exponent.
â
Exponent:
listâexponent
Returns list eleme nts times 10 to the exponent.
32 Com mands and Functions Listing
y D
y D
Page 37

â
Exponent:
matrixâexponent
Returns matrix elements times 10 to the exponent.
4Eff(
4Eff(nominal rate,
compounding periods)
Computes the effective interest rate.
Else
Else
See If:Then:Else
End
End
Identifies end of For(, If-Then-Else, R epeat, or While loop.
Eng
Eng
Sets engineering display mode.
y D
Π1:Finance
CALC
C: 4 Eff(
† ¼
CTL
7:End
† z
Eng
Equ4String(
Equ4String(Y= var,Strn)
Converts the contents of a Y= var to a string a nd stores it in St rn
eval(
eval(expression)
Returns a n evaluated expression as a string with 8 significant digits. The
expression must be real.
y
N
Equ 4 String
(
† ¼
I/O
C:eval(
Commands and Functions Listing 33
Page 38

eval(
eval(expression)
Returns a n evaluated expression as a string with 8 significant digits. The
expression must s implify to a real expression.
ExecLib
ExecLib
Extends TI-Basic (not a vailable)
expr(
expr(string)
Converts the character string contained in string to an expression and
executes the expression. string ca n be a string or a string variable.
ExpReg
ExpReg [Xlistname,Ylistname,freqlist,regequ]
Fits an exponential regression model to Xlistname a nd Ylistname with
frequency freqlist, a nd stores the reg ression equa tion to regequ.
ExprOff
ExprOff
Turns off the expression display during TRACE.
TI-Innovator™
Hub
† ¼
HUB
6:eval(
† ¼
CTL
K:ExecLib
† ¼
I/O
expr(
…
CALC
0:ExpReg
† y
.
ExprOff
ExprOn
ExprOn
Turns on the expression display during TRACE.
F
Ücdf(
Ücdf(lowerbound,upperbound,numerator
df,denominator df)
Computes the Û distribution probability between lowerbound and
upperbound for the specified numerator df (degrees of freedom)
and denominator df.
34 Com mands and Functions Listing
† y
.
ExprOn
y =
DISTR
0: Ü cdf(
Page 39

4 F 3 4 D
4 F 3 4 D
Converts an answer from a fraction to a decimal or from a decimal to a
fraction. Fraction and or decima l ma y be an approximation.
Fill(
Fill(value,matrixname)
Stores value to each elem ent in matrixname.
Fill(
Fill(value,listname)
Stores value to each elem ent in listname.
t ^
4: 4 F 3 4 D
or
»
NUM
B: 4 F 3 4 D
»
FRAC
3: 4 F 3 4 D
y
>
MATH
4:Fill(
y 9
OPS
4:Fill(
Fix
Fix #
Sets fixed-decimal mode for # of decimal places .
† z
0123456789
(select one)
Commands and Functions Listing 35
Page 40

Float
Float
Sets floating decima l mode.
fMax(
fMax(expression,variable,lower,upper[,tolerance])
Returns the value of variable where the local m aximum of expression
occurs, between lower a nd upper,with specified tolerance.
fMin(
fMin(expression,variable,lower,upper[,tolerance] )
Returns the value of variable where the local m inimum of expression
occurs, between lower a nd upper, with specified tolerance.
fnInt(
fnInt(expression,variable,lower,upper[,tolerance])
Returns the function integral of expression with respect to variable,
between lower and upper, with specified tolerance.
FnOff
FnOff [function#,function#,...,function n]
Deselects all Y= functions or specified Y= functions.
† z
Float
»
MATH
7:fMax(
»
MATH
6:fMin(
»
MATH
9:fnInt(
½
Y-VARS
4:On/Off
2:FnOff
FnOn
FnOn [function#,function#,...,function n]
Selects all Y= functions or specified Y= functions.
For(
:For(variable,begin,end
[,increment]):commands:End:commands
36 Com mands and Functions Listing
½
Y-VARS
4:On/Off
1:FnOn
† ¼
CTL
4:For(
Page 41

For(
Executes commands through End,incrementing variable from begin
by increment until variable>end.
fPart(
fPart(value)
Returns the fractional pa rt or parts of a real or complex num ber,
expression, list, or matrix.
Üpdf(
Üpdf(x,numerator df,denominator df)
Computes the Û distribution probability between lowerbound and
upperbound for the specified numerator df (degrees of freedom)
and denominator df.
4Frac
value4Frac
Displays a real or complex number, expression, list, or matrix as a fraction
simplified to its simplest terms.
Full
Full
Sets full screen mode.
»
NUM
4:fPart(
y =
DISTR
9: Ü pdf(
»
MATH
1: 4 Frac
† z
Full
Func
Func
Sets function graphing mode.
G
GarbageCollect
GarbageCollect
Displays the garbage collection m enu to allow clea nup of unused
archive m emory.
† z
Func
y N
GarbageCollect
Commands and Functions Listing 37
Page 42

gcd(
gcd(valueA,valueB)
Returns the greatest common divisor of valueA and valueB, which can
be real numbers or lists.
geometcdf(
geometcdf(p,x)
Computes a cumulative probabilityat x, the number of the trial on which
the first s uccess occurs, for the discrete ge ometric distribution with the
specified probability of success p.
geometpdf(
geometpdf(p,x)
Computes a probabilitya t x, the number of the trial on which the first
success occurs, for the discrete geometric distribution with the specified
probability of success p.
Get(
Get(variable)
Retrieves a value from a connected TI-Innovator™ Hub a nd stores the
data to a variable on the receiving CE calculator.
Note: See also Send( and eval(
»
NUM
9:gcd(
y =
DISTR
F:geometcdf(
y =
DISTR
E:geometpdf(
† ¼
I/O
A:Get(
Get(
Get(variable
Retrieves a value from a connected TI-Innovator™ Hub a nd stores the data
to a variable on the receiving CE calculator.
Note: See also Send( and eval(
GetCalc(
GetCalc( variable[,portflag])
Gets contents of variable on a nother T I-84 Plus CE and stores it to
variable on the receiving TI-84 Plus CE. By default, the TI-84 Plus CE
uses the USB port if it is connected. If the USB cable is not connected, it
uses the I/O port.
portflag=0 use USB port if connected;
portflag=1 use USB port;
portflag=2 use I/O port.(Ignored when program runs on the TI-84 Plus
38 Com mands and Functions Listing
Ti-Innovator™
Hub
† ¼
HUB
5:Get
† ¼
I/O
0:GetCalc(
Page 43

GetCalc(
CE.)
getDate
getDate
Returns a list giving the date according to the current value of the clock.
The list is in {year,mon th,day} format.
getDtFmt
getDtFmt
Returns a n integer representing the date format that is currently set on the
device.
1 = M/D/Y
2 = D/ M/Y
3 = Y/M/D
getDtStr(
getDtStr(integer)
Returns a string of the current date in the format specified by integer,
where:
1 = M/D/Y
2 = D/ M/Y
3 = Y/M/D
y N
getDate
y
N
getDtFmt
y
N
getDtStr(
Commands and Functions Listing 39
Page 44

getTime
getTime
Returns a list giving the time according to the current value of the clock.
The list is in {hour,minute,second} format. T he time is returned in the
24 hour format.
getTmFmt
getTmFmt
Returns a n integer representing the clock time format that is currently set
on the device.
12 = 12 hour format
24 = 24 hour format
getTmStr(
getTmStr(integer)
Returns a string of the current clock time in the format specified by
integer, where:
12 = 12 hour format
24 = 24 hour format
getKey
getKey
Returns the key code for the current keystroke, or 0, if no key is pressed.
y N
getTime
y
N
getTmFmt
y
N
getTmStr(
† ¼
I/O
7:getKey
Goto
Gotolabel
Transfers control to label.
40 Com mands and Functions Listing
† ¼
CTL
0:Goto
Page 45

GraphColor(
GraphColor(function#,color#)
Sets the color for function# .
Color#: 10 - 24 or color nam e pa sted from [vars] COLOR.
GraphStyle(
GraphStyle(function#,graphstyle#)
Sets a graphstyle for function#.
GridDot
GridDot [color#]
Turns on grid dots in the g raph area in the specified color.
Color#: 10 - 24 or color nam e pa sted from [vars] COLOR.
GridLine
GridLine [color#]
Turns on grid lines in the g raph area in the specified color.
Color#: 10 - 24 or color nam e pa sted from [vars] COLOR.
† ¼
CTL
H:GraphColor(
† ¼
CTL
H:GraphStyle(
† y
.
GridDot
† y
.
GridLine
GridOff
GridOff
Turns off g rid forma t.
G-T
G-T
Sets graph-table vertical split-screen mode.
H
Histogram
Histogram Plot#(type,Xlist,[,freqlist,color#])
Used as the "type" argument in the command
† y .
GridOff
† z
GRAPH-
TABLE
† y
,
Commands and Functions Listing 41
Page 46

Histogram
Where # gives Plot1, Plot2 or Plot3.
Horiz
Horiz
Sets horizontal split-screen mode.
Horizontal
Horizontal y[,color#,linestyle#]
Draws a horizontal line a t y in a specified
Color#: 10 - 24 or color nam e pa sted from [vars] COLOR.
line s tyle#: 1-4.
I
i
i
Returns the complex number i.
identity(
identity(dimension)
Returns the identitym atrix of dimension rows x dimension columns.
TYPE
† z
Horiz
y <
DRAW
3:Horizontal
y V
y >
MATH
5:identity(
If
If condition:commandA:commands
If condition=0 (false), skips commandA.
If
Then
End
If:conditionThen:commandsEnd:commands
Executes commands from Then to End if condition=1 (true).
42 Com mands and Functions Listing
† ¼
CTL
1:If
† ¼
CTL
2:Then
Page 47

If
Then
Else
End
If:
conditionThen:commandsElse:commandsEnd:commands
Executes commands from Then to Else if condition=1 (true); from
Else to End if condition = 0 (false).
imag(
imag(value)
Returns the imaginary (non-real) part of a complex num ber or list of
complex numbers.
inBinom(
inBinom(area,trial,p)
The inverse binomial cum ulative distribution function results in the
minimum number of successes, such that the cumulative probabilityfor
that minimum num ber of successes ≥ the given cumulative probability
(area). If more information is needed, also find the binomcdf for the
result from invBinom(as shown below for a full analysis.
Details:
Assume the toss of a fair coin 30 times. W hat is the minimum number
of heads you m ust observe such that the cumulative probability for that
number of observed hea ds is a t least 0.95?
The results on the screen first show that the minimum number of
successes to obtain at least the g iven cumulative probability of 0.95 is
19. Next, the cumulative probability for up to 19 is computed using
binomcdf(and is approximately 0.9506314271 which meets the criteria
of 0.9506314271≥0.95
† ¼
CTL
3:Else
»
CMPLX
3:imag(
y=
DISTR
C:invBinom(
Alternate Method:
Set Y1=binomcdf(30,0.5,X) and use the table of values (starting at 0 a nd
increment by 1) to find when the cum ulative probabilityis at or just
above the given cum ulative probability. This gives you a view of all
values to ma ke decisions. For this example, search in the table to find
the cumulative probabilityjust la rger than 0.95. Again, the number of
Commands and Functions Listing 43
Page 48

inBinom(
successes is 19.
IndpntAsk
IndpntAsk
Sets table to ask for independent-variable values.
† y
-
Indpnt:
Ask
IndpntAuto
IndpntAuto
Sets table to generate independent-variable values automa tically.
Input
Input
Displays graph.
44 Com mands and Functions Listing
† y
-
Indpnt:
Auto
† ¼
I/O
2:Input
Page 49

Input
Input [variable]
Input ["text",variable]
Prompts for value to store to variable.
Input
Input [Strn,variable]
Displays Strn and stores entered value to variable.
inString(
inString(string,substring[,start])
Returns the character position in string of the first character of substring
beginning a t start.
int(
int(value)
Returns the largest integer a real or com plex number, expression, list, or
matrix.
GInt(
GInt(pmt1,pmt2[,roundvalue])
Computes the sum, rounded to roundvalue, of the interest amount
between pmt1 and pmt2 for a n am ortization schedule.
† ¼
I/O
2:Input
† ¼
I/O
2:Input
y
N
inString(
»
NUM
5:int(
Œ
1:Finance
CALC
A: G Int(
invNorm(
invNorm(area[,µ,σ,tail])
tail [catalog]: LEFT, CEN TER, RIGHT
Computes the inverse cumulative normal distribution function for a
given area under the normal distribution curve specified by m and s..
The optional argument tail can be LEFT (-∞,-a), CENTER [-a,a] or RIGHT
(a, ∞) for Real a.
The tokens LEFT, CENTER a nd RIGHT can be found in [catalog].
y=
DISTR
3:invNorm(
Commands and Functions Listing 45
Page 50

LEFT
LEFT
LEFT is a tail argument for the invNorm( command where the optional
argume nt tail can be LEFT (-∞,-a), CENTER [-a ,a] or RIGHT (a, ∞) for
Real a.
See also invNorm(.
RIGHT
RIGHT
RIGHT is a tail argument for the invNorm( command where the optional
argume nt tail can be LEFT (-∞,-a), CENTER [-a ,a] or RIGHT (a, ∞) for
Real a.
See also invNorm(.
CENTER
CENTER
CENTER is a tail a rgument for the invNorm( command where the
optional a rgument tail ca n be LEFT (-∞,-a), CENTER [-a ,a] or RIGHT (a,
∞) for Rea l a.
See also invNorm(.
LEFT RIGHT CENTER
y N
LEFT
y N
RIGHT
y N
CENTER
46 Com mands and Functions Listing
Page 51

invT(
invT(area,df)
Computes the inverse cumulative student-t probability function specified
by degree of freedom, df for a g iven area under the curve.
iPart(
iPart(value)
Returns the integer part of a real or complex number, expression, list, or
matrix.
irr(
irr(CF0,CFList[,CFFreq])
Returns the interest rate at which the net present value of the cash flow is
equal to zero.
isClockOn
isClockOn
Identifies if clock is ON or OFF. Returns 1 if the clock is ON. Returns 0 if the
clock is OFF.
IS>(
:IS>(variable,value)
:commandA
:commands
Increments variable by 1; skips commandA if variable>va lue.
y =
DISTR
4:invT(
»
NUM
3:iPart(
Œ
1:Finance
CALC
8:irr(
y
N
isClockOn
† ¼
CTL
A:IS>(
L
Ù
Ùlistname
Identifies the next one to five characters as a user-created list name.
LabelOff
LabelOff
y 9
OPS
B: Ù
† y .
Commands and Functions Listing 47
Page 52

LabelOff
Turns off axes labels.
LabelOn
LabelOn
Turns on axes labels.
Lbl
Lbl label
Creates a label of one or two characters.
lcm(
lcm(valueA,valueB)
Returns the least comm on multiple of valueA and valueB, which can
be real numbers or lists.
length(
length(string)
Returns the number of characters in string.
LabelOff
† y .
LabelOn
† ¼
CTL
9:Lbl
»
NUM
8:lcm(
y
N
length(
Line(
Line(X1,Y1,X2,Y2[,erase#,color#,linestyle#])
Draws a line from (X1,Y1) to (X2,Y2) with the following options:
erase#: 1,0, color#:10-24, a nd line style#:1-4.
Line(
Line(X1,Y1,X2,Y2,0[,line#])
Erases a line (erase#: 1,0) from (X1,Y1) to (X2,Y2).
48 Com mands and Functions Listing
y <
DRAW
2:Line(
y <
DRAW
2:Line(
Page 53

LinReg(a+bx)
LinReg(a+bx) [Xlistname,Ylistname,freqlist,regequ]
Fits a linear regression m odel to Xlistname and Ylistname with
frequency freqlist, a nd stores the reg ression equa tion to regequ.
LinReg(ax+b)
LinReg(ax+b) [Xlistname,Ylistname,freqlist,regequ]
Fits a linear regression m odel to Xlistname and Ylistname with
frequency freqlist, a nd stores the reg ression equa tion to regequ.
LinRegTInt
LinRegTInt [Xlistname,Ylistname,freqlist,confidence
level, regequ]
Performs a linear reg ression and computes the t confidence interval for
the slope coefficient b.
LinRegTTest
LinRegTTest
[Xlistname,Ylistname,freqlist,alternative,regequ]
Performs a linear reg ression and a t-test. alternative=L1 is <;
alternative=0 is ; alternative=1 is >.
…
CALC
8:LinReg
(a+bx)
…
CALC
4:LinReg
(ax+b)
† …
TESTS
G:LinRegTInt
† …
TESTS
F:LinRegTTest
@List(
@List(list)
Returns a list containing the differences between consecutive elements in
list.
List4matr(
List4matr(listname1,...,listname n,matrixname)
Fills matrixname column by column with the elem ents from each
specified listname.
Commands and Functions Listing 49
y 9
OPS
7: @ List(
y 9
OPS
0:List 4 matr
(
Page 54

ln(
ln(value)
Returns the natural logarithm of a real or complex number, expression,
or list.
LnReg
LnReg [Xlistname,Ylistname,freqlist,regequ]
Fits a logarithmic regression m odel to Xlistname a nd Ylistname with
frequency freqlist, a nd stores the reg ression equa tion to regequ.
log(
log(value)
Returns logarithm of a real or complex number, expression, or list.
logBASE(
logBASE(value, base)
Returns the logarithm of a specifed value determined from a specified
base: logBASE(value, ba se).
Logistic
Logistic [Xlistname,Ylistname,freqlist,regequ]
Fits a logistic regression m odel to Xlistname and Ylistname with
frequency freqlist, a nd stores the reg ression equa tion to regequ.
µ
…
CALC
9:LnReg
«
»
A: logBASE
CALC
B:Logistic
50 Com mands and Functions Listing
Page 55

M
Manual-Fit
Manual-Fit[equname,color#,line style#]
Fits a linear equation to a s catter plot with specified color and line style.
Color#: 10 - 24 or color nam e pa sted from [vars] COLOR.
line s tyle#:1-4.
MATHPRINT
MATHPRINT
Displays most entries and answers the way they are displayed in
textbooks,such as .
Matr4list(
Matr4list(matrix,listnameA,...,listname n)
Fills ea ch listname with elem ents from each column in matrix.
Matr4list(
Matr4list(matrix,column#,listname)
Fills a listname with eleme nts from a specified column# in matrix.
…
CALC
D:Manual-
Fit
z
MATHPRINT
y 9
OPS
A:Matr 4
list(
y 9
OPS
A:Matr 4 list
(
max(
max(valueA,valueB)
Returns the larger of valueA a nd valueB.
max(
max(list)
Returns the larger of valueA a nd valueB.
»
NUM
7:max(
»
NUM
7:max(
Commands and Functions Listing 51
Page 56

max(
max(list)
Returns largest real or complex element in list.
max(
max(listA,listB)
Returns a real or complex list of the larger of ea ch pair of elem ents in
listA and listB.
max(
max(value,list)
Returns a real or complex list of the larger of value or each list elem ent.
mean(
mean(list[,freqlist])
Returns the mean of list with frequency freqlist.
median(
median(list[,freqlist] )
Returns the median of list with frequency freqlist.
y 9
MATH
2:max(
y 9
MATH
2:max(
y 9
MATH
2:max(
y 9
MATH
3:mean(
y 9
MATH
4:median(
Med-Med
Med-Med [Xlistname,Ylistname,freqlist,regequ]
Fits a median-m edian m odel to Xlistname a nd Ylistname with
frequency freqlist, a nd stores the reg ression equa tion to regequ.
Menu(
Menu("title","text1",label1[,...,"text7",label7])
Generates a menu of up to seven items during program execution.
min(
min(valueA,valueB)
52 Com mands and Functions Listing
…
CALC
3:Med-Med
† ¼
CTL
C:Menu(
»
Page 57

min(
Returns smaller of valueA and valueB.
min(
min(list)
Returns smallest rea l or complex eleme nt in list.
min(
min(listA,listB)
Returns real or complex list of the sma ller of each pa ir of elements in
listA and listB.
min(
min(value,list)
Returns a real or complex list of the smaller of value or ea ch list element.
ModBoxplot
ModBoxplot Plot#(type,Xlist,[,freqlist,color#])
Used as the "type" argument in the command.
Where # gives Plot1, Plot2 or Plot3.
NUM
6:min(
y 9
MATH
1:min(
y 9
MATH
1:min(
y 9
MATH
1:min(
† y
,
TYPE
N
nCr
valueA nCr valueB
Returns the number of combinations of valueA taken valueB at a time.
»
PRB
3:nCr
Commands and Functions Listing 53
Page 58

nCr
value nCr list
Returns a list of the combinations of value taken each e lement in list at
a time.
nCr
list nCr value
Returns a list of the combinations of each element in list taken value at
a time.
nCr
listA nCr listB
Returns a list of the combinations of each element in listA taken each
element in listB at a time.
n/d
n/d
Displays results as a simple fraction.
»
PRB
3:nCr
»
PRB
3:nCr
»
PRB
3:nCr
t ^
1: n/d
or
»
NUM
D: n/d
or
54 Com mands and Functions Listing
»
FRAC
1:n/d
Page 59

nDeriv(
nDeriv(expression,variable,value[,H])
When command is used in Classic mode, returns approximate numerical
derivative of expression with respect to variable at value, with
specific tolerance H.
In MathPrint mode, numeric derivative template pas tes and uses default
tolerance H.
4 n/d 3 4 Un/d
4 n/d 3 4 Un/d
Converts the results from a fraction to mixed number or from a mixed
number to a fraction, if applicable.
»
MATH
8:nDeriv(
t ^
3: 4 n/d 3 4
Un/d
or
»
NUM
A: 4 n/d3 4
Un/d
or
»
FRAC
4: 4 n/d 3
4Un/d
4Nom(
4Nom(effective rate,
compounding periods)
Computes the nominal interest rate.
Normal
Normal
Sets normal display mode.
Π1:Finance
CALC
B: 4 Nom(
† z
Normal
Commands and Functions Listing 55
Page 60

normalcdf(
normalcdf(lowerbound,upperbound[,m,s])
Computes the normal distribution probabilitybetween lowerbound and
upperbound for the specified m a nd s.
normalpdf(
normalpdf(x[,m,s])
Computes the probability density function for the normal distribution at a
specified x value for the specified m and s.
NormProbPlot
NormProbPlot Plot#(type,Xlist,[,freqlist,color#])
Used as the "type" argument in the command
Where # gives Plot1, Plot2 or Plot3.
not(
not(value)
Returns 0 if value is 0. value ca n be a real number, expression, or list.
nPr
valueA nPr valueB
Returns the number of permutations of va lueA taken valueB at a time.
y =
DISTR
2:normalcdf(
y =
DISTR
1:normalpdf(
† y
,
TYPE
y :
LOGIC
4:not(
»
PRB
2:nPr
nPr
value nPr list
Returns a list of the permutations of value taken each element in list at
a time.
nPr
list nPr value
Returns a list of the permutations of each element in list taken value at
a time.
56 Com mands and Functions Listing
»
PRB
2:nPr
»
PRB
2:nPr
Page 61

nPr
listA nPr listB
Returns a list of the permutations of each element in listA taken each
element in listB at a time.
npv(
npv(interest rate,CF0,CFList[,CFFreq])
Computes the sum of the present values for cas h inflows and outflows.
O
OpenLib(
OpenLib(
Extends TI-Basic. (Not available.)
or
valueA or valueB
Returns 1 if valueA or valueB is 0. valueA a nd valueB can be real
numbers, expressions, or lists.
»
PRB
2:nPr
Œ
1:Finance
CALC
7:npv(
† ¼
CTL
J:OpenLib
(
y :
LOGIC
2:or
Output(
Output(row,column,"text")
Displays text beg inning at specified row and column of the home
screen.
Output(
Output(row,column,value)
Displays value beg inning at specified row and column of the home
screen.
P
Param
Param
† ¼
I/O
6:Output(
† ¼
I/O
6:Output(
† z
Par
Commands and Functions Listing 57
Page 62

Param
Sets parametric graphing mode.
Pause
Pause
Suspends program execution until you press Í.
Pause
Pause [value]
Displays value; s uspends program execution until you press Í.
Pause
Pause [value, time]
Displays value on the current home s creen and execution of the
program continues after the time period specified. For time only,use
Pause “”,time where the value is a blank string. Time is in seconds.
Pausevalue,time.
piecewise
piecewise(
New piecewise function to support entry of functions a s they are seen in
textbook.This command can be found in » MATH B:piecewise(
† ¼
CTL
8:Pause
† ¼
CTL
8:Pause
† ¼
CTL
8:Pause
».
} or † to
scroll to
B:piecewise
(
Plot1( Plot2( Plot3(
Plot#(type,Xlist,Ylist[,mark,color#])
Defines Plot# (1, 2, or 3) of type Scatter or xyLine for Xlist and Ylist using
mark and color.
Color#: 10 - 24 or color nam e pa sted from [vars] COLOR.
Note: Xlist and Ylist represent the Xlist and Ylist nam es.
Plot1( Plot2( Plot3(
Plot#(type,Xlist,[,freqlist,color#])
58 Com mands and Functions Listing
† y
,
STAT PLOTS
1:Plot1
2:Plot2
3:Plot3
† y
Page 63

Plot1( Plot2( Plot3(
Defines Plot# (1, 2, or 3) of type Histogram or Boxplot for Xlist with
frequency freqlist and color#.
Color#: 10 - 24 or color nam e pa sted from [vars] COLOR.
Note: Xlist represents the Xlist name.
Plot1( Plot2( Plot3(
Plot#(type,Xlist,[,freqlist,mark,color#])
Defines Plot# (1, 2, or 3) of type ModBoxplot for Xlist with frequency
freqlist using mark and color #.
Color#: 10 - 24 or color nam e pa sted from [vars] COLOR.
Note: Xlist represents the Xlist name.
Plot1( Plot2( Plot3(
Plot#(type,datalist,[,data axis,mark,color#])
Defines Plot# (1, 2, or 3) of type NormProbPlot for datalist on data
axis using mark and color # data axis can be X or Y.
Color#: 10 - 24 or color nam e pa sted from [vars] COLOR.
Note: datalist represents the datalist na me.
PlotsOff
PlotsOff [ 1,2,3]
Deselects all stat plots or one or more specified stat plots (1, 2, or 3).
,
STAT PLOTS
1:Plot1
2:Plot2
3:Plot3
† y
,
STAT PLOTS
1:Plot1
2:Plot2
3:Plot3
† y
,
STAT PLOTS
1:Plot1
2:Plot2
3:Plot3
y
,
STAT
PLOTS
4:PlotsOff
PlotsOn
PlotsOn [1,2,3]
Selects all stat plots or one or more specified stat plots (1, 2, or 3).
Pmt_Bgn
Pmt_Bgn
Specifies an annuity due, where payments occur at the beginning of e ach
y
,
STAT
PLOTS
5:PlotsOn
Œ
1:Finance
Commands and Functions Listing 59
Page 64

Pmt_Bgn
payment period.
Pmt_End
Pmt_End
Specifies an ordinary a nnuity,where payments occur a t the end of each
payment period.
poissoncdf(
poissoncdf(m,x)
Computes a cumulative probabilityat x for the discrete Poisson distribution
with specified mea n m.
poissonpdf(
poissonpdf(m,x)
Computes a probabilitya t x for the discrete Poisson distribution with the
specified mean m.
CALC
F:Pmt_Bgn
Œ
1:Finance
CALC
E:Pmt_End
y =
DISTR
D:poissoncdf
(
y =
DISTR
C:poissonpdf
(
Polar
Polar
Sets polar graphing mode.
4Polar
complex value 4Polar
Displays complex value in polar format.
PolarGC
PolarGC
Sets polar graphing coordinates format.
60 Com mands and Functions Listing
† z
Polar
»
CMPLX
7: 4 Polar
† y
.
PolarGC
Page 65

prgm
prgmname
Executes the program name.
GPrn(
GPrn(pmt1,pmt2[,roundvalue])
Computes the sum, rounded to roundvalue, of the principal amount
between pmt1 and pmt2 for a n am ortization schedule.
prod(
prod(list[ ,start,end])
Returns product of list elements between start and end
Prompt
Prompt variableA[,variableB,...,variable n]
Prompts for value for variableA, then variableB, and so on.
1-PropZInt(
1-PropZInt(x,n[,confidence level])
Computes a one-proportion z confidence interval.
† ¼
CTRL
D:prgm
Œ
1:Finance
CALC
0: G Prn(
y 9
MATH
6:prod(
† ¼
I/O
2:Prompt
† …
TESTS
A:1-PropZInt(
2-PropZInt(
2-PropZInt(x1,n1,x2,n2[,confidence level])
Computes a two-proportion z confidence interval.
1-PropZTest(
1-PropZTest(p0,x,n[,alternative,drawflag, color#])
Computes a one-proportion z test. alternative=L1 is <; alternative=0 is
; alternative=1 is >. drawflag= 1 draws results; drawflag=0
calculates results.
Color#: 10 - 24 or color nam e pa sted from [vars] COLOR.
Commands and Functions Listing 61
† …
TESTS
B:2-PropZInt(
† …
TESTS
5:1-PropZTest
(
Page 66

2-PropZTest(
2-PropZTest(x1,n1,x2,n2[,alternative,drawflag, color#])
Computes a two-proportion z test. alternative=L1 is <; alternative=0 is
; alternative=1 is >. drawflag= 1 draws results; drawflag=0
calculates results.
Color#: 10 - 24 or color nam e pa sted from [vars] COLOR.
Pt-Change(
Pt-Change(x,y[ ,color#])
Togg les a point on or off at (x,y) on the g raph area . Off will be in the
Background color and On will be the specified
Color#: 10 - 24 or color nam e pa sted from [vars] COLOR.
Pt-Off(
Pt-Off(x,y[,mark] )
Erases a point at (x,y) on the graph area using mark. The Off s tate may
be the background color determined by the ImageVar or color setting.
Color#: 10 - 24 or color nam e pa sted from [vars] COLOR.
Pt-On(
Pt-On(x,y[,mark,color#])
Draws a point a t (x,y) on the g raph area using mark and the specified
color#.
Color#: 10 - 24 or color nam e pa sted from [vars] COLOR.
† …
TESTS
6:2-PropZTest
(
y <
POINTS
3:Pt-Change(
y <
POINTS
2:Pt-Off(
y <
POINTS
1:Pt-On(
PwrReg
PwrReg [Xlistname,Ylistname,freqlist,regequ]
Fits a power regression m odel to Xlistname a nd Ylistname with
frequency freqlist, a nd stores the reg ression equa tion to regequ.
62 Com mands and Functions Listing
…
CALC
A:PwrReg
Page 67

Pxl-Change(
Pxl-Change(row,column[,color#])
Togg les Off to On in the g raph area: with specified color#
Togg les On to Off in the g raph area: Off will display the set Background
Image Var or Color.
Color#: 10 - 24 or color nam e pa sted from [vars] COLOR.
Pxl-Off(
Pxl-Off(row,column)
The Off state will display the set Background Image Var or COLOR.
Pxl-On(
Pxl-On(row,column[,color#])
Draws pixel on the g raph area at (row,column) in the specified color.
Color#: 10 - 24 or color nam e pa sted from [vars] COLOR.
pxl-Test(
pxl-Test(row,column)
Returns 1 if pixel (row, column) is on, 0 if it is off;
y <
POINTS
6:Pxl-Change
(
y <
POINTS
5:Pxl-Off(
y <
POINTS
4:Pxl-On(
y <
POINTS
7:pxl-Test(
P4Rx(
P4Rx(r,q)
Returns X , given polar coordinates r and q or a list of polar coordinates.
P4Ry(
P4Ry(r,q)
Returns Y, given polar coordinates r and q or a list of polar coordinates.
y ;
ANGLE
7:P 4 Rx(
y ;
ANGLE
8:P 4 Ry(
Commands and Functions Listing 63
Page 68

Q
QuadReg
QuadReg [Xlistname,Ylistname,freqlist,regequ]
Fits a quadratic regression m odel to Xlistname a nd Ylistname with
frequency freqlist, a nd stores the reg ression equa tion to regequ.
QuartReg
QuartReg [Xlistname,Ylistname,freqlist,regequ]
Fits a quartic reg ression model to Xlistname and Ylistname with
frequency freqlist, a nd stores the reg ression equa tion to regequ.
R
Radian
Radian
Sets radian ang le mode.
rand
rand[(numtrials) ]
Returns a random number between 0 and 1 for a specified number of
trials numtrials.
…
CALC
5:QuadReg
…
CALC
7:QuartReg
† z
Radian
»
PRB
1:rand
randBin(
randBin(numtrials,prob[,numsimulations])
Generates a nd displays a random real number from a specified Binomial
distribution.
64 Com mands and Functions Listing
»
PRB
7:randBin(
Page 69

randInt(
randInt( lower,upper [,numtrials])
Generates a nd displays a random integer within a range specified by
lower and upper integer bounds for a specified number of trials
numtrials.
randIntNoRep(
randIntNoRep(lowerint,upperint [,numelements])
Returns a random ordered list of intege rs from a lower integer to an
upper integ er which may include the lower integ er and upper integer.
If the optional argument numelements is specified, the first
numelements a re listed. T he first numelements term in the list of
random integers are displayed.
randM(
randM(rows,columns)
Returns a random m atrix of rows× columns.
Max rows x columns = 400 m atrix elements.
randNorm(
randNorm(m,s[,numtrials])
Generates a nd displays a random real number from a specified Normal
distribution s pecified by m and s for a specified num ber of trials
numtrials.
»
PRB
5:randInt(
»
PRB
8:randIntNoRep(
y
>
MATH
6:randM(
»
PRB
6:randNorm(
re^qi
re^qi
Sets the mode to polar complex number mode (re^qi).
Real
Real
Sets mode to display complex results only when you enter complex
numbers.
† z
r e ^ q i
† z
Real
Commands and Functions Listing 65
Page 70

real(
real(value)
Returns the real part of a complex number or list of complex numbers.
RecallGDB
RecallGDB n
Restores all settings stored in the graph databa se variable GDBn.
RecallPic
RecallPic n
Displays the graph and a dds the picture stored in Picn.
4Rect
complex value 4Rect
Displays complex value or list in rectangular format.
RectGC
RectGC
Sets rectangular graphing coordinates format.
»
CPLX
2:real(
y <
STO
4:RecallGDB
y <
STO
2:RecallPic
»
CMPLX
6: 4 Rect
† y
.
RectGC
ref(
ref(matrix)
Returns the row-echelon form of a matrix.
remainder(
remainder(dividend, divisor)
Reports the rem ainder as a whole number from a division of two whole
numbers where the divisor is not zero.
66 Com mands and Functions Listing
y
>
MATH
A:ref(
»
NUM
0:remainder(
Page 71

remainder(
remainder(list, divisor)
Reports the rem ainder as a whole number from a division of two lists
where the divisor is not zero.
remainder(
remainder(dividend, list)
Reports the rem ainder as a whole number from a division of two whole
numbers where the divisor is a list.
remainder(
remainder(list, list)
Reports the rem ainder as a whole number from a division of two lists.
Repeat
Repeatcondition:commands:End:commands
Executes commands until condition is true.
Return
Return
Returns to the ca lling program.
»
NUM
0:remainder(
»
NUM
0:remainder(
»
NUM
0:remainder
(
† ¼
CTL
6:Repeat
† ¼
CTL
E:Return
round(
round(value[,#decimals])
Returns a number, expression, list, or matrix rounded to #decimals ( 9).
ärow(
ärow(value,matrix,row)
Returns a matrix with row of matrix multiplied by value and stored in
row.
»
NUM
2:round(
y >
MATH
E: ä row(
Commands and Functions Listing 67
Page 72

row+(
row+(matrix,rowA,rowB)
Returns a matrix with rowA of matrix added to rowB a nd stored in
rowB.
ärow+(
ärow+(value,matrix,rowA,rowB)
Returns a matrix with rowA of matrix multiplied by value, added to
rowB, and stored in rowB.
rowSwap(
rowSwap(matrix,rowA,rowB)
Returns a matrix with rowA of matrix swa pped with rowB.
rref(
rref(matrix)
Returns the reduced row-echelon form of a matrix.
R4Pr(
R4Pr(x,y)
Returns R, g iven rectangular coordinates x and y or a list of rectangular
coordinates.
y >
MATH
D:row+(
y >
MATH
F: ä row+(
y >
MATH
C:rowSwap(
y >
MATH
B:rref(
y ;
ANGLE
5:R 4 Pr(
R4Pq(
R4Pq(x,y)
Returns q, given rectangular coordinates x and y or a list of rectangular
coordinates.
68 Com mands and Functions Listing
y ;
ANGLE
6:R 4 P q (
Page 73

S
2-SampÜTest
2-SampÜTest
[
listname1
,
listname2
,freqlist1,freqlist2,alternative,drawflag,color#]
Performs a two-sample Ûtest. alternative=L1 is <; alternative=0
is ; alternative=1 is >. drawflag=1 draws results; drawflag=0
calculates results.
Color#: 10 - 24 or color nam e pa sted from [vars] COLOR.
2-SampÜTest
2-SampÜTestSx1,n1,Sx2,n2
[,alternative,drawflag,color#]
Performs a two-sample Ûtest. alternative=L1 is <; alternative=0
is ; alternative=1 is >. drawflag=1 draws results; drawflag=0
calculates results.
Color#: 10 - 24 or color nam e pa sted from [vars] COLOR.
2-SampTInt
2-SampTInt
[listname1,listname2,freqlist1,freqlist2,confidence
level,pooled]
(Data list input)
Computes a two-sample t confidence interval. pooled=1 pools
variances; pooled=0 does not pool variances.
† …
TESTS
E:2-Samp Ü Test
† …
TESTS
E:2-Samp Ü Test
† …
TESTS
0:2-SampTInt
2-SampTInt
2-SampTIntv1,Sx1,n1,v2,Sx2,n2[,confidence
level,pooled]
(Summary stats input)
Computes a two-sample t confidence interval. pooled=1 pools
variances; pooled=0 does not pool variances.
† …
TESTS
0:2-SampTInt
Commands and Functions Listing 69
Page 74

2-SampTTest
2-SampTTest
[
listname1
,
listname2
,
freqlist1
,freqlist2,alternative,pooled,drawflag,color#])
Computes a two-sample t test. alternative=L1 is <; alternative=0
is ; alternative=1 is >. pooled=1 pools variances; pooled=0 does
not pool variances. drawflag=1 draws results; drawflag=0
calculates results.
Color#: 10 - 24 or color nam e pa sted from [vars] COLOR.
2-SampTTest
2-SampTTestv1,Sx1,n1,v2,Sx2,n2
[,alternative,pooled,drawflag,color#])
Computes a two-sample t test. alternative=L1 is <; alternative=0
is ; alternative=1 is >. pooled=1 pools variances; pooled=0 does
not pool variances. drawflag=1 draws results; drawflag=0
calculates results.
Color#: 10 - 24 or color nam e pa sted from [vars] COLOR.
2-SampZInt(
2-SampZInt(s
[,listname1,listname2,freqlist1,freqlist2,confidence
,s
2
1
level])
(Data list input)
Computes a two-sample z confidence interval.
† …
TESTS
4:2-SampTTest
† …
TESTS
4:2-SampTTest
† …
TESTS
9:2-SampZInt(
2-SampZInt(
2-SampZInt(s
(Summary stats input)
Computes a two-sample z confidence interval.
70 Com mands and Functions Listing
,v1,n1,v2,n2[,confidence level])
1,s2
† …
TESTS
9:2-SampZInt(
Page 75

2-SampZTest(
2-SampZTest( s
[,
1,s2
listname1
,
listname2
,freqlist1,freqlist2,alternative,drawflag,color#])
Computes a two-sample z test. alternative=L1 is <; alternative=0 is
; alternative=1 is >. drawflag=1 draws results; drawflag=0
calculates results.
Color#: 10 - 24 or color nam e pa sted from [vars] COLOR.
2-SampZTest(
2-SampZTest(s
[,alternative,drawflag,color#])
Computes a two-sample z test. alternative=L1 is <; alternative=0 is
; alternative=1 is >. drawflag=1 draws results; drawflag=0
calculates results.
Color#: 10 - 24 or color nam e pa sted from [vars] COLOR.
Scatter
Scatter Plot#(type,Xlist,[,freqlist,color#])
Used as the "type" argument in the command
Where # gives Plot1, Plot2 or Plot3.
,v1,n1,v2,n2
1,s2
† …
TESTS
3:2-SampZTest(
† …
TESTS
3:2-SampZTest(
† y,
TYPE
Sci
Sci
Sets scientific notation display mode.
Select(
Select(Xlistname,Ylistname)
Selects one or more specific data points from a scatter plot or xyLine
plot (only), a nd then store's the selected data points to two new
lists, Xlistname and Ylistname.
† z
Sci
y 9
OPS
8:Select(
Commands and Functions Listing 71
Page 76

Send(
Send(string)
Sends one or more TI-Innovator™ Hub comma nds to a connected
hub.
Notes:
See also eval( and Get( command related to the Send(comma nd.
TI-Innovator™ Hub comm ands are supported in the HUB submenu in
the CE OS v.5.2 program editor.
Send(
Send(string)
Sends one or more TI-Innovator™ Hub comma nds to a connected hub.
Notes:
See also eval( and Get( command related to the Send(comma nd.
TI-Innovator™ Hub comm ands are supported in the HUB submenu in the CE
OS v.5.2 program editor.
seq(
seq(expression,variable,begin,end[,increment])
Returns list created by evaluating expression with reg ard to
variable, from begin to end by increment.
† ¼
I/O
B:Send(
TIInnovator™
Hub
† ¼
HUB
See menu
location
depending
on TIInnovator
Hub
sensors.
y 9
OPS
5:seq(
SEQ(n)
Seq(n)
In se quence mode, SEQ(n) sets the sequence editor type to enter
sequence functions, u, v, or w, as a function of the independent variable
n. Can also be se t from the Y= editor in SEQ mode.
SEQ(n+1)
Seq(n+1)
In se quence mode, SEQ(n+1) sets the sequence editor type to enter
sequence functions, u, v, or w, as a function of the independent variable
n+1. Can also be set from the Y= editor in SEQ mode.
72 Com mands and Functions Listing
† z
SEQ(n)
† z
SEQ(n+1)
Page 77

SEQ(n+2)
Seq(n+2)
In se quence mode, SEQ(n+2) sets the sequence editor type to enter
sequence functions, u, v, or w, as a function of the independent variable
n+2. Can also be set from the Y= editor in SEQ mode.
Note: "Type" will NOT be inc luded in the TIC CE P E
syntax
On the device, "Type" does not paste and is similar
to how the device displays, for example, DEC
Answers wh ere Answers appears in [catalog] but
does no t paste.
.
Seq
Seq
Sets sequence graphing m ode.
Sequential
Sequential
Sets mode to g raph functions sequentially.
† z
SEQ(n+2)
† z
Seq
† z
Sequential
setDate(
setDate(year,month,day)
Sets the date using a year, m onth, day forma t. The year m ust be 4
digits; month and day can be 1 or 2 digit.
setDtFmt(
setDtFmt(integer)
Sets the date forma t.
1 = M/D/Y
2 = D/ M/Y
3 = Y/M/D
y N
setDate(
y
N
setDtFmt(
Commands and Functions Listing 73
Page 78

setTime(
setTime(hour,minute, second)
Sets the time using an hour, minute, s econd format. The hour must be
in 24 hour format, in which 13 = 1 p.m.
setTmFmt(
setTmFmt(integer)
Sets the time format.
12 = 12 hour format
24 = 24 hour format
SetUpEditor
SetUpEditor
Removes all list names from the stat list editor,a nd then restores list
names L1 through L6 to columns 1 through 6.
SetUpEditor
SetUpEditor listname1[,listname2,...,listname20]
Removes all list names from the stat list editor,then sets it up to
display one or more listnames in the specified order, starting with
column 1.
y N
setTime(
y N
setTmFmt(
…
EDIT
5:SetUpEditor
…
EDIT
5:SetUpEditor
Shade(
Shade(lowerfunc,upperfunc
[,Xleft,Xright,pattern,patres,color#])
Draws lowerfunc and upperfunc in terms of X on the current
graph and uses pattern and patres to shade a nd color the area
bounded by lowerfunc, upperfunc, Xleft, and Xright.
lowerfunc and upperfunc a re shaded in the sa me specified
color.
Color#: 10 - 24 or color nam e pa sted from [vars] COLOR.
74 Com mands and Functions Listing
y <
DRAW
7:Shade(
Page 79

Shadec2(
Shadec2(lowerbound,upperbound,df[,color#])
Draws the density function for the c2distribution s pecified by
degrees of freedom df, and sha des and colors the area between
lowerbound a nd upperbound.
Color#: 10 - 24 or color nam e pa sted from [vars] COLOR.
ShadeÜ(
ShadeÜ
(lowerbound,upperbound,numeratordf,denominator
df[,color#])
Draws the density function for the Û distribution specified by
numerator df and denominator df and shades and colors the
area between lowerbound and upperbound.
Color#: 10 - 24 or color nam e pa sted from [vars] COLOR.
ShadeNorm(
ShadeNorm(lowerbound,upperbound[,m,s,color#])
Draws the normal density function specified by m a nd s a nd shades
and colors the area between lowerbound a nd upperbound.
Color#: 10 - 24 or color nam e pa sted from [vars] COLOR.
y =
DRAW
3:Shade c2(
y =
DRAW
4:Shade Ü (
y =
DRAW
1:ShadeNorm(
Shade_t(
Shade_t(lowerbound,upperbound,df[,color#])
Draws the density function for the Student-t distribution specified by
degrees of freedom df, a nd shades or colors the area between
lowerbound a nd upperbound.
Color#: 10 - 24 or color nam e pa sted from [vars] COLOR.
y =
DRAW
2:Shade_t(
Commands and Functions Listing 75
Page 80

Simul
Simul
Sets mode to g raph functions simultaneously.
sin(
sin(value)
Returns the sine of a real number, expression, or list.
L
1
sin
(
L
1
sin
(value)
Returns the arcsine of a real number, expression, or list.
sinh(
sinh(value)
Returns the hyperbolic sine of a real number, expression, or list.
L
1
sinh
(
L
1
sinh
(value)
Returns the hyperbolic arcsine of a real number, expression, or list.
† z
Simul
˜
y ?
y N
sinh(
y N
L
1
sinh
(
SinReg
SinReg
[iterations,Xlistname,Ylistname,period,regequ]
Attempts iterations times to fit a sinusoidal regression model to
Xlistname and Ylistname using a period guess, and stores the
regression equa tion to regequ.
76 Com mands and Functions Listing
…
CALC
C:SinReg
Page 81

solve(
solve(expression,variable,guess,{lower,upper})
Solves expression for variable, given an initial guess and lower
and upper bounds within which the solution is soug ht.
SortA(
SortA(listname)
Sorts elem ents of listname in ascending order.
SortA(
SortA(keylistname,dependlist1
[,dependlist2,...,dependlist n])
Sorts elem ents of keylistname in ascending order, then sorts e ach
depen dlist as a dependent list.
SortD(
SortD(listname)
Sorts elem ents of listname in descending order.
SortD(
SortD(keylistname,dependlist1[,dependlist2,...,
dependlist n])
Sorts elem ents of keylistname in descending order, then sorts ea ch
depen dlist as a dependent list.
† »
MATH
0:solve(
y 9
OPS
1:SortA(
y 9
OPS
1:SortA(
y 9
OPS
2:SortD(
y 9
OPS
2:SortD(
startTmr
startTmr
Starts the clock timer. Store or note the displayed value, and use it as
the argument for checkTmr( ) to check the elapsed time.
y N
startTmr
Commands and Functions Listing 77
Page 82

STATWIZARD OFF
STATWIZARD OFF
Disables wizard syntax help for statistical comm ands, distributions, and
seq(.
STATWIZARD ON
STATWIZARD ON
Enables wizard syntax help for statistical commands, distributions, and
seq(.
stdDev(
stdDev(list[,freqlist])
Returns the standard deviation of the elem ents in list with frequency
freqlist.
Stop
Stop
Ends program execution; returns to home s creen.
Store !
Store: value!variable
Stores value in variable.
y N
STATWIZARD
OFF
y N
STATWIZARD
ON(
y 9
MATH
7:stdDev(
† ¼
CTL
F:Stop
¿
StoreGDB
StoreGDB n
Stores current graph in da tabase GDBn.
78 Com mands and Functions Listing
y <
STO
3:StoreGDB
Page 83

StorePic
StorePic n
Stores current picture in picture Picn.
String4Equ(
String4Equ(string,Y= var)
Converts string into an equation and stores it in Y= var.
string can be a string or string variable.
String4Equ( is the inverse of Equ4String(.
sub(
sub(string,begin,length)
Returns a string that is a subset of another string, from begin to
length.
sum(
sum(list[,start,end])
Returns the sum of elements of list from start to end.
y <
STO
1:StorePic
† ¼
I/O
F:String>Equ(
y N
sub(
y 9
MATH
5:sum(
summation G(
G(expression[,start,end])
Classic comm and a s shown.
In MathPrint™ the summation entry template displays and returns
the sum of elements of list from start to end, where start<=end.
T
tan(
tan(value)
Returns the tangent of a real number, expression, or list.
»
NUM
0: summation G(
š
Commands and Functions Listing 79
Page 84

L
1
tan
(
L
1
tan
(value)
Returns the arctangent of a real number, expression, or list.
Tangent(
Tangent(expression,value[,color#,linestyle#])
Draws a line tangent to expression at X =value with specified color#:
10-24 a nd line style linestyle#: 1-2.
Color#: 10 - 24 or color nam e pa sted from [vars] COLOR.
tanh(
tanh(value)
Returns hyperbolic tangent of a real number, expression, or list.
L
1
tanh
(
L
1
tanh
(value)
Returns the hyperbolic arctangent of a rea l number, expression, or list.
tcdf(
tcdf(lowerbound,upperbound,df)
Computes the Student-t distribution probabilitybetween lowerbound
and upperbound for the s pecified degrees of freedom df.
y A
y <
DRAW
5:Tangent(
y
N
tanh(
y
N
L
tanh
y =
DISTR
6:tcdf(
1
(
Text(
Text(row,column,text1,text2,...,text n)
Writes text on graph beginning at pixel (row,column), where 0 row
164 and 0 column 264.
Full mode, row must be <=148; column must be 256
Horiz mode, row must be row<=66 and column must be <=256
G-T mode, row must be row <=126; column must be 176
TextColor(
TextColor([color#]
80 Com mands and Functions Listing
y <
DRAW
0:Text(
† y
Page 85

TextColor(
Set text color priorto using the Text( comma nd.
Color#: 10 - 24 or color nam e pa sted from [vars] COLOR.
Then
Then
See If:Then
Thick
Thick
Resets a ll Y=editor line-style settings to Thick.
Thin
Thin
Resets a ll Y=editor line-style settings to Thin.
Time
Time
Sets sequence graphs to plot with respect to time.
<
DRAW
A:TextColor
(
† zT
Thick
† zT
Thin
† y
.
Time
timeCnv(
timeCnv(seconds)
Converts seconds to units of time that ca n be m ore eas ily understood for
evaluation. The list is in {days,hours,minutes,seconds} format.
TInterval
TInterval [listname,freqlist,confidence level]
(Data list input)
Computes a t confidence interval.
y N
timeCnv
† …
TESTS
8:TInterval
Commands and Functions Listing 81
Page 86

TInterval
TInterval v,Sx,n[,confidence level]
(Summary stats input)
Computes a t confidence interval.
toString(
toString((value[,format])
Converts value to a string where value ca n be real, complex, an
evaluated expression, list, or matrix. String va lue displays in classic
format (0) following the mode setting AUTO/DEC or in decimal format
(1).
tpdf(
tpdf(x,df)
Computes the probability density function (pdf) for the Student-t
distribution a t a specified x value with specified degrees of freedom df.
Trace
Trace
Displays the graph and enters TRACE mode.
† …
TESTS
8:TInterval
† ¼
I/O
E:toString(
y =
DISTR
5:tpdf(
r
T-Test
T-Test m0
[,listname,freqlist,alternative,drawflag,color#])
(Data list input)
Performs a t test with frequency freqlist.alternative=L1 is <;
alternative=0 is ; alternative=1 is >. drawflag=1 draws results;
drawflag=0 calculates results.
Color#: 10 - 24 or color nam e pa sted from [vars] COLOR.
T-Test
T-Test m0,v,Sx,n[,alternative,drawflag,color#])
Performs a t test with frequency freqlist.alternative=L1 is < ;
alternative=0 is Ä ; alternative=1 is >. drawflag=1 draws results;
drawflag=0 calculates results.
Color#: 10 - 24 or color nam e pa sted from [vars] COLOR.
82 Com mands and Functions Listing
† …
TESTS
2:T-Test
† …
TESTS
2:T-Test
Page 87

tvm_FV
tvm_FV[(Ú,æ,PV,PMT,P/Y,C/Y)]
Computes the future value.
tvm_æ
tvm_æ[(Ú,PV,PMT,FV,P/Y,C/Y)]
Computes the a nnual interest rate.
tvm_Ú
tvm_Ú[(æ,PV,PMT,FV,P/Y,C/Y)]
Computes the number of payment periods.
tvm_Pmt
tvm_Pmt[(Ú,æ,PV,FV,P/Y,C/Y)]
Computes the a mount of ea ch payment.
Œ
1:Finance
CALC
6:tvm_FV
Œ
1:Finance
CALC
3:tvm_
æ
Œ
1:Finance
CALC
5:tvm_ Ú
Œ
1:Finance
CALC
2:tvm_
Pmt
tvm_PV
tvm_PV[(Ú,æ,PMT,FV,P/Y,C/Y)]
Computes the present value.
U
UnArchive
UnArchive variable
Moves the specified variables from the user data archive memory to RAM.
To archive variables, use Archive.
Œ
1:Finance
CALC
4:tvm_PV
y L
6:UnArchive
Commands and Functions Listing 83
Page 88

Un/d
Un/d
Displays results as a mixed number, if applicable.
uvAxes
uvAxes
Sets sequence graphs to plot u(n) on the x-axis and v(n) on the y-axis.
uwAxes
uwAxes
Sets sequence graphs to plot u(n) on the x-axis and w(n) on the y-axis.
V
1-VarStats
1-VarStats [Xlistname,freqlist]
Performs one-variable a nalysis on the da ta in Xlistname with frequency
freqlist.
»
NUM
C: Un/d
or
»
FRAC
2:Un/d
† y
.
uv
† y
.
uw
…
CALC
1:1-Var Stats
2-VarStats
2-VarStats [Xlistname,Ylistname,freqlist]
Performs two-variable ana lysis on the data in Xlistname and Ylistname
with frequency freqlist.
variance(
variance(list[,freqlist])
Returns the variance of the elem ents in list with frequency freqlist.
84 Com mands and Functions Listing
…
CALC
2:2-Var Stats
y 9
MATH
8:variance(
Page 89

Vertical
Vertical x[,color#,linestyle#]
Draws a vertical line a t x with specified color and line style.
Color#: 10 - 24 or color nam e pa sted from [vars] COLOR.
line s tyle#: 1-4.
vwAxes
vwAxes
Sets sequence graphs to plot v(n) on the x-axis and w (n) on the y-axis.
W
Wait
Waittime
Suspends execution of a program for a given time. Maximum time is 100
seconds.
y <
DRAW
4:Vertical
† y
.
vw
† ¼
CTL
A:Wait
Wait
Waittime
Suspends execution of a program for a given time. Maximum time is 100
seconds.
Web
Web
Sets sequence graphs to trace as webs.
:While
:Whilecondition:commands
:End:command
Executes commands while condition is true.
Innovator™
TI-
Hub
† ¼
HUB
4:Wait
† y
.
Web
† ¼
CTL
5:While
Commands and Functions Listing 85
Page 90

X
1
2
1
2
1
4
1
3
1
3
1
6
xor
valueA xor valueB
Returns 1 if only valueA or valueB = 0. valueA and valueB can be real
numbers, expressions, or lists.
xyLine
xyLine Plot#(type,Xlist,[,freqlist,color#])
Used as the "type" argument in the command
Where # gives Plot1, Plot2 or Plot3.
Z
ZBox
ZBox
Displays a graph, lets you draw a box that defines a new viewing window,
and updates the window.
ZDecimal
ZDecimal
Adjusts the viewing window so that TraceStep=0.1, @X=0.5 and
@Y=0.5, and displays the graph screen with the origin centered on the
screen.
y :
LOGIC
3:xor
†
y
,
TYPE
† q
ZOOM
1:ZBox
† q
ZOOM
4:ZDecimal
ZFrac1/2
ZFrac1/2
Sets the window variables so that you can trace in increments of
possible. Sets TraceStep to
ZFrac1/3
ZFrac1/3
Sets the window variables so that you can trace in increments of
possible. Sets TraceStep to
86 Com mands and Functions Listing
and @X and @Y to
and @X and @Y to
q
ZOOM
, if
.
B:ZFrac1/2
q
ZOOM
, if
.
C:ZFrac1/3
Page 91

ZFrac1/4
1
4
1
4
1
8
1
5
1
5
1
10
1
8
1
8
1
16
1
10
1
10
1
20
ZFrac1/4
Sets the window variables so that you can trace in increments of
possible. Sets TraceStep to
and @X and @Y to
.
ZFrac1/5
ZFrac1/5
Sets the window variables so that you can trace in increments of
possible. Sets TraceStep to
and @X and @Y to
.
ZFrac1/8
ZFrac1/8
Sets the window variables so that you can trace in increments of
possible. Sets TraceStep to
and @X and @Y to
.
ZFrac1/10
ZFrac1/10
Sets the window variables so that you can trace in increments of
possible. Sets TraceStep to
and @X and @Y to
.
q
ZOOM
, if
D:ZFrac1/4
q
ZOOM
, if
E:ZFrac1/5
q
ZOOM
, if
F:ZFrac1/8
q
ZOOM
, if
G:ZFrac1/10
ZInteger
ZInteger
Redefines the viewing window using the following dimensions:
TraceStep=1, @X=0.5, Xscl=10, @Y=1, Yscl=10.
Commands and Functions Listing 87
† q
ZOOM
8:ZInteger
Page 92

ZInterval
ZIntervals[,listname,freqlist,confidence level]
(Data list input)
Computes a z confidence interval.
ZInterval
ZIntervals,v,n[,confidence level]
(Summary stats input)
Computes a z confidence interval.
Zoom In
Zoom In
Magnifies the part of the graph that surrounds the cursor location.
Zoom Out
Zoom Out
Displays a greater portion of the graph, centered on the cursor location.
ZoomFit
ZoomFit
Recalculates Ymin and Ymax to include the minimum and ma ximum Y
values, between X min and X max, of the se lected functions and replots
the functions.
† …
TESTS
7:ZInterval
† …
TESTS
7:ZInterval
† q
ZOOM
2:Zoom In
† q
ZOOM
3:Zoom Out
† q
ZOOM
0:ZoomFit
ZoomRcl
ZoomRcl
Graphs the selected functions in a use r-defined viewing window.
88 Com mands and Functions Listing
† q
MEMORY
3:ZoomRcl
Page 93

ZoomStat
ZoomStat
Redefines the viewing window so that a ll statistical data points a re
displayed.
ZoomSto
ZoomSto
Immediately stores the current viewing window.
ZPrevious
ZPrevious
Replots the graph using the window variables of the graph that was
displayed before you executed the last ZOOM instruction.
ZQuadrant1
ZQuadrant1
Displays the portion of the graph that is in quadrant 1.
ZSquare
ZSquare
Adjusts the X or Y window settings so that ea ch pixel represents an
equal width and height in the coordinate system, and updates the
viewing window.
† q
ZOOM
9:ZoomStat
† q
MEMORY
2:ZoomSto
† q
MEMORY
1:ZPrevious
q
ZOOM
A:ZQuadrant1
† q
ZOOM
5:ZSquare
ZStandard
ZStandard
Replots the functions immediately, updating the window variables to the
default values.
Z-Test(
Z-Test(m0,s
[,listname,freqlist,alternative,drawflag,color#])
(Data list input)
Performs a z test with frequency freqlist. alternative= L1 is <;
† q
ZOOM
6:ZStandard
† …
TESTS
1:Z-Test(
Commands and Functions Listing 89
Page 94

Z-Test(
alternative=0 is ; alternative=1 is >. drawflag=1 draws results;
drawflag=0 calculates results.
Color#: 10 - 24 or color nam e pa sted from [vars] COLOR.
Z-Test(
Z-Test(m0,s,v,n[,alternative,drawflag,color#])
(Summary stats input)
Performs a z test. alternative=L1 is <; alternative=0 is ;
alternative=1 is >. drawflag=1 draws results; drawflag=0 calculates
results.
Color#: 10 - 24 or color nam e pa sted from [vars] COLOR.
ZTrig
ZTrig
Replots the functions immediately, updating the window variables to
preset values for plotting trig functions.
† …
TESTS
1:Z-Test(
† q
ZOOM
7:ZTrig
90 Com mands and Functions Listing
Page 95

Arithmetic Operations, Test Relations, and Symbols
! (factorial)
Factorial: value!
Returns factorial of value.
! (factorial)
Factorial: list!
Returns fa ctorial of listelements.
¡ (degrees notation)
Degrees notation: value¡
Interprets value as degrees; designa tes deg rees in DMS format.
r
(radian)
Radian: angle
Interprets angle a s radians.
r
»
PRB
4:!
»
PRB
4:!
y ;
ANGLE
1: ¡
y ;
ANGLE
3:
r
T
(transpose)
Transpose: matrix
Returns a matrix in which each element (row, column) is
swapped with the corresponding element (column, row) of
matrix.
x
‡
x
xthroot
‡value
Returns x
x
‡(
x
xthroot
‡list
T
th
root of value.
Arithmetic Operations, Test Relations, and Symbols 91
y >
MATH
2:
»
MATH
x
5:
»
MATH
T
‡
Page 96

x
‡(
th
Returns x
x
‡(
list
Returns list roots of value.
x
‡(
listA
Returns listA roots of listB.
3
Cube: value
Returns the cube of a real or complex number, expression, list, or
square matrix.
3
‡( (cube root)
Cube root:
Returns the cube root of a real or complex number, expression, or
list.
x
‡value
x
(cube)
‡listB
root of list eleme nts.
3
3
‡(value)
x
5:
»
MATH
x
5:
»
MATH
x
5:
»
MATH
3:
»
MATH
4:3(
‡
‡
‡
3
= (equal)
Equal:
valueA=valueB
Returns 1 if valueA=valueB. Returns 0 if valueA valueB.
valueA and valueB ca n be rea l or com plex numbers,
expressions, lists, or ma trices.
92 A rithmetic Operations, Test Relations, and Symbols
y :
TEST
1:=
Page 97

≠ (not equal)
Not equal:
valueA≠valueB
Returns 1 if valueA≠ valueB. Returns 0 if valueA=valueB.
valueA and valueB ca n be rea l or com plex numbers,
expressions, lists, or ma trices.
< (less than)
Less than:
valueA<valueB
Returns 1 if valueA<valueB. Returns 0 if valueA ‚ valueB.
valueA and valueB ca n be rea l or com plex numbers,
expressions, or lists.
> (greater than)
Greater than:
valueA>valueB
Returns 1 if valueA>valueB. Returns 0 if valueA { valueB.
valueA and valueB ca n be rea l or com plex numbers,
expressions, or lists.
{ (less or equal)
Less than or equal:
valueA{valueB
Returns 1 if valueA { valueB. Returns 0 if valueA>valueB.
valueA and valueB ca n be rea l or com plex numbers,
expressions, or lists.
y :
TEST
2: ≠
y :
TEST
5:<
y :
TEST
3:>
y :
TEST
6: {
≥ (greater or equal)
Greater than or equal:
valueA≥valueB
Returns 1 if valueA ≥ valueB. Returns 0 if valueA<valueB.
valueA and valueB ca n be rea l or com plex numbers,
expressions, or lists.
L
1
(inverse)
L
Inverse: value
Returns 1 divided by a real or com plex number or expression.
1
Arithmetic Operations, Test Relations, and Symbols 93
y :
TEST
4: ≥
œ
Page 98

L
1
(inverse)
L
Inverse: list
Returns 1 divided by list elements.
L
1
(inverse)
Inverse: matrix
Returns matrix inverted.
2
(square)
Square: value
Returns value m ultiplied by itself. value ca n be a real or
complex number or expression.
2
(square)
Square: list
Returns list eleme nts squared.
2
(square)
Square: matrix
Returns matrix multiplied by itself.
1
L
1
2
2
2
œ
œ
¡
¡
¡
^ (power)
Powers: value^power
Returns value raise d to power.value can be a real or
complex number or expression.
^ (power)
Powers: list^power
Returns list eleme nts raised to power.
94 A rithmetic Operations, Test Relations, and Symbols
›
›
Page 99

^ (power)
Powers: value^list
Returns value raise d to list elements.
^ (power)
Powers: matrix^power
Returns matrix elements raised to power.
L (negation)
Negation: Lvalue
Returns the negative of a real or complex number, expression,
list, or matrix.
10^( (power of ten)
Power of ten: 10^(value)
Returns 10 raised to the value powe r. value can be a real or
complex number or expression.
10^( (power of ten)
Power of ten: 10^(list)
Returns a list of 10 raised to the list
›
›
Ì
y G
y G
‡( (square root)
Square root: ‡(value)
Returns square root of a real or complex number, expression, or
list.
ä (multiply)
Multiplic ation:
valueAävalueB
Returns valueA times valueB.
ä (multiply)
Multiplic ation:
Arithmetic Operations, Test Relations, and Symbols 95
y C
¯
¯
Page 100

ä (multiply)
valueälist
Returns value times ea ch list element.
ä (multiply)
Multiplic ation:
listävalue
Returns each list element times value.
ä (multiply)
Multiplic ation:
listAälistB
Returns listA elements times listB elements.
ä (multiply)
Multiplic ation:
valueämatrix
Returns value times matrix elem ents.
ä (multiply)
Multiplic ation:
matrixAämatrixB
Returns matrixA times matrixB.
¯
¯
¯
¯
à (divide)
Division: valueAàvalueB
Returns valueA divided by valueB
à (divide)
Division: listàvalue
Returns list eleme nts divided by value.
à (divide)
Division: valueàlist
96 A rithmetic Operations, Test Relations, and Symbols
¥
¥
¥
 Loading...