

Page 1

HP Neoview Repository User Guide
HP Part Number: 611086-001
Published: July 2010
Edition: HP Neoview Release 2.5
Page 2

© Copyright 2010 Hewlett-Packard Development Company, L.P.
Legal Notice
Confidential computer software. Valid license from HP required for possession, use or copying. Consistent with FAR12.211and 12.212, Commercial
Computer Software, Computer Software Documentation, and Technical Data for Commercial Items are licensed to the U.S. Government under
vendor’s standard commercial license.
The information contained herein is subject to change without notice. The only warranties for HP products and services are set forth in the express
warranty statements accompanying such products and services. Nothing herein should be construed as constituting an additional warranty. HP
shall not be liable for technical or editorial errors or omissions contained herein.
Export of the information contained in this publication may require authorization from the U.S. Department of Commerce.
Microsoft, Windows, and Windows NT are U.S. registered trademarks of Microsoft Corporation.
Intel, Pentium, and Celeron are trademarks or registered trademarks of Intel Corporation or its subsidiaries in the United States and other
countries.
Java is a U.S. trademark of Sun Microsystems, Inc.
Motif, OSF/1, UNIX, X/Open, and the "X" device are registered trademarks, and IT DialTone and The Open Group are trademarks of The Open
Group in the U.S. and other countries.
Open Software Foundation, OSF, the OSF logo, OSF/1, OSF/Motif, and Motif are trademarks of the Open Software Foundation, Inc.
OSF MAKES NO WARRANTY OF ANY KIND WITH REGARD TO THE OSF MATERIAL PROVIDED HEREIN, INCLUDING, BUT NOT
LIMITED TO, THE IMPLIED WARRANTIES OF MERCHANTABILITY AND FITNESS FOR A PARTICULAR PURPOSE.
OSF shall not be liable for errors contained herein or for incidental consequential damages in connection with the furnishing, performance, or
use of this material.
© 1990, 1991, 1992, 1993 Open Software Foundation, Inc. The OSF documentation and the OSF software to which it relates are derived in part
from materials supplied by the following:
© 1987, 1988, 1989 Carnegie-Mellon University. © 1989, 1990, 1991 Digital Equipment Corporation. © 1985, 1988, 1989, 1990 Encore Computer
Corporation. © 1988 Free Software Foundation, Inc. © 1987, 1988, 1989, 1990, 1991 Hewlett-Packard Company. © 1985, 1987, 1988, 1989, 1990,
1991, 1992 International Business Machines Corporation. © 1988, 1989 Massachusetts Institute of Technology. © 1988, 1989, 1990 Mentat Inc. ©
1988 Microsoft Corporation. © 1987, 1988, 1989, 1990, 1991, 1992 SecureWare, Inc. © 1990, 1991 Siemens Nixdorf Informationssysteme AG. ©
1986, 1989, 1996, 1997 Sun Microsystems, Inc. © 1989, 1990, 1991 Transarc Corporation.
OSF software and documentation are based in part on the Fourth Berkeley Software Distribution under license from The Regents of the University
of California. OSF acknowledges the following individuals and institutions for their role in its development: Kenneth C.R.C. Arnold, Gregory S.
Couch, Conrad C. Huang, Ed James, Symmetric Computer Systems, Robert Elz. © 1980, 1981, 1982, 1983, 1985, 1986, 1987, 1988, 1989 Regents of
the University of California.
Page 3

Table of Contents
About This Document.........................................................................................................9
Supported Release Version Updates (RVUs)..........................................................................................9
Intended Audience.................................................................................................................................9
New and Changed Information in This Edition.....................................................................................9
Document Organization.......................................................................................................................10
Notation Conventions...........................................................................................................................10
General Syntax Notation.................................................................................................................10
Related Documentation........................................................................................................................12
Neoview Customer Library.............................................................................................................13
Publishing History................................................................................................................................14
HP Encourages Your Comments..........................................................................................................14
1 Introduction...................................................................................................................15
Repository Features and Interfaces.......................................................................................................15
2 Getting Started with Repository..................................................................................17
Installation............................................................................................................................................17
Character Set Support in Repository Views.........................................................................................17
Obtaining Prepackaged Queries...........................................................................................................17
Starting the Repository.........................................................................................................................17
Configuring Retention Times for Data.................................................................................................17
3 Repository Views..........................................................................................................19
Overview...............................................................................................................................................19
Query Statistics.....................................................................................................................................19
VIEW NEO.HP_METRICS.QUERY_STATS_VW2..........................................................................19
VIEW NEO.HP_METRICS.SQL_TEXT_VW1.................................................................................32
ODBC Session Data...............................................................................................................................33
VIEW NEO.HP_METRICS.ODBC_SESSION_STATS_V1...............................................................33
VIEW NEO.HP_METRICS.ODBC_SESSION_STATS_V2...............................................................36
Processing Node Statistics....................................................................................................................40
VIEW NEO.HP_METRICS.NODE_STATS_V1................................................................................40
Disk Statistics........................................................................................................................................42
VIEW NEO.HP_METRICS.DISK_STATS_V1..................................................................................42
EMS Events...........................................................................................................................................45
VIEW NEO.HP_METRICS.EVENTS_VW1.....................................................................................45
Space Management Views and Sample Query Views for Space Management....................................47
VIEW NEO.HP_METRICS.SPACE_PARTITION_DETAIL_VW1...................................................47
VIEW NEO.HP_METRICS.SPACE_PARTITION_DETAIL_HISTORY_VW1.................................50
Sample Query Views for Space Management.................................................................................54
SPACE_Q_CATALOG_SIZE_VW1............................................................................................54
SPACE_Q_DISK_FULL_VW1....................................................................................................55
SPACE_Q_NUM_GUARDIAN_FILES_VW1............................................................................55
SPACE_Q_OBJECT_GROWTH_VW1........................................................................................55
SPACE_Q_PARTITION_FULL_VW1.........................................................................................56
SPACE_Q_SYSTEM_DETAILS_VW1.........................................................................................56
SPACE_Q_SYSTEM_TOTAL_SIZE_VW1..................................................................................56
SPACE_Q_TABLES_BY_SCHEMA_VW1..................................................................................56
Table of Contents 3
Page 4

SPACE_Q_TABLE_FULL_VW1.................................................................................................57
SPACE_Q_TABLE_SIZE_VW1...................................................................................................57
SPACE_Q_TOP_10_CATEGORY_SIZE_VW1...........................................................................57
SPACE_Q_TOP_10_NON_PARTITION_DETAIL_VW1...........................................................57
SPACE_Q_TOP_10_PARTITION_DETAIL_VW1......................................................................58
SPACE_Q_TOP_10_SCHEMA_SIZE_VW1................................................................................58
SPACE_Q_TOP_10_TABLE_SIZE_VW1....................................................................................58
SPACE_Q_TOP_10_USER_SPACE_SIZE_VW1.........................................................................58
4 Examples and Guidelines for Creating Repository Queries....................................59
Overview...............................................................................................................................................59
Get the Number of Rows in a View......................................................................................................59
Retrieve a Specified Number of Rows from a View.............................................................................59
Retrieve Statistics for Completed Queries............................................................................................60
Retrieve Statistics for Incomplete Queries............................................................................................60
List Statement Counts for a Selected Time Period................................................................................61
Count Completed Queries, According to Specified Criteria................................................................62
Completed Queries Executed on a System in the Last 24 Hours....................................................62
Completed Queries Executed on a System in the Previous Two Days...........................................62
Queries within the Past 24 Hours, Grouped by Client Name.........................................................62
Queries within the Past 24 Hours, Grouped by Data Source..........................................................63
Queries within the Past 24 Hours, Grouped by Client Name and Including Average and
Maximum Elapsed Time.................................................................................................................63
Formatting Techniques to Enhance Readability of Query Output.......................................................63
Retrieving UCS2 Columns From a Workstation Configured for ISO8859-1........................................64
A Sample Queries for Event Information.......................................................................67
Sample Query Result............................................................................................................................72
B STATEMENT_TYPE Field...............................................................................................73
C Repository Views Disabled by Default.......................................................................75
Process Statistics...................................................................................................................................75
VIEW NEO.HP_METRICS.PROCESS_STATS_V1..........................................................................75
VIEW NEO.HP_METRICS.PROCESS_AGGR_LEVEL1_STATS_V1..............................................78
Table Statistics.......................................................................................................................................82
VIEW NEO.HP_METRICS.TABLE_STATS_V2 and VIEW
NEO.HP_METRICS.TABLE_STATS_DETAIL_V2...........................................................................83
D History of New and Changed Information in Previous Releases of the
Repository.........................................................................................................................87
New and Changed Information in Previous Editions..........................................................................87
E Pre-R2.5 Query Statistics Views..................................................................................89
Query Statistics for R2.4 SP2.................................................................................................................89
VIEW NEO.HP_METRICS.QUERY_STATS_VW1..........................................................................89
Query Statistics for R2.4 SP1...............................................................................................................101
Query Statistics for Pre-R2.4 SP1........................................................................................................101
VIEW NEO.HP_METRICS.ODBC_QUERY_STATS_V1_2400......................................................102
VIEW NEO.HP_METRICS.ODBC_QUERY_STATS_V2_2400......................................................105
4 Table of Contents
Page 5

VIEW NEO.HP_METRICS.QUERY_RUNTIME_STATS_V1_2400................................................108
Query Statistics for Release 2.4 ..........................................................................................................116
VIEW NEO.HP_METRICS.ODBC_QUERY_STATS_V1................................................................116
VIEW NEO.HP_METRICS.ODBC_QUERY_STATS_V2................................................................119
VIEW NEO.HP_METRICS.QUERY_RUNTIME_STATS_V1.........................................................122
F History of Field Changes for Repository..................................................................131
Summary of Changes for Repository 2.4 SP2.....................................................................................131
New Fields in QUERY_STATS_VW1 ............................................................................................131
New Fields in SQL_TEXT_VW1....................................................................................................131
New Space Management Views....................................................................................................131
Summary of Changes For Repository 2.4 SP1....................................................................................132
New Repository View For Accessing Error Event Information....................................................132
Repository View Changes For Easy Access to Query Statistics....................................................132
USER_NAME Field Increased to 128 Characters..........................................................................133
Summary of Changes for Repository 2.4............................................................................................133
Summary of Field Definition Changes for Repository 2.3..................................................................133
Summary of Field Definition Changes for Repository 2.2..................................................................135
Glossary.........................................................................................................................139
Index...............................................................................................................................141
Table of Contents 5
Page 6

List of Figures
1-1 Neoview Repository and Related Products..................................................................................16
6 List of Figures
Page 7

List of Tables
3-1 QUERY_STATS_VW2 Field Definitions........................................................................................20
3-2 SQL_TEXT_VW1 Field Definitions...............................................................................................32
3-3 ODBC_SESSION_STATS_V1 Field Definitions.............................................................................33
3-4 ODBC_SESSION_STATS_V2 Fields..............................................................................................37
3-5 NODE_STATS_V1 Field Definitions.............................................................................................40
3-6 DISK_STATS_V1 Field Definitions................................................................................................43
3-7 EVENTS_VW1 Field Definitions...................................................................................................46
3-8 SPACE_PARTITION_DETAIL_VW1 Field Definitions................................................................48
3-9 SPACE_PARTITION_DETAIL_HISTORY_VW1 Field Definitions..............................................50
3-10 SPACE_Q_CATALOG_SIZE_VW1................................................................................................54
3-11 SPACE_Q_DISK_FULL_VW1.......................................................................................................55
3-12 SPACE_Q_NUM_GUARDIAN_FILES_VW1................................................................................55
3-13 SPACE_Q_OBJECT_GROWTH_VW1...........................................................................................55
3-14 SPACE_Q_PARTITION_FULL_VW1............................................................................................56
3-15 SPACE_Q_SYSTEM_DETAILS_VW1............................................................................................56
3-16 SPACE_Q_SYSTEM_TOTAL_SIZE_VW1.....................................................................................56
3-17 SPACE_Q_TABLES_BY_SCHEMA_VW1.....................................................................................56
3-18 SPACE_Q_TABLE_FULL_VW1....................................................................................................57
3-19 SPACE_Q_TABLE_SIZE_VW1......................................................................................................57
3-20 SPACE_Q_TOP_10_CATEGORY_SIZE_VW1...............................................................................57
3-21 SPACE_Q_TOP_10_NON_PARTITION_DETAIL_VW1..............................................................57
3-22 SPACE_Q_TOP_10_PARTITION_DETAIL_VW1.........................................................................58
3-23 SPACE_Q_TOP_10_SCHEMA_SIZE_VW1...................................................................................58
3-24 SPACE_Q_TOP_10_TABLE_SIZE_VW1.......................................................................................58
3-25 SPACE_Q_TOP_10_USER_SPACE_SIZE_VW1............................................................................58
C-1 PROCESS_STATS_V1 Field Definitions........................................................................................75
C-2 PROCESS_AGGR_LEVEL1_STATS_V1 Field Definitions............................................................78
C-3 TABLE_STATS_V2 and TABLE_STATS_DETAIL_V2 Field Definitions.......................................83
E-1 QUERY_STATS_VW1 Field Definitions........................................................................................89
E-2 Comparison of ODBC Query Statistics and Query Runtime Statistics.......................................101
E-3 ODBC_QUERY_STATS_V1_2400 Field Definitions....................................................................102
E-4 ODBC_QUERY_STATS_V2_2400 Fields......................................................................................106
E-5 QUERY_RUNTIME_STATS_V1_2400 Field Definitions.............................................................108
E-6 ODBC_QUERY_STATS_V1 Field Definitions.............................................................................117
E-7 ODBC_QUERY_STATS_V2 Fields...............................................................................................120
E-8 QUERY_RUNTIME_STATS_V1 Field Definitions......................................................................123
F-1 Fields Not Available in Repository 2.4 SP1 Views ODBC_QUERY_STATS_V1,
ODBC_QUERY_STATS_V2, and QUERY_RUNTIME_STATS_V1..............................................132
F-2 Field Definition Changes for QUERY_RUNTIME_STATS_V1 from Repository 2.2 to Repository
2.3.................................................................................................................................................134
F-3 Field Name Mapping from TABLE_STATS_V1 to TABLE_STATS_V2.......................................134
F-4 Field Name Mapping from ACCESS_ODBCMX_QUERY_STATS_V1 to
ODBC_QUERY_STATS_V1.........................................................................................................135
F-5 Field Name Mapping from ACCESS_ODBCMX_QUERY_STATS_V2 to
ODBC_QUERY_STATS_V2.........................................................................................................135
F-6 Field Name Mapping from ACCESS_ODBCMX_SESSION_DATA_V1 to
ODBC_SESSION_STATS_V1.......................................................................................................136
F-7 Field Name Mapping from ACCESS_ODBCMX_SESSION_DATA_V2 to
ODBC_SESSION_STATS_V2.......................................................................................................136
7
Page 8

List of Examples
A-1 Generate Update Stats Command List..........................................................................................68
A-2 Search Event Logs for Abnormal Program Termination...............................................................68
A-3 Search Event Logs For a Specific Event Number..........................................................................69
A-4 Search Event Logs for Specific Event Text.....................................................................................69
A-5 Search Event Logs for Missing Statistics.......................................................................................70
A-6 Search Event Logs for a Process Name.........................................................................................70
A-7 Search Event Logs for a Query ID.................................................................................................71
A-8 Search Event Logs for Subsystem..................................................................................................71
A-9 Summary of all Events...................................................................................................................72
8 List of Examples
Page 9

About This Document
This document describes the views supported by the Neoview Manageability Repository, a
Neoview SQL database and set of programs that collect and store statistics and other information
about queries, query sessions, tables, disks, processing nodes, and (optionally) selected processes
involved in query execution on a Neoview platform.
Supported Release Version Updates (RVUs)
This manual supports Neoview Release 2.5 and subsequent Neoview releases until otherwise
indicated in a replacement publication.
Intended Audience
This document is intended for Neoview platform administrators, database administrators, and
other users interested in evaluating query performance and resource utilization on a Neoview
platform. Familiarity with Neoview SQL is a prerequisite.
New and Changed Information in This Edition
• Added a new view for accessing query statistics: QUERY_STATS_VW2. This view differs
from QUERY_STATS_VW1 by the addition of 5 new fields for WMS query aggregation and
changes to 8 existing field data types. See “VIEW NEO.HP_METRICS.QUERY_STATS_VW2”
(page 19). The new fields:
— QAG_OPTION
— QAG_TOTAL
— CONN_RULE
— COMP_RULE
— EXEC_RULE
The fields with data type changes:
— SQL_MEMORY_SPACE_ALLOCATED
— SQL_MEMORY_SPACE_USED
— SQL_MEMORY_HEAP_ALLOCATED
— SQL_MEMORY_HEAP_USED
— EXECUTOR_IN_DISK_MEMORY_SPACE_ALLOCATED
— EXECUTOR_IN_DISK_MEMORY_SPACE_USED
— EXECUTOR_IN_DISK_MEMORY_HEAP_ALLOCATED
— EXECUTOR_IN_DISK_MEMORY_HEAP_USED
• Increased the retention times for the following views:
— Processing node statistics
— Session data
— ODBC/JDBC Query compilation and execution statistics
— Table statistics
— Disk statistics
See Section : “Configuring Retention Times for Data” (page 17)
• Added 3 columns to ODBC_SESSION_STATS_V1 and ODBC_SESSION_STATS_V2:
— TOTAL_LOGIN_ELAPSED_TIME_MCSEC
— LDAP_LOGIN_ELAPSED_TIME_MCSEC
— CLIENT_USER_NAME
Supported Release Version Updates (RVUs) 9
Page 10

• Created new appendix for STATEMENT_TYPE field of QUERY_STATS_VW2. See
Appendix B: “STATEMENT_TYPE Field” (page 73).
• Moved Processing statistics (including the PROCESS_STATS_V1 AND
PROCESS_AGGR_LEVEL1_STATS_V1 views) and Table statistics (including the
TABLE_STATS_V2 and TABLE_STATS_DETAIL_V2 views) to new Appendix C: “Repository
Views Disabled by Default” (page 75).
• Moved QUERY_STATS_V1 view to Appendix E: “Pre-R2.5 Query Statistics Views” (page 89).
Document Organization
This document is organized as follows:
Chapter 1: Introduction
Use this chapter to learn about the Repository and related Neoview software products.
Chapter 2: Getting Started with Repository
Use this chapter to find how to obtain and install the Repository software, enable capture of
session data, and configure retention times for data.
Chapter 3: Repository Views
Use this chapter to learn about the available Repository views, including the meanings of
statistics and other data available through the views.
Chapter 4: Examples and Guidelines for Creating Repository Queries
Use this chapter to see several simple examples of Repository queries and to learn about
guidelines for creating your own queries.
Appendix A: Sample Queries for Event Information
Use this appendix to see sample Repository queries of error and event information on the
Neoview platform. You can use these sample queries or create your own queries following
the format in the examples.
Appendix B: STATEMENT_TYPE Field
Use this appendix to see the possible values for the STATEMENT_TYPE fields in the
QUERY_STATS_VW2 view.
Appendix C: Repository Views Disabled by Default
Use this appendix to learn about views that are disabled by default. These views include
Process Statistics and Table Statistics.
Appendix D: History of New and Changed Information in Previous Releases of the Repository
Use this appendix to learn about the history of new and changed information in the Repository.
Appendix E: Pre-R2.5 Query Statistics Views
Use this appendix to learn about the query statistics views before R2.5. Current data is
available through these views. However, some fields now return NULL values and you must
use the “two rows per query” semantics for query statistics.
Appendix F: History of Field Changes for Repository
Use this appendix to review the changes that have been made to the fields in the Repository,
beginning with Release 2.2 to the current release.
Glossary
Use the glossary to find the meanings of various terms used in this document.
Notation Conventions
General Syntax Notation
This list summarizes the notation conventions for syntax presentation in this manual.
10
Page 11

UPPERCASE LETTERS
Uppercase letters indicate keywords and reserved words. Type these items exactly as shown.
Items not enclosed in brackets are required. For example:
SELECT
Italic Letters
Italic letters, regardless of font, indicate variable items that you supply. Items not enclosed
in brackets are required. For example:
file-name
Computer Type
Computer type letters within text indicate case-sensitive keywords and reserved words. Type
these items exactly as shown. Items not enclosed in brackets are required. For example:
myfile.sh
Bold Text
Bold text in an example indicates user input typed at the terminal. For example:
ENTER RUN CODE
?123
CODE RECEIVED: 123.00
The user must press the Return key after typing the input.
[ ] Brackets
Brackets enclose optional syntax items. For example:
DATETIME [start-field TO] end-field
A group of items enclosed in brackets is a list from which you can choose one item or none.
The items in the list can be arranged either vertically, with aligned brackets on each side of
the list, or horizontally, enclosed in a pair of brackets and separated by vertical lines. For
example:
DROP SCHEMA schema [CASCADE]
[RESTRICT]
DROP SCHEMA schema [ CASCADE | RESTRICT ]
{ } Braces
Braces enclose required syntax items. For example:
FROM { grantee[, grantee]...}
A group of items enclosed in braces is a list from which you are required to choose one item.
The items in the list can be arranged either vertically, with aligned braces on each side of the
list, or horizontally, enclosed in a pair of braces and separated by vertical lines. For example:
INTERVAL { start-field TO end-field }
{ single-field }
INTERVAL { start-field TO end-field | single-field }
| Vertical Line
A vertical line separates alternatives in a horizontal list that is enclosed in brackets or braces.
For example:
{expression | NULL}
Notation Conventions 11
Page 12

… Ellipsis
An ellipsis immediately following a pair of brackets or braces indicates that you can repeat
the enclosed sequence of syntax items any number of times. For example:
ATTRIBUTE[S] attribute [, attribute]...
{, sql-expression}...
An ellipsis immediately following a single syntax item indicates that you can repeat that
syntax item any number of times. For example:
expression-n…
Punctuation
Parentheses, commas, semicolons, and other symbols not previously described must be typed
as shown. For example:
DAY (datetime-expression)
@script-file
Quotation marks around a symbol such as a bracket or brace indicate the symbol is a required
character that you must type as shown. For example:
"{" module-name [, module-name]... "}"
Item Spacing
Spaces shown between items are required unless one of the items is a punctuation symbol
such as a parenthesis or a comma. For example:
DAY (datetime-expression)
DAY(datetime-expression)
If there is no space between two items, spaces are not permitted. In this example, no spaces
are permitted between the period and any other items:
myfile.sh
Line Spacing
If the syntax of a command is too long to fit on a single line, each continuation line is indented
three spaces and is separated from the preceding line by a blank line. This spacing
distinguishes items in a continuation line from items in a vertical list of selections. For example:
match-value [NOT] LIKE pattern
[ESCAPE esc-char-expression]
Related Documentation
This manual is part of the HP Neoview customer library.
12
Page 13

Neoview Customer Library
The manuals in the Neoview customer library are listed here for your convenience.
• Administration
Neoview User Management and
Security Administration Guide
Neoview Character Sets
Administrator's Guide
Neoview Database
Administrator’s Guide
Neoview Guide to Stored
Procedures in Java
Neoview Query Guide
Neoview Transporter User Guide
README files for installing
Administration client products
• Management
Information about security features on the Neoview platform, including user
and role management for database and platform users, support for integration
with Lightweight Directory Access Protocol (LDAP) directory servers,
password encryption, and database security.
Information for database administrators and end users of the Neoview
Character Sets product, including rules for defining and managing character
data using SQL language elements, capabilities and limitations of Neoview
client applications, troubleshooting character set-related problems, and enabling
Pass-Through mode in the ISO88591 configuration.
Introduction to the Neoview database, database users and IDs, database
management, and management tools.
Information about how to use stored procedures that are written in Java within
a Neoview database.
Information about reviewing query execution plans and investigating query
performance of Neoview databases.
Information about processes and commands for loading data into your
Neoview platform or extracting data from it.
— README for the HP Neoview Windows Client Package
— README for the HP Neoview Transporter Java Client
HP Database Manager (HPDM)
Online Help
HP Database Manager (HPDM)
User Guide
Neoview Command Interface
(NCI) Guide
Neoview Performance Analysis
Tools Online Help
Neoview Performance Analysis
Tools User Guide
Neoview Repository User Guide
Neoview Workload Management
Services Guide
README files for installing
Management client products
Help topics that describe how to use the HP Database Manager client to monitor
and manage a Neoview data warehousing platform.
Information for database administrators about how to monitor and manage
a Neoview data warehousing platform using the HP Database Manager.
Information about using the HP Neoview Command Interface to run SQL
statements interactively or from script files.
Context-sensitive help topics that describe how to use the Neoview
Performance Analysis Tools to analyze and troubleshoot query-related issues
on the Neoview data warehousing platform.
Information about how to use the Neoview Performance Analysis Tools to
analyze and troubleshoot query-related issues on the Neoview data
warehousing platform.
Information about using the Repository, including descriptions of Repository
views and guidelines for writing Neoview SQL queries against the views.
Information about using Neoview Workload Management Services (WMS) to
manage workload and resources on a Neoview data warehousing platform.
— README for the HP Neoview Windows Client Package
— README for the HP Database Manager (HPDM)
— README for the HP Neoview Command Interface (NCI)
— README for the HP Neoview Performance Analysis Tools
Related Documentation 13
Page 14

• Connectivity
Reference
Reference information about the HP Neoview JDBC Type 4 Driver API.Neoview JDBC Type4 Driver API
Neoview JDBC Type 4 Driver
Programmer’s Reference
Neoview ODBC Drivers Manual
Neoview ADO.NET Provider
Manual
ODBC Client Administrator
Online Help
README files for installing
Connectivity client products
• Reference
Mapping Tables for Neoview
Character Sets
Neoview SQL Reference Manual
Neoview Client and Platform
Compatibility Reference
Information about using the HP Neoview JDBC Type 4 driver, which provides
Java applications on client workstations access to a Neoview database.
Information about using HP Neoview ODBC drivers on a client workstation
to access a Neoview database.
Information about using HP Neoview ADO.NET to access data and services
stored on the Neoview database.
Context-sensitive help topics that describe how to use the ODBC Data Source
Administrator.
— README for the HP Neoview Windows Client Package
— README for the HP Neoview JDBC Type 4 Driver
— README for the HP Neoview ODBC Driver for Windows
— README for the HP Neoview ODBC Drivers for UNIX
— README for the HP Neoview ADO.NET Provider
A hyperlinked collection of East Asian characters supported by Neoview
character set functionality.
Reference information about the syntax of SQL statements, functions, and
other SQL language elements supported by the Neoview database software.
Information about compatibility of client products and the version of the
Neoview release installed on the Neoview platform.
Cause, effect, and recovery information for error messages.Neoview Messages Manual
README for HP Neoview
Release 2.5
Information about new features for the current release, including where to
download software and obtain documentation.
Publishing History
HP Encourages Your Comments
HP encourages your comments concerning this document. We are committed to providing
documentation that meets your needs. Send any errors found or suggestions for improvement
to docsfeedback@hp.com.
Include the document title and part number, shown below:
Document title: HP Neoview Repository User Guide
Part Number: 611086-001
Publication DateProduct VersionPart Number
April 2008Release 2.3544811–001
April 2009Release 2.4546262-001
September 2009Release 2.4 Service Pack 1 (SP1)587392-001
May 2010Release 2.4 Service Pack 2 (SP2)621366–001
July 2010Release 2.5611086–001
14
Page 15
1 Introduction
Repository Features and Interfaces
The Neoview Manageability Repository is a Neoview SQL database and set of programs that
automatically collect and store statistics and other information about the following entities on a
Neoview platform:
• Queries initiated through ODBC and JDBC, including queries managed by Workload
Management Services (WMS). All query data is written to a single location and accessible
through two views, one of which holds the full SQL text. Certain data about queries is
available from the time the query starts; other data becomes available only after the query
is complete.
• Processing nodes (CPUs). Information about processing nodes is collected from the Neoview
platform every five minutes.
• Table statistics. This feature is off by default and no data is returned. Use the Neoview
Command Interface (NCI) automated Update Statistics feature to update histogram statistics
for tables.
• Disks. Information about disk availability and performance is collected from the Neoview
platform and sent to the Repository every 5 minutes, by default.
• Error and other events that are tracked in the Neoview event logs. A Repository view provides
access to the event data and you can use SQL queries to obtain information about a variety
of events occurring on the Neoview platform.
• Space management. Repository views provide access to inventory data about table partitions
and aging historical data about table partitions.
• Optional processes involved in query execution. Process statistics gathering is disabled by
default, but if you enable this feature, the information is collected from the Neoview platform
processes started by a specific query (NDCS connectivity server process). Different views
provide access to information about individual processes and sets of processes of the same
type, for example all query execution processes started by a specific query (NDCS connectivity
server process). The Repository data collector process is also monitored. Aggregates for sets
of related processes are computed every five minutes with a 15-minute delay; thus, aggregate
data becomes available from the Repository 15 minutes after the end of the sampling interval.
Process collectors should not be turned on and left on for a long time because they place a
load on the platform. They should be turned off after the measurement period has completed.
NOTE: As part of the retirement of the process statistics collectors, the collectors are not
installed nor configured on systems configured with Unicode characters sets.
The Repository is used to store historical information that the DBA can access to see patterns of
queries which were run on the Neoview platform. Some examples of the resource information
that can be obtained from the Repository includes:
• Platform CPU (Node) usage by time (hourly, daily, and distribution by segment)
• Platform disk space usage
• Information on queries run by specific users, applications, client PCs, type of queries run at
which time, the number of queries run
More information and sample queries are available from the Metric Miner within the HP Database
Manager product.
Any database administrator (ROLE.DBA) can issue queries against the Repository,using Neoview
Command Interface or another standard SQL interface, and can grant other users access to the
Repository.
Repository Features and Interfaces 15
Page 16
Use the Neoview Performance Analysis Tools (NPA Tools) client to monitor queries and system
resources on the Neoview platform and to reveal, as soon as possible, whether some aspect of
system performance is outside an acceptable range. The NPA Tools provide a way to view,
terminate, suspend, or resume queries. You can also use the HPDM system monitor and System
Offender features to monitor the platform in real-time.
NOTE: As of R2.4 SP1, running query information is no longer available from the Repository.
Use the Neoview Performance Analysis Tools to monitor running queries on the Neoview
platform.
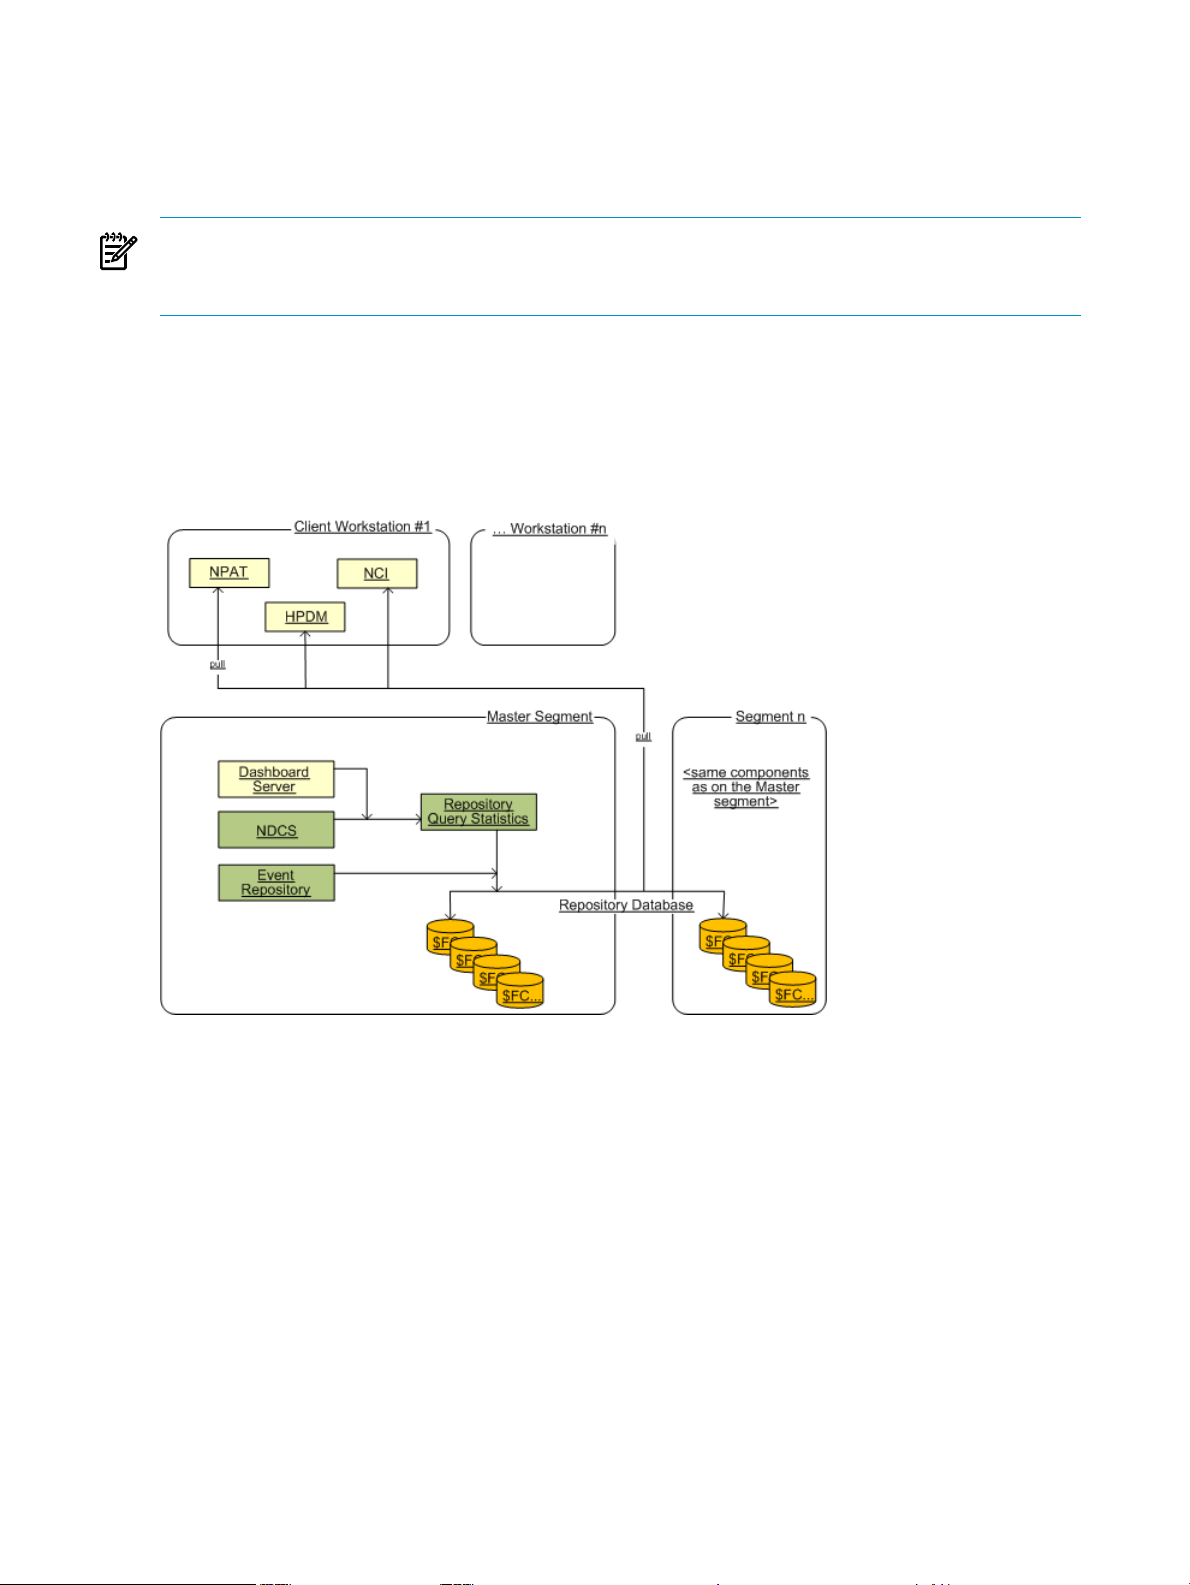
Figure 1-1: “Neoview Repository and Related Products” (page 16) illustrates, at a very high
level, the architectural relationship and interfaces of the Repository and the products with which
it interacts. This manual describes only the user interface of the Repository, which allows you
to create and display the results of Repository queries on any standard SQL interface. HP Support
has access to additional tools for managing the Repository configuration.
Figure 1-1 Neoview Repository and Related Products
16 Introduction
Page 17

2 Getting Started with Repository
Installation
The Repository is initially installed on the Neoview platform by HP Manufacturing. Repository
upgrades are installed by HP Support in the context of Neoview platform upgrades.
Character Set Support in Repository Views
The Repository installation script is aware of whether a Neoview platform is configured to
support the ISO8859-1, Japan Shift-JIS, or UTF-8 character set. If the Neoview platform is
configured for the ISO88591 configuration, then character fields in all Repository tables and
views will contain ISO8859-1 data. If the platform is configured for the SJIS or Unicode
configuration, character fields in some, but not all, Repository views contain double-wide
UCS2–encoded data. The description of each view in Chapter 3: “Repository Views” (page 19)
indicates whether the view supports UCS2–encoded data. Section : “Retrieving UCS2 Columns
From a Workstation Configured for ISO8859-1” (page 64) discusses how to retrieve UCS2 data
from an ISO8859-1 workstation or “from a workstation configured for the ISO8859-1 character
set”).
Regardless of the character set used by the Neoview platform, column names in Repository views
are encoded using ISO8859-1, and segment names are not internationalized.
Obtaining Prepackaged Queries
Prepackaged queries against the Repository are distributed as part of the Metric Miner product
within HPDM.
Starting the Repository
During installation, the Repository is configured to come up automatically when the Neoview
platform starts.
By default, statistics are collected for queries, connectivity sessions, disks, processing nodes, and
system events. Table data is not available by default.
NOTE: For support of query statistics, Neoview Workload Management Services (WMS) must
also be running. It is installed and started by default. For more information, see the Neoview
Workload Management Services Guide.
To change your configuration and the retention times for query statistics, contact your HP Support
representative.
Configuring Retention Times for Data
By default, the retention times for Repository data are:
Retention TimeRepository Metric
90 daysProcessing node statistics
90 daysSession data
Installation 17
Page 18

Retention TimeRepository Metric
ODBC/JDBC Query compilation and execution statistics
ODBC query statistics and Query runtime statistics
(Release 2.4 statistics)
90 days
90 days
These statistics are static and will never be updated. To
remove these statistics from your platform or get help
with migration to new tables, contact your HP service
provider.
30 daysProcess statistics, if enabled
30 daysProcess aggregation Level 1 statistics, if enabled
20 daysSQL Space status
90 daysTable statistics
90 daysDisk statistics
30 daysEvent data
To modify these retention times, contact your HP Support representative.
18 Getting Started with Repository
Page 19

3 Repository Views
Overview
You can use the following views for access to the Repository:
• “VIEW NEO.HP_METRICS.QUERY_STATS_VW2” (page 19)
• “VIEW NEO.HP_METRICS.SQL_TEXT_VW1” (page 32)
• “VIEW NEO.HP_METRICS.ODBC_SESSION_STATS_V1” (page 33)
• “VIEW NEO.HP_METRICS.ODBC_SESSION_STATS_V2” (page 36)
• “VIEW NEO.HP_METRICS.NODE_STATS_V1” (page 40)
• “VIEW NEO.HP_METRICS.DISK_STATS_V1” (page 42)
• “VIEW NEO.HP_METRICS.EVENTS_VW1” (page 45)
• “VIEW NEO.HP_METRICS.SPACE_PARTITION_DETAIL_VW1” (page 47)
• “VIEW NEO.HP_METRICS.SPACE_PARTITION_DETAIL_HISTORY_VW1” (page 50)
Views are reinstalled every time the Repository installation is run. Reinstalling the views picks
up any view definition changes.
Query Statistics
The Repository defines these views for retrieval of query statistics information:
• QUERY_STATS_VW2
• SQL_TEXT_VW1
If you have applications that use views from previous releases, the queries will continue to work
and access current query statistics. However, queries against views from previous releases cannot
use the new and revised columns. Also, some fields may no longer be available in
QUERY_STATS_VW2. If a field is no longer available, NULL is returned when you run queries
using the view. It is recommended that you adjust your applications as soon as possible to use
the QUERY_STATS_VW2 view. For query statistics information prior to R2.5, see “Pre-R2.5
Query Statistics Views” (page 89).
VIEW NEO.HP_METRICS.QUERY_STATS_VW2
The Repository collects compilation and execution query statistics.
This view provides access to all query information. The SQL text for the query is also included,
up to 254 characters. If the SQL text is longer than 254 characters, the
SQL_TEXT_OVERFLOW_INDICATOR field is set to 1 to indicate that only part of the SQL text fits
in this view, and the complete SQL text is placed in the SQL_TEXT_VW1 view. In this case,
QUERY_STATS_VW2 has the first 254 characters and SQL_TEXT_VW1 has the complete SQL
text. The QUERY_STATS_VW2 view can be joined with the SQL_TEXT_VW1 view through the
EXEC_START_LCT_TS (or EXEC_START_UTC_TS) and QUERY_ID fields to fetch the full SQL
text for the query.
Character columns use ISO88591 or UCS2 encoding, as appropriate to the Neoview platform
configuration. If the platform is UCS2 or SJIS, all character columns are created with CHARACTER
SET UCS2. If the platform is ISO88591, all CHAR columns are created with CHARACTER SET
ISO88591.
The Primary Key for QUERY_STATS_VW2 field definition is EXEC_START_UTC_TS and
QUERY_ID.
Overview 19
Page 20

Table 3-1 QUERY_STATS_VW2 Field Definitions
DescriptionData TypeField Name
EXEC_START_LCT_TS
EXEC_START_UTC_TS
QUERY_ID
TIMESTAMP(6) NO
DEFAULT
TIMESTAMP(6) NO
DEFAULT
CHAR(160) NO
DEFAULT
ANSI Timestamp, in Local Civil Time,
indicating when query execution began. That
is, the time when an execute statement is
issued for the prepared query.
If the query is controlled by WMS, this value
reflects the time it was ready to be submitted
to the WMS system. Depending on WMS
rules and threshold settings, WMS may delay
or cancel the actual launch of the query.
Columns SUBMIT_TS_LCT, WAIT_TIME
and HOLD_TIME can be used to calculate
the actual launch time of the query.
If the query is not under control of WMS,
EXEC_START_LCT_TSrepresents the actual
launch time.
Example: 2009-08-17 07:47:28.795392
Primary Key
ANSI Timestamp, in Coordinated Universal
Time, indicating when query execution
began.
Example: 2009-08-17 15:47:28.795392
Primary Key
A unique identifier for this SQL statement,
generated by the Neoview SQL compiler.
Example:
MXID0100109050821211709056930627300
0000026312DEV.USER2400_15010_SQL_CUR_1
ENTRY_ID_LCT_TS
ENTRY_ID_UTC_TS
SEGMENT_NAME
PLATFORM_NAME
USER_NAME
TIMESTAMP(6) NO
DEFAULT
TIMESTAMP(6) NO
DEFAULT
CHAR(16) DEFAULT
NULL
CHAR(64) DEFAULT
NULL
CHAR(128) DEFAULT
NULL
Repository-generated ANSI Timestamp, in
Local Civil Time, showing when this row
was last updated.
Example: 2009-08-17 07:48:09.967095
Repository-generated ANSI Timestamp, in
Coordinated Universal Time, showing when
this row was last updated.
Example: 2009-08-17 15:48:09.967095
Name of the Neoview platform segment
used by the datasource to connect and start
the query. The Master Executor process for
the query is running in this segment.
Example: \NEO0101
Neoview system name, made up of the first
three letters of the system name, followed
by 01 for the first platform at your site, 02
for the second platform at your site, and so
on.
Example: NEO01
The name or alias, used at time of
connection, to identify a Neoview user. One
or more users can have the same Neoview
role.
Example: dbmgr
20 Repository Views
Page 21

Table 3-1 QUERY_STATS_VW2 Field Definitions (continued)
DescriptionData TypeField Name
ROLE_NAME
START_PRIORITY
PROCESS_NAME
SESSION_ID
CLIENT_NAME
CHAR(128) DEFAULT
NULL
INTEGER UNSIGNED
DEFAULT NULL
CHAR(64) DEFAULT
NULL
CHARACTER(108)
DEFAULT NULL
VARCHAR(1024)
DEFAULT NULL
Neoview user role name. Multiple users can
have the same role name.
Example: DBA
Starting priority of the Master Executor
process for this query.
Example: 148
Process name of the NDCS server that is the
parent of the query. The format of this name
is \segment_name.$process_name.
Example: \NEO0101.$XYZ
Unique session ID generated by the NDCS
server when the ODBC/JDBC connection was
established.
Example: :
MXID010010905082121170905693062
73000000026312DEV.USER2400
TIP: The session ID is fully contained
within the query ID. To find all queries
executed within a specific session, join the
session statistics views and the query
statistics view on the session ID.
Name of the workstation that initiated the
query.
Example: testpc-8
APPLICATION_NAME
DATASOURCE
STATEMENT_ID
CHAR(130) DEFAULT
NULL
CHARACTER(128)
DEFAULT NULL
CHARACTER(160)
DEFAULT NULL
Name of the application used to connect to
the database and send the query.
Example: NCI.
Datasource name on the Neoview platform
to which the client connected.
Example: Admin_Load_DataSource
Unique statement ID generated by the NDCS
SQL server at the time the Prepare command
was received.
Example: SQL_CUR_1
Query Statistics 21
Page 22

Table 3-1 QUERY_STATS_VW2 Field Definitions (continued)
DescriptionData TypeField Name
STATEMENT_TYPE
CHARACTER(36)
DEFAULT NULL
Compiler-provided value, one of:
• SQL_SELECT_UNIQUE
• SQL_SELECT_NON_UNIQUE
• SQL_INSERT_UNIQUE
• SQL_INSERT_NON_UNIQUE
• SQL_UPDATE_UNIQUE
• SQL_UPDATE_NON_UNIQUE
• SQL_DELETE_UNIQUE
• SQL_DELETE_NON_UNIQUE
• SQL_SET_TRANSACTION
• SQL_SET_SCHEMA
• SQL_OTHER
• SQL_CALL_NO_RESULT_SETS
• SQL_CALL_WITH_RESULT_SETS
• SQL_CAT_UTIL
• SQL_EXE_UTIL
• SQL_EXEC_INSERT_RWRS
For definitions of SQL statement types, see
Appendix B: “STATEMENT_TYPE Field”
(page 73). The suffix _UNIQUE indicates
that the statement operates on a single row.
The suffix _NON_UNIQUE indicates that
the statement could operate on multiple
rows.
SERVICE_NAME
SEGMENT_ID
NODE_ID
SUBMIT_LCT_TS
SUBMIT_UTC_TS
COMPILE_START_LCT_TS
CHAR(128) DEFAULT
NULL
INTEGER UNSIGNED
DEFAULT NULL
SMALLINT UNSIGNED
DEFAULT NULL
TIMESTAMP(6)
DEFAULT NULL
TIMESTAMP(6)
DEFAULT NULL
TIMESTAMP(6) NO
DEFAULT
Name of service registered with Workload
Management Services (WMS).
Example: HP_DEFAULT_SERVICE
Segment number of the NDCS server that
reported the statistics.
The Master Executor process for the query
runs in this segment.
Example: 1
Processing node number of the NDCS server
that reported the statistics.
Example: 9
ANSI Timestamp, in Local Civil Time,
indicating when the query first entered
Workload Management Services (WMS).
Example: 2009-08-17 07:47:28.795755
ANSI Timestamp, in Coordinated Universal
Time, indicating when the query first entered
Workload Management Services (WMS).
Example: 2009-08-17 15:47:28.795755
ANSI Timestamp, in Local Civil Time,
indicating when query compilation began.
That is, when a Prepare statement was issued
for this query.
Example: 2009-08-17 07:47:28.791758
22 Repository Views
Page 23

Table 3-1 QUERY_STATS_VW2 Field Definitions (continued)
DescriptionData TypeField Name
COMPILE_START_UTC_TS
COMPILE_END_LCT_TS
COMPILE_END_UTC_TS
COMPILE_ELAPSED_TIME
COMPILE_ELAPSED_TIME_SEC
TIMESTAMP(6)
DEFAULT NULL
TIMESTAMP(6)
DEFAULT NULL
TIMESTAMP(6)
DEFAULT NULL
LARGEINT DEFAULT
NULL
FLOAT(54) DEFAULT
NULL
ANSI Timestamp, in Coordinated Universal
Time, indicating when query compilation
began. That is, when a Prepare statement
was issued for this query.
Example: 2009-08-17 15:47:28.791758
ANSI Timestamp, in Local Civil Time,
indicating when query compilation ended.
That is, when the Prepare statement
completed for this query.
Example: 2009-08-17 07:47:28.795259
ANSI Timestamp, in Coordinated Universal
Time, indicating when query compilation
ended. That is, when the Prepare statement
completed for this query.
Example: 2009-08-17 15:47:28.795259
Calculated compile time in microseconds,
computed as compilation end time minus
compilation start time. This is the amount of
time needed to prepare the query.
This value is obtained from the compiler.
Example: 3501
Compile time in seconds, computed as
compilation end time minus compilation
start time. This is the amount of time needed
to prepare the query.
This value is obtained from the compiler.
Example: 0.0035009999999999998
COMPILE_AFFINITY_NUM
COMPILE_DEGREE_OF_PARALLELISM
COMPILE_TRANSACTION_NEEDED
LARGEINT DEFAULT
NULL
INTEGER UNSIGNED
DEFAULT NULL
INTEGER UNSIGNED
DEFAULT NULL
Specifies the choice of CPU Subsets to be
used for placement of ESPs.. The value used
by the compiler for ESP placement for this
query.
Example: 697115338
Degree of parallelism used by the query. The
number of ESP operators that are reused to
parallelize a single fragment of the query
plan. If different fragments in the same plan
are parallelized to different extents, then this
counter reports the degree of parallelization
of the fragment that is parallelized the most.
Example: 0
Indicates whether this query is required to
execute under a transaction. All SQL
statements require a transaction except
SELECT statements that use the READ
UNCOMMITTED isolation level.
Values:
• 1 = True
• 0 = False
Query Statistics 23
Page 24

Table 3-1 QUERY_STATS_VW2 Field Definitions (continued)
DescriptionData TypeField Name
COMPILE_MANDATORY_CROSS_PRODUCT
COMPILE_MISSING_STATS
COMPILE_NUM_JOINS
COMPILE_FULL_SCAN_ON_TABLE
INTEGER UNSIGNED
DEFAULT NULL
INTEGER UNSIGNED
DEFAULT NULL
DEFAULT NULL
INTEGER UNSIGNED
DEFAULT NULL
Flags queries in which a join has been
specified with no predicates.
Joins with no predicates may result from
predicate movement during optimization or
simply because no predicate was specified
for the join.
Values:
• 1 = True
• 0 = False
Indicates whether single column missing
statistics warnings were raised during
compilation (SQLCODE 6008 or 6011).
Values:
• 1 = True
• 0 = False
Multi-column missing statistics warnings
(SQLCODE 6007 or 6010) are not flagged in
this field.
The number of joins in the query plan.INTEGER UNSIGNED
Indicates whether the query plan will
perform a full scan on at least one table.
Values:
• 1 = True
• 0 = False
COMPILE_ROWS_ACCESSED_FULL_SCAN
COMPILE_DISK_PROCESS_ROWS_ACCESSED
COMPILE_DISK_PROCESS_ROWS_USED
EST_COST
DOUBLE PRECISION
DEFAULT NULL
DOUBLE PRECISION
DEFAULT NULL
DOUBLE PRECISION
DEFAULT NULL
DOUBLE PRECISION
DEFAULT NULL
The estimated number of rows accessed by
a full scan of a table. Valid only if Full Scan
On Table is set.
If the query plan contains more than one full
scan operation, the largest number of rows
accessed by all scans is reported here.
Values:
• Largest number of rows accessed
• -1.0 – Full Scan on Table is not set.
• Zero (0.0) – A full scan was performed on
an empty table.
Estimated number of rows to be accessed by
all scan, insert, update and delete operations
in the query plan.
Example: 5.0
Estimated number of rows accessed by scan
and insert operations in the query plan.
Example: 2.0
Estimated total cost (time in seconds) of the
SQL operations for this query in the Master
Executor.The estimate occurs at the time the
query is prepared.
Example: 1.74125E-6
EST_CARDINALITY
24 Repository Views
DOUBLE PRECISION
NO DEFAULT
Estimated number of rows that will be
returned. The estimate occurs at the time the
query is prepared.
Example: 10.0
Page 25

Table 3-1 QUERY_STATS_VW2 Field Definitions (continued)
DescriptionData TypeField Name
EST_ACCESSED_ROWS
EST_USED_ROWS
EST_IO_TIME
EST_MSG_TIME
EST_IDLE_TIME
DOUBLE PRECISION
DEFAULT NULL
DOUBLE PRECISION
DEFAULT NULL
DOUBLE PRECISION
DEFAULT NULL
DOUBLE PRECISION
DEFAULT NULL
DOUBLE PRECISION
DEFAULT NULL
Estimated number of rows to be accessed by
SELECT statements from Disk Process at
runtime by EID (Executor in Disk Process).
For Insert/Update/Delete statements, the
value is reported as 0.0.
Estimated number of rows to be returned by
EID (Executor in Disk Process) after applying
selection predicates based on SELECT
statements. For Insert/Update/Delete
statements, the value is reported as 0.0.
Estimate of the number of seconds of I/O
time (seeks plus data transfer) to perform
the I/O for this query. The estimate occurs
at the time the query is prepared.
Example: 0.0
Estimate of the number of seconds required
for the messaging for this query, including
local and remote messages, and the amount
of data sent. The estimate occurs at the time
the query is prepared.
Example: 0.0
Estimate of the number of seconds to wait
for an operation to complete, (e.g., opening
a table or starting a process). The estimate
occurs at the time the query is prepared.
Example: 0.0
EST_NODE_TIME
EST_TOTAL_TIME
EST_TOTAL_MEM
EST_RESOURCE_USAGE
DOUBLE PRECISION
DEFAULT NULL
DOUBLE PRECISION
DEFAULT NULL
DOUBLE PRECISION
DEFAULT NULL
INTEGER DEFAULT
NULL
Estimate of the number of seconds of
processor time it might take to execute
instructions for this operator. The estimate
occurs at the time the query is prepared.
Example: 1.74125E-6
Estimated time in seconds for the SQL
operations for this query. This estimate
includes estimates of I/O time, Message time,
and Node time, and does not include Idle
time. The estimate occurs at the time the
query is prepared.
Example: 1.74125E-6
Estimate, in kilobytes, of the memory that
the query plan will use. The value is
computed based on operators that could
potentially consume large amounts of
memory: Hash Join, Hash Groupby, Sort,
Merge Join and Sequence.
Example: 0.0
Estimate of the number of seconds of
processor time it might take to execute the
query. The estimate occurs at the time the
query is prepared.
NOTE: For future use. Currently zero (0).
QAG_OPTION
QAG_TOTAL
CHAR(3) DEFAULT
NULL
NULL
Determines whether this is an aggregated
record. Yes/No
Total number of queries aggregated.LARGEINT DEFAULT
Query Statistics 25
Page 26

Table 3-1 QUERY_STATS_VW2 Field Definitions (continued)
DescriptionData TypeField Name
CONN_RULE
COMP_RULE
EXEC_RULE
QUERY_STATUS
QUERY_SUB_STATUS
NULL
NULL
NULL
CHAR(21) DEFAULT
NULL
CHAR(30) DEFAULT
NULL
Connection rule.CHAR(84) DEFAULT
Compilation rule.CHAR(84) DEFAULT
Execution rule.CHAR(84) DEFAULT
Status of the query. One of these:
INIT
COMPLETED
REJECTED
CANCELLED
Substatus of the query, dependent on
QUERY_STATUS
When QUERY_STATUS = COMPLETED or
CANCELLED, possible values for
QUERY_SUB_STATUS are:
• HOLD_TIMEOUT
• EXEC_TIMEOUT
• CANCELLED_BY_ADMIN
• QUERY_NOT_FOUND
• NDCS_PROCESS_FAILED
• CPU_FAILED
• SEGMENT_FAILED
• BY_EXEC_RULE
• SERVICE_NOT_ACTIVE
• UNEXPECTED_STATE
• CLIENT_DISAPPEARED
• CONNECTION_FAILED
When QUERY_STATUS = REJECTED,
possible values for QUERY_SUB_STATUS
are:
• BY_ADMIN
• CONNECTION_FAILED
• HOLD_TIMEOUT
• WAIT_TIMEOUT
• NDCS_PROCESS_FAILED
• CPU_FAILED
• SEGMENT_FAILED
• QUEUE_MSG_CANCELLED
• VERSION_MISMATCH
• WMS_ON_HOLD
• MAX_QUERIES_REACHED
• SERVICE_NOT_FOUND
• SERVICE_ON_HOLD
• BY_COMP_RULE
• UNKNOWN_USER
• CLIENT_DISAPPEARED
• UNEXPECTED_STATE
For more information, refer to the Neoview
Workload Management Services Guide.
26 Repository Views
Page 27

Table 3-1 QUERY_STATS_VW2 Field Definitions (continued)
DescriptionData TypeField Name
QUERY_EXECUTION_STATE
WARN_LEVEL
STATS_ERROR_CODE
CHAR(25) DEFAULT
NULL
CHAR(7) DEFAULT
NULL
INTEGER DEFAULT
NULL
What the executor is doing. Possible query
states include:
INITIAL
OPEN
EOF
CLOSE
DEALLOCATED
FETCH
CLOSE_TABLES
PROCESS_ENDED
UNKNOWN
NULL
Warning level from WMS. Possible levels
include:
LOW
MEDIUM
HIGH
NONE
SQL error code, if any, returned while
obtaining statistics for the query. Indicates
whether the query completed with warnings,
errors or successfully:
• Positive number – Warning
For example, warning 8922 – one or more
nodes did not report statistics for this
query.
• Negative number – Error
• Zero (0) or 100 – Success
WAIT_TIME
HOLD_TIME
QUERY_ELAPSED_TIME
QUERY_ELAPSED_TIME_SEC
LARGEINT DEFAULT
NULL
LARGEINT DEFAULT
NULL
LARGEINT DEFAULT
NULL
FLOAT(54) DEFAULT
NULL
Query wait time in seconds. The amount of
time a query waited in WMS for a resource
(for example, CPU time) to become available
for the query to start executing.
Query hold time in seconds. The amount of
time the query spent in a WMS queue in a
HOLDING or SUSPENDED state due to:
• Rules configured in WMS.
• An external attempt to hold the query,
such as a HOLD QUERY command
issued from NCI by a WMS
administrator.
This counter is updated during the time
before the query starts executing.
Elapsed clock time in microseconds from the
time the query started executing to the time
the results were sent back.
Example: 31169481
Elapsed clock time, in seconds, from the time
the query started executing to the time the
results were sent back.
Example: 311694
Query Statistics 27
Page 28

Table 3-1 QUERY_STATS_VW2 Field Definitions (continued)
DescriptionData TypeField Name
SQL_PROCESS_BUSY_TIME
SQL_PROCESS_BUSY_TIME_SEC
DISK_PROCESS_BUSY_TIME
DISK_PROCESS_BUSY_TIME_SEC
DISK_IOS
LARGEINT DEFAULT
NULL
FLOAT(54) DEFAULT
NULL
LARGEINT DEFAULT
NULL
FLOAT(54) DEFAULT
NULL
LARGEINT DEFAULT
NULL
INTEGERNUM_SQL_PROCESSES
An approximation, in microseconds, of the
total node time spent in the Master Executor
process and all ESPs involved in the query.
This is a cumulative value, across all ESPs
across all segments.
Example: 31.169480999999998
An approximation, in seconds, of the total
node time spent in the Master Executor
process and all ESPs involved in the query.
This value is cumulative across all ESPs
across all segments.
Example: 39593
Cumulative node busy time in microseconds
for all disk processes involved in executing
the query.
Example: 0.039592999999999996
Cumulative node busy time, in seconds, for
all disk processes involved in executing the
query.
Example: : 0.000000039592999999999996
Number of physical disk I/O operations
(reads or writes) caused by accessing this
table.
The number of SQL processes involved in
execution of this query.
SQL_MEMORY_SPACE_ALLOCATED
SQL_MEMORY_SPACE_USED
SQL_MEMORY_HEAP_ALLOCATED
SQL_MEMORY_HEAP_USED
LARGEINT DEFAULT
NULL
LARGEINT DEFAULT
NULL
LARGEINT DEFAULT
NULL
LARGEINT DEFAULT
NULL
Amount of “space” type (static) memory, in
kilobytes, allocated (reserved) for query
processes (master executor and ESPs) at the
beginning of query execution. This value
stays constant for the duration of query
execution.
Amount of “space” type (static) memory, in
kilobytes, allocated (reserved) for query
processes (master executor and ESPs) at the
beginning of query execution.
This value stays constant for the duration of
query execution. It should be less than or
equal to the SQL_MEMORY_SPACE_
ALLOCATED value. This is the value at the
end of query execution.
Amount of “heap” type (dynamic) memory,
in kilobytes, allocated (reserved) for query
processes (master executor and ESPs) at the
beginning of query execution. The processes
that execute the query request this memory
during execution, thus the amount can
change as the query runs. This is the value
at the end of query execution.
Amount of “heap” type (dynamic) memory,
in kilobytes, actually used for query
processes (master executor and ESPs) during
query execution. This is the value at the end
of query execution.
28 Repository Views
Page 29

Table 3-1 QUERY_STATS_VW2 Field Definitions (continued)
DescriptionData TypeField Name
EXECUTOR_IN_DISK_MEMORY_
SPACE_ALLOCATED
EXECUTOR_IN_DISK_MEMORY_
SPACE_USED
EXECUTOR_IN_DISK_MEMORY_
HEAP_ALLOCATED
EXECUTOR_IN-DISK_MEMORY_
HEAP_USED
TOTAL_MEMORY_ALLOCATED
LARGEINT DEFAULT
NULL
LARGEINT DEFAULT
NULL
LARGEINT DEFAULT
NULL
LARGEINT DEFAULT
NULL
LARGEINT DEFAULT
NULL
Amount of “space” type (static) memory, in
kilobytes, allocated (reserved) for the
Executor in Disk (EID) disk processes
involved in query execution. This process is
separate from master and ESPs, and all the
EID memory values are in addition to the
SQL memory values. This is the value at the
end of query execution.
Amount of “space” type (static) memory, in
kilobytes, actually used by the Executor in
Disk (EID) disk processes involved in query
execution. This is the value at the end of
query execution.
Amount of “heap” type (dynamic) memory,
in kilobytes, allocated for the Executor in
Disk (EID) disk processes involved in query
execution. This is the value at the end of
query execution.
Amount of “heap” type (dynamic) memory,
in kilobytes, actually used for the Executor
in Disk (EID) processes involved in query
execution. This is the value at the end of
query execution
Total memory allocated to the query. The
sum of SQL_MEMORY_SPACE_USED and
SQL_MEMORY_HEAP_USED.
MAX_MEMORY_EVER_USED
TRANSACTION_ID
NUM_REQUEST_MSGS
NUM_REQUEST_MSG_BYTES
NUM_REPLY_MSGS
NUM_REPLY_MSG_BYTES
FIRST_RESULT_RETURN_LCT_TS
FIRST_RESULT_RETURN_UTC_TS
ROWS_RETURNED_TO MASTER
LARGEINT DEFAULT
NULL
CHAR(25) DEFAULT
NULL
LARGEINT DEFAULT
NULL
LARGEINT DEFAULT
NULL
NULL
LARGEINT DEFAULT
NULL
TIMESTAMP(6)
DEFAULT NULL
TIMESTAMP(6)
DEFAULT NULL
LARGEINT DEFAULT
NULL
Maximum memory, in kilobytes, ever used
during the lifetime of the query.
Transaction identifier, in internal format, of
the transaction involved in executing the
query.
Count of messages that are initiated from
the Master Executor process to ESPs or ESP
to ESP. This count includes both control and
data messages.
Number of message bytes sent as part of
NUM_REQUEST_MSGS.
Count of reply messages from ESPs.LARGEINT DEFAULT
Number of bytes sent as part of the replies
from ESPs.
RMS timestamp in Local Civil Time when
SQL sends the first result row to the Master
Executor process.
RMS timestamp in Coordinated Universal
Time when SQL sends the first result row to
the Master Executor process.
Number of rows returned from the root
operator to the Master Executor process and
to the application in both the regular fetch
and rowset fetch.
Query Statistics 29
Page 30

Table 3-1 QUERY_STATS_VW2 Field Definitions (continued)
DescriptionData TypeField Name
PARENT_QUERY_ID
EXEC_END_LCT_TS
EXEC_END_UTC_TS
MASTER_EXECUTION_TIME
CHAR(160) DEFAULT
NULL
TIMESTAMP(6)
DEFAULT NULL
TIMESTAMP(6)
DEFAULT NULL
LARGEINT DEFAULT
NULL
Query ID for the immediate parent of this
query ID. If the parent query ID is not
present, value returned is NONE.
TIP: You can use the parent query ID to
relate a child SQL statement to an immediate
parent, then trace the relationship to find the
original SQL statement.
ANSI Timestamp in Local Civil Time
indicating when query execution ended.
Example: 2009-08-17 07:47:59.964873
ANSI Timestamp in Coordinated Universal
Time indicating when query execution
ended.
Example: 2009-08-17 15:47:59.964873
TIP: You can use this value to monitor
whether the query is still running.
Node processing time, in microseconds, from
the time the execution starts to the time the
results are returned. It does not include CPU
time consumed by SQL executor child
processes (ESPs) or disk processes for the
query.
Example: 40214
MASTER_EXECUTION_TIME_SEC
ERROR_CODE
SQL_ERROR_CODE
ERROR_TEXT
LAST_ERROR_BEFORE_AQR
FLOAT(54) DEFAULT
NULL
INTEGER DEFAULT
NULL
INTEGER DEFAULT
NULL
CHAR(200) DEFAULT
NULL
INTEGER DEFAULT
NULL
Node processing time, in seconds, from the
time the execution starts to the time the
results are returned. It does not include CPU
time consumed by SQL executor child
processes (ESPs) or disk processes for the
query.
Example: 0.040214
Query error code returned to the client. If
the NDCS process stops or fails, this field is
set to 201. In this case, the last statistics
available from WMS are retrievable with this
view.
Top–level error code returned by the query.
Values:
• 100 – completed SELECT, UPDATE, or
DELETE statements with actual end
statistics
• zero (0) – completed INSERT queries or
uncompleted queries
• negative number – an execution-type
error
Message text of the error returned by SQL.
See SQL_ERROR_CODE.
Last error code that caused the query to be
automatically retried.
DELAY_TIME_BEFORE_AQR_SEC
TOTAL_NUM_AQR_RETRIES
30 Repository Views
LARGEINT DEFAULT
NULL
LARGEINT DEFAULT
NULL
Delay time in seconds before the query was
automatically retried.
Total number of times that a query was
retried.
Page 31

Table 3-1 QUERY_STATS_VW2 Field Definitions (continued)
DescriptionData TypeField Name
LOCK_ESCALATIONS
LOCK_WAITS
MESSAGE_BYTES_TO_DISK
MESSAGES_TO_DISK
ROWS_ACCESSED
ROWS_RETRIEVED
NUM_ROWS_IUD
NUM_OPENS
LARGEINT DEFAULT
NULL
LARGEINT DEFAULT
NULL
LARGEINT DEFAULT
NULL
LARGEINT DEFAULT
NULL
LARGEINT DEFAULT
NULL
LARGEINT DEFAULT
NULL
LARGEINT DEFAULT
NULL
LARGEINT DEFAULT
NULL
Cumulative number of times record (row)
locks were escalated to file (table) locks
during query execution.
Number of times the statement waited for a
lock request (concurrency cost). Access to
the table is delayed due to conflicting locks.
Ideally, this number is zero or very small.
Size, in bytes, of the total number of
messages sent to the Encapsulated SQL
Access Manager (ESAM).
Number of messages sent to ESAM. That is,
the number of messages exchanged between
the file system and the disk process.
Cumulative number of rows accessed in each
table to evaluate the statement. This includes
records examined by the disk process, the
file system, and the SQL Executor.
Cumulative number of rows retrieved and/or
actually used. Number of rows that were
returned by Executor in Disk (EID) process.
Number of rows actually inserted, updated,
deleted in the base tables, by a query.
The number of OPEN partition calls
performed by the SQL Executor on behalf of
this query.
OPEN_BUSY_TIME
OPEN_BUSY_TIME_SEC
PROCESSES_CREATED
PROCESS_CREATE_BUSY_TIME
PROCESS_CREATE_BUSY_TIME_SEC
SQL_TEXT
SQL_TEXT_OVERFLOW_INDICATOR
LARGEINT DEFAULT
NULL
FLOAT(54) DEFAULT
NULL
INTEGER UNSIGNED
DEFAULT NULL
LARGEINT NO
DEFAULT
FLOAT(54) DEFAULT
NULL
CHAR(254) DEFAULT
NULL
SMALLINT UNSIGNED
DEFAULT NULL
Time in microseconds this process spent
doing file OPENs.
Time in seconds this process spent doing file
OPENs.
Number of new processes created by the
Executor on behalf of this process.
Time in microseconds the Executor spent
creating new processes.
Time in seconds the Executor spent creating
new processes.
The first 254 characters of query SQL text. If
query text is longer than 254 characters, the
entire query text is available in “VIEW
NEO.HP_METRICS.SQL_TEXT_VW1”
(page 32).
Indicates the status of the SQL_TEXT field:
• zero (0)– all SQL Text for the query is in
this field.
• 1 – only a preview (the first 254
characters) of the text is in the SQL_TEXT
field and the entire query text is stored in
“VIEW
NEO.HP_METRICS.SQL_TEXT_VW1”
(page 32)
Query Statistics 31
Page 32

VIEW NEO.HP_METRICS.SQL_TEXT_VW1
This view allows access to the complete SQL text for a query.
When the SQL text for a query is 254 characters or fewer, the text is written to the
QUERY_STATS_VW1 view and the SQL_TEXT_OVERFLOW_INDICATOR field is set to 0. If the
text is longer, the first 254 characters are written to QUERY_STATS_VW1 and
SQL_TEXT_OVERFLOW_INDICATOR is set to 1, indicating that the complete SQL text is found
in the SQL_TEXT field of SQL_TEXT_VW1. In SQL_TEXT_VW1, each row of SQL text can contain
up to 16000 characters. If the complete query text is written across multiple rows,
FRAGMENT_NUMBER is incremented for each row, starting with 0.
Character columns use ISO88591 or UCS2 encoding, as appropriate to the Neoview platform
configuration. If the platform is UCS2 or SJIS, all character columns are created with CHARACTER
SET UCS2. If the platform is ISO88591, all CHAR columns are created with CHARACTER SET
ISO88591.
The primary key for SQL_TEXT_VW1 field definition is QUERY_ID and FRAGMENT_NUMBER.
Table 3-2 SQL_TEXT_VW1 Field Definitions
DescriptionData TypeField Name
FRAGMENT_NUMBER
TIMESTAMP(6) NO DEFAULTEXEC_START_LCT_TS
TIMESTAMP(6) NO DEFAULTEXEC_START_UTC_TS
CHAR(160) NO DEFAULTQUERY_ID
SMALLINT UNSIGNED NO
DEFAULT
Primary Key
ANSI timestamp, in Local Civil Time,
indicating when query execution began
(that is, the time when an execute
statement is issued for the prepared
query).
Example: 2010–02–02 07:47:28.795392
Primary Key
ANSI timestamp, in Coordinated
Universal Time, indicating when query
execution began.
Example: 2010–02–02 15:47:28.795392
Primary Key
A unique identifier for this SQL
statement, generated by Neoview SQL
compiler.
Primary Key
Number of the row for a section of
query text, starting with zero (0). 16000
characters of query text are written per
row.
32 Repository Views
CHAR(16) DEFAULT NULLSEGMENT_NAME
Name of the Neoview platform segment
used by the datasource to connect and
start the query. The Master Executor
process for the query is running in this
segment. For example, \NEO0101.
Page 33

Table 3-2 SQL_TEXT_VW1 Field Definitions (continued)
DescriptionData TypeField Name
CHAR(64) DEFAULT NULLPLATFORM_NAME
VARCHAR(16000) DEFAULT NULLSQL_TEXT
ODBC Session Data
The two views used for retrieval of ODBC session statistics differ in that one
(NEO.HP_METRICS.ODBC_SESSION_STATS_V1) preserves separate rows for data collected
at the start and end of an ODBC Statement Execute, whereas the other
(NEO.HP_METRICS.ODBC_SESSION_STATS_V2) combines all statistics pertaining to the session
in a single row.
VIEW NEO.HP_METRICS.ODBC_SESSION_STATS_V1
This view preserves separate rows for data collected at the start and end of a session.
If information is not available for a field (because the record represents the start of a session and
the field is not populated until the end), the value in that field is NULL. To distinguish easily
between start and end records, you can filter results according to the value of SESSION_STATUS.
Character columns use ISO88591 or UCS2 encoding, as appropriate to the Neoview platform
configuration. If the platform is UCS2 or SJIS, all character columns are created with CHARACTER
SET UCS2. If the platform is ISO88591, all CHAR columns are created with CHARACTER SET
ISO88591.
The primary key for ODBC_SESSION_STATS_V1 field definition is SEGMENT_ID, NODE_ID,
and SESSION_EVENT_DATETIME_UTC.
Neoview system name, made up of the
first three letters of the system name,
followed by 01 for the first platform at
your site, 02 for the second platform at
your site, and so on. For example,
NEO01.
Complete SQL Text for a query. 16000
characters are written per row.
TIP: The full SQL text can be joined to
the query statistics by joining on the
QUERY_ID field.
Table 3-3 ODBC_SESSION_STATS_V1 Field Definitions
INTEGER UNSIGNEDSEGMENT_ID
INTEGER UNSIGNEDNODE_ID
TIMESTAMP(6)SESSION_EVENT_DATETIME
DATESESSION_EVENT_DATE
TIME(6)SESSION_EVENT_TIME
DescriptionData TypeField Name
Segment number of the NDCS
server that reported the
statistics.
Processing node number of the
NDCS server that generated the
session.
ANSI SQL Timestamp, in Local
Civil Time, indicating when the
statistics were recorded in the
Repository.
ANSI SQL date, in Local Civil
Time, when the statistics were
recorded in the Repository.
ANSI SQL time, in Local Civil
Time, when the statistics were
recorded in the Repository.
ODBC Session Data 33
Page 34

Table 3-3 ODBC_SESSION_STATS_V1 Field Definitions (continued)
DescriptionData TypeField Name
TIMESTAMP(6)SESSION_EVENT_DATETIME_UTC
DATESESSION_EVENT_DATE_UTC
TIME(6)SESSION_EVENT_TIME_UTC
CHAR(108)SESSION_ID
SMALLINT UNSIGNEDSEQUENCE_NUM
INTEGER UNSIGNEDMETRIC_CLASS_ID
ANSI SQL Timestamp, in
Coordinated Universal Time,
indicating when the statistics
were recorded in the
Repository.
ANSI SQL date, in Coordinated
Universal Time, when the
statistics were recorded in the
Repository.
ANSI SQL time, in Coordinated
Universal Time, when the
statistics were recorded in the
Repository.
Unique session ID generated by
the NDCS server when the
connection was established. For
information about the format,
see the note after this table.
Message sequence number
generated by NDCS.
Numbering starts at 0 and is
incremented by 1 for each new
record.
Repository-assigned value.
Used internally.
INTEGER UNSIGNEDMETRIC_CLASS_VERSION
LARGEINTTOTAL_CATALOG_STMTS
LARGEINTTOTAL_CLOSES
LARGEINTTOTAL_DELETE_STMTS_EXECUTED
LARGEINTTOTAL_ERRORS
LARGEINTTOTAL_EXECDIRECTS
LARGEINTTOTAL_EXECUTES
Repository-assigned value.
Used internally.
Total number of SQL catalog
statements sent by the HP
ODBC driver to the NDCS SQL
server.
Total number of SQL CLOSE
calls sent by the HP ODBC
driver to the NDCS SQL server.
Total number of SQL DELETE
statements sent by the HP
ODBC driver to the NDCS SQL
server. Does not include
internally generated SQL
statements.
Totalnumber of SQL statement
execution errors detected by the
NDCS SQL server.
Totalnumber of SQLExecDirect
calls.
Total number of SQLExecute
calls.
Totalnumber of SQLFetch calls.LARGEINTTOTAL_FETCHES
34 Repository Views
Page 35

Table 3-3 ODBC_SESSION_STATS_V1 Field Definitions (continued)
DescriptionData TypeField Name
LARGEINTTOTAL_INSERT_STMTS_EXECUTED
LARGEINTTOTAL_ODBC_ELAPSED_TIME
LARGEINTTOTAL_MASTER_EXEC_EXECUTION_TIME
LARGEINTTOTAL_PREPARES
LARGEINTTOTAL_SELECT_STMTS_EXECUTED
Total number of SQL INSERT
statements sent by the HP
ODBC driver to the NDCS SQL
server. Does not include
internally generated SQL
statements.
Total NDCS server real time, in
microseconds, from the time the
connection started to the time
it was closed.
Total NDCS server CPU time,
in microseconds, from the time
the connection started to the
time it was closed. Does not
include Neoview SQL compile
time.
Total number of SQLPrepare
calls.
Total number of SQL SELECT
statements sent by the HP
ODBC driver to the NDCS SQL
server. Does not include
internally generated SQL
statements.
LARGEINTTOTAL_UPDATE_STMTS_EXECUTED
LARGEINTTOTAL_WARNINGS
INTEGER UNSIGNEDPIN
SMALLINT UNSIGNEDSTART_PRIORITY
CHAR(5)SESSION_STATUS
CHAR(130)APPLICATION_ID
CHAR(15)CLIENT_ID
Total number of SQL UPDATE
statements sent by the HP
ODBC driver to the NDCS SQL
server. Does not include
internally generated SQL
statements.
Totalnumber of SQL statement
warnings detected by the
NDCS SQL server.
Process identification number
of the NDCS server.
Execution priority of the NDCS
process at the time the
connection request was
received.
START if this record contains
information collected at the
start of the session, or END if it
contains statistics collected at
the end of the session.
Client application name or
main window caption.
Client workstation TCP/IP or
NetBios/network name.
CHAR(20)COMPONENT_NAME
CHAR(128)DATASOURCE
Name of the NDCS component
to which the statistics apply, for
example, ODBC_Server.
Client data source name used
at the time of the connection.
ODBC Session Data 35
Page 36

Table 3-3 ODBC_SESSION_STATS_V1 Field Definitions (continued)
DescriptionData TypeField Name
CHAR(10)SEGMENT_NAME
CHAR(18)PROCESS_NAME
CHAR(8)USER_ID
CHAR(20)USER_NAME
LARGEINTTOTAL_LOGIN_ELAPSED_TIME_MCSEC
LARGEINTLDAP_LOGIN_ELAPSED_TIME_MCSEC
Name of the Neoview segment
used by the data source.
Process name of the NDCS
server.
A deprecated internal
representation of a Neoview
role.
The name, used at time of
connection, to identify a
Neoview user. One or more
such names can map internally
to the same Neoview role.
Time in microseconds spent on
login, including processing
steps on the Neoview platform
and, for database (LDAP) users,
time required for interaction
with the external authentication
server.
This metric does not include
processing steps on the
workstation where the logon
occurred.
Time in microseconds spent on
communication with the
external authentication server,
including time waiting for
replies from the server. For
platform users, such as
super-user or SecurityAdmin,
the value is 0.
CHAR(128) or NCHAR(128)CLIENT_USER_NAME
VIEW NEO.HP_METRICS.ODBC_SESSION_STATS_V2
The Repository stores a start and end row for each ODBC statement EXECUTE (active or
historical). To access the rows separately, use ODBC_SESSION_STATS_V1. In contrast, the view
ODBC_SESSION_STATS_V2 converts this information so that a single row provides complete
information about the start and the end of a session for COMPLETED session.
You can also use this view to extract UNTERMINATED queries sessions. UNTERMINATED
sessions are sessions that are still active or that terminated abnormally.
This table indicates which fields are present for completed and incomplete sessions. The source
of data fields indicates whether the value is collected at the start of the session or at the end.
Unless indicated here, field descriptions are those provided above for ODBC_SESSION_STATS_V1.
Character columns use ISO88591 or UCS2 encoding, as appropriate to the Neoview platform
configuration. If the platform is UCS2 or SJIS, all character columns are created with CHARACTER
SET UCS2. If the platform is ISO88591, all CHAR columns are created with CHARACTER SET
ISO88591.
The LDAP name of the user
who originated the session by
logging in to a workstation. If
the name is not available from
the ODBC driver, this field is
NULL.
36 Repository Views
Page 37

The primary key for ODBC_SESSION_STATS_V2 field definition is SEGMENT_ID, NODE_ID,
and SESSION_EVENT_DATETIME_UTC.
Table 3-4 ODBC_SESSION_STATS_V2 Fields
Source and
NotesData TypeIncomplete SessionsComplete Sessions
STARTCHAR(10)SEGMENT_NAMESEGMENT_NAME
STARTINTEGER UNSIGNEDSEGMENT_IDSEGMENT_ID
STARTINTEGER UNSIGNEDNODE_IDNODE_ID
STARTINTEGER UNSIGNEDPINPIN
SESSION_START_DATETIME_UTC
START_PRIORITYSTART_PRIORITY
SEQUENCE_NUMSEQUENCE_NUM
_UTC
SMALLINT
UNSIGNED
UNSIGNED
END, or
NULL for an
incomplete
session
STARTCHAR(18)PROCESS_NAMEPROCESS_NAME
STARTCHAR(108)SESSION_IDSESSION_ID
STARTCHAR(8)USER_IDUSER_ID
STARTCHAR(20)USER_NAMEUSER_NAME
STARTCHAR(15)CLIENT_IDCLIENT_ID
STARTCHAR(130)APPLICATION_IDAPPLICATION_ID
STARTCHAR(20)COMPONENT_NAMECOMPONENT_NAME
STARTCHAR(128)DATASOURCEDATASOURCE
STARTSMALLINT
STARTTIMESTAMPSESSION_START_DATETIMESESSION_START_DATETIME
STARTDATESESSION_START_DATESESSION_START_DATE
STARTTIMESESSION_START_TIMESESSION_START_TIME
STARTTIMESTAMPSESSION_START_DATETIME
SESSION_END_DATETIME_UTC
UTC
STARTDATESESSION_START_DATE_UTCSESSION_START_DATE_UTC
STARTTIMESESSION_START_TIME_UTCSESSION_START_TIME_UTC
TIMESTAMPSESSION_START_DATETIMESESSION_END_DATETIME
DATESESSION_END_DATESESSION_END_DATE
TIMESESSION_ END _TIMESESSION_ END _TIME
TIMESTAMPSESSION_START_DATETIME_
ODBC Session Data 37
END, or
NULL for an
incomplete
session
END, or
NULL for an
incomplete
session
END, or
NULL for an
incomplete
session
END, or
NULL for an
incomplete
session
Page 38

Table 3-4 ODBC_SESSION_STATS_V2 Fields (continued)
Source and
NotesData TypeIncomplete SessionsComplete Sessions
DATESESSION_END_DATE_UTCSESSION_END_DATE_UTC
TIMESESSION_ END _TIME_UTCSESSION_ END _TIME_UTC
CHAR(14)SESSION_STATESESSION_STATE
LARGEINTTOTAL_CATALOG_STMTS
LARGEINTTOTAL_CLOSES
LARGEINTTOTAL_DELETE_STMTS_EXECUTED
LARGEINTTOTAL_ERRORS
END, or
NULL for an
incomplete
session
END, or
NULL for an
incomplete
session
'INCOMPLETE'
or
'COMPLETE'
END, or
NULL for an
incomplete
session
END, or
NULL for an
incomplete
session
END, or
NULL for an
incomplete
session
END, or
NULL for an
incomplete
session
LARGEINTTOTAL_EXECDIRECTS
LARGEINTTOTAL_EXECUTES
LARGEINTTOTAL_FETCHES
LARGEINTTOTAL_INSERT_STMTS_EXECUTED
LARGEINTTOTAL_ODBC_ELAPSED_TIME
LARGEINTTOTAL_MASTER_EXECUTION_TIME
END, or
NULL for an
incomplete
session
END, or
NULL for an
incomplete
session
END, or
NULL for an
incomplete
session
END, or
NULL for an
incomplete
session
END, or
NULL for an
incomplete
session
END, or
NULL for an
incomplete
session
38 Repository Views
Page 39

Table 3-4 ODBC_SESSION_STATS_V2 Fields (continued)
Source and
NotesData TypeIncomplete SessionsComplete Sessions
LARGEINTTOTAL_PREPARES
LARGEINTTOTAL_SELECT_STMTS_EXECUTED
LARGEINTTOTAL_UPDATE_STMTS_EXECUTED
LARGEINTTOTAL_WARNINGS
LARGEINTTOTAL_LOGIN_ELAPSED_TIME_MCSEC
END, or
NULL for an
incomplete
session
END, or
NULL for an
incomplete
session
END, or
NULL for an
incomplete
session
END, or
NULL for an
incomplete
session
Time in
microseconds
spent on login,
including
processing
steps on the
Neoview
platform and,
for database
(LDAP) users,
time required
for interaction
with the
external
authentication
server.
This metric
does not
include
processing
steps on the
workstation
where the
logon
occurred.
ODBC Session Data 39
Page 40

Table 3-4 ODBC_SESSION_STATS_V2 Fields (continued)
Source and
NotesData TypeIncomplete SessionsComplete Sessions
CLIENT_USER_NAME
LARGEINTLDAP_LOGIN_ELAPSED_TIME_MCSEC
CHAR(128) or
NCHAR(128)
Time in
microseconds
spent on
communication
with the
external
authentication
server,
including time
waiting for
replies from
the server. For
platform users,
such as
super-user or
SecurityAdmin,
the value is 0.
The LDAP
name of the
user who
originated the
session by
logging in to a
workstation. If
the name is
not available
from the
ODBC driver,
this field is
NULL.
Processing Node Statistics
The Repository stores one row for each probe of a processing node (CPU). By default, the probe
interval is five minutes.
NOTE: A probe, in this context, is a statistics gathering session initiated by the Repository.
VIEW NEO.HP_METRICS.NODE_STATS_V1
Except where noted, processing-node counters are allocated and initialized only when the
processing node is loaded—when the platform is started or a processing node is restarted for
any reason—not at the start of each measurement.
All CHARACTER fields contain ISO88591-encoded data, regardless of the underlying Neoview
platform configuration.
The primary key for the NODE_STATS_V1 field definition is SEGMENT_ID, NODE_ID, and
MEASURE_END_DATETIME_UTC.
Table 3-5 NODE_STATS_V1 Field Definitions
INTEGER UNSIGNEDSEGMENT_ID
DescriptionData TypeField Name
Segment number of the
processing node being
measured.
40 Repository Views
Processing node number.INTEGER UNSIGNEDNODE_ID
Page 41

Table 3-5 NODE_STATS_V1 Field Definitions (continued)
DescriptionData TypeField Name
TIMESTAMP(6)MEASURE_END_DATETIME
DATEMEASURE_END_DATE
TIME(6)MEASURE_END _TIME
TIMESTAMP(6)MEASURE_END _DATETIME_UTC
DATEMEASURE_END _DATE_UTC
TIME(6)MEASURE_END _TIME_UTC
TIMESTAMP(6)MEASURE_START_DATETIME
DATEMEASURE_START_DATE
ANSI SQL timestamp, in Local
Civil Time, indicating when the
measurement interval ended.
ANSI SQL date, in Local Civil
Time, indicating when the
measurement interval ended.
ANSI SQL time, in Local Civil
Time, indicating when the
measurement interval ended.
ANSI SQL timestamp, in
Coordinated Universal Time,
indicating when the
measurement interval ended.
ANSI SQL date, in Coordinated
Universal Time, indicating when
the measurement interval ended.
ANSI SQL time, in Coordinated
Universal Time, indicating when
the measurement interval ended.
ANSI SQL timestamp, in Local
Civil Time, indicating when the
measurement interval began.
ANSI SQL date, in Local Civil
Time, indicating when the
measurement interval began.
TIME(6)MEASURE_START _TIME
TIMESTAMP(6)MEASURE_START _DATETIME_UTC
DATEMEASURE_START _DATE_UTC
TIME(6)MEASURE_START _TIME_UTC
LARGEINTDELTA_TIME
LARGEINTNODE_BUSY_TIME
ANSI SQL time, in Local Civil
Time, indicating when the
measurement interval began.
ANSI SQL timestamp, in
Coordinated Universal Time,
indicating when the
measurement interval began.
ANSI SQL date, in Coordinated
Universal Time, indicating when
the measurement interval began.
ANSI SQL time, in Coordinated
Universal Time, indicating when
the measurement interval began.
Duration of the measurement in
microseconds.
Neoview segment name.CHARACTER(8)SEGMENT_NAME
UP or DOWN.CHARACTER(4)NODE_STATUS
Totalmemory size in megabytes.SMALLINT UNSIGNEDMEMORY_MB
Time, in microseconds, during
which the processing node was
busy.
LARGEINTNODE_QUE_TIME
Time, in microseconds, that
processes spent on the ready list.
Processing Node Statistics 41
Page 42

Table 3-5 NODE_STATS_V1 Field Definitions (continued)
DescriptionData TypeField Name
LARGEINTDISPATCHES
LARGEINTSWAPS
LARGEINTINTR_BUSY_TIME
LARGEINTDISC_IOS
LARGEINTCACHE_HITS
LARGEINTSTARTING_FREE_MEM
LARGEINTENDING_FREE_MEM
LARGEINTSVNET_READ_BYTES1
Number of times a process was
selected from the ready list and
executed by the processing node.
Number of swap operations,
both into and out of memory,
performed by the memory
manager.
Time, in microseconds, that the
processing node spent executing
interrupt handlers.
Number of I/O disk transfers
performed by disk processes in
this processing node.
Number of times the required
block was found in cache during
an I/O operation.
Number of free memory frames
(physical pages) when the
processing node was loaded.
Number of free memory frames
(physical pages) at the end of the
measurement interval.
Number of bytes read by this
processing node, if NODE_ID is
1. Othewise, this field is not
populated.
LARGEINTSVNET_WRITE_BYTES1
LARGEINTSVNET_READ_BYTES16
LARGEINTSVNET_WRITE_BYTES16
Disk Statistics
The view DISK_STATS_V1 provides access to data describing the availability, utilization, and
performance of disk volumes. The sampling interval and the set of disks represented in the view
are determined by the Neoview Management Dashboard configuration.
VIEW NEO.HP_METRICS.DISK_STATS_V1
In this view, all CHARACTER columns use ISO88591 encoding, regardless of the underlying
Neoview platform configuration.
The primary key for DISK_STATS_V1 field definition is SUBMIT_TS, SEGMENT_ID, and
VOLUME_NAME.
Number of bytes written by this
processing node, if NODE_ID is
1. Othewise, this field is not
populated.
Number of bytes read by this
processing node, if NODE_ID is
16. Othewise, this field is not
populated.
Number of bytes written by this
processing node, if NODE_ID is
16. Othewise, this field is not
populated.
42 Repository Views
Page 43

Table 3-6 DISK_STATS_V1 Field Definitions
DescriptionData TypeField Name
TIMESTAMP(6)SUBMIT_TS
SMALLINT UNSIGNEDNODE_ID
SMALLINT UNSIGNEDPIN
DECIMAL(6,1)FULL_PCT
INTEGERCAPACITY
CHAR(12)PRIMARY_STATE
Timestamp, in Local Civil Time,
indicating when the measurement was
submitted to the Repository
Neoview platform segment numberSMALLINT UNSIGNEDSEGMENT_ID
Logical disk volume nameCHAR(8)VOLUME_NAME
Primary processing node number of
the disk process for this volume
Process identification number of the
disk process for this volume
Neoview platform segment nameCHAR(8)SEGMENT_NAME
Duration of the sample intervalINTERVAL SECOND(12,6)SAMPLE_ELAPSED_TIME
Percentage of disk space currently in
use
Available disk space, in megabytesDECIMAL(12,1)AVAILABLE_SPACE
Total capacity of this volume, in
megabytes
State of the primary disk, one of:
'Up'
'Down'
'Special'
'Mounted'
'Reviving'
'Testing'
'Exclusive'
'Hard down'
'Formatting'
'No processor'
CHAR(12)MIRROR_STATE
CHAR(2)PRIMARY_PATH
CHAR(2)MIRROR_PATH
SMALLINT UNSIGNEDTOT_BLOCK_SPLITS
SMALLINT UNSIGNEDCACHE_HITS_PER_SEC
DECIMAL(7,2)RECEIVE_QUEUE_LEN_PCT
State of the mirror disk (see
PRIMARY_STATE for possible values)
Path in use for communication with
the primary disk, one of:
• 'P' — Primary path in use
• 'B' — Backup path in use
• '-' — Neither path in use
Path in use for communication with
the mirror disk, one of:
• 'P' — Primary path in use
• 'B' — Backup path in use
• '-' — Neither path in use
'Y' if the disk is mirrored, or 'N' if notCHAR(1)IS_MIRRORED
Total volume block splits for all block
sizes
Total cache hits per second for this
interval, for all block sizes
Disk process receive queue length
integrated over the sample interval,
expressed as a percentage
Disk Statistics 43
Page 44

Table 3-6 DISK_STATS_V1 Field Definitions (continued)
DescriptionData TypeField Name
DECIMAL(9,1)IO_REQS_PER_SEC
SMALLINT UNSIGNEDBLOCKED_REQS_PER_SEC
DECIMAL(9,1)PAGE_SWAPS_PER_SEC
CHAR(12)STATUS_TEXT
SMALLINT UNSIGNEDSTATUS
Number of disk input/output requests
per second for this interval
Number of disk requests blocked per
second for this interval
Number of disk page swaps per
second for this interval
Availability or performance status of
the disk, reflecting objectives defined
in the Neoview Management
Dashboard configuration:
'Exists'
'Up'
'Low'
'Medium'
'High'
'Warning'
'Critical'
'Down'
'Questionable'
Numerical equivalent of the status text:
1 means 'Exists'
2 means 'Up'
3 means 'Low'
4 means 'Medium'
5 means 'High'
6 means 'Warning'
7 means 'Critical'
8 means 'Down'
9 means 'Questionable'
DECIMAL(12,1)LARGEST_FRAGMENT
DECIMAL(9,1)READS_PER_SEC
DECIMAL(9,1)WRITES_PER_SEC
DECIMAL(9,1)OPS_PER_SEC
DECIMAL(6,1)BUSY_PCT
DECIMAL(6,1)BUSY_WRITES_PCT
DECIMAL(6,1)BUSY_READS_PCT
DECIMAL(9,1)INPUT_KB_PER_SEC
Size of the largest disk fragment
available, in megabytes
Number of disk process read
operations per second for this interval,
for the primary disk
Number of disk process write
operations per second for this interval,
for the primary disk
Total number of disk process reads,
writes, and seeks per second for this
interval, for the primary disk
Percentage of time that the primary
disk was busy reading, writing, and
seeking during this interval
Percentage of time that the primary
disk was busy writingduring this
interval
Percentage of time that the primary
disk was busy reading during this
interval
Input kilobytes per second during this
interval for the primary disk
44 Repository Views
Page 45

Table 3-6 DISK_STATS_V1 Field Definitions (continued)
DescriptionData TypeField Name
DECIMAL(9,1)OUTPUT_KB_PER_SEC
DECIMAL(9,1)READS_PER_SEC_MIR
DECIMAL(9,1)WRITES_PER_SEC_MIR
DECIMAL(9,1)OPS_PER_SEC_MIR
DECIMAL(6,1)BUSY_PCT_MIR
DECIMAL(6,1)BUSY_WRITES_PCT_MIR
DECIMAL(6,1)BUSY_READS_PCT_MIR
DECIMAL(9,1)INPUT_KB_PER_SEC_MIR
DECIMAL(9,1)OUTPUT_KB_PER_SEC_MIR
Output kilobytes per second during
this interval for the primary disk
Number of disk process read
operations per second for this interval,
for the mirror disk
Number of disk process write
operations per second for this interval,
for the mirror disk
Total number of disk process reads,
writes, and seeks per second for this
interval, for the mirror disk
Percentage of time that the mirror disk
was busy reading, writing, and seeking
during this interval
Percentage of time that the mirror disk
was busy writingduring this interval
Percentage of time that the mirror disk
was busy reading during this interval
Input kilobytes per second during this
interval for the mirror disk
Output kilobytes per second during
this interval for the mirror disk
TIMESTAMP(6)SUBMIT_TS_UTC
TIMESTAMP(6)UPDATE_TS
INTERVAL MINUTE(3)UTC_BIAS
EMS Events
This view provides access to information collected from the error event logs. Events from these
logs are available through this single view and you can use SQL to run queries against the
information collected. Refer to Appendix A: “Sample Queries for Event Information” (page 67)
for sample queries that you can use.
VIEW NEO.HP_METRICS.EVENTS_VW1
Character columns use ISO88591 or UCS2 encoding, as appropriate to the Neoview platform
configuration. If the platform is UCS2 or SJIS, all character columns are created with CHARACTER
SET UCS2. If the platform is ISO88591, all CHAR columns are created with CHARACTER SET
ISO88591.
The primary key for EVENTS_VW1 field definition is LOG_TIMESTAMP_LCT, SEGMENT,
COLLECTOR, GENERATED_TIMESTAMP_UTC, and SEQ_NUMBER.
Timestamp, in Universal Coordinated
Time, when the measurement was
submitted to the Repository
Timestamp, in Local Civil Time, when
the measurement was stored in the
Repository
Minutes behind or ahead of UTC (can
be a positive or negative number)
EMS Events 45
Page 46

Table 3-7 EVENTS_VW1 Field Definitions
DescriptionData TypeField Name
TIMESTAMP(6)LOG_TIMESTAMP_LCT
CHAR(8)SEGMENT
CHAR(8)COLLECTOR
TIMESTAMP(6)GENERATED_TIMESTAMP_UTC
INTEGER UNSIGNEDSEQ_NUMBER
Primary Key
Timestamp, in Local Civil Time,
indicating when the event was
placed in the EMS log.
Primary Key
Name of the segment where
this event was logged. This
column always uses the
ISO88591 character set.
Primary Key
The name of the EMS collector
that logged this event. This
column always uses the
ISO88591 character set.
Primary Key
Timestamp, in Coordinated
Universal Time, indicating
when the event was generated.
Primary Key
A sequence number used to
differentiate between two
events that have identical LOG
and GENERATEDtimestamps.
TIMESTAMP(6)LOG_TIMESTAMP_UTC
TIMESTAMP(6)GENERATED_TIMESTAMP_LCT
INTEGEREVENT_NUMBER
CHAR(20)SSID
CHAR(8)PROCESS_SEGMENT
Timestamp, in Coordinated
Universal Time, indicating
when the event was recorded
in the EMS log.
Timestamp, in Local Civil Time,
indicating when the event was
generated.
Number assigned to the event
by the subsystem that logged it
to EMS. NOTE: A different
subsystem can use the same
number for an event that occurs
within that subsystem.
Subsystem ID of the subsystem
that generated the event. This
column always uses the
ISO88591 character set.
segment_name of the process
that generated the event. This
column always uses the
ISO88591 character set.
TIP: Use this column to select
or group events by segment.
46 Repository Views
CHAR(20)PROCESS_ID
segment_name,process_name
of the process that generated
the event. This column always
uses the ISO88591 character set.
Page 47

Table 3-7 EVENTS_VW1 Field Definitions (continued)
DescriptionData TypeField Name
INTEGER UNSIGNEDPROCESS_ID_INSTANCE
INTEGER UNSIGNEDNODE_ID
INTEGER UNSIGNEDPIN
INTEGER UNSIGNEDSEGMENT_ID
INTEGER, nullableSQLCD
INTEGER, nullableFSERROR
VARCHAR(5000)TEXT
Instance number of the process
that generated the event.
Processing node number of the
process that generated the
event.
Process identification number
of the process that generated
the event.
Segment number of the process
that generated the event. For
example, 1 for segment
\NEO0101 or 3 for segment
\NEO0103.
Reserved for future expansionReserved for future expansionSTART_ENTRY_ID
Reserved for future expansionReserved for future expansionSTART_ENTRY_ID
SQL error code. Null if event is
not SQL-related.
File system error, if related to
an SQL error. Null for any other
event.
Text description of the EMS
event.
If the Neoview platform is
configured for UTF8 or SJIS
character sets, this column uses
UCS2. Otherwise, this column
uses the ISO88591 character set.
Space Management Views and Sample Query Views for Space Management
If you need more reports than what Space Management in HPDM provides, you can run queries
directly against the Repository views for space management. See these next sections for details:
• “VIEW NEO.HP_METRICS.SPACE_PARTITION_DETAIL_VW1” (page 47)
• “VIEW NEO.HP_METRICS.SPACE_PARTITION_DETAIL_HISTORY_VW1” (page 50)
• “Sample Query Views for Space Management” (page 54)
VIEW NEO.HP_METRICS.SPACE_PARTITION_DETAIL_VW1
The Space Management Client in HPDM accesses this view to obtain inventory data about the
table partitions. You can also run queries directly against this view. For sample queries, see
“Sample Query Views for Space Management” (page 54).
Space Management Views and Sample Query Views for Space Management 47
Page 48

Table 3-8 SPACE_PARTITION_DETAIL_VW1 Field Definitions
DescriptionData TypeField Name
LARGEINTLAST_UPDATE_LCT_JTS
LARGEINTLAST_CHECK_NOUPDATE_LCT_JTS
LARGEINTLAST_UPDATE_UTC_JTS
LARGEINTLAST_CHECK_NOUPDATE_UTC_JTS
CHAR(64)PLATFORM_NAME
Timestamp, in Local Civil Time, indicating
when this row was updated in the
Repository
Example: 2010-01-26 07:47:28.795392
Timestamp, in Local Civil Time, indicating
when information in this row was checked
against the system values but did not need
any Repository update
Example: 2010-01-26 07:48:09.967095
Timestamp, in Coordinated Universal Time,
indicating when this row was updated in the
Repository
Example: 2010-01-26 15:47:28.795392
Timestamp, in Coordinated Universal Time,
indicating when information in this row was
checked against the system values but did
not need any Repository update
Example: 2010-01-26 15:48:09.967095
Neoview system name, made up of the first
three letters of the system name, followed
by 01 for the first platform at your site, 02
for the second platform at your site, and so
on.
Example: NEO01
INTSEGMENT_ID
CHAR(64)SEGMENT_NAME
CHAR(2)OBJECT_NAME_SPACE
CHAR(2)OBJECT_TYPE
CHAR(17)FILE_NAME
CHAR(1)CORRUPT_BROKEN
Segment number
Example: 1
Segment name
Example: \NEO0101
Catalog nameVARCHAR(128)CATALOG_NAME
Schema nameVARCHAR(128)SCHEMA_NAME
Object nameVARCHAR(128)OBJECT_NAME
Object namespace
Example: TA for tables and IX for indexes
Object type, which can be:
BT (Base Table)
MV (Materialized View)
IX (Index)
Subvolume and simple name of a file with
a partition
Disk volume nameCHAR(8)DISK_NAME
Corrupt. For disk objects other than SQL
shorthand views:
1 = if the object has the corrupt flag set
0 = otherwise
48 Repository Views
Page 49

Table 3-8 SPACE_PARTITION_DETAIL_VW1 Field Definitions (continued)
DescriptionData TypeField Name
CHAR(1)CRASH_OPEN
CHAR(1)INCOMPLETE_SQL_DDL
CHAR(1)UNRECLAIMED_FREE_SPACE
LARGEINTSIZE_CURR_BYTES
Crash open. For disk objects other than SQL
shorthand views:
1 = if the object was open with write access
when a system failure occurred and the
object has not been opened since
0 = otherwise
Incomplete SQL DDL operation. For SQL
tables and indexes:
1 = if the object has the D flag set
0 = otherwise
The D flag is an internal setting for
incomplete SQL DDL operations.
Unreclaimed free space. For SQL tables and
indexes:
1 = if the object has the F flag set
0 = otherwise
The F flag is an internal setting for unclaimed
free space.
Current data size, in bytes, of the partition,
determined by the End of File (EOF)
indicator
Maximum size, in bytes, of the partitionLARGEINTMAX_SIZE_CURR_BYTES
Primary extent size in bytesLARGEINTPRIMARY_EXTENT_CURR
Secondary extent size in bytesLARGEINTSECONDARY_EXTENT_CURR
Maximum extent size in bytesLARGEINTMAX_EXTENT_CURR
Allocated extent numberLARGEINTALLOC_EXTENT_CURR
Record length in bytesLARGEINTRECORD_LEN_CURR_BYTES
LARGEINTSTATS_ROWCOUNT_CURR_NUM
LARGEINTSTATS_CURR_LCT_JTS
LARGEINTSTATS_CURR_UTC_JTS
LARGEINTINDEX_LEVELS_CURR
LARGEINTROW_COUNT_NUM
LARGEINTCREATE_LCT_JTS
LARGEINTCREATE_UTC_JTS
Row count of the last UPDATE STATISTICS
operation
Timestamp, in Local Civil Time, when
UPDATE STATISTICS was last run
Timestamp, in Coordinated Universal Time,
when UPDATE STATISTICS was last run
Index level of the last UPDATE STATISTICS
operation
Real row-count number, available only when
the ROWC flag is set to Y
Timestamp, in Local Civil Time, when the
partition was created
Timestamp, in Coordinated Universal Time,
when the partition was created
LARGEINTLAST_MODIFIED_LCT_JTS
LARGEINTLAST_MODIFIED_UTC_JTS
Space Management Views and Sample Query Views for Space Management 49
Timestamp, in Local Civil Time, when the
partition was last modified
Timestamp, in Coordinated Universal Time,
when the partition was last modified
Page 50

Table 3-8 SPACE_PARTITION_DETAIL_VW1 Field Definitions (continued)
DescriptionData TypeField Name
LARGEINTLAST_OPEN_LCT_JTS
LARGEINTLAST_OPEN_UTC_JTS
LARGEINTDROP_TIME_LCT_JTS
LARGEINTDROP_TIME_UTC_JTS
CHAR(128)CATEGORY_TYPE
Timestamp, in Local Civil Time, when the
partition was last opened
Timestamp, in Coordinated Universal Time,
when the partition was last opened
Timestamp, in Local Civil Time, when the
partition was dropped
Timestamp, in Coordinated Universal Time,
when the partition was dropped
The application-defined codeINT UNSIGNEDFILE_CODE
Owner of the fileCHAR(64)FILE_OWNER_NAME
One of these categories:
SQL Permanent Space
SQL System Space
SQL Volatile Space
Transform Ghost Objects
Transporter Staging Tables
User or SystemCHAR(20)CATEGORY_NAME
Size allocated by the file systemLARGEINTALLOCATED_SIZE_BYTES
Percentage of disk space currently in useNUMERIC(128, 2)FULL_PCT
VIEW NEO.HP_METRICS.SPACE_PARTITION_DETAIL_HISTORY_VW1
The Space Management Client in HPDM accesses this view to obtain aging historical data about
the table partitions. You can also run queries directly against this view. For sample queries, see
“Sample Query Views for Space Management” (page 54).
Table 3-9 SPACE_PARTITION_DETAIL_HISTORY_VW1 Field Definitions
DescriptionData TypeField Name
LARGEINTLAST_CHECK_NOUPDATE_LCT_JTS
LARGEINTLAST_UPDATE_LCT_JTS
LARGEINTLAST_CHECK_NOUPDATE_UTC_JTS
Timestamp, in Local Civil Time, indicating
when information in this row was checked
against the system values but did not need
any Repository update
Example: 2010-01-26 07:48:09.967095
Timestamp, in Local Civil Time, indicating
when this row was updated in the
Repository
Example: 2010-01-26 07:47:28.795392
Timestamp, in Coordinated Universal Time,
indicating when information in this row was
checked against the system values but did
not need any Repository update
Example: 2010-01-26 15:48:09.967095
50 Repository Views
LARGEINTLAST_UPDATE_UTC_JTS
Timestamp, in Coordinated Universal Time,
indicating when this row was updated in the
Repository
Example: 2010-01-26 15:47:28.795392
Page 51

Table 3-9 SPACE_PARTITION_DETAIL_HISTORY_VW1 Field Definitions (continued)
DescriptionData TypeField Name
CHAR(64)PLATFORM_NAME
INTSEGMENT_ID
CHAR(64)SEGMENT_NAME
CHAR(2)OBJECT_NAME_SPACE
CHAR(2)OBJECT_TYPE
Neoview system name, made up of the first
three letters of the system name, followed
by 01 for the first platform at your site, 02
for the second platform at your site, and so
on.
Example: NEO01
Segment number
Example: 1
Segment name
Example: \NEO0101
Catalog nameVARCHAR(128)CATALOG_NAME
Schema nameVARCHAR(128)SCHEMA_NAME
Object nameVARCHAR(128)OBJECT_NAME
Object namespace
Example: TA for tables and IX for indexes
Object type, which can be:
BT (Base Table)
MV (Materialized View)
IX (Index)
CHAR(1)ROW_TYPE
CHAR(1)MOST_GRANULAR
CHAR(1)LEAST_GRANULAR
CHAR(17)FILE_NAME
CHAR(1)CORRUPT_BROKEN_CURR
CHAR(1)CRASH_OPEN_CURR
Type of aggregation in the row:
H (Hourly Aggregation Row)
D (Daily Aggregation Row)
W (Weekly Aggregation Row)
M (Monthly Aggregation Row)
Q (Quarterly Aggregation Row)
Y (Yearly Aggregation Row)
Indicates whether the row is the most
granular row for any given time period. For
future use.
Indicates whether the row is the least
granular row for any given time period. For
future use.
Subvolume and simple name of a file with
a partition
Disk volume nameCHAR(8)DISK_NAME
Corrupt. For disk objects other than SQL
shorthand views:
1 = if the object has the corrupt flag set
0 = otherwise
Crash open. For disk objects other than SQL
shorthand views:
1 = if the object was open with write access
when a system failure occurred and the
object has not been opened since
0 = otherwise
Space Management Views and Sample Query Views for Space Management 51
Page 52

Table 3-9 SPACE_PARTITION_DETAIL_HISTORY_VW1 Field Definitions (continued)
DescriptionData TypeField Name
CHAR(1)INCOMPLETE_SQL_DDL_CURR
CHAR(1)UNRECLAIMED_FREE_SPACE_CURR
LARGEINTSIZE_CURR_BYTES
Incomplete SQL DDL operation. For SQL
tables and indexes:
1 = if the object has the D flag set
0 = otherwise
The D flag is an internal setting for
incomplete SQL DDL operations.
Unreclaimed free space. For SQL tables and
indexes:
1 = if the object has the F flag set
0 = otherwise
The F flag is an internal setting for unclaimed
free space.
Current data size, in bytes, of the partition,
determined by the End of File (EOF)
indicator
Average value of SIZE_CURR_BYTESLARGEINTSIZE_AVG_BYTES
Minimum value of SIZE_CURR_BYTESLARGEINTSIZE_MIN_BYTES
Maximum value of SIZE_CURR_BYTESLARGEINTSIZE_MAX_BYTES
Maximum size, in bytes, of the partitionLARGEINTMAX_SIZE_CURR_BYTES
Average value of MAX_SIZE_CURR_BYTESLARGEINTMAX_SIZE_AVG_BYTES
LARGEINTMAX_SIZE_MIN_BYTES
LARGEINTMAX_SIZE_MAX_BYTES
LARGEINTPRIMARY_EXTENT_AVG
LARGEINTPRIMARY_EXTENT_MIN
LARGEINTPRIMARY_EXTENT_MAX
LARGEINTSECONDARY_EXTENT_AVG
LARGEINTSECONDARY_EXTENT_MIN
LARGEINTSECONDARY_EXTENT_MAX
Minimum value of
MAX_SIZE_CURR_BYTES
Maximum value of
MAX_SIZE_CURR_BYTES
Primary extent size in bytesLARGEINTPRIMARY_EXTENT_CURR
Average value of
PRIMARY_EXTENT_CURR
Minimum value of
PRIMARY_EXTENT_CURR
Maximum value of
PRIMARY_EXTENT_CURR
Secondary extent size in bytesLARGEINTSECONDARY_EXTENT_CURR
Average value of
SECONDARY_EXTENT_CURR
Minimum value of
SECONDARY_EXTENT_CURR
Maximum value of
SECONDARY_EXTENT_CURR
Maximum extent size in bytesLARGEINTMAX_EXTENT_CURR
Average value of MAX_EXTENT_CURRLARGEINTMAX_EXTENT_AVG
52 Repository Views
Minimum value of MAX_EXTENT_CURRLARGEINTMAX_EXTENT_MIN
Maximum value of MAX_EXTENT_CURRLARGEINTMAX_EXTENT_MAX
Allocated extent numberLARGEINTALLOC_EXTENT_CURR
Average value of ALLOC_EXTENT_CURRLARGEINTALLOC_EXTENT_AVG
Page 53

Table 3-9 SPACE_PARTITION_DETAIL_HISTORY_VW1 Field Definitions (continued)
DescriptionData TypeField Name
Minimum value of ALLOC_EXTENT_CURRLARGEINTALLOC_EXTENT_MIN
Maximum value of ALLOC_EXTENT_CURRLARGEINTALLOC_EXTENT_MAX
Record length in bytesLARGEINTRECORD_LEN_CURR_BYTES
LARGEINTRECORD_LEN_AVG_BYTES
LARGEINTRECORD_LEN_MIN_BYTES
LARGEINTRECORD_LEN_MAX_BYTES
LARGEINTSTATS_ROWCOUNT_CURR_NUM
LARGEINTSTATS_ROWCOUNT_AVG_NUM
LARGEINTSTATS_ROWCOUNT_MIN_NUM
LARGEINTSTATS_ROWCOUNT_MAX_NUM
LARGEINTSTATS_CURR_UTC_JTS
LARGEINTSTATS_CURR_LCT_JTS
LARGEINTINDEX_LEVELS_CURR
Average value of
RECORD_LEN_CURR_BYTES
Minimum value of
RECORD_LEN_CURR_BYTES
Maximum value of
RECORD_LEN_CURR_BYTES
Row count of the last UPDATE STATISTICS
operation
Average value of
STATS_ROWCOUNT_CURR
Minimum value of
STATS_ROWCOUNT_CURR
Maximum value of
STATS_ROWCOUNT_CURR
Timestamp, in Coordinated Universal Time,
when UPDATE STATISTICS was last run
Timestamp, in Local Civil Time, when
UPDATE STATISTICS was last run
Index level of the last UPDATE STATISTICS
operation
Average value of INDEX_LEVELS_CURRLARGEINTINDEX_LEVELS_AVG
Minimum value of INDEX_LEVELS_CURRLARGEINTINDEX_LEVELS_MIN
Maximum value of INDEX_LEVELS_CURRLARGEINTINDEX_LEVELS_MAX
LARGEINTROW_COUNT_CURR_NUM
LARGEINTROW_COUNT_AVG_NUM
LARGEINTROW_COUNT_MIN_NUM
LARGEINTROW_COUNT_MAX_NUM
LARGEINTCREATE_UTC_JTS
LARGEINTLAST_MODIFIED_UTC_JTS
LARGEINTLAST_OPEN_UTC_JTS
LARGEINTDROP_TIME_UTC_JTS
LARGEINTCREATE_LCT_JTS
Real row-count number, available only when
the ROWC flag is set to Y
Average value of
ROW_COUNT_CURR_NUM
Minimum value of
ROW_COUNT_CURR_NUM
Maximum value of
ROW_COUNT_CURR_NUM
Timestamp, in Coordinated Universal Time,
when the partition was created
Timestamp, in Coordinated Universal Time,
when the partition was last modified
Timestamp, in Coordinated Universal Time,
when the partition was last opened
Timestamp, in Coordinated Universal Time,
when the partition was dropped
Timestamp, in Local Civil Time, when the
partition was created
Space Management Views and Sample Query Views for Space Management 53
Page 54

Table 3-9 SPACE_PARTITION_DETAIL_HISTORY_VW1 Field Definitions (continued)
DescriptionData TypeField Name
LARGEINTLAST_MODIFIED_LCT_JTS
LARGEINTLAST_OPEN_LCT_JTS
LARGEINTDROP_TIME_LCT_JTS
CHAR(128)CATEGORY_TYPE
Sample Query Views for Space Management
You can use these sample query views to obtain various reports from the Repository views for
space management. These sample queries are provided as views named SPACE_Q_query-name
in the NEO.HP_METRICS schema. To return space management data from one of the sample
query views, run a SELECT statement like this one:
SELECT * FROM NEO.HP_METRICS.SPACE_Q_query-name;
For example, to see the SPACE_Q_CATALOG_SIZE_VW1 view, use this query:
SELECT * FROM NEO.HP_METRICS.SPACE_Q_CATALOG_SIZE_VW1;
For descriptions of the sample query views, see the next sections.
Timestamp, in Local Civil Time, when the
partition was last modified
Timestamp, in Local Civil Time, when the
partition was last opened
Timestamp, in Local Civil Time, when the
partition was dropped
The application-defined codeINT UNSIGNEDFILE_CODE
Owner of the fileCHAR(64)FILE_OWNER_NAME
One of these categories:
SQL Permanent Space
SQL System Space
SQL Volatile Space
Transform Ghost Objects
Transporter Staging Tables
User or SystemCHAR(20)CATEGORY_NAME
Size allocated by the file systemLARGEINTALLOCATED_SIZE_BYTES
Percentage of disk space currently in useNUMERIC(128, 2)FULL_PCT
SPACE_Q_CATALOG_SIZE_VW1
Table 3-10 SPACE_Q_CATALOG_SIZE_VW1
Description:
Columns Included:
54 Repository Views
This report provides the bytes used, bytes allocated, slack percentage, and number of schemas
for each catalog on the Neoview platform.
LAST_CHECK_NOUPDATE_LCT_TS
LAST_CHECK_NOUPDATE_UTC_TS
CATALOG_NAME
BYTES_USED
BYTES_ALLOCATED
SLACK_PCT
NUM_SCHEMAS
NEO.HP_METRICS.SPACE_PARTITION_DETAIL_VW1Views Used:
Page 55

SPACE_Q_DISK_FULL_VW1
Table 3-11 SPACE_Q_DISK_FULL_VW1
Description:
Columns Included:
Views Used:
This report provides disk fullness information, including the percentage of disk space that is
currently in use from biggest to smallest and the percentage of user-allocated space that is
currently full.
LAST_CHECK_NOUPDATE_LCT_TS
LAST_CHECK_NOUPDATE_UTC_TS
SEGMENT_NAME
DISK_NAME
DISK_FULL_PCT
USER_FULL_PCT
NEO.HP_METRICS.DISK_STATS_V1
NEO.HP_METRICS.SPACE_PARTITION_DETAIL_VW1
(and an internal table)
SPACE_Q_NUM_GUARDIAN_FILES_VW1
Table 3-12 SPACE_Q_NUM_GUARDIAN_FILES_VW1
This report provides the number of files on each segment.Description:
Columns Included:
SEGMENT_NAME
NUM_GUARDIAN_FILES_PER_SEG
NEO.HP_METRICS.SPACE_PARTITION_DETAIL_VW1 (and an internal table)Views Used:
SPACE_Q_OBJECT_GROWTH_VW1
Table 3-13 SPACE_Q_OBJECT_GROWTH_VW1
Description:
Columns Included:
This report provides historical data of object growth for a given time period, from the earliest
to the most recent time, and includes the current, average, maximum, and minimum sizes, in
megabytes, of the objects on the Neoview platform.
LAST_CHECK_NOUPDATE_LCT_TS
LAST_CHECK_NOUPDATE_UTC_TS
CATALOG_NAME
SCHEMA_NAME
OBJECT_NAME
OBJECT_NAME_SPACE
OBJECT_TYPE
ROW_TYPE
OBJECT_CURR_SIZE_MB
OBJECT_AVG_SIZE_MB
OBJECT_MAX_SIZE_MB
OBJECT_MIN_SIZE_MB
NEO.HP_METRICS.SPACE_PARTITION_DETAIL_HISTORY_VW1Views Used:
Space Management Views and Sample Query Views for Space Management 55
Page 56

SPACE_Q_PARTITION_FULL_VW1
Table 3-14 SPACE_Q_PARTITION_FULL_VW1
Description:
Columns Included:
This report provides partition fullness information, including the percentage of partition space
that is currently full for each partition, from biggest to smallest.
LAST_CHECK_NOUPDATE_LCT_TS
LAST_CHECK_NOUPDATE_UTC_TS
SEGMENT_NAME
PARTITION_NAME
PARTITION_FULL_PCT
NEO.HP_METRICS.SPACE_PARTITION_DETAIL_VW1Views Used:
SPACE_Q_SYSTEM_DETAILS_VW1
Table 3-15 SPACE_Q_SYSTEM_DETAILS_VW1
Description:
Columns Included:
This report provides detailed space information for the schemas on the Neoview platform,
including whether the objects in the schema are partitioned or non-partitioned, the number
of objects in the schema, the schema size in megabytes from biggest to smallest, and the
percentage of schema space that is currently full for each schema.
LAST_CHECK_NOUPDATE_LCT_TS
LAST_CHECK_NOUPDATE_UTC_TS
CATALOG_NAME
SCHEMA_NAME
SPACE_TYPE
NUM_OBJECTS
SCHEMA_SIZE_MB
SCHEMA_FULL_PCT
NEO.HP_METRICS.SPACE_PARTITION_DETAIL_VW1Views Used:
SPACE_Q_SYSTEM_TOTAL_SIZE_VW1
Table 3-16 SPACE_Q_SYSTEM_TOTAL_SIZE_VW1
This report displays the total amount, in gigabytes, of system-wide storage space for users.Description:
SYSTEM_SIZE_GBColumns Included:
None (internal tables only)Views Used:
SPACE_Q_TABLES_BY_SCHEMA_VW1
Table 3-17 SPACE_Q_TABLES_BY_SCHEMA_VW1
This report lists the tables in each schema on the Neoview platform.Description:
Columns Included:
SCHEMA_NAME
OBJECT_NAME
NEO.HP_METRICS.SPACE_PARTITION_DETAIL_VW1Views Used:
56 Repository Views
Page 57

SPACE_Q_TABLE_FULL_VW1
Table 3-18 SPACE_Q_TABLE_FULL_VW1
Description:
Columns Included:
This report provides table fullness information, including the percentage of table space that
is currently full for each table, from biggest to smallest.
LAST_CHECK_NOUPDATE_LCT_TS
LAST_CHECK_NOUPDATE_UTC_TS
TABLE_NAME
TABLE_FULL_PCT
NEO.HP_METRICS.SPACE_PARTITION_DETAIL_VW1Views Used:
SPACE_Q_TABLE_SIZE_VW1
Table 3-19 SPACE_Q_TABLE_SIZE_VW1
This report lists the tables and their sizes, in megabytes, from biggest to smallest.Description:
Columns Included:
CATALOG_NAME
SCHEMA_NAME
TABLE_NAME
TABLE_SIZE_MB
NEO.HP_METRICS.SPACE_PARTITION_DETAIL_VW1Views Used:
SPACE_Q_TOP_10_CATEGORY_SIZE_VW1
Table 3-20 SPACE_Q_TOP_10_CATEGORY_SIZE_VW1
Description:
Columns Included:
This report lists the categories with the top 10 sizes, in bytes, from biggest to smallest. The
categories include:
SQL Permanent Space
SQL System Space
SQL Volatile Space
Transform Ghost Objects
Transporter Staging Tables
CATEGORY_TYPE
CATEGORY_SIZE_BYTES
NEO.HP_METRICS.SPACE_PARTITION_DETAIL_VW1Views Used:
SPACE_Q_TOP_10_NON_PARTITION_DETAIL_VW1
Table 3-21 SPACE_Q_TOP_10_NON_PARTITION_DETAIL_VW1
Description:
Columns Included:
This report lists the non-partitioned objects with the top 10 sizes, in megabytes, from biggest
to smallest.
LAST_CHECK_NOUPDATE_LCT_TS
LAST_CHECK_NOUPDATE_UTC_TS
CATALOG_NAME
SCHEMA_NAME
OBJECT_NAME
OBJECT_SIZE_MB
NEO.HP_METRICS.SPACE_PARTITION_DETAIL_VW1Views Used:
Space Management Views and Sample Query Views for Space Management 57
Page 58

SPACE_Q_TOP_10_PARTITION_DETAIL_VW1
Table 3-22 SPACE_Q_TOP_10_PARTITION_DETAIL_VW1
Description:
Columns Included:
This report lists the partitioned objects with the top 10 sizes, in megabytes, from biggest to
smallest.
LAST_CHECK_NOUPDATE_LCT_TS
LAST_CHECK_NOUPDATE_UTC_TS
CATALOG_NAME
SCHEMA_NAME
OBJECT_NAME
OBJECT_SIZE_MB
NEO.HP_METRICS.SPACE_PARTITION_DETAIL_VW1Views Used:
SPACE_Q_TOP_10_SCHEMA_SIZE_VW1
Table 3-23 SPACE_Q_TOP_10_SCHEMA_SIZE_VW1
This report lists the schemas with the top 10 sizes, in megabytes, from biggest to smallest.Description:
Columns Included:
CATALOG_NAME
SCHEMA_NAME
SCHEMA_SIZE_MB
NEO.HP_METRICS.SPACE_PARTITION_DETAIL_VW1Views Used:
SPACE_Q_TOP_10_TABLE_SIZE_VW1
Table 3-24 SPACE_Q_TOP_10_TABLE_SIZE_VW1
This report lists the tables with the top 10 sizes, in megabytes, from biggest to smallest.Description:
Columns Included:
CATALOG_NAME
SCHEMA_NAME
TABLE_NAME
TABLE_SIZE_MB
NEO.HP_METRICS.SPACE_PARTITION_DETAIL_VW1Views Used:
SPACE_Q_TOP_10_USER_SPACE_SIZE_VW1
Table 3-25 SPACE_Q_TOP_10_USER_SPACE_SIZE_VW1
Description:
Columns Included:
This report lists the top 10 users who are consuming the most space, in megabytes, on the
Neoview system.
FILE_OWNER
USER_SIZE_MB
NEO.HP_METRICS.SPACE_PARTITION_DETAIL_VW1Views Used:
58 Repository Views
Page 59

4 Examples and Guidelines for Creating Repository Queries
Overview
This section provides some simple queries against the available Repository views and provides
a few suggestions for writing Repository queries.
NOTE: More realistic examples of Repository queries are included in the Metric Miner of the
HP Database Manager (HPDM) product. Queries in this section are simple examples provided
as an introduction to the Repository. For further information on writing Repository queries, see
the course “Neoview: Using the Neoview Repository to Understand Performance”.
In general, each row in a Repository view includes two kinds of data:
• Metrics or statistics pertaining to a query, session, or other object. Examples of columns that
contain this kind of information are MESSAGE_BYTES_TO_DISK, MESSAGES_TO_DISK,
ROWS_ACCESSED, ROWS_RETRIEVED, NUM_ROWS_IUD, LOCK_ESCALATIONS,and
LOCK_WAITS.
• Information identifying a query, session, or other object, for instance who initiated it or
when it occurred. Examples of columns that contain this kind of information are
USER_NAME, QUERY_ID, DATASOURCE, STATEMENT_TYPE, and QUERY_STATUS.
With regard to creating Repository queries, here are a few tips:
• Using SELECT (*) in a programmatic query (embedded in a program) is not guaranteed to
return columns in the same order all the time. The following list applies to cases when the
result of the query is parsed programmatically or used in an automated calculation. Although
a few of the sample queries use the asterisk wildcard (*) to select all columns in the view for
simplicity, generally using the asterisk (*) wildcard is not desirable because:
— It is easier to extract meaningful information by selecting individual fields relevant to
the question being asked.
— The number and definitions of columns in a view might change in future versions.
— Column name changes can cause problems in programs.
If you are not parsing the result data, selecting all columns by using the asterisk (*) is
acceptable.
• To increase database concurrency, views use the “FOR READ UNCOMMITTED ACCESS”
option. If you are creating your own views, please include this option in the view creation
statements.
• Queries against views that provide process or process aggregation data will return data only
if process data collection is enabled. Queries against views that provide table data will return
data only if the table statistics data collection is enabled in Dashboard.
Get the Number of Rows in a View
Each of these queries gets the number of rows in a specific view:
select count(*) from NEO.HP_METRICS.QUERY_STATS_VW2 FOR READ UNCOMMITTED ACCESS;
select count(*) from NEO.HP_METRICS.ODBC_SESSION_STATS_V2 FOR READ UNCOMMITTED ACCESS;
Retrieve a Specified Number of Rows from a View
This query retrieves the ten rows most recently added to a view.
SELECT [first 10] (EXEC_START_LCT_TS) AS EXEC_START_LCT_TS
,(SEGMENT_ID) AS SEGMENT_ID
,(QUERY_STATUS) AS QUERY_STATUS
,(QUERY_ELAPSED_TIME) AS QUERY_ELAPSED_TIME
,(CLIENT_NAME) AS CLIENT_NAME
Overview 59
Page 60

from NEO.HP_METRICS.QUERY_STATS_VW2
ORDER BY EXEC_START_LCT_TS DESC FOR READ UNCOMMITTED ACCESS;
Retrieve Statistics for Completed Queries
This query lists information for the ten most recent queries that completed normally. You could
enhance this query to filter for time ranges, user IDs, or other attributes.
The list following the query shows values that might be returned in a single record.
SELECT [first 10] (EXEC_START_LCT_TS) AS EXEC_START_LCT_TS
,(SEGMENT_ID) AS SEGMENT_ID
,(QUERY_STATUS) AS QUERY_STATUS
,(QUERY_ELAPSED_TIME) AS QUERY_ELAPSED_TIME
,(cLIENT_NAME) AS CLIENT_NAME
from NEO.HP_METRICS.QUERY_STATS_VW2
where QUERY_STATUS='COMPLETED'
ORDER BY EXEC_START_LCT_TS DESC FOR READ UNCOMMITTED ACCESS;
Retrieve Statistics for Incomplete Queries
This query lists information about queries that have started but not ended. The result set is
ordered in descending chronological order (most recent first). The result set represents queries
that are active, queries that terminated abnormally, or queries where the user chose not to finish
fetching the data. If a query did not complete, fields that are not populated unless the query
completes have the value NULL.
The list following the query shows the values that might be associated with a specific row.
60 Examples and Guidelines for Creating Repository Queries
Page 61

select [first 10] (EXEC_START_LCT_TS) AS EXEC_START_LCT_TS
,(SEGMENT_ID) AS SEGMENT_ID
,(QUERY_STATUS) AS QUERY_STATUS
,(cLIENT_NAME) AS CLIENT_NAME
from NEO.HP_METRICS.QUERY_STATS_VW2
WHERE QUERY_STATUS in ('REJECTED', 'INIT')
ORDER BY EXEC_START_LCT_TS DESC FOR READ UNCOMMITTED ACCESS;
List Statement Counts for a Selected Time Period
This query returns statement counts by user name for a given time period that you provide. The
output following the query shows a single row of the output.
SELECT USER_NAME, count(*) as TTL_STMTS,
cast(MIN((ENTRY_ID_LCT_TS)) as timestamp(0)) as FIRST_TIME,
cast(MAX((ENTRY_ID_LCT_TS)) as timestamp(0)) as LAST_TIME,
sum(case when SQL_ERROR_CODE < 0 then 1 else 0 end ) as error_count,
SUM(DISK_IOS) as TTL_DISK_READS,
SUM(MESSAGES_TO_DISK) as TTL_MESSAGES_TO_DISK,
SUM(MESSAGE_BYTES_TO_DISK) as TTL_MESSAGE_BYTES_TO_DISK,
SUM(NUM_ROWS_IUD) as TTL_NUM_ROWS_IUD,
SUM(ROWS_ACCESSED) as TTL_ROWS_ACCESSED,
SUM(ROWS_RETRIEVED) as TTL_ROWS_RETRIEVED,
SUM(LOCK_ESCALATIONS) as TTL_LOCK_ESCALATIONS,
SUM(LOCK_WAITS) as TTL_LOCK_WAITS
FROM NEO.HP_METRICS.QUERY_STATS_VW2
WHERE
(ENTRY_ID_LCT_TS) >= cast(cast(('2010-03-15') as DATE) as TIMESTAMP(0))
AND (ENTRY_ID_LCT_TS) < CURRENT_TIMESTAMP
AND QUERY_STATUS = 'COMPLETED'
GROUP BY USER_NAME
ORDER BY USER_NAME;
List Statement Counts for a Selected Time Period 61
Page 62

Count Completed Queries, According to Specified Criteria
The following queries all return the number of completed queries, but they break down the
number in different ways.
Completed Queries Executed on a System in the Last 24 Hours
SELECT DISTINCT (CAST(EXEC_START_LCT_TS AS DATE)) AS START_DATE,
COUNT(*) AS NUM_OF_QUERIES,
MAX(CAST(EXEC_START_LCT_TS AS TIME(6))) AS MAX_START_TIME,
MIN(CAST(EXEC_START_LCT_TS AS TIME(6))) AS MIN_START_TIME
FROM NEO.HP_METRICS.QUERY_STATS_VW2
WHERE EXEC_START_LCT_TS <= CURRENT
AND EXEC_START_LCT_TS >= CURRENT - INTERVAL '1' DAY
AND QUERY_STATUS = 'COMPLETED'
GROUP BY 1
FOR READ UNCOMMITTED ACCESS;
Completed Queries Executed on a System in the Previous Two Days
To count queries that executed from one midnight to the next, instead of within a 24 hour period
relative to the current time, the following query uses the Neoview DATE_TRUNC function in
the SQL WHERE clause.
SELECT DISTINCT (CAST(EXEC_START_LCT_TS AS DATE)) AS START_DATE,
COUNT(*) AS NUM_OF_QUERIES,
MAX(CAST(EXEC_START_LCT_TS AS TIME(6))) AS MAX_START_TIME,
MIN(CAST(EXEC_START_LCT_TS AS TIME(6))) AS MIN_START_TIME
FROM NEO.HP_METRICS.QUERY_STATS_VW2
WHERE EXEC_START_LCT_TS <= CURRENT
AND EXEC_START_LCT_TS >= DATE_TRUNC('DAY', CURRENT - INTERVAL '1' DAY)
AND QUERY_STATUS = 'COMPLETED'
GROUP BY 1
FOR READ UNCOMMITTED ACCESS;
Queries within the Past 24 Hours, Grouped by Client Name
This example indicates how many queries different clients ran within a 24-hour period.
SELECT client_name, COUNT(*) AS NUM_OF_QUERIES
FROM NEO.HP_METRICS.QUERY_STATS_VW2
WHERE EXEC_START_LCT_TS <= CURRENT
AND EXEC_START_LCT_TS >= CURRENT - INTERVAL '1' DAY
AND QUERY_STATUS = 'COMPLETED'
GROUP BY client_name
ORDER BY client_name
FOR READ UNCOMMITTED ACCESS;
62 Examples and Guidelines for Creating Repository Queries
Page 63

Queries within the Past 24 Hours, Grouped by Data Source
This example indicates how many queries within the 24-hour period were associated with each
data source.
SELECT datasource, COUNT(*) AS NUM_OF_QUERIES
FROM NEO.HP_METRICS.QUERY_STATS_VW2
WHERE EXEC_START_LCT_TS <= CURRENT
AND EXEC_START_LCT_TS >= CURRENT - INTERVAL '1' DAY
AND QUERY_STATUS = 'COMPLETED'
GROUP BY datasource
ORDER BY datasource
FOR READ UNCOMMITTED ACCESS;
Queries within the Past 24 Hours, Grouped by Client Name and Including Average and Maximum Elapsed Time
SELECT client_name,
COUNT(*) AS num_of_queries,
AVG(query_elapsed_time)/1000 AS avg_qry_elapsed_msec,
MAX(query_elapsed_time)/1000 AS max_qry_elapsed_msec
FROM NEO.HP_METRICS.QUERY_STATS_VW2
WHERE EXEC_START_LCT_TS <= CURRENT
AND EXEC_START_LCT_TS >= CURRENT - INTERVAL '1' DAY
AND QUERY_STATUS = 'COMPLETED'
GROUP BY client_name
ORDER BY client_name
FOR READ UNCOMMITTED ACCESS;
Formatting Techniques to Enhance Readability of Query Output
Often the typical data in a column is much narrower than the maximum defined column size.
For example, the SESSION_ID column is defined as CHARACTER(108), and the DATASOURCE
column is defined as CHARACTER(128); actual values in those columns are usually much shorter.
Many query tools support automatic adjustment of column size for viewing results, but in some
cases, it is necessary to adjust the size of the columns returned from the query to improve
readability of the results.
Neoview SQL supports several string manipulation functions. Among these, the LEFT function
is useful for simple column size reduction. In addition to string functions, use of CAST is
sometimes helpful for modifying the appearance or size of numeric fields.
For example, the following query run from NCI produces results that can be difficult to read:
select [first 10]
datasource,
client_name,
Formatting Techniques to Enhance Readability of Query Output 63
Page 64

count(*) as query_count
from NEO.HP_METRICS.QUERY_STATS_VW2
where query_status = 'COMPLETED'
group by datasource, client_name
order by datasource, client_name;
DATASOURCE
CLIENT_NAME
QUERY_COUNT
-------------------------------------------------------------------------------------------------------------------------------------------------------------------------------------------------------
-------------------TDM_Default_DataSource
FMASTROPOL
3
TDM_Default_DataSource
JHANSEN13
127
TDM_Default_DataSource
SCOX1
687
TDM_Default_DataSource
THE0101
79
TDM_Default_DataSource
THE0102
2
TDM_Default_DataSource
THE0103
Minor formatting of the columns can yield a more readable result:
select [first 10]
left (datasource, 25) as datasource1,
client_name,
count(*) as query_count
from NEO.HP_METRICS.QUERY_STATS_VW2
where query_status = 'COMPLETED'
group by 1, client_name
order by 1, client_name;
DATASOURCE1 CLIENT_NAME QUERY_COUNT
------------------------- ------------ -----------TDM_Default_DataSource FMASTROPOL 3
TDM_Default_DataSource JHANSEN13 127
TDM_Default_DataSource SCOX1 688
TDM_Default_DataSource THE0101 79
TDM_Default_DataSource THE0102 2
TDM_Default_DataSource THE0103 2
Retrieving UCS2 Columns From a Workstation Configured for ISO8859-1
As indicated in Chapter 2: “Getting Started with Repository” (page 17), if the Neoview platform
is configured for the SJIS or Unicode configuration, certain Repository views contain
UCS2–encoded data. To retrieve such data (for example, to SELECT by making a character
comparison) from an ISO8859-1 workstation, you must translate the character literals in your
SQL statement to UCS2.
For example, if you issued the following statement from an ISO8859-1 workstation to retrieve
rows in which a specified column had the value 'abc'
Select * from <ucs2-view> where <column-name> = 'abc';
the query would fail with the following errors:
***ERROR[4041] Type CHAR(16) CHARACTER SET UCS2 cannot be compared with type CHAR(3) CHARACTER SET ISO88591.
***ERROR[8822] The statement was not prepared.
To perform the comparison and select the data successfully, you could use the _UCS2 character
set introducer, as in the following example:
Select * from <ucs2-view> where <column-name> = _UCS2'abc';
The _UCS2 introducer also works with hexadecimal character strings, as in the following example:
Select * from <ucs2-view> where <column-name> = _UCS2 X'0041 004E 0053 0049 0020 0054 0041 0042 004C 0045 005F
0030';
64 Examples and Guidelines for Creating Repository Queries
Page 65

The TRANSLATE function is another option for specifying a UCS2 literal. For example, the
following query uses the TRANSLATE function to translate an ISO8859-1 character string to
UCS2:
Select * from <ucs2-view> where <column-name> = TRANSLATE('ISO_abc' USING ISO88592ToUCS2);
The next example translates a hexadecimal literal to UCS2:
Select * from <ucs2-view> where <column-name> = TRANSLATE(X'48 45 58 5F 61 62 63' USING ISO88592ToUCS2);
For a much more extensive discussion of character sets on the Neoview platform, see the Neoview
Character Sets Administrator's Guide.
Retrieving UCS2 Columns From a Workstation Configured for ISO8859-1 65
Page 66

66
Page 67

A Sample Queries for Event Information
These are examples of queries you can run against the error event data on the Neoview platform
using HPDM SQL Whiteboard, HPDM Metric Miner, or Neoview Command Interface on
Repository view EVENTS_VW1. For details about fields from the EVENTS_VW1 view used in
these queries, refer to “VIEW NEO.HP_METRICS.EVENTS_VW1” (page 45).
67
Page 68

Example A-1 Generate Update Stats Command List
This report generates an executable command list to resolve missing table statistics, based on
two event numbers:
SELECT
COUNT(*) AS CNT,
MIN(LOG_TIMESTAMP_LCT) AS FIRST_TIME,
MAX(LOG_TIMESTAMP_LCT ) AS LAST_TIME,
UPDATE_STATS_COMMAND || ';' as UPDATE_STATS_COMMAND,
EVENT_NUMBER
FROM
(
SELECT
log_timestamp_lct,
trim(trailing '.'
FROM
trim
(
CASE
WHEN locate( 'UPDATE STATISTICS FOR TABLE',TEXT) > 0
THEN
--'GOT A MATCH'
substring(text
FROM
LOCATE ('UPDATE STATISTICS FOR TABLE',TEXT) )
ELSE '/*Unable to create update statistics command. Invalid value in EMS event*/'
END
)
) as UPDATE_STATS_COMMAND,
EVENT_NUMBER
FROM
NEO.HP_METRICS.EVENTS_VW1
WHERE
log_timestamp_lct >= TIMESTAMP '$$_FROM_TIME$$'
AND log_timestamp_lct <= TIMESTAMP '$$_TO_TIME$$'
and SSID like '%SQLMX%'
and (event_number = 6010 or event_number = 6011)
) AS A
GROUP BY UPDATE_STATS_COMMAND, EVENT_NUMBER
ORDER BY
CNT DESC
for read uncommitted access in share mode;
Example A-2 Search Event Logs for Abnormal Program Termination
This report performs a case-insensitive search for all events in which the event text contains the
string 'ABEND' during a given time period.
SELECT
EVENT_NUMBER AS EVENT_NUMBER,
GENERATED_TIMESTAMP_LCT AS GEN_TIME,
SUBSTRING(SUBSTRING(SSID FROM CHAR_LENGTH('TANDEM. '))FOR LOCATE('.' ,SUBSTRING(SSID FROM
CHAR_LENGTH('TANDEM. ')) )-1) AS SUB_SYS,
trim(substring(Text FROM CHAR_LENGTH('00:00 01FEB10 001.01.1000 '))) AS Event_Text,
PROCESS_SEGMENT AS SEGMENT,
TRIM(PROCESS_ID) AS PROCESS_NAME,
NODE_ID AS NODE_ID,
PIN AS PIN,
SEGMENT_ID AS SEGMENT_ID,
SQLCD AS SQLCD,
FSERROR AS FSERROR,
COLLECTOR AS COLLECTOR,
LOG_TIMESTAMP_LCT AS LOG_TIME_LCT,
TEXT AS FULL_TEXT,
SSID
FROM
NEO.HP_METRICS.EVENTS_VW1
WHERE
GENERATED_TIMESTAMP_LCT >= TIMESTAMP '$$__FROM_TIME$$' - interval '1' second and
GENERATED_TIMESTAMP_LCT <= TIMESTAMP '$$__TO_TIME$$' + interval '1' second
AND UPSHIFT(TEXT) LIKE '% ABEND%'
ORDER BY
GEN_TIME DESC
FOR READ UNCOMMITTED ACCESS IN SHARE MODE
68 Sample Queries for Event Information
Page 69

Example A-3 Search Event Logs For a Specific Event Number
This report lists all occurrences of a specified event number within a given time period.
SELECT
EVENT_NUMBER AS EVENT_NUMBER,
GENERATED_TIMESTAMP_LCT AS GEN_TIME,
SUBSTRING(SUBSTRING(SSID FROM CHAR_LENGTH('TANDEM. '))FOR LOCATE('.' ,SUBSTRING(SSID FROM
CHAR_LENGTH('TANDEM. ')) )-1) AS SUB_SYS,
trim(substring(Text FROM CHAR_LENGTH('00:00 01FEB09 001.01.1000 '))) AS Event_Text,
PROCESS_SEGMENT AS SEGMENT,
TRIM(PROCESS_ID) AS PROCESS_NAME,
NODE_ID AS NODE_ID,
PIN AS PIN,
SEGMENT_ID AS SEGMENT_ID,
SQLCD AS SQLCD,
FSERROR AS FSERROR,
COLLECTOR AS COLLECTOR,
LOG_TIMESTAMP_LCT AS LOG_TIME_LCT,
TEXT AS FULL_TEXT,
SSID
FROM
NEO.HP_METRICS.EVENTS_VW1
WHERE
GENERATED_TIMESTAMP_LCT >= TIMESTAMP '$$__FROM_TIME$$' - interval '1' second and
GENERATED_TIMESTAMP_LCT <= TIMESTAMP '$$__TO_TIME$$' + interval '1' second
AND EVENT_NUMBER = $$EVENT_NUMBER$$
ORDER BY
GEN_TIME, SSID DESC
FOR READ UNCOMMITTED ACCESS IN SHARE MODE
Example A-4 Search Event Logs for Specific Event Text
This report performs a case-insensitive search for events in which the event text contains the
entered text string and time period.
SELECT
EVENT_NUMBER AS EVENT_NUMBER,
GENERATED_TIMESTAMP_LCT AS GEN_TIME,
SUBSTRING(SUBSTRING(SSID FROM CHAR_LENGTH('TANDEM. '))FOR LOCATE('.' ,SUBSTRING(SSID FROM
CHAR_LENGTH('TANDEM. ')) )-1) AS SUB_SYS,
trim(substring(Text FROM CHAR_LENGTH('00:00 01FEB09 001.01.1000 '))) AS Event_Text,
PROCESS_SEGMENT AS SEGMENT,
TRIM(PROCESS_ID) AS PROCESS_NAME,
NODE_ID AS NODE_ID,
PIN AS PIN,
SEGMENT_ID AS SEGMENT_ID,
SQLCD AS SQLCD,
FSERROR AS FSERROR,
COLLECTOR AS COLLECTOR,
LOG_TIMESTAMP_LCT AS LOG_TIME_LCT,
TEXT AS FULL_TEXT,
SSID
FROM
NEO.HP_METRICS.EVENTS_VW1
WHERE
GENERATED_TIMESTAMP_LCT >= TIMESTAMP '$$__FROM_TIME$$' - interval '1' second and
GENERATED_TIMESTAMP_LCT <= TIMESTAMP '$$__TO_TIME$$' + interval '1' second
AND UPSHIFT(TEXT) LIKE upshift('%$$EVENT_TEXT$$%')
ORDER BY
GEN_TIME DESC
FOR READ UNCOMMITTED ACCESS IN SHARE MODE
69
Page 70

Example A-5 Search Event Logs for Missing Statistics
This report searches for all occurrences of missing SQL statistics messages 6007, 6008, 6010 and
6011 during a given time period.
SELECT
EVENT_NUMBER AS EVENT_NUMBER,
GENERATED_TIMESTAMP_LCT AS GEN_TIME,
SUBSTRING(SUBSTRING(SSID FROM CHAR_LENGTH('TANDEM. '))FOR LOCATE('.' ,SUBSTRING(SSID FROM
CHAR_LENGTH('TANDEM. ')) )-1) AS SUB_SYS,
trim(substring(Text FROM CHAR_LENGTH('00:00 01FEB09 001.01.1000 '))) AS Event_Text,
PROCESS_SEGMENT AS SEGMENT,
TRIM(PROCESS_ID) AS PROCESS_NAME,
NODE_ID AS NODE_ID,
PIN AS PIN,
SEGMENT_ID AS SEGMENT_ID,
SQLCD AS SQLCD,
FSERROR AS FSERROR,
COLLECTOR AS COLLECTOR,
LOG_TIMESTAMP_LCT AS LOG_TIME_LCT,
TEXT AS FULL_TEXT,
SSID
FROM
NEO.HP_METRICS.EVENTS_VW1
WHERE
GENERATED_TIMESTAMP_LCT >= TIMESTAMP '$$__FROM_TIME$$' AND
GENERATED_TIMESTAMP_LCT <= TIMESTAMP '$$__TO_TIME$$'
AND UPSHIFT(SSID) LIKE '%SQL%'
AND (EVENT_NUMBER = 6010 or event_number = 6011
or EVENT_NUMBER = 6007 or event_number = 6008)
ORDER BY
GEN_TIME DESC
FOR READ UNCOMMITTED ACCESS IN SHARE MODE
Example A-6 Search Event Logs for a Process Name
This report lists all events for a full or partial process name and given time period.
SELECT
EVENT_NUMBER AS EVENT_NUMBER,
GENERATED_TIMESTAMP_LCT AS GEN_TIME,
SUBSTRING(SUBSTRING(SSID FROM CHAR_LENGTH('TANDEM. '))FOR LOCATE('.' ,SUBSTRING(SSID FROM
CHAR_LENGTH('TANDEM. ')) )-1) AS SUB_SYS,
trim(substring(Text FROM CHAR_LENGTH('00:00 01FEB09 001.01.1000 '))) AS Event_Text,
PROCESS_SEGMENT AS SEGMENT,
TRIM(PROCESS_ID) AS PROCESS_NAME,
NODE_ID AS NODE_ID,
PIN AS PIN,
SEGMENT_ID AS SEGMENT_ID,
SQLCD AS SQLCD,
FSERROR AS FSERROR,
COLLECTOR AS COLLECTOR,
LOG_TIMESTAMP_LCT AS LOG_TIME_LCT,
TEXT AS FULL_TEXT,
SSID
FROM
NEO.HP_METRICS.EVENTS_VW1
WHERE
GENERATED_TIMESTAMP_LCT >= TIMESTAMP '$$__FROM_TIME$$' and
GENERATED_TIMESTAMP_LCT <= TIMESTAMP '$$__TO_TIME$$'
AND UPSHIFT(PROCESS_ID) LIKE UPSHIFT('%$$PROCESS_NAME$$%')
ORDER BY
GEN_TIME DESC
FOR READ UNCOMMITTED ACCESS IN SHARE MODE
70 Sample Queries for Event Information
Page 71

Example A-7 Search Event Logs for a Query ID
This report searches event text for a full or partial query_id during a given time period.
SELECT
EVENT_NUMBER AS EVENT_NUMBER,
GENERATED_TIMESTAMP_LCT AS GEN_TIME,
SUBSTRING(SUBSTRING(SSID FROM CHAR_LENGTH('TANDEM. '))FOR LOCATE('.' ,SUBSTRING(SSID FROM
CHAR_LENGTH('TANDEM. ')) )-1) AS SUB_SYS,
trim(substring(Text FROM CHAR_LENGTH('00:00 01FEB09 001.01.1000 '))) AS Event_Text,
PROCESS_SEGMENT AS SEGMENT,
TRIM(PROCESS_ID) AS PROCESS_NAME,
NODE_ID AS NODE_ID,
PIN AS PIN,
SEGMENT_ID AS SEGMENT_ID,
SQLCD AS SQLCD,
FSERROR AS FSERROR,
COLLECTOR AS COLLECTOR,
LOG_TIMESTAMP_LCT AS LOG_TIME_LCT,
TEXT AS FULL_TEXT,
SSID
FROM
NEO.HP_METRICS.EVENTS_VW1
WHERE
GENERATED_TIMESTAMP_LCT >= TIMESTAMP '$$__FROM_TIME$$' - interval '1' second and
GENERATED_TIMESTAMP_LCT <= TIMESTAMP '$$__TO_TIME$$' + interval '1' second
AND UPSHIFT(TEXT) LIKE UPSHIFT('%$$QUERY_ID$$%')
ORDER BY
GEN_TIME DESC
FOR READ UNCOMMITTED ACCESS IN SHARE MODE
Example A-8 Search Event Logs for Subsystem
This report searches for all events for full or partial subsystem name and time period.
SELECT
EVENT_NUMBER AS EVENT_NUMBER,
GENERATED_TIMESTAMP_LCT AS GEN_TIME,
SUBSTRING(SUBSTRING(SSID FROM CHAR_LENGTH('TANDEM. '))FOR LOCATE('.' ,SUBSTRING(SSID FROM
CHAR_LENGTH('TANDEM. ')) )-1) AS SUB_SYS,
trim(substring(Text FROM CHAR_LENGTH('00:00 01FEB09 001.01.1000 '))) AS Event_Text,
PROCESS_SEGMENT AS SEGMENT,
TRIM(PROCESS_ID) AS PROCESS_NAME,
NODE_ID AS NODE_ID,
PIN AS PIN,
SEGMENT_ID AS SEGMENT_ID,
SQLCD AS SQLCD,
FSERROR AS FSERROR,
COLLECTOR AS COLLECTOR,
LOG_TIMESTAMP_LCT AS LOG_TIME_LCT,
TEXT AS FULL_TEXT,
SSID
FROM
NEO.HP_METRICS.EVENTS_VW1
WHERE
GENERATED_TIMESTAMP_LCT >= TIMESTAMP '$$__FROM_TIME$$' - interval '1' second and
GENERATED_TIMESTAMP_LCT <= TIMESTAMP '$$__TO_TIME$$' + interval '1' second
AND UPSHIFT(SSID) LIKE UPSHIFT('%$$SUBSYSTEM_NAME$$%')
ORDER BY
GEN_TIME DESC
FOR READ UNCOMMITTED ACCESS IN SHARE MODE
71
Page 72

Example A-9 Summary of all Events
This report summarizes all events for a given time period and returns results grouped by SSID
and event number.
SELECT
COUNT(*) AS CNT,
EVENT_NUMBER AS EVENT_NUMBER,
CASE
WHEN LEFT(SSID,6) = 'TANDEM'
THEN SUBSTRING(SUBSTRING(SSID
FROM
CHAR_LENGTH('TANDEM. '))FOR LOCATE('.' ,SUBSTRING(SSID
FROM
CHAR_LENGTH('TANDEM. ')) )-1)
ELSE SSID
END AS SUB_SYS,
MIN(GENERATED_TIMESTAMP_LCT) AS FIRST_TIME,
MAX(GENERATED_TIMESTAMP_LCT) AS LAST_TIME,
TRIM(SUBSTRING(MAX(TEXT)
FROM
CHAR_LENGTH('00:00 01FEB09 001.01.1000 ')) ) AS EXAMPLE_EVENT_TEXT,
SSID AS SSID
FROM
NEO.HP_METRICS.EVENTS_VW1
WHERE
GENERATED_TIMESTAMP_LCT >= TIMESTAMP '$$__FROM_TIME$$' and
GENERATED_TIMESTAMP_LCT <= TIMESTAMP '$$__TO_TIME$$'
GROUP BY
SSID,
EVENT_NUMBER
ORDER BY
CNT DESC FOR READ UNCOMMITTED ACCESS IN SHARE MODE
;
Sample Query Result
This example shows a report summarizing all events for a given time period and returns results
grouped by SSID and event number.
72 Sample Queries for Event Information
Page 73

B STATEMENT_TYPE Field
The following table provides the compiler-provided values for the STATEMENT_TYPE field of
the NEO.HP_METRICS.ODBC_QUERY_STATS_VW2 Repository view.
Statements/CommandsCompiler-Provided Value
SELECT, TABLESQL_SELECT_UNIQUE
SELECT, TABLE, EXPLAINSQL_SELECT_NON_UNIQUE
INSERT, VALUESSQL_INSERT_UNIQUE
INSERT, VALUESSQL_INSERT_NON_UNIQUE
UPDATING A UNIQUE ROW, MERGE_INTOSQL_UPDATE_UNIQUE
UPDATESQL_UPDATE_NON_UNIQUE
DELETESQL_DELETE_UNIQUE
DELETESQL_DELETE_NON_UNIQUE
CONTROL QUERY DEFAULTSQL_CONTROL
SET TRANSACTIONSQL_SET_TRANSACTION
SET SCHEMASQL_SET_SCHEMA
SQL_OTHER
SQL_CALL_WITH_RESULT_SETS
SQL_CAT_UTIL
ALTER/CREATE/DROP SYNONYM
ALTER/CREATE/DROP TABLE
ALTER/CREATE/DROP MATERIALIZED VIEW
ALTER/CREATE/DROP VIEW
ALTER/CREATE/DROP MVGROUP
ALTER/CREATE/DROP TRIGGER
CREATE/DROP INDEX
CREATE/DROP SCHEMA
GRANT/REVOKE
GRANT/REVOKE SCHEMA
GRANT/REVOKE EXECUTE
ROLLBACK WORK
BEGIN WORK
COMMIT WORK
CALLSQL_CALL_NO_RESULT_SETS
CALL (Statements that execute stored procedure returning
result sets)
UPDATE STATISTICS, REFRESH, Utility commands that
are implemented as internal stored procedures
MAINTAIN, REPLICATE, PURGEDATASQL_EXE_UTIL
Insert using user load commandSQL_EXEC_INSERT_RWRS
73
Page 74

74
Page 75

C Repository Views Disabled by Default
This appendix contains the following views that have been disabled by default:
• “VIEW NEO.HP_METRICS.PROCESS_STATS_V1” (page 75)
• “VIEW NEO.HP_METRICS.PROCESS_AGGR_LEVEL1_STATS_V1” (page 78)
• “VIEW NEO.HP_METRICS.TABLE_STATS_V2 and VIEW
NEO.HP_METRICS.TABLE_STATS_DETAIL_V2” (page 83)
Process Statistics
The two views used for access to process statistics differ in that one includes a record for each
measured process, whereas the other aggregates information about measured processes of specific
types. If process data collection is enabled, both views are populated with data.
NOTE: Process statistics are not turned on by default. If you want HP Support to enable process
statistics, please contact your HP Support representative.
The measurements apply to four key process types:
• The Neoview SQL compiler (MXCMP)
• The Neoview SQL executor server process (MXESP)
• The Neoview NDCS server (MXOSRVR)
• The Repository collector processes (MMCOLLEC)
By default, a measurement of each of these processes occurs every five minutes. Aggregates are
computed every five minutes with a 15–minute delay: that is, aggregate data becomes available
from the Repository 15 minutes after the end of the sampling interval.
VIEW NEO.HP_METRICS.PROCESS_STATS_V1
NOTE: Process statistics are not turned on by default. If you want HP Support to enable process
statistics, please contact your HP Support representative.
This view is populated only if process data collection is enabled.
In this view, all CHARACTER columns use ISO88591 encoding, regardless of the underlying
Neoview platform configuration.
The primary key for PROCESS_STATS_V1 field definition is SEGMENT_ID, NODE_ID, PIN,
and METRIC_CLASS_ID.
Table C-1 PROCESS_STATS_V1 Field Definitions
SEGMENT_ID
DEFAULT
NODE_ID
PIN
INTEGER UNSIGNED NO
DEFAULT
DEFAULT
TIMESTAMP(6)MEASURE_END_DATETIME
DescriptionData TypeField Name
Segment number of the processINTEGER UNSIGNED NO
Processing node number of the process
being measured
Unique number.INTEGER UNSIGNED NO
ANSI SQL timestamp, in Local Civil
Time, indicating when the
measurement interval ended
DATEMEASURE_END_DATE
ANSI SQL date, in Local Civil Time,
indicating when the measurement
interval ended
Process Statistics 75
Page 76

Table C-1 PROCESS_STATS_V1 Field Definitions (continued)
DescriptionData TypeField Name
METRIC_CLASS_ID
TIME(6)MEASURE_END _TIME
TIMESTAMP(6)MEASURE_END_DATETIME_UTC
DATEMEASURE_END _DATE_UTC
TIME(6)MEASURE_END _TIME_UTC
INTEGER UNSIGNED NO
DEFAULT
INTEGER UNSIGNEDMETRIC_CLASS_VERSION
TIMESTAMP(6)MEASURE_START_DATETIME
DATEMEASURE_START_DATE
ANSI SQL time, in Local Civil Time,
indicating when the measurement
interval ended
ANSI SQL timestamp, in Coordinated
Universal Time, indicating when the
measurement interval ended
ANSI SQL date, in Coordinated
Universal Time, indicating when the
measurement interval ended
ANSI SQL time, in Coordinated
Universal Time, indicating when the
measurement interval ended
Repository assigned value. Used
internally.
Repository assigned value. Used
internally.
ANSI SQL timestamp, in Local Civil
Time, indicating when the
measurement interval began
ANSI SQL date, in Local Civil Time,
indicating when the measurement
interval began
TIME(6)MEASURE_START_TIME
TIMESTAMP(6)MEASURE_START_DATETIME_UTC
DATEMEASURE_START_DATE_UTC
TIME(6)MEASURE_START_TIME_UTC
LARGEINTDELTA_TIME
INTEGER UNSIGNEDPRIORITY
NUMERIC(9, 0)USERID
ANSI SQL time, in Local Civil Time,
indicating when the measurement
interval began
ANSI SQL timestamp, in Coordinated
Universal Time, indicating when the
measurement interval began
ANSI SQL date, in Coordinated
Universal Time, indicating when the
measurement interval began
ANSI SQL time, in Coordinated
Universal Time, indicating when the
measurement interval began
Duration of the measurement in
microseconds
Neoview segment nameCHARACTER(8)SEGMENT_NAME
Name of the process being measuredCHARACTER(8)PROCESS_NAME
Object file name of the processCHARACTER(24)PROGRAM_FILE_NAME
Creation priority of the measured
process
Internal representation of a Neoview
role
76 Repository Views Disabled by Default
SMALLINT UNSIGNEDUSERID_GROUP
SMALLINT UNSIGNEDUSERID_USER
Part of the internal representation of a
Neoview role
Part of an internal representation of a
Neoview role
Page 77

Table C-1 PROCESS_STATS_V1 Field Definitions (continued)
DescriptionData TypeField Name
SMALLINT UNSIGNEDANCESTOR_NODE_ID
SMALLINT UNSIGNEDANCESTOR_PIN
CHARACTER(8)ANCESTOR_SEGMENT_NAME
CHARACTER(8)ANCESTOR_PROCESS_NAME
LARGEINTNODE_BUSY_TIME
LARGEINTREADY_TIME
LARGEINTMEM_QUE_TIME
LARGEINTDISPATCHES
Processing node of the parent process
(the process that started the process
being measured). If this information is
unavailable, the field contains the
value “unknown.”
Unique number associated with a
running instance of a process, in this
case the parent process, or “unknown.”
Name of the segment where the
ancestor process runs, or “unknown.”
Process name of the parent process, or
“unknown.”
Time, in microseconds, that the
processing node spent executing the
measured process
Time, in microseconds, that the
measured process spent either
executing or on the ready list
Time, in microseconds, that the
measured process spent waiting on
page faults
Number of times the process was
selected from the ready list and
executed by the processing node
identified by NODE_ID
LARGEINTPAGE_FAULTS
LARGEINTPRES_PAGES_QUE_TIME
LARGEINTEXT_SEGS_QUE_TIME
LARGEINTRECV_QUE_TIME
LARGEINTMESSAGES_SENT
LARGEINTRETURNED_BYTES
LARGEINTMESSAGES_RECEIVED
LARGEINTRECEIVED_BYTES
LARGEINTREPLY_BYTES
Number of page faults generated by
the process
Time, in microseconds, that pages
sponsored by the measured process
spent in main memory
Time, in microseconds, that extended
segments were allocated to the process
Time, in microseconds, that messages
spent waiting on a process message
input queue
Number of messages sent by the
process (associated with I/O operations
and some system procedure calls)
Number of bytes sent by the processLARGEINTSENT_BYTES
Number of message bytes received by
the process
Number of messages that the process
has read from its message input queue
Number of message bytes received by
the process
Number of message bytes sent by this
process in reply to a request from
another process
Process Statistics 77
Page 78

Table C-1 PROCESS_STATS_V1 Field Definitions (continued)
DescriptionData TypeField Name
LARGEINTFILE_OPEN_CALLS
LARGEINTBEGIN_TRANS
LARGEINTABORT_TRANS
LARGEINTPRES_PAGES_START
LARGEINTPRES_PAGES_END
LARGEINTMSGS_SENT_QUE_TIME
Number of calls to open regular files,
pipes, FIFOs, AF_INET sockets,
AF_UNIX sockets, directories, and
other files, including implicit opens
due to process creation APIs
Number of times the process began a
transaction
Number of times the process stopped
a transaction in progress, causing the
transaction to be rolled back
Number of pages in main memory
sponsored by the measured process at
the start of the measurement interval
Number of pages in main memory
sponsored by the measured process at
the end of the measurement interval
Time, in microseconds, that messages
sent by the process were outstanding
VIEW NEO.HP_METRICS.PROCESS_AGGR_LEVEL1_STATS_V1
NOTE: Process statistics are not turned on by default. If you want HP Support to enable process
statistics, please contact your HP Support representative.
Each row of this view represents statistics, or aggregate statistics, for one of the following processes
or sets of processes:
• All executor server processes for a given parent (NDCS server) process.
• All Repository collector processes for a given parent process.
• Each NDCS server process.
• Each Neoview SQL compiler process. In the case of a compiler process, the parent process
will not be identified in the Repository record.
This view is populated only if process data collection is enabled.
Aggregates represent differences between the previous aggregation period and the current
aggregation period.
In the case of an NDCS server process or a Neoview SQL compiler process, statistics are not
really aggregates because each record represents only one process.
In this view, all CHARACTER columns use ISO88591 encoding, regardless of the underlying
Neoview platform configuration.
The primary key for PROCESS_AGGR_LEVEL1_STATS_V1 field definition is SEGMENT_ID,
NODE_ID, PIN, and SAMPLE_DATETIME_UTC.
Table C-2 PROCESS_AGGR_LEVEL1_STATS_V1 Field Definitions
DescriptionData TypeField Name
SMALLINT UNSIGNEDSEGMENT_ID
Segment number of the parent
process
78 Repository Views Disabled by Default
TIMESTAMP(6)SAMPLE_DATETIME
DATESAMPLE_DATE
ANSI SQL timestamp of the
aggregation, in Local Civil Time.
ANSI SQL date of the
aggregation, in Local Civil Time.
Page 79

Table C-2 PROCESS_AGGR_LEVEL1_STATS_V1 Field Definitions (continued)
DescriptionData TypeField Name
TIME(6)SAMPLE_TIME
TIMESTAMP(6)SAMPLE_DATETIME_UTC
DATESAMPLE_DATE_UTC
TIME(6)SAMPLE_TIME_UTC
SMALLINT UNSIGNEDNODE_ID
SMALLINT UNSIGNEDPIN
CHARACTER(8)METRIC_TYPE
ANSI SQL time of the
aggregation, in Local Civil Time.
ANSI SQL timestamp of the
aggregation, in Coordinated
Universal Time.
ANSI SQL date of the
aggregation, in Coordinated
Universal Time.
ANSI SQL time of the
aggregation, in Coordinated
Universal Time.
Processing node number of the
parent process
Unique number representing a
running instance of a process, in
this case the parent process, or
“unknown.”
“MXCMP ” for the SQL
compiler, “MXESP ” for the SQL
executor server process,
“MXOSRVR ” for the NDCS
server, “MMCOLLEC ” for the
Repository collector
Neoview segment nameCHARACTER(8)SEGMENT_NAME
CHARACTER(24)CHILD_PROGRAM_FILE_NAME
INTEGER UNSIGNEDMIN_PRIORITY
INTEGER UNSIGNEDAVG_PRIORITY
INTEGER UNSIGNEDMAX_PRIORITY
INTEGER UNSIGNEDCHILD_COUNT
LARGEINTTOTAL_CHILD_ELAPSED_TIME
LARGEINTTOTAL_CHILD_BUSY_TIME
Object file name of the process
type for which statistics are
aggregated in this record, e.g.,
$SYSTEM.SYSTEM.MXESP
Minimum creation priority for
all processes described by this
record
Average creation priority all
processes described by this
record
Maximum creation priority for
all processes described by this
record
Number of processes included
in this aggregation
Sum of elapsed times, in
microseconds, between the end
of the last aggregation period
and the end of this one, for all
processes described by this
record
Sum of CPU busy time, in
microseconds, for all processes
described by this record, since
the last aggregation
Process Statistics 79
Page 80

Table C-2 PROCESS_AGGR_LEVEL1_STATS_V1 Field Definitions (continued)
DescriptionData TypeField Name
DECIMAL(6,2)CHILD_SYSTEM_BUSY_PCT
DECIMAL(6,2)MIN_CHILD_ BUSY_PCT
DECIMAL(6,2)AVG_CHILD_ BUSY_PCT
DECIMAL(6,2)MAX_CHILD_ BUSY_PCT
LARGEINTBUSY_HISTOGRAM_1
LARGEINTBUSY_HISTOGRAM_1_25
LARGEINTBUSY_HISTOGRAM_25_50
Total child busy time, in
microseconds, divided by the
number of processing nodes in
the cluster
Minimum CPU busy time since
the last aggregation, for all
processes described by this
record
Average CPU busy time since
the last aggregation, for all
processes described by this
record
Maximum CPU busy time since
the last aggregation, for all
processes described by this
record
Number of processes with a CPU
busy percentage less than 1
Number of processes with a CPU
busy percentage between 1 and
25
Number of processes with a CPU
busy percentage between 25 and
50
LARGEINTBUSY_HISTOGRAM_50-75
LARGEINTBUSY_HISTOGRAM_75_95
LARGEINTBUSY_HISTOGRAM_95
LARGEINTAVG_HISTOGRAM_1
LARGEINTAVG_HISTOGRAM_1_25
LARGEINTAVG_HISTOGRAM_25_50
LARGEINTAVG_HISTOGRAM_50-75
LARGEINTAVG_HISTOGRAM_75_95
Number of processes with a CPU
busy percentage between 50 and
75
Number of processes with a CPU
busy percentage between 75 and
95
Number of processes with a CPU
busy percentage greater than 95
Average percent busy of all
processes with a CPU busy
percentage less than 1
Average percent busy of all
processes with a CPU busy
percentage between 1 and 25
Average percent busy of all
processes with a CPU busy
percentage between 25 and 50
Average percent busy of all
processes with a CPU busy
percentage between 50 and 75
Average percent busy of all
processes with a CPU busy
percentage between 75 and 95
80 Repository Views Disabled by Default
LARGEINTAVG_HISTOGRAM_95
Average percent busy of all
processes with a CPU busy
percentage greater than 95
Page 81

Table C-2 PROCESS_AGGR_LEVEL1_STATS_V1 Field Definitions (continued)
DescriptionData TypeField Name
LARGEINTSTDDEV_HISTOGRAM_1
LARGEINTSTDDEV _HISTOGRAM_1_25
LARGEINTSTDDEV _HISTOGRAM_25_50
LARGEINTSTDDEV _HISTOGRAM_50-75
LARGEINTSTDDEV _HISTOGRAM_75_95
LARGEINTSTDDEV _HISTOGRAM_95
LARGEINTTOTAL_CHILD_READY_TIME
Standard deviation of percent
busy for processes with a CPU
busy percentage less than 1
Standard deviation of percent
busy for processes with a CPU
busy percentage between 1 and
25
Standard deviation of percent
busy for processes with a CPU
busy percentage between 25 and
50
Standard deviation of percent
busy for processes with a CPU
busy percentage between 50 and
75
Standard deviation of percent
busy for processes with a CPU
busy percentage between 75 and
95
Standard deviation of percent
busy for processes with a CPU
busy percentage greater than 95
Sum of ready time, in
microseconds, for all aggregated
processes
DECIMAL(6,2)CHILD_SYSTEM_ READY _PCT
DECIMAL(6,2)MIN_CHILD_ READY _PCT
DECIMAL(6,2)AVG_CHILD_ READY _PCT
DECIMAL(6,2)MAX_CHILD_ READY _PCT
INTEGER UNSIGNEDNUMBER_OF_WAITING_CHILDREN
INTEGER UNSIGNEDNUMBER_OF_ACTIVE_DISPATCHING_ CHILDREN
INTEGER UNSIGNEDMIN_NUMBER_OF_DISPATCHES
INTEGER UNSIGNEDAVG_NUMBER_OF_DISPATCHES
Ready time divided by the
number of nodes in the cluster
Minimum ready time, in
microseconds, for all processes
described by the record
Average ready time, in
microseconds, for all processes
described by the record
Maximum ready time, in
microseconds, for all processes
described by the record
Number of processes with ready
time greater than 25 percent
Number of processes that had
more than 30 dispatches
Among processes that had more
than 30 dispatches, the smallest
number of dispatches for any
process
Among processes that had more
than 30 dispatches, the average
number of dispatches per
process
INTEGER UNSIGNEDMAX_NUMBER_OF_DISPATCHES
Among processes that had more
than 30 dispatches, the greatest
number of dispatches for any
process
Process Statistics 81
Page 82

Table C-2 PROCESS_AGGR_LEVEL1_STATS_V1 Field Definitions (continued)
DescriptionData TypeField Name
INTEGER UNSIGNEDNUMBER_OF_CHILDREN_W_PAGE_FAULTS
INTEGER UNSIGNEDMIN_NUMBER_OF_PAGE_FAULTS
INTEGER UNSIGNEDAVG_NUMBER_OF_ PAGE_FAULTS
INTEGER UNSIGNEDMAX_NUMBER_OF_ PAGE_FAULTS
INTEGER UNSIGNEDNUMBER_OF_CHILDREN_W_FILE_OPEN_CALLS
INTEGER UNSIGNEDMIN_NUMBER_OF_FILE_OPEN_CALLS
INTEGER UNSIGNEDAVG_NUMBER_OF_ FILE_OPEN_CALLS
Count of processes with page
faults
Among processes that had page
faults, the smallest number of
page faults
Among processes that had page
faults, the average number of
page faults
Among processes that had page
faults, the maximum number of
page faults
Number of processes with calls
to open regular files, pipes,
FIFOs, AF_INET sockets,
AF_UNIX sockets, directories,
and other files, including implicit
opens due to process creation
APIs
Among processes that had file
open calls, the minimum number
of file open calls
Among processes that had file
open calls, the average number
of file open calls
Table Statistics
Table statistics are not turned on by default. If you want HP Support to enable table statistics,
please contact your HP Support representative.
The Repository includes two views that provide access to data about tables or materialized views
whose histogram statistics are missing or out of date. The views have identical column definitions
but satisfy different purposes:
INTEGER UNSIGNEDMAX_NUMBER_OF_ FILE_OPEN_CALLS
INTEGER UNSIGNEDNUMBER_OF_CHILDREN_W_ PRES_PAGES_END
INTEGER UNSIGNEDMIN_NUMBER_OF_ PRES_PAGES_END
INTEGER UNSIGNEDAVG_NUMBER_OF_ PRES_PAGES_END
INTEGER UNSIGNEDMAX_NUMBER_OF_ PRES_PAGES_END
Among processes that had file
open calls, the maximum
number of file open calls
Number of processes that had
pages present in memory at the
end of the measurement interval
Among processes that had pages
present in memory at the end of
the interval, the minimum
number of pages present
Among processes that had pages
present in memory at the end of
the interval, the average number
of pages present
Among processes that had pages
present in memory at the end of
the interval, the maximum
number of pages present
82 Repository Views Disabled by Default
Page 83

• TABLE_STATS_V2 provides the most recently collected data for each monitored object.
Thus, the view includes only one row per monitored table or materialized view.
• TABLE_STATS_DETAIL_V2 presents all the data collected for the table or materialized view
since it began to be monitored. The view provides a row for each condition reported by the
table monitoring process. Thus, the view includes one row for every data collection interval.
For example, the following report could result from a query of TABLE_STATS_DETAIL_V2.
FIRST_SUBMIT_TS LATEST_SUBMIT_TS OBJECT_NAME MON_STATUS MISSING_STATS
-------------------------- -------------------------- ------------------------------ ---------- ---------
2007-10-11 10:03:01.000029 2007-10-11 10:03:01.000029 NEO.SCHEMA1.TABLE1 Up
SEGMENT_ID (2),DISK_NAME (1),(SEGMENT_ID, DISK_NAME) (1)
2007-10-11 10:04:00.992523 2007-10-11 11:25:00.995953 NEO.SCHEMA1.TABLE1 Up
(SEGMENT_ID, DISK_NAME) (1)
2007-10-11 11:26:00.991639 2007-10-11 11:31:01.00082 NEO.SCHEMA1.TABLE1 Dropped
-
2007-10-11 11:32:00.99343 2007-10-11 11:32:00.99343 NEO.SCHEMA1.TABLE1 Removed
A report on the same object from TABLE_STATS_V2 would show only the most recent information
about the object:
FIRST_SUBMIT_TS LATEST_SUBMIT_TS OBJECT_NAME MON_STATUS MISSING_STATS
-------------------------- -------------------------- ------------------------------ ---------- ---------
2007-10-11 11:32:00.99343 2007-10-11 11:32:00.99343 NEO.SCHEMA1.TABLE1 Removed
The Repository gets table data from the Neoview Management Dashboard, which begins to
monitor a table in two circumstances:
• Neoview event services generate runtime warnings when a table has missing statistics. Any
table that is the subject of such a warning is monitored until fifteen minutes after the statistics
are updated.
• The Dashboard Table SGP gathers information about monitored tables that have missing
or obsolete statistics or that need reorganization. HP Support can customize the Dashboard
configuration to specify which tables are monitored.
To update outdated statistics, perform an Update Statistics operation on the table.
VIEW NEO.HP_METRICS.TABLE_STATS_V2 and VIEW NEO.HP_METRICS.TABLE_STATS_DETAIL_V2
These views will not show any data because the data is not available from the metrics provider
(Dashboard).
Character columns use ISO88591 or UCS2 encoding, as appropriate to the Neoview platform
configuration. If the platform is UCS2 or SJIS, all character columns are created with CHARACTER
SET UCS2. If the platform is ISO88591, all CHAR columns are created with CHARACTER SET
ISO88591.
The primary key for these views is CATALOG_NAME, SCHEMA_NAME, OBJECT_NAME,
OBJECT_NAME_SPACE,L FIRST_SUBMIT_TS, and LATEST_SUBMIT_TS.
Table C-3 TABLE_STATS_V2 and TABLE_STATS_DETAIL_V2 Field Definitions
TIMESTAMP(6)FIRST_SUBMIT_TS
TIMESTAMP(6)LATEST_SUBMIT_TS
CHAR(128)CATALOG_NAME
DescriptionData TypeField Name
Timestamp in Local Civil Time when the
data in this record was first submitted to the
Repository.
Timestamp in Local Civil Time when the
data in this record was most recently
submitted to the Repository.
Name of the catalog in which the object (e.g.,
the table) is stored
CHAR(128)SCHEMA_NAME
CHAR(128)OBJECT_NAME
Name of applicable schema for the object
(e.g., the table).
Name of the table, index, or materialized
view.
Table Statistics 83
Page 84

Table C-3 TABLE_STATS_V2 and TABLE_STATS_DETAIL_V2 Field Definitions (continued)
DescriptionData TypeField Name
UTC_BIAS
CHAR(22)OBJECT_NAME_SPACE
CHAR(22)OBJECT_TYPE
CHAR(16)MONITOR_STATUS_TXT
INTERVAL
MINUTE (3)
Namespace in which the object is visible,
currently: ‘TABLE'
Kind of object, one of: ‘TABLE’ ‘MAT VIEW’
or ‘_’
“Up” means the table or materialized view
is being monitored. “Dropped” means that
the table or materialized view was dropped
or renamed, and no other object with the
same name was created. “Removed” means
the table or materialized view is no longer
being monitored and will stop appearing in
displays 15 minutes after that change in
status. “NoTable” means that a table was
specified in the Dashboard server
configuration as a monitored object, but no
table of the specified name exists. If all
missing statistics for an automatically
monitored object are updated and
reorganization status is COMPLETED, the
object will no longer be monitored after
fifteen minutes.
Offset in minutes from Coordinated
Universal Time for the local system at time
this record was written. The maximum offset
is 720 minutes. The value can be positive or
negative.
DISTINCT_STATS
TIMESTAMP(6)MIN_STATS_TS
TIMESTAMP(6)MAX_STATS_TS
SMALLINT
UNSIGNED
TIMESTAMP(6)UPDATE_STATS_RUNNING_TS
TIMESTAMP(6)LAST_REORG_TS
INTEGERMISSING_STATS_COUNT
Timestamp, in Local Civil Time, when
update statistics was first run on the table.
If there is no HISTOGRAMS table or no row
for this object, the value in this field is NULL.
Timestamp, in Local Civil Time, of the most
recent update statistics operation on the
table. If there is no HISTOGRAMS table or
no row for this object, the value in this field
is NULL.
Number of times update statistics has run
on the table.
If update statistics is currently running, start
time for that operation, in Local Civil Time.
Time at which the last reorganization of the
table occurred.
COMPLETED, IN_PROGRESS, or NONECHAR(11)REORG_STATUS
Total count of missing statistics events for
this object.
84 Repository Views Disabled by Default
Page 85

Table C-3 TABLE_STATS_V2 and TABLE_STATS_DETAIL_V2 Field Definitions (continued)
DescriptionData TypeField Name
VARCHAR(1740)MISSING_STATS
VARCHAR(1024)REPAIR_ACTION
Cumulative list of columns for which
statistics are missing, or “-” if the data is not
the result of a runtime warning. Value is a
comma-separated list in which each member
has the form column(number) or (column,
column)(number), where column is a
column name, and number is the
corresponding number of missing statistics
warnings. If no columns with missing
statistics have been identified so far, the
value in this field is NULL.
Proposed repair action (update statistics), or
“-” if the data is not the result of a runtime
warning. If no columns with missing
statistics have been identified so far, the
value in this field is NULL.
Table Statistics 85
Page 86

86
Page 87

D History of New and Changed Information in Previous
Releases of the Repository
New and Changed Information in Previous Editions
The Release 2.4 Service Pack 2 (SP2) edition of this manual includes the following new and
changed information:
• New fields in QUERY_STATS_VW1: DISK_PROCESS_BUSY_TIME_SEC and
MASTER_EXECUTION_TIME_SEC. See “VIEW NEO.HP_METRICS.QUERY_STATS_VW1”
(page 89).
• New fields in SQL_TEXT_VW1: EXEC_START_LCT_TS and EXEC_START_UTC_TS. See
“VIEW NEO.HP_METRICS.SQL_TEXT_VW1” (page 32).
• New space management views: VIEW
NEO.HP_METRICS.SPACE_PARTITION_DETAIL_VW1 and VIEW
NEO.HP_METRICS.SPACE_PARTITION_DETAIL_HISTORY_VW1. See “Space Management
Views and Sample Query Views for Space Management” (page 47).
• New sample query views for space management. See “Sample Query Views for Space
Management” (page 54).
The Release 2.4 Service Pack 1 (SP1) edition of this manual includes the following new and
changed information:
• Data retention times were changed. See “Configuring Retention Times for Data” (page 17).
• Removed references to NCHAR and NCHAR VARYING.
• Added a new view for accessing data from error event logs:
NEO.HP_METRICS.EVENTS_VW1, and Appendix A: “Sample Queries for Event
Information” (page 67) with sample queries to obtain reports about these events.
• Added two new views for accessing all query statistics:
— QUERY_STATS_VW1 – shows all available statistics for a query in a single row for each
execution of that query.
— SQL_TEXT_VW1 – stores the complete SQL text for queries that are longer than 254
characters.
A maximum of 16000 characters of SQL text can be stored in each of the multiple rows
in this view. The first 254 characters of SQL text are also included in one of the fields
in QUERY_STATS_VW1. When the SQL text for a query exceeds 254 characters, the
entire query text is stored in SQL_TEXT_VW1.
• Added “Pre-R2.5 Query Statistics Views” (page 89) and moved three views to it. These
views currently exist on the Neoview platform only so that existing queries will succeed.
You can use these views to obtain current query statistics. However, you are encouraged to
update your queries to use the new views, QUERY_STATS_VW1 and SQL_TEXT_VW1, as
soon as possible.
— ODBC_QUERY_STATS_V1
— ODBC_QUERY_STATS_V2
— QUERY_RUNTIME_STATS_V1
• Added three views. They exist on the Neoview platform so that queries can access data from
R2.4 only. This data is static and will never be updated.
— ODBC_QUERY_STATS_V1_2400
— ODBC_QUERY_STATS_V2_2400
— QUERY_RUNTIME_STATS_V1_2400
• Added “History of Field Changes for Repository” (page 131) and moved the Repository
history from “Repository Views” (page 19) to this appendix.
• Removed new and changed manual information for previous editions to its own section,
leaving “New and Changed Information in This Edition” (page 9) for the current edition
only.
New and Changed Information in Previous Editions 87
Page 88

The Release 2.4 edition of this manual included the following new and changed information:
• Clarify and correct text related to space and heap.
• Miscellaneous other corrections and clarifications.
The Release 2.3 edition of this manual included the following new and changed information:
• Description of Query Runtime Statistics as a standard feature, and enhancements to the
view that provides access to the data.
• Description of the Disk entity and views that provide metric information for Disks.
• Updates to reflect enhancements in the gathering of Table statistics.
• Notes on support for alternative (Japan Shift-JIS and Unicode) character sets, where
applicable.
• Naming changes to reflect the catalog and schema within which Repository views are defined.
The new catalog name is NEO; the new schema name is HP_METRICS.
• Naming changes to reflect the fact that the product formerly called Neoview Script is now
called Neoview Command Interface.
• Deletion of text and descriptions of prepackaged queries, which are no longer part of the
Repository product. (The Neoview Reports product includes prepackaged queries. For more
information, see the Neoview Reports Online Help.)
• Removal of references to the table census utility, which is superseded by new functions in
the Table data collector.
The Release 2.2 edition of this manual included the following new and changed information:
• Descriptions of new Repository views that provide access to Query Runtime Statistics and
Table metrics.
• Field naming changes in most Repository views, to reflect standard Neoview terminology.
For example, the term “node” has been replaced by “segment” in the views themselves, and
thus in the documentation, wherever applicable.
• Removal of deprecated Repository views (which had names starting with ACCESS). These
views are still present in the software but no longer described in the manual.
• New ANSI SQL Date and Time columns, which permit ANSI SQL standard date and time
computations.
• Enhancements to Repository status queries to incorporate new features, such as support for
Table metrics.
• New prepackaged queries, and changes in existing queries, to reflect new Repository features
and field naming changes.
88 History of New and Changed Information in Previous Releases of the Repository
Page 89

E Pre-R2.5 Query Statistics Views
Query Statistics for R2.4 SP2
VIEW NEO.HP_METRICS.QUERY_STATS_VW1
Repository collects compilation and execution query statistics.
This view provides access to all query information. The SQL text for the query is also included,
up to 254 characters. If the SQL text is longer than 254 characters, the
SQL_TEXT_OVERFLOW_INDICATOR field is set to 1 to indicate that only part of the SQL text fits
in this view, and the complete SQL text is placed in the SQL_TEXT_VW1 view. In this case,
QUERY_STATS_VW1 has the first 254 characters and SQL_TEXT_VW1 has the complete SQL
text. The QUERY_STATS_VW1 view can be joined with the SQL_TEXT_VW1 view through the
EXEC_START_LCT_TS (or EXEC_START_UTC_TS) and QUERY_ID fields to fetch the full SQL
text for the query.
Character columns use ISO88591 or UCS2 encoding, as appropriate to the Neoview platform
configuration. If the platform is UCS2 or SJIS, all character columns are created with CHARACTER
SET UCS2. If the platform is ISO88591, all CHAR columns are created with CHARACTER SET
ISO88591.
The Primary Key for QUERY_STATS_VW1 field definition is EXEC_START_UTC_TS and
QUERY_ID.
Table E-1 QUERY_STATS_VW1 Field Definitions
EXEC_START_LCT_TS
EXEC_START_UTC_TS
QUERY_ID
TIMESTAMP(6) NO
DEFAULT
TIMESTAMP(6) NO
DEFAULT
CHAR(160) NO
DEFAULT
DescriptionData TypeField Name
ANSI Timestamp, in Local Civil Time,
indicating when query execution began. That
is, the time when an execute statement is
issued for the prepared query.
If the query is controlled by WMS, this value
reflects the time it was ready to be submitted
to the WMS system. Depending on WMS
rules and threshold settings, WMS may delay
or cancel the actual launch of the query.
Columns SUBMIT_TS_LCT, WAIT_TIME
and HOLD_TIME can be used to calculate
the actual launch time of the query.
If the query is not under control of WMS,
EXEC_START_LCT_TSrepresents the actual
launch time.
Example: 2009-08-17 07:47:28.795392
Primary Key
ANSI Timestamp, in Coordinated Universal
Time, indicating when query execution
began.
Example: 2009-08-17 15:47:28.795392
Primary Key
A unique identifier for this SQL statement,
generated by the Neoview SQL compiler.
Example:
MXID0100109050821211709056930627300
0000026312DEV.USER2400_15010_SQL_CUR_1
Query Statistics for R2.4 SP2 89
Page 90

Table E-1 QUERY_STATS_VW1 Field Definitions (continued)
DescriptionData TypeField Name
ENTRY_ID_LCT_TS
ENTRY_ID_UTC_TS
SEGMENT_NAME
PLATFORM_NAME
USER_NAME
TIMESTAMP(6) NO
DEFAULT
TIMESTAMP(6) NO
DEFAULT
CHAR(16) DEFAULT
NULL
CHAR(64) DEFAULT
NULL
CHAR(128) DEFAULT
NULL
Repository-generated ANSI Timestamp, in
Local Civil Time, showing when this row
was last updated.
Example: 2009-08-17 07:48:09.967095
Repository-generated ANSI Timestamp, in
Coordinated Universal Time, showing when
this row was last updated.
Example: 2009-08-17 15:48:09.967095
Name of the Neoview platform segment
used by the datasource to connect and start
the query. The Master Executor process for
the query is running in this segment.
Example: \NEO0101
Neoview system name, made up of the first
three letters of the system name, followed
by 01 for the first platform at your site, 02
for the second platform at your site, and so
on.
Example: NEO01
The name or alias, used at time of
connection, to identify a Neoview user. One
or more users can have the same Neoview
role.
Example: dbmgr
ROLE_NAME
START_PRIORITY
PROCESS_NAME
SESSION_ID
CLIENT_NAME
CHAR(128) DEFAULT
NULL
INTEGER UNSIGNED
DEFAULT NULL
CHAR(64) DEFAULT
NULL
CHARACTER(108)
DEFAULT NULL
VARCHAR(1024)
DEFAULT NULL
Neoview user role name. Multiple users can
have the same role name.
Example: DBA
Starting priority of the Master Executor
process for this query.
Example: 148
Process name of the NDCS server that is the
parent of the query. The format of this name
is \segment_name.$process_name.
Example: \NEO0101.$XYZ
Unique session ID generated by the NDCS
server when the ODBC/JDBC connection was
established.
Example: :
MXID010010905082121170905693062
73000000026312DEV.USER2400
TIP: The session ID is fully contained
within the query ID. To find all queries
executed within a specific session, join the
session statistics views and the query
statistics view on the session ID.
Name of the workstation that initiated the
query.
Example: testpc-8
APPLICATION_NAME
90 Pre-R2.5 Query Statistics Views
CHAR(130) DEFAULT
NULL
Name of the application used to connect to
the database and send the query.
Example: NCI.
Page 91

Table E-1 QUERY_STATS_VW1 Field Definitions (continued)
DescriptionData TypeField Name
DATASOURCE
STATEMENT_ID
STATEMENT_TYPE
CHARACTER(128)
DEFAULT NULL
CHARACTER(160)
DEFAULT NULL
CHARACTER(36)
DEFAULT NULL
Datasource name on the Neoview platform
to which the client connected.
Example: Admin_Load_DataSource
Unique statement ID generated by the NDCS
SQL server at the time the Prepare command
was received.
Example: SQL_CUR_1
Compiler-provided value, one of:
• SQL_SELECT_UNIQUE
• SQL_SELECT_NON_UNIQUE
• SQL_INSERT_UNIQUE
• SQL_INSERT_NON_UNIQUE
• SQL_UPDATE_UNIQUE
• SQL_UPDATE_NON_UNIQUE
• SQL_DELETE_UNIQUE
• SQL_DELETE_NON_UNIQUE
• SQL_CONTROL
• SQL_SET_TRANSACTION
• SQL_SET_CATALOG
• SQL_SET_SCHEMA
• SQL_OTHER
• SQL_UNKNOWN
• SQL_CALL_NO_RESULT_SETS
• SQL_CALL_WITH_RESULT_SETS
• SQL_SP_RESULT_SET
• SQL_CAT_UTIL
• SQL_EXE_UTIL
• SQL_NOT_SUPPORTED
For definitions of SQL statement types, see
Appendix B (page 73). The suffix _UNIQUE
indicates that the statement operates on a
single row. The suffix _NON_UNIQUE
indicates that the statement could operate
on multiple rows.
SERVICE_NAME
SEGMENT_ID
NODE_ID
SUBMIT_LCT_TS
CHAR(128) DEFAULT
NULL
INTEGER UNSIGNED
DEFAULT NULL
SMALLINT UNSIGNED
DEFAULT NULL
TIMESTAMP(6)
DEFAULT NULL
Name of service registered with Workload
Management Services (WMS).
Example: HP_DEFAULT_SERVICE
Segment number of the NDCS server that
reported the statistics.
The Master Executor process for the query
runs in this segment.
Example: 1
Processing node number of the NDCS server
that reported the statistics.
Example: 9
ANSI Timestamp, in Local Civil Time,
indicating when the query first entered
Workload Management Services (WMS).
Example: 2009-08-17 07:47:28.795755
Query Statistics for R2.4 SP2 91
Page 92

Table E-1 QUERY_STATS_VW1 Field Definitions (continued)
DescriptionData TypeField Name
SUBMIT_UTC_TS
COMPILE_START_LCT_TS
COMPILE_START_UTC_TS
COMPILE_END_LCT_TS
COMPILE_END_UTC_TS
TIMESTAMP(6)
DEFAULT NULL
TIMESTAMP(6) NO
DEFAULT
TIMESTAMP(6)
DEFAULT NULL
TIMESTAMP(6)
DEFAULT NULL
TIMESTAMP(6)
DEFAULT NULL
ANSI Timestamp, in Coordinated Universal
Time, indicating when the query first entered
Workload Management Services (WMS).
Example: 2009-08-17 15:47:28.795755
ANSI Timestamp, in Local Civil Time,
indicating when query compilation began.
That is, when a Prepare statement was issued
for this query.
Example: 2009-08-17 07:47:28.791758
ANSI Timestamp, in Coordinated Universal
Time, indicating when query compilation
began. That is, when a Prepare statement
was issued for this query.
Example: 2009-08-17 15:47:28.791758
ANSI Timestamp, in Local Civil Time,
indicating when query compilation ended.
That is, when the Prepare statement
completed for this query.
Example: 2009-08-17 07:47:28.795259
ANSI Timestamp, in Coordinated Universal
Time, indicating when query compilation
ended. That is, when the Prepare statement
completed for this query.
Example: 2009-08-17 15:47:28.795259
COMPILE_ELAPSED_TIME
COMPILE_ELAPSED_TIME_SEC
COMPILE_AFFINITY_NUM
COMPILE_DEGREE_OF_PARALLELISM
LARGEINT DEFAULT
NULL
FLOAT(54) DEFAULT
NULL
LARGEINT DEFAULT
NULL
INTEGER UNSIGNED
DEFAULT NULL
Calculated compile time in microseconds,
computed as compilation end time minus
compilation start time. This is the amount of
time needed to prepare the query.
This value is obtained from the compiler.
Example: 3501
Compile time in seconds, computed as
compilation end time minus compilation
start time. This is the amount of time needed
to prepare the query.
This value is obtained from the compiler.
Example: 0.0035009999999999998
Specifies the choice of CPU Subsets to be
used for placement of ESPs.. The value used
by the compiler for ESP placement for this
query.
Example: 697115338
Degree of parallelism used by the query. The
number of ESP operators that are reused to
parallelize a single fragment of the query
plan. If different fragments in the same plan
are parallelized to different extents, then this
counter reports the degree of parallelization
of the fragment that is parallelized the most.
Example: 0
92 Pre-R2.5 Query Statistics Views
Page 93

Table E-1 QUERY_STATS_VW1 Field Definitions (continued)
DescriptionData TypeField Name
COMPILE_TRANSACTION_NEEDED
COMPILE_MANDATORY_CROSS_PRODUCT
COMPILE_MISSING_STATS
INTEGER UNSIGNED
DEFAULT NULL
INTEGER UNSIGNED
DEFAULT NULL
INTEGER UNSIGNED
DEFAULT NULL
Indicates whether this query is required to
execute under a transaction. All SQL
statements require a transaction except
SELECT statements that use the READ
UNCOMMITTED isolation level.
Values:
• 1 = True
• 0 = False
Flags queries in which a join has been
specified with no predicates.
Joins with no predicates may result from
predicate movement during optimization or
simply because no predicate was specified
for the join.
Values:
• 1 = True
• 0 = False
Indicates whether single column missing
statistics warnings were raised during
compilation (SQLCODE 6008 or 6011).
Values:
• 1 = True
• 0 = False
Multi-column missing statistics warnings
(SQLCODE 6007 or 6010) are not flagged in
this field.
COMPILE_NUM_JOINS
COMPILE_FULL_SCAN_ON_TABLE
COMPILE_ROWS_ACCESSED_FULL_SCAN
COMPILE_DISK_PROCESS_ROWS_ACCESSED
COMPILE_DISK_PROCESS_ROWS_USED
DEFAULT NULL
INTEGER UNSIGNED
DEFAULT NULL
DOUBLE PRECISION
DEFAULT NULL
DOUBLE PRECISION
DEFAULT NULL
DOUBLE PRECISION
DEFAULT NULL
The number of joins in the query plan.INTEGER UNSIGNED
Indicates whether the query plan will
perform a full scan on at least one table.
Values:
• 1 = True
• 0 = False
The estimated number of rows accessed by
a full scan of a table. Valid only if Full Scan
On Table is set.
If the query plan contains more than one full
scan operation, the largest number of rows
accessed by all scans is reported here.
Values:
• Largest number of rows accessed
• -1.0 – Full Scan on Table is not set.
• Zero (0.0) – A full scan was performed on
an empty table.
Estimated number of rows to be accessed by
all scan, insert, update and delete operations
in the query plan.
Example: 5.0
Estimated number of rows accessed by scan
and insert operations in the query plan.
Example: 2.0
Query Statistics for R2.4 SP2 93
Page 94

Table E-1 QUERY_STATS_VW1 Field Definitions (continued)
DescriptionData TypeField Name
EST_COST
EST_CARDINALITY
EST_ACCESSED_ROWS
EST_USED_ROWS
EST_IO_TIME
DOUBLE PRECISION
DEFAULT NULL
DOUBLE PRECISION
NO DEFAULT
DOUBLE PRECISION
DEFAULT NULL
DOUBLE PRECISION
DEFAULT NULL
DOUBLE PRECISION
DEFAULT NULL
Estimated total cost (time in seconds) of the
SQL operations for this query in the Master
Executor.The estimate occurs at the time the
query is prepared.
Example: 1.74125E-6
Estimated number of rows that will be
returned. The estimate occurs at the time the
query is prepared.
Example: 10.0
Estimated number of rows to be accessed by
SELECT statements from Disk Process at
runtime by EID (Executor in Disk Process).
For Insert/Update/Delete statements, the
value is reported as 0.0.
Estimated number of rows to be returned by
EID (Executor in Disk Process) after applying
selection predicates based on SELECT
statements. For Insert/Update/Delete
statements, the value is reported as 0.0.
Estimate of the number of seconds of I/O
time (seeks plus data transfer) to perform
the I/O for this query. The estimate occurs
at the time the query is prepared.
Example: 0.0
EST_MSG_TIME
EST_IDLE_TIME
EST_NODE_TIME
EST_TOTAL_TIME
EST_TOTAL_MEM
DOUBLE PRECISION
DEFAULT NULL
DOUBLE PRECISION
DEFAULT NULL
DOUBLE PRECISION
DEFAULT NULL
DOUBLE PRECISION
DEFAULT NULL
DOUBLE PRECISION
DEFAULT NULL
Estimate of the number of seconds required
for the messaging for this query, including
local and remote messages, and the amount
of data sent. The estimate occurs at the time
the query is prepared.
Example: 0.0
Estimate of the number of seconds to wait
for an operation to complete, (e.g., opening
a table or starting a process). The estimate
occurs at the time the query is prepared.
Example: 0.0
Estimate of the number of seconds of
processor time it might take to execute
instructions for this operator. The estimate
occurs at the time the query is prepared.
Example: 1.74125E-6
Estimated time in seconds for the SQL
operations for this query. This estimate
includes estimates of I/O time, Message time,
and Node time, and does not include Idle
time. The estimate occurs at the time the
query is prepared.
Example: 1.74125E-6
Estimate, in kilobytes, of the memory that
the query plan will use. The value is
computed based on operators that could
potentially consume large amounts of
memory: Hash Join, Hash Groupby, Sort,
Merge Join and Sequence.
Example: 0.0
94 Pre-R2.5 Query Statistics Views
Page 95

Table E-1 QUERY_STATS_VW1 Field Definitions (continued)
DescriptionData TypeField Name
EST_RESOURCE_USAGE
QUERY_STATUS
QUERY_SUB_STATUS
INTEGER DEFAULT
NULL
CHAR(21) DEFAULT
NULL
CHAR(30) DEFAULT
NULL
Estimate of the number of seconds of
processor time it might take to execute the
query. The estimate occurs at the time the
query is prepared.
NOTE: For future use. Currently zero (0).
Status of the query. One of these:
INIT
COMPLETED
REJECTED
CANCELLED
Substatus of the query, dependent on
QUERY_STATUS
When QUERY_STATUS = COMPLETED or
CANCELLED, possible values for
QUERY_SUB_STATUS are:
• HOLD_TIMEOUT
• EXEC_TIMEOUT
• CANCELLED_BY_ADMIN
• QUERY_NOT_FOUND
• NDCS_PROCESS_FAILED
• CPU_FAILED
• SEGMENT_FAILED
• BY_EXEC_RULE
• SERVICE_NOT_ACTIVE
• UNEXPECTED_STATE
• CLIENT_DISAPPEARED
• CONNECTION_FAILED
When QUERY_STATUS = REJECTED,
possible values for QUERY_SUB_STATUS
are:
• BY_ADMIN
• CONNECTION_FAILED
• HOLD_TIMEOUT
• WAIT_TIMEOUT
• NDCS_PROCESS_FAILED
• CPU_FAILED
• SEGMENT_FAILED
• QUEUE_MSG_CANCELLED
• VERSION_MISMATCH
• WMS_ON_HOLD
• MAX_QUERIES_REACHED
• SERVICE_NOT_FOUND
• SERVICE_ON_HOLD
• BY_COMP_RULE
• UNKNOWN_USER
• CLIENT_DISAPPEARED
• UNEXPECTED_STATE
For more information, refer to the Neoview
Workload Management Services Guide.
Query Statistics for R2.4 SP2 95
Page 96

Table E-1 QUERY_STATS_VW1 Field Definitions (continued)
DescriptionData TypeField Name
QUERY_EXECUTION_STATE
WARN_LEVEL
STATS_ERROR_CODE
CHAR(25) DEFAULT
NULL
CHAR(7) DEFAULT
NULL
INTEGER DEFAULT
NULL
What the executor is doing. Possible query
states include:
INITIAL
OPEN
EOF
CLOSE
DEALLOCATED
FETCH
CLOSE_TABLES
PROCESS_ENDED
UNKNOWN
NULL
Warning level from WMS. Possible levels
include:
LOW
MEDIUM
HIGH
NONE
SQL error code, if any, returned while
obtaining statistics for the query. Indicates
whether the query completed with warnings,
errors or successfully:
• Positive number – Warning
For example, warning 8922 – one or more
nodes did not report statistics for this
query.
• Negative number – Error
• Zero (0) or 100 – Success
WAIT_TIME
HOLD_TIME
QUERY_ELAPSED_TIME
QUERY_ELAPSED_TIME_SEC
LARGEINT DEFAULT
NULL
LARGEINT DEFAULT
NULL
LARGEINT DEFAULT
NULL
FLOAT(54) DEFAULT
NULL
Query wait time in seconds. The amount of
time a query waited in WMS for a resource
(for example, CPU time) to become available
for the query to start executing.
Query hold time in seconds. The amount of
time the query spent in a WMS queue in a
HOLDING or SUSPENDED state due to:
• Rules configured in WMS.
• An external attempt to hold the query,
such as a HOLD QUERY command
issued from NCI by a WMS
administrator.
This counter is updated during the time
before the query starts executing.
Elapsed clock time in microseconds from the
time the query started executing to the time
the results were sent back.
Example: 31169481
Elapsed clock time, in seconds, from the time
the query started executing to the time the
results were sent back.
Example: 311694
96 Pre-R2.5 Query Statistics Views
Page 97

Table E-1 QUERY_STATS_VW1 Field Definitions (continued)
DescriptionData TypeField Name
SQL_PROCESS_BUSY_TIME
SQL_PROCESS_BUSY_TIME_SEC
DISK_PROCESS_BUSY_TIME
DISK_PROCESS_BUSY_TIME_SEC
DISK_IOS
LARGEINT DEFAULT
NULL
FLOAT(54) DEFAULT
NULL
LARGEINT DEFAULT
NULL
FLOAT(54) DEFAULT
NULL
LARGEINT DEFAULT
NULL
INTEGERNUM_SQL_PROCESSES
An approximation, in microseconds, of the
total node time spent in the Master Executor
process and all ESPs involved in the query.
This is a cumulative value, across all ESPs
across all segments.
Example: 31.169480999999998
An approximation, in seconds, of the total
node time spent in the Master Executor
process and all ESPs involved in the query.
This value is cumulative across all ESPs
across all segments.
Example: 39593
Cumulative node busy time in microseconds
for all disk processes involved in executing
the query.
Example: 0.039592999999999996
Cumulative node busy time, in seconds, for
all disk processes involved in executing the
query.
Example: : 0.000000039592999999999996
Number of physical disk I/O operations
(reads or writes) caused by accessing this
table.
The number of SQL processes involved in
execution of this query.
SQL_MEMORY_SPACE_ALLOCATED
SQL_MEMORY_SPACE_USED
SQL_MEMORY_HEAP_ALLOCATED
SQL_MEMORY_HEAP_USED
INTEGER DEFAULT
NULL
INTEGER DEFAULT
NULL
INTEGER SIGNED
DEFAULT NULL
INTEGER SIGNED
DEFAULT NULL
Amount of “space” type (static) memory, in
kilobytes, allocated (reserved) for query
processes (master executor and ESPs) at the
beginning of query execution. This value
stays constant for the duration of query
execution.
Amount of “space” type (static) memory, in
kilobytes, allocated (reserved) for query
processes (master executor and ESPs) at the
beginning of query execution.
This value stays constant for the duration of
query execution. It should be less than or
equal to the SQL_MEMORY_SPACE_
ALLOCATED value. This is the value at the
end of query execution.
Amount of “heap” type (dynamic) memory,
in kilobytes, allocated (reserved) for query
processes (master executor and ESPs) at the
beginning of query execution. The processes
that execute the query request this memory
during execution, thus the amount can
change as the query runs. This is the value
at the end of query execution.
Amount of “heap” type (dynamic) memory,
in kilobytes, actually used for query
processes (master executor and ESPs) during
query execution. This is the value at the end
of query execution.
Query Statistics for R2.4 SP2 97
Page 98

Table E-1 QUERY_STATS_VW1 Field Definitions (continued)
DescriptionData TypeField Name
EXECUTOR_IN_DISK_MEMORY_
SPACE_ALLOCATED
EXECUTOR_IN_DISK_MEMORY_
SPACE_USED
EXECUTOR_IN_DISK_MEMORY_
HEAP_ALLOCATED
EXECUTOR_IN-DISK_MEMORY_
HEAP_USED
TOTAL_MEMORY_ALLOCATED
INTEGER DEFAULT
NULL
INTEGER DEFAULT
NULL
INTEGER DEFAULT
NULL
INTEGER DEFAULT
NULL
LARGEINT DEFAULT
NULL
Amount of “space” type (static) memory, in
kilobytes, allocated (reserved) for the
Executor in Disk (EID) disk processes
involved in query execution. This process is
separate from master and ESPs, and all the
EID memory values are in addition to the
SQL memory values. This is the value at the
end of query execution.
Amount of “space” type (static) memory, in
kilobytes, actually used by the Executor in
Disk (EID) disk processes involved in query
execution. This is the value at the end of
query execution.
Amount of “heap” type (dynamic) memory,
in kilobytes, allocated for the Executor in
Disk (EID) disk processes involved in query
execution. This is the value at the end of
query execution.
Amount of “heap” type (dynamic) memory,
in kilobytes, actually used for the Executor
in Disk (EID) processes involved in query
execution. This is the value at the end of
query execution
Total memory allocated to the query. The
sum of SQL_MEMORY_SPACE_USED and
SQL_MEMORY_HEAP_USED.
MAX_MEMORY_EVER_USED
TRANSACTION_ID
NUM_REQUEST_MSGS
NUM_REQUEST_MSG_BYTES
NUM_REPLY_MSGS
NUM_REPLY_MSG_BYTES
FIRST_RESULT_RETURN_LCT_TS
FIRST_RESULT_RETURN_UTC_TS
ROWS_RETURNED_TO MASTER
LARGEINT DEFAULT
NULL
CHAR(25) DEFAULT
NULL
LARGEINT DEFAULT
NULL
LARGEINT DEFAULT
NULL
NULL
LARGEINT DEFAULT
NULL
TIMESTAMP(6)
DEFAULT NULL
TIMESTAMP(6)
DEFAULT NULL
LARGEINT DEFAULT
NULL
Maximum memory, in kilobytes, ever used
during the lifetime of the query.
Transaction identifier, in internal format, of
the transaction involved in executing the
query.
Count of messages that are initiated from
the Master Executor process to ESPs or ESP
to ESP. This count includes both control and
data messages.
Number of message bytes sent as part of
NUM_REQUEST_MSGS.
Count of reply messages from ESPs.LARGEINT DEFAULT
Number of bytes sent as part of the replies
from ESPs.
RMS timestamp in Local Civil Time when
SQL sends the first result row to the Master
Executor process.
RMS timestamp in Coordinated Universal
Time when SQL sends the first result row to
the Master Executor process.
Number of rows returned from the root
operator to the Master Executor process and
to the application in both the regular fetch
and rowset fetch.
98 Pre-R2.5 Query Statistics Views
Page 99

Table E-1 QUERY_STATS_VW1 Field Definitions (continued)
DescriptionData TypeField Name
PARENT_QUERY_ID
EXEC_END_LCT_TS
EXEC_END_UTC_TS
MASTER_EXECUTION_TIME
CHAR(160) DEFAULT
NULL
TIMESTAMP(6)
DEFAULT NULL
TIMESTAMP(6)
DEFAULT NULL
LARGEINT DEFAULT
NULL
Query ID for the immediate parent of this
query ID. If the parent query ID is not
present, value returned is NONE.
TIP: You can use the parent query ID to
relate a child SQL statement to an immediate
parent, then trace the relationship to find the
original SQL statement.
ANSI Timestamp in Local Civil Time
indicating when query execution ended.
Example: 2009-08-17 07:47:59.964873
ANSI Timestamp in Coordinated Universal
Time indicating when query execution
ended.
Example: 2009-08-17 15:47:59.964873
TIP: You can use this value to monitor
whether the query is still running.
Node processing time, in microseconds, from
the time the execution starts to the time the
results are returned. It does not include CPU
time consumed by SQL executor child
processes (ESPs) or disk processes for the
query.
Example: 40214
MASTER_EXECUTION_TIME_SEC
ERROR_CODE
SQL_ERROR_CODE
ERROR_TEXT
LAST_ERROR_BEFORE_AQR
FLOAT(54) DEFAULT
NULL
INTEGER DEFAULT
NULL
INTEGER DEFAULT
NULL
CHAR(200) DEFAULT
NULL
INTEGER DEFAULT
NULL
Node processing time, in seconds, from the
time the execution starts to the time the
results are returned. It does not include CPU
time consumed by SQL executor child
processes (ESPs) or disk processes for the
query.
Example: 0.040214
Query error code returned to the client. If
the NDCS process stops or fails, this field is
set to 201. In this case, the last statistics
available from WMS are retrievable with this
view.
Top–level error code returned by the query.
Values:
• 100 – completed SELECT, UPDATE, or
DELETE statements with actual end
statistics
• zero (0) – completed INSERT queries or
uncompleted queries
• negative number – an execution-type
error
Message text of the error returned by SQL.
See SQL_ERROR_CODE.
Last error code that caused the query to be
automatically retried.
DELAY_TIME_BEFORE_AQR_SEC
TOTAL_NUM_AQR_RETRIES
LARGEINT DEFAULT
NULL
LARGEINT DEFAULT
NULL
Delay time in seconds before the query was
automatically retried.
Total number of times that a query was
retried.
Query Statistics for R2.4 SP2 99
Page 100

Table E-1 QUERY_STATS_VW1 Field Definitions (continued)
DescriptionData TypeField Name
LOCK_ESCALATIONS
LOCK_WAITS
MESSAGE_BYTES_TO_DISK
MESSAGES_TO_DISK
ROWS_ACCESSED
ROWS_RETRIEVED
NUM_ROWS_IUD
NUM_OPENS
LARGEINT DEFAULT
NULL
LARGEINT DEFAULT
NULL
LARGEINT DEFAULT
NULL
LARGEINT DEFAULT
NULL
LARGEINT DEFAULT
NULL
LARGEINT DEFAULT
NULL
LARGEINT DEFAULT
NULL
LARGEINT DEFAULT
NULL
Cumulative number of times record (row)
locks were escalated to file (table) locks
during query execution.
Number of times the statement waited for a
lock request (concurrency cost). Access to
the table is delayed due to conflicting locks.
Ideally, this number is zero or very small.
Size, in bytes, of the total number of
messages sent to the Encapsulated SQL
Access Manager (ESAM).
Number of messages sent to ESAM. That is,
the number of messages exchanged between
the file system and the disk process.
Cumulative number of rows accessed in each
table to evaluate the statement. This includes
records examined by the disk process, the
file system, and the SQL Executor.
Cumulative number of rows retrieved and/or
actually used. Number of rows that were
returned by Executor in Disk (EID) process.
Number of rows actually inserted, updated,
deleted in the base tables, by a query.
The number of OPEN partition calls
performed by the SQL Executor on behalf of
this query.
OPEN_BUSY_TIME
OPEN_BUSY_TIME_SEC
PROCESSES_CREATED
PROCESS_CREATE_BUSY_TIME
PROCESS_CREATE_BUSY_TIME_SEC
SQL_TEXT
SQL_TEXT_OVERFLOW_INDICATOR
LARGEINT DEFAULT
NULL
FLOAT(54) DEFAULT
NULL
INTEGER UNSIGNED
DEFAULT NULL
LARGEINT NO
DEFAULT
FLOAT(54) DEFAULT
NULL
CHAR(254) DEFAULT
NULL
SMALLINT UNSIGNED
DEFAULT NULL
Time in microseconds this process spent
doing file OPENs.
Time in seconds this process spent doing file
OPENs.
Number of new processes created by the
Executor on behalf of this process.
Time in microseconds the Executor spent
creating new processes.
Time in seconds the Executor spent creating
new processes.
The first 254 characters of query SQL text. If
query text is longer than 254 characters, the
entire query text is available in “VIEW
NEO.HP_METRICS.SQL_TEXT_VW1”
(page 32).
Indicates the status of the SQL_TEXT field:
• zero (0)– all SQL Text for the query is in
this field.
• 1 – only a preview (the first 254
characters) of the text is in the SQL_TEXT
field and the entire query text is stored in
“VIEW
NEO.HP_METRICS.SQL_TEXT_VW1”
(page 32)
100 Pre-R2.5 Query Statistics Views
 Loading...