

Page 1
INSTRUCT
TYPE 1381
ION
MANUAL
RANDOM-NOISE GENERATOR
2Hz-
50kHz
GENERAL
A
RADIO
COMPANY
Page 2

Page 3
INSTRUCT
ION
MANUAL
TYPE 1381
RANDOM-NOISE GENERATOR
NOTE:
convenience
This instrument is equipped with
and
2Hz-
Form No. 1381-0100-A
ID No. 2495
April, 1968
safety.
Refer to
50kHz
our
the
new snap
Service
..
on
Section
knob for added
for
details.
GENERAl
WEST
Copyright
West
CONCORD,
1968 by
Concord,
General
Massachusetts,
R A D
MASSACHUSETTS,
Radio
0
Company
USA
COMPANY
USA
Page 4
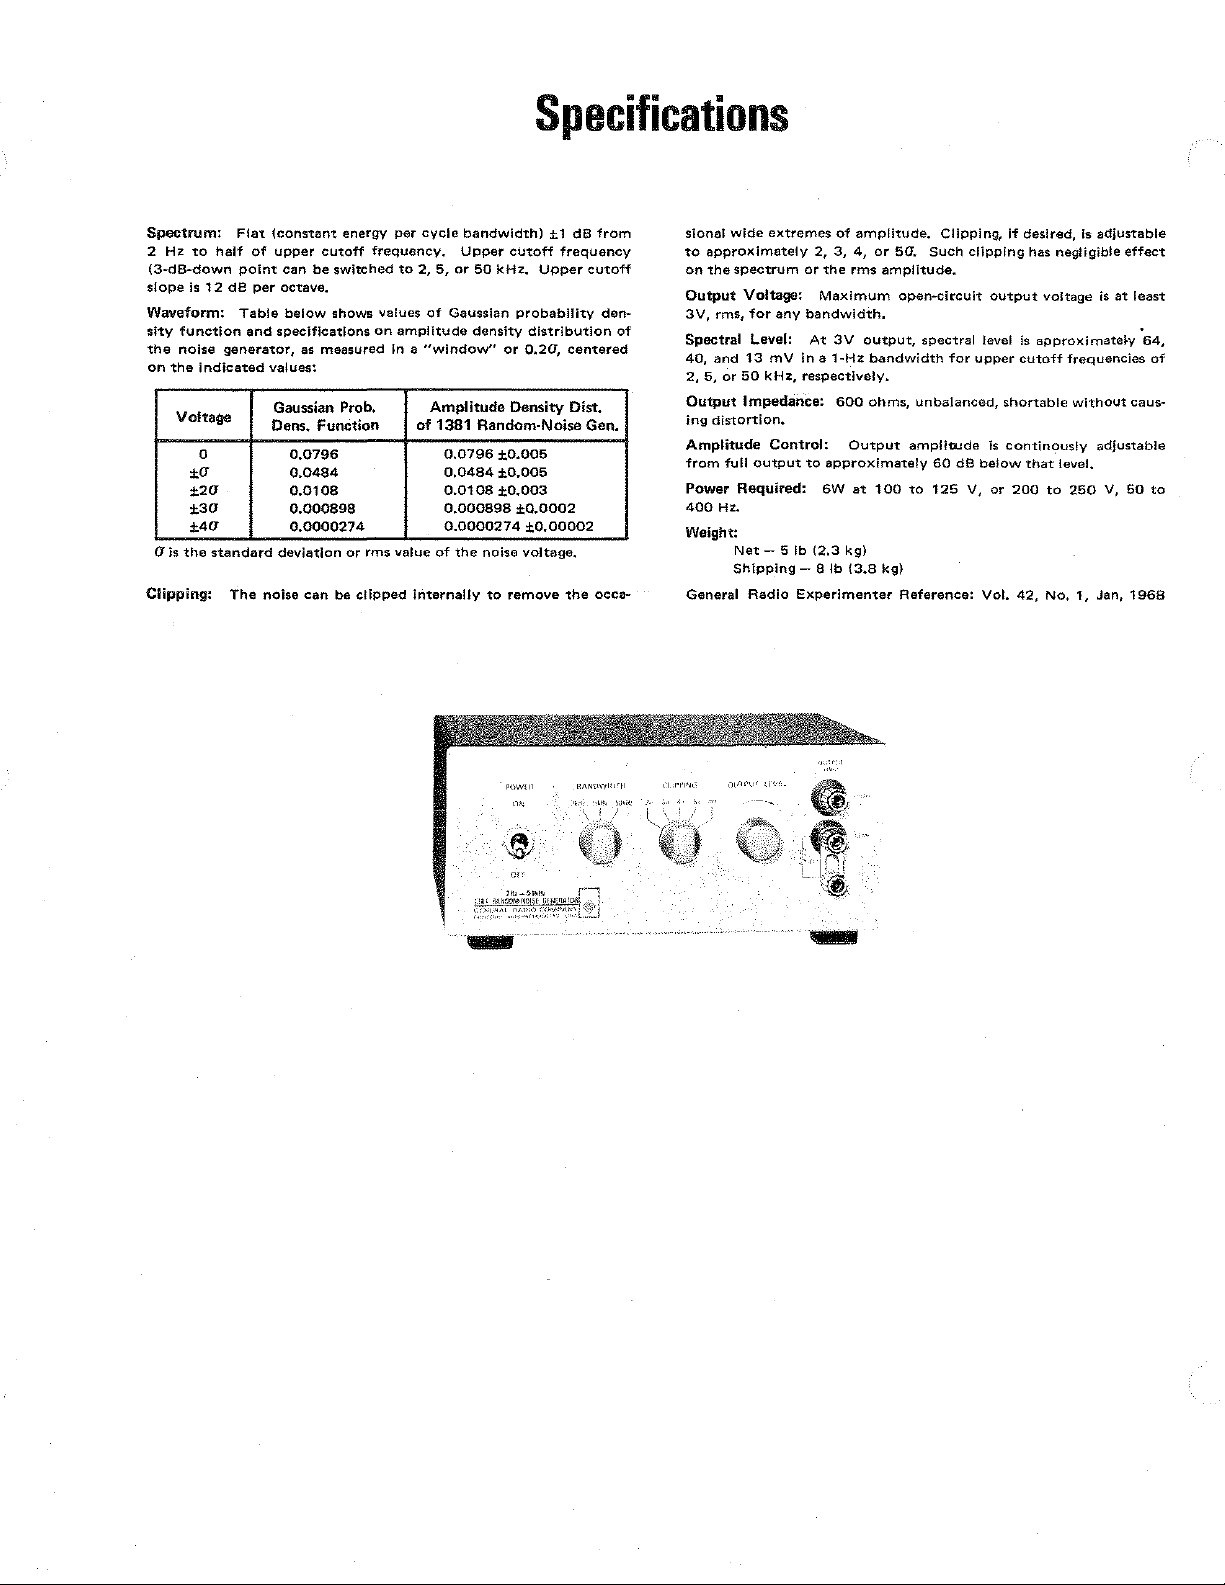
Specifications
Spectrum:
2
Hz
to
(3-dB-down
slope
is
12
Waveform:
sity
function
the
noise
on
the
indicated
Voltage
0
±0"
±20"
±30"
±40"
a
1s
the
Clipping:
Flat
half
of
point
dB
Table
and
generator,
standard
The
(constant
upper
cutoff
can
be
per
octave.
below
specifications
as
measured
values:
Gaussian Prob.
Dens. Function
0.0796
0.0484
0.0108
0.000898
0.0000274
deviation
noise
can
energy
frequency.
switched
shows
or
rms
be
clipped
per
cycle
to
2,
5,
values
of
on
amplitude
In a "window"
Amplitude
1381 Random-Noise Gen.
of
value
of
internally
bandwidth)
Upper
or
50
Gaussian
density
0.0796
0,0484
0.0108
0.000898
0.0000274
the
notse
to
cutoff
kHz.
probability
distribution
or
0.20,
Density
±,0.005
±0.005
±0.003
±0.0002
±0.00002
voltage.
remove
±1 dEl
frequency
Upper
centered
Dist.
the
from
cutoff
den--
occa-
of
slana!
wide
to
approximately
on
the
spectrum
Output
Voltage:
3V,
rms,
Spectral
40,
and
2,
5,
or
50
Output
Impedance:
ing
distortion.
Amplitude
from
full
Power
Required:
400Hz.
Weight:
NetShipping-8 lb
General
extremes
for
Level:
13
mV
kHz,
Control:
output
Radio
2,
or
the
Maximum
any
bandwidth.
At
in a 1-Hz
respectively.
to
approximately
6W
5
Jb
(2.3
Experimenter
of
amplitude.
3,
4,
rms
3V
output,
600
Output
at
kg)
{3.8
or
bandwidth
ohms,
100
Clipping,
5G.
such
spectral
for
unbalanced,
amplitude
60
dB
to
125
clipping
V,
amplitude.
open~circult
kg)
Reference:
output
level
upper
shortable
is
continously
below
or
Vol.
if
desired,
Is
negligible
voltage
frequencies
without
leveL
to
250
No.
1,
adjustable
effect
is
at
adjustable
V,
Jan,
has
is
approximate~y
cutoff
that
200
42,
least
64,
caus-
50
1968
of
to
Page 5
Section
Type
1381
Random-Noise
1-lntroduction
..
._
4 5
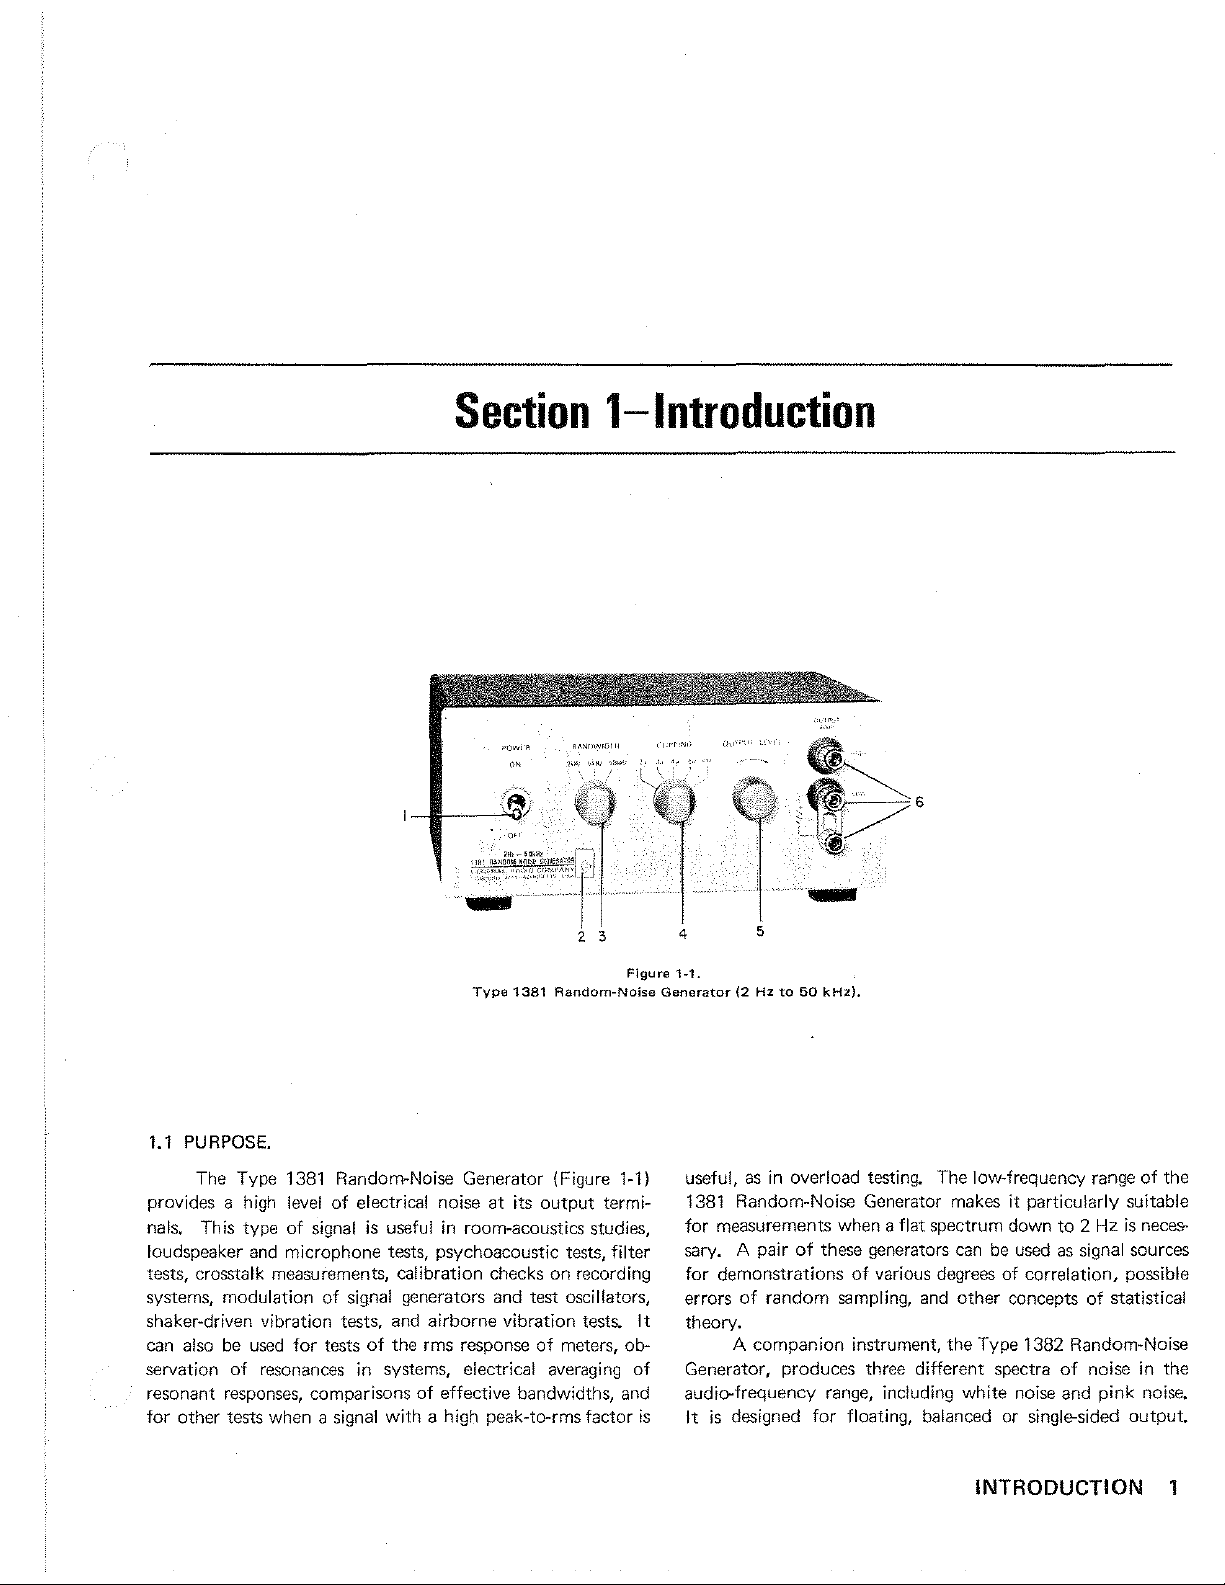
Figure
1~1.
Generator
(2Hz
to
50
kHz).
1.
1 PURPOSE.
The
Type
1381
provides a
nals.
This type
high
Random-Noise Generator I Figure
level
of electrical noise
of
signal
is
useful in room-acoustics studies,
at
its
output
1-1)
termi-
loudspeaker and microphone tests, psychoacoustic tests, filter
tests, crosstalk measurements, calibration checks
on
recording
systems, modulation of signal generators and test oscillators,
shaker-driven vibration tests, and airborne vibration tests. It
can also be
used
for tests of the rms response of meters, ob-
servation of resonances in systems, electrical averaging of
resonant responses, comparisons of effective bandwidths, and
for
other tests when a signal
with
a high peak-to-rms factor
is
useful,
1381
for
sary. A pair
for
errors
theory.
Generator, produces three different spectra
audio-frequency range,
It
as
in overload testing. The low-frequency range
Random-Noise Generator
measurements when a flat spectrum down
of
these generators
demonstrations
of
random sampling,
A companion instrument, the Type
is
designed
of
various
including white noise and
for
floating, balanced or single-sided output.
makes
can
be
degrees
and
other concepts
it
particularly suitable
used
of
correlationi possible
1382 Random-Noise
INTRODUCTION 1
to
2 Hz
is
as
signal sources
of
statistical
of
noise in the
pink
of
the
neces--
noise.
Page 6
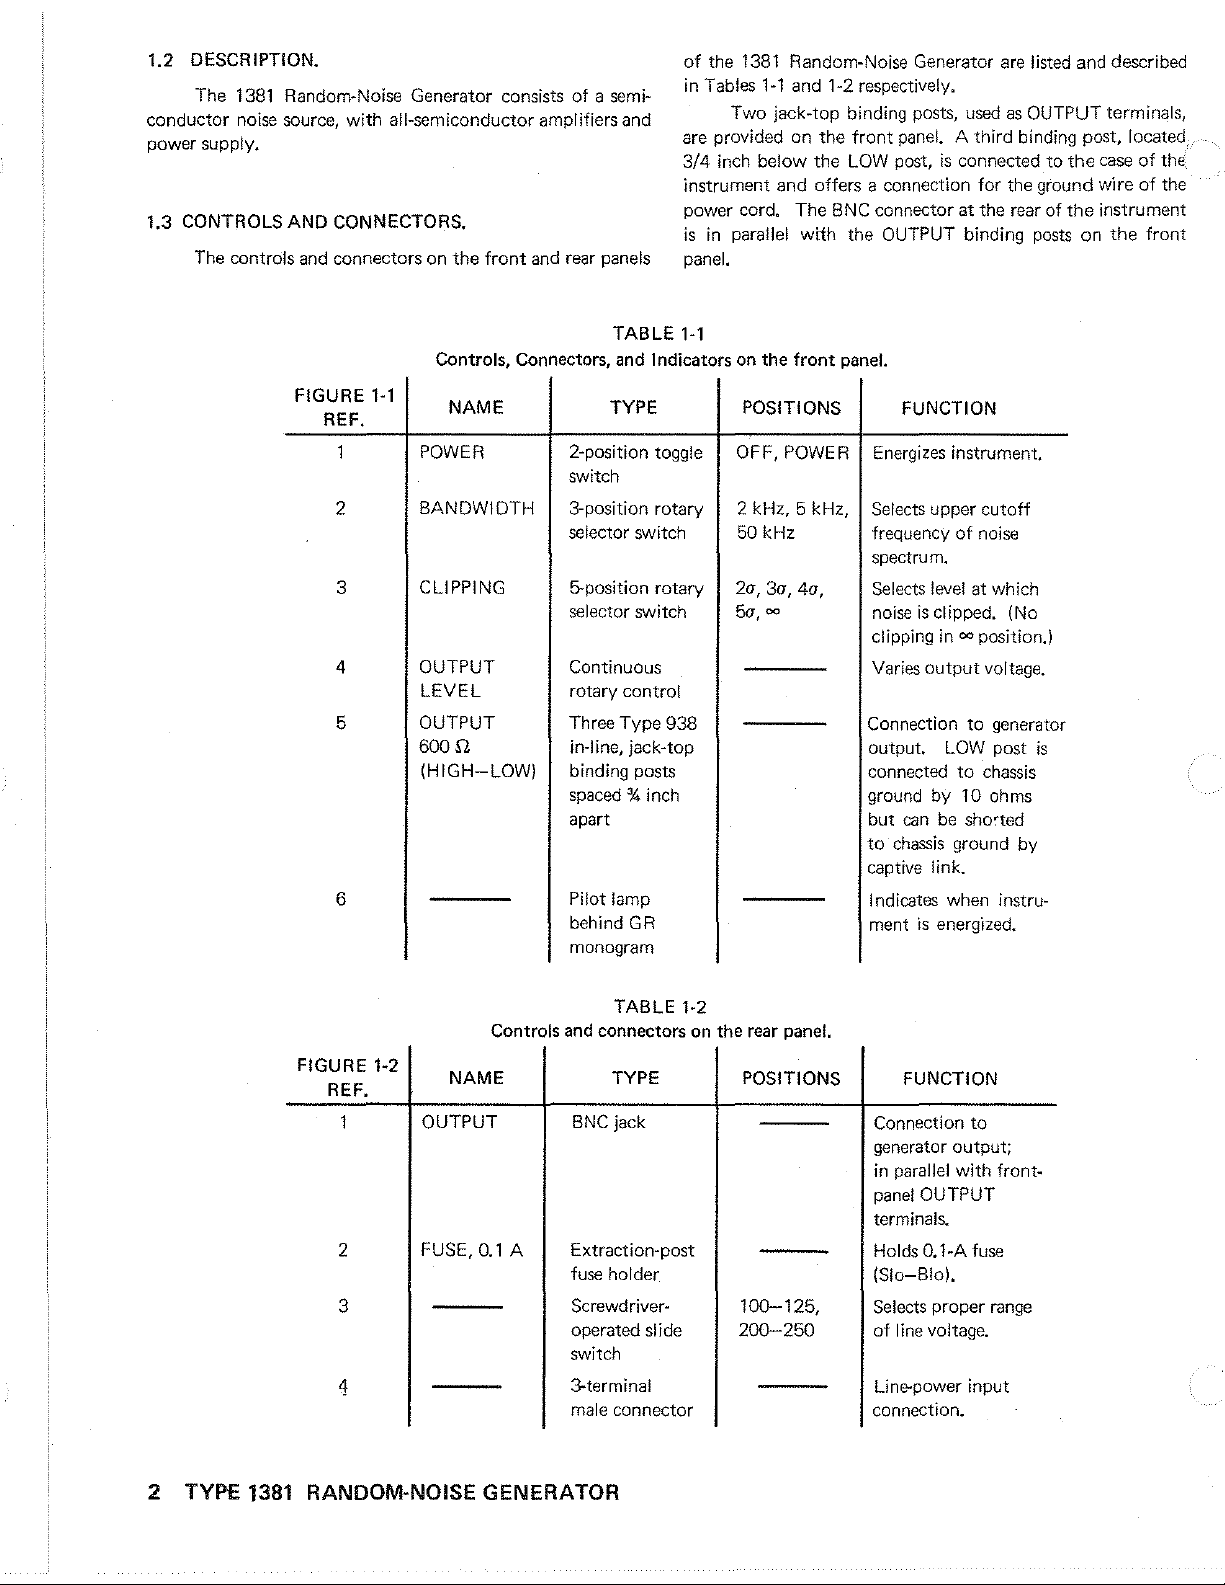
1.2 DESCRIPTION.
The
1381
Random-Noise Generator consists
conductor
power supply.
1.3 CONTROLS
noise
source,
AND
The controls and
with
all-semiconductor amplifiers and
CONNECTORS.
connectors
on
the
front
of a semi-
and rear panels
of
the
1381
Random-Noise Generator
in
Tables
1-1
and 1-2 respectively.
Two jack-top binding posts,
are
provided on the
3/4
inch below the LOW post,
instrument and offers a connection for the ground wire
power cord.
is
in
parallel wtth the OUTPUT binding
panel.
The
front
BNC
panel.
is
connector
are
listed and described
used
as
OUTPUT terminals,
A third binding post, located.
connected
at
the
to
rear of
posts
the
case
the
instrument
on
the
of
of
front
the
the
FIGURE
REF.
2
3
4
5
6
1-1
POWER
BANDWIDTH
CLIPPING
OUTPUT
LEVEL
OUTPUT
60QQ
(HIGH-LOW)
TABLE
Controls, Connectors, and Indicators on the
NAME
TYPE
2-position toggle
1-1
POSITIONS
OFF, POWER
switch
3-position rotary
selector switch
&-position rotary
selector switch
2
kHz, 5 kHz,
50 kHz frequency
2a, 3a, 4a,
5a,
oo
Continuous
rotary
control
Three Type 938
in~line,
jack~top
binding posts
spaced
% inch
apart
Pilot lamp
behind GR
monogram
front
panel.
FUNCTION
Energizes
Selects
instrument.
upper
of
spectrum.
Selects
level at which
noise
is
clipped. (No
clipping
Varies
Connection
output. LOW post
connected
ground by 10 ohms
but
to
output
can
chassis
in=
to
to
be
shocted
ground by
captive link.
Indicates when instru-
ment
is
energized.
cutoff
noise
position.)
voltage.
generator
is
chassis
Controls and connectors on the rear panel.
FIGURE 1-2
REF.
2
3
NAME
OUTPUT
0.1
FUSE,
A
BNC jack
Extraction~post
fuse
holder
Screwdriver~
operated slide
switch
4
3--terminal
male
2 TYPE 1381 RANDOM-NOISE GENERATOR
TABLE
TYPE
connector
1-2
POSITIONS
100-125,
200-250
FUNCTION
Connection
generator
in parallel
panel
OUTPUT
terminals.
Holds 0.1-A
(Sio-Bio).
Selects
proper
of
line voltage.
Line-power
connection.
to
output;
with
front-
fuse
range
input
Page 7
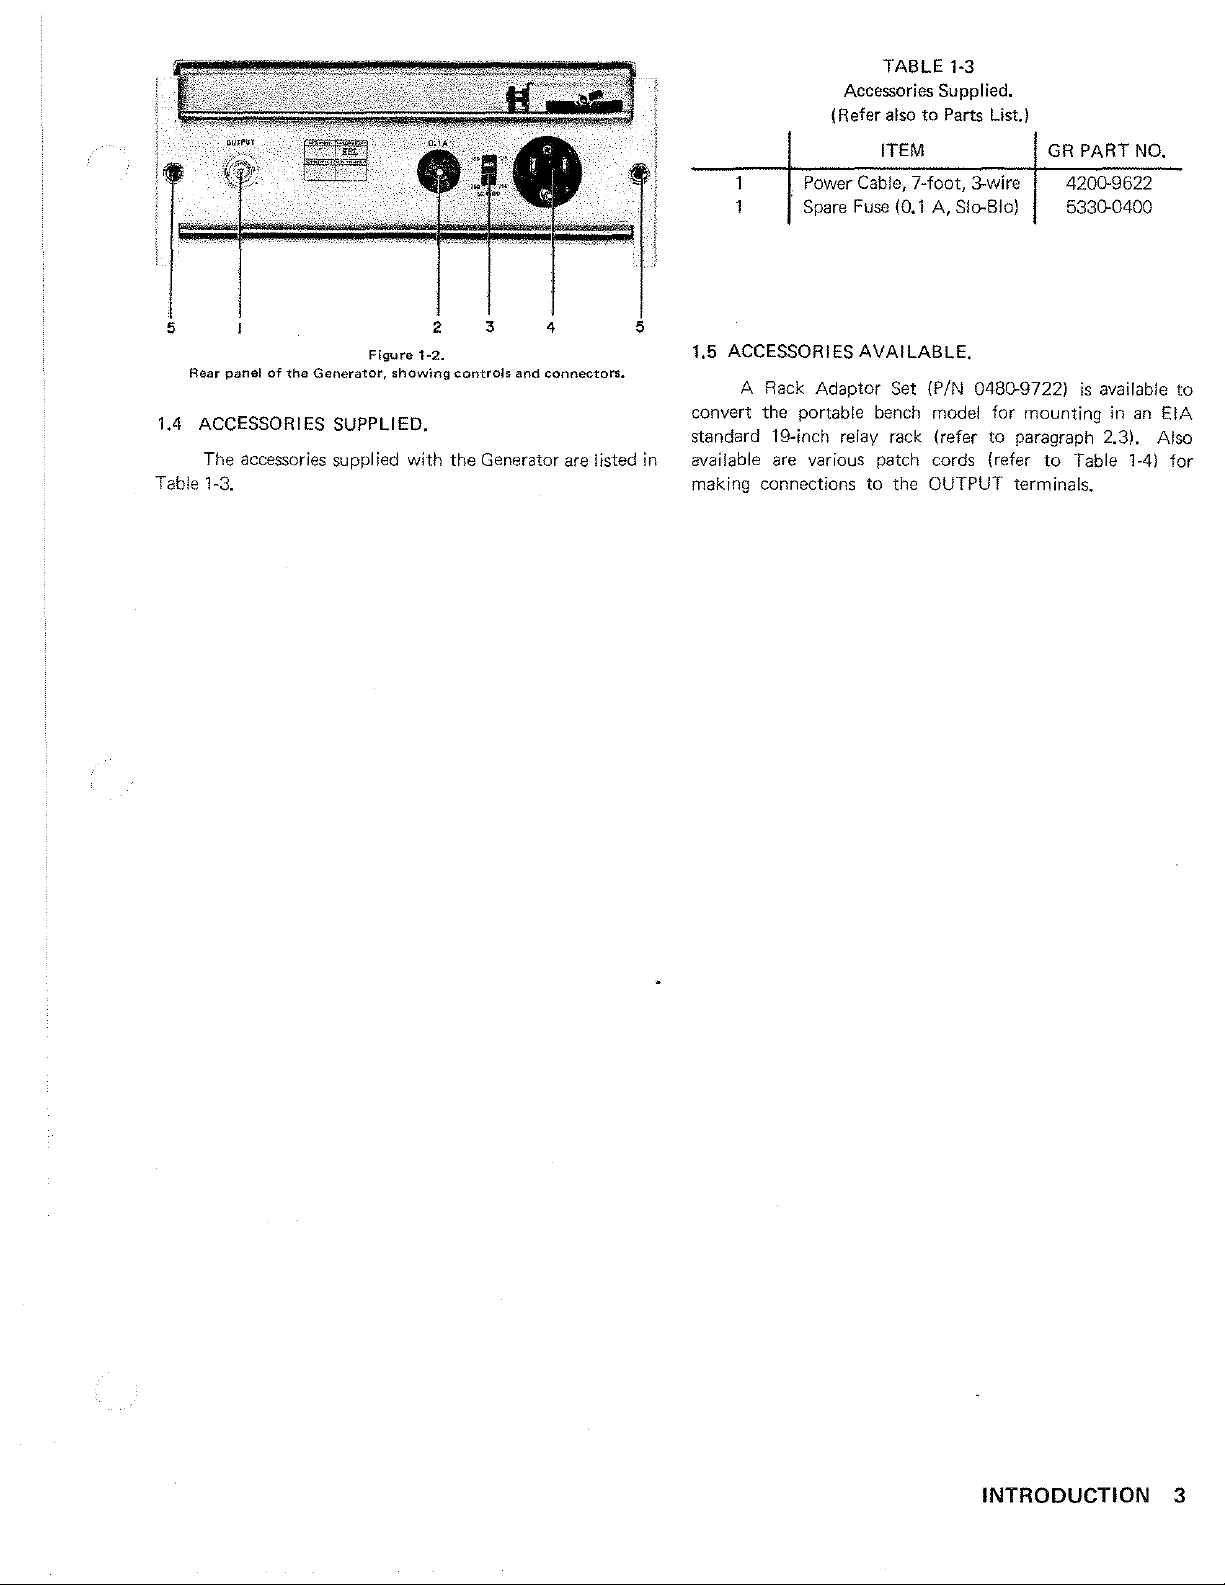
TABLE
1·3
Accessories Supplied.
(Refer
also
to Parts List.)
5
Rear
panel
of
the
Figure
Generator,
showing
1.4 ACCESSORIES SUPPLIED.
The
accessories supplied with
Table 1-3.
1-2.
3 4
2
controls
the
and
Generator are listed
connectors.
ITEM
Power Cable,
Spare
1.5 ACCESSORIES
A Rack Adaptor
7-foot, 3-wire
Fuse
(0.1
A, Slo-Bio)
AVAILABLE.
Set
(P/N 0480-9722)
convert the portable bench model
standard 19-inch relay rack (refer
in
available
are
various patch cords (refer
making connections to the OUTPUT terminals.
GR
PART NO.
4200-9622
5330-0400
is
available
for
mounting in
to
paragraph 2.3). Also
to
Table
an
1-41
to
E!A
for
INTRODUCTION 3
Page 8
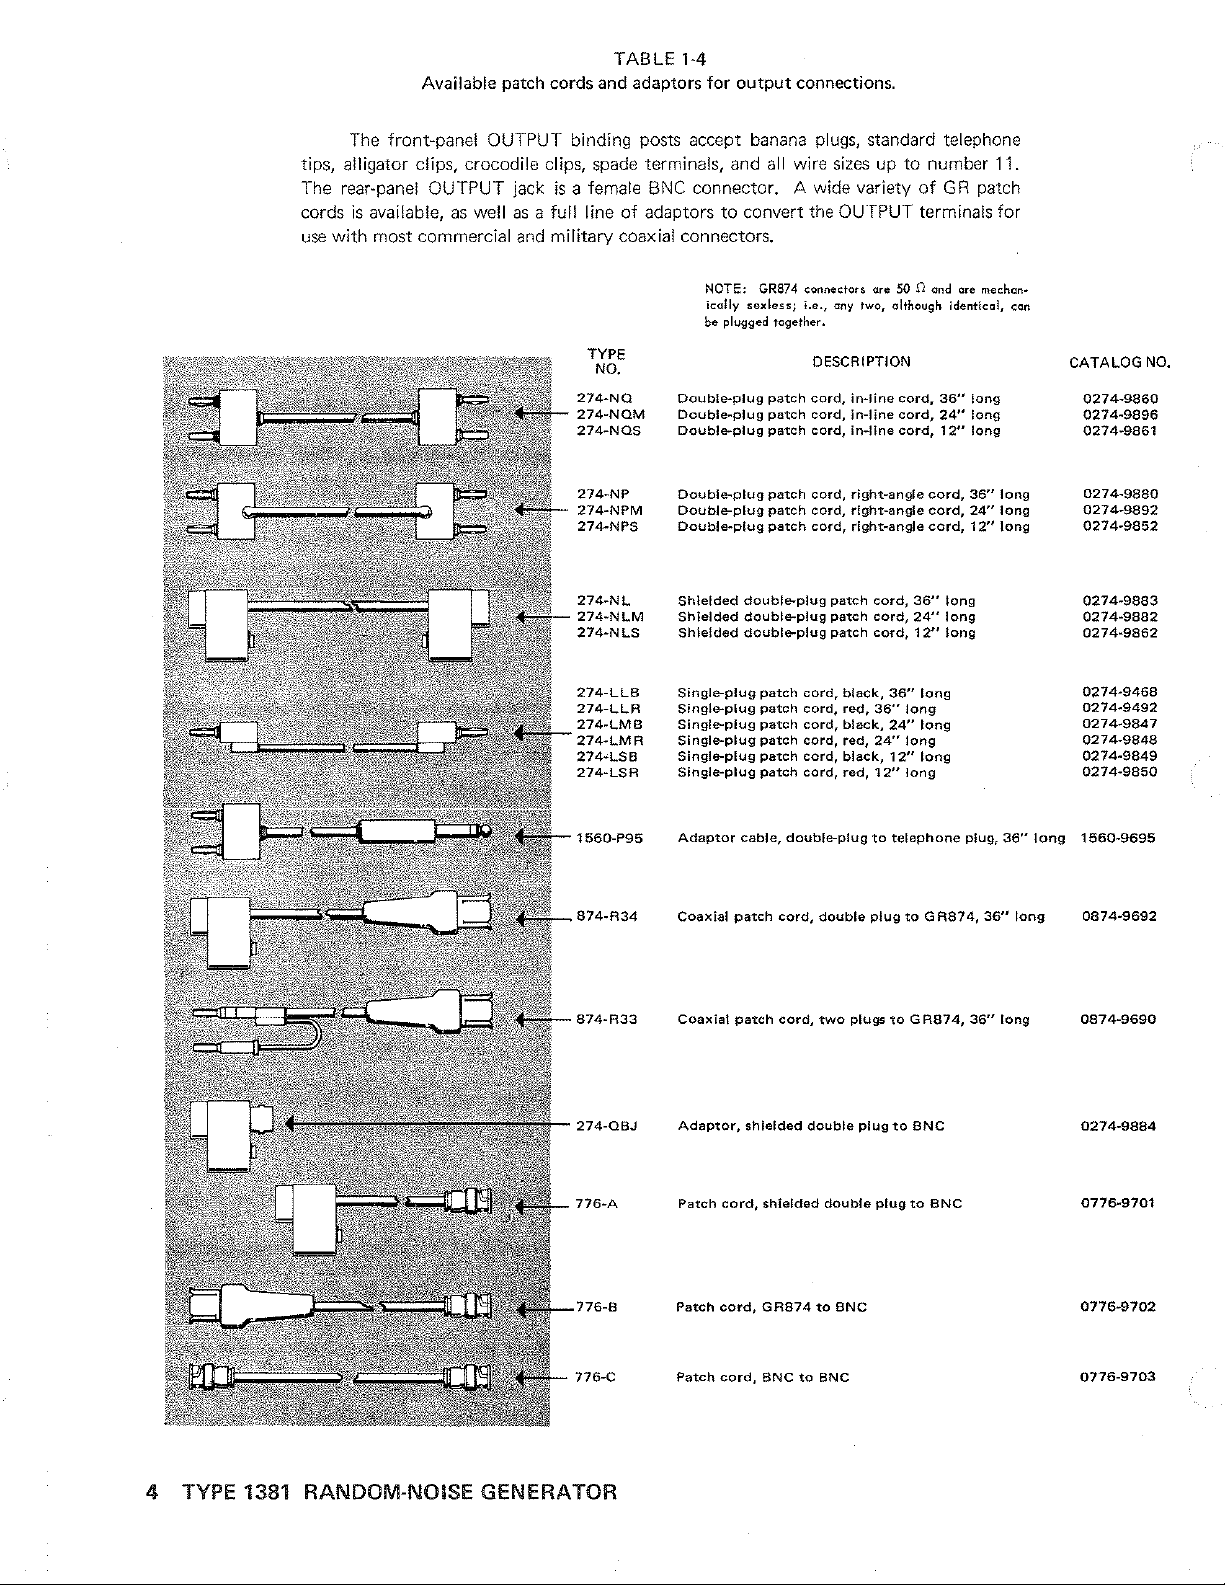
TABLE
Available patch cords and adaptors for
1-4
output
connections.
The front-panel OUTPUT binding posts accept banana plugs, standard telephone
tips, alligator
The rear-panel
is
cords
use
with most commercial
dips,
OUTPUT jack
available,
crocodile clips,
as
well
as a full
and
spade
terminals, and all wire
is
a female BNC connector. A wide variety
line
of
military
adaptors
coaxial connectors.
to
convert the OUTPUT terminals
sizes
up
to
number 11.
of
GR
patch
for
TYPE
NO.
274-NQ
274~NQM
274-NQS
274-NP
274-NPM
274-NPS
274-NL
274-NLM
274-NLS
274-LLB
274-LLR
274-LMB
274-LMR
274-LSB
274-LSA
1560-P95
NOTE: GR874 connectors ore 50 D and are
ically
sexless;
i.e.,
be
plugged
Double-plug
Double-plug
Double-plug
Double-plug
Double--plug
Double-plug
Shielded
Shielded
Shielded
Single--plug
Single--plug
Single--plug
Single--plug
Single--plug
Single-plug
Adaptor
double-plug
double--plug
double-plug
cable,
together.
patch
patch
patch
patch
patch
patch
patch
patch
patch
patch
patch
patch
any two, although identlco!, con
DESCRIPTION
cord,
in-line
in-line
in-line
right-angle
right-angle
right-angle
cord,
cord,
cord,
black,
36"
red,
36"
black,
24"
red,
24"
black,
12"
red,
12"
to
cord,
cord,
cord,
long
long
long
telephone
cord,
cord,
cord,
cord,
cord,
patch
patch
patch
cord,
cord,
cord,
cord,
cord,
cord,
double-plug
36"
24"
12"
long
long
long
36"
24"
12"
cord,
cord,
cord,
long
long
long
mec:han•
long
long
long
36"
24"
12''
plug,
long
long
long
36"
long
CATALOG
0274-9860
0274-9896
0274-9861
0274-9880
0274-9892
0274-9852
0274-9883
0274-9882
0274-9862
0274-9468
0274-9492
0274-9847
0274-9848
0274-9849
0274-9850
1560-9695
NO.
4
TYPE
874-R34
874-R33
274-QBJ
776-A
1381 RANDOM-NOISE GENERATOR
Coaxial
Coaxial
Adaptor,
Patch
Patch
Patch
patch
patch
cord,
cord,
cord,
cord,
cord,
shielded
shielded
GR874
BNC
double
two
double
to
to
BNC
plugs
double
BNC
plug
plug
to
plug
to
GR874,
to
to
GR874,
BNC
BNC
36"
36"
long
long
0874-9692
0874-9690
0274-9884
0776-9701
0776-9702
0776-9703
Page 9
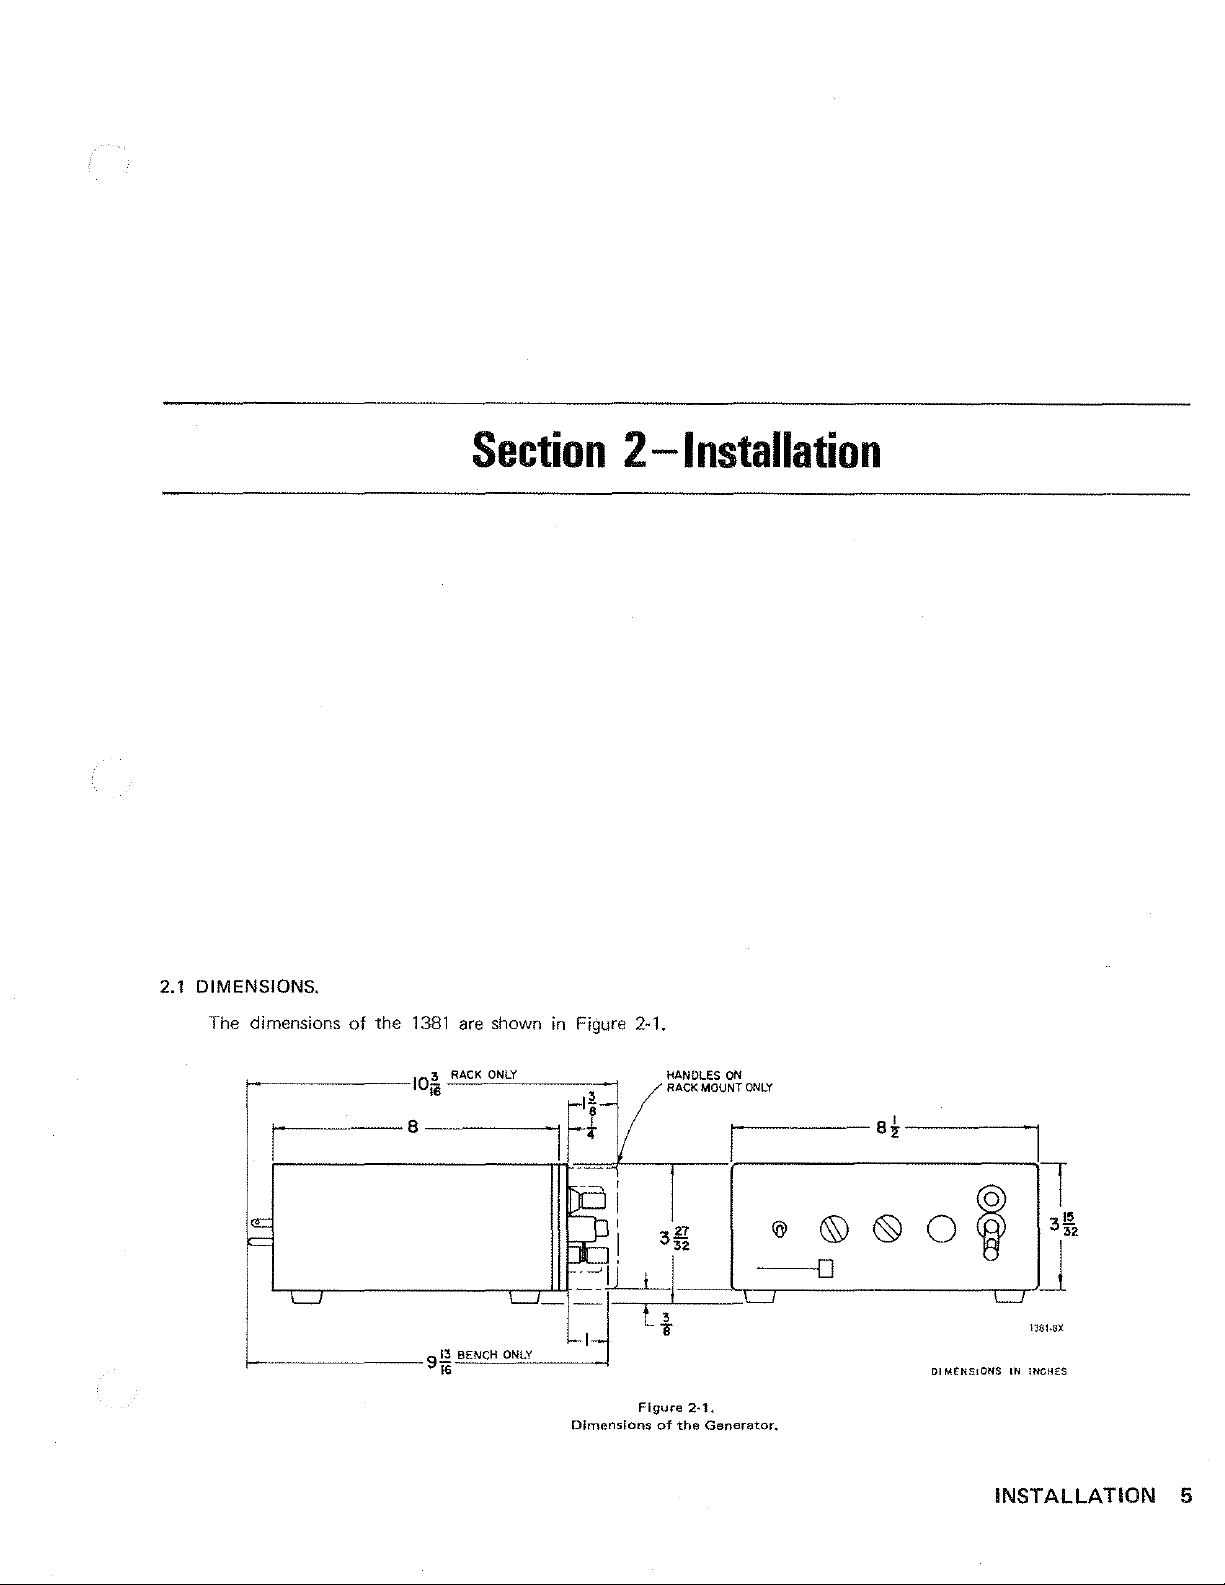
2.1
DIMENSIONS.
Section 2 -Installation
The dimensions
;--------jQl
f---·---·--8
of
the
1381
are
RACK_,O"'Nlo_Y
••
---·--___,
shown
___
in
Figure 2-1.
-1
3
FI
Dimensions
Figure
of
HANDLES
RACK
MOUNT
2·1.
the
Generator.
ON
ONLY
01
MENS!ONS
IN
INCHES
INSTALLATION
5
Page 10

2.2 BENCH
pletely assembled in a metal cabinet, ready
MOUNTING.
The 1381 Random-Noise Generator
is
delivered com-
for
bench
use.
convenient bail, located between the front feet, can be pulled
down to raise the
front
of the instrument and provide a
better
view of the control settings.
2.3
RELAY-RACK
2.3.1 Single
Adaptor
Rack
vert the portable bench model
inch relay rack. Table
Adaptor
ure 2-2):
in
instrument forward,
ply
slightly and the
Be
version
on
age
form a I iner
of
two
site
flange side,
Set.
a.
Loosen the
the rear of
b.
Remove the
push
out
sure
to
save
of
the instrument
c.
Pierce and push
the inner sides
the threads in the threaded holes.
d.
Press
for
e.
Attach
the cabinet (on either side
5/16-inch screws I F). Note
directions-
as
MOUNTING.
Instrument
The conversion procedure
the
the
two
all
the subpanel (D)
the latter.
the
and Blank
Set (P/N 0480-9722)
2-1
lists the parts included in the Rack
two
captive 10/32 screws (5, Figure 1-2)
cabinet until
out
of
the cabinet.
four
rubber feet
two
rear feet. Spread the bail (A, Figure
front
feet (B)
Panel
for
use
the
instrument
and
(Figure 2-2).
is
available
in
an
EIA
is
as
follows
is
free; slide
from
the cabinet. Sim-
the bail
will
parts as they are removed for possible recon-
to
bench mounting.
out
of
short
the
the plugs
cabinet,
flange
of
from
the
four
near
the
front.
into
the blank panel (E),
of
the blank panel
the cabinet,
that
the screws enter in oppo-
as
desired) using
one from inside the cabinet and one from
shown.
to
con-
standard 19-
(see
Fig-
the
2-21
drop
out.
bosses
(C)
Do
not
dam-
to
to
the
front
the
f. Pierce and push
on the
side
toward the blank panel
g.
A
er rear
passes
bracket in position
lower,
screw (K).
side
inch screws (
directions, one from inside the cabinet.and one from outside.
Use
the
(E).
the
lower holes
site directions.
place
were loosened
Attach one end
boss.
The bracket must be placed so
through a clearance hole,
h.
Attach the
rear
hole in the wide flange,
i.
Attach one Rack
of
the cabinet opposite the blank panel, using
L).
the upper
i.
wide flange
Use
flange that
k.
with
and
Attach the
on
two
5/16-inch screws (M) through the
are
in
the Assembly. Again, the screws enter
Install the instrument in the cabinet and lock
the
two
in
step
out
the plug in the lower rear
only,
as
shown.
of
the support bracket (H)
that
into
a tapped hole. Lock the
with
a 5/16-inch screw (J).
other
end
of
the support bracket
as
shown, using a 5/16-inch
Adaptor
Again, note
lower holes in the Assembly.
other
Rack
liner (D) and the flange on the blank panel
nearest the panel and through the upper and
captive screws through
Assembly (handle)
that
the screws enter
Adaptor
Assembly (handle)
two
the
rear panel that
a.
L Place a straight edge across both the instrument panel
and the blank panel. Loosen the screw (J) through the slot in
the support bracket (H). Exert a slight pressure on the blank
panel
(E)
so
that
it
forms a straight line
panel,
and
tighten the screw (J) in the bracket,
panels
in
this position.
m.
Slide the entire assembly
it
in place
lon cup washers.
by
inserting a screwdriver through the holes
with
the
Use
four
9/16-inch screws (N)
two
screws on each side and tighten them
with
the instrument
into
the relay rack and lock
with
(P)
in the handles.
boss
to
the low-
the screw .
to
to
two
5/16-
in
opposite
holes in
in
oppo-
it
to
lock the
captive ny-
(G)
the
the
to
in
\
L \
\
.~
\
\
([
Method
of
mounting
6 TYPE 1381 RANDOM-NOISE GENERATOR
the
generator
\
t!ff'·
Figure
2·2.
and a blank
\
\
r·
panel
-~J
E
in a relay
rack.
H
E
Q
Page 11

2.3.2 Reconverting
To reconvert
procedures
biy
of
of
instrument, cabinet, and blank panel
to
the
paragraph 2.3.1,
Next remove:
a.
The instrument from its cabinet.
b.
The support bracket (H) from the cabinet
2-2).
c.
The blank panel (E)
of
side
the cabinet.
and
cabinet and lock
through the rear panel
2.3.3 Rack-mounting
1381's
the cabinet.
d.
The Rack Adaptor Set (handle) from the
Push
the
two
rear feet
two
front
feet (B)
it
Two- instruments
or
one
1381
and
Portable Bench Mounting.
instrument for bench use, reverse the
first
removing the entire
from
(with
handle attached)
into
the cabinet; slide the bail (A)
into
place. Install the instrument in its
in
place with the two captive screws
(see
Figure 1-3).
Two
Instruments.
of
the
same
panel size (such
one
1382)
can
be
mounted side-by-
the rack.
(see
from
other
assem-
Figure
side
as
side
in a standard 1 9-inch relay rack.
paragraph 2.3.1, substituting the
blank panel. Do
not
but insert three screws through the bosses
of
the cabinets,
(G). The
each
from
to
lock the instruments in the
I isted below:
one
of
two
Screws,
3
4
Screws,
2.4 CONNECTING
means
panel, to accept
volts or 200-250 volts.
plied to the
ure
1-21
The wiring
of
Connect the 3-wire power cable IP/N 4200-9622) sup-
on the rear panel. A single 0.1-A fuse
two
four
feet and the bail must,
cabinet.
BH
10-32
BH
10-32,9/16
of
the 2-position slide switch
50-
line
and
line voltage. Power consumption
Use
the procedure
second
use
the support bracket (H, Figure 2-2),
near the
Use
the
four
front
screws
rack.
5/16
P/N7080-0800
with
nylon
THE
POWER.
the power transformer
to
400-Hz line power
to
the 3-terminal male connector (4, Fig-
is
instrument
in
the adjacent sides
(C)
and
one
near
of
course,
IN)
with
nylon
The
required hardware
washers
(3,
P/N7207-6310
can
Figure
of
is
be
1-21_
either 100-125
used
approximately 6
for
the rear
be
removed
washers
switched,
on
the rear
for
either
W.
of
the
is
by
Fig. 2-2
F,
J,
Ref.
E
D
H
K,
N
PARTS
L,
M,
INCLUDED
P/N 0480-9722
Used
No.
2
TABLE
IN THE RACK ADAPTOR SET,
Blank
Sub-Panel
Rack Adaptor Assembly
Support Bracket
Hardware
includes
8
4
2·1
(see
Figure 2-2).
Item GR Part No.
Panel
Set
Screws,
Screws,
w.
BH
10-32,
BH
10-32,
nylon cup washers
5/16"
9/16"
0480-8932
0480-8952
0480-4902
0480-8524
0480-3080
7080-0800
7270-6310
INSTALLATION
7/8
Page 12

Page 13

Section
3-
Properties
of
Random
Noise
3.1
DEFINITIONS.
The acoustical term
certain electrical signals because of the undesirable audible effects
they
produced
the electrical sense,
wanted signal, and therefore can include
noise and atmospheric noise in radio receivers,
talk, hum, and distortion.
Random noise is a signal whose exact value
moment cannot be predicted, It
that;
it
means a signal containing no periodic component
whose
future value
can
"noise"
at
the
output
is
now a broad term
be
predicted. Unlike periodic
was
of
radio receivers. Noise,
is
even a little more than
applied originally
that
means any
not
only input-stage
but
also
cross-
at
any future
signals,
un-
to
whose spectra consist
ing
to
the various frequency components, random noise has a
in
spectrum that
ing
no discrete line components.
3.2 DESCRIPTION
It
is
only possible
its average properties
but
must
be
averaged over some finite measurement time. The
two most important characteristics of random noise are its
amp
I itude distribution and its spectrum.
PROPERTIES OF RANDOM NOISE 9
of
one or more discrete lines correspond-
is
a continuous function
OF
RANDOM NOISE.
to
describe random noise
that
cannot be measured instantaneously
of
freque~:ncy,
in
terms
contain-
of
Page 14

3.3 AMPLITUDE DISTRIBUTION.
3.3.1 Amplitude Distribution Functions.
The instantaneous value
particular instant,
can
speak
particular
the amplitude density distribution, p(v).
a voltage increment, dv, this function
that,
Because
the integral
range.
at
any given instant,
the
J_:
Another useful probability function
that
range,
P(v)
Thus defined,
given instant, lies below
ability functions lie
noting certainty. A probability
of occurance.
cannot
of
the probability that the voltage will lie
This probability
voltage must exist
p(v)dv =
called the amplitude distribution, P(v), defined
=
J_:
p(x)dx.
P(v)
is
the probability that the voltage, at any
on a scale
of a random
be predicted,
is
the
voltage lies
at
some value, it follows
1.
the
value
v.
between 0 and
of
given
is
the integral over part
The
0.5 denotes a
but
for
by
When
gives
between
values
noise,
at
some
many noises we
in
some
a function
multiplied by
the probability
of
called
v and v + dv.
these prob-
1,
with 1
50'/o
chance
that
of
as
de-
standard deviation), and
of these functions are given
graphed in Figures
Gaussian amplitude
v
-5a .000
-4a
·3a
-2a
·1
a .241 97/a .158 65
0
1a
2a
3a
4a
5a
0/5/<T
0.4/<:r
I
0.3/<7
I I
I
erf
3.1
and
TABLE
p(v)
001
.000133
.004
432/a
.053
99/a
.398 94/a .500 00
.241
97/a
.053
99/a
.004
432/a
.000 133
.000
001
denotes the error function. Values
in
Table 3.1 and the functions are
3.2.
3·1
distribution
487/a
8/a
8/a
487/a .999 999 713
!
functions.
P(v)
.000 000
.000
.001
.022 75
.841
.977 25
.998 650
.999 968 33
031
350
34
287
67
I
I
\
I
\
I
3.3.2 The Gaussian Distribution.
The
Gaussian
portant
ranee
amplitude of thermal noise
vacuum
the
the
voltages is increased, regardless
dividual voltages (derived from the Central
statistics). An extension
that filtering that
non-Gaussian noise more Gaussian, so
Gaussian
an distribution
appropriate distribution
For
for several reasons: It describes
of
random measurement errors in experiments.
tube
sum
of
many independent time-varying voltages approaches
Gaussian distribution
is
a stable distribution. For these reasons,
the
Gaussian distribution,
or
normal distribution
in
a resistance
are Gaussianly distributed.
in
the limit as
of
the
distribution of the
of
this reasoning leads
reduces
is
of fundamental importance and
the bandwidth generally
that,
of
random noise in most experiments.
v2
2
and
p(v) =
(_
1 ) - 2a
\.
aV2if e
is
particularly
the
"normal"
and
shot
The
distribution of
the
number
Limit
in this sense,
occur-
noise
of such
Theorem
to
the
makes
the
Gaussi-
is
the most
im-
The
in
in-
of
result
the
0.1/<T
I
/
I
0
-
4<:r
a
The
Gaussian
100
!j
a
O.'
/
-3<:r
probability
the
-
'•
Figure
density
root-mean-square
I
3-1.
function
1.
I f'.-..l
0
\
plotted
amplitude,
v
I
\
'•
as a function
••
I
of
a,
\/,
-;
0.50
I
t=
;;:
0.2
'
0
-4c:r -3<7 -2c:r
The
Gaussian
function
/
probability
of
a,
the
/I
/
0
Figure
3-2.
distribution
root-mean-square
'I
function
amplitude.
,.
plotted
I
as
a
P(v)
=
~
where a
t + erf
is
the
root-mean-square voltage (in statistics, the
(a./7
)]
10 TYPE 1381 RANDOM-NOISE GENERATOR
It
can
be
seen
from Figure 3.2 that a
buted
random noise lies below its positive root-mean-square
value
(a = 1)
value only
16%
84%
of
the time.
of
the time,
and
Gaussianly
therefore
exceeds
distri-
that
Page 15

3.3.3 Importance of Knowing
the
Distribution.
3.3.5 Amplitude Distribution of the Type 1381.
Knowledge of the amplitude distribution of a noise
is
important in measuring its magnitude. Electronic voltmeters
respond to different measures
such as the rms, the peak, or
The
peak
and
average
values
volt, rms, amplitude are given
sponding
value of a sine
cate a value
1·1.05
dB)
to
the
wave
that
1
•
Voltmeters
average and calibrated
will, when measuring
is
low by the factor 0. 798/0.900 =
that
of
the amplitude of the voltage,
the
(full-wave-rectified) average.
of
various waveforms having
in
Table 3-2. A voltmeter re-
to
indicate the rms
respond
to
Gaussian
the
true
rms value are
noise, indi-
1-
0.887
quite appropriate for the measurement of noise, because they
can
indicate the
amplitude distribution. The response
meter
is
constants of its rectifier circuits; when random noise
rms
dependent
value
without
upon
correction,
of
regardless
a peak-indicating volt·
the charging and discharging time
is
of
the
meas-
ured, each may indicate a different value. The response time
of
a rectified-average-responding voltmeter
than
that
of
the
true rms voltmeter. Therefore, for measuring
the
amplitude of Gaussianly·distributed noise, the average-re-
sponding voltmeter
necessary correction factor}.
non-Gaussian noise,
rection factor, it
Rms, peak, and full-wave rectified average voltage values
Sine
Wave
Square
Wave
Gaussian
Noise
is
probably the most convenient (using the
In
order
or
to
make
the
measurement with no cor-
is
necessary
TABLE
of
various waveforms.
RMS
1.0 1.414IJ"'l.i 0.900
1.0 1.0 1.0
1.0
to
use a true-rms instrument.
3·2
FULL-WAVE RECTIFIED
PEAK AVERAGE
~
is
usually shorter
to
measure the rms of
(
2;7)
0.798
(E)
3.3.4 Measuring Amplitude Distribution.
The amplitude distribution,
means of a circuit
that
which the noise voltage
age level,
some form
v.
Apparatus for this purpose generally includes
of
level-crossing detector,and, for high-speed
measures
exceeds
P(v), can
the
percentage of time during
lor
does
be
measured by
not
exceed) the volt·
opera-tion, Schmitt-circuit wave--shapers. The measurement must be
made by averaging over a time
fluctuations
in
the indication
The amplitude density distribution, p(v), can be
ured by similar,
that
indicates the percentage
but
somewhat more complicated, apparatus
exists within the range from v
these measurements, averaging
average characteristics
of
the
long enough
to
negligible size.
of
time
that
to
(v
+ dv).
is
important, bacause only the
to
smooth the
the noise voltage
In
making any
noise can be measured
meas-
of
meaning--
fully.
Care has been taken to ensure that
bution
Noise Generator
been designed so
output,
~f
the noise generated by the Type 1381 Random·
is
truly Gaussian. The
that
clipping cannot occur below 4a at full
and below even higher values of a as
duced. Special attention has been
given
the
amplitude distri-
output
the
to the
symmetry
amplifier has
output
is
re-
of the
distribution.
A
CLIPPING control on
plitude distribution to be deliberately cut off
of
a,
for use
in
those cases where it
occasional extremes of voltage
tor
is
used
to
drive power amplifiers, loud speakers,
systems. Because the fraction of time
age exceeds 2 a
is
very
noticeable effect upon the over-all amplitude of
3.4
SPECTRUM.
the
front panel permits the am·
is
desirable to limit the
amplitude, as when
in
which the noise
smal.!,
such clipping has an almost
at
various values
the
genera-
or
'the
shak~r
volt~
un~
noise.
3.4. 1 General.
The spectrum of a random signal
of a periodic signal, which
is
composed
lines, each of which corresponds to a frequency
of
the
periodic signal. A truly random signal contains no periodic frequency
tinuous
function of frequency.
components, and has a spectrum
is
different from
of
one
or
that
more discrete
component
that
is
a con-
3.4.2 Spectrum Functions.
The frequency
a function
sions
called the spectral intensity, which has
of voltage squared per unit bandwidth. (When divided
content
by a value of resistance, it
would
dissipate
spectral intensity
tion function, and
in
that
is
the Fourier transform of
is
the spectrum function
mathematical analysis of random noise. It
of a random noise
is
equal
to
the power
is
described by
the
dimen-
that
voltage
resistance, per unit bandwidth). The
the
autocorrela-
most
often used
is
not
the most convenient function for practical use, however, because spectra are
usually measured
given bandwidth, and
spectra, are
for practical use,
ly
equal
to
units
of
voltage per square root of bandwidth,
spoken
of
as
voltage, rather than voltage squared,
filter responses, used
usually measured
we
define the voltage spectrum
the
scuare root of the spectral intensity. It has
as voltage
in
as
voltage functions. Therefore,
a given bandwidth. Spectra shown
in
shaping noise
as
numerical-
but
may be
in
Figure 3-3 are plotted as voltage spectra.
3.4.3
White Noise.
Noise whose spectral intensity
frequencies
is
called white noise, by analogy with white light,
which contains more
colors?
White noise
or
less
cannot
is
constant over a range of
equal intensities of all visible
contain equal amplitudes
at
all
in
a
in
1
This
tained
Curves
copy
writing
and
much
in a General
for
Random
of
this
six-page
to
General
other
Radio
Noise",
compendium
Radio,
Information
publication,
Instrument
West
Concord,
concerning
"Useful
Note
can
be
Mass.
random
Formulas,
IN-102
obtained
01781.
(June,
free
noise
Tables
1963).
of
is
charge
con-
and
by
2
Aithough,
drawn
a
function
A
unit
as
incorrectly,
of
wavelength,
Bennett
(op.
cit.,
p.
14)
points
out,
the
because
wavelength,
not
per
spectroscopists
and
found
unit
frequency.
it
to
were
be
substantially
analOgy
measuring
intensity
constant
PROPERTIES OF RANDOM NOISE
has
been
as
per
11
Page 16

frequencies, for then the total power
finite. White noise, therefore, means
over the range
of
interest, for example, throughout the audio-
frequency range. Because of its flat spectrum, white noise
particularly convenient as a starting
in
the noise would
that
the spectrum
point
for many experi-
be
is
in-
flat
is
ments.
3.4.4 Importance of Knowing the
In
most experiments involving random noise, knowledge
of the spectrum
When noise
of the noise being used
is
used as a driving-point signal
response of some system, the response
the input spectrum
is
known, and
studied when the input spectrum
cases where
other
spectra are more convenient.
Spectrum.
is
vitally necessary.
to
determine
is
meaningful only when
is
usually most conveniently
is
flat. There
are,
If,
of course,
in
the
such
cases, a filter can be constructed whose response has the shape
of the desired spectrum, white noise
that
filter to produce the desired spectrum
Noise·Spectra Measurements.
3.4. 5
is
the proper input for
at
its output.
The spectrum of a noise can be measured with any wave
analyzer whose frequency range
put
·mdication to be free of fluctuations
reading errors, the product
eraging time must be large. As
amplitude distribution, the spectrum can only
accurately
by
averaging over a relatively long time intervaL
Wave
analyzers generally indicate the voltage
ysis passband. The indication
not
W(f).
It
is
convenient
common bandwidth
is
one cycle. Units
basis,
for
W(f)
is
appropriate. For the out-
that
might cause
of
analysis bandwidth
in
the
measurement of
is
therefore proportional to w(f),
to
reduce an measurements to a
and the most-often-used bandwidth
are
"volts
squared per cycle band-
and
be
measured
ln
the anal-
the av-
the
width," and considerable use has been made of the unit "volts
per root-cycle" for
"hertz,"
best replaced by
sary
this term
In
order
to
divide the voltage indication
square root of the analysis bandwidth. For example, using
General Radio Type 1906 Wave Analyzer,
factors
given
dom noise to volts
Correction factors for converting voltage indication
Wave
ANALYZER BANDWIDTH
1 These numbers include the correction for
voltmeter
in
the 1900
In
a constant-percentage-bandwidth analyzer, the analy-
sis bandwidth
of the pass band. This necessitates dividing the voltage
tion by the square root
w(f).
is
"volts
to
convert
in
Table 3-3
in
a
Analyzer
3Hz
10Hz
50
Hz
Wave
is
directly proportional
Now that "cycles"
even more cumbersome, and
in a 1-hertz band."
to
volts
to
convert measured values
1~hertz
TABLE
to
voltage
Analyzer.
of
the frequency
in
a 1-hertz band,
of
the analyzer by
multiply
band.
3-3
of
the Type 1900
in
a 1·hertz band.
CORRECTION FACTOR1
0.6501-3.7
0.357 l-9.0
0.159 l-15.9dB)
the
to
dB)
dB)
average-responding
the center frequency
as
well
have
become
is
perhaps
it
is
as
by the cor-
neces-
the
the
by the
of
ran-
indica-
rection factor for the fractional bandwidth itself. When using
constant-percentage-bandwidth analyzers, such as the General
Radio Type 1564
1558 Octave-Band
dication by
Correction factors for converting voltage indication
3.4.6 Spectrum
The spectrum
tor
is
flat
over three different frequency
spectrum
typically rolls
quency, where the voltage spectrum
justable
±1
Voltage spectra
age
level
is
to
dB
at frequencies below half the upper
is
the
same
is
higher
Clipping,
trum, merely transferring a small amount
Sound
and
Vibration Analyzer
Analyzer,
the
appropriate conversion factor
constant-percentage-bandwidth analyzer
voltage
BANDWIDTH
1/10
Octave
1/3
Octave
Octave
of
the Type 1381.
of
flat
within 1
off
less
than 3
either
2,
5,
are
shown
for
the
for
the narrower bandwidths.
if
it
is
multiply
TABLE 3-4
in
a 1-hertz band.
CORRECTION FACTOR
the Type
dB
for
dB
or 50 kHz. The spectrum
in
Figure 3-3.
different bandwidths,
used,
has
the
3.80/Jf
2.08/JT
1.19/JT
1381
Random-Noise
ranges.
frequencies above 2 Hz
at 1 Hz. The upper
has
rolled
The
negligible effect on the
or
the Type
analyzer voltage in-
in
Table 3-4.'
of
a
to
Genera-
The voltage
and
cutoff
fre-
off
3 dB,
is
ad-
is
flat
within
cutoff
of
total
so
energy
frequency.
output
volt-
the spectral
spec-
to
higher
frequencies.
10
0
0
•
OUTPUT BANOWIOTH
0
0
•
2
I
2kHz
15kHz
tiOkH1
\\
\ \
\
'.\
1\\
\
\\
'
2
0 .I
IH•
Voltage
3.5
STATIONARITY.
A random noise
statistical parameters such
spectra
10
of
the
1381
at 3 volts,
is
ICXl
Figure
rms,
said
as
l
FREQUENCY
for
kHZ
3~3.
the
three
output
to
output
level,
be statlonary3 if
the amplitude distribution and
the spectral intensity do not change with time. Random noise,
3Bennett,
op.
cit.,
p.
52-54.
\'
10
bandwidths
\
100
its various
12 TYPE 1381 RANDOM-NOISE GENERATOR
Page 17

of course, never repeats the same pattern from one moment
the next, but,
spectrum made
suit, except for
quantity
Bendat and
processes, it
variance (square
with the time
of the 1381
it
is
only necessary
stationarity. This can be done by seeing
in
long-.time recordings of
greater than the
noise and the smoothing time
Tests of this type have been
departure from stationarity
stationarity
ty of an
if
it
is
stationary, many measurements of the
at
different times
the
unavoidable errors of measuring a random
in
a finite time.
Piersol4 point
is
sufficient
of
at
which they are measured. Because the
is
ac coupled, the mean
value
in
a random noise generator
to
the
standard deviation, a ) do not change
to
observe the rms amplitude to prove
predkted
oscillator; the user
will
all
indicate the same
In
discussing tests for stationarity,
out
that,
for most noiS&generating
determine
the
amplitude of the noise are no
that
the mean and the
is
automatically zero, and
that
the fluctuations
from the bandwidth
of
the detector.
applied to the 1381 and no
is
detectable. The importance
is
is
assured
that
analogous
there
to
is
no change in
output
of
stabili-
the spectrum or the
to
amplitude distribution during
of the experiment.
re~
3.6 SUMMARY.
Because various terms used
are sometimes confused, a summary
in
speaking of random noise
is
presented here of the
most-often-used words, together with a brief explanation of
their meaning:
noise"
is a signal
"Noise"
whose future value cannot
is
any unwanted signal.
be
ed and that does not contain any periodic components. To
differentiate
distribution,
the
connection with the amplitude distribution. The word "intensity"
is
applies only
of
ticular
spectrum, and means
clearly between the spectrum and the amplitude
in
this book the word "density"
used only
in
connection with the spectrum. "Gaussian"
to the amplitude distribution and refers to a par-
theoretical distribution. "White" refers only
that
the spectral intensity
over some range of interest.
the
"Random
exactly
is
used only
is
course
predict~
in
to
the
constant
BIBLIOGRAPHY
1.
Bennet~
Hill Book
2.
Peterson,
meters to Random Noise," General Radio Ex-
perimenter,
3.
Hilibrand, J.,
bility
Research Laboratory of Electronics, Massa-
chusetts
Mass.,
1956.
4.
Bendat,
ment
Wiley
223.
5.
American Standards Association (now
United
American Standard Spec·ification for GeneralPurpose
1961, New York.
6.
MIL-STD-188B,
Command,
7. Beranek, L. L., Acoustic Measurements,
John Wiley&. Sons, Inc., New York, 1949.
8.
Holtje.J M. C., and M. J. Fitzmorris, 11A
Graphic Level Recorder with High Sensitivity
and Wide Ranges," General Radio Experi-
menter, Vol33,
?·
A useful bibliography for
1s:
S .
Cohen,
University Press, Cambridge, 1955, particu-
W. R., Electrical Noise, McGraw-
vo.,
Inc., New York (1960).
A.
P. G., 11Response of Peak Volt-
31, No.
Distributions for Excess Physical Noises,"
Institute
Technical Report 276, September
.T.
and Analysis of Random Data, John
& Sons, Inc., New York, 1966,
States
Sound
Fort
.S.
Stevens,
Bibliography on Hearing, Harvard
7,
December, 1956, p 3-8.
11
Characterization
of Technology, Cambridge,
8. and Piersol,
of America Standards InstitUte),
Level Meters, Standard
U.
S. Army Electronics
Monmouth, New ,Jersey.
No.6,
June, 1959.
J.
G.
S.
Lonng, and Dorothy
of
A.
G., Measure-
~hese
applications
Proba-
pp
219~
SL4,
larly those references listed in Sections
(p
571),
157
(p 573),
10. Faran, J. J., Jr.,
Application
tics Receiving Systems, Acoustics Research
Laboratory, Harvard
Mass., Technical Memorandum No. 28, No-
vember,
11. Crandall,
7,
Volume
Institute
1963.
12. General Radio Co., "Distribution of
dom
dent Laboralory, No. STX-.104, January,
(Copies of this publication
free of charge from the General Radio
Concord, Mass., 01781.)
13. General Radio Co., n Useful Formulas,
Tables, and
Instrument Notes, No. IN-103, June,
(Copies of this publication
free of
Concord, Mass., 01781.)
14. Kundert,
Convenience, with
tion Analyzer," General
Vol37,
15. Arthur
"Response
Noise," Noise Control, Vol5,
1959,
of
1952.
2, The M.I.T. Press, Massachusetts
of Technology, Cambridge, Mass.,
Noise Voltages," E1:periments for
charge from the General Radio Co., W.
No.9 & 10,
A.
of Structures to High Intensity
pp
13-19.
and
222-228
and
Correlation Techniques
S.
H., editor, Random Vibration,
Curves for
W.
R.,
the
Rieger and
R. Hills,
University, Cambridge,
may
be obtained
Random
may
be obtained
11
New Performance, New
New Sound and Vibra-
Rad-io
Harvey
No.5,
Expertmenter,
H. Hubbard
September-October, 1963.
139
(pp
579 f).
Jr.,
The
to
Amus-
Ran-
the
Stu-
1967.
Co., W.
Noise,"
1963.
September,
4aendat
and
Piersol,
op.
cit.,
p.
219-222.
PROPERTIES OF RANDOM NOISE 13/14
Page 18

Page 19

Section
4.1
DESCRIPTION OF CIRCUIT.
Figure
4-1
is
a block diagram
Noise
Generator (refer
a semiconductor diode (CR101). The noise
a
band-pass
that maintains a constant
plus CR102 and CR103). The
to 200 kHz. This noise
range
01101. The oscillator that drives the modulator (0111 and
01121 produces a symmetrical, almost-square
output
The
to
remove remnants
fier (0113), and then
have
cutoff
by
means
then amplified
circuit
adjustable by means
front
panel
the CLIPPING control, this circuit
amplifier with
of 0 to
50 kHz by a balanced modulator
of
the modulator
frequencies
of
the
(0114
(CR104-CR110).
to
2, 3, 4,
also
to
Figure
an
automatic-gain-control circuit
output
passband
is
heterodyned down
is
passed
of
the oscillator signal, through
to
one
of
three low-pass filters.
of
2, 5,
and
BANDWIDTH
and
of
the CLIPPING control, S102, on the
or
control S101. The noise
0115)
and
The clipping
5a.
In
the=
4-
of
the Type
7-3).
level
(0101 through
of
this amplifier
through a trap
50 kHz and
is
applied
is
(infinity)
is
disconnected and there
Principles
1381
The
noise
is
amplified in
to
the frequency
(0107
wave
at 150 kHz.
an
are
to
the clipping
symmetrical and
position
Random-
source
0106
is
100
through
circuit
ampli-
These
selected
of
of 0 peration
is
Block diagram
is
no clipping. The OUTPUT
output
amplifier
is
is
A voltage-regulated power supply (0501, 0502,
is
used
to
of
line
voltage. A slide
permits
power transformer for operation
or a 200. to 250-volt power line.
easy
(0116,
ensure stability
changeover
Figure
of
the
1381
0117)
of
operation over the specified
switch at the
of the primary
4-1.
Random-Noise
LEVEL
follow.
on
either a 100- to 125-volt
Generator.
control, R146,
rear
of the instrument
connections
and
the
0503)
range
of the
PRINCIPLES OF OPERATION 15/16
Page 20

Page 21

5.1 GENERAL.
Section
5-
Operating
Procedure
With
the
instrument placed in position on the bench or
installed
age
the
power, using the power cable supplied (P/N 4200.9622),
turn
5.4
LEVEL
5.2
switch that
trum.
the spectrum
spectrum
setting automatically changes the attenuation built into
in
a relay rack, set
slide switch
power~!ine
on the
Follow
for
setting the BANDWIDTH, CLIPPING,
controls.
BANDWIDTH CONTROL.
The BANDWIDTH control
At
(see
voltage. Connect the instrument
POWER
sets
this frequency, adjustable
level falls
switch.
the instructions given in paragraphs 5.2, 5.3,
the upper
level
is
12
the
screwdriver-operated line-volt-
Figure 1-2)
down 3 dB.
dB
to
the
is
cutoff
frequency
At
per octave. Changing this switch
range
corresponding
to
the
and
OUTPUT
a three-position selector
of
the noise
to
either 2, 5,
higher frequencies, the
or
50 kHz,
the
to
line
and
and
spec-
fii-
ter networks,
substantially the
spectrum, the spectral
bandwidths.
CW)
and
3.0 V, rms. The voltage spectral
each spectrum, for
Table 5.1. In
flat at frequencies down
Graphs
bandwidths
Voltage spectral levels for different bandwidths, with an
so
that
same.
At
full
with
no load, the
each
of
the voltage spectra
are
shown in Figure 3-3.
BANDWIDTH
2kHz
5kHz
50 kHz
the over-all rms noise output remains
As a result, in the flat portion
level
of the noise
output
the
case,
(OUTPUT
output
three different bandwidths, are given
the spectral
to 2 Hz.
TABLE
VOLTAGE SPECTRAL LEVEL
IN 1-HERTZ BANDWIDTH
5·1
is
greater
LEVEL
voltage
levels
in the flat portion
level
remains substantially
for
the three different
64mV
40mV
13 mV
OPERATING PROCEDURE 17
tor
the lesser
control
is
approximately
output
of 3
of
the
fully
of
in
V.
Page 22

5.3 CLIPPING
The CLIPPING control
necessary
that
characterize a Gaussianly-distributed random noise. The
CLIPPING control produces symmetrical clipping
independent
The clipping
the
rms value of the noise voltage.
CLIPPING control, no clipping occurs. Clipping
2· a
level
tion
of
about
energy
will remove the effect
further
to
reduction
distribution
5.4 OUTPUT
The OUTPUT LEVEL control
control
selected value between its maximum open-circuit value
proximately 3 V
level
by
to
some specific value,
meter for
CONTROL
to
limit
the
occasional wide extremes
of
the position
is
adjustable
has
negligible effect
1%)
higher frequencies).
of
to
Gaussian.
LEVEL
means
of
and 3 mV
the
measurement.
to
and
upon the spectrum
bandwidth
of
the clipping,
CONTROL.
which the output
is
useful
when
it
is
of
the OUTPUT
either
2,
3,
In
on
the
rms
It
should
by
filtering in external systems
(or
less).
When
use
an
average-responding
LEVEL
4, or 5
the
oo
position of
amplitude
Ia
slight shifting
be
kept in mind that
and
tend
is
a continuous rotary
level
can
setting the output
desirable
of
amplitude
of
the noise,
a,
where a
to
Ia
to
restore the
be
set
control.
the
even
the
reduc·
at any
of
ap-
ac
volt-
NOTE
or
is
of
The
outer
shell
of
the connector, which
side
of
the output,
instrument and
the captive link noted in
nected between
5.5.4
DC
In The Output.
There
may
OUTPUT terminals
capacitor, C124, which produces a voltage drop
Under
usual
conditions
having
ohms)
is
5,6
5.6.1
de
resistance
is
connected across the
significantly reduced.
USE
OF
AUXILIARY
PUT.
Generating Lower
is
insulated from the
is
connected
the
lower two binding posts.
be
a small component
because
that
of
leakage
it
is
less
is
low compared
output
EQUIPMENT TO MODIFY OUT-
Levels.
to
the case only when
paragraph
than 0.25 V.
terminals, this de voltage
Various attenuating devices can be connected to the
OUTPUT
Radio Type 1450
impedances
of
the generator
Decade
of
600 ohms,
to
reduce
the power level.
Attenuators, with input
can
be
inserted between the
and a 600-ohm load, for accurate attenuation
is
the low
case
of
the
5,5.2
is
con·
of
de
voltage at the
in the output coupling
in
R151,
When
a load
to
R151
(18 kil-
General
and
output
1381
in
decibel steps.
5.5 OUTPUT CONNECTIONS.
5.5.1 Output Impedance,
The output impedance
Generator
age
exceed 4 times
without
current
peaks
5.5.2 Grounding.
is
600
is
3 V, rms, and occasional
that
causing distortion of the noise. The maximum
into a
short~circuited
that
may exceed 4 times
A captive link
Q.
value. The
on
of
the Type
The maximum open-circuit
peaks
output
load
is
that
the lower binding post on the
1381
Random-Noise
of
the noise voltage may
can be
short~circuited
5 mA, rms, with occasional
value.
output
volt-
output
front
panel can be secured between the lower two binding posts,
connect the
instrument, thereby connecting it directly
of
the
these
LOW
OUTPUT terminal directly
to
three-wire power
two
lower terminals are connected internally by a
cord
When the captive link
to
the
the
ground wire
case
of
is
open,
10-
resistor, which keeps the instrument substantially grounded
all times. Opening the link,
LOW
between the
of
value in interrupting possible ground loops in which largeamplitude
to
measurement errors.
5,5,3
connector
when
is
provided for this purpose.
currents
Rear·Panel
In
some situations it may be desirable
on
the
instrument
OUTPUT terminal
at
Output Jack,
the
rear panel of the generator, for instance,
in
effect, inserts the
power~line
is
mounted
frequencies may contribute
in
a relay rack. A
and
ground,
to
use
10-lJ
and
the
resistor
may
output
BNC
to
the
n
at
be
jack
5,6.2 Generating Higher
The
noise
generated by the Type
Generator
range
can
be
is
adequate. The high crest factor
buted random noise must be kept
power rating
An amplifier capable
will
be
load
if
5.6.3 Generating
of
the amplifier,
capable
peaks
In
of
below
Bands
some applications it
narrow bands of noise. Because
it
is
a simple matter
that impedance
Wave
an
output
of
noise
Wave
Analyzer
Hz,
and
level.
analyzers that
are convenient for use as a filter. For narrow bands
of
fixed bandwidth, the
can
its frequency
Levels.
1381
amplified by any amplifier
in
so
that the
of
driving 40
driving only 5 W
4a
are
to
of
Noise.
to
drive a filter designed for operation
make
be
used.
range
is 0 to
W,
of
be
passed
is
desirable
the
output
the filtered
General
Its bandwidths
50 kHz, For constant-per-
whose
of
Gaussianly distri-
mind
noise
sine
wave,
random
without clipping.
to
impedance
signal
Radio Type 1900-A
are
Random-Noise
frequency
in
choosing the
is
not clipped.
into a load
noise
into that
use more or
is
600S1,
available
3,
10,
and
less
at
as
50
centage bandwidths, several analyzers are available, and their
bandwidths
are
given
Analyzers with
ANALYZER
1558
1564
1568
in Table
constant~percentage
5-2.
TABLE
5·2
bandwidths.
BANDWIDTH
1 octave
1/3, 1/10 octave
1%
18
TYPE 1381 RANDOM-NOISE GENERATOR
Page 23

The power available at the OUTPUT terminals
various analyzers
band noise
paragraph 5.6.2).
When the frequency response
noise,
several
chart paper on the
of
the chart paper indicating the center frequency
of
noise.
Wider bands
Type
1952 Universal Filter, which contains independently
justable low·
quencies
5.7
necessary
degree
duced
a resistor between their high
Figure
malized correlation coefficient of
can
GENERATING
DOM-NOISE SIGNALS.
In
experiments on correlation techniques,
to
of
correlation. Such a pair
from
5-1.
is
not
great; for general utility, the narrow-
from·the
analyzer will need amplification (refer
is
of
these analyzers
1521
Graphic-Level Recorder, the
of
noise
and
high-pass units. Upper and lower
be
adjusted over the range
TWO
PARTIALLY
generate
two
If
two
random-noise signals having a known
1381
Random-Noise Generators by connecting
the
output
can
can
be
generated by
of
signals can
OUTPUT terminals
amplitudes are made equal, the nor-
the
measured with bands of
be
synchronized
from 4 Hz
CORRELATED
two
noise signals will be
of
use
cutoff
to
it
is
sometimes
be
easily pro·
as
of
these
to
to
the
abcissae
the band
of
the
ad-
fre-
60kHz.
RAN·
shown in
NOISE
GENERATOR
#I
Method
between
of
the
two
e;€2
~
producing
noise
= (R')
Figure
varying
voltages
2R'
where e1 and e2 are the two
dicates the
tance
reduced by the loading
the actual
plotted, together
time
used.
The magnitude
output
average,
R'
on
voltage to the open-circuit output voltage
with
p , in Figure 5-2,
R
1381--6
5-1.
degrees
of
e1 and
correlation
e2 (see
Figure
5~2),
+ 2
2
+
2R'
+ 2
output
is
of
voltages, the overbar
~,
and R
6
the
output
is
voltage
the value
is
somewhat
of
each terminal, and the ratio,
as a function
resis-
r,
of
in-
of
is
R.
0
o.
•
0
'
-
r~
--·
•
0.
'
0
0
•oo
Normalized
generators
as a function
correlation
and
ratio
of
terminals
""
of
the
of
........
~
=
Figure
coefficient
output
resistance
the
generators
"0
600
R(OHMS)
5-2,
voltage
connected
f!OI5IOO
(p)
of
to
that
(see
!'-....
P-?-
I k
outputs
(v)
between
Figure
1.5k
with
5-1),
-
"'
of
the
-
two
no
'
"'
noise
resistor,
HIGH
,.
1"\.
"
,.,
w•
'
lOOk
l:!lll·7
ro
OPERATING PROCEDURE
19/20
Page 24

Page 25

Section
6.1
GENERAL.
The
Type
1381
Random-Noise Generator
ever a source
clipping, and spectral intensity constant
cies
is
Generator,
spectra, and balanced
put)
are
ments
other
is
:r:O
0
<t-
wc[
t;:::o
w"'
::0:::>
;:: 0
ww
>z
-1'!
t<z
~~
a: \:10.5
of
noise having
desirable. Its companion, the Type 1382 Random-Noise
is
useful where its features (white, pink, or USASI
needed.
will
particularly appropriate.
2.0
w
r::
1.5
In many applications either
serve well,
SPEECH
ANECHOIC
an
adjustable bandwidth, variable
or
unbalanced, floating
but
there are cases where one
I~
CHA\BER
\
<t
1.0
SPEECH
LIVE
STUDIO
IN
Ill\\
i \
!/
I
MUSIC
(ORCHESTRA
,\LAR?
is
to
very low frequen-
or
of
THEATRE)
~
(Curves
produced
is
an
analysis
0
-2.0
Amplitude
labeled
from
of
-1.0
INSTANTANEOUS
Figure
distribution
"Speech"
readings
an
orchestral
of
printed
6-1.
curves
are
for
selection
0
'
AMPLITUDE
for
particular
matter;
made
various
curve
in a large
1.0
sounds.
cases
labeled
of
6
-Applications
useful where-
grounded out-
these
instru-
or
the
IN
2.0
sounds
"Music"
theater.)
rally, 1 while
tirely different. These
by a comparison of the distributions of Figures
Distribution
Other applications depend
quency spectra of noise. The spectrum
amplitude distribution,
distribution
trum
- flat, broad, narrow, sloping,
affect one characteristic, however, may also affect the other;
For example, clipping affects both the amplitude distribution
and
the spectrum. Linear filter networks
dom
Gaussian
but
do alter the frequency characteristic
the
time scale. Linear filter networks, used after clipped noise,
alter the spectrum
cantly, also tend to make the distribution more nearly Gaussian.
1.5
0
-2.0
of
curves
the
amplitude distribution of a sine wave
similarities and differences can be seen
SINUSOIDAL
SPEECH
.LIVE~
\
--<
-1.0
INSTANTANEOUS
of a single
in
amplitudes
noise
do
and,
IN
~\
I \
b,.d"
RANDOM
0
Figure
6·2.
sinusoidal
on
the sense
is
not affect the amplitude distribution
if
they reduce the bandwidth signifi-
that
possible with any frequency
WAVE
""-1
v
~
NOIS~
AMPLITUDE
wave
the various possible fre-
or
t:::::-
1.0
and a random
is
independent of the
a normal (or Gaussian)
peaked.
used
and,
correspondingly,
6-1
and
1:::--..
2..0
noise.
Systems
on purely
is
en-
6-2.
spec-
that
ran-
Some applications
amplitude-distribution characteristics. For example, the
plitude
many other sounds
distribution
of
a noise generator depend on its
is
similar to
or
electrical disturbances
that
of speech, music, and
that
occur
am-
natu~
1
Dunn,
3,
H. K.,
January
tiona I Speech",
No.
and
Journal
1940,
White,
pp
S.D.,
of
the
278-288.
"Statistical
Acoustical
Measurements
Society
of
America,
on
Conversa·
APPLICATIONS
Vol.
11,
21
Page 26
6.2
USE OF NOISE
IN
ELECTRICAL
TESTI~IG.
6.2.5
Measurement
of
Effective Bandwidth.
6.2.1 Simulation
In
studying
or
sonar systems with regard
and recover signals
real
mixture
noise
of
controlled
sometimes
ceivers and
6.2.2
Measuring
Random noise
measuring
has been passed
level
of
the
quencies,
urements
in
the
is
of
noise
products. This
cause white noise
system
type
6.2.3
responds, and represents,
of
test signal.
Measuring Crosstalk.
White noise
uring crosstalk
systems.
the
frequencies
providing
ing a cure.
6.2.4
some
Testing Response
One of
that
an ac
the
rms,
or
signals
to
it
values, and observe
and
short
of
Background Noise.
the
of
signal
characteristics
becomes
other
modern
lntermodulation
performance
in
noise, it
and naturally occurring noise by adding
the
signal
signal-processing systems.
is
used
of
radio, telemetery, radar
to
their
ability
is
convenient
to
a standard signal. Noise
itself in tests of correlation
Distortion.
in
one
very effective
intermodulation distortion.2 White
through a band-stop
noise by, say,
applied
the
to
system
spectrum
is
an especially significant measurement be-
contains
is
in
multichannel
Spectrum
that
assistance
the
most
voltmeter
the
average value
that
have
the
a very
80
dB over a narrow range
the
input
output
indicate
has been filled
all
appropriate
analysis
cause
of
the
in
determining
of
Meter Circuits.
straightforward
circuit
responds
of
different
ratios
indications.
of
a system. Spectrum
the
frequencies
in
this
telephone,
the
crosstalk signal identifies
greatest disturbance,_ theret>y
the
input
of
In
rectangular pulses, Gaussian noise
purpose.3 Rms, peak,·and average values
in
are given
noise,
an
extremely large value
Table 3-2. Although
theoretically,
is
responding voltmeters
is
predictab1e,4 provided
infinite,
is
very slight.
to
Gaussian noise has been studied
the
the
the
probability
characteristics of
are known.
to
transmit,
to
detect,
simulate
method
noise,
which
filter that reduces
of
meas--
how
much
the
"notch"
in
by intermodu!ation
to
which
sense, a
signa! for use
the
methods
accurately
"worst~case"
in
meas~
radio,
or
telemetry
cause and specify-
of
showing
to
the
peak,
voltage
is
to
apply
peak, rms, and average
addition
peak value
to
sine waves.
is
useful for
of
various waveforms
of
Gaussian
this
of ever observing
The
response
of
peak-
and
the
voltmeter
When wave analyzers
tems)
are
used
to
measure
the
necessary
the
in
terms
system.
of
to
know
the
effective bandwidth
The
effective noise bandwidth
an ideal filter having a rectangular
acteristic {constant over a range
where
width
actly
are
the
of
the
the
else).
of
equal
two
total
re-
of
tral level
white
the
fre-
noise
being measured has appreciable transmission.
When
known,
effective
The
effective noise bandwidth
the
same
pass band
to
the
white
filters are
of
the
output
of
noise, provided
the
same. It can be measured by finding
signa! transmitted when white noise
is
applied
the
bandwidth
to
the
input. The frequency range
must
include all frequencies
the
effective
necessary
bandwidth
computations
of
the
filter
the
EBW, =
where
EBWn
Nout
Njn
Gfmax
measured with a sinewave
The
effective bandwidth
EBWn
is
the
effective
is
the
output
is
the
input noise voltage;
is
the
maximum
noise voltage;
signal).
of
the
1381 Random-Noise Generator
the
upper
cutoff
frequency, as indicated by
control,
6.2.6
is
white
of
response range
uring
ly
and observing
pulse may have
observable signal
i.e.,
2.22,
5.55,
or
55.5
Determining Impulse Response by
The
impulse response
the
cross-correlation function
noise
is
applied
the
noise need only be large compared
of
the
the
correlation function
more
satisfactory than applying an impulse (delta function)
the
response directly, as
to
at
the
at
the
system
exceed
output.
of
the
or
filters {or
the
spectral
of
frequencies,
ideal filter
the
actual filter
the
are simplified.
is
bandwidth
or
peak gain
noise
at
is
closely equal
kHz.
an amplifier,
of
its
input
In
under
test.
is
available, this
the
overload level
mo_re
density
of
can
frequency
of
whose
when
complex
of
the
be
and
a filter
output
noise, it
filter
or
thought
char-
zero
every~
is
is
the
inputs
sy&
is
of
of
the
ex-
maximum transmissions
of
known
spec~
of
the
for
which
the
filter
of
the
input
noise
is
Then
the
of
the
noise;
of
the
filter (as
the
output
Cross~Correlation.
network,
output
practice,
It
apparatus
amplitude
of
to
1.11 times
the
BANDWIOTH
and
input
the
bandwidth
to
the
frequency-
method
of
to
produce
the
Type
or
system
when
for
meas-
is
usual~
the
im-
an
2
MIL
STD-1888.
3
1ts
use
is
Standard
1961
),
4
Peterson,
The
General
suggested
Specification
A. P.
Radio
in
ASA
for
G.,
"Response
Experimenter,
(now
Generai~Purpose
USASI)
of
Peak
December,
Standard
Sound-Level
Voltmeters
1956,
to
S1.4,
Meters
Random
American
{Jan.
Noise,"
22 TYPE 1381 RANDOM-NOISE GENERATOR
6.2. 7 Observing Overload Characteristics.
To
9,
sometimes
limit
the
have
been
sists
of
short
metrical,
Random
observe
total rms power. Trains
used
and,
noise
the
effect
of
desirable
to
use a signal with a high peak factor,
tor
this purpose,
pulses
of
alternating polarity,
for
this reason, may produce undesirable effects.
is
a symmetrical signal
overloading
of
short
but
unless
that
an
amplifier, it
rectangular pulses
such
a signal
it
is
highly unsym-
can be used
for
is
to
con~
this
Page 27
purpose. Gaussianly distributed noise,
has
band,
peaks greater than 4
ct
"white"
that occur often enough
readily observable.
6.2.8 Broad-Band Testing
When one wishes
of
types
able
equipment,
to
use
a broad-band signal
ercised over its entire frequency
The continuous spectrum
purpose.
Clipping
permitting greater rms
It
is
also conceivable
cal
equipment may require some sort
which random noise may
6.3 USE
OF NOISE IN
TICAL
TESTING.
or
Burn-ln.
to
test over-all performance
such
as
audio amplifiers,
so
that the system
range
of
noise
can
be
used
to
limit
levels
without
that
certain types
be
the ideal test signal.
ACOUSTICAL
it
all
at
once.
makes
the
peak
overload.
of
of
run-in
AND PSYCHOACOUS-
6.3.1 Frequency-Response Measurements.
Frequency-response measurements
vices made
with
a sine-wave
tone
source, especially when
in nonanechoic surroundings, are frequently
because
pret
either
terns. When the
is
measured,
because
and
receiver in the room. When this
be
made easier
of
the large fluctuations in the
to
characteristics
response
for
example, fine details
of
the device or
of
a loudspeaker in a particular room
they depend upon the precise placement
to
interpret
by
using a band
the sine-wave signal. 5 The noise signal, in effect,
measurement over a
er
cu.rve.
A constant-bandwidth
1900,6 having the filtered
plied at its
input,
range
of
output
can
produce a band
frequencies, producing a
available,
tuneable across the audio-frequency
of
frequencies below 50 Hz). This band
plified and applied
response
curve
Recorder7'driving the tuning dial
as
in the 1910 Recording
to
the loudspeaker
can
be
recorded
Wave
with
of
Analyzer.
of
electroacoustic
difficult
response
to
standing-wave pat-
are
of
little
is
the
case,
of
noise in place
wave
analyzer, such
with
of
noise 50-Hz wide,
range
(with the exception
of
noise
as
the test signal. The
the
1521
the analyzer automatically,
over the audio
to
of
certain
may
be
desir-
is
being ex-
it
ideal
for
this
amplitudes,
electroacousti-
or
burn~in
made
to
inter-
curve due
significance,
of
the source
the curve
averages
white noise
can
can
the
smooth~
as
the
ap-
be
am-
Graphic Level
be
fuse-field
tory
response
that
a random-noise source
of
a microphone.
be
6.3'.3 Sound-Transmission Measurements.
In measurements
panels, walls,
because
it
is
and
necessary
reproduceable results. As mentioned above, the
dom-noise
signal
fuse-sound field. Random noise
measurement
of
tioning ducts.
for
6.3.4 Psychoacoustical Testing.
noise
such
cal
Random
tests,
measurements, determination
diometric
tests.
discussed in the various
de-
Society
There
6.4
of
America
is
a useful bibliography for these applications.11
VIBRATION
The Type
signal source
testing.
is
of
especially useful
adjustable clipping feature
12• 13
for
Because
extreme amplitudes,
that
produce the vibrations,
in the amplifiers
clipped
removed
eral,
the
not
noise
also,
if
further
output
be
effective.
is
reduced by subsequent filtering, the
and
spectrum~shaping
of
the Type 1381, the clipping in the generator will
6.5 DEMONSTRATING
of
the transmission
floors, random noise
to
have
a diffuse-sound field to obtain
is
one
of
the best methods
sound attenuation in heating
is
an
important
as
masking or inter-ference tests, loudness
of
The techniques
issues
of
~nd
in various psychological journals.
TESTING.
1381
Random-Noise Generatior
driving shakers
the spectrum ,level
for
vibration testing
is
useful also,
to
protect the shakers or loudspeakers
and
to
used
to
drive thern.
peaks
greater than
STATISTICAL
"It
is
practically manda-
10
used."
of
sound through
is
often
used,
mainly
use
of
of
obtaining a dif-
is,
again, a useful signal
and
air-condi-
signal
for-
psychoacousti-
critical bandwidths,
used
in making
the Journal
for
of
random~noise
is
flat
down to 2 Hz,
of
large
because
and
such
tests
the Acoustical
is
useful
vibration
systems.
it
limits the
prevent overload problems
If
the bandwidth
c!ipp_ing
3a
again
appear. In
operations
are
performed on
PROPERTIES.
a ran-
for
au-
are
as
The
of
the
gen-
a
it
is
6.3.2 Measurements Under Reverberant Conditions.
A band
interest,
tion time. a, 9 There are many acoustical measurements
are
made under reverberant conditions,
of
the acoustical absorption
5eeranek,
6General
7
General
Bseranek,
9General
of
random· noise, centered on the frequency
is
a very useful signal
L.
L.,
op.
cit.
665-666.
Radio
Experimenter,
Radio
Experimenter,
L.
L.,
op.
cit.
pp.
Radio
Experimenter,
for
measurements.
such
of
materials. In obtaining the
Volume
38,
No,
4,
Volume
38,
No.9,
804-806.
Volume
38,
No.9,
of
as
determination
April,
1964,
Sept.,
1964.
Sept.,
1964.
reverbera~
o·f
that
dif-
6.5.1 Measurement
An experimental method
tribution
1
Oseranek,
11
Stevens,
Hearing, Harvard
those
228
12crandall,
Cambridge,
13Harris,
3
Vols.,
references
(pp,
579f).
C.
McGraw-Hill
of
random noise
L. L.,
op,
S.
S,,
Loring,
University
listed
s.
H.,
Random
Massachusetts
M.,
and
of
Amplitude Distribution.
of
measuring the amplitude
is
presented in a
cit.
pp,
639-640.
J.
G.
S.,
and
in
Sections
(1963),
Crede,
Book
Press,
Vibration,
Co.,
139
Chapter
C. E.,
Inc.,
Cohen,
Cambridge,
(p.
571
Volume
9.
Shock
New
APPLICATIONS 23
Dorothy,
Mass.,
),
157
2,
and
Vibration
York,
General
Bibliography
1955;
(p,
573)
the
M.
1961.
dis~
Radio
particularly
and
222-
I.
T.
Press,
Handbook,
on
Page 28

Student
for
which
when
accurately Gaussian
the
Experiment
this purpose
the
amplitude
clipping
note.
because
is
not
than
Note.'4 The
of
its
distribution
used,
its amplitude distribution
that
of
1381
is
dipping
feature,
can be changed1 and
the
Type 1390-B, called
6.5.2 Demonstration of Correlation Theory.
In
experiments
on correlation theory,
particularly suitable
by
means
of
because,
is
more
for
in
it
is
often
neces-
sary
to
generate
two
random signals having a known correla-
tion. Such signals can be generated easily with
dam-Noise Generators. The procedure
in
paragraph 5.7.
Correlation
nals together and averaging
this purpose
two
random signals
corre!egrams
lent
to
Lissajous patterns
is
properly measured by multiplying two
the
is
not
available, the degree
can
be
observed
or
scatterp!ots.
15
for
random signals.
for
doing
result. When equipment for
of
correlation between
by
means
These
are
substantially equiva-
two
1381 Ran·
so
is
described
of
oscillographic
sig-
14General
bution
of
West
this
Concord,
of
note
Radio
Random
can
Mass.,
Co,,
Noise
be
obtained
Experiments
Voltages",
free
01781,
of
for
the
No.
charge
Student
STX-104
by
writing
Laboratory,"
(Jan.,
1967}. A copy
to
General
Distri-
Radio,
24 TYPE 1381 RANDOM-NOISE GENERATOR
15Licklider,
Illustrating
2770,
p,
J.
Various
121-124
C. A.,
{Jan.
and
Degrees
30,
Dzendolet,
of
Correlation",
1g:48).
E.,
"Oscillographic
Science,
Scatterplots
Vol.
107,
No.
 Loading...