

Page 1
Motion Software, Inc.
535 West Lambert Road, Building “E”
Brea, California 92821-3911
Voice: 714-255-2931, Fax: 714-255-7956
Web: www.motionsoftware.com
Email: support@motionsoftware.com
Dyno2000 Simulation v3.10, 5-/01 Release 5
Dyno2000 Advanced Engine Simulation—1
Page 2

MOTION SOFTWARE, INC. SOFTWARE LICENSE
PLEASE READ THIS LICENSE CAREFULLY BEFORE
BREAKING THE SEAL ON THE DISKETTE ENVELOPE AND
USING THE SOFTWARE. BY BREAKING THE SEAL ON
THE DISKETTE ENVELOPE, YOU ARE AGREEING TO BE
BOUND BY THE TERMS OF THIS LICENSE. IF YOU DO
NOT AGREE TO THE TERMS OF THIS LICENSE,
PROMPTLY RETURN THE SOFTWARE PACKAGE, COMPLETE, WITH THE SEAL ON THE DISKETTE ENVELOPE
UNBROKEN, TO THE PLACE WHERE YOU OBTAINED IT
AND YOUR MONEY WILL BE REFUNDED. IF THE PLACE
OF PURCHASE WILL NOT REFUND YOUR MONEY, RETURN THE ENTIRE UNUSED SOFTWARE PACKAGE,
ALONG WITH YOUR PURCHASE RECEIPT, TO MOTION
SOFTWARE, INC. AT THE ADDRESS AT THE END OF THIS
AGREEMENT. MOTION SOFTWARE, INC. WILL REFUND
YOUR PURCHASE PRICE WITHIN 60 DAYS. NO REFUNDS
WILL BE GIVEN IF THE DISKETTE ENVELOPE HAS BEEN
OPENED.
Use of this package is governed by the following terms:
1. License. The application, demonstration, and other software accompanying this License, whether on disk or on any other media (the “Motion Software, Inc. Software”), and the related documentation are licensed to you by
Motion Software, Inc. You own the disk on which the Motion Software, Inc.
Software are recorded but Motion Software, Inc. and/or Motion Software,
Inc.’s Licensor(s) retain title to the Motion Software, Inc. Software, and related documentation. This License allows you to use the Motion Software,
Inc. Software on a single computer and make one copy of the Motion Software, Inc. Software in machine-readable form for backup purposes only.
You must reproduce on such copy the Motion Software, Inc. copyright notice and any other proprietary legends that were on the original copy of the
Motion Software, Inc. Software. You may also transfer all your license rights
in the Motion Software, Inc. Software, the backup copy of the Motion Software, Inc. Software, the related documentation and a copy of this License to
another party, provided the other party reads and agrees to accept the terms
and conditions of this License.
2. Restrictions. The Motion Software, Inc. Software contains copyrighted
material, trade secrets, and other proprietary material, and in order to protect them you may not decompile, reverse engineer, disassemble or otherwise reduce the Motion Software, Inc. Software to a human-perceivable
form. You may not modify, network, rent, lease, loan, distribute, or create
derivative works based upon the Motion Software, Inc. Software in whole or
in part. You may not electronically transmit the Motion Software, Inc. Software from one computer to another or over a network.
3. Termination. This License is effective until terminated. You may terminate
this License at any time by destroying the Motion Software, Inc. Software,
related documentation, and all copies thereof. This License will terminate
immediately without notice from Motion Software, Inc. if you fail to comply
with any provision of this License. Upon termination you must destroy the
Motion Software, Inc. Software, related documentation, and all copies
thereof.
4. Export Law Assurances. You agree and certify that neither the Motion
Software, Inc. Software nor any other technical data received from Motion
Software, Inc., nor the direct product thereof, will be exported outside the
United States except as authorized and permitted by United States Export
Administration Act and any other laws and regulations of the United States.
5. Limited Warranty on Media. Motion Software, Inc. warrants the disks on
which the Motion Software, Inc. Software are recorded to be free from defects in materials and workmanship under normal use for a period of ninety
(90) days from the date of purchase as evidenced by a copy of the purchase
receipt. Motion Software, Inc.’s entire liability and your exclusive remedy
will be replacement of the disk not meeting Motion Software, Inc.’s limited
warranty and which is returned to Motion Software, Inc. or a Motion Software, Inc. authorized representative with a copy of the purchase receipt.
Motion Software, Inc. will have no responsibility to replace a disk damaged
by accident, abuse or misapplication. If after this period, the disk fails to
function or becomes damaged, you may obtain a replacement by returning
the original disk, a copy of the purchase receipt, and a check or money order
for $10.00 postage and handling charge to Motion Software, Inc. (address is
at the bottom of this agreement).
6. Disclaimer of Warranty on Motion Software, Inc. Software. You expressly
acknowledge and agree that use of the Motion Software, Inc. Software is at
your sole risk. The Motion Software, Inc. Software and related documentation are provided “AS IS” and without warranty of any kind, and Motion Software, Inc. and Motion Software, Inc.’s Licensor(s) (for the purposes of provisions 6 and 7, Motion Software, Inc. and Motion Software, Inc.’s Licensor(s)
shall be collectively referred to as “Motion Software, Inc.”) EXPRESSLY DISCLAIM ALL WARRANTIES, EXPRESS OR IMPLIED, INCLUDING, BUT NOT
LIMITED TO, THE IMPLIED WARRANTIES OF MERCHANTABILITY AND FITNESS FOR A PARTICULAR PURPOSE. MOTION SOFTWARE, INC. DOES NOT
WARRANT THAT THE FUNCTIONS CONTAINED IN THE MOTION SOFTWARE,
INC. SOFTWARE WILL MEET YOUR REQUIREMENTS, OR THAT THE OPERATION OF THE MOTION SOFTWARE, INC. SOFTWARE WILL BE UNINTERRUPTED OR ERROR-FREE, OR THAT DEFECTS IN THE MOTION SOFTWARE,
INC. SOFTWARE WILL BE CORRECTED. FURTHERMORE, MOTION SOFTWARE, INC. DOES NOT WARRANT OR MAKE ANY PRESENTATIONS REGARDING THE USE OR THE RESULTS OF THE USE OF THE MOTION SOFTWARE,
INC. SOFTWARE OR RELATED DOCUMENTATION IN TERMS OF THEIR CORRECTNESS, ACCURACY, RELIABILITY, OR OTHERWISE. NO ORAL OR WRITTEN INFORMATION OR ADVICE GIVEN BY MOTION SOFTWARE, INC. OR A
MOTION SOFTWARE, INC. AUTHORIZED REPRESENTATIVE SHALL CREATE
A WARRANTY OR IN ANY WAY INCREASE THE SCOPE OF THIS WARRANTY.
SHOULD THE MOTION SOFTWARE, INC. SOFTWARE PROVE DEFECTIVE, YOU
(AND NOT MOTION SOFTWARE, INC. OR A MOTION SOFTWARE, INC. AUTHORIZED REPRESENTATIVE) ASSUME THE ENTIRE COST OF ALL NECESSARY SERVICING, REPAIR, OR CORRECTION. SOME JURISDICTIONS DO NOT
ALLOW THE EXCLUSION OF IMPLIED WARRANTIES, SO THE ABOVE EXCLUSION MAY NOT APPLY TO YOU.
7. Limitation of Liability. UNDER NO CIRCUMSTANCES INCLUDING NEGLIGENCE, SHALL MOTION SOFTWARE, INC. BE LIABLE FOR ANY INCIDENT,
SPECIAL, OR CONSEQUENTIAL DAMAGES THAT RESULT FROM THE USE,
OR INABILITY TO USE, THE MOTION SOFTWARE, INC. SOFTWARE OR RELATED DOCUMENTATION, EVEN IF MOTION SOFTWARE, INC. OR A MOTION
SOFTWARE, INC. AUTHORIZED REPRESENTATIVE HAS BEEN ADVISED OF
THE POSSIBILITY OF SUCH DAMAGES. SOME JURISDICTIONS DO NOT ALLOW THE LIMITATION OR EXCLUSION OF LIABILITY FOR INCIDENTAL OR
CONSEQUENTIAL DAMAGES SO THE ABOVE LIMITATION OR EXCLUSION
MAY NOT APPLY TO YOU.
In no event shall Motion Software, Inc.’s total liability to you for all damages,
losses, and causes of action (whether in contract, tort (including negligence)
or otherwise) exceed the amount paid by you for the Motion Software, Inc.
Software.
8. Controlling Law and Severability. This License shall be governed by and
construed in accordance with the laws of the United States and the State of
California. If for any reason a court of competent jurisdiction finds any provision of this License, or portion thereof, to be unenforceable, that provision of
the License shall be enforced to the maximum extent permissible so as to
effect the intent of the parties, and the remainder of this License shall continue in full force and effect.
9. Complete Agreement. This License constitutes the entire agreement between the parties with respect to the use of the Motion Software, Inc. Software and related documentation, and supersedes all prior or contemporaneous understandings or agreements, written or oral. No amendment to or
modification of this License will be binding unless in writing and signed by a
duly authorized representative of Motion Software, Inc.
Motion Software, Inc.
535 West Lambert, Bldg. E
Brea, CA 92821-3911
714-255-2931; Fax 714-255-7956
© 1995, 2001 By Motion Software, Inc. All rights reserved. Motion Software,
Inc., MS-DOS, DOS, Windows, and Windows95/98NT/2000 are trademarks
of Microsoft Corporation. IBM is a trademark of the International Business
Machines Corp. Motion-PC, DeskTop Dyno, Drag2000, DeskTop Dyno2000,
DeskTop DragStrip, DeskTop Drag2000, DragStrip2000, Dyno Shop and other
DeskTop and Motion-PC software products are trademarks of Motion Software, Inc.
All other trademarks, logos, or graphics are the property of their respective
owners.
2—Dyno2000 Advanced Engine Simulation
Page 3

MOTION SOFTWARE ACKNOWLEDGMENTS, ETC.
ACKNOWLEDGMENTS: Larry Atherton of
Motion Software wishes to thank the many
individuals who contributed to the development and marketing of this program:
Lance Noller, Lead Programmer. A special
thanks for his dedication to the Dyno2000
project. His programming skills, tenacious
troubleshooting and creative problem solving made the Dyno2000 possible.
Curtis Leaverton, Simulation Designer. My
friend and college, Curtis Leaverton is the
“brains” behind the Dyno2000. His engine
computer simulations have changed the
way performance enthusiasts approach
engine building.
Brent Erickson, Simulation Designer, Pro-
grammer. Developed new simulation models for the Dyno2000. A brilliant programmer, Brent’s positive “can-do” attitude is
backed up by his ability to accomplish what
many dismiss as impossible.
Trent Noller, Marketing/Sales Manager.
Trent excels at problem solving and there
were more than a few problems that required his creative skills during the development and deployment of the Dyno2000.
My friend for many years, Trent Noller can,
simply, be credited with the success of the
Dyno2000.
And special thanks are due to the marketing and management personnel of the Mr.
Gasket Performance Group™:
Gary Gibson, His dedication to the Desk-
Top software line is more than greatly appreciated.
Bob Bruegging, President, CEO, Mr. Gas-
ket Performance Group. Bob’s experience
in performance marketing is vast. And so
is his enthusiasm!
And thanks to the many other individuals
at Mr. Gasket who have contributed to the
success of the DeskTop line, including:
Don McGee, Kirk Tinney, Mike Roth and
others too numerous to mention.
This publication is the copyright property of Motion Software, Inc.,
Copyright © 1995, 2001 by Motion Software, Inc., 535 West Lambert, Bldg. E, Brea, CA 92821-3911. All rights reserved. All text
and photographs in this publication are the copyright property of
Motion Software, Inc. It is unlawful to reproduce—or copy in any
w
w
w
.
m
o
t
i
o
The text, photographs, drawings, and other artwork (hereafter referred to as information) contained in this publication is
provided without any warranty as to its usability or performance. Specific system configurations and the applicability of
described procedures both in software and in real-world conditions—and the qualifications of individual readers—are beyond the control of the publisher, therefore the publisher disclaims all liability, either expressed or implied, for use of the
information in this publication. All risk for its use is entirely assumed by the purchaser/user. In no event shall Motion Software, Inc. be liable for any indirect, special, or consequential damages, including but not limited to personal injury or any
other damages, arising out of the use or misuse of any information in this publication. This book is an independent publication of Motion Software, Inc. All trademarks are the registered property of the trademark holders.
The publisher (Motion Software, Inc.) reserve the right to revise this publication or change its content from time to time
without obligation to notify any persons of such revisions or changes.
®
c
.
e
r
a
w
t
f
n
o
s
way—resell, or redistribute this information without the expressed
m
written permission of Motion Software, Inc. This PDF document
o
may be downloaded by Dyno2000 users and prospective buyers
for informational use only. No other uses are permitted.
Dyno2000 Advanced Engine Simulation—3
Page 4

CONTENTS
MOTION SOFTWARE LICENSE......................... 2
ACKNOWLEDGMENTS ...................................... 3
INTRODUCTION ................................................. 5
How It Works ..............................................5
What’s New In The Dyno2000 ..................6
Dyno2000 Requirements........................... 7
Requirements In Detail .............................7
INSTALLATION ................................................. 10
Helpful Installation Hints .........................10
Installing The Dyno2000 .........................10
Starting The Dyno2000 ........................... 11
PROGRAM OVERVIEW .................................... 13
Main Program Screen .............................. 13
Using The Mouse Or Keyboard ..............16
Direct-Entry Menu Choices ..................... 18
The Meaning Of Screen Colors............... 19
THE ENGINE COMPONENT MENUS............... 20
Bore, Stroke, Number Of Cylinders........ 20
What’s A Shortblock ........................ 20
Bore, Stroke, & Compression ......... 21
Cylinder Head And Valve Diameters ......21
Basic Flow Theory ........................... 22
Sorting Out Head Choices ..............23
Low-Performance ............................ 24
Wedge Cylinder Heads .................... 25
Canted-Valve Heads ........................25
4-Valve Heads................................... 26
Custom Port Flow ............................ 28
Valve Diameter Menu...............................29
Compression Ratio Menu........................ 30
Compression Basics .......................31
Changing Compression Ratio ........33
Compression Ratio Calculator .......34
Calculator With Flattops ................. 35
Calculator With Domed Pistons .....36
Induction Menu ........................................38
Airflow And Pressure Drop ............. 39
Airflow Assumptions ....................... 40
Airflow Calculator ............................ 40
Mode 1, Convert To 4-Bbl Flow....... 41
Mode 2, Convert To 2-Bbl Flow....... 42
Mode 3, Convert To Any Flow......... 43
Fuel Menu .................................................44
Nitrous-Oxide Injection ...................44
Induction Manifold Menu......................... 46
Dual-Plane ........................................46
Single-Plane .....................................49
Tunnel-Ram ......................................51
Individual Runner ............................ 52
Tuned-Port Injection ........................53
Sequential-Fire Injection ................. 55
Forced Induction Menus .........................55
Intercoolers ..............................................58
Exhaust Menu........................................... 60
Stock Manifolds/Mufflers ................61
HP Manifolds/Mufflers ..................... 61
Small Headers With Mufflers ..........62
Small Headers Open Exhaust ......... 63
Large Headers With Mufflers .......... 63
Large Headers Open Exhaust......... 63
Large Stepped Headers................... 64
Camshaft Menu ........................................65
Cam Basics ...................................... 66
Valve Events..................................... 67
Camshaft Menu Choices ................. 68
Stock Street/Economy..................... 69
HP Street...........................................70
Dual Purpose Street/Track .............. 70
Drag Race/Circle Track.................... 70
Drag Race High Speed ....................71
Lifter Menu................................................ 71
Hydraulic .......................................... 72
Solid, Flat-Tappet............................. 72
Roller Or Roller Hydraulic ............... 72
Making The Best Lifter Choice .......72
Timing Method Menu ............................... 74
Seat-To-Seat Method ....................... 75
0.050-Inch Method ........................... 75
Advance/Retard Menu .............................76
Saving Cam Specs Menu ........................77
The Cam Math Calculator ........................78
THE GRAPHICS RESULTS DISPLAY .............. 81
THE ITERAT OR................................................. 87
Setting Up Iterative Testing..................... 89
Halting And Restarting Testing ...............93
Tips For Running Iterative Testing .........93
OTHER FEATURES .......................................... 95
DOS File Compatibility ............................ 95
Printing Dyno Data And Power Curves.. 96
General Simulation Assumptions ..........98
FREQUENTL Y ASKED QUESTIONS ............. 100
Basic Operation .....................................100
Screen Display .......................................101
Bore/Stroke/Shortblock......................... 101
Compression Ratio ................................ 101
Induction/Fuels ......................................101
Camshaft/Valvetrain...............................103
Running A Simulation............................ 105
MINI GLOSSARY ............................................106
DYNO TEST NOTES ....................................... 111
MAIL/FAX SOFTWARE SUPPORT FORM ..... 113
4—Dyno2000 Advanced Engine Simulation
Page 5
INTRODUCTION
INTRODUCTION
Note:
If you can’t wait to start the Dyno2000™, feel free to jump ahead to
LATION on page 10,
time. Also, make sure you mail in your registration card—it entitles you to receive a
FREE upgrade and other information and support.
Thank you for purchasing the Dyno2000™ for IBM®-compatible computers. This
software is the result of several years of development and testing. It is just one of
several quality software products developed by Motion Software, Inc., that can further your understanding and enjoyment of automobiles, performance, and racing
technology.
The Dyno2000 is a Windows95/98 and WindowsNT/2000, 32-bit program based
on the
family of mathematical models because of their
excellent power prediction accuracy and fast processing times. The Dyno2000 is a
lation. This means that it calculates the complete
fluid-dynamic, thermodynamic, and frictional conditions that exist inside each cylinder throughout
the entire 720 degrees of the four-cycle process.
grams on the market (even a few that sell for several times the price of the Dyno2000) are not true
engine
metric efficiency (VE) and then derive an estimate
Filling-And-Emptying
You will find that many other simulation pro-
simulations
but don’t forget to read the rest of this manual when you have
HOW IT WORKS
method of engine power simulation. We chose this
full-cycle
. Rather, they calculate the volu-
simu-
INSTAL-
The Dyno2000 is the most advanced engine simula-
tion ever offered to the performance enthusiast. It
combines ease of use, rapid calculation times,
powerful Iterative Testing™, and detailed graphics.
The Dyno2000 is available from Mr. Gasket Perfor-
mance and Motion Software, Inc.
Dyno2000 Advanced Engine Simulation—5
Page 6
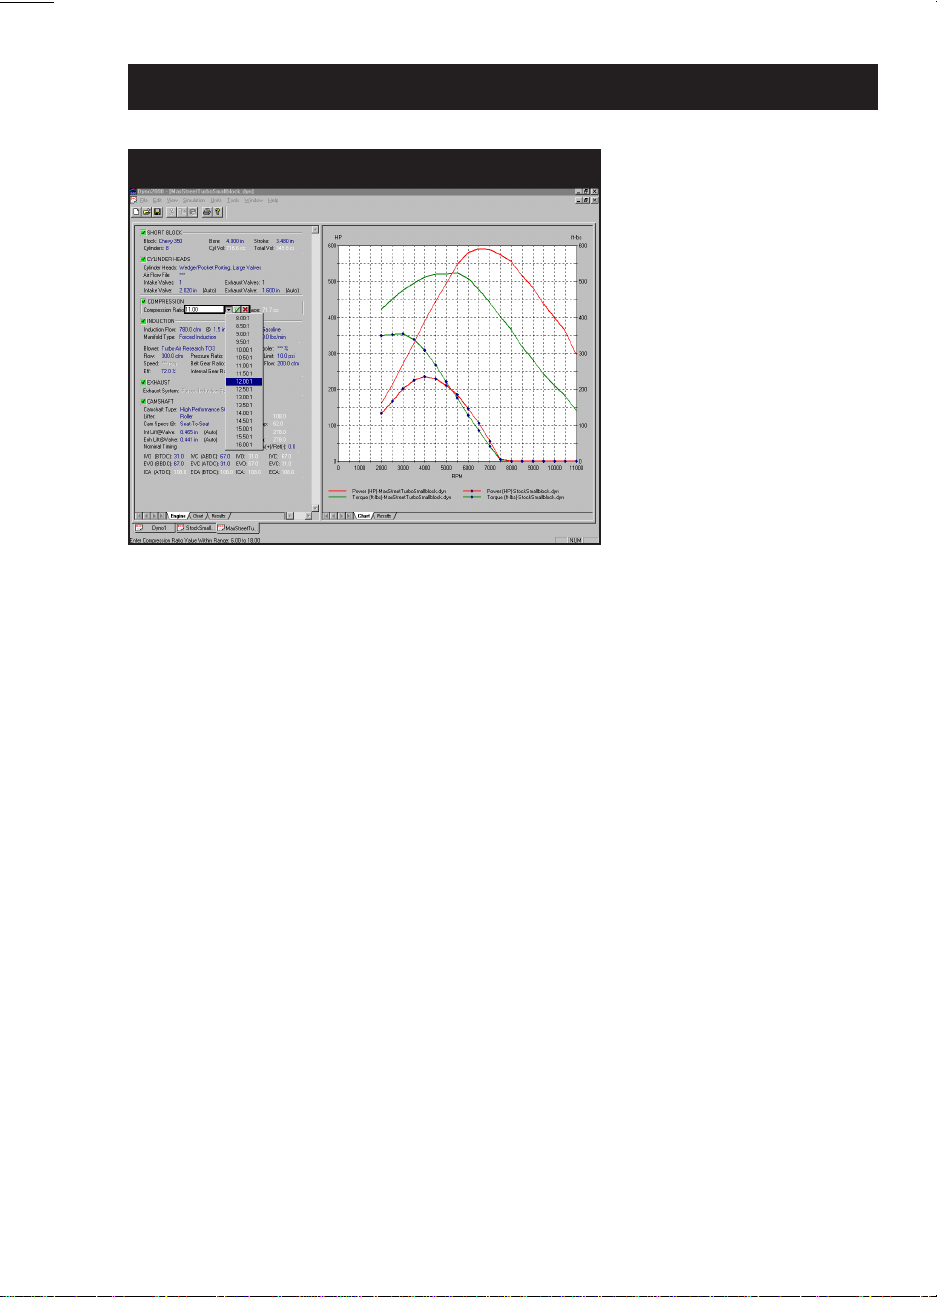
Introduction To The Dyno2000
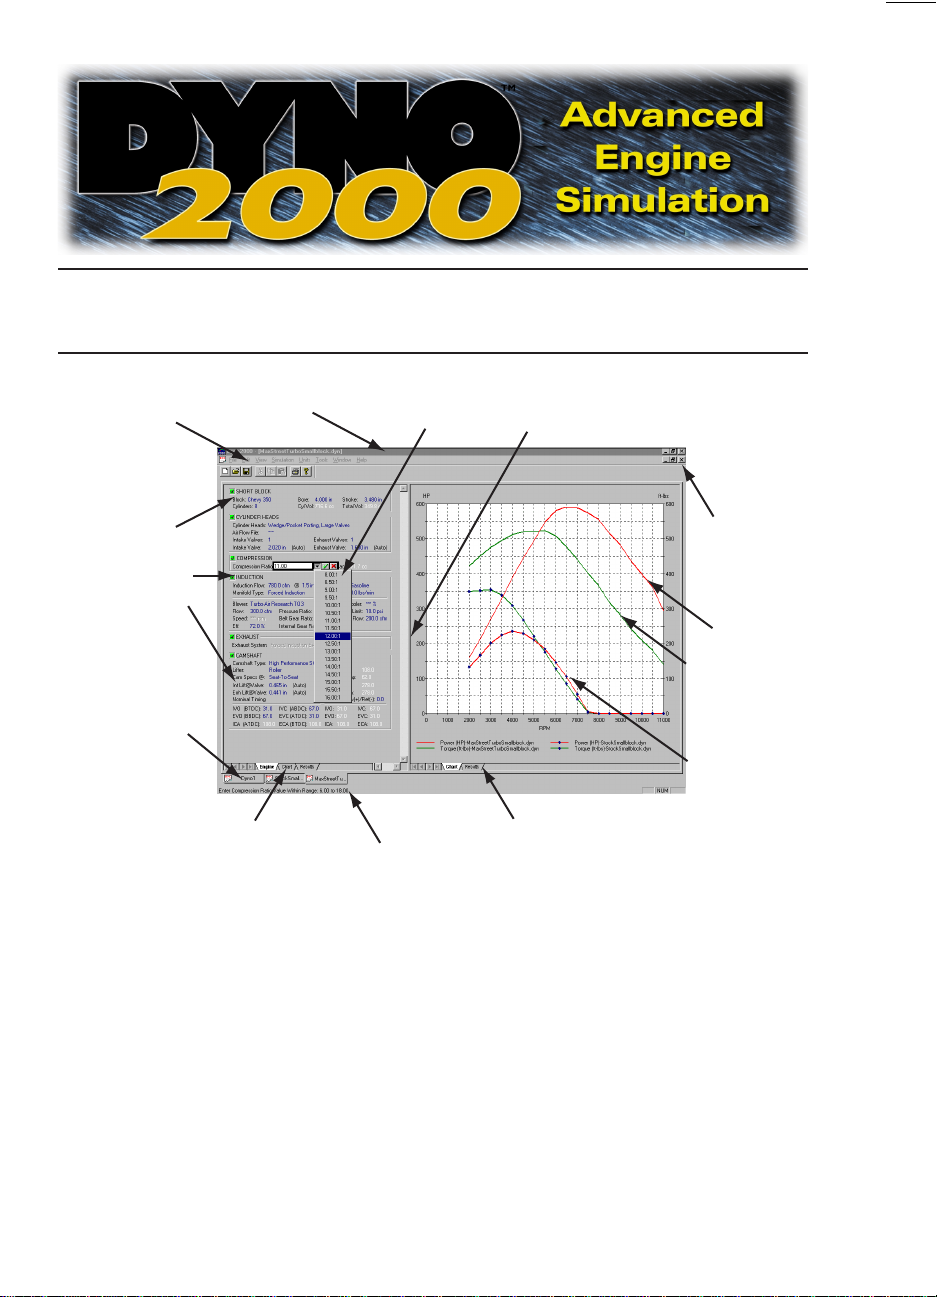
Dyno2000 Main Component Screen
The Dyno2000 incorporates a
very clean, intuitive user
interface. If you wish to
change a component, simply
click on the component
name and select a new
component from the dropdown list. A comprehensive
data display is fully
customizable. Multiple
engine and/or data value
comparisons are possible.
All components and graphics
displays can be printed in
full color.
of torque and horsepower. There are many shortcomings to this technique. The two
greatest drawbacks are: 1) since cylinder pressure is not determined, it is impossible
to predict the pressure on the exhaust valve and the subsequent mass flow through
the port when the exhaust valve opens, and 2) the inability to accurately determine
the pumping horsepower (energy needed to move gasses into and out of the engine)
from the predicted horsepower.
Since the Dyno2000 incorporates both filling-and-emptying
ing that includes frictional and pumping-loss calculations, extensive computation is
required for each power point. In fact, the program performs several million calculations at each 500rpm test point on the power curve (a full power-curve simulation
consists of 27 test points). This in-depth analysis offers unprecedented accuracy
over a vast range of engines. The Dyno2000 has been successfully used to model
single-cylinder “lawn mower” engines, light aircraft engines, automotive engines,
modern Pro Stock drag-racing powerplants, and multi-thousand horsepower supercharged, nitrous-oxide injected “mountain motors.”
and
full-cycle model-
WHAT'S NEW IN THE DYNO2000
The Dyno2000 features a completely unique, easy-to use, point-and-click interface. Just click on any component, and drop-down menus offer alternative selections. Hundreds of components are available, including a wide selection of import
engines. Instantly change between US and Metric measurements.
The Dyno2000 also models of forced induction systems, including turbocharging
and roots/centrifugal supercharging. Set maximum boost, belt ratios, efficiencies,
and more! Even model intercoolers.
Test engine power with alternate fuels, including Methanol, Ethanol, Propane,
6—Dyno2000 Advanced Engine Simulation
Page 7
Introduction To The Dyno2000
LNG, and even Nitrous Oxide injection. Graph cylinder pressures, frictional losses,
and other engine variables.
And the Dyno2000 is the only engine simulation with exclusive
ing™
that analyzes thousands of dyno tests, keep track of all the results, and
displays the best setup for virtually any application, all automatically! Combine this
power with uniquely versatile graphing capabilities, and the Dyno2000 is, simply, the
best engine simulation you can buy. In fact, you will find no other software, even at
many times the price, that offers so much capability and performance.
DYNO2000 REQUIREMENTS
The following list presents an overview of the basic hardware and software
required to run the Dyno2000.
Minimum Requirements Overview:
• An IBM compatible “PC” computer with a CD-ROM drive
• At least 16MB of RAM (random access memory) for Windows95/98; 32MB for
WindowsNT; 64MB for Windows2000
• Windows95/98 or Windows NT/2000 (recommend NT version 4.0 with SP4 or
later)
• A video system capable of at least VGA (640 x 480 resolution). Recommend
800 x 600 or higher to optimize screen display and engine analysis
• A Pentium 200 or similar processor (Pentium II or III or faster processors will
improve processing speeds; especially helpful for Iterative analysis)
• A mouse
• A printer (needed to obtain dyno-test printouts).
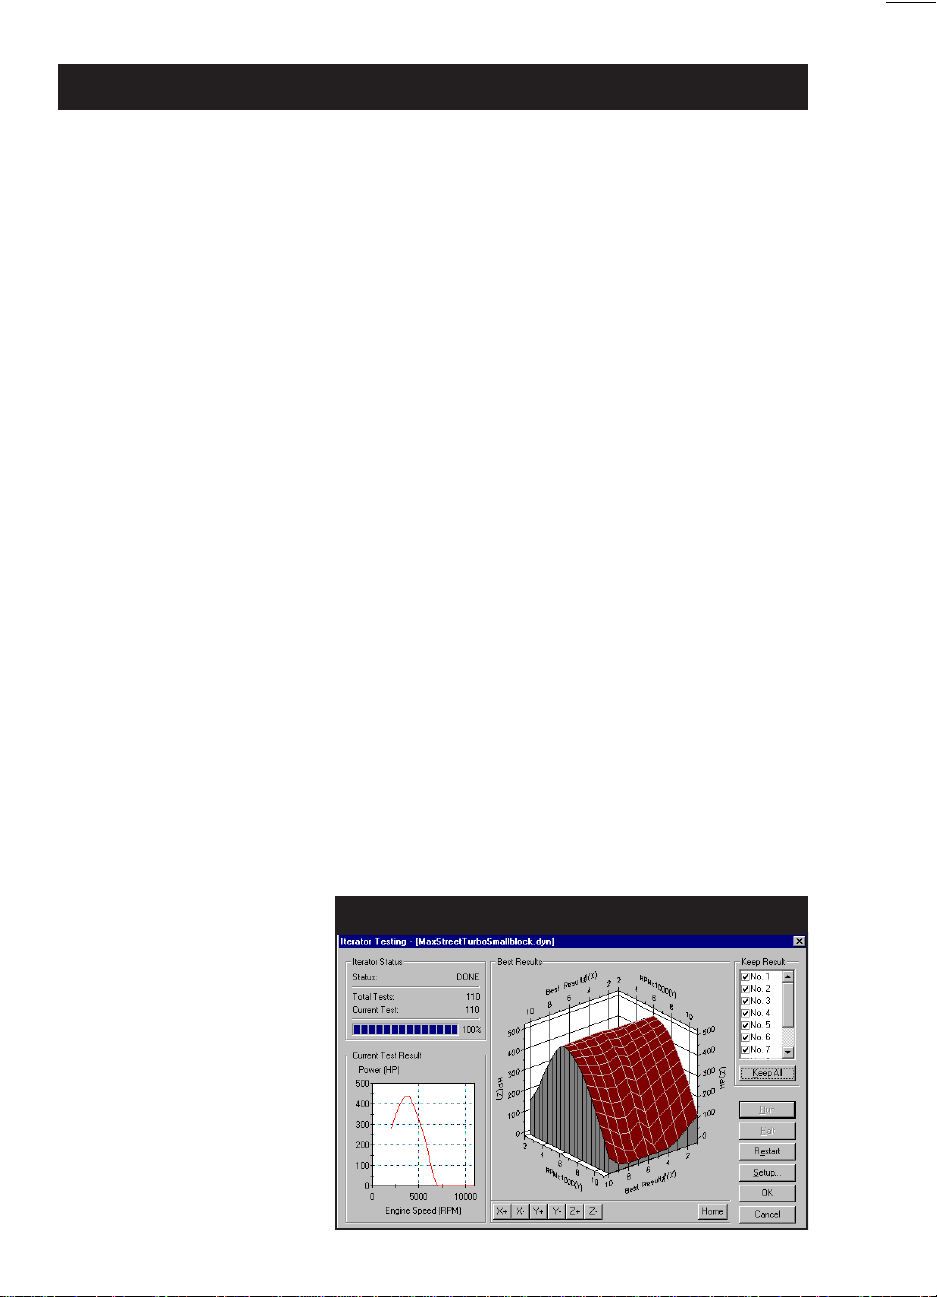
Iterative Test-
Iterative Testing™ is a
powerful feature of the
Dyno2000. This screen
illustrates a test that just
evaluated a series of compo-
nents (over 100 dyno tests
were performed). Using this
powerful tool it is possible to
automatically run thousands
or even hundreds of thou-
sands of tests to find the
best combinations. The
Dyno2000 keeps track of all
the results and displays the
best matches to your test
criterion.
Dyno2000
Iterative Testing
Dyno2000 Advanced Engine Simulation—7
™
Screen
Page 8

Introduction To The Dyno2000
REQUIREMENTS IN DETAIL
Computer: An IBM-compatible “PC” computer with a CD-ROM disk drive is re-
quired. The Dyno2000 will operate on any computer system with an Intel-compatible
processor, however, a Pentium-class microprocessor is recommended to minimize
calculation times (Pentium II or III 400+Mhz processors will improve processing
speeds; especially helpful for
dyno tests can be performed in a continuous series).
Windows95/98 and NT/2000: The Dyno2000 is a full 32-bit program designed for
Windows95, Windows98 and later versions of Windows using the Win95 kernel. The
Dyno2000 is also compatible with WindowsNT versions 3.51 or later and Windows2000
(Motion recommends that if you use WindowsNT, use version 4.0 with service pack
4 or later; and if you use Windows2000, make sure to install the latest service pack
for both Windows2000 and for Internet Explorer).
System Memory: Your system should have a minimum of 16Mbytes of physical
RAM memory for Windows95/98, 32Mbytes for WindowsNT, and 64Mbytes for Windows2000. The Dyno2000 may not operate on systems with less installed memory.
To optimize Windows and Dyno2000 performance, 64Mbytes or more is recommended.
Iterative
analysis where hundreds or thousands of
Video Graphics Card And Monitor: Virtually any Windows compatible monitor and
display card will work with the Dyno2000. Systems with SVGA or better graphics
(800 x 600 resolution or higher) provide more screen “real estate.” This additional
display space is very helpful in component selection and power-curve analysis.
Note1: See FAQ on page 100 for help in changing the screen resolution of your
monitor.
Note2: Specialized graphics cards and ultra-high resolution “workstation” displays
may not be compatible with Dyno2000. If you encounter display incompatibilities with
the Dyno2000, please contact Motion Software Tech Support, 535 West Lambert,
Bldg. E, Brea, CA 92821-3911, 714-255-2931, or visit our website:
www.motionsoftware.com.
System Processor: The Dyno2000 is extremely calculation-intensive. Over 25 mil-
lion mathematical operations are performed for each complete power-curve simulation. While the program has been written in fast C++ and hand-tuned assembler to
optimize speed, a faster processor will improve data analysis capabilities. Furthermore, the Dyno2000 incorporates a powerful
analysis of hundreds of thousands of dyno tests. To reduce these calculation times
and extend the modeling capabilities of the program, use the fastest processor
possible.
The following table gives an approximation of the time required to complete a
Iterative Tester
that can perform an
8—Dyno2000 Advanced Engine Simulation
Page 9

Introduction To The Dyno2000
100 dyno-run
tests can consist of hundreds of thousands of simulated dyno runs or more):
Computer Coprocessor Calc. Time For 100-Test Run
Pentium 400Mhz Built-In 17 Seconds
Pentium 200Mhz Built-In 75 Seconds
Pentium 133Mhz Built-In 112 Seconds
Pentium 60Mhz Built-In 4.3 Minutes
80486DX 33Mhz Built-In 13.5 Minutes
80386DX 25Mhz Yes (added) 49 Minutes
80486SX 25Mhz No 6.4 Hours
80386DX 33Mhz No 9.4 Hours
80286 at 10Mhz No 24 Hours
8088 at 8Mhz Yes (added) 3.2 Hours
Mouse: A mouse (trackball, or other pointer control) is required to use the Dyno2000.
While most component selections can be performed with the keyboard, several
operations within the Dyno2000 require the use of a mouse.
Printer: The Dyno2000 can print a comprehensive “dyno-test report” of a simulated
dyno run with any Windows-compatible printer. If you use a color printer, the data
curves and selected information will print in color (see page 81 for more information
about Dyno2000 printing).
Iterative
test on various PC systems (this is a very short run;
Iterative
Dyno2000 Advanced Engine Simulation—9
Page 10
INSTALLATION
INSTALLATION
Helpful Installation Tips
Dyno2000 installation is a quick and easy on virtually all computers. To minimize
the likelihood of problems, review the following tips before you begin:
1) The Dyno2000 requires Windows 95/98® or Windows NT/2000® and at least
16MB of installed memory (see pages 7-8 for more information about system
requirements).
2) The entire installation of the Dyno2000 and DeskTop Videos requires 110MB of
free disk space. If you do not wish to install the Software Videos, select the
“Compact” option presented during the installation process.
3) If at all possible, install the software onto the (default) drive and directory sug-
gested by the SETUP program. This will speed the process of installing Dyno2000
software updates in the future.
Installing The Dyno2000
The installation programs included with the Dyno2000 will copy the appropriate
files to your hard drive. Please read and perform each of the following instructions
carefully.
1) Start Windows95/98 (or Windows NT/2000), if necessary.
2) Insert the Dyno2000 CD-ROM into your CD drive.
3) An installation Welcome screen will appear on your desktop within 5 to 30
seconds (depending on the speed of your CD drive). Proceed to step 5.
4) If the Dyno2000 installation Welcome screen does not automatically display on
your desktop after 30 to 60 seconds, run the Setup program included on the
Dyno2000 CD-ROM. (Open the
then double click on Setup. Alternatively, choose Settings from the Start menu,
10—Dyno2000 Advanced Engine Simulation
Windows Explorer
, switch to your CD Drive,
Page 11

Installing & Starting The Dyno2000
select Control Panels, the double click on Add/Remove Programs, finally click
on Install.)
5) Click Next to proceed to the second Installation screen. Click Next again to
review the Motion Software License Agreement. Read the Agreement and if you
agree with the terms, click Next to continue with the installation.
6) Enter your name and company name in the User Information screen (only
enter your company name if the Dyno2000 is being registered to your company). Click Next again to continue the installation.
7) The Choose Destination Location window will suggest C:\Dyno2000 as the
installation path. We recommend that you accept this default. However, if you
prefer another location for the Dyno2000, click on Browse... to select a new
path. When you are finished, click on Next to continue the installation.
8) The Setup Type window will present three installation options:
Typical—Installs Dyno2000, sample files, user manual, and software videos.
Compact—Installs Dyno2000, sample files, and user manual only.
Custom—Allows you to select the installed elements.
We recommend you select Typical, then press Next to continue the installation.
9) The Select Program Folder screen indicates that the Dyno2000 program folder
will be added to the list of Windows Program choices displayed on the Start,
Programs menu. You may change the name of the program folder. Press Next
to continue.
10) The Start Copying Files screen gives you a chance to review all the installation
choices that you’ve made. Press Back to make any changes; press Next to
being copying files to your system.
11) When main installation is complete, the Setup Complete screen provides a
checkbox option (defaults unchecked) that allows you to start the Dyno2000
immediately after installation. (Note: If you do not check this box and click
Finish, you can start the Dyno2000 at any time by selecting Programs, Dyno2000
Engine Simulation from your Windows Start menu.) Click Finish to complete
the installation.
Starting The Dyno 2000
12) To start the Dyno2000, open the Windows Start menu, select Programs, then
choose Dyno2000 Engine Simulation, and finally click on the Dyno2000 En-
gine Simulation icon that opens from the folder.
Dyno2000 Advanced Engine Simulation—11
Page 12

Installing & Starting The Dyno2000
13) A video of the new DeskTop DragStrip2000, has been included with the
Dyno2000. Start the demo by opening the Start menu, select Programs, then
choose the Dyno2000 Engine Simulation folder, finally click on DragStrip2000
Demo NEW.
14) You can also access considerable additional information on the DeskTop soft-
ware line and technical support by opening the Start menu, select Programs,
then choose the Dyno2000 Engine Simulation folder, finally click on DeskTop
Software Info.
15) Please review the remainder of this user guide for more information on menu
selections, program functions, and simulation tips.
16) If you have installation problems with the Dyno2000, please review program
requirements on pages 7-9, and take a few minutes and look over the following
sources of information before you contact technical support:
• The FAQs starting on page 100 in this booklet contain detail installation and
operational questions and answers.
• Visit the Tech Support section of the Motion Software website for additional tips
and FAQs.
If you cannot find a solution to your problem, use the fax-back form in this manual.
Fax or mail the completed form to:
Motion Software, Inc.
535 West Lambert, Bldg. E
Brea, CA 92821-3911
Tech Fax: 714-255-7956, or visit our
Web: www.motionsoftware.com
Email: support@motionsoftware.com
Note: Tech support will only be provided to registered users. Please send in your
registration card today. You may also register your software on-line at:
www.motionsoftware.com. If you purchased your software directly from Motion Soft-
ware, Inc., you are already registered.
12—Dyno2000 Advanced Engine Simulation
Page 13
OVERVIEW
OVERVIEW
Program
Menu
Bar
Engine
Component
Categories
And
Status Boxes
Engine
Selection
Tabs
Title Bar
Left Pane
Display T abs
THE MAIN PROGRAM SCREEN
Drop-Down
Menu
Right Pane Display Tabs
Range Limits
And Status Box
Vertical Divider To
Resize Left/Right Panes
Windows
Size
Buttons
Power
Curves For
Current
Engine
Comparison
Curves
The Main Program Screen allows you to select engine components, dimen-
sions, and specifications. In addition, engine power curves and/or simulation data is
displayed in graphical and chart form. The Main Program Screen is composed of the
following elements:
1) The Title Bar displays the program name followed by the name of the currently-
selected engine.
2) The Program Menu Bar contains eight pull-down menus that control overall
program function. Here is an overview of these control menus, from left to right
Dyno2000 Advanced Engine Simulation—13
Page 14
Program Overview
Program Menu Bar
Program Menu Bar contains eight pulldown menus that control overall program
function.
(detailed information on menu functions is provided in the next section, beginning on page 20):
File—Opens and Saves dyno test files, exports DOS Dyno files to other
DeskTop software, prints engine components and power curves, allows the
quick selection of the most recently used Dyno files, and contains an exitprogram function.
Edit—Clears all component choices from the currently-selected engine (indi-
cated by the
Engine Selection Tab
currently in the foreground; see Engine
Selection Tabs, below).
View—Allows you to turn the Toolbar, Status Bar and Workbook layout on
(default) or off.
Simulation—Run forces an update of the current simulation. Auto Run
enables or disables (toggles) automatic simulation updates when any engine
component is modified.
Units—Selects between US and Metric units.
Tools—Opens the
Iterative Testing
window or selects one of the build-in,
engine-math calculators.
Window—A standard Windows menu for arranging and selecting engine
display windows.
Help—Gives access to this Users Guide, and other program help features.
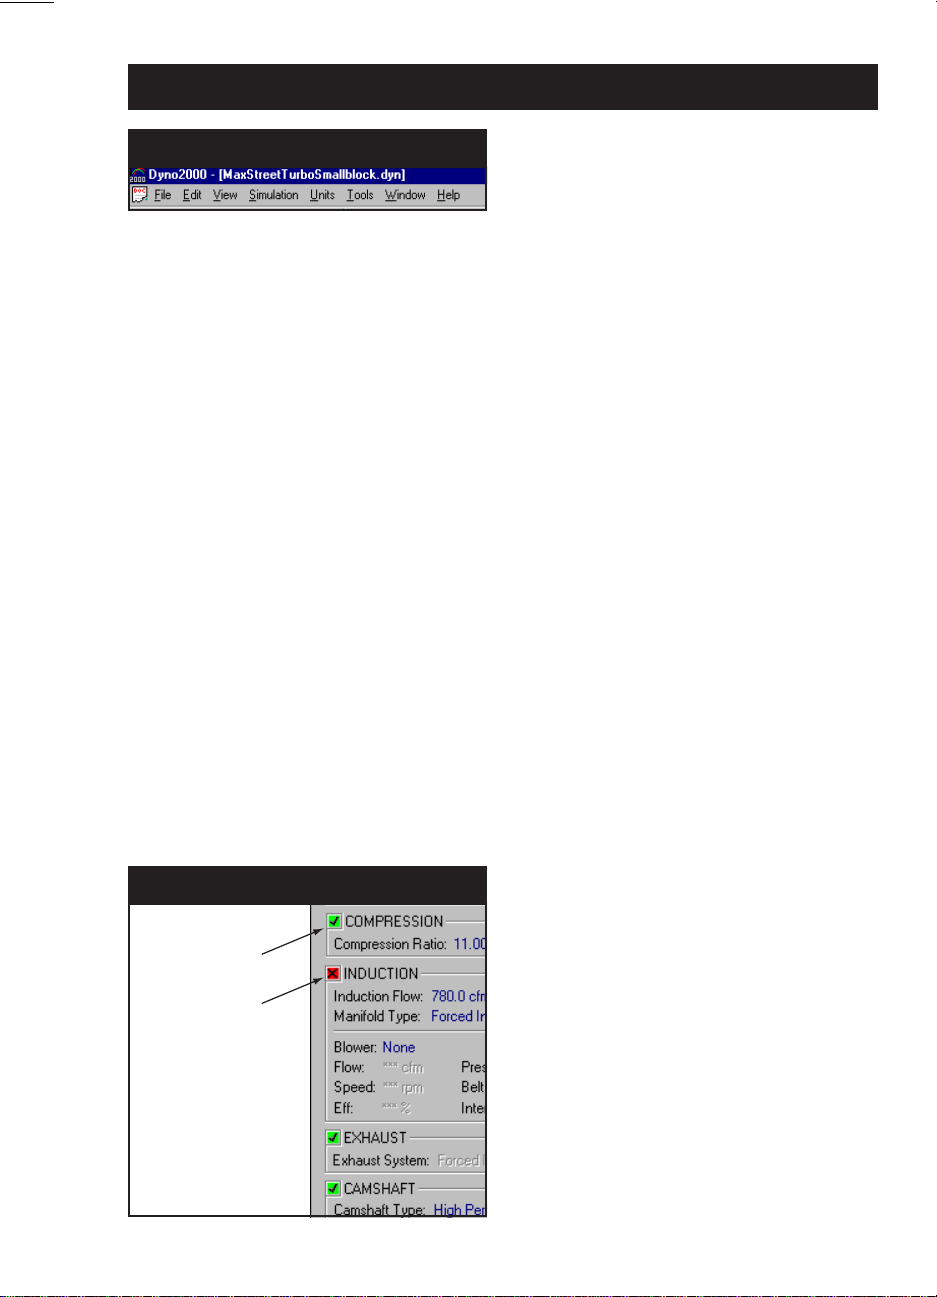
3) The Engine Component Categories are made up of the following groups:
Component Status Boxes
All Components
Selected
Category
Incomplete
A Status Box is located in the upper left
corner of each Component Category.
These boxes either contain a red boxed
X, indicating that the category is not
complete (inhibiting a simulation run), or
a green-boxed check-mark ✔, indicating
that all components in that category
have been selected
14—Dyno2000 Advanced Engine Simulation
Page 15

Program Overview
SHORTBLOCK—Select the bore, stroke, and number of cylinders in this
category (see page 20).
CYLINDER HEADS—Select the cylinder head type, port configuration, and
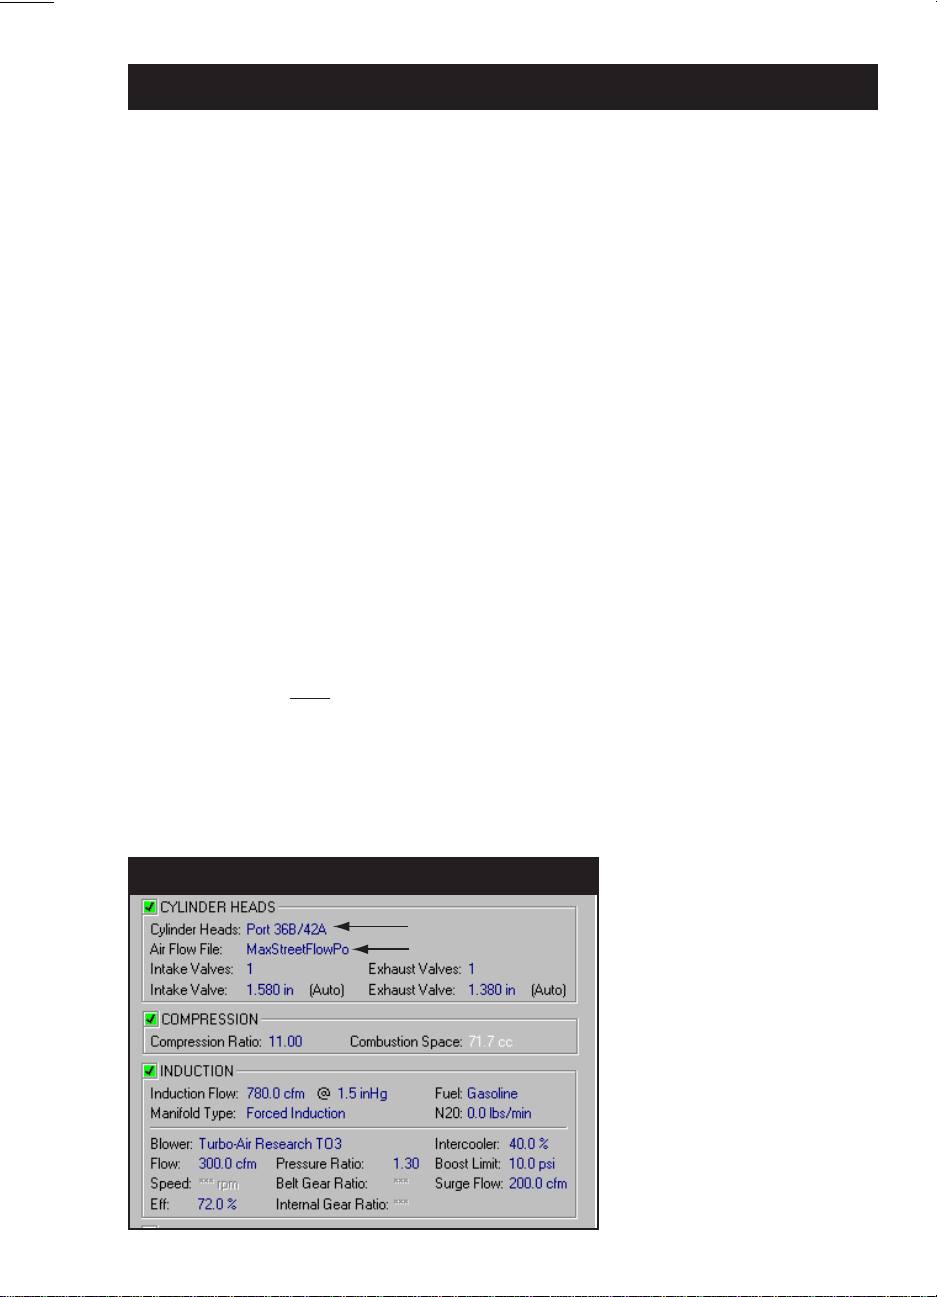
valve diameters. Direct entry of flow-bench data is also supported (see page
22).
COMPRESSION—Select the compression ratio (see page 30).
INDUCTION—Selects the airflow rate through the induction system, the
type of fuel, nitrous flow rate, intake manifold, and a forced induction system
(see page 38).
EXHAUST—Selects the exhaust-system configuration (see page 59).
CAMSHAFT—Selects the camshaft type, lifter type, and allows direct entry
of valve timing and lift data (see page 65).
Note: Each component category contains a Status Box located in the upper left
corner. These boxes either contain a red boxed X, indicating that the category is
not complete (inhibiting a simulation run), or a green-boxed check-mark ✔,
indicating that all components in that category have been selected. When all
component categories have green checks, a simulation will be performed using
the current data values and the results will be displayed in the graph on the right
pane of the Main Program Screen (the simulation run and data plot will occur
automatically providing Autorun is checked in the Simulation drop-down menu
[default], see Simulation Menu described on the previous page).
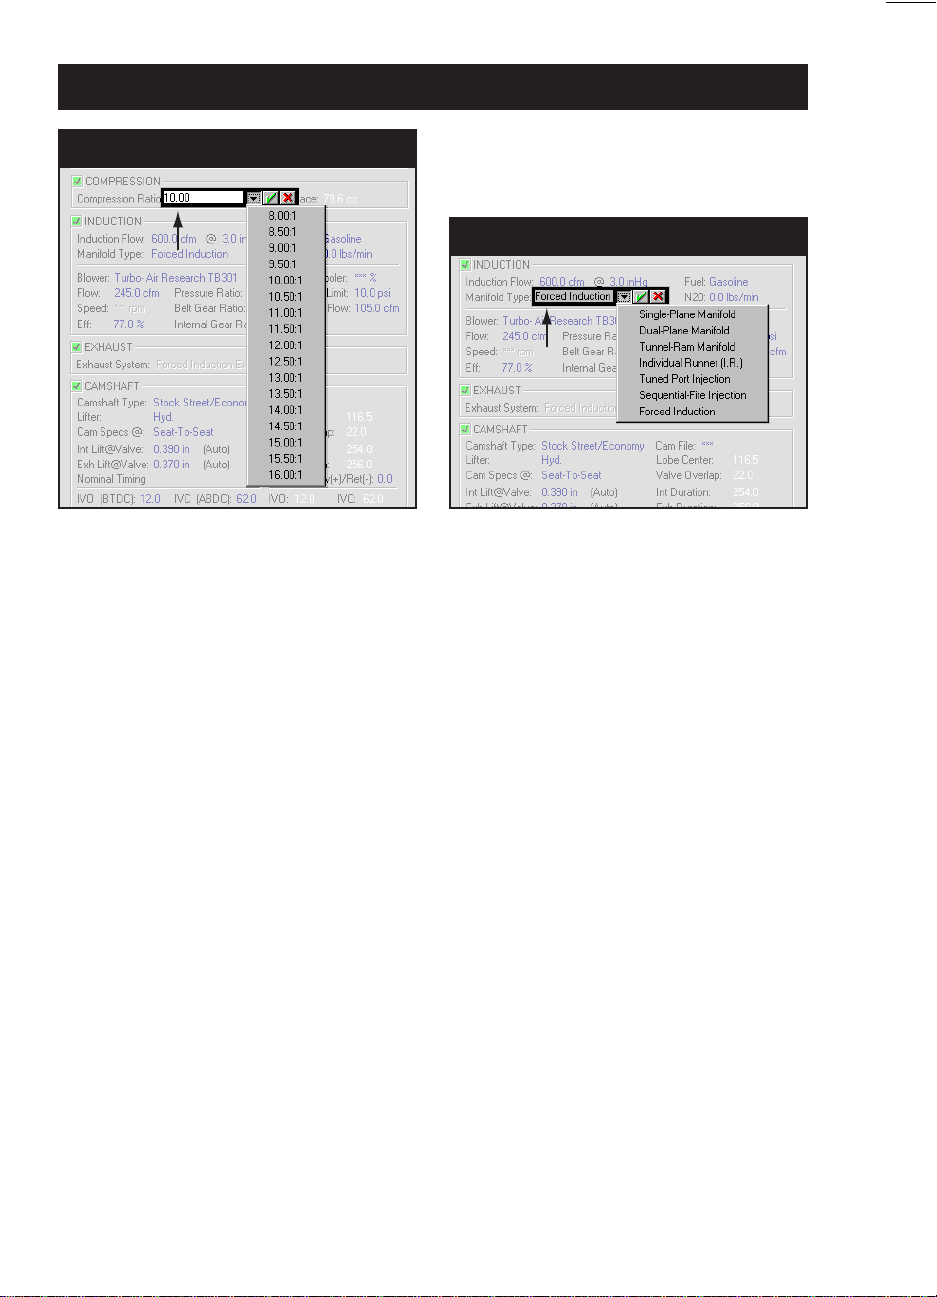
4) The Drop-Down Component Menus contain components and specifications for
each of the Component Category choices. Click on any component specification
to open its menu. The menu will close when a selection is complete. If you wish
to close the menu before making a new selection, click the red X next to the
drop-down box or press the Escape key until the menu closes.
Component fields that do not yet
contain valid entries are marked with a
series of asteristics. This indicates that
the field is empty and can accept data
input. Most numeric fields accept direct
keyboard entry or selections from
provided drop-down menus. Text
selection fields (like the Cylinder Head
choice menu) only accept selections
from the associated drop-down menu.
When a valid selection has been made,
it will replace the asteristics and be
displayed next to the field names.
Incomplete Component Fields
Empty Component
Fields
Dyno2000 Advanced Engine Simulation—15
Page 16

Program Overview
Direct-Click™ Component Menus
Bounding
The Direct-Click™ Component Menus
contain components and specifications
for each Component Category choice.
Click on any component specification to
open its menu. The menu will close
when a selection is complete (or accept
the current selection by clicking on the
green ✔). If you wish to close the menu
before making a new selection, click the
red X next to the drop-down box or
press the Escape key until the menu
closes.
Box
Accept
Current
Selection
5) Several Component Category menus allow direct numeric entry. During this
data entry, the range of acceptable values will be displayed in a Range Limit
Line within the Status Box at the bottom of the screen.
6) The Dyno2000 can simulate several engines at once. Switch between “active”
engines by selecting any Tab from the Engine Selection Tabs, just above the
Status Box (see photo, page 13). The currently-selected engine is indicated on
the foreground Tab. The name of the currently-selected engine is also displayed
in the Title Bar.
Close
Menu
7) The Main Program Screen window is divided into two panes (the width of these
panes is adjustable; drag the vertical screen divider to resize). Each pane contains a Screen Display Tab group. Use these tabs to switch the display in each
pane to component lists and other data displays.
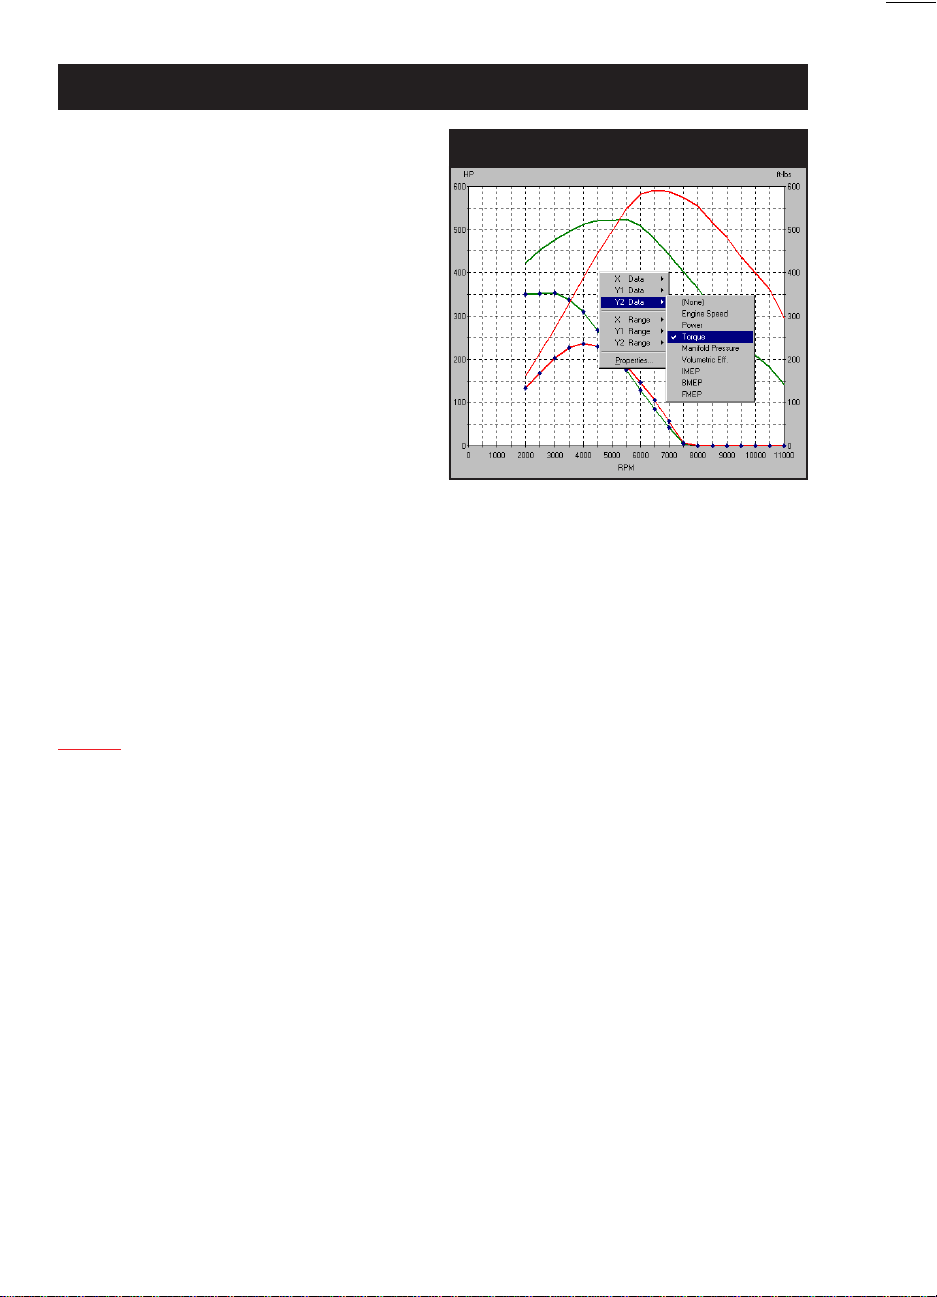
8) The Current Engine Power Curves window displays the horsepower and torque
for the currently-selected engine. Horsepower and torque are the default curves,
however, any graphic data display can be changed by right-clicking on the graph
and reassigning each curve in the Graph Options Box. Use Properties... in the
Options Box setup list to create comparisons between any “active” engines.
9) The Main Program Screen also incorporates Windows Size Buttons. These
buttons provide standard maximizing, minimizing, and closing functions common
to all windows. Refer to your Windows documentation for more information on
the use of these buttons.
16—Dyno2000 Advanced Engine Simulation
Page 17
Program Overview
The Right-Hand Power Curves Box
displays the horsepower and torque for
the currently-selected engine. Horse-
power and torque are the default curves,
however, the data displayed can be
modified by right-clicking on the graph
and reassigning each curve in the Graph
Options Box. In addition, you can use the
Properties... choice available at the
bottom of the Options Box to setup
comparisons between any “active”
engine. Note: A second, Left-Hand graph
is available under the component
selection screen (to activate this display,
use the Left-Pane tabs at the bottom of
the component screen).
Graph Options Box
USING THE MOUSE OR KEYBOARD
TO BUILD A TEST ENGINE
Begin using the Dyno2000 by “assembling” a test engine from component parts.
For example, select a bore and stroke by using the Block pull-down menu. Activate
the menu by:
Mouse
1) Start the Dyno2000 or select New from the File menu. All component categories
start off empty, indicated by strings of asterisks (****) next to each incomplete
selection.
2) Move the mouse cursor into the SHORTBLOCK category and double click the
left mouse button on the asterisks in the Block component category.
3) When the component-menu bounding box appears (see photo, page 16), click
on the ▼ symbol to open the Shortblock selection menu.
4) Move the mouse pointer through the menu choices.
5) When a submenu opens, move the mouse cursor over your selected choice in
the submenu.
6) Click the left mouse button on your selection. This loads the engine name, bore,
stroke, and number of cylinders into the SHORTBLOCK category. Note that the
red boxed X (Status Box) on the left of the SHORTBLOCK category changed to
a green-boxed check-mark ✔, indicating that all components in that category
Dyno2000 Advanced Engine Simulation—17
Page 18

Program Overview
have been selected.
7) Alternatively, to close the menu without making a selection, click the red X on
the right of the bounding box or press the Escape key until the menu closes.
8) Continue making component selections until all the category Status Boxes have
switched to green. At this point an engine simulation will be performed and the
results will be displayed on the graph or chart on the right of the Main Program
Screen.
Keyboard
1) Press and release the Alt key followed by the F key to highlight and open the
File menu. Use the cursor-arrow keys to select New, then press Enter to create
a new, blank component screen. All component categories start off empty, indicated by strings of asterisks (****) next to each incomplete component selection.
Note: You can activate other menu choices—e.g.,
by pressing the Right-Arrow or Left-Arrow keys or by using the menu shortcuts
(e.g., open the
2) A component menu bounding box is positioned around the Block choice in the
SHORTBLOCK category.
Edit
menu by pressing Alt E).
Edit, View, Simulation
, etc.,
3) Press Enter to activate the box. Then press Tab to move the highlight (focus) to
the ▼ symbol. Then press the Spacebar to open the Block selection menu.
4) Use the Up-Arrow or Down-Arrow keys to scroll through the menu choices.
When the menu selections include submenus (a small arrow points to the right
at the end of the menu line), use the Right-Arrow key to open the submenu.
5) When you have highlighted your choice, press Enter to make the selection.
This loads the engine name, bore, stroke, and number of cylinders into the
SHORTBLOCK category. Note that the red boxed X (Status Box) on the left of
the SHORTBLOCK category changed to a green-boxed check-mark ✔, indicating that all components in that category have been selected.
Note: Alternatively, to close the menus without making a selection, press the
Escape key.
6) Use the TAB key to move the component-selection bounding box to the next
blank field (Compression Ratio). Continue making component selections until all
the main component category Status Boxes have changed to green. At this point
an engine simulation will be performed and the results will be displayed on the
graph or chart in the right pane of the Main Program Screen.
Note: The Shift Tab key combination will move the bounding box backwards to
the previous component field.
18—Dyno2000 Advanced Engine Simulation
Page 19
Program Overview
Fields Accepting Direct Input
Fields Not Accepting Direct Input
White Background:
Numeric input
accepted. Enter
value or make
selection from
drop-down menu.
DIRECT-ENTRY MENU CHOICES
The Bore, Stroke, Number Of Cylinders, Valve Size, Compression Ratio, Induction Airflow, and several other menus permit direct numeric entry. When a component field supports direct entry, the bounding box will have a white interior. If the only
entry possible is a choice from the drop-down menu, the bounding box will have a
gray interior (see above photos). Choosing a new numeric value will replace the
currently displayed value. When you press Enter the new value will be tested for
acceptability, and if it passes, it will be used in the next simulation run. If you press
Enter without entering a new value, the currently displayed value is left unchanged.
Data entry into any field in the component-selection screen is limited to values
over which the Dyno2000 can accurately predict power. The range limits are displayed in the Range Limit Line within the Status Box at the bottom-left of the Main
Program Screen. If you enter an invalid number, the Dyno2000 will play the Windows error sound and wait for new input.
Gray Background:
No numeric input
accepted. Make
selection from
drop-down menu.
THE MEANING OF SCREEN COLORS
The colors used on the component-selection screen provide information about
various engine components and specifications. Here is a quick reference to screen
color functionality:
White Numeric Values: White engine specifications indicate that they are automati-
cally calculated by program and cannot be directly altered.
Dark Blue: All engine specifications that can be changed by the user through pull-
down menus are displayed in dark blue.
Dyno2000 Advanced Engine Simulation—19
Page 20
COMPONENT MENUS
COMPONENT MENUS
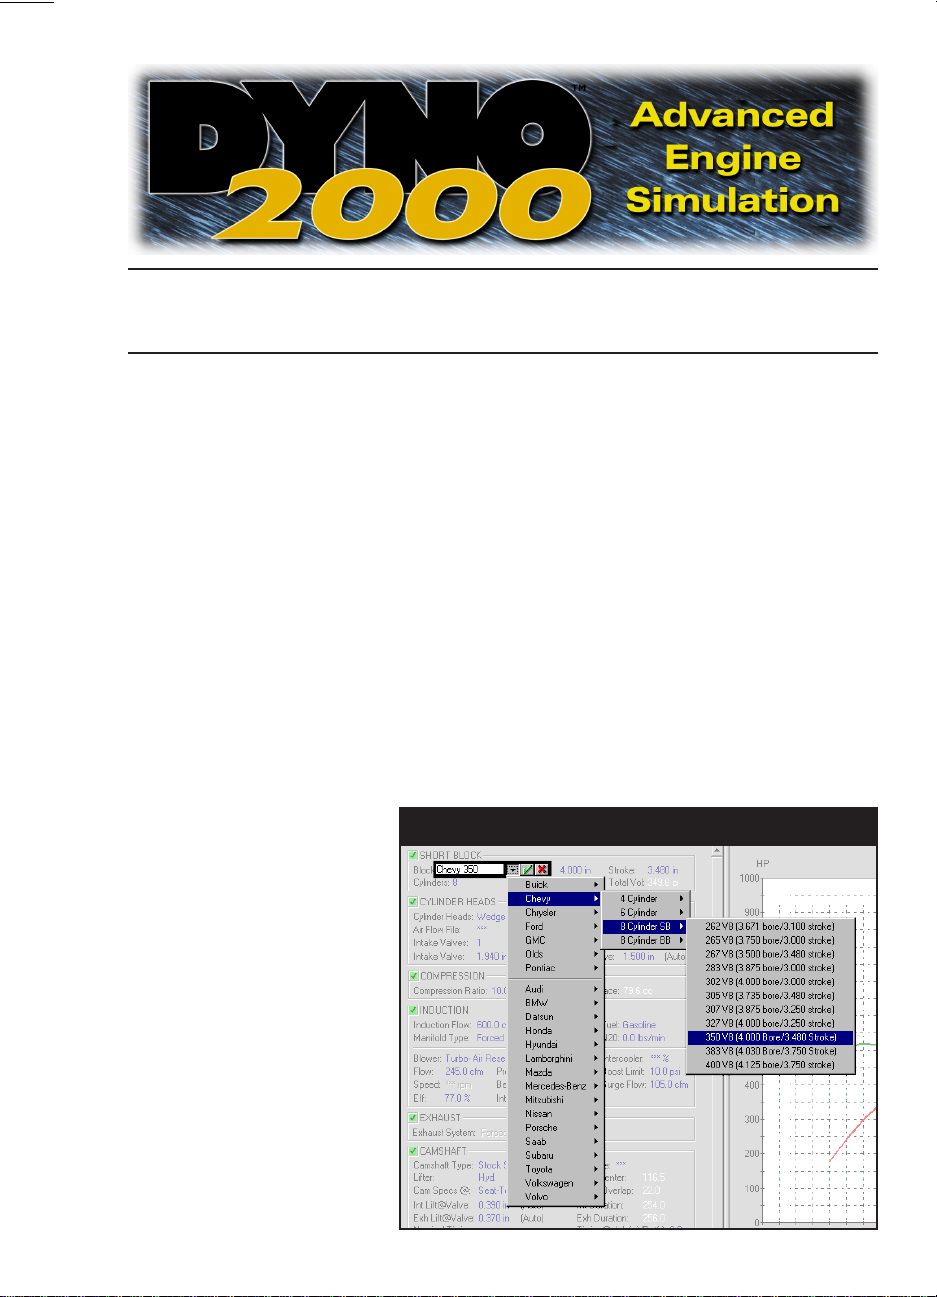
THE BORE, STROKE, AND NUMBER-OF-CYLINDER MENUS
The Block menu is located on the upper-left of the SHORTBLOCK component
category on the Main Program Screen. By opening this menu, you are presented
with a variety of domestic and import “pre-defined” engine shortblock configurations.
If any one of these choices is selected, the appropriate bore, stroke, and number of
cylinders will be loaded in the SHORTBLOCK category. In addition to selecting any
predefined engine configuration, you can directly enter any Block name, Stroke,
Bore, and Number Of Cylinder numeric values (within the acceptable range limits
of the program indicated at the bottom of the screen in the Status Bar).
What’s A SHORTBLOCK
When a particular engine combination is selected from the Block menu, the bore,
stroke, and the number of cylinders are “loaded” into the SHORTBLOCK category.
These values are subsequently used in the simulation. The SHORTBLOCK menu
The Block component menu
contains over 200 bore and
stroke combinations of
popular domestic and import
engines that you can in-
stantly use in a simulation.
20—Dyno2000 Advanced Engine Simulation
Block Component Menu
Page 21

Block, Bore, and Stroke Menus
choices should be considered a “handy” list of common engine cylinder-bore and
crankshaft-stroke values, not a description of engine configurations (e.g., V8, V6,
straight 6, V4, etc.), material composition (aluminum vs. cast iron), the type of
cylinder heads (hemi vs. wedge) or any other engine characteristics. The Bore/
Stroke menu only loads Bore, Stroke, and the Number Of Cylinders into the
program database.
Bore And Stroke And Its Effects On Compression Ratio
After making a Bore, Stroke, and Number-Of-Cylinder selection, the swept cylinder volume and the total engine displacement will be calculated and displayed in the
SHORTBLOCK component category. The swept cylinder volume measures the volume displaced by the movement of a single piston from TDC (top dead center) to
BDC (bottom dead center). This “full-stroke” volume is one of the two essential
values required in calculating compression ratio. We’ll discuss compression ratio in
more detail later, but for now let’s take a quick look at how compression ratio is
calculated:
Swept Cyl Vol + Combustion Space Vol
Compression Ratio = ———————————————————
Combustion Space Vol
The total volume that exists in the cylinder when the piston is located at BDC (this
volume includes the Swept Volume of the piston plus the Combustion Space Volume) is divided by the remaining volume that exists when the piston is positioned
at Top Dead Center.
Bore and stroke dimensions greatly affect cylinder volumes and, therefore, compression ratio. When the stroke, and to a lessor degree the bore, is increased while
maintaining a fixed combustion-space volume, the compression ratio will rapidly
increase. And, as is the case in the Dyno2000 simulation, if the compression ratio
is held constant—because it is a fixed component selected by you—the combustion
space volume (not necessarily the same as the combustion-chamber volume, see
page 31) must increase to maintain the desired compression ratio.
This may seem more understandable when you consider that if the combustionspace volume did not increase, a larger swept cylinder volume (due to the increase
in engine displacement) would be compressed into the same final combustion space,
resulting in an increase in compression ratio.
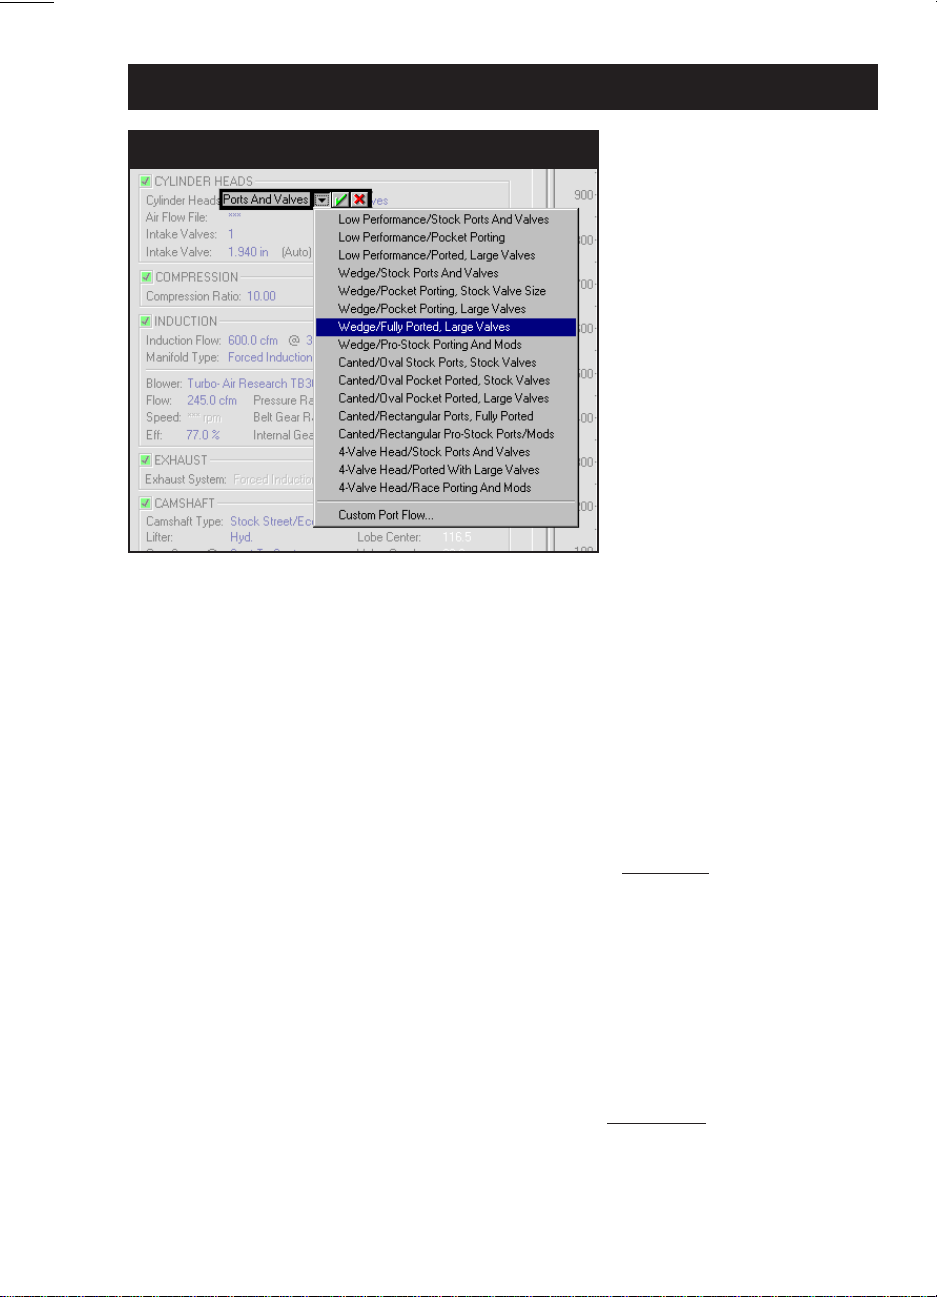
THE CYLINDER HEAD AND VALVE DIAMETER MENUS
The Cylinder Head pull-down menu is located in the CYLINDER HEAD category,
and selection from this menu allows the Dyno2000 to simulate various cylinder head
designs and a wide range of airflow characteristics. The menu lists general cylinder
head characteristics, including restrictive low-performance ports, typical wedge- and
Dyno2000 Advanced Engine Simulation—21
Page 22
Cylinder Head Menu
Cylinder Head Menu
The Cylinder Head menu
contains a wide range of
head/port choices, from stock
to all-out racing. In addition,
Custom Port Flow allows the
direct entry of flow bench
data. This feature allows the
simulation and testing of any
cylinder head for which flow
data is available.
canted-valve configurations, and 4-valve cylinder heads. Each type of head/port
includes several stages of modifications from stock to all-out race configurations.
In addition, the Custom Port Flow choice at the bottom of the Cylinder Head
menu allows the direct entry of flowbench data, allowing the Dyno2000 to model any
cylinder head for which flow data is available. This option will be described in more
detail later.
Basic Flow Theory
A selection from the Cylinder Head menu is the first part of a two-step process
used by the simulation to accurately model cylinder head flow characteristics. The
initial cylinder head selection determines the airflow restriction generated by the
ports. That is, this choice establishes
mum peak flow will pass through each port
selected from the remaining CYLINDER HEAD category menus: Intake and Exhaust Valve Diameter Menus. The valve-diameter menus allow the selection of
valve sizes that fix the theoretical peak flow (called
Most cylinder heads flow only about 50% to 70% of this value.
Note: You can enable the Auto Calculate Valve Size feature to allow the Dyno2000
to automatically determine valve diameters based on bore size and the degree of
cylinder head porting/modifications. The various Cylinder Head menu choices load
airflow data into the simulation, but this flow data is not directly used to determine
the airflow capacity of the cylinder heads.
There are several reasons for this. First of all, flow generated in the ports of a
running engine is vastly different than the flow measured on a flow bench. Airflow
on a flow bench is steady-state flow, measured at a fixed pressure drop (it’s also dry
how much less air than the theoretical maxi-
. What determines peak flow? That’s
isentropic
flow) of each port.
22—Dyno2000 Advanced Engine Simulation
Page 23
Cylinder Head Menu
flow, but a discussion of that feature is beyond the scope of this book). A running
engine will generate rapidly and widely varying pressures in the ports. These pressure differences directly affect—in fact, they directly cause—the flow of fuel, air, and
exhaust gasses within the engine. The Dyno2000 calculates these internal pressures
at each degree of crank rotation throughout the four-cycle process. To determine
mass flow into and out of the cylinders at any instant, the flow that occurs as a result
of these changing pressure differences is also calculated. Since the variations in
pressure, or pressure drops, within the engine are almost always different than the
pressure drop used on a flow bench, flow bench data cannot directly predict flow
within the engine.
While it is impractical to use cylinder head flow data directly in an engine simulation, measured cylinder head flow figures are, nonetheless, a good starting point.
Flow-bench data can be used as a means to compare the measured flow of a
particular port/valve configuration against the calculated isentropic (theoretical maximum) flow. The resulting “ratio,” called the discharge coefficient, has proven to be
an effective link between flow-bench data and predicted mass flow moving into and
out of the cylinders. Furthermore, the discharge coefficient also can be used to
predict the changes in flow for larger or smaller valves and for various levels of port
modifications. In other words, the discharge coefficient provides a practical method
to simulate mass flow within a large range of engines under a wide range of operational conditions.
Sorting Out Cylinder Head Menu Choices
Now that some of the basic flow theory behind the choices in the CYLINDER
HEAD category menus has been exposed, here’s some practical advice that may
Typical Low-Performance Cylinder Heads
The “Low Performance”
cylinder head choices are
intended to model cylinder
heads that have unusually
small ports and valves. Heads
of this type were often designed for low-speed,
economy applications, with
little concern for high-speed
performance. Early 260 and
289 smallblock Ford and to a
lessor degree early smallblock
Chevy castings fall into this
category.
Dyno2000 Advanced Engine Simulation—23
Page 24
Cylinder Head Menu
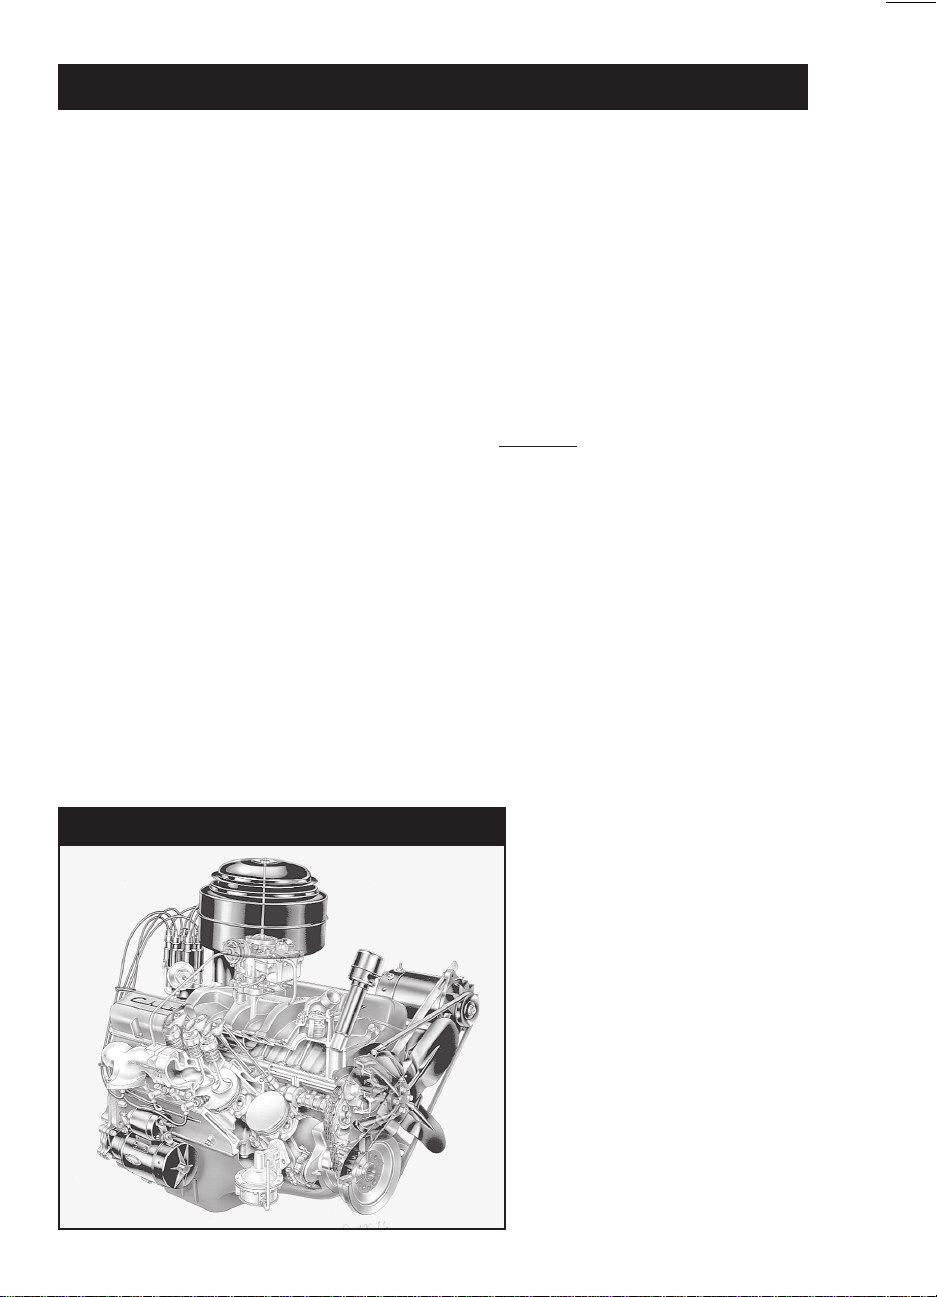
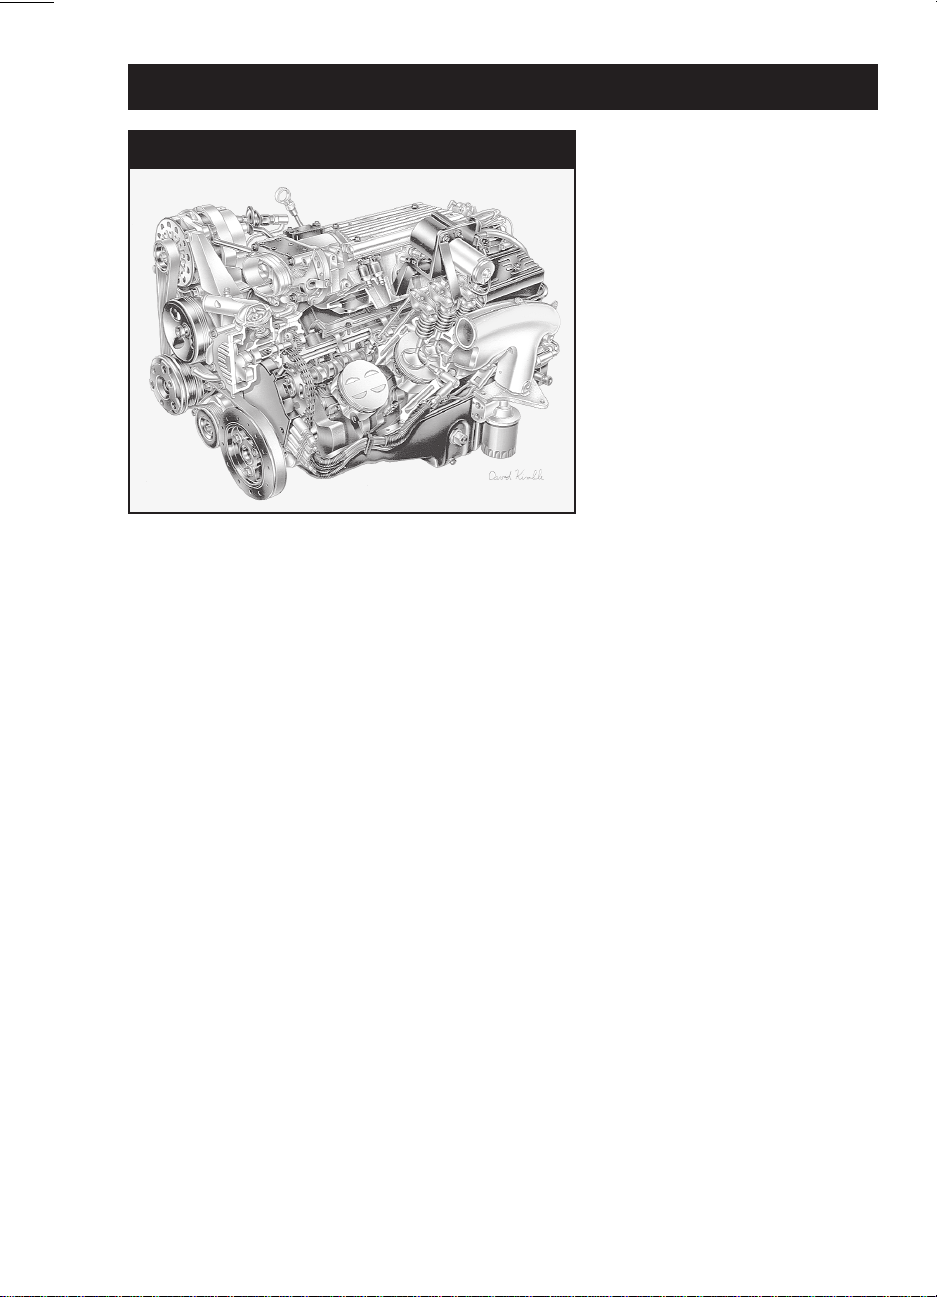
Typical Wedge Cylinder Heads
The “Wedge Cylinder head”
menu choices model cylinder
heads that have ports and
valves sized with performance
in mind, like the heads on this
LT1 smallblock Chevy.
help you determine the appropriate selections for your application.
Low Performance Cylinder Heads—There are three “Low Performance” cylinder
head selections listed at the top of the Cylinder Head menu. Each of these choices
is intended to model cylinder heads that have unusually small ports and valves
relative to engine displacement. Heads of this type were often designed for lowspeed, economy applications, with little concern for high-speed performance. Early
260 and 289 smallblock Ford and to a lessor degree early smallblock Chevy castings
fall into this category. These choices use the lowest discharge coefficient of all the
head configurations listed in the menu. Minimum port cross-sectional areas are 85%
of the valve areas or somewhat smaller and, if Auto Calculate Valve Size has been
selected, relatively small (compared to the bore diameter) intake and exhaust valve
diameters will be used.
The first low-performance choice models an unmodified production casting. The
second “Low Performance/Pocket Porting” choice adds minor porting work performed
below the valve seat and in the “bowl” area under the valve head. The port runners
are not modified. The final choice “Low Performance/Ported, Large Valves” incorporates the same modifications plus slightly larger intake and exhaust valves and some
modest work in the port runners. Auto-calculate valve size increases vary, but they
are always scaled to a size that will install in production castings without extensive
modifications.
The low-performance choices have some ability to model flathead (L-head & Hhead) and hybrid (F-head) engines. While the ports in these engines are even more
restrictive, by selecting Low-Performance and manually entering the exact valve
sizes, the simulation will, at least, give you an approximate power output usable to
evaluate changes in cam timing, induction flow, and other components.
24—Dyno2000 Advanced Engine Simulation
Page 25
Cylinder Head Menu
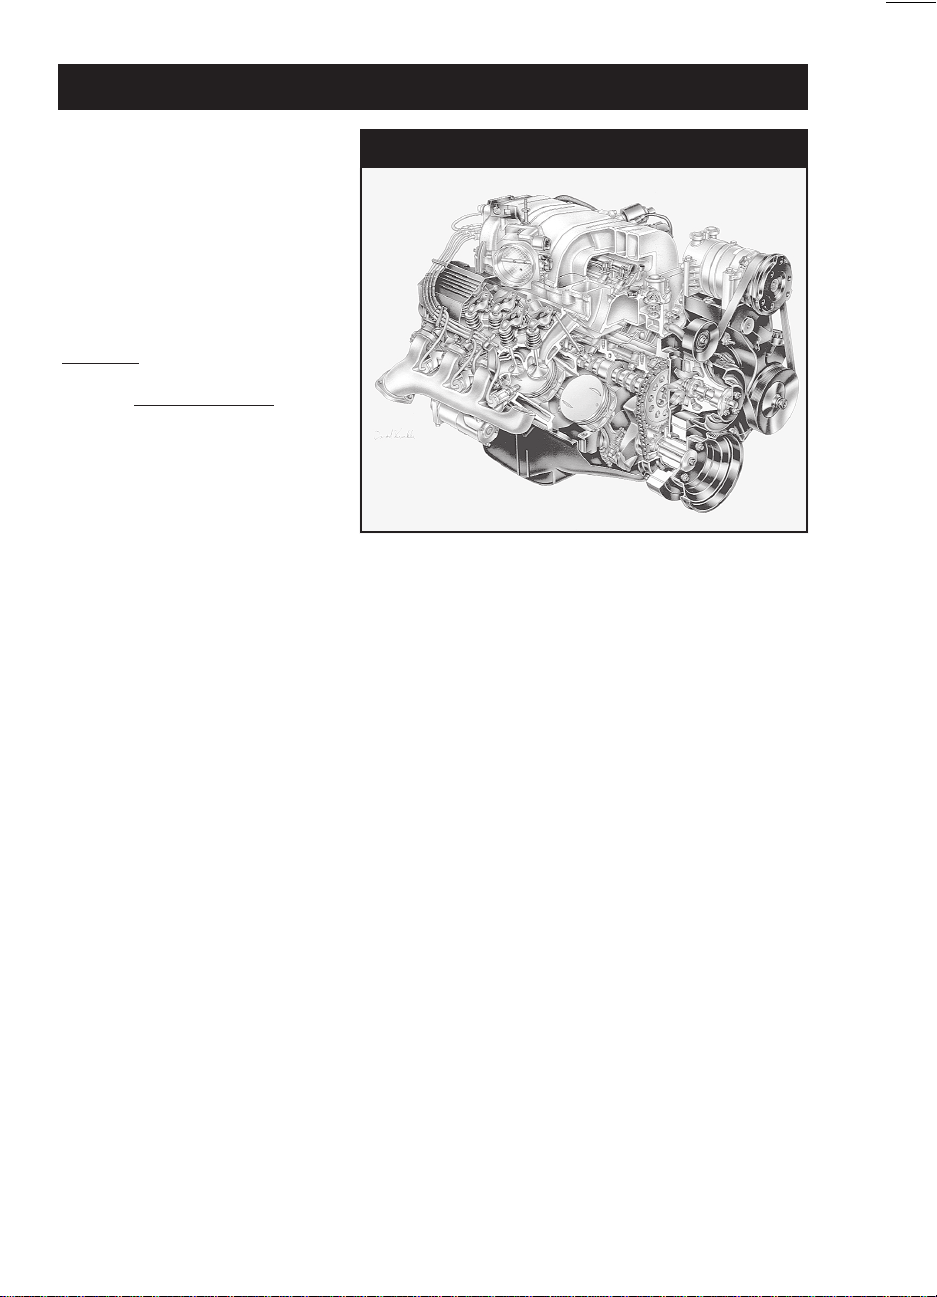
Typical Canted-Valve Cylinder Heads
The “Canted-Valve Cylinder
Head” selections have ports
with generous cross-sectional
areas and valves that angle
toward the port mouths. The
first three menu choices model
oval-port designs. The final two
selections simulate perfor-
mance
This L29 big-block Chevy would
be best modeled by the second
head with flow capacity beyond
the capabilities of L29 castings.
Wedge Cylinder Heads—The wedge-chamber and canted-valve choices comprise
the two main cylinder head categories. Choices from these two groups are applicable to 90% of all performance engine applications.
sized with performance in mind. Ports are not excessively restrictive for high-speed
operation, and overall port and valve-pocket design offers a good compromise between low restriction and high flow velocity. The stock and pocket-ported choices are
best for high-performance street to modest racing applications.
street applications. This casting has improved discharge coefficients, greater port
cross-sectional areas, and increased valve sizes. Consider this head to be an extensively modified, high-performance, factory-type casting that has additional modifications to provide optimum flow for racing applications. It does not incorporate
“exotic” modifications, like raised and/or welded ports that require custom-fabricated
manifolds.
selection is designed to model state-of-the-art, high-dollar, Pro-Stock drag-racing
cylinder heads. These custom pieces are designed for one thing: Maximum power.
They usually require hand-fabricated intake manifolds, have excellent valve discharge coefficients, and the ports have the largest cross-sectional areas in the
smallblock group. This head develops sufficient airflow speeds for good cylinder
filling only at high engine rpm.
rectangular-port heads.
or third menu choice—the
fourth menu choice models a
The first three basic wedge selections model heads that have ports and valves
The fourth wedge head “Wedge/Fully Ported, Large Valves” moves away from
The last choice in the wedge group is “Wedge/Pro-Stock Porting And Mods.” This
Canted-Valve Cylinder Heads—All canted-valve selections are modeled after heads
with “canted” valves. That is, the valve stems are tilted toward the outside of the
cylinder heads to improve the discharge coefficient and overall airflow. All ports have
Dyno2000 Advanced Engine Simulation—25
Page 26
Cylinder Head Menu
generous cross-sectional areas for excellent high-speed performance.
The first three choices are based on an oval-port configuration. These smaller
cross-sectional area ports provide a good compromise between low restriction and
high flow velocity for larger displacement engines. The stock and pocket-ported
choices are suitable for high-performance street to modest racing applications.
The final two selections simulate extensively modified rectangular-port heads.
These choices model, primarily, all-out, big-block heads, however, they closely model
other extremely aggressive high-performance racing designs, like the Chrysler Hemi
head and all-out ProStock designs. As with the smallblock category, the “Canted/
Rectangular Ports/Fully Ported” heads are not suitable for most street applications.
These castings have high discharge coefficients, large port cross-sectional areas,
and increased valve sizes. This head is basically a factory-type casting but extensively improved. However, it does not incorporate “exotic” modifications, like raised
and/or welded ports that require custom-fabricated manifolds.
The last choice in the canted-valve group is “Canted/Rectangular ProStock Ports/
Mods.” This selection is designed to model state-of-the-art, ProStock drag-racing
cylinder heads. These custom pieces, like their wedge-design counterparts, are built
from the ground-up for maximum power. They require hand-fabricated intake manifolds, have optimum valve discharge coefficients, and the ports have the largest
cross-sectional areas in the entire Cylinder Head menu, except for 4-valve heads
(discussed next). These specially fabricated cylinder heads only develop sufficient
airflow for good cylinder filling with large displacement engines at very high engine
speeds.
4-Valve Cylinder Heads—The next three selections in the Cylinder Head submenu
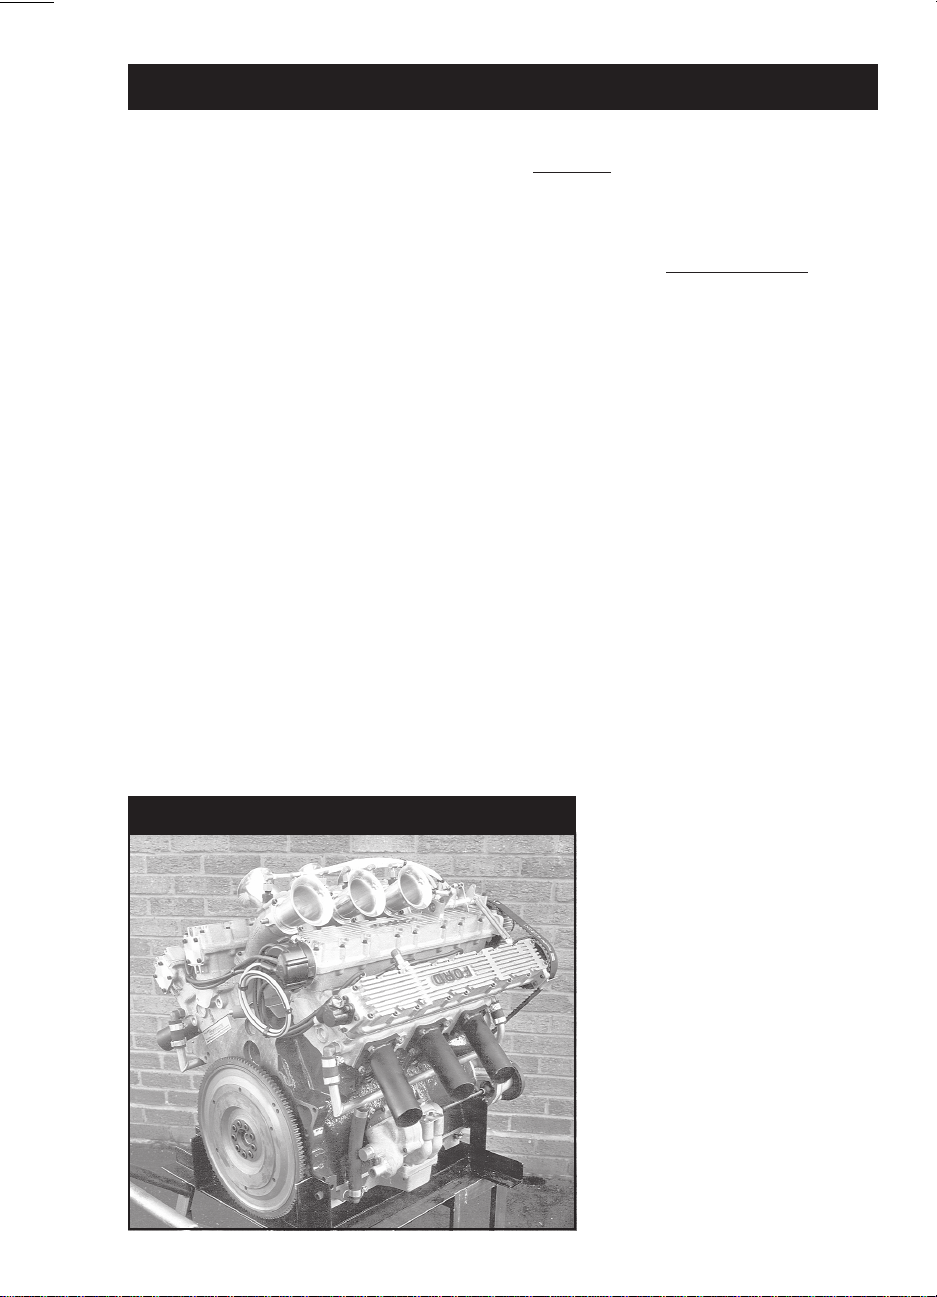
Typical 4-Valve Cylinder Heads
The “4-Valve Cylinder Head”
selections model cylinder
heads with 4-valves per
cylinder. These heads can offer
more than 1.5 times the curtain
area of the largest 2-valve
heads. This large valve area,
combined with high-flow, lowrestriction ports greatly
improves air and fuel flow into
the cylinders at high engine
speeds. These Cosworth heads
were designed for the English
Ford V6. When they were raced
in England several years ago,
they regularly beat V8s.
26—Dyno2000 Advanced Engine Simulation
Page 27
Cylinder Head Menu
model 4-valve cylinder heads. These are very interesting choices since they simulate
the effects of very low-restriction ports and valves used in many import stock and
performance applications. The individual ports in 4-valve heads begin as single,
large openings, then neck down to two Siamesed ports, each having a small (relatively) valve at the combustion chamber interface. Since there are two intake and
two exhaust valves per cylinder, valve curtain area is considerably larger than with
the largest single-valve-per-port designs. In fact, 4-valve heads can offer more than
1.5 times the curtain area of the largest 2-valve heads. This large area, combined
with high-flow, low-restriction ports greatly improves air and fuel flow into the cylinders at low valve lifts and at high engine speeds. Unfortunately, the ports offer an
equally low restriction to reverse flow (reversion) that occurs at low engine speeds
when the piston moves up the cylinder from BDC to Intake Valve Closing (IVC) on
the final portion of the intake stroke. For this reason, 4-valve heads, even when fitted
with more conservative ports and valves, can be a poor choice for small-displacement, low-speed engines, unless camshaft timing is carefully designed to complement the low-lift flow capabilities of these cylinder heads. On the other hand, the
outstanding flow characteristics of the 4-valve head put it in another “league” when
it comes to horsepower potential on high-speed racing engines.
The first choice in the 4-valve group is “4-Valve Head/Stock Ports And Valves.”
This simulates a 4-valve cylinder head that would be “standard equipment” on factory high-performance or “sports-car” engines. These heads offer power comparable
to high-performance 2-valve castings equipped with large valves and pocket porting.
However, because they still have relatively small ports, reasonably high port velocities, and good low-lift flow characteristics, they often show a boost in low-speed
power over comparable 2-valve heads.
The next choice, “4-Valve Head/Ported With Large Valves” incorporates mild
performance modifications. Larger valves have been installed and both intake and
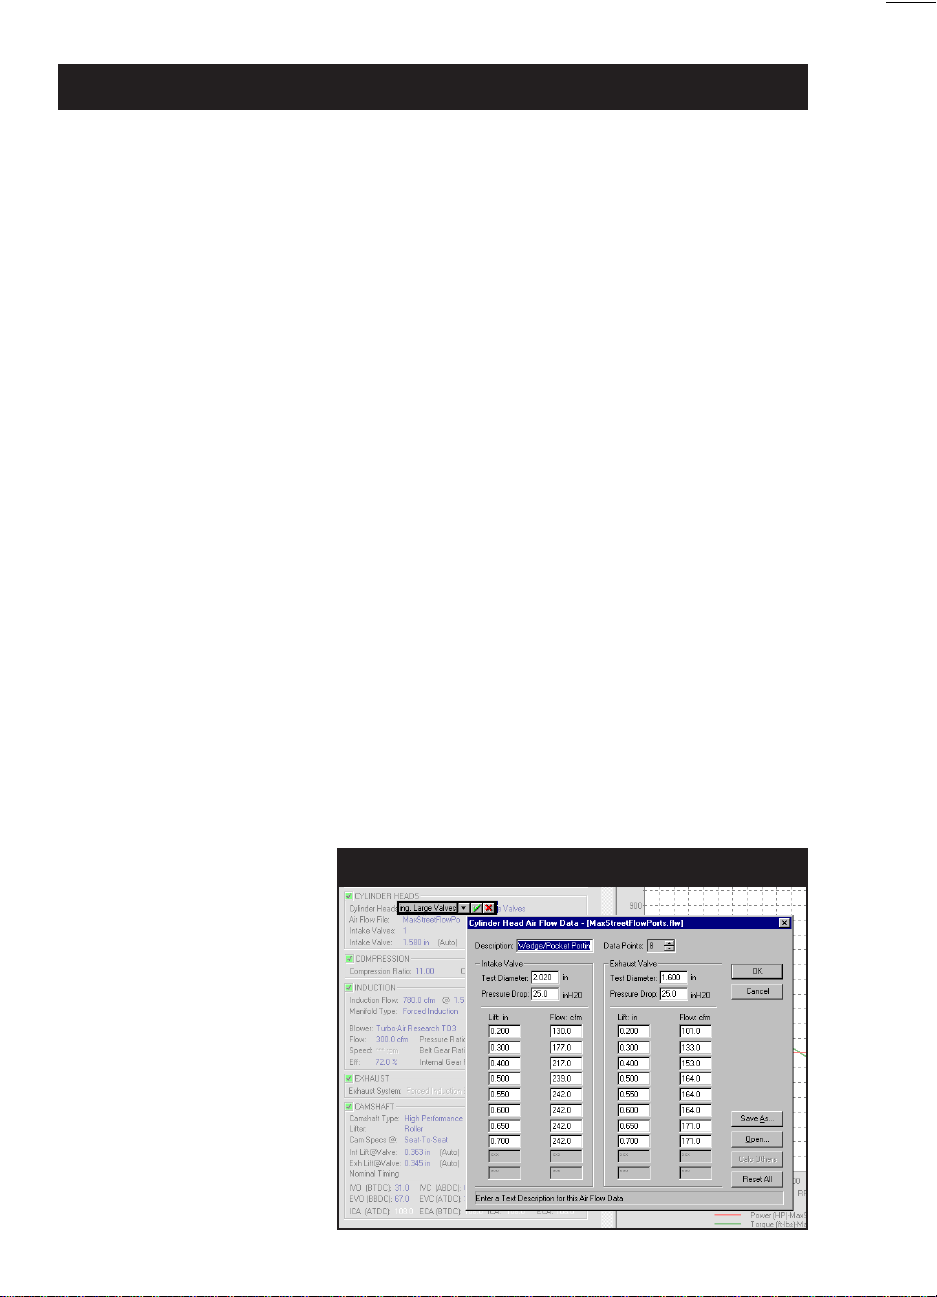
The Custom Port Flow
dialog box allows the direct
entry of flow bench data.
From 4 to 10 data points for
each port can be entered.
Virtually any test valve
diameter and pressure drop
can be used.
Custom Port Flow Dialog
Dyno2000 Advanced Engine Simulation—27
Page 28
Custom Port Flow Dialog
exhaust flow has been improved by pocket porting. However, care has been taken
not to increase the minimum cross-sectional area of the ports. These changes
provide a significant increase in power with only slightly slower port velocities. Reversion has increased, but overall, these heads should show a power increase
throughout the rpm range on most engines.
The final choice, “4-Valve Head/Race Porting And Mods,” like the other “Race
Porting And Mod” choices in the Cylinder Head menu, models an all-out racing
cylinder head. This selection has the greatest power potential of all. The ports are
considerably larger than the other choices, the valves are larger, and the discharge
coefficients are the highest possible. These heads suffer from the greatest reversion
effects, especially with late IVC timing on low-speed, small-displacement engines.
Note: These heads, like all choices provided in the Cylinder Head menu, are “scaled”
to engine size, so that smaller engines automatically use appropriately smaller valves—
providing the Auto Calculate Valve Size option is selected—and smaller ports.
Tip: If you would like to know what “hidden” power is possible using any particular
engine combination, try this cylinder head choice. It is safe to say that the only way
to find more power, with everything else being equal, would be to add forced induction, nitrous-oxide injection, or use exotic fuels.
Custom Port Flow—The Dyno2000 will accept flowbench data, taken from measur-
ing virtually any port, with any valve size, at any pressure drop. Selecting Custom
Port Flow opens the airflow-bench dialog box (see photo on previous page). If you
open this dialog after you have selected one of the other cylinder head menu
choices, the Custom Port Flow dialog will display the flow data for that head configuration.
To enter flow-bench data, first provide a short description of the flow-bench/
cylinder head test in the Description field. Then select the number of data points
Custom Port Flow Description And Filename
Custom Port Flow
Saved Flow Data
28—Dyno2000 Advanced Engine Simulation
When Custom Port Flow is
used, the port Description
name (entered in the PortFlow Dialog Box) is displayed in the CYLINDER
HEAD category. In addition,
if the flow data was saved to
disk, the filename is also
displayed. You can doubleclick on the filename (or
asteristics in that field) and
load and save airflow data.
Page 29

Valve Size Menus
in your flowbench test into the Data Points field (click up to increase, down to
decrease). Then enter the test-valve diameters and the pressure drop (in inches of
H20) at which the tests were performed. Finally enter flow and valve-lift test data.
Note 1: You may press the Calc Others button at any time to fill in the remaining
lift fields with the same “step” value that was established in the previous fields. The
Calc Others button is smart enough to change step values at higher valve lifts.
Note 2: If you have fewer data points for one of the valves, simply repeat the highest
measured flow value to “flush out” the remaining data points. This technique has
been shown to produce accurate simulations.
You can save the flow data to your hard drive at any time by pressing the Save
As button. Recall previously saved flow data with the Open button.
Pressing OK will load the new test data into the engine database and display the
custom flow Description in the CYLINDER HEAD category.
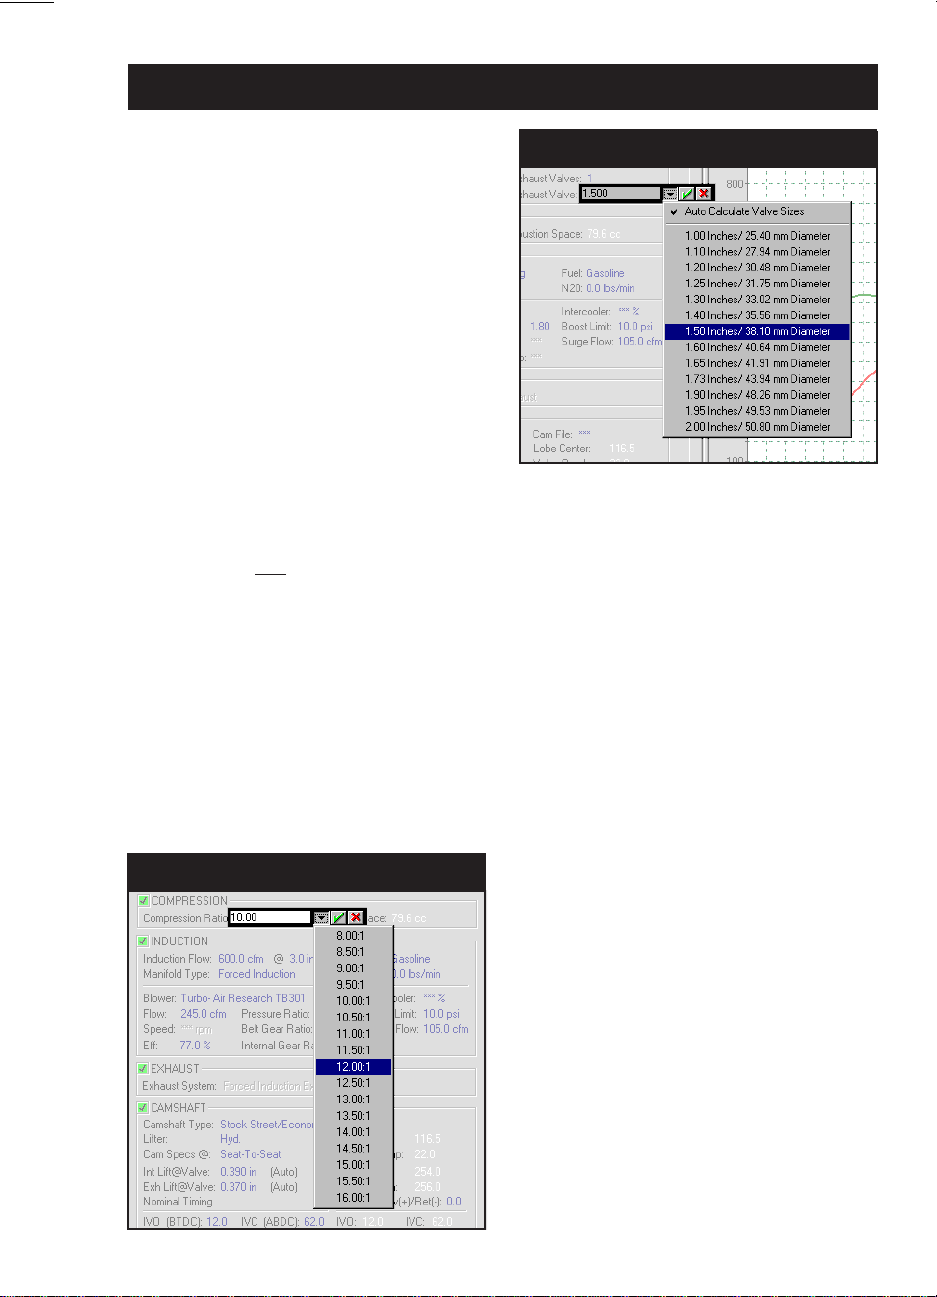
Valve Diameters
The Valve Diameter menus are located in the lower portion of the CYLINDER
HEAD category. The first selection is Auto Calculate Valve Size. This feature
instructs the simulation software to determine the most likely valve sizes to be used
with the current engine based on an assessment of the current bore diameter and
the Cylinder Head selection. When the Auto Calculate function is activated Auto will
be displayed next to the calculated sizes, and it remains active on the current engine
until turned off (by selecting it a second time). Auto Calculation is turned off by
default when the Dyno2000 is started and whenever Clear Components is chosen
from the Edit menu.
Auto Calculate Valve Size is especially helpful if you are experimenting with
several different bore and stroke combinations or comparing different engine configurations. Auto Calculate will always select valves of appropriate diameter for the
Intake And Exhaust Valve Sizes
Select valve sizes for the intake and
exhaust valves from drop-down menus.
If you choose Auto Calculate Valve Size
from either the intake or the exhaust
menu, the Dyno2000 will size all valves
appropriately, based on the cylinderhead
type and the bore diameter. Deselecting
Auto Calculate Valve Size on either the
intake or the exhaust valve-size menus
will disable this feature on all valves.
Dyno2000 Advanced Engine Simulation—29
Page 30
Compression Ratio Menu
Selecting a specific valve size will
disable Auto Calculate Valve Size. You
can select from the provided sizes
(displayed in both US and Metric mea-
surements), or you can directly enter
any valve dimension within the range
limits of the Dyno2000.
Manually Selecting Valve Sizes
cylinder heads under test and it will never use valve sizes that are too large for the
current bore diameter (also, see page 69 for information on the related Auto Cal-
culate Valve Lift feature).
While the Auto Calculate Valve Size is helpful during fast back-to-back testing,
it may not “guess” the precise valve sizes used, and therefore, not simulate power
levels as accurately as possible. In these situations refer to the lower choices on the
Valve Diameter menus. Here you will find a list of exact valve sizes consisting of
common intake and exhaust dimensions. In addition, you can directly enter any
valve diameters within the acceptable range limits of the program.
THE COMPRESSION RATIO MENU
The Compression Ratio menu is located in the COMPRESSION category. A
Compression Ratio Menu
The Compression Ratio of the engine is
a comparison of the geometric volume
that exists in the cylinder when the
piston is located at BDC (bottom dead
center) to the “compressed” volume
when the piston reaches TDC (top dead
center). Passenger car engines often
have 8 to 10:1. While racing engines can
have as high as 18:1 compression ratio.
30—Dyno2000 Advanced Engine Simulation
Page 31

Compression Ratio Menu
;;;;;;;
;;;;;;;
;;
;;
;;
Basic Compression Ratio Equation
Compression ratio is calculated by
dividing the total volume that exists
in the cylinder when the piston is
Compression Ratio =
Swept Cyl Vol + Combustion Space Vol
located at BDC by the volume that
exists when the piston is positioned
at Top Dead Center.
———————————————————
Combustion Space Vol
selection from this menu establishes the compression ratio for the simulated engine
(the Dyno2000 range of compression ratios is 6:1 to 18:1). As mentioned earlier,
compression ratio is a comparison of the geometric volume that exists in the cylinder
when the piston is located at BDC (bottom dead center) to the “compressed” volume
when the piston reaches TDC (top dead center).
Let’s take a close look at this relationship to discover exactly what compression
ratio is and how compression ratio affects performance in the IC engine.
Compression Ratio Basics
The compression-ratio equation contains two variables: 1) swept-cylinder volume,
and 2) combustion-space volume. These volumes are the only two variables that
affect compression ratio. However, each of these variables is made up of multiple
volumes, so the first step in exploring compression ratio must be to understand
these volumes.
While combustion-chamber
volume is simply the volume in
the cylinderhead, the combustion-
space volume is the
total en-
closed volume when the piston is
located at TDC. This space
includes the volume in the
combustion chamber, plus any
volume added by the piston not
rising to the top of the bore and
the head-gasket thickness, less
any volume due to the piston or
piston dome protruding above the
top of the bore.
Top Dead Center Volumes
COMBUSTION
CHAMBER
VOLUME
PISTON
AT
TDC
Dyno2000 Advanced Engine Simulation—31
COMBUSTION
SPACE
VOLUME
Page 32

Compression Ratio Menu
;
;;
;;;;
;
;
;;
Compression Increases Power
A combustion space containing twice as
much volume as the cylinder produces a
1.5:1 compression ratio. Peak cylinder
pressures after fuel ignition will be about
250psi. With a combustion space about
1/10th of the volume of the cylinder, the
compression ratio is now 10:1. Peak
pressures reach about 1500psi. The
higher compression ratio generated
much higher cylinder pressures through-
out the first half of the piston’s travel
from TDC to BDC on the power stroke.
This additional pressure generates a
much larger force across the surface of
the piston, and that increases torque
and horsepower.
Swept cylinder volume is the most straightforward of the two. As you discovered
previously, swept volume is calculated by the Dyno2000—and displayed in the
SHORTBLOCK category—as soon as the bore and stroke have been selected for
the test engine. Swept volume is simply the three-dimensional space displaced by
the piston as it “sweeps” from BDC to TDC, and is determined solely by the bore
diameter and stroke length.
The other variable in the compression-ratio equation is
This is the total volume that exists in the cylinder when the piston is positioned at
TDC. This space includes the volume in the combustion chamber, the volume taken
up by the thickness of the head gasket, plus any volume added by the piston not
rising fully to the top of the bore, less any volume due to the piston protruding above
the top of the bore. The complexity involved in combustion-space volume can be a
stumbling block for some enthusiasts. However, the following explanation and illus-
COMPRESSION
RATIO
1.5:1
combustion-space volume
COMPRESSION
RATIO
10:1
;
.
Combustion Space Volume
Combustion Space Volume
Is Not The Same As
Combustion ChamberVolume
Compression Ratio Is The Ratio
Between The Volume In The Cylinder
At BDC Compared To The Volume
At TDC. Combustion Chamber Volume
Is Only A Portion Of TDC Volume.
32—Dyno2000 Advanced Engine Simulation
An 11:1 compression ratio (as shown
here) means that the sum of the Cylinder
Volume and the Combustion Space
Volume is eleven times greater than the
volume in the Combustion Space alone.
Page 33
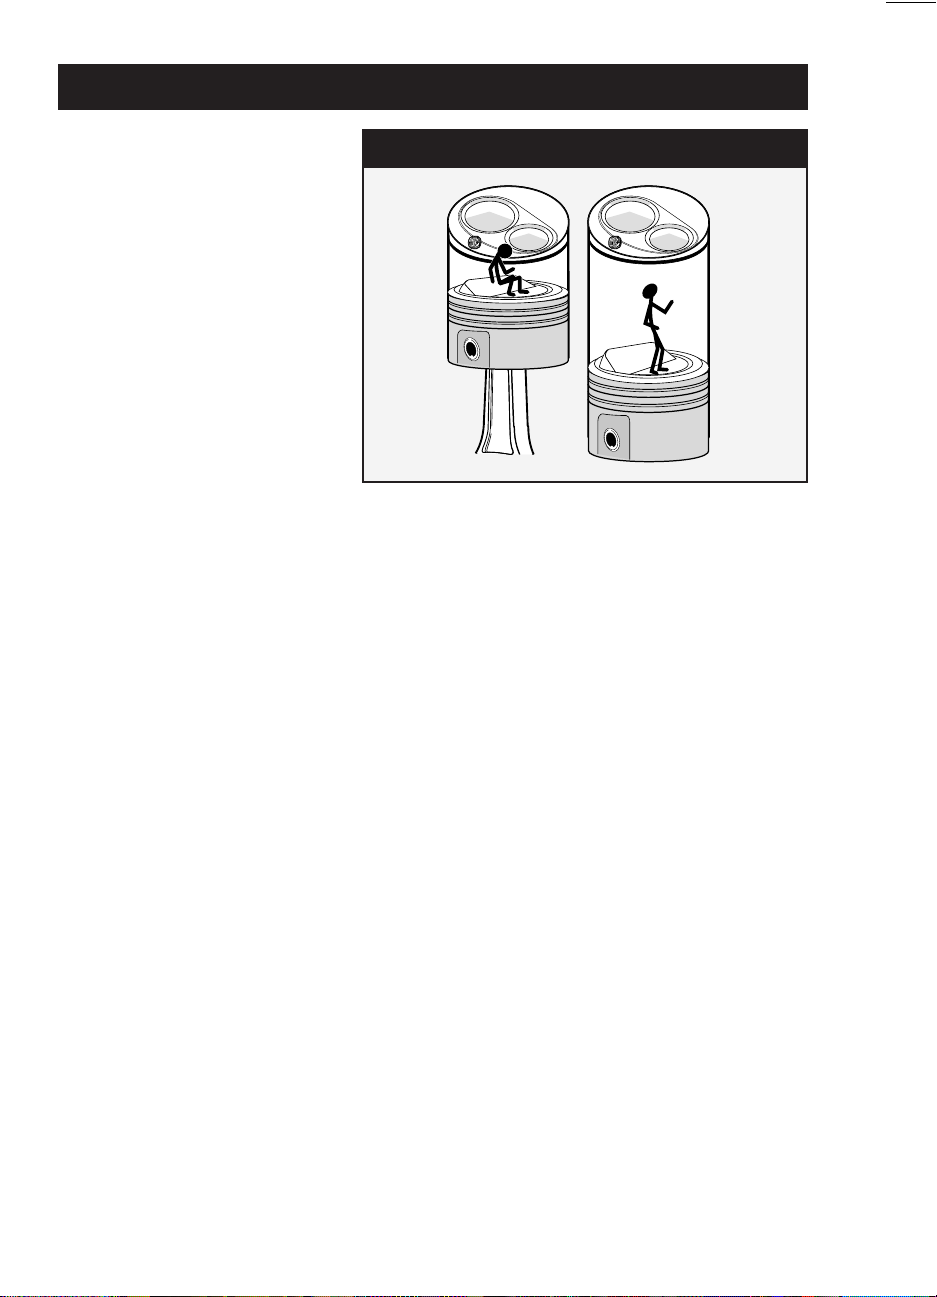
Compression Ratio Menu
Compression Space And Volumes
A good way to visualize com-
pression ratio volumes is to
imagine yourself a “little man”
wandering around inside the
engine. You would see the
combustion chamber above you
like a ceiling. Your floor would
be the top of the piston (see
text for additional description of
cylinder volumes).
PISTON
AT
TDC
PISTON
AT
BDC
trations should clarify these important engine variables.
A good way to visualize these volumes is to imagine yourself a “little man” wandering around inside the engine. Let’s take a walk inside the combustion space.
Picture what it would look like in the cylinder with the piston at TDC. You would see
the combustion chamber above you like a ceiling. Your floor would be the top of the
piston. If the piston (at TDC) didn’t rise completely to the top of the cylinder, around
the edges of the floor you would see a bit of the cylinderwall, with the head gasket
sandwiched between the head and block, like a trim molding around the room. There
may be notches in the top of the piston just under your feet (don’t trip!). If the piston
had a dome, it might look like a small room divider rising from the floor, to perhaps
knee high. The combustion space would be larger if the piston was positioned lower
down the bore or if the notches under your feet were deeper, and it would be smaller
if the room divider (dome) volume was larger. This entire space is “home” for the
compressed charge when the piston reaches TDC. This is the volume that makes
up the combustion space, the denominator of the compression-ratio calculation. Now
let’s continue our “ride” in the cylinder, but this time picture what it looks like when
the piston is positioned at BDC. The very same volumes that we just described
(chamber, dome, notches, gasket, etc.) are still there, but are now located well
above our head. It looks like the room has been stretched, like the elevator ride in
the Haunted House at Disneyland. This “stretched” volume is described in the numerator of the compression-ratio equation. It’s simply the original combustion volume plus the volume added by the “sweep” of the piston as it traveled from TDC to
BDC. The ratio between these two volumes is the compression ratio.
Changing Compression Ratio
A quick look at the compression-ratio equation reveals that if engine displacement
(swept volume) is increased, either by increasing the bore or stroke, the compression ratio will rise. In fact, with everything else being equal, a longer stroke will
Dyno2000 Advanced Engine Simulation—33
Page 34

Compression-Ratio Math Calculator
increase compression ratio much more effectively than increasing bore diameter.
This is due to the fact that a longer stroke not only increases displacement, but it
tends to decrease combustion space volume, since the piston moves higher the bore
(in our “little man” example, raising the floor closer to the ceiling). This “double
positive” results in rapid increases in compression ratio for small increases in stroke
length. On the other hand, increasing cylinder-bore diameter also increases compression ratio but much less rapidly. This is due, in part, to the increase in combustion volume that often accompanies a larger bore (again, using our “little man,” a
larger bore adds more floor space by increasing the diameter of the room—and it
can also increases the size of the ceiling), partially offsetting the compression-ratio
increase from swept cylinder volume.
Changing combustion space, the other element in the equation, will also alter the
compression ratio. Anything that reduces the combustion volume, while maintaining
or increasing the swept volume of the cylinder, will increase the compression ratio.
Some of the more common methods are decreasing the volume of the combustion
chambers (by replacing or milling the heads), using thinner head gaskets, changing
the location of the piston-pin or rod length to move the piston closer to the combustion chamber, installing pistons with larger domes, and others. These modifications
and others can be explored further using the built-in Compression Ratio Math Calculator, described in the next section.
THE COMPRESSION-RATIO MATH CALCULATOR
The Dyno2000 advanced engine simulation allows the selection and testing of
virtually any compression ratio. But many users have requested the ability to directly
enter combustion-chamber volumes, head-gasket thickness, etc., to determine their
effects on compression ratio. The Compression-Ratio Math Calculator built-in to
the Dyno2000 quickly performs these functions. But it is not another “enter-the-
numbers-into-the-equation” calculator. This tool “intelligently” adjusts itself to the
needs of the engine builder, changing the way it handles volumes for flattop or
domed piston configurations.
After you have specified the bore, stroke, and number of cylinders for the engine
under test, activate the Compression-Ratio Math Calculator by selecting either
Compression-Ratio Math from the Tools menu or by clicking on the Compression-
Ratio Math Icon in the Toolbar. When the calculator is first activated, it defaults to
Compression-Ratio Math Calculator
Opens Compression-Ratio
Math Calculator
After you have specified the bore,
stroke, and number of cylinders in the
engine, activate the CompressionRatio Math Calculator by either
selecting Compression Ratio Math
from the Tools menu or by clicking on
the Compression-Ratio Math Icon in
the toolbar.
34—Dyno2000 Advanced Engine Simulation
Page 35

Compression-Ratio Math Calculator
CR Math Calculator—FlatTop Piston Mode
When the Compression-
FlatTop Piston Mode
Calculated Compression-Ratio
flattop-piston mode. This is the simplest model for calculating compression ratio,
since the combustion volume (the space above piston at TDC) can be calculated by
the simple sum of the chamber volume, head-gasket volume, and deck volume
(volume remaining in the cylinder with the piston at TDC).
Ratio Math Calculator is
first activated, it
defaults to the Flattop
Piston Mode. This is the
simplest model for
calculating compression ratio, since the
combustion-volume can
be calculated by the
simple sum of the
chamber volume, headgasket volume, and
deck volume (deck
volume is the remaining
space in the cylinder
with the piston at TDC).
Using The Calculator With FlatTop Pistons Without Valve Reliefs
Flattop pistons do not require measuring or calculating the volume of any domes,
dishes, or valve reliefs, so calculating the final compression ratio is considerably
simplified. Here is the procedure to use the Flattop-Piston Mode; the domed-piston
model will be discussed in the next section. Start off by verifying that the calculator
is in the Flattop Mode by checking the upper radio button
Valve Reliefs
cc’s) in the first (1)
. Next, enter the combustion-chamber volume (in cubic centimeters—
Head Chamber Volume
data box (refer to the above photo).
Piston—Flattop, Without
Combustion chamber volume is typically measured with a burette containing a colored liquid (for more information on compression ratio basics, refer to page 31).
The next two data-entry boxes are used to calculate the volume added to the
combustion space by the compressed head gasket. The data box marked (2) accepts the
Head Gasket Bore
diameter in the appropriate (Metric or US) units system.
Most head gaskets have a bore-circle larger than the cylinder-bore diameter. For
gaskets with bore-circle diameters of odd shapes, simply estimate the bore size by
averaging the larger and smaller dimensions. Next, enter the head gasket compressed thickness in the (3)
Head Gasket Thickness
Dyno2000 Advanced Engine Simulation—35
field. This dimension is often
Page 36

Compression-Ratio Math Calculator
Measuring Deck Height
Use a dial indicator and stand to measure
how far down the bore the piston is positioned at TDC. Enter a positive number for
“down-the-bore” distances and a negative
number if the piston protrudes above the
deck surface. A typical value might be
+0.040, indicating that the piston comes to a
rest at TDC 0.040-inch
surface.
below the deck
available from the gasket manufacturer. When the thickness is entered, the
Gasket Volume
For flattop pistons, the next data entry field is (4)
allows you to enter how far down the bore the piston is positioned at TDC. Enter a
positive number for “down-the-bore” distances and a negative number if the piston
protrudes above the deck surface (see photo, above). A typical value might be
+0.040, indicating that the piston comes to a rest 0.040-inch below the deck surface
at TDC. As soon as this last value is entered, both the
the
Compression Ratio
Note: A positive
deck surface and this volume adds to the combustion space at TDC; a negative
number indicates the piston protrudes above the deck surface at TDC and subtracts
from the combustion space.
At this point, you can move to any of the previous fields (by clicking in them or
using the Tab and/or the SHIFT-Tab keys) and modify any values to determine their
effect on compression ratio. At any time, you can click on the Apply button to load
the new calculated compression ratio into the Component Screen and save all entered values with the simulated engine. Alternately, you can press the Cancel button
to discard all entries and leave any previously entered compression ratio specifications intact.
is calculated.
Piston Down Bore @ TDC
Deck Volume @ TDC
are calculated.
Deck Volume @ TDC
Using The Calculator With Domed/Dished Pistons
Or Pistons With Valve Reliefs
indicates the piston is positioned below the
Head
that
and
Pistons with domes, dishes, pockets, or valve reliefs complicate the compression
ratio issue. Each of these volumes must be accurately determined so that the net
effect of all “positive” (domes) and “negative” (pockets, reliefs) can be calculated.
Start off by verifying that the calculator is in the Domed Mode by checking the
lower radio button
chamber volume (in cubic centimeters—cc’s) in the first (1)
data box. As described earlier, combustion chamber volume is typically measured
Piston—Has Dome, Dish or Valve Reliefs
. Enter the combustion
Head Chamber Volume
36—Dyno2000 Advanced Engine Simulation
Page 37

Compression-Ratio Math Calculator
CR Math Calculator—Domed Piston Mode
Domed Piston Mode
Distance Down Bore
Selected To Keep Dome
Below Deck Surface
Volume Measured
With Burette
Calculated
Compression-Ratio
When the CompressionRatio Math Calculator is
switched to the Domed
Piston Mode, field (4) is
redefined and an
additional field (5) is
displayed. These fields
allow the engine builder
to calculate a volume
(Deck Volume @ TDC)
equivalent to the sum
of all the dome, dish,
and relief volumes of
the piston. The piston
is lowered down the
bore until the dome is
located below the deck
surface (4). A direct
measurement is taken
of the cylinder volume
(5). The Deck Volume @
TDC is then calculated
and displayed.
with a burette.
The next two data-entry boxes allow the program to calculate the volume added
to the combustion space by the compressed head gasket. The data box marked (2)
accepts the
Head Gasket Bore
diameter in the appropriate (Metric or US) units
system. Most head gaskets have a bore-circle larger than the cylinder-bore diameter.
For gaskets with bore-circle diameters of odd shapes, simply estimate the bore size
by averaging the larger and smaller dimensions. Next, enter the head gasket compressed thickness in the (3)
available from the gasket manufacturer. When the thickness is entered, the
Gasket Volume
is calculated. Up to this point, the function of the Compression Math
Head Gasket Thickness
field. This dimension is often
Head
Calculator is identical to the flattop-piston mode, however, the next two data entry
fields are unique to the domed-piston model.
The next entry (4)
Piston Down From TDC
allows you to enter a distance down
the bore (measured from the deck surface) that positions the highest part of the
piston dome below the deck. Typical values may be 0.100-inches or 0.250-inches
depending on the height of the piston dome (any distance is acceptable as long as
the entire dome resides below the deck surface). At this depth, a direct measurement is made of the
Volume Above The Piston
in the cylinder. This measurement
is taken by the engine builder (see photo on next page) using a burette with a
petcock to fill the space above the piston (grease is often used to “seal” the piston
to the bore and a flat Plexiglas plate covers and seals the top of the bore). The
volume liquid dispensed will be less (typically) than the volume for a simple cylinder
of the same height as the distance the piston is positioned below the deck surface.
Dyno2000 Advanced Engine Simulation—37
Page 38

Induction Airflow Menus
Measuring Dome/Deck Volume
Measure the volume above the piston while
the highest portion of the piston dome is
positioned below the deck surface. Enter this
value in field (5) Volume Above Piston. The
difference between this volume and the
volume of a simple cylinder [of a height equal
to the value entered in field (4)] is the Deck
Volume At TDC. This volume is equivalent to
the sum of all the dome, dish, and relief
volumes of the piston. A negative Deck
Volume At TDC indicates that the dome
reduces the combustion space and will
increase the compression ratio over a flattop
piston. A positive value indicates that the sum
of all dome/deck/dish/relief volumes will
increase the combustion volume and decrease
the compression ratio over a flattop piston.
The liquid volume dispensed from the burette is entered in field (5)
Piston
. The difference between this volume and the volume of a simple cylinder [of
a height equal to the value entered in field (4)] is the
Deck Volume At TDC
Volume Above
, a volume
equivalent to the sum of the dome, dish, and relief volumes of the piston.
Note: A negative
Deck Volume At TDC
indicates that the dome reduces the combustion space and will increase the compression ratio over a flattop piston. A positive
value indicates that the sum of all dome/deck/relief/dish volumes will increase the
combustion space volume and decrease the compression ratio over a similar flattop
piston (with the same deck height at TDC).
Induction Airflow Menu
The Induction Airflow menu establishes
the airflow restriction for the induction
system and the pressure drop at which
the airflow is measured. For the purposes of the simulation, everything
upstream of the intake ports, including
the intake manifold, carburetor/fuelinjection system, venturis, any supercharger or turbocharger, and the openings to the atmosphere is considered the
induction system. The Airflow menu
consists of four 2-barrel-carburetor
selections and thirteen 4-barrel-carburetor/fuel injection choices. In addition,
you can directly specify the rated airflow
from 100 to 3000cfm and the pressure
drop at which this airflow is measured.
38—Dyno2000 Advanced Engine Simulation
Page 39

Induction Airflow Menus
THE INDUCTION MENU
The next main component category establishes an INDUCTION system for the
simulated test engine. An induction system, as used in the Dyno2000, is everything
upstream of the intake ports, including the intake manifold, common plenums (if
used), carburetor/fuel-injection throttle body, venturis (if used), any supercharger or
turbocharger, and openings to the atmosphere. Dyno2000 induction menus are divided into two groups: 1) Airflow, pressure drop, fuel type, and manifold type, and
2) forced induction.
Airflow Selection And Pressure Drop
The first two Induction menus are used to select the rated airflow for the induction
system and the pressure drop at which this airflow is measured. The Induction Flow
menu consists of four 2-barrel-carburetor selections and thirteen 4-barrel-carburetor/
fuel-injection choices. In addition, you can directly specify any rated airflow from 100
to 3000cfm.
The two-barrel selections “install” either a 300-, 350-, 500-, or 600-cfm 2-bbl
carburetor on the test engine. These are the only 2-barrel choices directly available
in the menu. The remaining Induction Flow choices range from 300 to 1100cfm, 4or 8-barrel carburetors and fuel-injection applications.
The flow ratings for 2-barrel carburetors are measured at a pressure drop twice
as high as the pressure used to rate 4-barrel carburetors and most fuel-injection
systems. Rated airflow for 2-barrels is typically measured at a pressure drop of 3
inches of mercury, while the pressure drop for 4-barrel carburetors is 1.5-inches of
mercury (this is the pressure differential maintained across the carburetor during
airflow measurement at wide-open throttle). This is displayed as 3-inHg in the Pres-
sure Drop menu (Hg is the symbol for mercury as used in the periodic table of
elements).
Note: The higher pressure drop increases the measurement resolution for smaller
carburetors and “shifts” the flow numbers toward the range commonly found in
automotive applications (roughly, 100 to 700cfm).
Knowing the pressure-drop convention, it is possible to simulate virtually any 2barrel or 4-barrel induction. By manually entering, say, 460cfm into the Induction
Flow menu and 3.0 for Pressure Drop, the program will accurately model a 460cfm
Induction Pressure-Drop Menu
Use the Induction Airflow Pressure Drop
menu to select between 1.5-inches of
Mercury, a measurement standard for 4barrel carburetors and injection systems,
and the two-barrel carburetor standard
of 3.0-inches of Mercury.
Dyno2000 Advanced Engine Simulation—39
Page 40

Induction Airflow Menus
2-barrel.
Note: See the Airflow Math Calculator (see page 40) for quick conversions between
any airflow measured at any pressure drop.
The last thirteen choices in the Induction Flow menu are labeled with 4/8-BBL
Carb Or Fuel Inj. These selections designate airflow ratings that were measured at
1.5-in/Hg. 4/8-BBL indicates that the induction system can consist of single or multiple
carburetors or a fuel-injection system capable of the rated airflow. The important
thing to remember about airflow selection is that the program
about the type of restriction
is simply a rating of the total restriction of the induction system.
As higher airflow levels are selected from the Induction menu, the simulation
lowers the restriction within the induction system. This decrease in restriction increases charge density. To keep things consistent, the simulation assumes that
used in the carburetor or injection system. The airflow
Airflow Menu Assumptions
air/fuel ratio is always at the precise proportion for optimum power
air/fuel ratios are more achievable with fuel-injection systems, a carefully tuned
carburetor also can come remarkably close to ideal fuel metering. Regardless of
whether the simulated engine uses carburetors or fuel injection, the power levels
predicted by the program can be considered optimum, achievable when the engine
is in “peak” tune and the induction system is working properly.
The airflow (in Cubic Feet per Minute, or CFM) selected from the Induction Airflow
menu is the
systems, the Induction Airflow is the sum of all rated airflow devices. So a manifold
equipped with twin 1100cfm Holley Dominators would have a rated airflow of 2200cfm.
If an air cleaner is used, total airflow must be adjusted to compensate for the
increase in restriction (contact the element manufacturer or flow test the carburetor/
air-cleaner as an assembly).
Note: Keep in mind the unique way airflow capacities are handled on Individual
Runner (I.R.) manifolds (discussed in an upcoming section). On these induction
systems, each cylinder is connected to a single “barrel” or injector stack with no
connecting passages that allow the cylinders to “share” barrels. The total rated flow
for these induction systems is divided among the number of cylinders. For example,
a smallblock V8 equipped with 4 Weber carburetors (having 8 barrels) may have a
total rated flow of 2000cfm. To properly model this system, enter 2000cfm directly
into the Induction Airflow field. When an I.R. manifold is selected from the Manifold
Type menu, the airflow is equally divided into all cylinders.
total rated airflow into the engine
. On dual-inlet or multiple-carburetor
makes no assumption
the
. While optimum
THE AIRFLOW MATH CALCULATOR
The Dyno2000 will simulate virtually any engine with an induction airflow rating
measured at a pressure drop of either 1.5-Inches of mercury (In/Hg), widely accepted as the standard 4-barrel airflow pressure-drop rating system, or at 3.0-In/Hg,
40—Dyno2000 Advanced Engine Simulation
Page 41

Airflow Math Calculator
The Airflow Math Calculator is a
Airflow Math Calculator
general-purpose tool that will convert
airflow to/from any pressure-drop
standard. Activate the Airflow Math
Calculator by either selecting Airflow
Math from the Tools menu or by
clicking on the Airflow Math Calculator
Icon in the toolbar.
the standard pressure drop used to rate 2-barrel carburetors. For those instances
where an induction system, injector, or carburetor was flow tested at a different
pressure drop, or whenever you would like to convert flow values from one pressuredrop to another, the Dyno2000 Airflow Math Calculator easily performs these conversion functions. The Airflow Math Calculator can also convert flow ratings measured in inches-of-mercury (in/Hg) to and from airflow values rated in inches-of-water
(in/H2O).
Note: A pressure drop of 1.5-in/Hg is equivalent to 20.3-in/H2O.
The Airflow Math Calculator has three basic modes of operation: 1) Convert to
the 4-Barrel Standard, 2) convert to the 2-Barrel Standard, and 3) calculate airflow
between any pressure drop ratings. Each of these methods are described below.
Activate the Airflow Math Calculator by either selecting
drop-down menu or click on the Airflow Icon located in the Toolbar.
Using The Airflow Math Calculator
Mode 1: Convert To The 1.5-in/Hg, 4-Barrel Standard.
Opens Airflow Math Calculator
Airflow Math
from the Tools
When the calculator is first activated, the
Airflow Ratings Standard
Airflow Math Calc—Convert To 4-Bbl Standard
Convert To Standard
4-Barrel Flow Rating
Calculated
Non-Standard
Airflow
Airflow At
1.5 Inches/Hg
“radio button”
When the calculator is
first activated, the
Airflow Ratings Standard is set to
This forces the Calculated Airflow to default
to a pressure drop of
1.5-in/Hg or 20.3-in/H
To convert any known
airflow to the 1.5-in/Hg,
4-barrel standard, enter
the measured airflow
and pressure drop in
the Known Airflow
category. The calculated airflow will be
displayed in the Airflow
Rate field.
Dyno2000 Advanced Engine Simulation—41
1.5-in/Hg
2
.
O.
Page 42

Calculated
Airflow At
3.0 Inches/Hg
4-Barrel Standard
Airflow
Convert To Standard
2-Barrel Flow Rating
Airflow Math Calculator
of 1.5-in/Hg is selected. This forces the result, or
Calculated Airflow
category to
default to a pressure drop of 1.5-in/Hg or 20.3-in/H2O (these pressure drops are
identical). To convert any known airflow measured at any pressure drop to the 1.5in/Hg, 4-barrel standard, enter the measured airflow and pressure drop in the
Airflow
category (you can switch between Inches-of-Mercury(Hg) and Inches-of-Water
(H2O) buy clicking on the appropriate radio buttons in the
culated Airflow
Rate
field (see photo, previous page). You can move to any of the previous fields
categories). The calculated airflow will be displayed in the
Known Airflow
Known
and
Airflow
Cal-
(by clicking on them or using the Tab or SHIFT-Tab keys) to make changes and
determine their effect on the calculated airflow. At any time, you can click on the
Apply button to load the new calculated airflow into the Induction Airflow field on the
Component Selection screen, saving all entered values. Alternately, you can press
the Cancel button to discard all entries and leave any previously entered values
intact.
Using The Airflow Math Calculator
Mode 2: Convert To The 3.0-in/Hg, 2-Barrel Standard.
Switch the
2-Barrel Rating of 3.0-in/Hg Pressure Drop
Airflow
category to default to a pressure drop of 3.0-in/Hg or 40.7-in/H2O (these
Airflow Ratings Standard
category selection to the radio button marked
. This forces the “result,” or
Calculated
pressure drops are identical). To convert any known airflow measured at any pressure drop to the 3.0-in/Hg, 2-barrel standard, enter the measured airflow and pressure drop in the
Inches-of-H2O buy clicking on the appropriate radio buttons in the
Calculated Airflow
pressure drop will be displayed in the
Known Airflow
category (you can switch between Inches-of-Hg and
Known Airflow
categories). The new, equivalent airflow at the new 3.0-in/Hg
Airflow Rate
field (see photo, below). You can
and
Switch the Airflow
Ratings Standard to
. This forces the
in/Hg
Calculated Airflow to
default to a pressure
drop of 3.0-in/Hg or
40.7-in/H
drop used for 2-barrel
carburetors). Enter the
measured airflow and
pressure drop in the
Known Airflow category
shown here, but any
airflow at any pressure
drop may be entered).
airflow is displayed in
the Airflow Rate field.
O (a pressure
2
(a 4-barrel airflow is
The new calculated
42—Dyno2000 Advanced Engine Simulation
Airflow Math Calc—Convert To 2-Bbl Standard
3.0-
Page 43

Airflow Math Calculator
Switch the Airflow
Ratings Standard to
Ratings Standard
Calculated Airflow can
now be set to any
pressure drop mea-
sured in Inches of Hg
O. Select the
or H
desired Pressure Drop
pressure drop. Enter
the desired pressure
drop in the Calculated
Airflow category. The
equivalent airflow will
2
Units and enter the
known airflow and
be displayed in the
Airflow Rate field.
. The
Airflow Math Calc—Convert To Any Pressure Drop
No
Convert Between Any
Two Flow Rating Systems
Any Airflow @ Any
Pressure Drop
Convert To Any
Airflow @ Any
Pressure Drop
move to any of the previous fields (by clicking on them or using the Tab or SHIFTTab keys) make changes and determine their effects on the calculated airflow. At any
time, you can click on the Apply button to load the new calculated airflow into the
Induction Flow field on the Component Selection screen, saving all entered values.
Alternately, you can press the Cancel button to discard all entries and leave any
previously entered values intact.
Using The Airflow Math Calculator
Mode 3: Convert To Equivalent Flow At Any Pressure-Drop.
Note: Since the Dyno2000 Induction Flow field only accepts induction airflow rated
at either 1.5- or 3.0-in/Hg (20.3- or 40.7-in/H2O), the Apply button is not shown when
the No Ratings Standard is selected. If you wish to use the new calculated values
in a dyno test, select either the
Barrel Rating at 3.0-in/Hg Pressure Drop
4-Barrel Rating at 1.5-in/Hg Pressure Drop
choices in the
Airflow Ratings Standard
or
2-
category.
Switch the
No Ratings Standard
Airflow Ratings Standard
. This allows the “result,” or
category selection to the radio button marked
Calculated Airflow
category to be
set to any pressure drop measured in Inches of Hg or Inches of H2O. To convert any
known airflow measured at any pressure drop to any other pressure drop equivalent
flow, enter the starting airflow and pressure drop in the
Known Airflow
category (you
can switch between Inches-of-Mercury(Hg) and Inches-of-H2O). Then enter the new
pressure drop in the
be displayed in the
Calculated Flow
Airflow Rate
field (see photo, above). You can move to any of
category. The calculated equivalent airflow will
the previous fields (by clicking on them or using the Tab or SHIFT-Tab keys) to make
changes and determine their effects on the calculated airflow.
Dyno2000 Advanced Engine Simulation—43
Page 44

Fuel Menu
Fuel And Nitrous-Oxide Selection Menu
FUEL MENU
The Dyno2000 can model five automotive fuels and Nitrous-Oxide injection during
dyno testing.
To select any of the available fuels, make a choice from the FUEL menu:
• Gasoline (Detonation Free), • Gasoline W/Nitrous Injection
• Methanol (Methyl Alcohol), • Ethanol (Ethyl Alcohol)
• Propane (Gaseous fuel), • LNG (Liquefied Natural Gas)
When any of these fuels have been selected, the Dyno2000 readjusts the air/fuel
proportion for optimum power. Since combustion
Dyno2000 (a flame-travel model would require a full 3D map of the combustion
chamber and piston shape), detonation and/or variations in combustion efficiency
are not calculated. However, the predicted power will accurately match dyno figures
on engines that are setup properly to use these fuels.
flame-travel
The Dyno2000 allows
a wide range of
possible fuels for
dyno testing. When
any of these fuels
have been selected,
the air/fuel ratio is
adjusted to ensure
optimum power.
is not modeled in the
Nitrous-Oxide Injection
There are many ways to boost engine power. However, nitrous-oxide injection is
a uniquely effective method. Developed during World War II for piston-driven fighter
aircraft, nitrous-oxide gas—an oxygen-releasing substance—allows an engine to
burn more fuel while maintaining optimum air/fuel ratios. When injected into the
cylinders with additional fuel, the effect is similar to instantaneous supercharging but
without the losses from a belt- or exhaust-gas-driven device. Remarkable as it may
seem, you can add about as much horsepower as you want, with the limitations
being excessive cylinder pressure, detonation, and component failure. There are no
subtleties here: Add more nitrous and fuel; get out more horsepower.
Most nitrous systems inject a fixed amount of nitrous and fuel, regardless of
engine speed. In other words, when the nitrous “switch” is turned on, the engine will
immediately produce a boost in power determined by the amount of injected fuel and
nitrous. A nitrous injection system designed to add 100 horsepower (flowing about
44—Dyno2000 Advanced Engine Simulation
Page 45
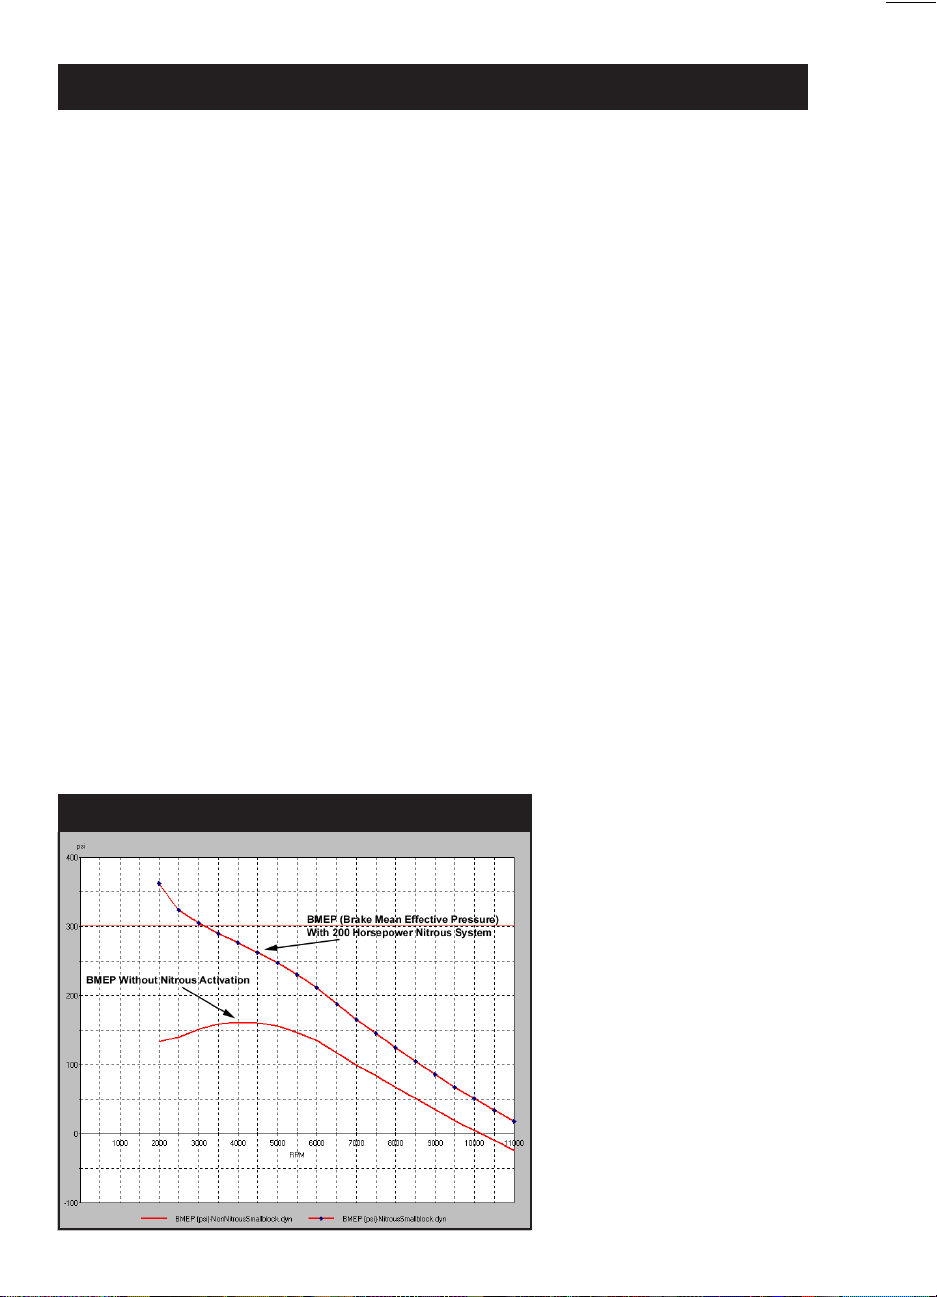
Nitrous-Oxide Injection Menus
4 pounds per minute of nitrous oxide), will produce a 100 horsepower boost instantly
upon triggering the system, and continue to produce that horsepower increase across
the entire rpm range. In other words, a 100hp nitrous system activated at 2000rpm
(when the engine may have been producing only about 70hp) can virtually double
or even triple power output.
But these huge power boosts at low engine speeds (when each cylinder must
ingest a large “dose” per power cycle) can send cylinder pressures through the roof.
So, fixed-flow-rate systems are often designed to delay activation until the engine
reaches sufficient speed to reduce each cylinder’s nitrous load, thereby reducing
cylinder pressures and preventing detonation and mechanical failure.
The Dyno2000 models a constant-flow nitrous/gasoline system. You should monitor cylinder pressures (BMEP) to make sure dangerously high pressures are avoided
at lower engine speeds (a BMEP greater than 300psi is usually considered excessive). For example, the test graph shown above illustrates a 350 smallblock equipped
with a 200hp nitrous system. Note that BMEP cylinder pressures below 3000rpm
exceed 300psi.
One of the ways you can reduce low-speed cylinder pressures is by altering cam
timing. Increasing valve duration and overlap will lower cylinder pressures at lower
engine speeds. While this phenomenon is normally a hindrance to power at low
speed, combined with a nitrous-oxide injection system it can permit earlier nitrous
flow while optimizing power at higher rpms. Other variables that will decrease lowspeed cylinder pressures are reduced compression ratios, increased exhaust-system back pressure, reduced induction airflow, less efficient induction manifolding,
and larger engine displacement.
Using the Dyno2000 it is a simple matter to simulate and test a variety of com-
Nitrous-Oxide vs Cylinder Pressure (BMEP)
This graphic comparison
was set up in the Dyno2000.
It shows how cylinder
pressure increases after a
200-horsepower nitrous
system is activated. Since
this is a fixed-flow nitrous
system, cylinder loads of
nitrous increase as engine
speed decreases. Below
3000rpm, BMEP exceeds
300psi. To maintain engine
reliability, nitrous-system
activation should be delayed
to keep cylinder pressures
below this critical level.
Dyno2000 Advanced Engine Simulation—45
Page 46

Manifold Modeling Menu
ponent combinations to determine the maximum nitrous load that can be injected
into any specific engine at any engine speed.
You can choose to add nitrous by selecting Gasoline/Nitrous Injection from the
induction menu. This will open the following submenu:
• 25 HP (1 lb/min N2Oflow), • 50 HP (2 lb/min N2Oflow)
• 100 HP (4 lb/min N2Oflow), • 200 HP (8 lb/min N2Oflow)
• 300 HP (12 lb/min N2Oflow), • 400 HP (16 lb/min N2Oflow)
These six choices allow nitrous flow selections from 25hp (1-lb/min flow) to 400hp
(16-lb/min flow). You can also directly enter flow values from 0.1- to 20-lb/min into
the Nitrous Flow Rate field.
MANIFOLD TYPE MENU
The Manifold Type menu consists of six naturally-aspirated manifold choices and
a Forced Induction selection (forced induction is discussed in the next section). Each
of the six naturally-aspirated manifolds applies a unique tuning model to the induction system. These six manifolds are only a small sample of the comprehensive list
of all the intake manifolds available for IC engines. The list should be interpreted as
six discrete designs that, in fact, cover most manifolds available to the engine
builder. If you are interested in a manifold that falls “in between” two menu selections, you can often use the trend method to estimate power for a hybrid design. For
example, run a test simulation using manifold Type A, then set up a comparison and
study the differences in power attributed to manifold Type B. The changes will
indicate trends that should give you insight into how a hybrid manifold Type A/B
might
perform. Because a rigorous analysis of pressure waves is not performed by
the Dyno2000 (look into the Motion Software
program series, available 2001), keep in mind that the data you obtain might not
match real-world dyno data with some unique combinations. In general, however,
the trends and overall accuracy should be within 10%.
For each manifold described below, you will find information about its basic design, an overview of how the manifold boosts power or torque, and finally, a description of the assumptions and recommendations associated with that individual design.
Dynomation Lite™
engine simulation
Manifold Type Menu
46—Dyno2000 Advanced Engine Simulation
Each of the six naturally-aspirated
manifolds in the Manifold Type menu
applies a unique tuning model to the
induction system. While these six
manifolds are only a small sample of
the intake manifolds available for IC
engines, these six discrete designs
cover most manifolds available to the
engine builder.
Page 47
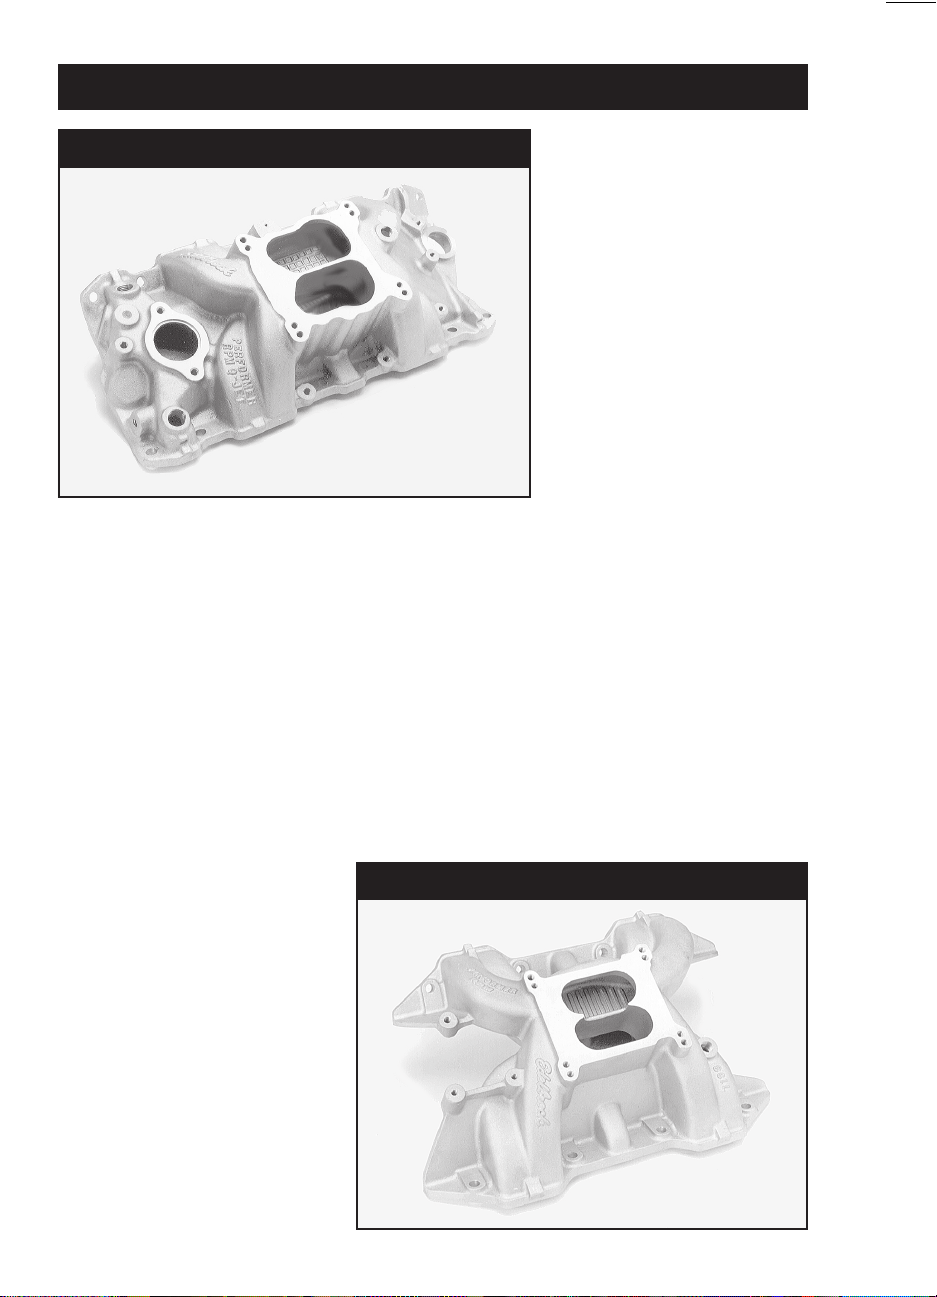
Dual-Plane Manifold Modeling
Dual-Plane Manifold
The Edelbrock Performer QJet represents a typical dualplane manifold design. This
manifold is said to have a
nd
degree of freedom. A
2
powerful resonance multiplies the force of the pressures waves, simulating the
effects of long runners,
boosting low- and mid-range
power.
Dual-Plane Manifold—Remarkably, the well-known and apparently straightfor-
ward design of the dual-plane manifold is, arguably, the most complex manifold on
the list. An intake manifold is considered to have a dual-plane configuration when
1) the intake runners can be divided into two groups, so that 2) each group alternately receives induction pulses, and 3) the pulses are spaced at even intervals. If
all of these criteria are met, the manifold is said to have a 2nd degree of freedom,
allowing it to reach a unique resonance producing oscillations within the entire
manifold. During this period, pressure readings taken throughout the manifold will be
in “sync” with one another. This powerful resonance multiplies the force of the
pressures waves, simulating the effects of long runners. Since longer runners typically tune at lower engine speeds, not surprisingly, the dual-plane manifold is most
Many dual-plane manifolds are
hybrids. This Edelbrock dual-
plane manifold is designed for
the 440 Chyrsler engine and
has a partially open plenum. In
this case, the opening adds
mid-range and high-speed
performance with only a slight
sacrifice in low-speed torque.
Not all hybrid designs are as
successful as this one. In
situations where you are not
familiar with engine or mani-
fold characteristics, it may be
worthwhile to stick with
“plane-vanilla” designs.
Hybrid Dual-Plane Design
Dyno2000 Advanced Engine Simulation—47
Page 48

Dual-Plane Manifold Modeling
Dual-Plane vs. Single-Plane Design
The basic differences between single- and dual-plane manifolds are clearly illustrated
here. The dual-plane (left) divides the plenum in half, with the runners grouped by
firing order. Each cylinder “sees” only one-half of the carburetor, transferring a strong
signal to the venturis. This manifold design is said to have a 2
allowing it to reach a unique resonance that makes its short runners boost low-speed
power. The single-plane manifold (right) has short, nearly equal-length runners with
an open plenum, much like a tunnel ram that is laid flat across the top of the engine.
The manifold has excellent high-speed performance, but its design prevents full-manifold resonance. That reduces low-speed torque, driveability, and fuel economy.
nd
degree of freedom,
known for its ability to boost low-end power.
The divided plenum is another common feature of dual-plane manifolds that further boosts low-end power. Since each side of the plenum is connected to only onehalf of the cylinders (4-cylinders in a V8), each cylinder in the engine is “exposed”
to only one-half of the carburetor. This maximizes wave strength and improves lowspeed fuel metering (these effects are much less pronounced with throttle-body fuelinjection systems). However, the divided plenum can become a significant restriction
at higher engine speeds, limiting peak horsepower.
The main benefits of the dual-plane design are its low-speed torque-boosting
capability, compact design, and wide availability for use with both carburetors and
injection systems. However, not all engines are capable of utilizing a dual plane
configuration. Typically, engines that do not have an even firing order or have too
many cylinders to generate a resonance effect will not benefit from a dual-plane
manifold. While there are some exceptions, engines having 2 or 4 cylinders work
best with this manifold. Since most V8 engines are basically two 4-cylinder engines
on a common crankshaft, even-firing V8s also benefit from the resonance effects of
the dual-plane manifold. Motion’s simulation does not prevent choosing a dual-plane
manifold on engines that will not develop a full resonance effect. For example, you
can install a dual-plane manifold on a 5-cylinder engine, but the results—a low-end
power boost—are not reproducible in the real world, since an effective dual-plane
manifold cannot be built for this engine. The simulation is best utilized by modeling
48—Dyno2000 Advanced Engine Simulation
Page 49

Single-Plane Manifold Modeling
dual-plane manifolds combinations that already exist rather than testing theoretical
fabrications.
Many dual-plane manifolds are hybrids incorporating facets of other manifold
designs. Especially common is the use of an undivided or open plenum typically
associated with single-plane manifolds. These hodgepodge designs are attempts at
harnessing the best features while eliminating the worst drawbacks of various designs. Sometimes, the combinations are successful, adding more performance without much of a sacrifice in low-speed driveability. With these designs, you can successfully use the “trend” method described earlier to estimate engine torque and
power. Unfortunately, there is no shortage of manifolds that can reduce power
without giving anything back in driveability or fuel economy. In fact, some of the
worst designs are remarkably bad. It is impossible to determine which of these
combo designs is better than others using the Dyno2000 simulation. Only a simulation that models intake passages, including the complex effects of multicylinder
interference, can perform this analysis (Motion’s upcoming
lation series is capable of this analysis). Unless you can perform actual dyno testing
on these manifolds to determine what works and what doesn’t, it may be worthwhile
to stick with more “plain-vanilla” designs that produce predictable results.
Single-Plane Manifold—In a very real sense, a single-plane manifold, as used
on most V8 engines, is simply a low-profile tunnel ram. The tunnel-ram manifold
(discussed next) is a short-runner system combined with a large common plenum;
a design that optimizes power on all-out racing engines where hood clearance is not
an issue. The single-plane manifold combines short, nearly equal-length runners
with an open plenum, but “lays” the entire configuration flat across the top of the
engine. The results are quite predictable. The runner design prevents full-manifold
resonance. That reduces low-speed torque, and depending on the size of the plenum and runners, single-plane manifolds can also reduce driveability and fuel
Dynomation
engine simu-
A single-plane manifold is
simply a low-profile tunnel
ram. The design combines
short, nearly equal-length
runners with an open
plenum, but “lays” the
entire configuration flat
across the top of the
engine. The single-plane
manifold combines
improved flow capacity,
higher charge density,
and short runners to build
substantial horsepower at
higher engine speeds.
Single-Plane Manifold
Dyno2000 Advanced Engine Simulation—49
Page 50

Single-Plane Manifold Modeling
Single-Plane Pulse Interference
The typically compact, low-
profile design of the single-
plane manifold has some
drawbacks. The runners are
connected to a common
plenum. This arrangement
tends to create unpredict-
able interference effects as
pressure pulses moving
through the runners meet
in the plenum and stir up a
complex soup, sometimes
creating irregular fuel-
distribution.
economy. Furthermore, a large-volume, undivided plenum often contributes to lowspeed performance problems by presenting every cylinder to all barrels of the carburetor, lowering venturi signal and low-speed fuel metering accuracy (again, this
drawback is minimized on fuel-injection systems). On the other hand, the singleplane manifold (like the tunnel ram) combines improved flow capacity, potentially
higher charge density, and short runner lengths to build substantially more horsepower at higher engine speeds.
As a high-performance, high-speed manifold, the single-plane design has many
advantages, however, it’s compact, low-profile design has drawbacks, too. The runners are connected to a common plenum like spokes to the hub of a wheel. This
arrangement tends to create unpredictable interference effects as pressure pulses
moving through the runners meet in the plenum and stir up a complex brew. Large
plenum volumes help cancel some these effects, but open-plenum, single-plane
manifolds may produce unexpected changes in fuel distribution and pressure-wave
tuning with specific camshafts, headers, or cylinder heads (to some degree, these
effects are present in all manifold designs). Predicting these will-o’-the-wisp anomalies requires rigorous modeling. Currently, pinning down these problems requires
dyno testing with exhaust temperature probes to measure fuel distribution accuracy.
Designers and engine testers have experimented with hybrid single-plane manifold designs that incorporate various dual-plane features. One common modification
is dividing the plenum into a pseudo dual-plane configuration. While this does increase signal strength at the carburetor, uneven firing does not allow 2nd degree of
freedom resonance. This modification can cause sporadic resonances to occur
throughout the rpm range with unpredictable results. Spacers between the carburetor and plenum are also commonly used with single-plane manifolds often with
positive results, particularly in racing applications. Spacers typically increase power
for two reasons: 1) By increasing plenum volume they tend to reduce unwanted
pressure-wave interactions, and 2) a larger plenum improves airflow by reducing the
50—Dyno2000 Advanced Engine Simulation
Page 51

Tunnel-Ram Manifold Modeling
angle the air/fuel must negotiate as it transitions from “down” flow through the
carburetor to “side” flow into the ports. While there is no way to use trend testing to
evaluate the effects of a divided plenum, spacers can be partially simulated. The
increase in plenum volume tends to transform the single-plane manifold into a “mini”
tunnel ram, so horsepower gains tend to mimic those obtained by switching to a
tunnel ram design (i.e., performance improvements, when found, usually occur at
high rpm).
Since the single-plane manifold typically reduces low-speed torque and improves
high-speed horsepower, it is often the best compact manifold design for applications
where wide-open-throttle engine speed rarely falls below 4000rpm. If the engine
commonly runs through lower speeds, a dual-plane, individual runner, or tuned-port
injection system will usually provide better performance, driveability, and fuel economy.
Tunnel-Ram Manifold—This intake manifold is a single-plane induction system
designed to produce optimum power on all-out racing engines. The advantages of
the tunnel ram derive from its combination of a large common plenum and short,
straight, large-volume runners. The large plenum has plenty of space for two carburetors, potentially flowing up to 2000+cfm. The large plenum also minimizes pressure-wave interaction and fuel distribution issues. The short runners can be kept
cooler than their lay-flat, single- and dual-plane counterparts, and they offer a straight
path into the ports, optimizing ram-tuning effects.
Applications for the tunnel ram are quite limited because of its large size; vehicles
using tunnel-ram manifolds usually require a hole in the hood and/or a hood scoop
for manifold and carburetor clearance. While a protruding induction system may be
a “sexy” addition to a street rod, in somewhat more compact single-carburetor configurations, the tunnel ram offers very little potential power over a well-designed,
single-plane manifold. Only at very high engine speeds, with multiple carburetors,
This Weiand/Holley BB
Chevy tunnel ram
manifold is a single-
plane induction system
designed to produce
optimum power on all-
out racing engines. It has
a large common plenum
and short, straight, large-
volume runners. The
tunnel ram manifold
menu selection has the
potential to produce the
highest peak horsepower
of all the naturally-
aspirated manifolds
listed in the Induction
menu.
Tunnel-Ram Manifold
Dyno2000 Advanced Engine Simulation—51
Page 52

Individual-Runner Manifold Modeling
Individual Runner Manifold
A manifold that connects each
cylinder to a single carburetor
barrel with no interconnecting
passages for shared flow is
considered an individual (or
isolated) runner system (I.R. for
short). Multiple Weber or Mikuni
carburetor systems are wellknown examples of this type of
induction system. This I.R.
manifold was designed for early
OHC Pontiacs.
will the advantages in the tunnel ram contribute substantially to power.
This tunnel-ram selection can also accurately model fuel-injection systems with
large, individual stacks. Strictly speaking, while the simulation combines short runners and a large-volume plenum, this design mimics short injector stacks that open
to the atmosphere. For one-barrel-per-cylinder Weber carburetion or small-diameter,
individual-injector systems, use the Individual Runner manifold described next. However, for large-diameter injectors, like Hillborn or Crower systems, the tunnel-ram
manifold—along with the appropriate airflow selection (for all cylinders combined)—
is a good induction model.
The tunnel ram manifold has the potential to produce the highest peak horsepower of all the naturally-aspirated manifolds listed in the Induction menu. The large
cross-sectional areas, straight runners, and short tuned lengths make this manifold
a “no compromise” racing design.
Individual Runner—A manifold that connects each cylinder to one “barrel” of
single or multiple carburetors
with no interconnecting passages for shared flow
is
considered an individual (or isolated) runner system (I.R. for short). A multiple Weber
or Mikuni carburetor setup is a well-known example of this type of induction system.
On a V8 engine, four twin-barrel Webers make a very impressive sight, and at first
glance they may appear to offer more airflow potential that any engine needs,
particularly any street engine. While it may look like overkill, the one-barrel-percylinder arrangement often has substantial horsepower limitations due to airflow
restriction! A typical Weber 48IDA carburetor flows about 330cfm per barrel. While
the sum total of all eight barrels is over 2600cfm (a flow rating equivalent to two
Holley Dominators), the important difference here is that each cylinder can draw
from only one 330cfm barrel. In a single- or even a dual-plane manifold, each
cylinder has access to more than one carburetor barrel, reducing restriction during
peak flow and increasing high-speed horsepower. While an I.R. system offers sub-
52—Dyno2000 Advanced Engine Simulation
Page 53

Tuned-Port Injection Manifold Modeling
stantial low-end performance benefits (more on that next), at 5000rpm and higher on
typical smallblock installations, power can fall below the levels of an average single
four-barrel, 780cfm induction system!
Taken as a whole, multiple-carburetor, I.R. induction may seem to offer so much
flow capacity, that it must be plagued with low-speed carburetion problems. Surprisingly, the same one-barrel-per-cylinder arrangement that produces a restriction at
high engine speeds, transmits strong pressure waves to each carburetor barrel at
low speeds, producing ideal conditions for accurate fuel metering. Furthermore, the
pressure waves moving in the runners are not dissipated within a plenum and don’t
interact with other cylinders. This ensures that the reflected waves strongly assist
cylinder filling and reduce reversion. The combination of these effects makes individual-runner manifolds an outstanding induction choice for low-speed to medium/
high-speed engine applications, such as high-performance street engines. Unfortunately, the high cost of these systems—and current emissions regulations—prevents
their wider acceptance.
The simulation model for the Individual Runner choice in the Manifold Type
menu assumes that the runner sizes and the carburetor venturi diameters are of
“medium” dimensions. Runner length, that is, the distance from the valve head to the
top of the carburetors, is also assumed to be “mid-length,” and so the simulation
uses a mid-range rpm power bias. These assumptions work well with most I.R.
applications, since this induction system is commonly used on street engines or in
road-racing applications that require good throttle response and a wide power band.
The I.R. menu selection can also model fuel-injection systems with small-diameter, medium-to-long length individual stacks. For large-diameter, short-length injectors, like drag-racing systems, the tunnel-ram manifold selection provides a better
induction model (see the previous tunnel-ram description).
Tuned-Port Injection Manifold
The TPI manifold was
introduced by
automakers in the mid
1980’s and millions of
them remain on the road
today. It represents the
first mass-produced
induction system that
clearly incorporated
modern wave-dynamic
principals.
Dyno2000 Advanced Engine Simulation—53
Page 54

Sequential-Fire Injection Modeling
Tuned-Port Injection—This manifold was introduced by automakers in the mid
1980’s and millions of them remain on the road today. It represents the first massproduced induction system that clearly incorporates modern wave-dynamic principals. To optimize low-speed torque and fuel efficiency, the TPI manifold has very
long runners (many configurations measure up to 24-inches from valve head to
airbox). The runners on most TPI systems are also quite small in diameter—again,
to optimize low-speed power—and, unfortunately, create considerable restriction at
higher engine speeds. Characteristic power curves from this type of manifold are
slightly to significantly above a dual-plane up to about 5000rpm, then runner restriction and an out-of-tune condition substantially lowers peak power.
The TPI is a single-plane design that functions like a long-runner tunnel ram.
Each runner is completely isolated until it reaches the central plenum. This design
tends to maximize pressure-wave tuning and minimize wave interactions. Since fuel
is injected near the valve, the TPI system delivers precise air/fuel ratios with no fuel
distribution or puddling problems.
There is a wide range of aftermarket parts available for the TPI, including enlarged and/or Siamesed runners, improved manifold bases, high-flow throttle bodies,
and sensor/electronic modifications. The Tuned-Port Injection selection in the Manifold Type menu models a stock TPI. However, increasing the airflow (from the
Induction Airflow menu) makes it possible to model some of the benefits of larger
runners and high-flow throttle bodies.
There are now many “TPI-like” EFI (electronic fuel injection) systems available for
small- and big-block engines. Some of these custom packages are based on a shortrunner tunnel ram model. Do not use the TPI manifold model to simulate these
manifolds, instead, select a single-plane (for small-runner systems) or the sequen-
Many TPI and EFI
(electronic fuel
injection) packages
are based on short-
runner, high-flow
tunnel ram bases and
use sequential-fire
electronic injectors.
Some longer-runner
systems, like this
manifold from Induc-
tion Technology, allow
much greater airflow
than the original
factory TPI and still
provide substantial
low-speed torque.
Model this induction
systems with the
Sequential-Fire
manifold selection.
Sequential-Fire Injection System
54—Dyno2000 Advanced Engine Simulation
Page 55

Forced Induction Modeling
tial-fire manifold (for large-runner packages) to obtain more realistic power curves.
Only choose a TPI manifold when the induction system uses a typical small-diameter, long-runner TPI configuration.
Sequential-Fire Injection—The sequential-fire injection manifold models the current
state-of-the-art in high-performance manifolds used on many street muscle cars and
in some racing applications. Aside from the near perfect fuel distribution provided by
sequential injectors, this manifold model is, typically, built around a “tunnel ram”
design, with larger and shorter runners than a TPI.
The torque produced by this design is somewhat lower than long-runner TPI in
the low rpm ranges, but higher than you might expect since the fuel delivery is so
precise. The sequential-fire system really shines at higher engine speeds. Large
cross-sectional area, short runners promote cylinder filling and increase horsepower.
FORCED INDUCTION MENUS
The Forced Induction choice included in the Manifold Type menu considerably
expands the modeling power of the Dyno2000. In an instant, you can add a positive
displacement Roots-type blower, a centrifugal blower (like a Paxton or Vortech), or
a turbocharger to any engine. In addition, you can vary maximum boost—or blowoff (wastegate) pressure—pulley ratios, and you can even change blower pressure
Forced Induction Menus
The Dyno2000 includes nearly 100
forced induction choices (Turbos, shown
here, Centrifugal, and Roots blowers).
Selecting a supercharger from any of the
three submenus will load the specifications for that device into the INDUCTION
category. You may edit these values at
any time to determine their affect on
engine power. In addition, you can select
Custom from the bottom of any of the
supercharger menus and directly enter
of all supercharger specifications.
Dyno2000 Advanced Engine Simulation—55
Page 56

Forced Induction Modeling
Belt Gear Ratio
Both centrifugal and roots blowers
are mechanically driven by the
engine. The Belt Gear Ratio (external
drive) is the mechanical connection
between the engine crankshaft rpm
and blower input rpm. This bigblock
Chevy pulley setup provides a slight
overdrive (a Belt Ratio of 1.20:1).
ratios, surge cfm, and more. And finally, you can test the effects of an intercooler
on any of the forced-induction systems.
Because a positive-pressure induction system changes the flow dynamics within
the engine, forced induction cannot be used with other manifold types. And, as is
detailed in the next section, the exhaust system choices are also overridden with a
Forced Induction Exhaust display. The modeling applied to both the intake and
exhaust systems for forced induction will simulate many free-flowing, high-performance designs. The exhaust model is designed to simulate open exhaust, or at least
a low-restriction muffler system with large diameter tubing.
Selecting Forced Induction activates the lower half of the INDUCTION category.
Double-click on the Blower field to open a menu containing Turbocharger, Centrifugal, and Roots blower choices. Select from any of the nearly 100 forced induction
devices. Specific fields will become active depending on the type of supercharger
that was selected. Here is a quick overview of these fields, the superchargers to
which they apply, and how they affect forced induction performance:
INDUCTION Category With Forced Induction
56—Dyno2000 Advanced Engine Simulation
The INDUCTION Category
displays naturally-aspirated and forced-induction
selections. Directly click
on any field to change
values and evaluate the
effects on power, torque,
and manifold pressure.
Page 57

Forced Induction Modeling
Intercooler Menu
The Dyno2000 includes
an intercooler model that
can be used with any
forced induction system.
An intercooler reduces
induction temperatures
from compressing the
intake charge that,
otherwise, can substantially reduce performance.
Flow—(Turbos, Centrifugals, Roots) This is the flow rate at which the supercharger
is most efficient, also called the Island Flow. Typically, the smaller the turbo the
lower the Island Flow. Small turbos will spin up faster but have lower overall flow
potential.
Pressure Ratio—(Turbos, Centrifugals) This is the ratio of compressor pressures at
the Island flow point (ambient vs. output). The higher this number, the more
efficient the device performs as an “air compressor.” Roots blowers are a positivedisplacement device, so pressure ratio, as used here, does not apply.
Boost Limit—(Turbos, Centrifugals, Roots) This is the pressure at which the
wastegate or blow-off valve is activated, maintaining induction pressure at or
below this value.
Speed—(Centrifugals) This value is the rotational speed (rpm) at which centrifugal
superchargers reaches peak efficiency. There is a similar speed value applicable
to turbochargers, however, the model currently incorporated in the Dyno2000
does not support this variable for turbochargers.
Belt Gear Ratio—(Centrifugals, Roots) Both centrifugal and roots blowers are me-
chanically driven by the engine. The Belt Gear Ratio (external) is the mechanical
connection ratio between the engine crankshaft rpm and blower input rpm. This
value is multiplied by the Internal Gear Ratio on centrifugal superchargers to
determine internal rotor speed.
Surge Flow—(Turbos) The surge flow is the airflow within the Island (most efficient)
pressure ratio at which turbocharger flow and internal momentum can “resonate”
and produce a pulsing in the induction system. This phenomenon reduces efficiency and engine power output, and it can even damage the turbocharger.
Dyno2000 Advanced Engine Simulation—57
Page 58

Intercooler Modeling
Efficiency—(Turbos, Centrifugals, Roots) This is a measure of the power consumed
by the supercharger compared to the increase in induction pressure at the point
of highest efficiency. Roots blowers are often the least efficient, however, they
generally deliver substantial induction pressure increases at low speeds. On the
other hand, centrifugal and especially turbochargers are more efficient, but re-
quire more time to “spin up” to an efficient operating speed.
Internal Gear Ratio—(Centrifugal) Centrifugal superchargers are driven by a me-
chanical connection to the engine crankshaft. Internal rotor speed is increased by
the external Belt Gear Ratio (described earlier), but this speed increase is not a
sufficient for most centrifugal superchargers to reach their optimum operating
speeds (35,000rpm and higher). An internal gear train is commonly used to fur-
ther increase rotational speed. The ratio of this internal gearing determines how
much faster the turbine rotates over input-shaft rpm. To determine the internal
speed of the centrifugal turbine, multiply crankshaft rpm by the Belt Gear Ratio,
then multiply that by the Internal Gear Ratio.
Selecting a supercharger listed in any of the three submenus will load the specifications for that device into the INDUCTION category. You may edit these values
at any time to determine their effect on engine power. In addition, you can select
Custom from the bottom of any of the supercharger menus. This option permits
direct entry of all supercharger specifications.
Intercoolers
One of the drawbacks to any method of supercharging is increased induction
temperatures. High boost pressures can quickly raise charge temperatures more
than 200-degrees(F)! These higher temperatures, common on blowers with pressure
ratios of 2.0 or higher, can cost more than lost horsepower. Higher temperatures can
lead to detonation, increase in octane requirements, and a required reduction in
overall ignition timing advance. While induction cooling can improve performance
directly from increased charge density (more oxygen and fuel per volume of inducted
charge), the additional benefits of reduced detonation and increased reliability make
charge cooling an attractive addition to any supercharged high-performance or racing engine.
Charge cooling is accomplished much in the same way that heat is removed from
the engine itself. A radiator, called an intercooler, is placed in the air ducting between the supercharger and the intake manifold. Everything from ducted outside air
to ice water and even evaporating pressurized liquefied gas (like Freon or nitrous
oxide) have been used to remove heat from an intercooler. The average efficiencies
for these devices are:
Air-To-Air 25%, Air-To-Cooler Ducted Air 50%
Air-To-Water 75%, Air-To-Cooled Water 100%
58—Dyno2000 Advanced Engine Simulation
Page 59

Exhaust System Modeling
Exhaust System Menu
Flow restriction (back pressure) is accurately modeled
using “pressure-drop” techniques. The Dyno2000 can
accurately predict engine
power changes from various
exhaust manifolds and headers of large and small tubing
diameters (sizes are relative to
the engine under test).
Air-To-Ice Water 120%, Air-To-Evaporating Liquid 120+%
The Dyno2000 includes an intercooler model that can be activated with any
forced induction system. Simply double-click on the Intercooler field and select an
intercooler efficiency from the drop-down list (or directly enter a custom value).
Note: When methanol evaporates it cools the intake charge more than gasoline (the
latent heat of vaporization of methanol is greater than gasoline). Therefore, intercooling
is somewhat less effective with methanol.
THE EXHAUST MENU
The EXHAUST category establishes an exhaust manifold or header configuration
for the simulated test engine. The menu includes seven selections, four of which
include mufflers. Since the Dyno2000 is designed to simulate the power levels for
an engine mounted on a dyno testing fixture, the exhaust system for muffled engines
The first choice in the Exhaust
menu simulates typical,
production, cast-iron, “log-
type” exhaust manifolds,
where all ports connect at
nearly right angles to a
common “log” passage. These
manifolds are designed to
provide clearance for various
chassis and engine compo-
nents and provide much less
than optimum exhaust flow.
Stock Exhaust System Manifolds
Dyno2000 Advanced Engine Simulation—59
Page 60
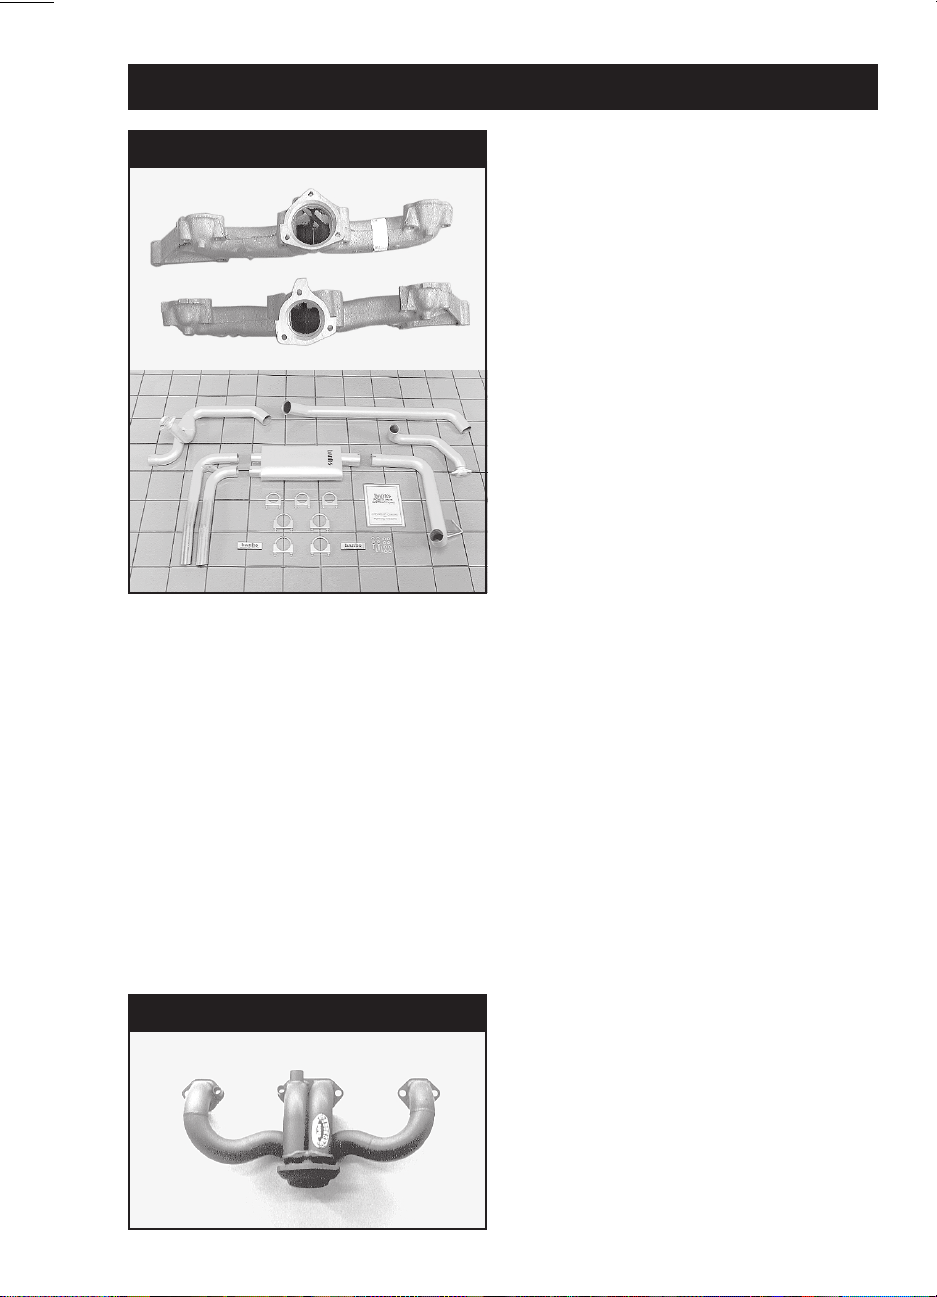
Exhaust System Modeling
HP Manifolds And Mufflers
The HP Manifolds And Mufflers
exhaust-system choice offers a
measurable improvement over the
stock-exhaust selection. High-performance exhaust manifolds are designed to improve exhaust gas flow
and reduce system restriction. They
are usually a “ram-horn” or other
“sweeping” design with fewer sharp
turns and larger internal passages.
The connecting pipes to the mufflers
are large diameter and the mufflers
generate less back pressure.
ends at the outlet of the muffler and does not include additional tubing commonly
used to route exhaust gasses to the rear of a vehicle.
Each of the exhaust system selections apply a unique tuning model within the
simulation. (Refer to the complete
ware for a more rigorous look at the theory of exhaust-system tuning.)
DeskTop Dynos
book available from Motion Soft-
Exhaust Menu Selections
The exhaust system—perhaps more than any other single part of the IC engine—
is a virtual “playground” for high-pressure wave dynamics. These interactions can be
solved only by sophisticated, computationally-intensive methods that are only partially modeled in the Dyno2000 (a much more detailed modeling of these interactions
is done in the
Custom “Manifolds”
Dynomation
engine simulation series available from Motion Software
Here are excellent examples of highperformance “manifolds” from Hooker
Headers. The low-restriction manifolds fit
1992-1995 Corvettes with an LT1 engine.
When used with mufflers, model this
system using the H.P. Manifolds And
Mufflers menu choice.
60—Dyno2000 Advanced Engine Simulation
Page 61

Exhaust System Modeling
in 2001). While flow restriction (back pressure) is accurately modeled using “pres-
sure-drop” techniques, the Dyno2000 does not resolve specific header dimensions.
However, the Dyno2000 can accurately predict engine power changes from various
exhaust manifolds and headers of large and small tubing diameters (sizes relative
to the displacement of the engine under test).
The exhaust menu choices are described in the following sections. Use this
information to make the most appropriate choice for your test engine.
Stock Manifolds And Mufflers—The first choice in the Exhaust menu simulates
the most restrictive exhaust system. It assumes that the exhaust manifolds are a
typical, production, cast-iron, “log-type” design, where all ports connect at nearly
right angles to a common log passage. These manifolds are designed more to
minimize clearance problems with various chassis and engine components than to
optimize exhaust flow. Exhaust manifolds of this type have widespread application
on low-performance production engines.
The
Stock Manifolds And Mufflers
are connected to twin mufflers with short sections of pipe. Because the engine
environment is a simulated dyno cell, the exhaust system terminates at the muffler
outlets.
The exhaust manifolds and mufflers cancel all scavenging effects, and the system
is a completely “non-tuned” design. Any suction waves that might be generated are
fully damped or never reach the cylinders during valve overlap. The restriction created by this system mimics most factory muffler and/or catalytic-converter-with-muffler combinations. Back pressure levels in the exhaust system nearly cancel the
blowdown effects of early EVO timing and increase the pumping work losses during
the exhaust cycle.
selection assumes that the exhaust manifolds
H.P. Manifolds And Mufflers—This choice offers a measurable improvement
over the stock exhaust system modeled in the previous selection. The high-performance exhaust manifolds simulated here are designed to improve exhaust gas flow
and reduce system restriction. They are usually a “ram-horn” or other “sweeping”
design with fewer sharp turns and larger internal passages. The connecting pipes to
the mufflers are large diameter and the mufflers generate less back pressure and
produce more noise.
While this system is a “high-performance” design, it offers no tuning effects and
all suction waves are fully damped or never reach the cylinders during valve overlap.
All performance benefits from this selection are due to a decrease in passage
restrictions and lower system back pressure. System pressure levels mimic factory
high-performance mufflers and/or catalytic-converter with muffler combinations. This
exhaust system may allow some benefits from early-EVO timing blowdown effects
(depending on the engine component combination) and overall pumping work losses
are slightly reduced by lower back pressures.
IMPORTANT NOTE ABOUT ALL HEADER CHOICES:
Some engines, in particular,
Dyno2000 Advanced Engine Simulation—61
Page 62

Exhaust System Modeling
Small Tube Headers
This is the first exhaust-system
selection that begins to harness
the tuning potential of wave
dynamics in the exhaust system.
While the system pictured here is
not a “true” header, this tubular
exhaust system from Edelbrock
for late model cars and trucks
offers some wave-dynamic
scavenging.
4- or 2-cylinder applications, can develop a “full resonance” in the exhaust system—
refer to the previous discussion of dual-plane manifolds for information about “full”
induction system resonance. This phenomenon can derive scavenging benefits (although some studies have revealed that the benefits are relatively small) from suction waves created in the collector by adjacent cylinders. These “one-cylinder-scavenges-another” tuning techniques are not modeled in the Dyno2000 simulation.
Instead, the headers are assumed to deliver a scavenging wave only to the cylinder
that generated the initial pressure wave.
Note About Tubing Sizes For All Header Choices: The following rules of thumb
give approximations of tubing diameters used by the simulation: Headers with tubes
that measure 95% to 105% of the exhaust-valve diameter are considered “small” for
any particular engine; tubes that measure 120% to 140% of the exhaust-valve diameter are “large” tube headers.
Small Tube Headers With Mufflers—This is the first component selection that
begins to harness the tuning potential of wave dynamics in the exhaust system.
These simulated headers have primary tubes that individually connect each exhaust
port to a common collector. The collector—or collectors, depending on the number
of cylinders—terminates into a high-performance muffler(s). Suction waves are created in the collector, but are somewhat damped by the attached muffler.
Note: Since exact tubing lengths are not simulated, the program assumes that the
primary tube will deliver the scavenging wave to the cylinder during the valve-overlap
period. The primary tubes modeled by this Exhaust menu selection are considered
“small,” and should be interpreted to fall within a range of dimensions that are
commonly associated with applications requiring optimum power levels at or below
peak-torque engine speeds. These headers typically show optimum benefits on
smaller displacement engines, and may produce less power on large displacement
62—Dyno2000 Advanced Engine Simulation
Page 63

Exhaust System Modeling
Large Tube Headers
Typical large-tube headers
are designed for highperformance street and
racing applications in mind.
The better pieces have 3- to
4-inch collectors and 1-3/4- to
2-3/8-inch primary tubes
(depending on whether they
were designed for
smallblocks or bigblocks).
engines.
Small-Tube Headers Open Exhaust—This menu selection simulates headers
with “small” primary tubes individually connecting each exhaust port to a common
collector. The collector—or collectors, depending on the number of cylinders—termi-
nates into the atmosphere. Strong suction waves are created in the collector that
provide a substantial boost to cylinder filling and exhaust gas outflow. Since exact
tubing lengths are not simulated, the program assumes that the primary tube will
deliver the scavenging wave to the cylinder during the valve-overlap period.
The primary tubes modeled by this menu selection are considered “small,” and
should be interpreted to fall within a range of dimensions that are commonly associated with applications requiring optimum power levels at or slightly above peaktorque engine speeds. These headers show benefits on smaller displacement engines but may produce less power on large-displacement, big-block engines.
Large-Tube Headers With Mufflers—This menu selection simulates headers
with “large” primary tubes individually connecting each exhaust port to a common
collector. The collector—or collectors, depending on the number of cylinders—termi-
nates into a high-performance muffler(s). Suction waves are created in the collector,
but are somewhat damped by the attached muffler.
The primary tubes modeled by this menu selection are considered “large,” and
should be interpreted to fall within a range of dimensions that are commonly associated with applications requiring optimum power at peak engine speeds. These
headers typically show benefits on high-rpm racing smallblocks or large displacement engines. These headers may produce less power on small-displacement engines operating in the lower rpm ranges.
Large-Tube Headers Open Exhaust—This menu selection simulates headers
with “large” primary tubes individually connecting each exhaust port to a common
Dyno2000 Advanced Engine Simulation—63
Page 64

Exhaust System Modeling
collector. The collector—or collectors, depending on the number of cylinders—termi-
nates into the atmosphere. Strong suction waves are created in the collector that
provide a substantial boost to cylinder filling and exhaust gas outflow.
The primary tubes modeled by this menu selection are considered “large,” and
should be interpreted to fall within a range of dimensions that are commonly associated with applications requiring optimum power at peak engine speeds. These
headers typically show benefits on high-rpm racing smallblocks or large displacement big-block engines. These headers may produce less power on small-displacement engines, particularly those operating in the lower rpm ranges.
Large Stepped-Tube Race Headers—This menu selection simulates headers
with “large” primary tubes individually connecting each exhaust port to a common
collector. Each primary tube has several transitions to slightly larger tubing diameters as it progresses towards the collector. These “steps” can reduce pumping work
and improve horsepower as described below. The collector—or collectors, depending on the number of cylinders—terminates into the atmosphere. Strong suction
waves are created in the collector that provide a substantial boost to cylinder filling
and exhaust gas outflow.
The “stepped” design of the primary tubes can reduce pumping work on some
engines. As high-pressure compression waves leave the port and encounter a step
in the primary tube, they return short-duration rarefaction waves. These low-pressure
“pulses” moves back up the header and assists the outflow of exhaust gasses. When
rarefaction waves reach the open exhaust valve, they help depressurize the cylinder
and lower pumping work. This can generate a measurable increase in horsepower
on large displacement and/or high-rpm engines.
The primary tubes modeled by this menu selection are considered “large,” and
Large Tube Stepped Racing Headers
64—Dyno2000 Advanced Engine Simulation
Large-tube stepped headers have
large-diameter primary tubes with
several transitions to slightly
larger tubing diameters. These
“steps” can reduce pumping work
and improve horsepower on large
displacement and/or high-rpm
applications. These Hooker
ProStock BB Chevy headers have
2-3/8-inch primary tubes that step
to 2-1/2-inch by the time they
reach the 4-1/2-inch collectors.
Page 65

Camshaft Modeling
Camshaft Menu
The Dyno2000 can test the
effects of cam timing changes
in seconds. Several cam profiles are included in the dropdown menu, and you can easily
input any custom timing and
valve lift specs. Test cams from
manufacturer catalogs or load
camfiles directly from the
Motion Software CamDisk™
containing over 1200 read-totest cams.
should be interpreted to fall within a range of dimensions that are commonly associated with applications requiring optimum power at peak engine speeds.
CAMSHAFT MENU
The final component category allows the selection of the single most important
part in the IC engine: the camshaft. For many enthusiasts and even professional
engine builders, the subtleties of cam timing defy explanation. The reason for this
confusion is understandable. The camshaft is the “brains” of the IC engine, directing
the beginning and ending of all four engine cycles. Even with a good understanding
of all engine systems, the interrelatedness of the physics within the IC engine can
make the results of cam timing changes read like a mystery story. In many cases
there are only two ways to determine the outcome of a modification: 1) run a real
dyno test or 2) run a simulation. Since the camshaft directly affects several functions
at once, e.g., exhaust and intake scavenging, induction signal, flow efficiency, cylinder pressures, etc., using a computer-based engine simulation program is often
the only way to accurately
predict
the outcome.
The Dyno2000 makes it possible to test the effects of cam timing in seconds. The
The best way to visualize
camshaft timing is to use
this “twin-hump” event
drawing. It shows valve
motion for the exhaust
lobe on the left and the
intake lobe on the right,
positioning the valve
overlap and TDC at the
center. Study this
picture. It will help you
quickly evaluate cam
timing specs and visual-
ize how they relate to
one another.
Valve Motion Diagram
180
.500
.450
.400
.350
.300
.250
.200
.150
.100
.050
.000
VALVE MOTION CURVES
220260300 60 100 140
BDC
Exhaust
Centerline
020
60100140
40 40
TDC
INTAKE EXHAUST
IVO IVCEVO EVC
Intake
Centerline
ICAECA
Dyno2000 Advanced Engine Simulation—65
180
BDC
220 260 30020
60° ABDC24° ATDC24° BTDC60° BBDC
Page 66

Camshaft Modeling
Valve Lift Menu
Selecting (placing a check mark next
to) Auto Calculate Valve Lift will
automatically calculate appropriate
valve lifts for camshafts listed in the
Camshaft Type drop-down menu. To
manually select valve lift from the
drop-down menu, or to directly enter
a custom value, make sure that the
Auto Calculate Valve Lift feature is
turned off (no check mark next to
Auto Calculate).
ability of the program to take multiple elements into consideration and “add up the
effects over time” is key to analyzing the effects of camshaft timing changes.
Cam Basics
In the simplest terms, the camshaft is a straight steel or iron shaft with eccentric
lobes. It is connected to the crankshaft with a chain or gear train and is usually
rotated at one-half crank speed. Lifters (or cam followers)—and in the case of inblock cam locations, pushrods, and rockerarms—translate the rotary motion of the
cam into an up-and-down motion that opens and closes the intake and exhaust
valves. This entire assembly must function with high precision and high reliability.
The camshaft is a round shaft
incorporating cam lobes. The base
circle diameter is the smallest
diameter of the cam lobe. Clearance
ramps form the transition to the
acceleration ramps. The lifter
accelerates up the clearance ramp
and continues to rise as it ap-
proaches the nose, then begins to
slow to a stop as it reaches maxi-
mum lift at the lobe centerline.
Maximum lifter rise is determined by
the height of the toe. Valve-open
duration is the number of
crankshaft
degrees that the valve or lifter is
held above a specified height
(usually 0.006-, 0.020-, or 0.050-inch).
A symmetric lobe has the same lift
curve for opening and closing.
66—Dyno2000 Advanced Engine Simulation
Cam Basics
Nose or Toe
Clearance
Ramp
V
e
v
l
a
n
e
p
O
-
Lobe Centerline
Closing
Acceleration
R
o
t
t
a
Base Circle
Diameter
D
u
r
Opening
Aeceleration
n
o
i
a
t
i
o
n
Lifter
Rise
Clearance
Ramp
Foot or
Heel
Page 67

Camshaft Modeling
Common “Cam Card” Timing
Before engine simulations were widely used,
cam manufacturers
established a methodology for identifying
and classifying camshafts. Unfortunately,
these “catalog” specs
place the emphasis on
the span between the
valve events rather
than on the events
themselves.
Street engines driven hundreds-of-thousands of miles operate their valvetrain components
billions of cycles
. If the overall camshaft and valvetrain design is good, a
precision micrometer will detect only negligible wear.
The camshaft controls the valve opening and closing points by the shape and
rotational location of the lobes. Most cams are ground to a precision well within one
crankshaft degree, ensuring that the valves actuate exactly when intended. Timing
variations of several degrees can develop in the cam drive, especially in chain-drive
systems, but racing gear drives reduce variations to within one or two crank degrees
of indicated timing. Camshaft lobes also determine how far the valves will lift off of
the valve seats by the height of the lobes (heal to toe height) and the multiplying
ratio of the rockerarms (if used). The rates at which the valves are accelerated open
and then returned to their seats are also “ground into” cam lobe profiles. Only a
limited range of contours will maintain stable valve motion, particularly with high-lift,
racing profiles. Unstable profiles or excessive engine speed will force the valvetrain
into “valve float,” leading to rapid component failure.
Valve Events
There are six basic cam timing events ground into the lobes of every camshaft.
These timing points are:
1—Intake Valve Opening (IVO) 2—Intake Valve Closing (IVC)
3—Exhaust Valve Opening (EVO) 4—Exhaust Valve Closing (EVC)
5—Intake Valve Lift 6—Exhaust Valve Lift
These six points can be “adjusted” somewhat (we’ll discuss which and how cam
timing events can be altered in the next section), but for the most part they are fixed
by the design of the cam. Other timing numbers are often discussed, but they are
always derived from the basic six events. Derivative events are:
7—Intake Duration 8—Exhaust Duration
9—Lobe Center Angle (LCA) 10—Valve Overlap
11—Int. Center Angle (ICA) 12—Exh. Center Angle (ECA)
Dyno2000 Advanced Engine Simulation—67
Page 68

Camshaft Modeling
The first four basic timing points (IVO, IVC, EVO, EVC) pinpoint the “true” beginning and end of the four engine cycles. These valve opening and closing points
indicate when the function of the piston/cylinder mechanism changes from intake to
compression, compression to power, power to exhaust, and exhaust back to intake.
For much more in-depth information about cam timing, refer to the complete book
DeskTop Dynos
The Camshaft menu contains five camshaft “grinds” that are listed by application:
1)
Stock Street/Economy Profile
pose Street/Track Profile
Speed Profile
applied to these cam profiles, adjusting the acceleration rates from mild to very
aggressive. When any of these cam profiles are selected, the seat-to-seat IVO, IVC,
EVO, EVC, Intake Centerline, Intake Lobe Center Angle, Intake Duration, and Exhaust Duration are loaded into the CAMSHAFT category along with the camshaft
description. Valve lifts can be manually entered or automatically calculated by the
program (refer to the following Notes).
available from Motion Software.
Camshaft Menu Choices
, 2)
High Performance Street Profile
, 4)
Drag-Race/Circle-Track Profile
. Any of the three lifter types (described later in this chapter) can be
, and 5)
, 3)
Dual Pur-
Drag-Race High-
Note 1:
Camshaft Type
The
intake
ISKY Cam Catalog
and
exhaust valve lifts
for any of the camshafts listed in the
drop-down menu can be automatically calculated if you choose
CamDisk™ With 3500+ Camfiles
The new CamDisk2™ from Motion Software includes over 3500 camfiles with application info. It’s the fastest way to load
and test cams in the Dyno2000.
Several of the “generic” grinds included
in the Dyno2000 Camshaft menu were
modeled after profiles from the ISKY
CAMS catalog.
68—Dyno2000 Advanced Engine Simulation
Page 69

Camshaft Modeling
Developing Valve Motion Curves
Calculated
Lobe
Centerline
(assuming
symmetric
profile)
Lifter
Rise
The Dyno2000 models symmetric valve
motion curves from six data points,
three for each lobe: 1) the opening point,
2) the closing point, and 3) the point of
maximum lobe lift. Although some cam
grinds are asymmetric, performance
differences between a symmetric model
and actual asymmetric valve motion is
quite small.
Auto Calculate Valve Lift
available from either
Closing
Point
R
n
o
o
i
t
t
a
Lobe Profiles Are Calculated
From Opening Point, Closing Point,
And Lifter Rise
Valve Lift
menu (intake or exhaust).
Opening
Point
Calculated valve lifts are based on the valve-head diameters and camshaft timing.
The auto-lift calculation feature will be suspended and, instead, permanent lift values
will be used for any camshaft when you re-select
Auto Calculate Valve Lifts
to
“uncheck” the feature (turn it off).
Note 2:
If
valve diameters
are also being automatically calculated by the Dyno2000
(see page 29)—cylinder-bore diameter and a cylinder head selection must be complete before the program can calculate valve diameters and, consequently, valve
lifts.
Stock Street/Economy Profile—This first cam selection is designed to simulate
a typical factory-stock cam. All cam timing events displayed are seat-to-seat measurements.
The EVO timing maintains combustion pressure late into the power stroke and
early IVC minimizes intake flow reversion. Late IVO and early EVC produce only 22
degrees of overlap, enough to harness some scavenging effects but restricted enough
to prevent exhaust gas reversion into the induction system. The characteristics of
this cam are smooth idle, good power from 1000 to 4500rpm, and good fuel economy.
This cam works well in high-torque demand applications. The
Profile
cam is typically used with hydraulic lifters.
Stock Street/Economy
High Performance Street Profile—This profile is designed to simulate a high-
performance “street” camshaft. All cam timing events displayed in the CAMSHAFT
category are seat-to-seat measurements.
This camshaft uses relatively-late EVO to fully utilize combustion pressure and
Dyno2000 Advanced Engine Simulation—69
Page 70

Camshaft Modeling
early IVC minimizes intake flow reversion. IVO and EVC produce 62 degrees of
overlap, a profile that is clearly intended to harness exhaust scavenging effects. The
modestly-aggressive overlap allows some exhaust gas reversion into the induction
system at lower engine speeds, affecting idle quality and low-speed torque. The
characteristics of this cam are fair idle, good power from 1500 to 6000rpm, and good
fuel economy. This cam develops considerable power at higher engine speeds. The
High Performance Street Profile
lifters, and the simulation will accurately model this cam with any lifter-acceleration
rate (choose hydraulic lifters for increased driveability and solid or roller lifters for
more high-performance oriented applications). This cam is nearly identical to the
ISKY Hi-Rev Flat-Tappet
Dual Purpose Street/Track Profile—This profile is designed to simulate a high-
performance aftermarket camshaft. All cam timing events displayed are seat-to-seat
measurements.
EVO timing on this camshaft is beginning to move away from specs that would
be expected for optimum combustion pressure utilization, with more of an emphasis
on blowdown and minimizing exhaust-pumping losses. The later IVC attempts to
strike a balance between harnessing the ram effects of the induction system while
minimizing intake flow reversion. IVO and EVC produce 64 degrees of overlap, a
profile designed to harness exhaust scavenging. The modestly aggressive overlap
allows some exhaust gas reversion into the induction system at lower engine speeds,
affecting idle quality and low-speed torque. The characteristics of this cam are lopey
idle, good power from 2500 to 6500rpm, and modest fuel economy. This cam develops considerable power at higher engine speeds and is especially effective in
lightweight vehicles. This
hydraulic, solid, or roller lifters, and the simulation will accurately model this cam with
any lifter-acceleration rate (choose hydraulic lifters for more street-oriented applications and solid or roller lifters for more high-performance oriented applications). The
profile of this cam is nearly identical to the
cam part 201025.
Dual Purpose Street/Track Profile
choice can be used with hydraulic, solid, or roller
choice can be used with
ISKY Hydraulic Series
cam part 201281.
Drag-Race/Circle-Track Profile—This profile is designed to simulate a compe-
tition aftermarket camshaft. All cam timing events displayed are seat-to-seat measurements.
EVO timing on this racing camshaft places less emphasis on utilizing combustion
pressure and more emphasis on beginning early blowdown to minimize exhaustpumping losses. The later IVC attempts to strike a balance between harnessing the
ram effects of the induction system while minimizing intake flow reversion. IVO and
EVC produce 90 degrees of overlap, intended to optimize exhaust scavenging effects. This aggressive overlap is designed for higher engine speeds with open headers and allows exhaust gas reversion into the induction system at lower rpm, affecting idle quality and torque below 3500rpm. The characteristics of this cam are very
lopey idle, good power from 3600 to 7600rpm, with no consideration for fuel economy.
This cam develops substantial power at higher engine speeds and is especially
70—Dyno2000 Advanced Engine Simulation
Page 71

Camshaft Modeling
effective in lightweight vehicles. The
used with solid or roller lifters, and the simulation will accurately model this cam with
either lifter-acceleration rate (choose solid lifters for less valvetrain punishing applications and roller lifters for higher power drag-racing applications). The profile of this
cam is similar to the
Drag-Race High-Speed Profile—This profile is designed to simulate an all-out
competition aftermarket camshaft. All cam timing events displayed are seat-to-seat
measurements.
All timing events on this camshaft are designed to optimize power on large displacement engines at very high engine speeds with large-tube, open headers, and
high compression ratios. This camshaft may not be effective in small displacement
engines. EVO timing on this racing profile places the utilization of combustion pressure on the “back burner” and focuses emphasis on beginning early blowdown to
minimize pumping losses during the exhaust stroke. This technique will help power
at very high engine speeds, especially on large-displacement engines that do not
easily discharge the high volume of exhaust gasses they produce. The late IVC
attempts to harness the full ram effects of the induction system while relying on
intake pressure wave tuning to minimize intake-flow reversion. IVO and EVC produce 104 degrees of overlap, a profile that is clearly intended to utilize exhaust
scavenging effects. This very aggressive overlap seriously affects idle quality and
torque below 4000rpm. The characteristics of this cam are extremely lopey idle,
good power from 4500 to 8500+rpm, with no consideration for fuel consumption.
This
Drag-Race High-Speed Profile
this cam is similar to
ISKY Oval Track Flat Tappet Series
ISKY Roller Series
Drag-Race/Circle-Track Profile
cam part 201555.
is typically used with roller lifters. The profile of
cam part 201600.
choice can be
Note: Each of the previous application-specific cams can be modified in any way by
directly entering valve-event or other cam-timing specs (more on this in the next few
sections).
LIFTER MENU
The Dyno2000 uses sophisticated modeling to simulate camshaft and valvetrain
motion, but you should keep in mind that valve motion curves for both the intake and
exhaust valves are being calculated from only six data points, three for the intake
valve and three for the exhaust valve.
The three points for each simulated motion curve are the opening point, closing
point, and the maximum lobe lift. From these points, and the lifter-type selection, the
program creates motion curves that pinpoint valve lifts at each degree of crank
position. While the results are remarkably accurate, the Dyno2000 cannot model
subtle differences between cam grinds that use the same event timing and valve lift
specs. Furthermore, the Dyno2000 develops a symmetric valve motion curve (meaning that the “opening” side of the lobe has an identical shape as the “closing” side).
Asymmetric modeling is impossible with only three data input points, luckily, perfor-
Dyno2000 Advanced Engine Simulation—71
Page 72

Camshaft Modeling
Lifter Menu
The Dyno2000 uses increasing
valvetrain acceleration to model
hydraulic, solid, and roller-lifters.
This is a good assumption, since
most cam profiles have predictable valve acceleration rates.
However, some roller-lifter street
cams do not to have high acceleration, but instead use roller
lifters to optimize reliability. Refer
to the accompanying text for help
in selecting a lifter choice.
mance differences between symmetric and asymmetric valve motions are often quite
small.
The Lifter menu offers three choices. Each choice instructs the simulation to
apply a unique “ramp-rate” model to the valve motion curve:
Hydraulic Flat-Tappet Lifters—The lowest acceleration is assigned to the first
menu choice. Hydraulic lifters incorporate a self-adjusting design that maintains
zero lash in the valvetrain. They are well-known for providing quiet, trouble-free
operation in mild- to high-performance street engines. Hydraulic, flat-tappet cam
profiles usually generate low acceleration rates to optimize valvetrain reliability and
extend engine life.
Solid Flat-Tappet Lifters—The next highest acceleration rate is assigned to
Solid Lifters. These lifters incorporate no lash adjusting mechanism and require an
operating clearance (or lash) in the valvetrain, usually 0.020- to 0.030-inch. Clearance is typically adjusted at the rockerarm or with spacers in the case of overhead
cams with cam followers. Solid lifter cams are often ground with faster acceleration
rate ramps, generate more valvetrain noise and wear, and are designed for performance-oriented applications. These characteristics are used by the Dyno2000 to
derive a more aggressive valve-motion curve.
Roller Solid Or Roller Hydraulic Lifters—The highest acceleration rates are
applied to Roller Lifters. This choice generates very aggressive ramp acceleration
rates and derives valve motion curves appropriate for most high-performance and
racing, roller-lifter camshafts.
Note: Please refer to the next section for additional information on selecting the
proper lifter choice for your application, especially for roller-lifter camshafts.
Making The Best Lifter Choice
The simulation uses increasing valvetrain acceleration to model hydraulic, solid,
72—Dyno2000 Advanced Engine Simulation
Page 73

Camshaft Modeling
Basic Lifter Choices
Street/Mild
Performance
Check Valve
Lifter Body
Lifter Face
R
o
t
a
n
t
i
o
High Perf./
Racing
R
o
t
a
n
t
i
o
High/Perf.
All-Out Racing
R
o
t
a
n
t
i
o
Hydraulic Lifter
Lifter Face
Solid Lifter
Lifter Body
Roller Bearings
Lifter Cam Roller
Roller Lifter
Metering Valve
Adjusting
Oil
Cavity
Oil Inlet
Lifter Body
Check Valve
Adjusting
Oil
Cavity
Pushrod Seat
Oil Inlet
Retaining Ring
Pushrod Seat
Oil Metering
Valve
Pushrod Seat
Metering Valve
Oil Inlet
Retaining Ring
Retaining Clip
and finally roller-lifter camshafts. This is
a good assumption, since cams typically
use lifters that are suited for the intended
application, and cam profiles for specific
applications typically apply predictable
valve acceleration rates. However, this
is not always the case. For example,
some camshafts available for mild street
engines use roller lifters, not to achieve
high valve acceleration rates, but to optimize reliability. In these cases, choosing roller lifters will produce optimistic
simulated power curves. So, to improve
program accuracy, ask yourself if the
camshaft you are modeling fits the following application-specific description
before you make a lifter selection:
Menu Choice Application
Hydraulic Flat-Tappet Street/Mild Perf.
Solid Flat-Tappet HP/Mild Racing
Roller Very HP/Racing
If the cam you’re modeling is a rollerlifter grind but incorporates a mild-street
profile, select
pets
from the menu, since this choice
Hydraulic
or
Solid Flat-Tap-
will produce a lift curve that best matches
a mild street camshaft. On the other
hand, if the cam is a high-performance—
or high acceleration—grind, select
Lifters
since this will model the faster ac-
Solid
celeration rates of aggressive performance grinds. If you are modeling a
solid-lifter racing cam, like some “mush-
room” lifter grinds, the
Solid Lifter
choice
may underestimate the acceleration rate
of these competition camshafts. In this
case you may find more accurate pre-
The three lifter choices establish a “ramp-rate” model for the simulated valve-motion
curve. The lowest acceleration is assigned to Hydraulic Flat-Tappet Lifters. The next
highest acceleration is applied to Solid Flat-Tappet Lifters. The highest acceleration is
reserved for the last menu choice: Roller Solid Or Hydraulic Lifters.
Dyno2000 Advanced Engine Simulation—73
Page 74

Camshaft Modeling
Lifter Choices In The Dyno2000
dictions from the
Roller Lifter
selection.
If your cam uses roller
lifters but is a mild
street profile, select
Hydraulic or Solid Flat-
Tappets since these
choices will produce a
lift curve that matches a
mild camshaft. On the
other hand, if the cam
is a high-performance
grind, select Solid
Lifters or Roller Lifters
since these will model
the faster acceleration
rates of an aggressive
performance grind.
TIMING METHOD MENU
The Dyno2000 will simulate camshaft motion for both
inch cam timing specifications
. Whenever you change the Cam Specs field and alter
Seat-To-Seat
and
0.050-
the camshaft-timing method, any currently displayed timing events are NOT changed;
it’s up to you to modify/enter the correct timing values. A warning message will be
displayed indicating that the timing method has been changed. In addition, the new
selected timing method will be displayed next to Cam Specs @: in the CAMSHAFT
category.
The basic cam timing events are affected by changes in timing methods. Changing the cam timing method affects IVO, IVC, EVO, EVC, and the calculated intake
and exhaust durations. The remaining timing events, including Intake Centerline
(ICA), Exhaust Centerline (ECA), Lobe Center Angle (LCA), and Intake and Exhaust
Valve Lift are not altered by changes in the timing measurement method because
none of these specs are derived from any of the basic four valve events.
Cam Timing Method Menu
74—Dyno2000 Advanced Engine Simulation
The Dyno2000 will simulate camshaft
motion for both Seat-To-Seat and
0.050-inch cam timing. However, the
internal simulation model requires
seat-to-seat event timing to accurately
calculate the beginning and end of
mass flow in the ports and cylinders
and must derive seat-to-seat timing
from 0.050-inch figures. Unfortunately,
this cannot be done with high accuracy. So, whenever possible enter
seat-to-seat timing to obtain the most
accurate simulation results.
Page 75

Camshaft Modeling
Seat-to-seat timing method—This timing method measures the valve timing—
relative to piston position—when the valve or lifter has only just begun to rise or has
almost
completely returned to the base circle on the closing ramp. Unfortunately,
there are no universal seat-to-seat measuring standards. These are some of the
more common seat-to-seat timing methods:
0.004-inch valve rise for both intake and exhaust
0.006-inch valve rise for both intake and exhaust
0.007-inch open/0.010-close valve rise for both valves
0.010-inch valve rise for both intake and exhaust
0.020-inch LIFTER rise for both intake and exhaust
The timing specs measured using these methods are meant to approximate the
actual valve opening and closing points that occur within the running engine. Because of this, seat-to-seat valve events are often called the
timing. The Dyno2000 needs this information to calculate the beginning and end of
mass flow in the ports and cylinders, a crucial step in the process of determining
cylinder pressures and power output. Because of this, directly entering seat-to-
seat timing specifications will produce the most accurate simulation results.
0.050-inch cam timing—This timing method is widely used by cam manufactur-
ers. 0.050-inch cam timing points are always measured at:
0.050-inch LIFTER rise for both intake and exhaust.
This measurement technique is based on the movement of the cam follower
(lifter) rather than the valve. Since the lifter is rapidly opening or closing at 0.050inch lift, this technique provides an accurate “index” for cam-to-crank position, and
advertised
or
running
Seat-to-seat timing measures the valve
timing—relative to piston position—when
the valve or (more rarely the lifter) has
just begun to rise. Here dial indicators
are positioned on the valvespring
retainers and are measuring
which is the most common technique
used with seat-to-seat timing (0.020-inch
LIFTER rise is a notable exception).
Timing specs measured using these
methods are meant to approximate the
actual valve opening and closing points
that occur within the running engine.
Because of this, seat-to-seat valve
events are often called the advertised or
running timing and will always produce
the most accurate simulations.
valve rise,
Seat-To-Seat Timing Method
Dyno2000 Advanced Engine Simulation—75
Page 76
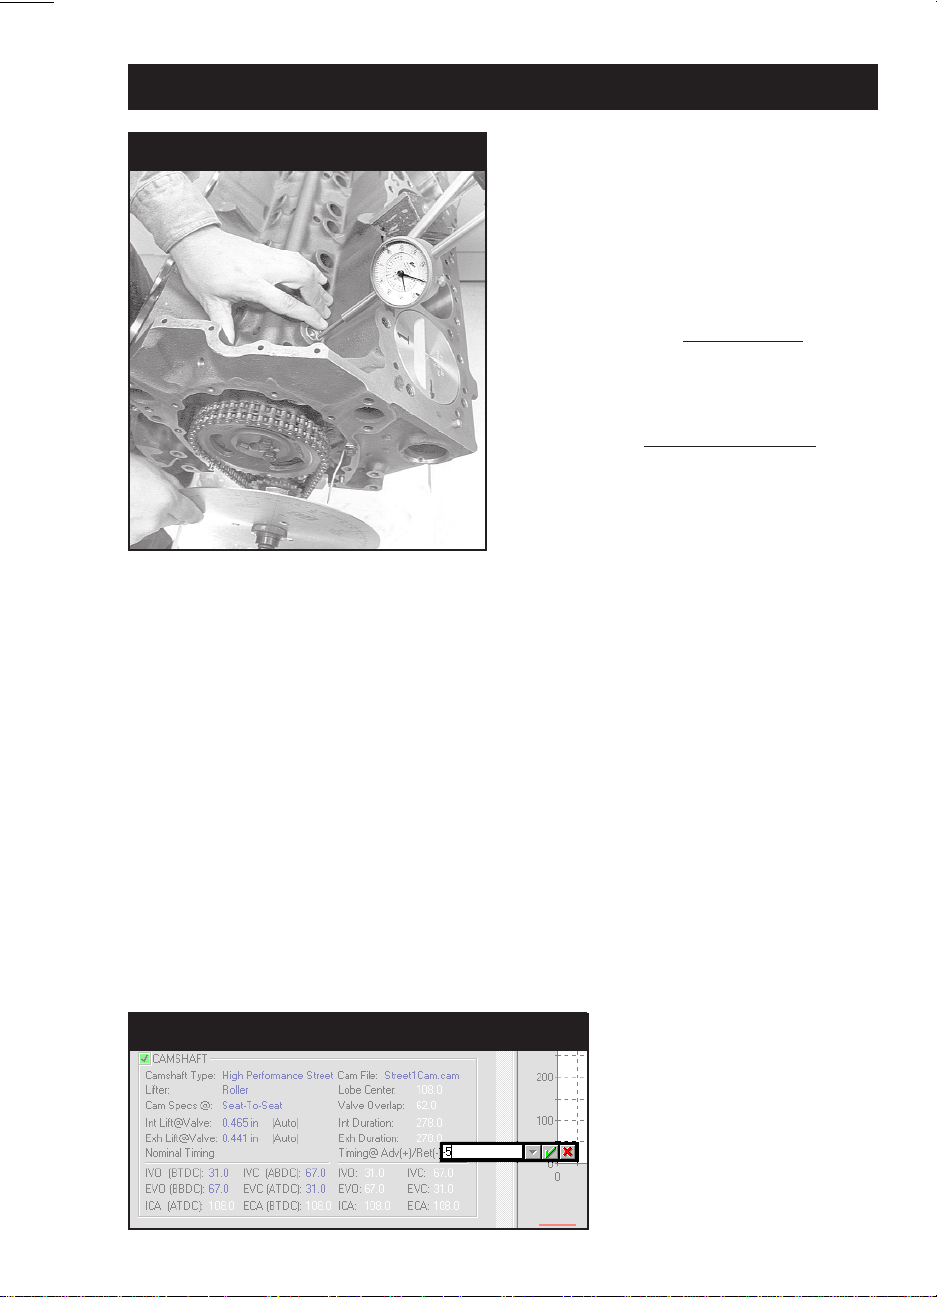
Camshaft Modeling
0.050-Inch Timing Method
The 0.050-inch lifter rise cam timing
method measures valve timing when the
lifter has risen 0.050-inch off of the base
circle of the cam. In the setup pictured
here, the dial indicator is positioned on
an intake lifter; the 0.050-inch valve
timing point can now be read directly off
of the degree wheel attached to the
crankshaft. Timing specs measured
using this method
approximate the actual valve opening
and closing points, instead their purpose
is to permit accurate cam installation. All
0.050-inch timing specs entered into the
Dyno2000 are
seat-to-seat timing. Because there is no
way to precisely perform this conversion, always try to obtain and use seatto-seat event timing to optimize simulation accuracy.
are not meant to
internally converted to
is a wonderful way to accurately check the installation (index) of a camshaft. However, 0.050-inch timing does not pinpoint when the intake and exhaust valves open
or close; essential data needed to perform any engine simulation. While you will
always find 0.050-inch lifter rise timing points published on the cam card and in
many cam manufacturer’s catalogs, the Dyno2000 must internally convert 0.050timing to seat-to-seat figures. And unfortunately, this can introduce some degree of
error into valve-motion calculations. So to emphasize a point:
When ever possible,
use seat-to-seat timing specifications; they produce the most accurate simulation
results.
.
ADVANCE/RETARD MENU
The Dyno2000 allows direct entry of a camshaft advance or retard value. Changing this specification from zero (the default) to a positive value advances the cam
(in crank degrees) while negative values retard the cam. The
Advance/Retard
func-
tion “shifts” all the intake and exhaust lobes the same advanced or retarded amount
Advance/Retard Menu
The Dyno2000 allows direct
entry of camshaft advance
or retard. Changing this
specification from zero (the
default) to a positive value
advances the cam; negative
values retard the cam. See
text for more information on
how these changes affect
engine output.
76—Dyno2000 Advanced Engine Simulation
Page 77

Camshaft Modeling
Installing offset cam
bushings in the cam
gear is a common
method of advancing or
retarding cam timing.
While this method can
improve power, it can
hurt almost as much as
it helps. Camshafts that
show power gains using
this method have the
wrong event timing for
the engine.
Changing Camshaft Advance/Retard
relative to the crankshaft. Why is this done? It is just about the only valve-timing
change available to the engine builder after the camshaft has been purchased.
While it’s possible to “tune” the cam using offset keys, special bushings, or multiindexed sprockets, let’s investigate what happens when all the valve events are
advanced or retarded from the cam manufacturer’s recommended timing.
It is generally accepted that advancing the cam improves low-speed power while
retarding the cam improves high-speed power. When the cam is advanced, IVC and
EVC occur earlier and that tends to improve low-speed performance; however, EVO
and IVO also occur earlier, and these changes tend to improve power at higher
engine speeds. The net result of these conflicting changes is a slight boost in lowspeed power. The same goes for retarding the cam. Two events (later IVC and EVC)
boost high-speed power and two (later EVO and IVO) boost low-speed performance.
The net result is a slight boost in high-speed power.
Advancing or retarding a camshaft has the overall affect of reducing valve-timing
efficiency in exchange for slight gains in low- or high-speed power. Consequently,
most cam grinders recommend avoiding this tuning technique. If advancing or retarding allows the engine to perform better in a specific rpm range, the cam profile
was probably not optimum in the first place. More power can be found at both ends
of the rpm range by installing the right cam rather than advancing or retarding the
wrong cam. However, if you already own a specific camshaft, slightly advanced or
retarded timing may “fine tune” engine output to better suit your needs.
SAVING CAM SPECS MENU
The Dyno2000 can save and retrieve cam file specifications. Simply select the
Cam File field in the CAMSHAFT category. Choose Save from the drop-down menu.
Enter a filename then click OK. A “.cam” is automatically added to the filename and
the file will be saved in the selected directory.
Note 1: If you change any of the on-screen cam specs after saving or retrieving cam
files, the cam file will not be automatically updated (if desired, choose the Save
function again to update the cam files on disk).
Dyno2000 Advanced Engine Simulation—77
Page 78

Cam Math Calculator
Saving And Retrieving Cam Files
The Dyno2000 can save and
retrieve cam file specifications.
Simply select the Cam File
field in the CAMSHAFT category. A “.cam” is automatically added to the file name
you select to save the cam
specs.
Note 2: Dyno2000 cam files are not compatible with cam files from the Motion-PC
Dyno Shop v.2.8.7. If you wish import cam files from this previous version of the
Dyno, print out a test sheet from v.2.8.7, then manually load the cam specs into the
Dyno2000, finally re-save the cam specs to your hard drive.
THE CAM MATH CALCULATOR
As discussed previously, the basic four valve events (IVO, IVC, EVO, EVC) are
required by the Dyno2000 to pinpoint when the intake and exhaust valves open and
close. The IVO and EVO signal the beginning of mass flow in the intake and exhaust
ports. The closing points, IVC and EVC, mark the end of mass flow. Unfortunately,
many cam catalogs and other printed materials ONLY publish the lobe center angles
and duration values, leaving the conversion to IVO, IVC, EVO, and EVC up to the
frustrated simulation user.
Now, the “frustration factor” has been reduced. The Cam Math Calculator, included in the Dyno2000, instantly converts the lobe-center angle, intake centerline,
and the duration values into IVO, IVC, EVO, and EVC events. These values can be
loaded into the main Component Selection screen (in the CAMSHAFT Category)
and used in the next simulation. In order for the Cam Math Calculator to determine
all four valve events, BOTH the lobe-center angle AND the intake centerline must
be available. Without the intake centerline, there is no way to determine how the
cam is “timed” or “indexed” to the crankshaft. Many, unfortunately not all, cam
manufacturer catalogs provide sufficient information to use the Cam Math Calculator
to determine valve event timing. If you have a catalog that does not provide this
information, try another cam manufacturer, or consider purchasing the CamDisk
from Motion Software that provides over 1200 read-to-load cam files for the Dyno2000.
Note: You can even obtain cam (and flow and engine) files from several sources on
the Internet. The popularity of the Dyno2000 has engendered “unofficial” support
sites that you may find helpful in your engine development (Motion Software, Inc.,
does not endorse, guarantee, or accept any responsibility for the accuracy or usability of any of the information obtained from “non-official” sources.)
Before you open the Cam Math Calculator, select the appropriate cam timing
method from the Cam Specs @ menu located in the CAMSHAFT category on the
78—Dyno2000 Advanced Engine Simulation
Page 79

Cam Math Calculator
Cam Timing Method Menu
Before you open the Cam Math
Calculator, select either the Seat-ToSeat or 0.050-inch cam timing
methods. Remember, seat-to-seat
event timing will produce the most
accurate simulation results.
main Component Screen. This will establish how the timing points are applied to the
simulated engine by the Calculator.
Important Note: The Cam Math Calculator screen indicates whether the displayed
specs used in cam-math calculations and, potentially, applied to the simulated engine are based on the 0.050-inch or Seat-to-Seat timing methods (see photo, page
80). You can switch between these timing methods by closing the Cam Math Calculator and choosing a timing specification from the Cam Specs @ field in the
CAMSHAFT category. Remember, whenever you have a choice of cam specs,
always use seat-to-seat timing values; the simulation results will have the highest
accuracy.
The Cam Math Calculator is activated by selecting Cam Math from the TOOLS
drop-down menu or by clicking on the Cam Math Calculator button on the Toolbar.
If IVO, IVC, EVO and EVC cam timing values were already entered in the CAMSHAFT category (on the main Component Selection Screen), the Cam Math Calculator will display the lobe-center angle, intake centerline, and duration values for the
current cam and accept any changes. On the other hand, if you have not yet entered
valve-event timing, the Cam Math Calculator will display blank fields, and allow the
input of centerline, duration, and valve-lift specs. As you fill in the fields, the corresponding IVO, IVC, EVO and EVC points will be calculated and displayed. You may
then either accept the calculated values and transfer them to the CAMSHAFT category (on the Component Selection Screen) by pressing the Apply button or discard
The Cam Math Calculator is an easy-
to-use tool that converts LCA, ICA and
duration values to the IVO, IVC, EVO,
and EVO timing points needed to
perform a simulation. Open the
calculator by selecting Cam Math from
the Tools menu or clicking on the
Cam Math Calculator button in the
Toolbar.
Starting The Cam Math Calculator
Opens Cam Math Calculator
Dyno2000 Advanced Engine Simulation—79
Page 80

Cam Math Calculator
Cam Math Calculator
The Cam Math
Calculator allow
direct entry of cam
data from cam
manufacturer’s
catalogs. It also
simplifies changing
lobe-center angle,
intake centerline,
intake and exhaust
duration, and valve
lift specifications.
the new values and close the Calculator by pressing Close.
You also will find the Cam Math Calculator a handy tool for testing changes made
to the lobe-center angle, the intake centerline, intake duration, and exhaust duration
values. Combined with the ability to change IVO, IVC, EVO, EVC, and overall
advance and retard from the Component Selection screen, the Dyno2000 with the
Cam Math Calculator allows quick, “what-if” manipulation of EVERY cam timing
event.
Cam Timing-Method Display
Current Cam Timing
Method
80—Dyno2000 Advanced Engine Simulation
The Cam Math Calculator
screen indicates whether
the displayed specs will
be used in the simulation
as 0.050-inch or Seat-toSeat timing values. You
can switch between these
methods by closing the
Cam Math Calculator and
choosing the timing
specification from the
Cam Specs @
CAMSHAFT category.
field in the
Page 81
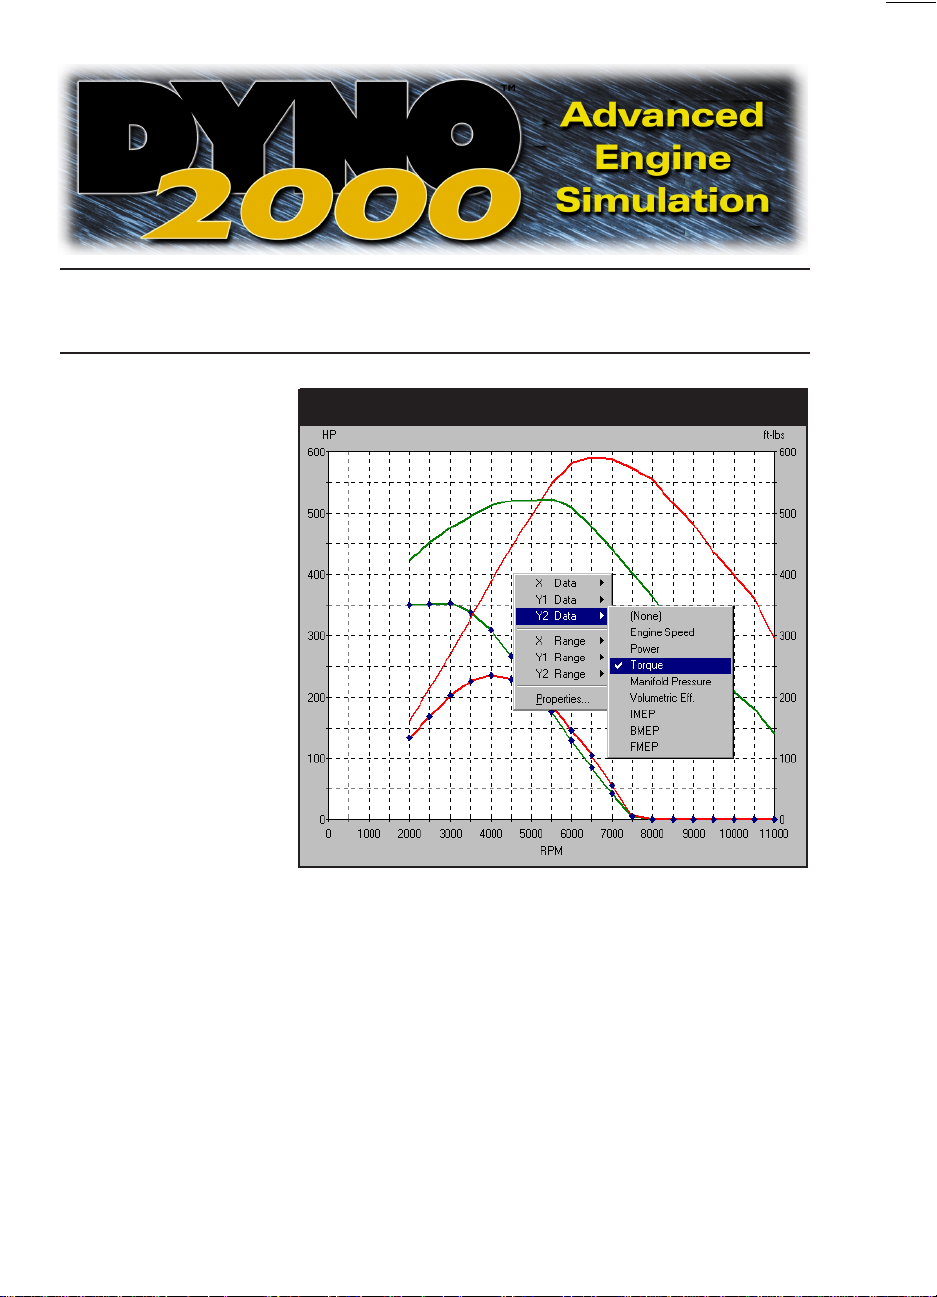
RESULTS SCREEN
RESULTS SCREEN
The speed and ease
of engine component
entry in the Dyno2000 is
complemented by the
power and versatility of
the simulation results
displays. Almost the
same instant that all the
component categories
have been completed
(all categories have
green Status Boxes) the
simulation results will be
displayed on a fully-scalable precision graph.
The display graph can
be customized to display
virtually any engine variable on any axis. Auto
scaling or manual axis
scaling are easily setup
by right-clicking on the graph (shown here). Up to four engines can be compared at
once. And a comprehensive “table” display shows exact horsepower, torque, rpm,
induction pressure, cylinder pressure, engine friction, and more! The Dyno2000 will
show you what you are looking for, fast!
The Simulation Results display is composed of several elements that will help
you retrieve the most information from any simulation as quickly and easily as
possible:
Simulation Results Display
1) The Main Program Screen (photo, next page) is divided into two sections (called
panes), with the component selection categories on the left and the results
screen on the right (by default). The center divider between each pane can be
moved (click and drag) to resize the results screen to suit your requirements.
The graph will redraw and re-scale to take advantage of changes in display
Dyno2000 Advanced Engine Simulation—81
Page 82

Simulation Results Display
Two Panes Of Main Program Screen
The Main Program
Screen is divided into
two sections (called
panes), with the
component selection
categories on the left
and the results screen
on the right (by
default). The center
divider between each
pane can be moved
(click and drag) to
change the size of the
results screen to suit
your requirements.
The graph will redraw
and re-scale.
area.
2) The results graph consists of three axis, a left, right, and bottom (horizontal)
axis. Each of these axis can be assigned an engine variable. Currently the
Dyno2000 will graph the following variables: Rpm, Horsepower, Torque, Intake
Manifold Pressure, Volumetric Efficiency, Imep (Indicated Mean Effective Pressure), Bmep (Brake Mean Effective Pressure), and Fmep (Friction Mean Effective Pressure). Right click on the graph to display the Graph Options menu to
The results graph
consists of three axis,
a left, right, and
bottom (horizontal).
Right click the graph
and assign any
variable to each curve
(see photo on previ-
ous page). The graph
on the right shows
how horsepower (red)
and manifold pressure
(green) varied
throughout a test run.
Also note that the
screen divider has
been moved to allow
the graph more
display area.
Assign Variables To Graph Curves
82—Dyno2000 Advanced Engine Simulation
Page 83

Simulation Results Display
Default Scaling
Low Scaling Option
High Scaling Option
Auto Scaling Option
The results graph supports several methods of axis scaling. Each axis will scale
to a low, medium, high, and auto-scale ranges.
assign engine variables to graph axis.
3) The results graph supports several methods of axis scaling. Each axis will scale
to a low, medium, and high value. Plus auto-scaling can be enabled for any axis.
By default, auto-scaling is turned off. This maintains the axis values constant,
establishing a fixed baseline so that changes in power or torque are easily
distinguished. However, when component changes dramatically alter power (like
nitrous-oxide injection or forced induction), the auto-scaling feature will ensure
Dyno2000 Advanced Engine Simulation—83
Page 84

Simulation Results Display
Compare Up To Four “Open” Engines
A comparison of four
engines was setup
using the Properties
Box. Up to four
“open” engines can
be compared on any
graph. This graph
shows how horse-
power (red) and
volumetric efficiency
varied for all four test
engines.
that the data curves are always visible and display at 80 to 90% of full graph
height for maximum resolution.
4) The Graph Properties dialog screen allows on-graph comparison of up to four
engines at once. The engines you wish to include in the comparison must be
“open” with active tabs in the Engine Selection Tabs display. Right click the
The ability to select
the variables that you
would like to compare
is an extremely power
tool. Here horsepower
is compared with
manifold pressure on
a supercharged
engine. Notice that
the wastegate opens
at 7000rpm when
manifold pressure
reaches about 25psi
(above ambient).
84—Dyno2000 Advanced Engine Simulation
Ensure Supercharger Boost Pressure
Page 85

Simulation Results Display
Dual Displays Of Same Engine
Research Nature Of I.C. Engine
Select a Graph display
for both panes and set
the Options to plot
different variables for
each graph. View more
simulation data and get
better insight into the
performance potential
of any component
combination.
The graphing capability
of the Dyno2000 is not
limited to standard
“power” curves. Here
is a display of how
induction pressure and
Brake Mean Effective
Pressure (Bmep) varied
in relationship to
engine output. It’s
graphs like this that
can lead to new in-
sights and optimum
component combina-
tions.
graph to display the Graph Options menu then select Properties. Use the
Graph Data Sets drop-down menus to select from currently-open engines. When
you click on OK, the graph will redraw with the desired data comparisons. A
legend at the bottom of the graph provides a key to all graph curves.
Dyno2000 Advanced Engine Simulation—85
Page 86
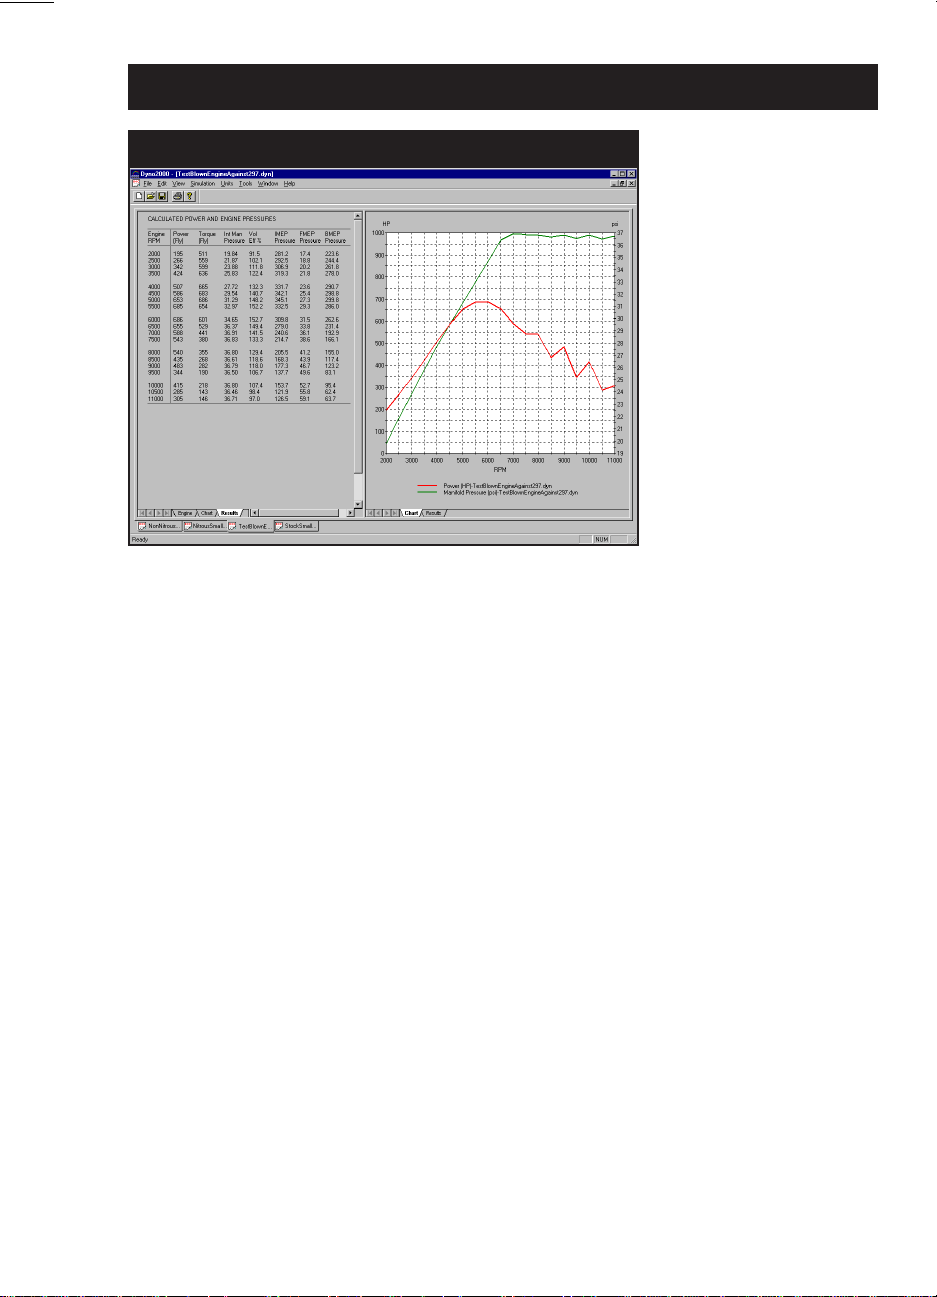
Simulation Results Display
Table Shows Exact Test Results
In addition to 2D
graphing capability
described in the text,
a chart display is
available by clicking
on Table tabs located
at the bottom of either
pane. The chart lists
all engine variables
recorded during the
simulated dyno run.
The exact data values
are displayed in
500rpm increments
from 2000 to
11,000rpm.
5) In addition to 2D graphing capability described above, a chart display is avail-
able by clicking on Table tabs located at the bottom of either display pane. The
chart lists all engine variables recorded during the simulated dyno run. The exact
data values are displayed in 500rpm increments from 2000 to 11,000rpm.
86—Dyno2000 Advanced Engine Simulation
Page 87

™
THE ITERATOR
THE ITERATOR
Before the rapid “what-if” testing possible with the Dyno2000, obtaining data
about engine component combinations was an expensive, time-consuming process.
Components were assembled into a complete engine, the engine was installed on
the dyno, and after initial break-in runs, power testing was performed. This process
could easily take several hours, if not days, for each component setup. Add up the
cost of the parts, labor, and dyno time, and it obvious why even wealthy engine
builders/owners could only slowly build a file of engine-test data. Sorting through the
tests and analyzing results rarely required extensive cataloging and sorting; there
were simply too few tests and never enough data.
While the cost of engine building and dyno testing have certainly not decreased
over the past few years, the ability to fill file cabinets with
available to anyone. In fact, many enthusiasts become “bogged down” in an overabundance of test data. Sorting through the results, analyzing the best power curves,
and selecting promising component combinations has turned into a job nearly as
difficult as the old trial-and-error dyno testing.
The solution to the this problem comes from the same source that made this
overabundance of data possible in the first place: the computer. Sorting, comparing,
cataloging, filing, retrieving, storing; these are all terms associated with computers.
simulated
dyno tests is
Using Iterative
Testing™, the
Dyno2000 can evalu-
ate more parts
combinations than
any human could sort
and file. It will ana-
lyze all the results
and present the best
for you to review.
The Iterator handles
all testing details. In
fact, you can start a
test series and walk
away from the com-
puter until the task is
complete.
Iterative Testing
™
Main Screen
Dyno2000 Advanced Engine Simulation—87
Page 88

Using Iterative Testing™
Empty Main Iterator Screen (Requires Setup)
To start an iterative test,
first build a baseline
engine (the engine you
would like to optimize).
Then select Iterator Test-
ing from the Tools menu
or the Iterator icon in the
Toolbar. The empty Main
Iterator Screen is displayed (shown here).
Select the Setup button to
open the Iterator Setup
dialog box (shown below).
In fact, computer excel at these tasks. Automating these repetitive tasks, the Dyno2000
brings not only the awesome power of engine simulation computations to the desktop, but also it offers the ability to sort, compare, and select from hundreds, thousands, even millions of dyno tests and isolate the best combinations based on your
selection criterion. Using powerful, built-in
more parts combinations than any human could sort and file. It will carefully analyze
all the results and present the best-of-the-best for you to review. The Dyno2000
Iterator handles all testing details. In fact, you can start a series of tests and simply
walk away from the computer until the task is complete. Or you can continue to use
your computer for other tasks while it performs dyno testing and analysis in the
background.
Iterative Testing
™
, the Dyno2000 can test
The Iterator Setup box allows
you to choose the range of
components for the testing
series. Start off by selecting
a Baseline engine from the
Baseline Engine drop-down
box. Every “open” engine is
available for Iterative testing,
providing all component
categories are completed
(green Status Boxes).
88—Dyno2000 Advanced Engine Simulation
Setup Screen (Select Baseline Engine)
Page 89
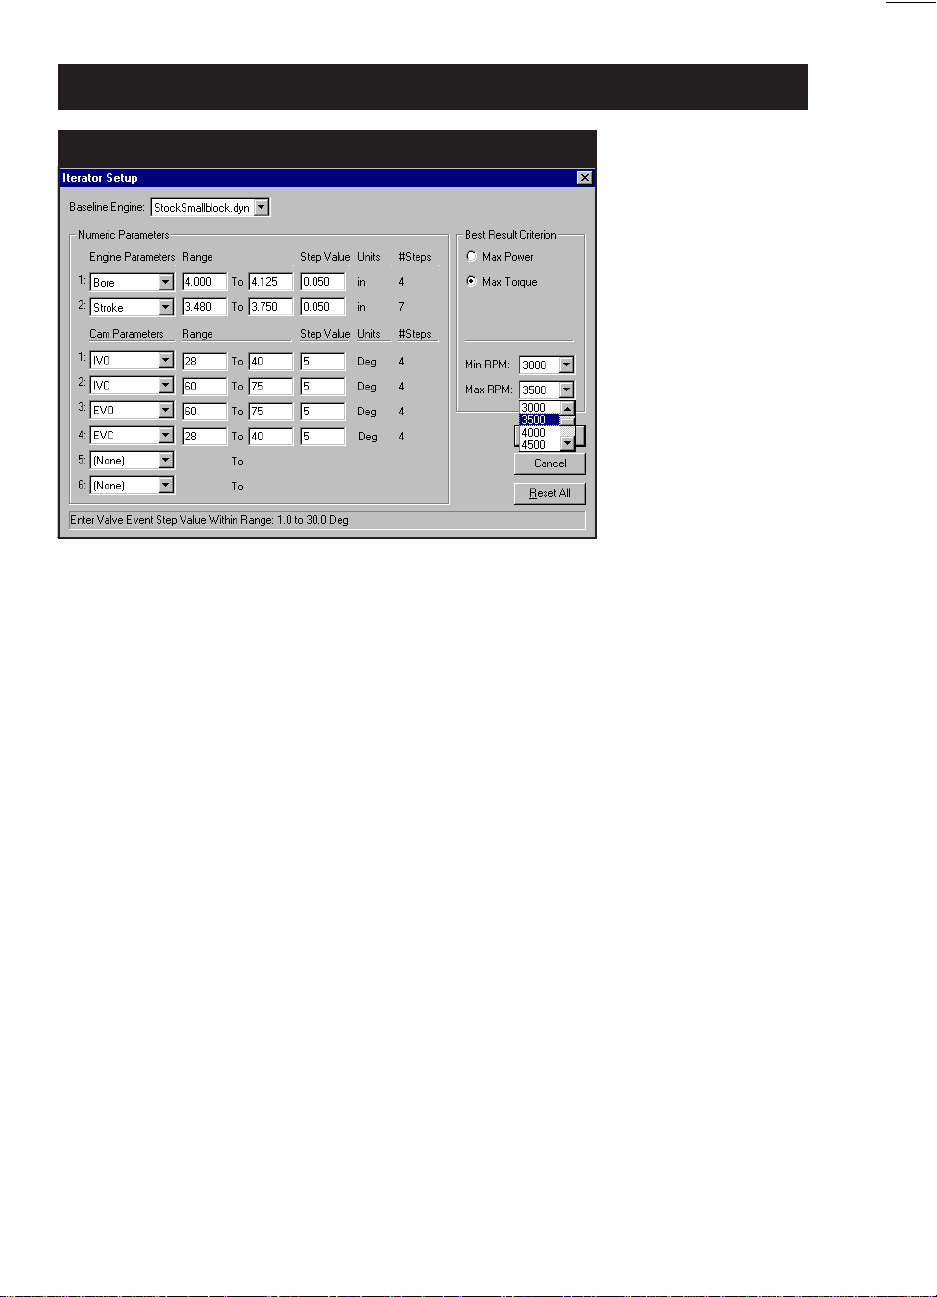
Using Iterative Testing™
Iterator Parameters, Step Values, Test Criterion
After selecting a
baseline engine the
Numeric Parameters menus
become active.
Select an Engine
Parameters for
testing. Then enter
a testing Range,
and a Step Value.
Choose if you
would like to
search for peak
Power or Torque in
the Best Results
Criterion box.
Finally, select the
Minimum and
Maximum RPM.
Setting Up Iterative Testing
In order to perform a single dyno test all component parts must be selected
(green status boxes in all component categories). An iterative test can be setup only
after
the first dyno test has been completed and the horsepower and torque are
displayed in the results screen.
To start an iterative test, select the components you would like to optimize for
your baseline engine, make sure all Status Boxes on each component category are
green, and Auto Calculate Valve Size and Valve Lift are turned off (more on this
later). Then select Iterator Testing from the Tools menu or select the Iterator icon
in the Toolbar. The Main Iterator Screen is displayed (it will be empty the first time
it’s opened). Select the Setup button to open the Iterator Setup dialog choices. The
Setup screen allows you select the range of components to use for Iterative testing.
Start off by selecting your baseline engine from the Baseline Engine drop-down
box. Every “open” engine that has all component categories completed is available
for Iterative testing. When you have selected a baseline engine, the Numeric Pa-
rameters menus will become active. Select an Engine Parameter to test (bore,
stroke, and compression; more parameters will be added in the next release of the
Dyno2000; just send in your registration card to receive a free update!) and/or select
any of the Cam Parameter menus.
When you select a testing parameter, range boxes are displayed and loaded with
the current component value. Enter the value range for each engine parameter
(always enter the smaller value in the left box and the larger value in the right box)
and the Step Value to use throughout the test run. The smaller the Step Value, the
more tests will be performed. The Number Of Steps (#Steps) for each parameter
will be calculated and displayed to the right of each parameter field. The
total
Dyno2000 Advanced Engine Simulation—89
Page 90

Using Iterative Testing™
Iterator Testing Begun
Begin Iterative testing
by clicking the Run
button. As each test is
completed, the engine
power or torque curve
will be displayed in the
small graph on the left.
As testing proceeds,
the ten component
combinations that
produce the best
power or torque within
the selected rpm range
are “stored” in the
Best Results 3D graph.
number of steps
by
multiplying together all the Number-Of-Step values
Cam timing values are selected from the Cam Parameters category. When each
timing value is selected, such as IVO, the current value for that timing point is loaded
into the parameter range boxes. Select the minimum and maximum values for each
timing point (always enter the smaller value in the left box and the larger value in
the right box), then select a step value. #Steps will be displayed.
When all components, ranges, and step values have been selected, choose whether
you would like to search for Max. Power or Max. Torque in the Best Results
Criterion box. Finally, select the Minimum and Maximum RPM range values that
the Dyno2000 should use to search for the best horsepower or torque (rpm range
must span least 500rpm). For example, you might select 2500-3000rpm in a search
for maximum torque on a powerplant for heavy vehicle or towing applications. On the
View the curves (red
curves indicate Horse-
power; green curves
indicate Torque) from
any prospective using
the X+, X-, Y+, Y-, Z+,
and Z- buttons (Home
returns the graph to
original position).
for an Iterative test can accumulate quickly, since it is determined
.
Viewing Results As The Iterator Continues Testing
90—Dyno2000 Advanced Engine Simulation
Page 91

Using Iterative Testing™
Iterator Testing Begun
At any time during the
Iteration process, you
can Halt calculation.
Clicking Run will
resume with no data
loss. While the Iterator
is halted, you can
select up to ten curves
from the Keep Result
box. Click OK to close
the Iterator. The Dyno
2000 will spawn these
simulated engines.
other hand, a selection of 7000-8500rpm might be used in a search for maximum
horsepower on a race engine.
When you have completed all the selections on the Setup dialog, click OK to
close the box and return to the Main Iterator Screen. Notice that the total number
of tests in the current Iterator run is displayed in the Iterator Status box (upper left).
Begin Iterative testing by clicking on the Run button. As each Iterative test is completed, the engine power or torque curve will be displayed in the small Current Test
Result graph (red curves indicate Horsepower; green curves indicate Torque). As
testing proceeds, the ten component combinations that produce the best power or
torque within the selected rpm range are “stored” in the Best Results 3D graph.
When Iterative testing is complete (you can stop testing at any time by pressing
the Halt button; press Run again to continue testing), the Best Results graph will
contain the ten engine combinations that achieved the highest horsepower or torque
When the Iterator
completes a test run
(this run consisted of
7168 tests), you can
keep any or all of the
ten “best-results”
engine configurations
(click on Keep All to
keep all ten). If you
click OK, the Iterator
will create (spawn)
engine configurations
that match those used
to produce the best-
results curves.
Iterator Testing Completed
Dyno2000 Advanced Engine Simulation—91
Page 92

Using Iterative Testing™
Spawned Engines Displayed In Engine Tabs; Iterator Power Increase
When you close the Iterator screen, new “spawned” engines will be created and
displayed in the Engine Tabs at the bottom of the Main Program Screen. Each new
engine can be brought into the foreground by clicking on its Selection Tab. Iteratorspawned engines can be analyzed, tested, and modified in any way, just like any
other engine in the Dyno2000. The comparison test shown here between the Baseline engine and one of the ten Iterator test results illustrates the increase in power
and torque that was “found” by the Iterative testing.
within the selected parameters and rpm ranges. View the curves from any prospective using the X+, X-, Y+, Y-, Z+, and Z- buttons (Home returns the graph to original
position), then place check marks next to the curve numbers you wish to keep in the
Keep Result box. You can keep all ten curves by clicking on Keep All. When all
curves you wish to keep have been selected, click OK to close the Iterator. In a few
seconds, the Dyno2000 will spawn dyno-test engines with the component combinations that produced the power or torque of the selected curves.
When the Iterator closes, the new spawned engines will be displayed in the
Engine Selection Tabs at the bottom of the Main Program Screen (see page 13
for more information on Engine Tabs). Each test engine can be brought into the
foreground by clicking on its Tab. Iterator-spawned engines can be analyzed, tested,
and modified in any way, just like any other engine in the Dyno2000. In fact, it is
92—Dyno2000 Advanced Engine Simulation
Page 93

Using Iterative Testing™
possible to begin a
new
Iterator test using any of the spawned engines as a Baseline
Engine to further “home in” on the desired results.
Halting And Restarting Testing
At any time during the Iteration process, you can stop calculation by click the Halt
button. Simply clicking Run will resume calculation with no data loss. If, instead, you
wish to reset the Iterator and start the simulation series over again, click the Restart
button, or you can click Setup, change any parameters or step values you wish,
then click Run to start the Iteration process from the beginning.
If you Halt the simulation, you can close the Iterator screen by clicking Close. If
you reopen the Iterator screen before you close the Dyno2000, you will be able to
resume calculations on the current Iterator series. However, when the Dyno2000 is
closed, all Iterator calculations and results that have not been spawned to engines
and saved to disk will be lost.
Tips For Running Iterative Testing
Setting up an Iterative series only takes a few seconds, however, if you include
too many parameters, ranges that are too wide, or step values that are too small,
you will create an Iterator series that contains too many tests. If you create a series
longer than 300 million tests (even fast computer systems will require one year or
more to complete 300 million tests) the Dyno2000 will request that you increase step
values for selected parameters.
The best way to find optimum components, especially cam timing, is to use large
step values (5 degrees or more) to “get in the ballpark” of the right values. Then run
a second Iteration series on the best engine, keeping the range of values narrow
(perhaps just a 5 or 10 degree range) and use smaller (perhaps 1 degree) step
Iteration Counter Limits
Setting up too many
parameters, ranges that
are too wide, or step
values that are too
small, will create a test
series that contains too
many runs. This experimental setup requires
over 1.6 billion tests to
complete (would take
almost 6 years). The
Dyno2000 limits a test
series to no more than
300 million tests (about
one year of computation
time on a fast computer!).
Dyno2000 Advanced Engine Simulation—93
Page 94

Using Iterative Testing™
values to precisely locate the best timing.
Narrowly-focused tests may still require several thousand test cycles to complete.
A series this large may require an hour or two—or even a day or two—of calculation
time depending on the speed of the computer. In these cases, you may continue to
use your computer to perform other tasks. Simply use the Start menu to begin other
applications and use Alt-Tab to switch between applications (see your Windows
documentation for more information on program switching).
Note: If you are running Windows98, you may select the “DeskTop” icon in the task
bar (usually located two or three icons to the right of the Start menu on the task bar)
to “minimize” the Dyno2000 and regain your desktop.
Warning!
turned off, all calculated test results will be lost.
long calculation series is to Halt the calculation from time to time, select a power
curve that seems to best match your criterion, check the curve number in the Keep
Results box, spawn the engine, then Save it to your hard drive. After the engine file
has been saved, resume Iterative testing.
If you are running a simulation series and your system crashes or is
One way to circumvent a loss of a
94—Dyno2000 Advanced Engine Simulation
Page 95

OTHER FEATURES
OTHER FEATURES
DYNO FILE COMPATIBILITY
DeskTop Software allows you to simulate building and dyno testing an engine, but
in addition you can install any simulated engine in a simulated vehicle using the
DragStrip2000, then test the combination in 1/8- or 1/4-mile drag events. You can
even load simulated engines into DeskTop Pro Drag Racing and X-Car Road Racing
games. It is Motion Software’s goal to maintain this compatibility throughout our
entire software line.
Dyno2000 engine files can be directly loaded into the DragStrip2000; no file
export is required to transfer any engine into the DragStrip2000. However, the
Dyno2000 has many options, like forced induction, that are not supported in older
DOS-based Desktop simulations. To maintain as much backward compatibility as
possible, a DOS file export feature has been incorporated into the Dyno2000 (see
photo, next page). Using this export feature, you can exchange Dyno2000 engines
with the DeskTop Dragstrip, the DeskTop Full Throttle Reaction Timer, and even
DeskTop Pro Drag Racing and X-Car Road Racing games.
However, to maintain this compatibility, export limits must be imposed on Dyno2000
engines. The following exports limits are required:
1) Engines using Forced Induction cannot be exported. Switch the induction
system to a naturally-aspirated manifold.
2) Engines that have Auto Calculate Valve Size or Auto Calculate Valve Lift
cannot be exported until these features are turned off.
3) The Unit system (use the Units menu in the Dyno2000) must be set to the US
measurement system before DOS file export.
Note: The Dyno2000 also provides a special export feature for users of the NIRA
Intense Import drag racing game. Engines exported from the Dyno2000 using this
feature have none of the above restrictions; any engine you can build in the Dyno2000
can be imported into Intense Import by using the NIRA export feature available in
the File menu (see photo, next page).
Dyno2000 Advanced Engine Simulation—95
Page 96

Other Program Features
File Menu Export And Print Choices
The new DragStrip2000 vehicle
simulation will directly read Dyno2000
engine simulation files. To support
earlier software, the Dyno2000 also
incorporates a DOS File Export
feature that allows you to transfer
many simulated Dyno2000 engines to
the Dos-based DeskTop Dragstrip, the
DeskTop Full Throttle Reaction Timer,
and even Pro Drag Racing and X-Car
Road Racing games. There is a
special menu choice for the NIRA
Intense Import racing game (no
engine restrictions are required to
use this export). The File menu also
offers choices that will help you
setup your printer and print dyno test
data.
PRINTING DYNO DATA AND POWER CURVES
The Dyno2000 is capable of printing a complete list of engine components, cylinder head airflow data, exact engine test result values, and 2D graphic curves of
several engine-test variables. Each of these data sets print on separate pages that
comprise a complete 5-page, dyno-test report of the currently-selected engine. You
can determine which pages you would like to print, preview the pages before you
print, and direct the output to any installed Windows printer.
There are three choices in the File menu (located on the Main Program Screen)
that will help you setup your printer and print dyno data. The choices are:
The print dialog box, acces-
sible from the File menu,
allows the selection of a
printer, access to printer
Properties, and you can
enter the range of dyno-test
report pages. Printing can
be started from this dialog
box.
96—Dyno2000 Advanced Engine Simulation
Print Dialog Box
Page 97

Other Program Features
Print Preview Page 1–2 Print Preview Page 3–4
Print Preview Page 4–5
Print—Opens a dialog box that allows the selection of a printer, access to printer
Properties, and the Print Range of dyno-test pages. Printing can be started from this
dialog box.
Print Preview—Opens the Print Preview Screen that provides an on-screen ren-
dering of what each page in the dyno-test report will look like when printed on the
selected Windows printer.
The Dyno2000 will print a complete
list of engine components, cylinder
head airflow data, exact engine test
result values, and graphic curves of
engine-test variables. Each page is
shown here using the print preview
function available from the File menu.
Page one prints a complete component list. Page two displays the
cylinder head airflow data. Page three
shows all calculated engine power
and pressures values. Page four and
five reproduce both graphs (from the
left and right panes of the Main
Program Screen).
Printer Setup—Similar to the Print dialog box (allows printer selection), except
printing cannot be started from this box.
The dyno-test report generated by the Dyno2000 consists of 5 pages. Here is
description of each page:
Page 1—This page prints the components selected for the current dyno test. The
Dyno2000 Advanced Engine Simulation—97
Page 98

Other Program Features
appearance of the report is similar to the Component Selection pane of the Main
Program Screen.
Page 2—This page displays the cylinder head airflow data used for the test run.
Page 3—All calculated engine power and pressures are provided in chart form.
A calculated value is listed for each 500rpm test point throughout the full test
range (2000 to 11,000rpm).
Page 4—The first of two graphs of engine output is reproduced on this page (this
is the graph that is setup on the left side of the Main Program Screen; select the
Graph Tab at the bottom of the Component-Selection screen to display this
graph). Full color printing is supported.
Page 5—The second of two graphs of engine output is reproduced on this page
(this is the graph that is setup on the right side of the Main Program Screen). Full
color printing is supported.
GENERAL SIMULATION ASSUMPTIONS
The Dyno2000 closely simulates the conditions that exist during an actual engine
dyno test. The goal is to reliably predict the torque and horsepower that a dynamometer will measure throughout the rpm range while the engine and dyno are running
through a programmed test. However, engine power can vary considerably from one
dyno test to another if environmental and other critical conditions are not carefully
controlled. In fact, many of the discrepancies between dyno tests are due to variabilities in what should have been “fixed” conditions.
Among the many interviews conducted during the research and development of
Motion Software, Inc., engine simulation software, dyno operators and engine owners readily acknowledged the possibilities of errors in horsepower measurements.
Unless the dyno operator and test personnel are extremely careful to monitor and
control the surrounding conditions, including calibration of the instrumentation, comparing results from one dyno cell to another (or even one test run to another) is a
futile task.
Controlling these same variables in an engine simulation program is infinitely
easier but, nevertheless, just as essential. Initial conditions of temperature, pressure,
energy, and methodology must be established and carefully maintained throughout
the simulation process. Here are some of the assumptions within the Dyno2000 that
establish a modeling baseline:
Fuel
1) The fuel is assumed to have sufficient octane to prevent detonation.
2) The air/fuel ratio is always maintained at the optimum power ratio.
98—Dyno2000 Advanced Engine Simulation
Page 99

Other Program Features
Environment
1) Air for induction is 68-degrees (F), dry (0% humidity), and of 29.92-in/Hg
atmospheric pressure.
2) The engine, oil, and coolant have been warmed to operating temperature.
Methodology
1) The engine is put through a series of “step” tests, during which the load is
adjusted to “hold back” engine speed as the throttle is opened wide. The load
is adjusted to allow the engine speed to rise to the first test point, 2000rpm
in the case of this simulation. The engine is held at this speed and a power
reading is taken. Then engine speed is allowed to increase to the next step,
2500rpm, and a second power reading is taken. This process continues until
the maximum testing speed of 11,000rpm is reached.
2) Since the testing procedure increases engine speed in 500rpm steps, and
engine speed is held steady during the measurement, the measured power
does not reflect losses from accelerating the rotating assembly (the effects of
rotational inertia in the crank, rods, etc.). These processes affect power in
most “real-world” applications, such as road racing and drag racing, where
engine speed is rapidly changing throughout the race.
Dyno2000 Advanced Engine Simulation—99
Page 100

COMMON QUESTIONS
COMMON QUESTIONS
COMMONLY ASKED QUESTIONS
The following information may be helpful in answering questions and solving
problems that you encounter when installing and using the Dyno2000. If you don’t
find an answer to your problem here, send in the Mail/Fax Tech Support Form on
page 113
only—mail in your registration form today).
an answer to you as soon as possible.
INSTALLATION/BASIC-OPERATION QUESTIONS
Question: Received an “Error Reading Drive D” (or another drive) message when
Answer: This means your computer cannot read the disk in your CD-ROM drive.
Question: Encountered “Could not locate the Dyno2000 CD-ROM disk” error mes-
Answer: Please insert the Dyno2000 disk in your CD-ROM drive. Occasionally,
Question: The Dyno2000 produced an
Answer: Please note down all of the information presented in the message box,
(Motion Software provides Mail/Fax technical service to registered users
We will review your problem and return
attempting to run or install the Dyno2000. What does this mean?
The disk may not be properly seated in your drive, the drive may be defective, or
the disk may be damaged. If you can properly read other CD-ROM disks in your
drive, but the Dyno2000 distribution disk produces error messages, try requesting a directory of a known-good disk by entering DIR X: or CHKDSK X: (where
X is the drive letter of your CD-ROM drive) and then perform those same
operations with the Dyno2000 disk. If these operations produce an error message only when using the Dyno2000 disk, the disk is defective. Return the disk
to Motion Software, Inc., for a free replacement (address at bottom of Tech
Support Form).
sage when trying to run the Dyno2000. Why?
the Dyno2000 will need to access the CD. Please keep the Dyno2000 disk
handy.
Assertion Failure
provide a quick synopsis of what lead up to the error, then send this information
to Motion Software. Thank you for your assistance in helping us improve the
Dyno2000.
error. What should I do?
100—Dyno2000 Advanced Engine Simulation
 Loading...