

Page 1

•
For safety and warning information, please read this
•
Additional safety and warning information is provided
•
st
MX269022A
LTE TDD Downlink Measurement
manual before attempting to use the equipment.
within the MS2690A/MS2691A/MS2692A Signal
Analyzer Operation Manual (Mainframe Operation),
MS2830A Signal Analyzer Operation Manual
(Mainframe Operation), or MS2850A Signal Analyzer
Operation Manual (Mainframe Operation). Please also
refer to this document before using the equipment.
Keep this manual with the equipment.
Software
Operation Manual
Operation
21
Edition
ANRITSU CORPORATION
Document No.: M-W3209AE-21.0
Page 2

Safety Symbols
To prevent the risk of personal injury or loss related to equipment malfunction, Anritsu Corporation uses the
following safety symbols to indicate safety-related information. Ensure that you clearly understand the meanings of
the symbols BEFORE using the equipment. Some or all of the following symbols may be used on all Anritsu
equipment. In addition, there may be other labels attached to products that are not shown in the diagrams in this
manual.
Symbols used in manual
DANGER
WARNING
CAUTION
This indicates a very dangerous procedure that could result in serious injury or
death if not performed properly.
This indicates a hazardous procedure that could result in serious injury or death if
not performed properly.
This indicates a hazardous procedure or danger that could result in light-to-severe
injury, or loss related to equipment malfunction, if proper precautions are not taken.
Safety Symbols Used on Equipment and in Manual
The following safety symbols are used inside or on the equipment near operation locations to provide information
about safety items and operation precautions. Ensure that you clearly understand the meanings of the symbols and
take the necessary precautions BEFORE using the equipment.
This indicates an obligatory safety precaution. The obligatory operation is
This indicates a warning or caution. The contents are indicated symbolically in or
This indicates a note. The contents are described in the box.
These indicate that the marked part should be recycled.
This indicates a prohibited operation. The prohibited operation is indicated
symbolically in or near the barred circle.
indicated symbolically in or near the circle.
near the triangle.
MX269022A
LTE TDD Downlink Measurement Software
Operation Manual Operation
15 May 2009 (First Edition)
31 October 2019 (21st Edition)
Copyright © 2009-2019, ANRITSU CORPORATION.
All rights reserved. No part of this manual may be reproduced without the prior written permission of the
publisher.
The contents of this manual may be changed without prior notice.
Printed in Japan
ii
Page 3

iii
Equipment Certificate
Anritsu Corporation guarantees that this equipment was inspected at
shipment and meets the published specifications.
Anritsu Warranty
During the warranty period, Anritsu Corporation will repair or exchange this
•
software free-of-charge if it proves defective when used as described in the
operation manual.
The warranty period is 6 months from the purchase date.
•
The warranty period after repair or exchange will remain 6 months from
•
the original purchase date, or 30 days from the date of repair or
exchange, depending on whichever is longer.
This warranty does not cover damage to this software caused by Acts of
•
God, natural disasters, and misuse or mishandling by the customer.
In addition, this warranty is valid only for the original equipment purchaser. It
is not transferable if the equipment is resold.
Anritsu Corporation shall assume no liability for injury or financial loss of the
customer due to the use of or a failure to be able to use this equipment.
Anritsu Corporation Contact
In the event of this equipment malfunctions, contact an Anritsu Service and
Sales office. Contact information can be found on the last page of the printed
version of this manual, and is available in a separate file on the PDF version.
Page 4

iv
This product and its manuals may require an Export License/Approval by
the Government of the product's country of origin for re-export from your
country.
Before re-exporting the product or manuals, please contact us to confirm
whet
When you dispose of export-controlled items, the products/manuals need
to be broken/shredded so as not to be unlawfully used for military purpose.
Notes On Export Management
her they are export-controlled items or not.
Page 5

v
Software End-User License Agreement (EULA)
Please read this Software End-User License Agreement (hereafter this EULA) carefully before using
(includes executing, copying, registering, etc.) this software (includes programs, databases, scenarios,
etc., used to operate, set, etc., Anritsu electronic equipment). By reading this EULA and using this
software, you are agreeing to be bound by the terms of its contents and Anritsu Corporation (hereafter
Anritsu) hereby grants you the right to use this Software with the Anritsu-specified equipment
(hereafter Equipment) for the purposes set out in this EULA.
1. Grant of License and Limitations
1. Regardless of whether this Software was
purchased from or provided free-of-charge by
Anritsu, you agree not to rent, lease, lend, or
otherwise distribute this Software to third
parties and further agree not to disassemble,
recompile, reverse engineer, modify, or
create derivative works of this Software.
2. You may make one copy of this Software for
backup purposes only.
3. You are not permitted to reverse engineer
this software.
4. This EULA allows you to install one copy of
this Software on one piece of Equipment.
2. Disclaimers
To the extent not prohibited by law, in no
event shall Anritsu be liable for personal
injury, or any incidental, special, indirect or
consequential damages whatsoever,
including, without limitation, damages for
loss of profits, loss of data, business
interruption or any other commercial
damages or losses, arising out of or related
to your use or inability to use this Software.
3. Limitation of Liability
a. If a fault (bug) is discovered in this Software,
preventing operation as described in the
operation manual or specifications whether
or not the customer uses this software as
described in the manual, Anritsu shall at its
own discretion, fix the bug, or exchange the
software, or suggest a workaround,
free-of-charge. However, notwithstanding
the above, the following items shall be
excluded from repair and warranty.
i) If this Software is deemed to be used for
purposes not described in the operation
manual or specifications.
ii) If this Software is used in conjunction with
other non-Anritsu-approved software.
iii) Recovery of lost or damaged data.
iv) If this Software or the Equipment has been
modified, repaired, or otherwise altered
without Anritsu's prior approval.
v} For any other reasons out of Anritsu's direct
control and responsibility, such as but not
limited to, natural disasters, software virus
infections, etc.
b. Expenses incurred for transport, hotel, daily
allowance, etc., for on-site repairs by Anritsu
engineers necessitated by the above faults
shall be borne by you.
c. The warranty period for faults listed in
article 3a above covered by this EULA shall
be either 6 months from the date of purchase
of this Software or 30 days after the date of
repair, whichever is longer.
Page 6

vi
4. Export Restrictions
You may not use or otherwise export or
re-export directly or indirectly this Software
except as authorized by Japanese and
United States law. In particular, this
software may not be exported or re-exported
(a) into any Japanese or US embargoed
countries or (b) to anyone on the Japanese or
US Treasury Department's list of Specially
Designated Nationals or the US Department
of Commerce Denied Persons List or Entity
List. By using this Software, you warrant
that you are not located in any such country
or on any such list. You also agree that you
will not use this Software for any purposes
prohibited by Japanese and US law,
including, without limitation, the
development, design and manufacture or
production of missiles or nuclear, chemical or
biological weapons of mass destruction.
5. Termination
Anritsu shall deem this EULA terminated if
you violate any conditions described herein.
This EULA shall also be terminated if the
conditions herein cannot be continued for
any good reason, such as violation of
copyrights, patents, or other laws and
ordinances.
6. Reparations
If Anritsu suffers any loss, financial or
otherwise, due to your violation of the terms
of this EULA, Anritsu shall have the right to
seek proportional damages from you.
7. Responsibility after Termination
Upon termination of this EULA in
accordance with item 5, you shall cease all
use of this Software immediately and shall
as directed by Anritsu either destroy or
return this Software and any backup copies,
full or partial, to Anritsu.
8. Dispute Resolution
If matters of dispute or items not covered by
this EULA arise, they shall be resolved by
negotiations in good faith between you and
Anritsu.
9. Court of Jurisdiction
This EULA shall be interpreted in
accordance with Japanese law and any
disputes that cannot be resolved by
negotiation described in Article 8 shall be
settled by the Japanese courts.
Page 7

vii
Only files that have been provided directly from Anritsu or generated
All other required files should be transferred by means of USB or
Do not download or install software that has not been specifically
y protection in
place.
Cautions against computer virus infection
• Copying files and data
using Anritsu equipment should be copied to the instrument.
CompactFlash media after undergoing a thorough virus check.
• Adding software
recommended or licensed by Anritsu.
• Network connections
Ensure that the network has sufficient anti-virus securit
Page 8

viii
Page 9

About This Manual
(
)
(
)
Composition of Operation Manuals
The operation manuals for the MX269022A LTE TDD Downlink
Measurement Software are comprised as shown in the figure below.
MS2690A/MS2691A/MS2692A Signal Analyzer Operation Manual
Main Frame Operation
Or
MS2690A/MS2691A/MS2692A and MS2830A/MS2840A/MS2850A
Signal Analyzer Operation Manual (Main Frame Remote Control)
MS2830A Signal Analyzer Operation Manual
Main Frame Operation
MS2850A Signal Analyzer Operation Manual
(Main Frame Operation)
MX269022A LTE TDD Downlink Measurement Software
Operation Manual (Operat i on)
MX269022A LTE TDD Downlink Measurement Software
Operation Manual (Remote Control)
I
Page 10

Signal Analyzer Operation Manual (Mainframe Operation)
Signal Analyzer Operation Manual (Mainframe Remote Control)
These manuals describe basic operating methods, maintenance
procedures, common functions, and common remote control of the signal
analyzer mainframe.
LTE TDD Downlink Measurement Software Operation Manual
(Operation) <This document>
This manual describes basic operating methods, and functions of the LTE
TDD Downlink Measurement Software. As for signal analyzer
hardware and its basic functions and operation outline, refer to
MS2690A/MS2691A/MS2692A Signal Analyzer Operation Manual
(Mainframe Operation), MS2830A Signal Analyzer Operation Manual
(Mainframe Operation),
(Mainframe Operation)
or
MS2850A Signal Analyzer Operation Manual
.
LTE TDD Downlink Measurement Software Operation Manual (Re mote
Control)
This manual describes remote control of the LTE TDD Downlink
Measurement Software. As for signal analyzer application’s basic remote
control functions and its definitions of common commands, refer to
MS2690A/MS2691A/MS2692A and MS2830A/MS2840A/MS2850A Signal
Analyzer Operation Manual (Mainframe Remote Control)
.
Convention Used in This Manual
Throughout this document, the use of MS269xA Series is assumed unless
otherwise specified. If using MS2830A or MS2850A, change MS269xA to
read MS2830A, MS2850A.
In this document,
indicates a panel key.
II
Page 11

Table of Contents
1
About This Manual........................................ I
Chapter 1 Overview .................................... 1-1
1.1 Product Overview ...................................................... 1-2
1.2 Product Configuration ................................................ 1-3
1.3 Specifications ............................................................. 1-4
Chapter 2 Preparation ................................ 2-1
2.1 Part Names ................................................................ 2-2
2.2 Signal Path Setup ...................................................... 2-14
2.3 Application Startup and Selection .............................. 2-15
2.4 Initialization and Calibration ....................................... 2-16
2
3
4
5
Chapter 3 Measurement ............................ 3-1
3.1 Basic Operation ....................................................... 3-6
3.2 Setting Frequency and Level ................................... 3-12
3.3 Setting Trigger ......................................................... 3-15
3.4 Common Settings .................................................... 3-17
3.5 Setting Modulation Analysis ..................................... 3-23
3.6 Modulation Analysis Measurement and Results ...... 3-47
3.7 Power vs Time Setting ............................................. 3-71
3.8 Measurement and Result for Power vs Time .......... 3-84
3.9 MIMO Summary Settings ......................................... 3-91
3.10 MIMO Summary Measurement Results .................. 3-93
3.11 Setting Batch Measurement .................................... 3-95
3.12 Batch Measurement Results .................................... 3-131
3.13 Spectrum Measurement .......................................... 3-133
6
Index
III
Page 12

Chapter 4 Digitizing and Replaying .......... 4-1
4.1 Digitize function.......................................................... 4-2
4.2 Replay Function ......................................................... 4-8
Chapter 5 Performance Test ..................... 5-1
5.1 Overview of Performance Test .................................. 5-2
5.2 Performance Test Items ............................................ 5-3
Chapter 6 Other Functions ........................ 6-1
6.1 Selecting Other Functions ......................................... 6-2
6.2 Setting Title ................................................................ 6-2
6.3 Erasing Warmup Message ........................................ 6-2
Index .......................................................... Index-1
IV.
Page 13

Chapter 1 Overview
This chapter provides an overview of the MX269022A LTE TDD
Measurement Software and describes the product configuration.
1
Product Overview ...................................................... 1-2
1.1
1.2 Product Configuration ................................................ 1-3
1.2.1 Standard configuration .................................. 1-3
1.2.2 Option ............................................................ 1-3
1.2.3 Applicable parts ............................................. 1-3
1.3 Specifications ............................................................. 1-4
Overview
1-1
Page 14

Chapter 1 Overview
1.1 Product Overview
MS269x Series, MS2830A, or MS2850A Signal Analyzer enables
high-speed, high-accuracy, and simple measurements of transmission
characteristics of base stations and mobile stations for various mobile
communications types. The MS2690A/MS2691A/MS2692A, MS2830A or
MS2850A is equipped with high-performance signal analyzer and
spectrum analyzer functions as standard, with optional measurement
software allowing modulation analysis functionality supporting various
digital modulation modes.
The MX269022A LTE TDD Downlink Measurement Software
(hereinafter referred to as MX269022A) is a software option for
measuring the RF characteristics of LTE TDD (Frame structure type 2)
downlink signal specified by 3GPP, TS36.211 V8.6.0 (2009-03) Physical
Channels and Modulation (Release 8).
The MX269022A provides the following measurement features.
Modulation accuracy measurement
Carrier frequency measurement
Transmitter power measurement
MS2830A-005/105 and MS2830A-006/106 is required to use the
MX269022A on MS2830A.
1-2
Page 15

1.2 Product Configuration
1.2.1 Standard configuration
Table 1.2.1-1 lists the standard configuration of the MX269022A.
Table 1.2.1-1 Standard configuration
1.2 Product Configuration
1
Overview
Item
Application MX269022A
Accessory ― Installation CD-ROM 1
Model
Name/Symbol
Product Name Q’ty Remarks
LTE TDD Downlink
Measurement Software
1
Application software,
operation manual CD-ROM
1.2.2 Option
Tables 1.2.2-1 list the option for the MX269022A. This is sold separately.
Table 1.2.2-1 Option
Option No. Product Name Remarks
MX269022A-001
LTE-Advanced TDD Downlink Measurement
Software
Only for MS269xA,
MS2830A, MS2850A
1.2.3 Applicable parts
Table 1.2.3-1 lists the applicable parts for the MX269022A.
Table 1.2.3-1 Applicable parts
Model
Name/Symbol
W3209AE
W3210AE
Product Name Remarks
MX269022A LTE TDD Downlink
Measurement Software Operation
Manual (Operation)
MX269022A LTE TDD Downlink
Measurement Software Operation
Manual (Remote Control)
English,
printed version
English,
printed version
1-3
Page 16

Chapter 1 Overview
1.3 Specifications
Table 1.3-1 shows the specifications for the MX269022A.
When MS2830A, MS2850A is used, this software’s specification is
specified by the condition below, unless otherwise noted.
Attenuator Mode: Mechanical Atten Only
Table 1.3-1 Specifications
Item Specification
Common Specifications
Channel bandwidth 1.4, 3, 5, 10, 15, 20 MHz
Target signal LTE TDD Downlink
Capture time
Modulation/Frequency Measurement
Measurement frequency
ranges
Measurement level range
Carrier frequency accuracy
Capture Time = Auto : 5 frame
Capture Time = Manual : 5 to 150 frame
MS269x Series: 600 to 4000 MHz
MS2830A-041/043/044/045:
600 to 4000 MHz
MS2830A-040: 600 to 3600 MHz
MS2850A: 600 to 4000 MHz (Analysis bandwidth ≤ 31.25 MHz)
800 to 4000 MHz (Analysis bandwidth > 31.25 MHz)
15 to +30 dBm (at Pre-Amp Off, or Pre-Amp not installed.)
30 to +10 dBm (at Pre-Amp On)
After CAL execution at 18 to 28ºC
For a signal of EVM = 1%
When Downlink 10 Subframe is the measurement target
MS269x series:
(accuracy of reference frequency carrier frequency + 3 Hz)
(Excluding the Batch Measurement when MS269xA-004/104 is
installed)
MS2830A:
(accuracy of reference frequency carrier frequency + 3.5 Hz)
(When the center frequency is from 600 MHz to 2700 MHz and
MS2830A-078/178 is not installed)
(accuracy of reference frequency carrier frequency + 8.0 Hz)
(When the center frequency is from 2700 MHz to 4000 MHz and
MS2830A-078/178 is not installed)
(accuracy of reference frequency carrier frequency + 4.0 Hz)
(In the CC of the center frequency when the center frequency is
from 600 MHz to 2700 MHz and MS2830A-078/178 is installed)
(At the input level of –4 dBm when MS2830A-045 is installed)
(accuracy of reference frequency carrier frequency + 8.0 Hz)
(In the CC of the center frequency when the center frequency is
from 2700 MHz to 4000 MHz and MS2830A-078/178 is installed)
(And when MS2830A-045 is installed, at the input level of –4 dBm)
1-4
Page 17

Table 1.3-1 Specifications (Cont’d)
1.3 Specifications
Item Specification
MS2850A:
(accuracy of reference frequency carrier frequency + 4.0 Hz)
Carrier frequency accuracy
Residual EVM
Transmitter power accuracy
Waveform display
Adjacent Channel Power Measurement
Measurement method
(Center frequency 600 to 2700 MHz (Analysis bandwidth ≤ 31.25 MHz))
(Center frequency 800 to 2700 MHz (Analysis bandwidth > 31.25 MHz))
(accuracy of reference frequency carrier frequency + 8.0 Hz)
(Center frequency 2700 to 4000 MHz)
After CAL execution at 18 to 28C
When Downlink 10 Subframe is the measurement target
MS269x series: 1.0% (rms)
(When MS269xA-078/178 is not installed.
When MS269xA-004/104 is installed, excluding the Batch
Measurement.)
< 1.3% (rms)
(When MS269xA-078/178 is installed, in the CC of the center frequency. )
MS2830A:
(When MS2830A-078/178 is not installed. At the input level of –4 dBm
when MX2830A-045 is installed)
1.3% (rms)
(When MS2830A-078/178 is installed, in the CC of the center frequency.
At the input level of –4 dBm when MX2830A-045 is installed)
MS2850A:
After CAL execution at 18 to 28ºC, input attenuator ≥ 10 dB,
The signal measured is within the measurement level range and less
than or equal to Input Level.
MS269x series:
0.6 dB (at Pre-Amp Off, or Pre-Amp not installed.)
1.1 dB (at Pre-Amp On)
(When MS269xA-004/104 is installed, excluding the Batch
Measurement. )
MS2830A:
0.6 dB (at Pre-Amp Off, or Pre-Amp not installed.)
MS2850A:
0.6 dB (at Pre-Amp Off, or Pre-Amp not installed.)
1.1 dB (at Pre-Amp On)
The transmitter power accuracy is obtained by an RSS (root summed
square) error of the absolute amplitude accuracy and in-band
frequency characteristics.
Provides functions for displaying waveforms below.
Constellation
EVM vs Subcarrier
EVM vs Symbol
Power vs Resource Block
EVM vs Resource Block
Spectral Flatness
Executes the adjacent channel power measurement function of the
Spectrum Analyzer or Signal Analyzer.
1.3% (rms)
1.3% (rms)
1
Overview
1-5
Page 18

Chapter 1 Overview
Table 1.3-1 Specifications (Cont’d)
Item Specification
Occupied Bandwidth Measurement
Measurement method
Executes the occupied bandwidth measurement function of the Spectrum
Analyzer or Signal Analyzer.
Channel Power Measurement
Measurement method
Executes the channel power measurement function of the Spectrum
Analyzer or Signal Analyzer.
Spectrum Emission Mask Measurement
Measurement method
Executes the spectrum emission mask measurement function of the
Spectrum Analyzer.
Digitize function
Function overview
Outputs acquired waveform data to the internal storage device or to
external storage device.
Format: I, Q (32 bit floating point binary format)
Level: If 0 dBm is input, the following is assumed:
Waveform data
22
= 1
QI
Level accuracy:
Same as absolute amplitude accuracy and in-band frequency
characteristics of signal analyzer.
Replay Function
Analyzes each trace from the saved waveform data.
Function overview
Format: I, Q (32 bit floating point binary format)
Sampling rate: 50 MHz
Power vs Time
Function overview
Provides measurements for Transmitter OFF Power, Time Mask, and
Transmitter Transient Period.
121.4 dB (nominal) *
1, *2, *3
*1: This is the value when Channel bandwidth is 5 MHz.
For the other channel bandwidth, the following formula can be
Dynamic range
used.
10log
10
( Channel bandwidth / 5.0 MHz ) dB
*2: Wide Dynamic Range = On, Noise Correction = On
*3: Applied to only MS269x series
MIMO Summary
Function overview Inputs multiple MIMO signals and measures timing differences.
1-6.
Page 19

Chapter 2
This chapter describes the preparations required for using the
application you are using. Refer to the
Signal Analyzer Operation Manual (Mainframe Operation),
Signal Analyzer Operation Manual (Mainframe Operation)
Signal Analyzer Operation Manual (Mainframe Operation)
features not included in this manual.
Part Names ................................................................... 2-2
2.1
2.1.1 Front panel ....................................................... 2-2
2.1.2 Rear panel ........................................................ 2-9
2.2 Signal Path Setup ....................................................... 2-14
2.3 Application Startup and Selection ............................... 2-15
2.3.1 Launching application ..................................... 2-15
2.3.2 Selecting application....................................... 2-15
2.4 Initialization and Calibration ........................................ 2-16
2.4.1 Initialization ..................................................... 2-16
2.4.2 Calibration ...................................................... 2-16
MS2690A/MS2691A/MS2692A
Preparation
MS2830A
or
MS2850A
for common
2
Preparation
2-1
Page 20
Chapter 2 Preparation
2.1 Part Names
This section describes the panel keys for operating the instrument and
connectors used to connect external devices. For general points of caution,
refer to the
Manual (Mainframe Operation), MS2830A Signal Analyzer Operation
Manual (Mainframe Operation)
Manual (Mainframe Operation)
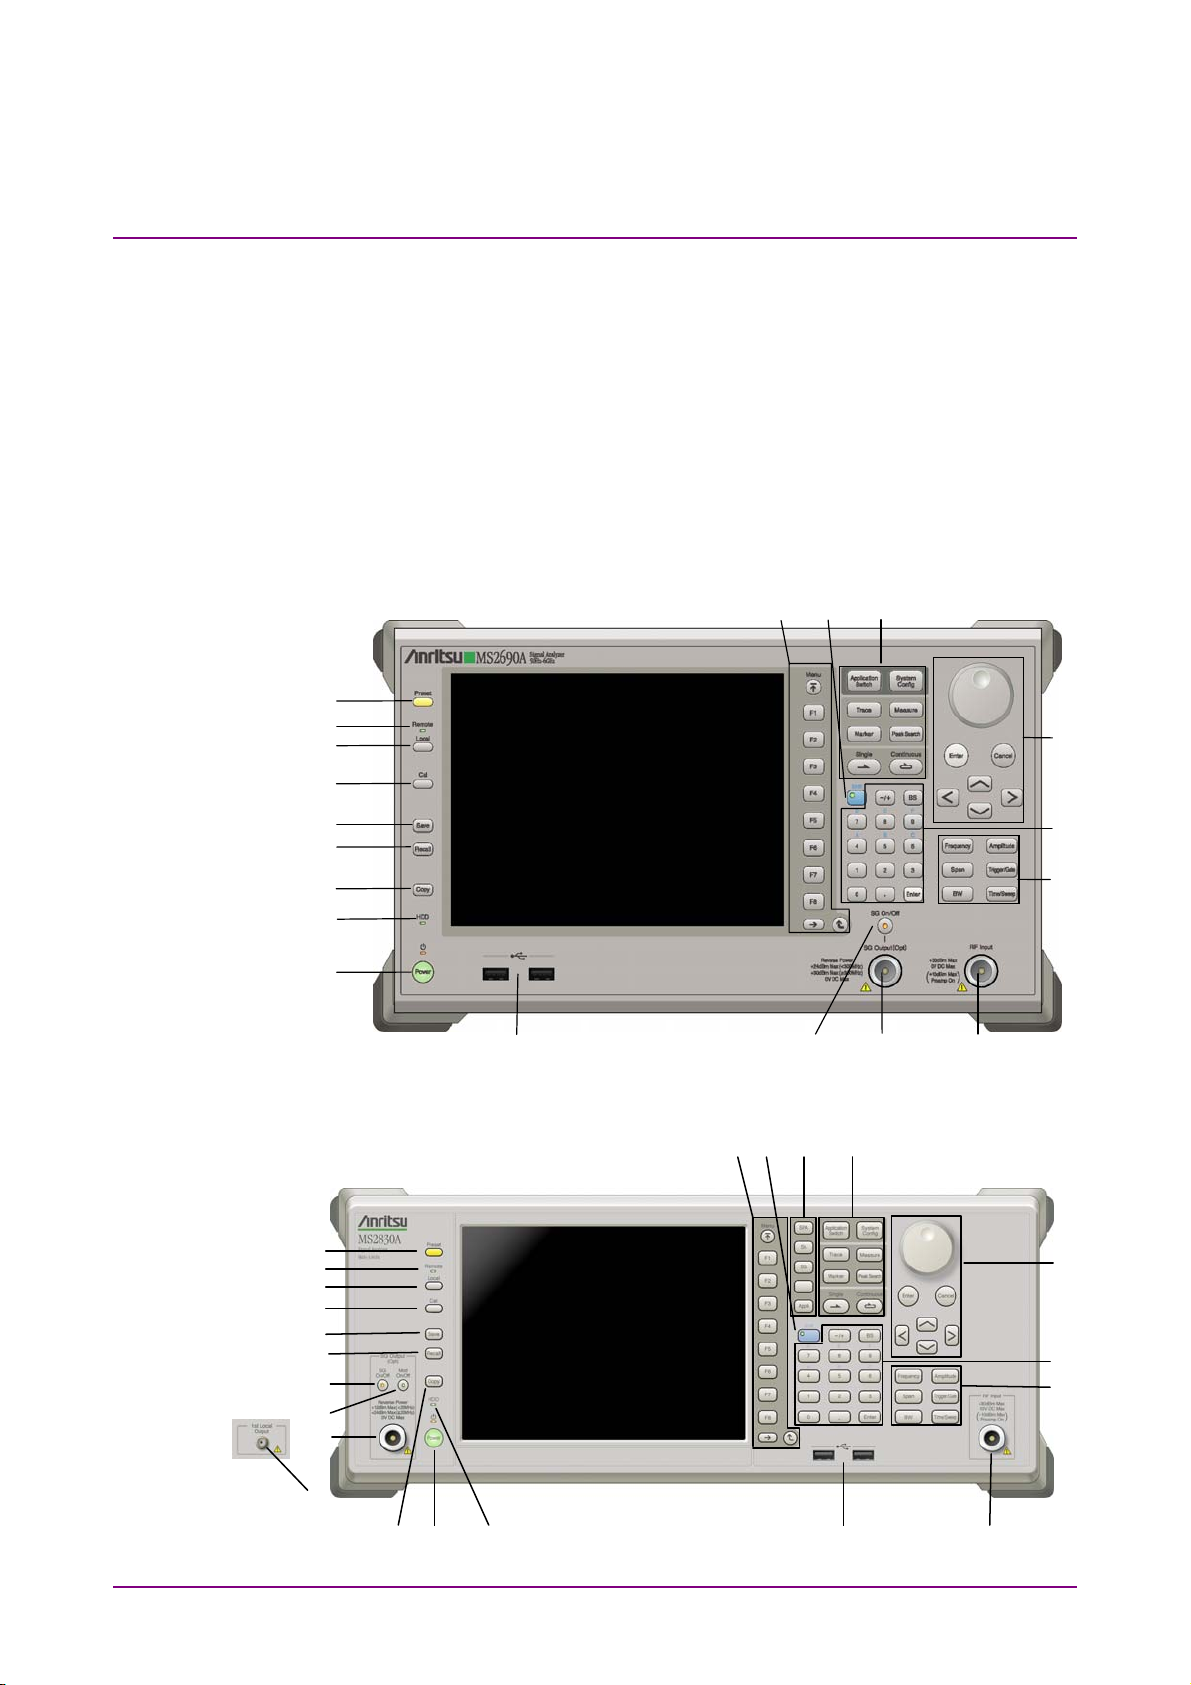
2.1.1 Front panel
This section describes the front-panel keys and connectors.
9
8
7
MS2690A/MS2691A/MS2692A Signal Analyzer Operation
or
MS2850A Signal Analyzer Operation
.
10
14
12
13
6
5
4
3
2
1
19
17
18
16
15
11
Figure 2.1.1-1 MS269x series front panel
9
8
7
6
5
4
17
20
18
10 21 12 14
13
15
11
2-2
22
3 21
19 16
Figure 2.1.1-2 MS2830A/MS2850A front panel (MS2830A Example)
Page 21
2.1 Part Names
1
2
SSD
SSD access lamp (MS2850A)
3
4
5
6
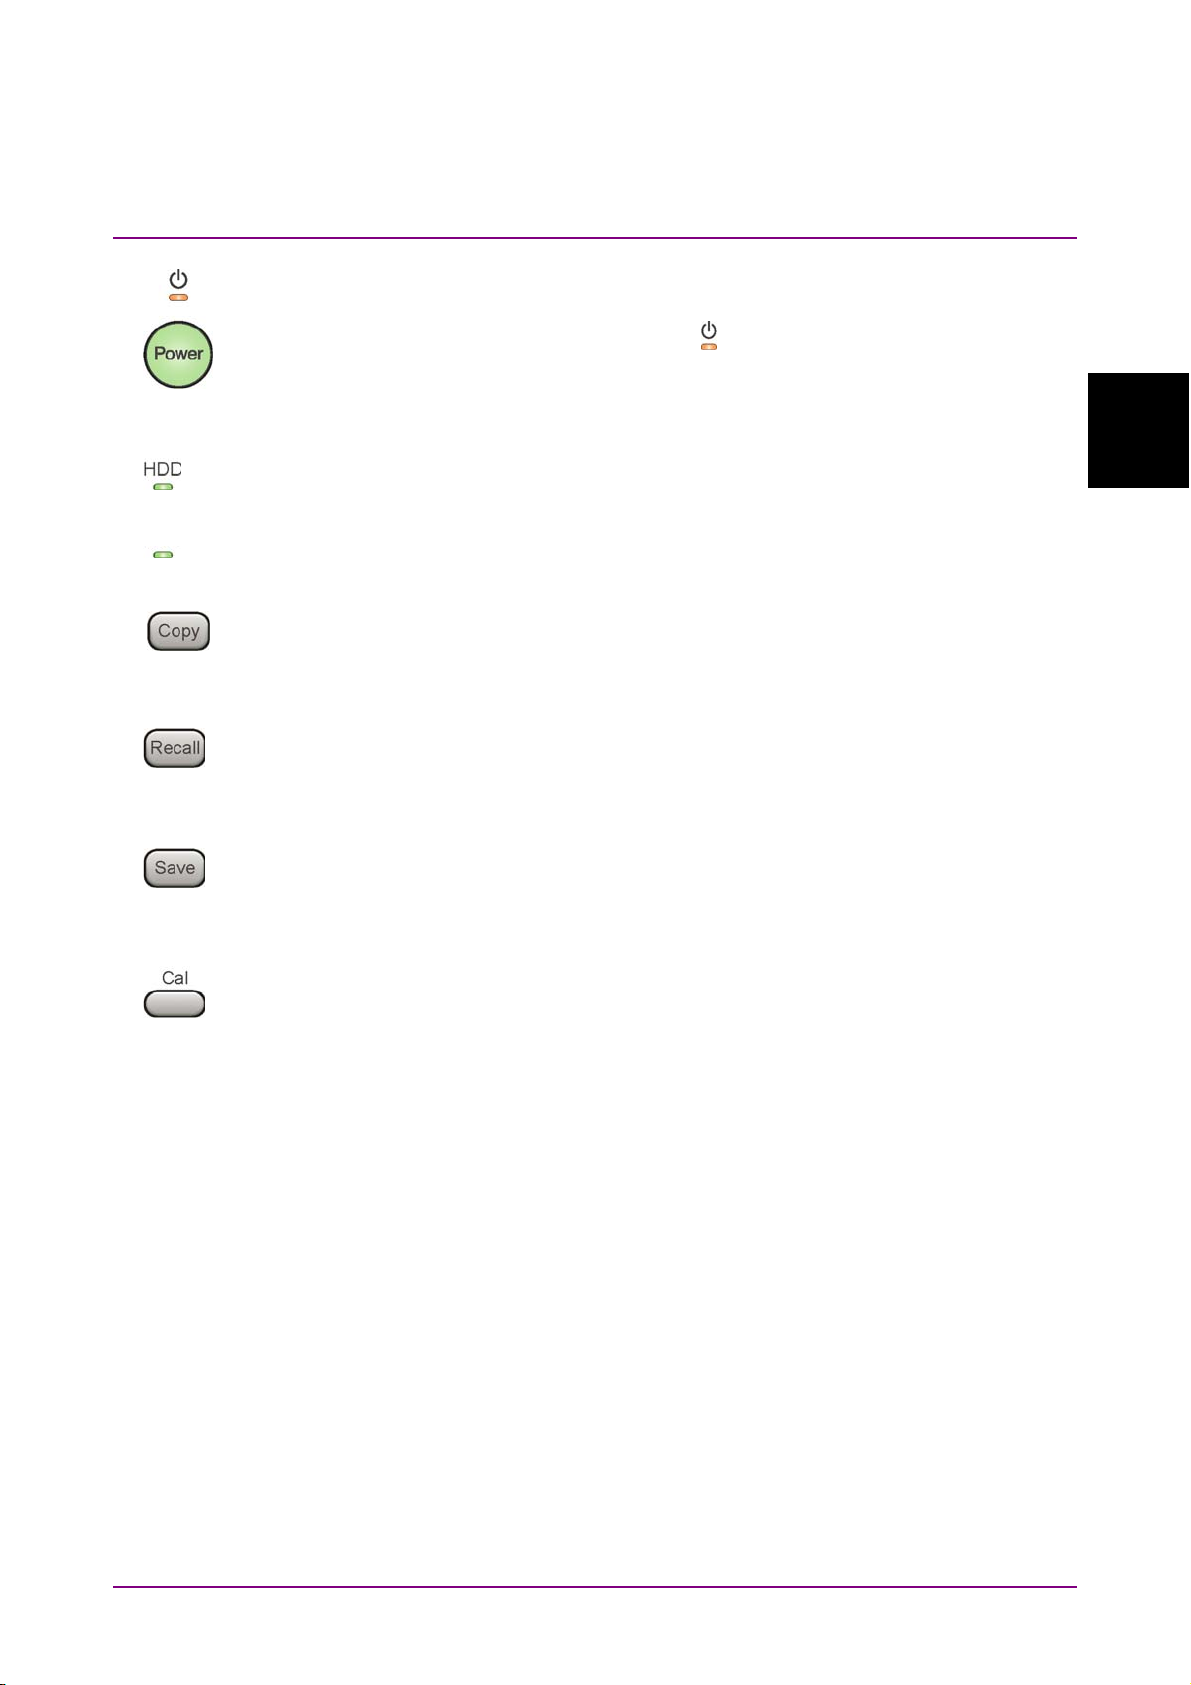
Power Switch
Press to switch between the standby state (AC power supplied) and
power-on state. The Power lamp
Power On. Press the power switch for about 2 seconds.
Hard disk access lamp (MS269x series, MS2830A)
Lights up when the internal hard disk is accessed.
Lights up when the internal SSD is accessed .
Copy key
Press to capture display screen and save to file.
Recall key
Press to recall parameter file.
Save key
Press to save parameter file.
Cal key
Press to display the Calibration menu.
lights orange at Standby and green at
Preparation
2
2-3
Page 22

Chapter 2 Preparation
7
8
9
10
Local key
Press to return to local operation from remote control via GPIB, Ethernet,
or USB (B), and enable panel settings.
Remote lamp
Lights when in remote-control state.
Preset key
Resets parameters to initial settings.
Function keys
Selects or configures function menu displayed on the right of the screen.
The function menu is provided in multiple pages and layers.
Press
is displayed at the bottom of the function menu, as in “1 of 2”.
Sub-menus may be displayed when a function menu is pressed. Press
to go back to the previous menu. Press
to fetch next function menu page. The current page number
to go back to the top menu.
2-4
Page 23

2.1 Part Names
11
12
Main function keys 1
Press to set or execute main functions.
Executable functions vary with the current application. When nothing
happens with the press, it indicates that the application in use does not
support the key.
Press to set frequency parameters.
Press to set level parameters.
No function is assigned to this key.
Press to set trigger parameters.
No function is assigned to this key.
Press to set measurement item parameters.
Main function keys 2
Press to set or execute main functions.
Executable functions vary with the current application. When nothing
happens with the press, it indicates that the application in use does not
support the key.
2
Preparation
Press to switch application.
Press to display Configuration screen.
Press to set the trace items or to switch the operation window.
Press to set measurement item parameters.
Use when switching graph marker operation.
Press to set parameters related to the peak search function.
Press to start single measurement.
Press to start continuous measurements.
2-5
Page 24
Chapter 2 Preparation
13
14
15
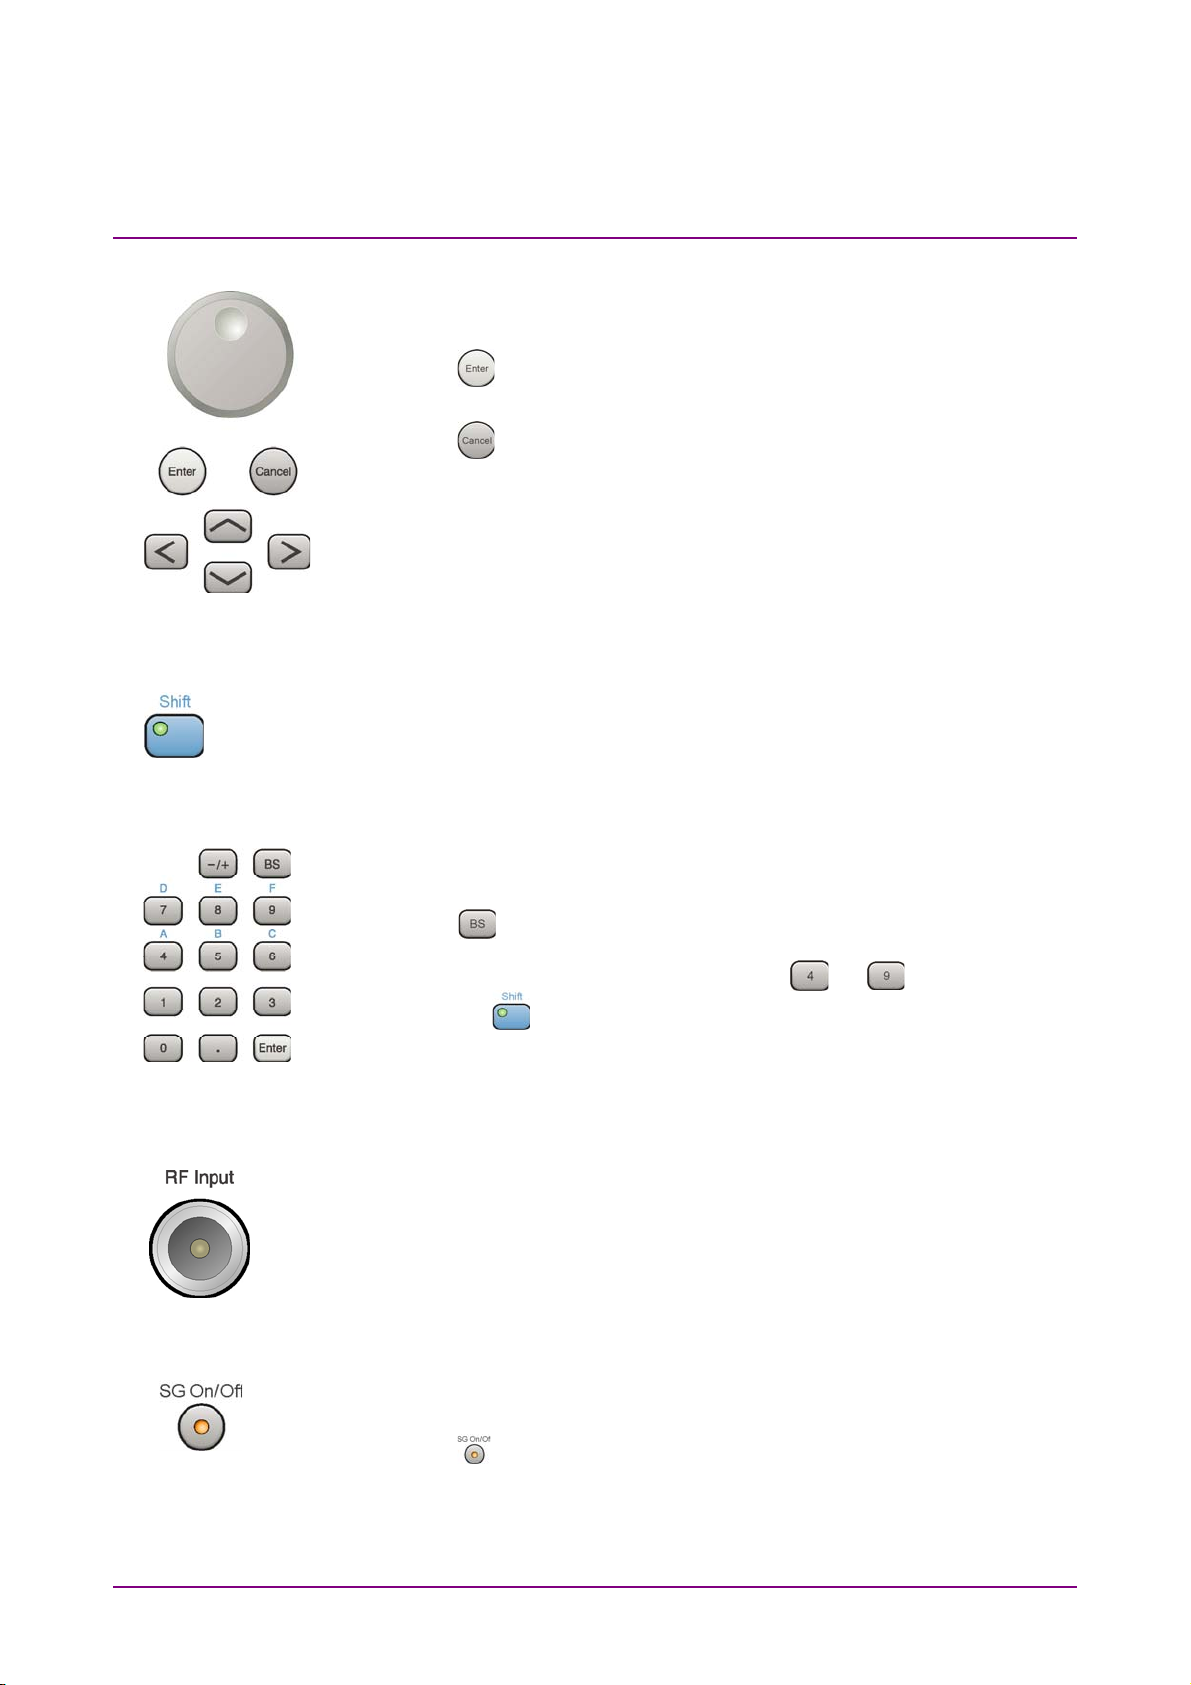
Rotary knob/Cursor key/Enter key/Cancel key
The rotary knob and cursor keys select display items or change settings.
Press
Press
Shift key
Operates keys with functions in blue characters on panel. Press the Shift
key so the key lamp is green and then press the target key.
Numeric keypad
Enters numbers on parameter setup screens.
to set the entered or selected data.
to cancel input or selected data.
16
17
Press
[A] to [F] can be entered by pressing keys
key lamp
RF Input connector
Inputs RF signal. This is an N type input connector.
For the MS2830A with the MS2830A-045 and the MS2850A, a K type
input connector is installed.
RF Output Control key (when MS269xA-0 20/120, MS2830A-020/120/021/121
is installed)
Press
Signal Generator option is installed. The RF output control key lamp
lights orange when the RF signal output is set to On.
This cannot be installed on the MS2830A with the MS2830A-044/045, or
on the MS2850A.
to delete the last entered digit or character.
to while the Shift
is green.
to switch on/off the modulation of RF signal when the Vector
2-6
Page 25
2.1 Part Names
18
19
20
21
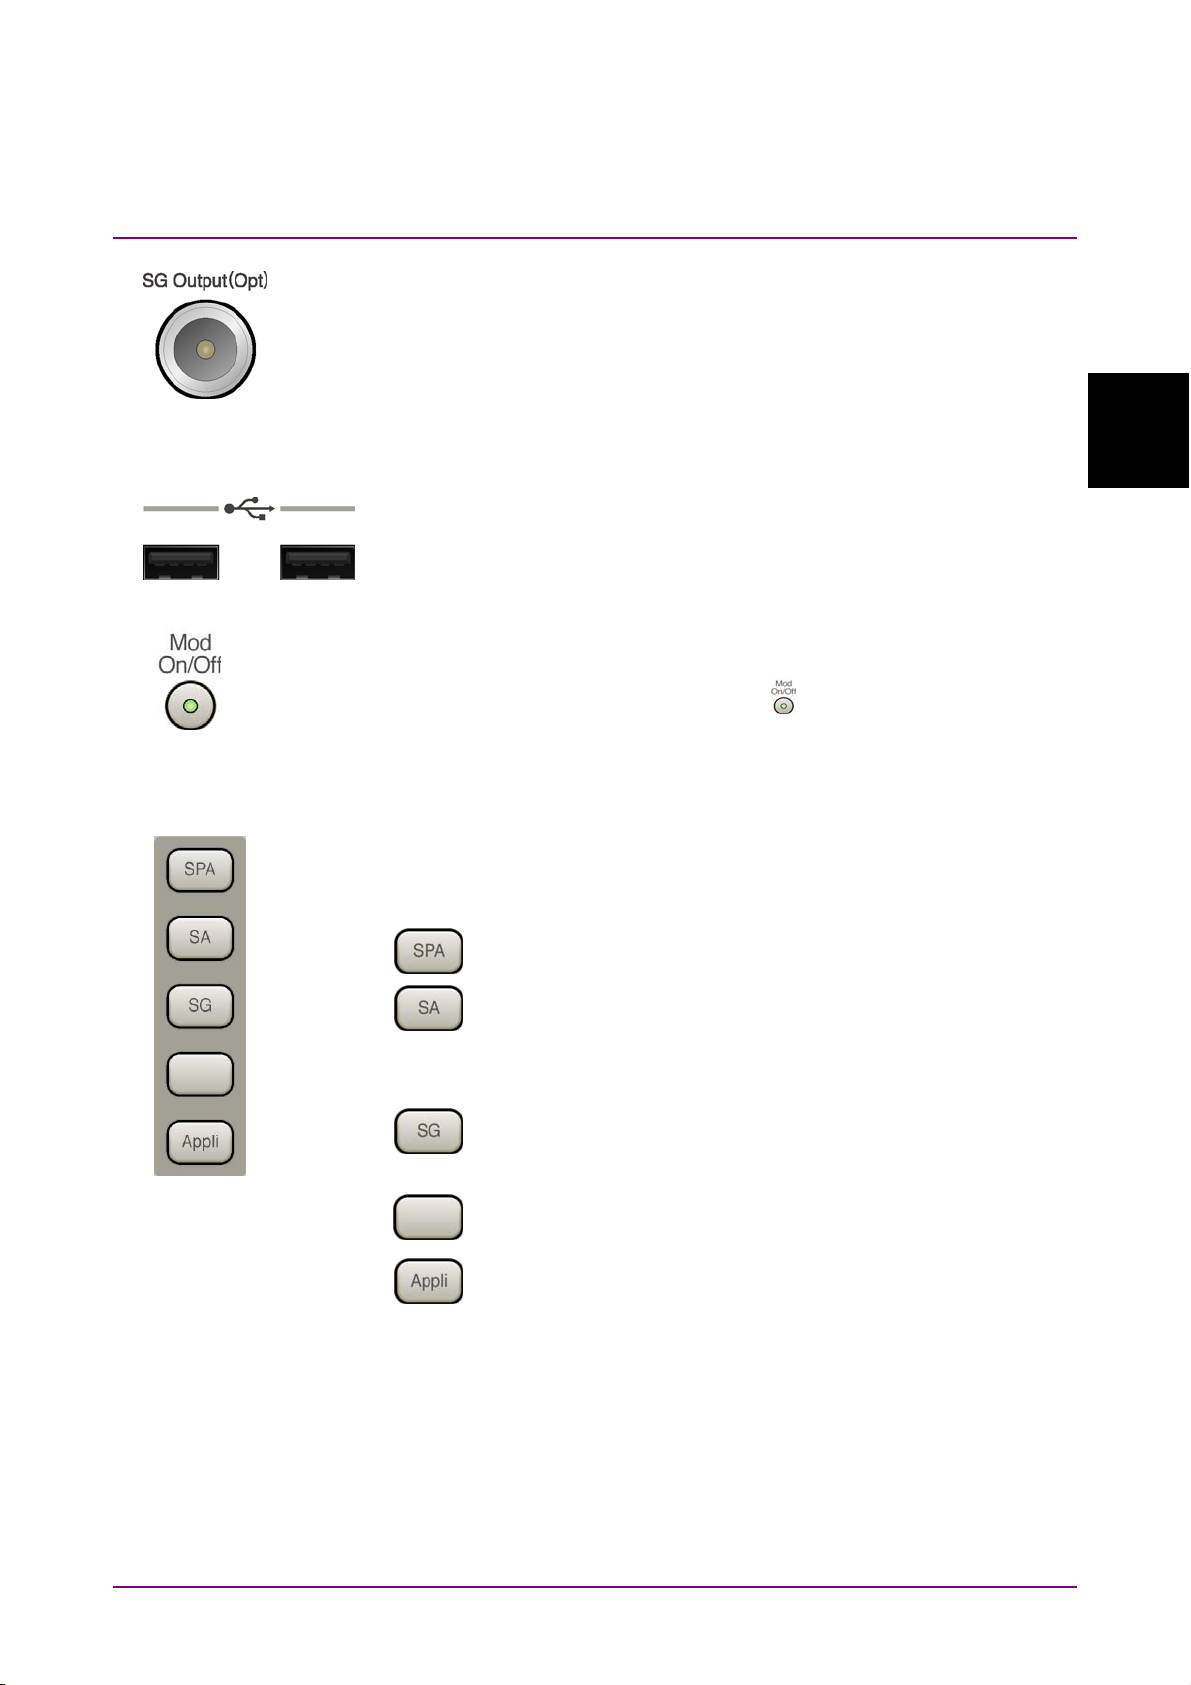
RF Output connector (when MS269xA-020/120, MS2830A-020/120/021/121
installed)
Outputs RF signal, when the Vector Signal Generator option is installed.
This is an N type output connector.
This cannot be installed on the MS2830A with the MS2830A-044/045, or
on the MS2850A
USB connector (type A)
Connect the accessory USB keyboard, mouse or USB memory.
Modulation control key (when MS2830A-020/120/021/121 installed)
Press to switch on/off the modulation of RF signal when the Vector Signal
Generator option is installed. The lamp
in the modulation On state.
This cannot be installed on the MS2830A with the MS2830A-044/045, or
on the MS2850A.
Application key (MS2830A, MS2850A)
Press to switch between applications.
Press to display the Spectrum Analyzer main screen.
Press to display the Signal Analyzer main screen, when
MS2830A-005/105/007/006/106/009/109/077/078 or MS2850A
are installed.
Press to display the Signal Generator main screen, when Vector
Signal Generator option is installed. (MS2830A only)
This is a blank key. Not used. (MS2830A only)
Displays the main screen of the application that is selected
using the Application Switch (Auto), or displays that of the
pre-selected application (Manual).
For details, refer to 3.5.4 “Changing application layout” in
on the key lights up in green
MS2830A Signal Analyzer Operation Manual (Mainframe
Operation) or MS2850A Signal Analyzer Operation Manual
(Mainframe Operation)
.
Preparation
2
2-7
Page 26

Chapter 2 Preparation
1st Local Output connector (MS2830A, MS2850A)
22
This is installed with the MS2830A-044/045, or MS2850A.
Supplies local signal and bias current to the external mixer, and receives
the IF signal with its frequency converted.
2-8
Page 27
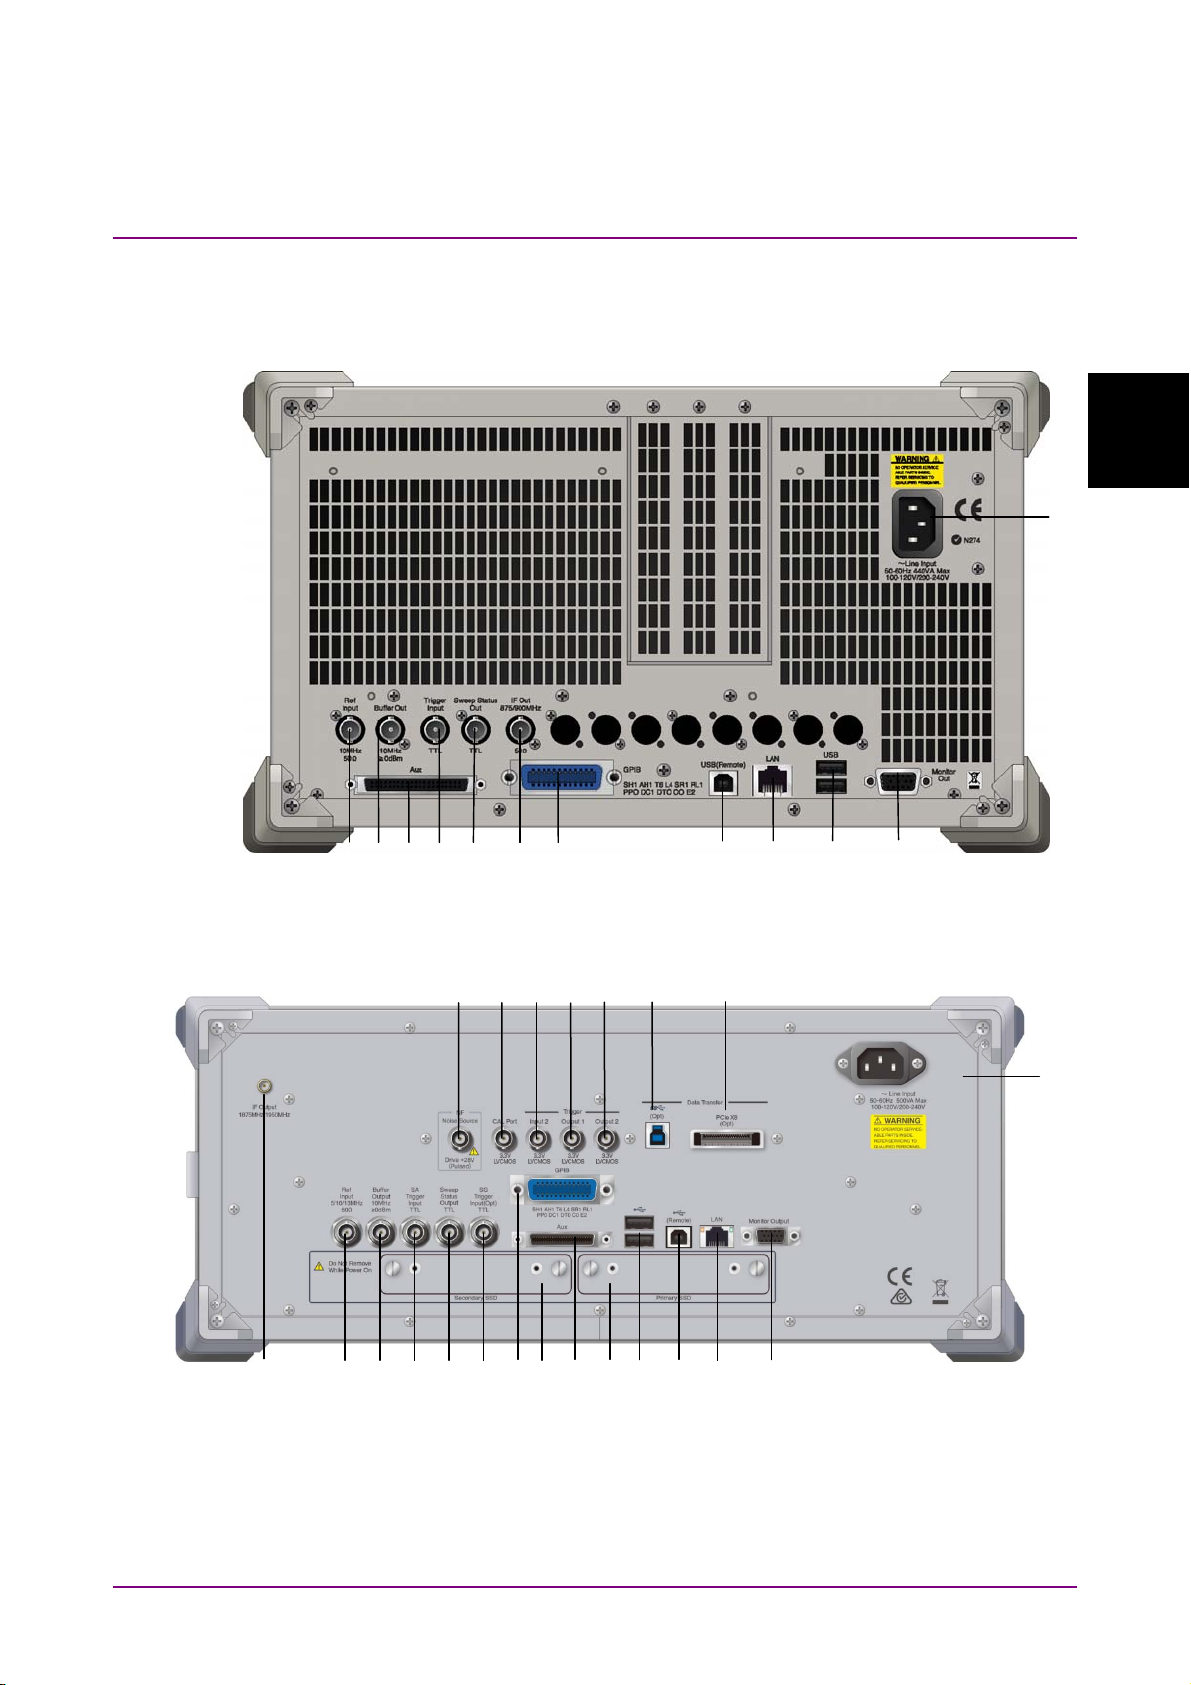
2.1.2 Rear panel
2.1 Part Names
This section describes the rear-panel connectors.
2
Preparation
12
1
2 6 3 4 5
Figure 2.1.2-1 MS269x series rear panel
18 19
Figure 2.1.2-2 MS2830A/MS2850A rear panel (MS2850A Example)
7
20 21
22 23 24
8 9 10
981067144 13 2 1 16 1517
11
11
12
2-9
Page 28

Chapter 2 Preparation
1
2
3
4
5
6
7
GP-IB
Ref Input connector (reference frequency signal input connector)
Inputs external reference frequency signal. It is for inputting reference
frequency signals with higher accuracy than the instrument’s internal
reference signal, or for synchronizing the frequency of the
MS2690A/MS2691A/MS2692A or MS2830A, MS2850A to that of other
equipment. The following frequencies are supported:
MS269x series: 10 MHz/13 MHz
MS2830A, MS2850A: 5 MHz/10 MHz/13 MHz
Buffer Out connector (reference frequency signal output connector)
Outputs the internal reference frequency signal (10 MHz). It is for
synchronizing frequencies between other equipment and the
MS2690A/MS2691A/MS2692A or MS2830A, MS2850A.
Trigger Input connector (MS269x series only)
Inputs trigger signal from external device.
Sweep Status Out connector
Outputs signal when internal measurement is performed or
measurement data is obtained.
IF Out connector (MS269x series only)
Not used.
AUX connector
Not used.
GPIB connector
For external control via GPIB.
2-10
Page 29

2.1 Part Names
8
9
10
11
12
Monitor Out
USB connector (type B)
For external control via USB.
Ethernet connector
Connects PC or Ethernet network.
USB connector (type A)
Used to connect a USB keyboard or mouse or the USB memory supplied.
Monitor Out connector
Connects external display.
AC inlet
Supplies power.
Preparation
2
13
14
15 HDD
16 HDD(Opt)
or
Primary HDD/SSD
or
Secondary HDD/SSD
SA Trigger Input connector (MS2830A, MS2850A)
This is a BNC connector for inputting external trigger signal (TTL) for
SPA and SA applications.
SG Trigger Input connector (MS2830A)
This is a BNC connector for inputting external trigger signal (TTL) for
Vector Signal Generator option.
HDD slot (MS2830A)
SSD slot (MS2850A)
HDD slot for Option (MS2830A)
SSD slot (MS2850A)
This is a standard HDD slot.
This is a standard SSD slot.
This is a HDD slot for the options.
This is a SSD slot for the options.
2-11
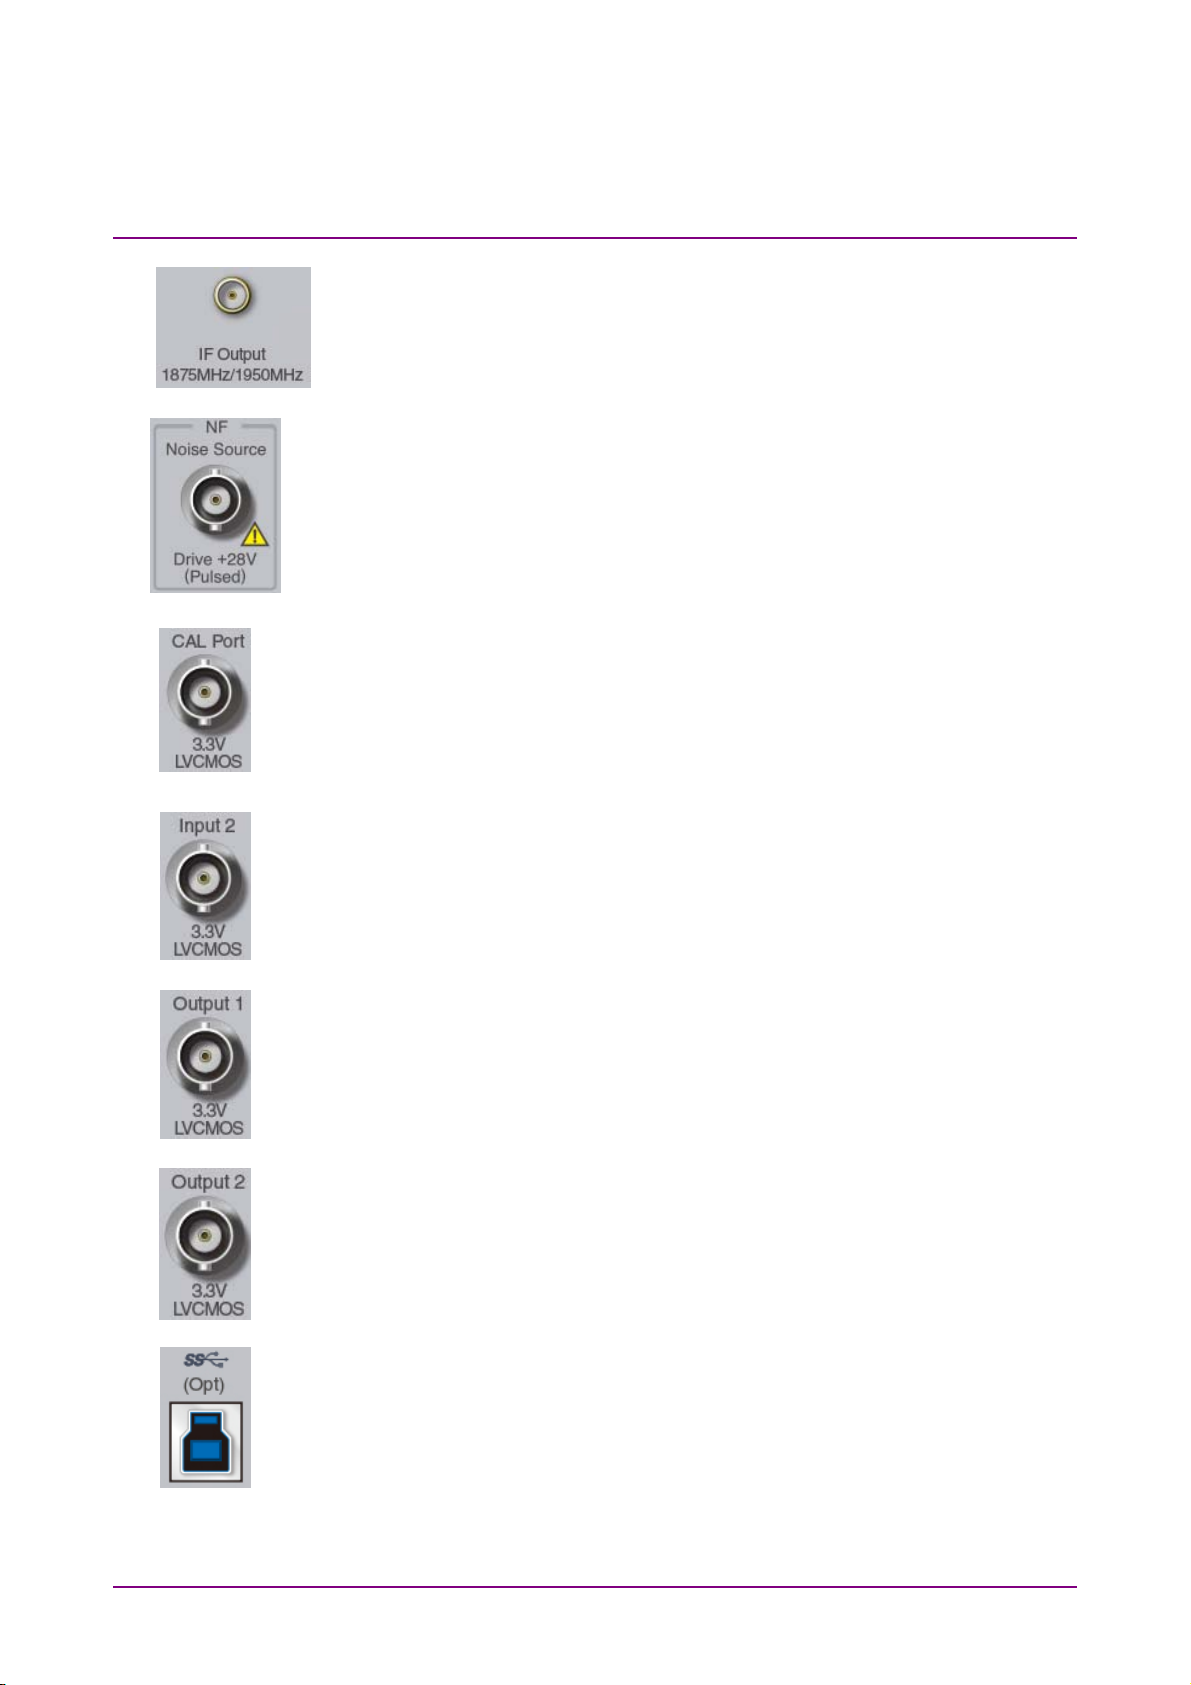
Page 30
Chapter 2 Preparation
17
Noise Source connector
18
CAL Port connector (Future extensions) (MS2850A)
19
Trigger Input 2 connector (MS2850A)
20
Trigger Output 1 connector (MS2850A)
21
Trigger Output 2 connector (MS2850A)
22
USB 3.0 connector (MS2850A)
23
IF output connector (MS2830A, MS2850A)
This is installed with the MS2830A-044/045 or on the MS2850A.
Monitor output of the internal IF signal.
Supply (+28 V) of the Noise Source Drive.
This is available when the Option 017/117 is installed.
Input the trigger signal (3.3 V LVCMOS) for SPA and SA applications.
Output the trigger signal (3.3 V LVCMOS).
Output the trigger signal (3.3 V LVCMOS).
This is available when the MS2850A-054/154 is installed.
2-12
Page 31

PCIe X8 connector (MS2850A)
24
This is available when the MS2850A-053/153 is installed.
2.1 Part Names
2
Preparation
2-13
Page 32

Chapter 2 Preparation
2.2 Signal Path Setup
As shown in Figure 2.2-1, connect the instrument and the DUT using an
RF cable, so that the signal to be tested is input to the RF Input
connector. To prevent an excessive level signal from being input, do not
input the signal before setting the input level using this application.
RF Input
DUT
Figure 2.2-1 Signal path setup example
Set the reference signal and/or trigger signal paths from external sources,
as required.
Trigger signal (TTL)
Reference frequency signal
2-14
Figure 2.2-2 External signal input
Page 33

2.3 Application Startup and Selection
2.3 Application Startup and Selection
To use this application, it is necessary to load (start up) and select the
application.
2.3.1 Launching application
The application startup procedure is described below.
Note:
The XXX indicates the application name currently in use.
<Procedure>
1. Press
2. Press
Switch Registration screen.
3. Press
in the Unloaded Applications list.
If “XXX” is displayed in the Loaded Applications list, this means
that the application is already loaded.
If “XXX” appears in neither the Loaded Applications nor Unloaded
Applications list, this means that the application has not been
installed.
4. Press
Loaded Applications list, this means that the application is already
loaded.
2
Preparation
to display the Configuration screen.
(Application Switch Settings) to display the Application
(Load Application Select), and move the cursor to “XXX”
(Set) to load the application. If “XXX” is displayed in the
2.3.2 Selecting application
The selection procedure is described below.
<Procedure>
1. Press
2. Press the menu function key displaying “XXX”.
The application can also be selected with mouse, by clicking “XXX” on the
task bar.
to display the Application Switch menu.
2-15
Page 34

Chapter 2 Preparation
2.4 Initialization and Calibration
This section describes the parameter settings and the preparations
required before starting measurement.
2.4.1 Initialization
After selecting this application, first perform initialization. Initialization
returns the settable parameters to their default value in order to clear
the measurement status and measurement results.
Note:
When another software application is switched to or this
application is unloaded (ended), the application keeps the
parameter settings at that time. The parameter values that were
last set will be applied when this application is selected next time.
2.4.2 Calibration
The initialization procedure is as follows.
<Procedure>
1. Press
2. Press
Perform calibration before performing measurement. Calibration sets the
level accuracy frequency characteristics for the input level to flat, and
adjusts level accuracy deviation caused by internal temperature
fluctuations. Calibration should be performed when first performing
measurement after turning on power, or if beginning measurement when
there is a difference in ambient temperature from the last time
calibration was performed.
<Procedure>
1. Press
2. Press
For details on calibration functionality only executable with this
instrument, refer to the
Operation Manual (Mainframe Operation),
Operation Manual (Mainframe Operation)
Operation Manual (Mainframe Operation)
to display the Preset function menu.
(Preset).
to display the Application Cal function menu.
(SIGANA All).
MS2690A/MS2691A/MS2692A Signal Analyzer
MS2830A Signal Analyzer
or
MS2850A Signal Analyzer
.
2-16.
Page 35

Chapter 3 Measurement
3-1
Measurement
This chapter describes the measurement functions and parameters of the
MX269022A, together with descriptions of how to set them.
3.1 Basic Operation ............................................................ 3-6
3.1.1 Screen layout .................................................... 3-6
3.1.2 Types of Measurement Function ...................... 3-9
3.1.3 Performing Measurement ............................... 3-10
3.1.4 Measurement Signals and Troubleshooting
Errors .............................................................. 3-11
3.2 Setting Frequency and Level ...................................... 3-12
3.2.1 Carrier Frequency ........................................... 3-12
3.2.2 Input Level ...................................................... 3-12
3.2.3 Offset .............................................................. 3-13
3.2.4 Pre-Amp ......................................................... 3-14
3.2.5 Auto Range ..................................................... 3-14
3.3 Setting Trigger ............................................................ 3-15
3.3.1 Trigger Switch ................................................. 3-15
3.3.2 Trigger Source ................................................ 3-15
3.3.3 Trigger Slope .................................................. 3-16
3.3.4 Trigger Delay .................................................. 3-16
3.3.5 Frame Sync Setup .......................................... 3-16
3.4 Common Settings ....................................................... 3-17
3.4.1 Channel Bandwidth ........................................ 3-17
3.4.2 Test Model ...................................................... 3-17
3.4.3 Test Model Version ......................................... 3-17
3.4.4 Uplink-downlink Configuration ........................ 3-18
3.4.5 Special Subframe Configuration ..................... 3-19
3.4.6 Synchronization Mode .................................... 3-20
3.4.7 Cell ID ............................................................. 3-20
3.4.8 Reference Signal Boosting ............................. 3-21
3.4.9 Number of Antenna Ports ............................... 3-21
3.4.10 Antenna Port ................................................... 3-22
3.5 Setting Modulation Analysis ........................................ 3-23
3.5.1 Starting Subframe Number ............................. 3-23
3.5.2 Measurement Interval ..................................... 3-25
3.5.3 PDSCH Modulation Scheme .......................... 3-26
3.5.4 Total EVM & Constellation Composite ........... 3-27
3.5.5 EVM Window Length ...................................... 3-28
3.5.6 PBCH - On / Off .............................................. 3-29
3.5.7 PBCH - Power Auto/Manual
3.5.8 PBCH - Power Boosting ................................. 3-30
3.5.9 Precautions at Power Auto Setting ................. 3-31
3.5.10 P-SS - On/Off ................................................. 3-31
........................... 3-30
3
Page 36

Chapter 3 Measurement
3-2
3.5.11 P-SS - Power Auto / Manual .......................... 3-32
3.5.12 P-SS - Power Boosting ................................... 3-32
3.5.13 S-SS - On/Off ................................................. 3-32
3.5.14 S-SS - Power Auto/Manual ............................ 3-33
3.5.15 S-SS - Power Boosting ................................... 3-33
3.5.16 PDCCH - On / Off ........................................... 3-33
3.5.17 PDCCH - Power Auto / Manual ...................... 3-34
3.5.18 PDCCH - Power Boosting .............................. 3-34
3.5.19 PCFICH - On/Off ............................................ 3-34
3.5.20 PCFICH - Power Auto / Manual ..................... 3-35
3.5.21 PCFICH - Power Boosting .............................. 3-35
3.5.22 PHICH - On / Off ............................................. 3-36
3.5.23 PHICH - Power Auto / Manual ........................ 3-37
3.5.24 PHICH - Power Boosting ................................ 3-37
3.5.25 PDSCH - Power Auto / Manual ...................... 3-38
3.5.26 PDSCH - Power Boosting............................... 3-38
3.5.27 PHICH - TDD m_i=1(E-TM) On/Off ................ 3-39
3.5.28 PHICH - Ng ..................................................... 3-39
3.5.29 PHICH - Duration ............................................ 3-39
3.5.30 Number of PDCCH Symbols - Auto/Manual... 3-40
3.5.31 Number of PDCCH Symbols .......................... 3-41
3.5.32 PDCCH Mapping ............................................ 3-41
3.5.33 PDCCH Format .............................................. 3-42
3.5.34 Number of PDCCHs ....................................... 3-43
3.5.35 Channel Estimation ........................................ 3-43
3.5.36 DwPTS............................................................ 3-43
3.5.37 PDSCH EVM Calculation ............................... 3-44
3.5.38 Test Model Starting Frame Type .................... 3-44
3.5.39 Measurement Filter Type................................ 3-45
3.5.40 Extended Freq Lock Range ............................ 3-45
3.5.41 Operating Detail Settings Dialog .................... 3-45
3.5.42 Analysis Frame Position ................................
3.5.43 Analysis Offset Time ....................................... 3-46
3.6 Modulation Analysis Measurement and Results ......... 3-47
3.6.1 Setting Storage Mode/Count .......................... 3-48
3.6.2 Trace Mode .................................................... 3-49
3.6.3 Frame Offset ................................................... 3-50
3.6.4 Main Numeric Results .................................... 3-51
3.6.5 Setting EVM Display Units and Scale ............ 3-51
3.6.6 Constellation ................................................... 3-52
3.6.7 EVM vs Subcarrier .......................................... 3-53
3.6.8 EVM vs Symbol .............................................. 3-55
3.6.9 Spectral Flatness ............................................ 3-57
3.6.10 PDSCH Constellation ..................................... 3-59
. 3-46
Page 37

Chapter 3 Measurement
3-3
Measurement
3.6.11 Subframe Number .......................................... 3-59
3.6.12 Resource Block Number................................. 3-60
3.6.13 Power vs RB ................................................... 3-61
3.6.14 EVM vs RB ..................................................... 3-62
3.6.15 Marker............................................................. 3-63
3.6.16 Summary ........................................................ 3-66
3.6.17 Test Model Summary ..................................... 3-69
3.7 Power vs Time Setting ................................................ 3-71
3.7.1 Wide Dynamic Range ..................................... 3-72
3.7.2 Noise Correction ............................................. 3-73
3.7.3 Pre-Amp Mode ............................................... 3-73
3.7.4 Channel bandwidth ......................................... 3-74
3.7.5 Setting smoothing (Smoothing) ...................... 3-74
3.7.6 Select Mask .................................................... 3-75
3.7.7 Mask Setup ..................................................... 3-75
3.7.8 Frame Sync .................................................... 3-80
3.7.9 Limiter Mode ................................................... 3-81
3.8 Measurement and Result for Power vs Time ............. 3-84
3.8.1 Averaging (Storage) ....................................... 3-86
3.8.2 Main Numeric Results .................................... 3-87
3.8.3 Marker............................................................. 3-89
3.9 MIMO Summary Settings ............................................ 3-91
3.9.1 Number of Antenna Ports ............................... 3-91
3.9.2 Antenna Port ................................................... 3-91
3.9.3 Active Antenna Threshold .............................. 3-92
3.10 MIMO Summary Measurement Results ..................... 3-93
3.10.1 Numeric Results ............................................. 3-94
3.11 Setting Batch Measurement ....................................... 3-95
3.11.1 Common Settings : Storage Mode ................. 3-95
3.11.2 Common Settings : Storage Count ................. 3-95
3.11.3 Common Settings : Storage Mode for
Unwanted Emissions ...................................... 3-95
3.11.4 Common Settings : Storage Count for
Unwanted Emissions ...................................... 3-96
3.11.5 Common Settings : Starting Subframe
Number ........................................................... 3-96
3.11.6 Common Settings : Measurement Interval ..... 3-97
3.11.7 Common Settings : Starting OFDM Symbol
Number ........................................................... 3-97
3.11.8 Common Settings : Measurement Interval for
3.11.9 Common Settings : Modulation Analysis ........ 3-98
3.11.10 Common Settings : OBW ............................. 3-99
3.11.11 Common Settings : ACLR ............................ 3-99
Unwanted Emissions ...................................... 3-98
3
Page 38

Chapter 3 Measurement
3-4
3.11.12 Common Settings : OBUE
(Operating Band Unwanted Emissions) ....... 3-99
3.11.13 Band Settings : Measurement Item ........... 3-100
3.11.14 Band Settings : Carrier Frequency ............ 3-101
3.11.15 Band Settings : Input Level ........................ 3-101
3.11.16 Band Settings : Pre-Amp ........................... 3-102
3.11.17 Band Settings : Level Offset ...................... 3-102
3.11.18 Band Settings : Offset Value ...................... 3-102
3.11.19 Band Settings : Contiguous Mode ............. 3-103
3.11.20 Band Settings : OBUE Standard ................ 3-103
3.11.21 Band Settings : OBUE Standard Additional3-104
3.11.22 CC Settings : Measurement Item ............... 3-104
3.11.23 CC Settings : Frequency Band .................. 3-105
3.11.24 CC Settings : Frequency Offset ................. 3-105
3.11.25 CC Settings : Channel Bandwidth ............. 3-106
3.11.26 CC Settings : Test Model ........................... 3-106
3.11.27 CC Settings :
Test Model Starting Frame Type ............... 3-107
3.11.28 CC Settings :
Uplink-downlink Configuration ................. 3-107
3.11.29 CC Settings :
Special Subframe Configuration ................ 3-108
3.11.30 CC Settings : Synchronization Mode ......... 3-108
3.11.31 CC Settings : Cell ID .................................. 3-109
3.11.32 CC Settings : CRS Power Boosting ........... 3-109
3.11.33 CC Settings :
CRS Number of Antenna Ports .................. 3-110
3.11.34 CC Settings :
CSI-RS Number of Antenna Ports ............. 3-110
3.11.35 CC Settings : CRS Antenna Port ............... 3-111
3.11.36 CC Settings : CSI-RS Antenna Port .......... 3-111
3.11.37 CC Settings : PDSCH Modulation Scheme 3-112
3.11.38 CC Settings : EVM Window Length ........... 3-112
3.11.39 CC Settings : Channel Estimation ............. 3-113
3.11.40 CC Settings : DwPTS ................................. 3-113
3.11.41 CC Settings :
DwPTS for Unwanted Emissions ............... 3-113
3.11.42 CC Settings : Measurement Filter Type ..... 3-114
3.11.43 CC Settings : PBCH On/Off ....................... 3-114
3.11.44 CC Settings : PBCH Power Auto/Manual .. 3-115
3.11.45 CC Settings : PBCH Power Boosting ........ 3-115
3.11.46 CC Settings : P-SS On/Off ......................... 3-116
3.11.47 CC Settings : P-SS Power Auto/Manual .... 3-116
3.11.48 CC Settings : P-SS Power Boosting .......... 3-
117
Page 39

Chapter 3 Measurement
3-5
Measurement
3.11.49 CC Settings : S-SS On/Off ......................... 3-117
3.11.50 CC Settings : S-SS Power Auto/Manual .... 3-118
3.11.51 CC Settings : S-SS Power Boosting .......... 3-118
3.11.52 CC Settings : PDCCH On/Off .................... 3-119
3.11.53 CC Settings : PDCCH Power Auto/Manual 3-119
3.11.54 CC Settings : PDCCH Power Boosting ...... 3-120
3.11.55 CC Settings : PCFICH On/Off .................... 3-120
3.11.56 CC Settings : PCFICH Power Auto/Manual3-121
3.11.57 CC Settings : PCFICH Power Boosting ..... 3-121
3.11.58 CC Settings : PHICH On/Off ...................... 3-122
3.11.59 CC Settings : PHICH Power Auto/Manual . 3-122
3.11.60 CC Settings : PHICH Power Boosting ....... 3-123
3.11.61 CC Settings : PDSCH Power Auto/Manual 3-123
3.11.62 CC Settings : PDSCH Power Boosting ...... 3-124
3.11.63 CC Settings : PHICH - Ng .......................... 3-124
3.11.64 CC Settings : PHICH Duration ................... 3-125
3.11.65 CC Settings : Number of PDCCH Symbols -
Auto/Manual ............................................... 3-125
3.11.66 CC Settings : Number of PDCCH Symbols
for Subframe 1 and 6 ................................. 3-126
3.11.67 CC Settings : Number of PDCCH Symbols 3-126
3.11.68 CC Settings : PDCCH Mapping ................. 3-127
3.11.69 CC Settings : PDCCH Format ................... 3-127
3.11.70 CC Settings : Number of PDCCHs ............ 3-128
3.11.71 CC Settings : CSI-RS On/Off ..................... 3-128
3.11.72 CC Settings : CSI-RS Configuration .......... 3-129
3.11.73 CC Settings : CSI-RS Periodicity T ............ 3-129
3.11.74 CC Settings : CSI-RS Subframe Offset ..... 3-130
3.12 Batch Measurement Results ..................................... 3-131
3.12.1 Measurement results .................................... 3-131
3.13 Spectrum Measurement ........................................... 3-133
3.13.1 Measurement results .................................... 3-135
3.13.2 Advanced Settings ........................................ 3-136
3
Page 40

Chapter 3 Measurement
3-6
3.1 Basic Operation
3.1.1 Screen layout
This section describes the screen layout of the MX269022A.
Figure 3.1.1-1 Screen Appearance (Modulation Analysis)
1. Title
This displays the title of the application. The title can be changed.
6.2 Setting Title
2. Measurement Parameter
This displays the settings of the main parameters.
Carrier Freq.
Modulation
(Displayed when Test Model set to Off)
Test Model
Channel Bandwidth
Input Level
ATT
Internal attenuator setting (automatic)
Input signal carrier frequency setting
PDSCH modulation method setting
Test model setting
(Displayed when Test Model not set to
Off)
Channel bandwidth setting
Average power setting while input
signal transmission on
Page 41

3.1 Basic Operation
3-7
Measurement
Offset
Trigger
Delay
3. Measurement Status
This displays the measurement results of status and storage status.
performing measurement is too large for the settings. When Level
Over is displayed, either increase the Input Level value or decrease
the level of the input signal and measure again.
"Measuring" indicates that measurement is in progress.
the input signal has failed. Measurement results are not displayed
on the screen when this happens. When the signal abnormal is
displayed, check the status of the input signal and the correct
settings for this application.
Trigger signal type setting
Trigger delay setting
Reference Signal
Reference Signal detection method
indicates that the level of the signal input for
Level offset setting (displayed at Offset
On)
(displayed at Trigger Switch On)
(displayed at Trigger Switch On)
3.2.2 Input Level
3.1.3 Performing Measurement
indicates that frame synchronization with
3
3.1.4 Measurement Signals and Troubleshooting Errors
The storage status is indicated at the right side of the measurement
status field. It is not displayed when Storage Mode is set to Off. The
numeric value at the right side of
setting and the numeric value at the left side indicates the
completed measurement count.
4. Constellation
This field displays the symbol constellation for the specified range.
The marker positions and I and Q Coordinates for the marker
positions are displayed on the left side of the constellation screen.
The constellation is displayed when Modulation Analysis is selected.
5. Numeric Results/Graph (Upper)
This displays the measurement results for the currently selected
Measure function and Trace Mode.
"/"
indicates the Storage Count
Page 42

Chapter 3 Measurement
3-8
6. Graph/Numeric Results (Lower)
This displays the measurement results for the currently selected
Measure Function and Trace Mode. The Trace Mode contents are
displayed when Modulation Analysis is selected.
7. Reference Frequency Signal
This indicates that type and status of the detected reference
frequency signal.
Ref.Int
8. Pre-amplifier Setting
9. Correction Setting
Internal reference frequency signal/lock status
Ref.Ext
Ref.Int Unlock
Ref.Ext Unlock
This indicates a pre-amplifier settings status.
Pre-Amp On
Pre-Amp Off
This is displayed when the Correction function is On.
External reference frequency signal/lock status
Internal reference frequency signal/unlock
status
External reference frequency signal/unlock
status
Preamplifier On
Preamplifier Off or not installed
3.2.4 Pre-Amp
Refer to the
MS2690A/MS2691A/MS2692A Signal Analyzer
Operation Manual (Mainframe ,Operation), MS2830A Signal
Analyzer Operation Manual (Mainframe Operation), or MS2850A
Signal Analyzer Operation Manual (Mainframe ,Operation)
10. Message
The indicates the cause of the Signal Abnormal display.
"Synchronizing signal cannot be detected" indicates that
synchronization with the input signal was lost.
11. Function Menu
This indicates the functions that can be executed by the relevant
function keys.
3.1.4 Measurement Signals and Troubleshooting Errors
.
Page 43

3.1 Basic Operation
3-9
Measurement
3.1.2 Types of Measurement Function
This application has the following measurement functions.
(1) Modulation Analysis
Measures the modulation accuracy such as frequency error, EVM,
etc.
(2) Power vs Time
Measures the time fluctuations of power of the obtained measured
signal.
(3) ACP (FFT)
Recalls the ACP function of the Signal Analyzer function. This
function is only enabled when Channel Bandwidth is set to 1.4, 3,
and 5 MHz.
(4) ACP (Swept)
3
Recalls the ACP function of the Spectrum Analyzer function.
(5) Channel Power (FFT)
Calls Signal Analyzer function and Channel Power function
(6) Channel Power (Swept)
Recalls the Channel Power function of the Spectrum Analyzer
function.
(7) OBW (FFT)
Recalls the OBW function of the Signal Analyzer function.
(8) OBW (Swept)
Recalls the OBW function of the Spectrum Analyzer function.
(9) Spectrum Emission Mask (Swept)
Recalls the spectrum emission mask function of the Spectrum
Analyzer function.
Page 44

Chapter 3 Measurement
3-10
3.1.3 Performing Measurement
There are two measurement modes: single and continuous. Measurement
is performed once in the single measurement mode, and continuously in
the continuous measurement mode.
Single Measurement
After capturing an input signal based upon the settings of Capture Time,
the selected measurement items are measured only for the measurement
count (Storage Count) before measurement is stopped.
Continuous Measurement
1. Press
2. Press
After capturing an input signal based upon the settings of Capture Time,
the selected measurement items are continuously measured for the
measurement count (Storage Count).
1. Press
2. Press
Notes:
The two measurement modes are not available when the Replay
•
function is executed. For the Replay function, analysis starts
when the IQ data file is specified.
The continuous measurement cannot be performed at the
•
Power vs Time Measurement. The measurement mode is
switched forcefully from the continuous measurement to the
single measurement.
to select the measurement function.
.
to select the measurement function.
.
4.1.1 Loading IQ Data
4.2 Replay Function
Page 45

3.1 Basic Operation
3-11
Measurement
3.1.4 Measurement Signals and Troubleshooting Errors
Wireless standard
3GPP TS36.211 V8.6.0 (2009-03)
Multiplex method
TDD
Frame length (1
frame)
Channel Bandwidth
1.4 / 3 / 5 / 10 / 15 / 20 MHz
Cyclic prefix (CP)
Normal cyclic prefix
Uplink-downlink
0 to 6
(DL Subframe included in subframe)
Special subframe
0 to 8
(DwPTS included)
PDSCH (required), PBCH, PCFICH, PDCCH,
PHICH
Reference signal (required), Synchronization
signal
Test Model
E-TM1.1 / 1.2 / 2 / 2a / 3.1 / 3.1a / 3.2 / 3.3
Table 3.1.4-1 lists the minimum requirements for measuring with the
MX269022A. To measure with this application, check that the input
signal satisfies the conditions listed in Table 3.1.4-1 and that the
application settings match these conditions.
Table 3.1.4-1 Measurement Signals (minimum conditions)
Item Value
10 ms = 10 subframes
configuration
3
configuration
Physical channels
Physical signals
Note:
This application is for frame synchronizing the Reference or
Synchronization signals (determined by Synchronization Mode
settings) included in 10 Downlink subframes (5 frames max.).
If Signal Abnormal is displayed, consider the following possible causes.
Check the input signal parameter settings and try to measure again.
(1) The Carrier Frequency Settings do not match the input signal
carrier frequency.
(2) The input level is too low for the Input Level setting.
(3) The Synchronization Mode is set to Synchronization Signal but there
is no Synchronization Signal in the input signal.
(4) The Synchronization Mode is set to Reference Signal but the set Cell
ID is different from the input signal.
Page 46

Chapter 3 Measurement
3-12
3.2 Setting Frequency and Level
3.2.1 Carrier Frequency
This sets the carrier frequency of the input signal.
You cannot set Carrier Frequency when the Replay function is executed.
3.2.2 Input Level
4.2 Replay Function
Procedure
> (Frequency) > (Carrier Frequency)
or
Range 300 MHz to the upper limit of the main unit
(MS2830A-078, MS2850A)
100 MHz to the upper limit of the main unit
(MS269xA, MS2830A other than above.)
100 MHz to the upper limit of the main unit
Minimum resolution 1 Hz
Default 2110 MHz
This sets the average power (rms) in the input signal transmission-on
period. The difference between the average power and the peak power
(crest factor) with this application is 14 dB. When calling the signal
analyzer or spectrum analyzer ACP, Channel Power, OB W, and SEM
measurement functions from this application, set Input Level +14 dB as
Reference Level.
You cannot set Input Level when the Replay function is executed.
4.2 Replay Function
Procedure
> (Amplitude) > (Input Level)
or
Range With Pre-Amp On or Pre-Amp Mode On at Power vs Time
measurement:
(–80.00 + Offset Value) to (10.00 + Offset Value) dBm
With Pre-Amp Off:
(–60.00 + Offset Value) to (30.00 + Offset Value) dBm
Minimum resolution: 0.01 dB
Default
10.00 dBm
–
Page 47

3.2 Setting Frequency and Level
3-13
Measurement
3.2.3 Offset
DUT
40 dBm Output
Attenuator
30 dB
MS2690A/MS2691A/MS2692A,
MS2830A, or MS2850A
Input Level 40 dBm
Offset On
Offset Value 30 dB
10 dBm
Offset
This adds the displayed offset to the Input Level setting. Input the
increase or decrease in the level due to devices such as cables,
attenuators, amplifiers, etc., between this equipment and the
measurement target as the level offset and set the same input level as
the output level at the antenna of the DUT.
3
Figure 3.2.3-1 Setting Input Level and Level Offset
Procedure
> (Amplitude) > (Offset)
Offset Value
Options On, Off
Default Off
Note:
Offset is set automatically to on when setting Offset Value.
Procedure
> (Amplitude) > (Offset Value)
Range
Minimum resolution: 0.01 dB
Default 0.00 dB
Note:
The correction set at the System Config. screen is used irrespective
of the Offset Value.
99.99 to +99.99 dB
–
3.1.1 Screen layout
Page 48

Chapter 3 Measurement
3-14
3.2.4 Pre-Amp
The MS2690A/MS2691A/MS2692A-008/108 6 GHz Preamplifier,
MS2830A-008/108 Preamplifier, or MS2850A-068/168 Preamplifier
(hereinafter referred to as “Option 008”) is installed in this instrument.
The level sensitivity can be increased by setting this pre-amp to On.
You ca n not set Pre-Amp when the Replay function is executed.
3.2.5 Auto Range
4.2 Replay Function
Procedure
> (Amplitude) > (Pre-Amp)
Options On, Off
Default Off
Notes:
If opt-008 is not installed, the Pre-Amp menu is not displayed.
•
When Wide Dynamic Range is On at Power vs Time
•
measurement, the Pre-Amp menu is displayed in gray and the
function is disabled.
This function adjusts input level according to input signal.
You cannot set Auto Range when the Replay function is executed.
4.2 Replay Function
You cannot set Auto Range when Limiter Mode is On.
Procedure
> (Amplitude) > (Auto Range)
3.7.9 Limiter Mode
Page 49

3.3 Setting Trigger
3-15
Measurement
3.3 Setting Trigger
The trigger signal determining the measurement start timing may be
either the external input signal from the Trigger Input connector on the
back panel or an internal signal generated from the optional Vector
Signal Generator. Using this application, a header-timing signal with a
10-ms frame interval is input.
You cannot set Trigger when the Replay function is executed.
4.2 Replay Function
3
3.3.1 Trigger Switch
This enables/disables the trigger function.
Procedure
> (Trigger) > (Trigger Switch)
or
Options On (Enabled), Off (Disabled)
Default Off
3.3.2 Trigger Source
This sets the trigger signal type.
Procedure
or
Options
External*
External 2*
SG Marker Starts measurement by the timing of internal
Frame*
Frame Sync Setup*
*1: External 1 is displayed only for MS2850A.
*2: External 2 is selectable only for MS2850A.
*3: Frame is selectable only for MS2850A.
*4: Frame Sync Setup is selectable only for MS2850A.
Default External
> (Trigger Switch)
> (Trigger) > (Trigger Source)
> (Trigger Source)
1
Measurement starts with external trigger signal input.
2
Measurement starts with external trigger 2
signal input.
Vector Signal Generator option.
3
Starts measurement by the timing of
equipment-internal trigger.
4
Sets the Frame Trigger starting source if
Trigger Source is set to Frame. Frame Sync
Setup function menu is displayed.
Refer to 3.3.5 “Frame Sync Setup“
Page 50

Chapter 3 Measurement
3-16
3.3.3 Trigger Slope
3.3.4 Trigger Delay
This sets the trigger polarity.
Procedure
> (Trigger) > (Trigger Slope)
or
Options
Rise Synchronizes with rising edge of the trigger.
Fall Synchronizes with falling edge of the trigger.
Default Rise
This sets the difference between the trigger signal detection timing and
the measurement start timing.
Procedure
or
> (Trigger Slope)
> (Trigger) > (Trigger Delay)
> (Trigger Delay)
Range When the Measure is Modulation Analysis or
Minimum resolution: 20 ns
Default 0 s
3.3.5 Frame Sync Setup
Sets the Frame Trigger starting source if Trigger Source is set to Frame.
Procedure
or
Options
Frame Trigger Period Sets the generation period for the frame
Frame Sync Offset Sets the offset time from when a trigger
MIMO Summary.
–2 s to + 2 s
When the Measure is Batch Measurement.
0.5 to + 0.5 s
−
> (Trigger) > (Trigger Source) > (Frame Sync Setup)
>
(Trigger Source) > (Frame Sync Setup)
trigger signal. 10 ms fixed
signal (the equipment-internal trigger
signal, Wide IF Video signal, or external
trigger signal) is generated until a trigger
actually occurs. 0 s fixed
Page 51

3.4 Common Settings
3-17
Measurement
3.4 Common Settings
This section explains the shade parameters used by all measurement
functions of this application. These parameters are mainly referenced for
performing synchronization processing related to the input signal.
3.4.1 Channel Bandwidth
This sets the channel width.
Procedure
> (Common Setting) > (Channel Bandwidth)
or
Options 1.4 MHz, 3 MHz, 5 MHz, 10 MHz, 15 MHz, 20 MHz
Default 5 MHz
>
(Modulation Analysis) > (Channel Bandwidth)
3
3.4.2 Test Model
When the input signal is an E-UTRA Test Model (Test Model hereafter)
defined by 3GPP TS36.141, Test Model is set. When Test Model is set, the
parameters defined by Test Model are fixed. If there is no Test Model, Off
is set.
Procedure
or
Options Off, E-TM1.1, E-TM1.2, E-TM2, E-TM2a, E-TM3.1,
Default Off
3.4.3 Test Model Version
This sets the version of 3GPP TS36.141 when the input signal is an
E-UTRA Test Model (Test Model hereafter) defined by 3GPP TS36.141.
Procedure
> (Common Setting) > (Test Model)
>
(Modulation Analysis) > (Detail Settings)
E-TM3.1a, E-TM3.2, E-TM3.3
>
(Modulation Analysis) > (Detail Settings)
Options 3GPP TS36.141 V8.2.0 (2009-03),
Default 3GPP TS36.141 V8.3.0 (2009-05)
3GPP TS36.141 V8.3.0 (2009-05)
Page 52

Chapter 3 Measurement
3-18
3.4.4 Uplink-downlink Configuration
This sets the position of the Downlink subframe in the frame.
Table 3.4.4-1 shows the relation between the Uplink-downlink
Configuration and subframe type.
Table 3.4.4-1 Relation between Uplink-downlink Configuration and
Subframe Type
Uplink-downlink
Configuration
0 D S U U U D S U U U
1 D S U U D D S U U D
2 D S U D D D S U D D
3 D S U U U D D D D D
4 D S U U D D D D D D
5 D S U D D D D D D D
6 D S U U U D S U U D
D
: Downlink subframe
U
: Uplink subframe
S
: Special subframe (DwPTS + GP + UpPTS)
This can be set when Test Model is Off. The setting is fixed to 3 when
Test Model is not Off.
Procedure
Subframe number
0 1 2 3 4 5 6 7 8 9
> (Common Setting)
>
(Uplink-downlink Configuration)
Range 0 to 6
Default 3
Page 53

3.4 Common Settings
3-19
Measurement
3.4.5 Special Subframe Configuration
6592×Ts
19760×Ts
21952×Ts
24144×Ts
26366×Ts
6592×Ts
19760×Ts
21952×Ts
24144×Ts
This sets the configuration of the special subframe.
The special subframe is composed of three parts: the DwPTS (Downlink
part of the special subframe), the GP (Guard Period),and the UpPTS
(Uplink part of the special subframe). The length of the DwPTS and
UpPTS are determined by the Special Subframe Configuration as shown
in Table 3.4.5-1.
Table 3.4.5-1 Special Subframe Configuration
Special Subframe
Configuration
0
1
2
3
4
5
6
7
8
This can be set when Test Model is Off. It is fixed to 8 when Test Model is
not Off.
Procedure
> (Common Setting)
DwPTS UpPTS
2192×Ts
4384×Ts
3
>
(Special Subframe Configuration)
Range 0 to 8
Default 8
Page 54

Chapter 3 Measurement
3-20
3.4.6 Synchronization Mode
This sets the type of physical signal used for synchronization processing
with the input signal. When Reference Signal is selected, Cell ID must
also be set correctly.
This can be set when Test Model is Off. It is fixed to Synchronization
Signal when Test Model is not Off.
Procedure
> (Common Setting)> (Synchronization Mode)
or
> (Modulation Analysis) > (Detail Settings)
Options Reference Signal, Synchronization Signal
Default Synchronization Signal
3.4.7 Cell ID
3.4.7 Cell ID
This sets the Cell ID.
It is used to create the Reference Signal for synchronization and for
defining the physical channel depending on the Cell ID value. This
parameter is only enabled when Synchronization Mode is set to
Reference Signal.
3.4.6 Synchronization Mode
Procedure
> (Common Setting) > (Reference Signal)
>
(Cell ID)
or
> (Modulation Analysis) > (Detail Settings)
Range 0 to 503
Default 0
Page 55

3.4 Common Settings
3-21
Measurement
3.4.8 Reference Signal Boosting
This sets the Reference Signal Boosting level.
This application uses the power value for the specified Reference Signal
plus the value specified by this parameter as the reference level for each
physical channel and the physical signal (0 dB).
Physical Channel / Physical Signal Reference Level
It can be set when Test Model is Off. It is fixed to 0.000 dB when Tes t
Model is not Off.
Procedure
> (Common Setting) > (Reference Signal)
= Reference Signal Power - Reference Signal Boosting
Level
3
>
(Power Boosting)
or
>
Range
Default 0.000 dB
–
3.4.9 Number of Antenna Ports
This sets the number of antennas for the DUT.
It can be set when Test Model is Off. It is fixed to 1 when Test Model is
not Off.
Procedure
> (Common Setting)> (Reference Signal)
>
(Number of Antenna Ports)
or
>
Options 1, 2, 4
Default 1
(Modulation Analysis) > (Detail Settings)
20.000 dB to +20.000 dB
(Modulation Analysis) > (Detail Settings)
Page 56

Chapter 3 Measurement
3-22
3.4.10 Antenna Port
This sets the input signal antenna number.
It can be set when Test Model is Off. It is fixed to 0 when Test Model is
not Off.
Procedure
> (Common Setting)> (Reference Signal)
>
(Antenna Port)
or
>
(Modulation Analysis) > (Detail Settings)
Options 0 to (Number of Antenna Ports
Default 0
3.4.9 Number of Antenna Ports
1)
–
Page 57

3.5 Setting Modulation Analysis
3-23
Measurement
3.5 Setting Modulation Analysis
0
0, 5 + 10×N
1
0, 4, 5, 9 + 10×N
2
0, 3, 4, 5, 8, 9 + 10×N
3
0, 5, 6, 7, 8, 9 + 10×N
4
0, 4, 5, 6, 7, 8, 9 + 10×N
5
0, 3, 4, 5, 6, 7, 8, 9 + 10×N
6
0, 5, 9 + 10×N
This section explains the measurement conditions for modulation
analysis. Unless specifically excluded, calculation is performed using the
same data without recapturing the input signal when parameters
described in this section are changed after Single measurement ends and
when the Storage Mode is Off.
3.5.1 Starting Subframe Number
This sets the subframe number for starting analysis based on the
synchronized frame header.
Procedure
> (Modulation Analysis) > (Analysis Time)
(Starting Subframe Number)
or
> (Starting Subframe Number)
Range
Table 3.5.1-1 Range of Starting Subframe Number
Uplink-downlink Configuration Range
3
>
Where N = 1 to 4
Default 0
Figure 3.5.1-1 shows the Downlink Subframe to be analyzed when
Starting Subframe Number is 5, and Measurement Interval is 12. The
analysis target at this time is 3 subframes, such as Subframe 5 of Frame
0, and subframe0 and 5 of Frame 1.
Page 58

Chapter 3 Measurement
3-24
0
D
1
S
Subframe No.
Starting Subframe Number = 5
Measurement Interval = 12
2
U
3 U 4 U 5 D 6 S 7 U 8 U 9 U 0 D 1 S 2
U
3
U
4
U
5
D
6
S
7
U
8
U
9
U
Frame 0
Frame 1
When Uplink-downlink Configuration
= 0
Figure 3.5.1-1 Setting Example for Uplink-downlink Configuration and
Starting Subframe Number / Measurement Interval
Page 59

3.5 Setting Modulation Analysis
3-25
Measurement
3.5.2 Measurement Interval
This sets the analysis interval in subframe units. The value is set as the
interval of contiguous subframes, irrespective of the subframe type.
The subframes for modulation analysis are the Downlink subframe and
the Special subframe. The measurement results are unaffected even if
the Uplink subframe count including the start to finish measurement
interval is changed.
Figure 3.5.1-1 shows an example of setting the Measurement Interval to
12. The measurement results do not change at this time, because only
the Uplink subframe is changed when Measurement Interval is between
12 and 15.
Procedure
> (Modulation Analysis) > (Analysis Time)
(Measurement Interval)
or
> (Measurement Interval)
Range When Test Model Starting Frame Type is Unlock:
1 to (50
When Test Model Starting Frame Type is Frame1 or
Frame2:
1 to (40 – Starting Subframe Number) Subframes
Default 1 Subframes
Starting Subframe Number) Subframes
–
>
3
Page 60

Chapter 3 Measurement
3-26
3.5.3 PDSCH Modulation Scheme
This sets the modulation mode for the PDSCH.
The value of this parameter is applied to the entire measurement
interval. As a result, PDSCH requires the same modulation method for
all when QPSK, 16QAM, 64QAM, and 256QAM is selected.
It can be set when test model is Off. The setting is disabled when Te st
Model is not Off.
Procedure
> (Modulation Analysis)
(PDSCH Modulation Scheme)
Options
QPSK Analyzes an input signal as a QPSK modulated signal.
16QAM Analyzes an input signal as a 16QAM modulated signal.
64QAM Analyzes an input signal as a 64QAM modulated signal.
256QAM Analyzes an input signal as a 256QAM modulated signal.
AUTO Analyzes an input signal after judging its modulation
scheme automatically (Excluding 256QAM) (Default).
>
Note:
If DwPTS is included in the measurement target, sometimes auto
detection is not performed correctly because the PDSCH count
included in DwPTS is too small. In this case, set any of QPSK,
16QAM, 64QAM, and 256QAM to the PDSCH Modulation Scheme
matching the input signal.
Page 61

3.5 Setting Modulation Analysis
3-27
Measurement
3.5.4 Total EVM & Constellation Composite
This sets whether or not to display the Total EVM measurement results
and Constellation graph for each channel (RS, PDSCH, PBCH, P-SS,
S-SS, PDCCH, PCFICH, PHICH, DTX).
Procedure
> (Modulation Analysis) >
(Total EVM & Constellation Composite)
Options Include, Exclude
Default RS Include
PDSCH Include
PBCH Include
P-SS Include
S-SS Include
PDCCH Include
PCFICH Include
PHICH Include
DTX Exclude
>
3
Page 62

Chapter 3 Measurement
3-28
Cyclic prefix
Valid symbols
OFDM Symbol # n
W: Window Length
EVM Low
EVM High
Cyclic prefix center
3.5.5 EVM Window Length
This sets the length of EVM Window applied to OFDM symbol as the
width from the center position of Cyclic prefix. It can be set either as the
FFT sample count W, or in Ts units (time per sample). Refer to Table
3.5.5-1 for the conversion method.
EVM Window is applied to OFDM symbol as shown in Fig. 3.5.5-1.
Assuming EVM Window Length is W, the EVM Window for the FFT size
from the point (Cyclic prefix center – W/2) or (Cyclic prefix center + W/2)
is applied to OFDM symbol.
EVM Low indicates the measurement result when applying EVM
Window from the point (Cyclic prefix center – W/2); EVM High indicates
the measurement result when applying EVM Window from the point
(Cyclic prefix center + W/2). Finally, the EVM result is uses the larger of
the larger of the EVM High and EVM Low values.
Note:
"Cyclic prefix center" actually indicates the next position.
At Cyclic prefix length 144 (OFDM symbol 1 to 6): FFT point 72
At Cyclic prefix length 160 (OFDM symbol 0: FFT point 88
Figure 3.5.5-1 Window Length
Page 63

3.5 Setting Modulation Analysis
3-29
Measurement
1.4 MHz
5 ×16
3 MHz
12 ×8
5 MHz
32 ×4
10 MHz
66 ×2
15 MHz
102
(2048/1536)
20 MHz
136 ×1
Procedure
> (Modulation Analysis)
Range
Ts : 0 to 142
W : When Channel Bandwidth is set to 1.4 MHz, 0 to 8
When Channel Bandwidth is set to 3 MHz: 0 to 17
When Channel Bandwidth is set to 5 MHz: 0 to 35
When Channel Bandwidth is set to 10 MHz: 0 to 71
When Channel Bandwidth is set to 15 MHz: 0 to 106
When Channel Bandwidth is set to 20 MHz: 0 to 142
Default See Table 3.5.5-2.
Table 3.5.5-2 EVM Window Length Defaults and W/Ts Conversion
>
(EVM Window Length)
3
Channel Bandwidth
3.5.6 PBCH - On / Off
This enables or disables the PBCH.
PBCH is arranged from the 8th to 11th symbol of Subframe 0.
This is supported when Test Model is set to Off. It is fixed to On when
Test Model is set to not Off.
Procedure
Range On (Check box selected) PBCH on
Default On
EVM Window
Length (W)
>
(Modulation Analysis) > (Detail Settings)
Off (Check box not selected) PBCH off
W/Ts Conversion
×
Page 64

Chapter 3 Measurement
3-30
3.5.7 PBCH - Power Auto/Manual
This sets the method for determining the PBCH Boost level.
This is available when Test Model is set to Off. This is fixed to Manual
when Test Model is not set to Off.
Procedure
>
Options Auto, Manual
Default Auto
3.5.8 PBCH - Power Boosting
This sets the PBCH Boost level as a relative value based on the
Reference Signal level.
The Power Auto/Manual setting is enabled at Manual.
It can be set when test model is Off. When Test Model is not Off, the
defined value for Test Model is fixed.
Procedure
>
Range
Default 0.000 dB
3.5.9 Precautions at Power Auto Setting
(Modulation Analysis) > (Detail Settings)
(Modulation Analysis) > (Detail Settings)
20.000 dB to +20.000 dB
–
Page 65

3.5 Setting Modulation Analysis
3-31
Measurement
3.5.9 Precautions at Power Auto Setting
Detected level
→This symbol used to
calculate EVM as ideal signal
Expected symbol
position
I
Q
This amplitude error not
reflected in EVM value
When the Power Auto/Manual setting for the physical channel/physical
signal is Auto, this application determines the ideal signal for calculating
the EVM based on the measured level. As a result, when there is a
difference between the expected boost level and the actual signal level,
sometimes this level difference is not reflected in the EVM result.
When the physical channel/physical signal Boost setting level is clear
and is the same within the measurement interval, set that Boost level.
3
Figure 3.5.9-1 Determining Ideal Signal at Power Auto Setting
3.5.10 P-SS - On/Off
This enables/disables P-SS (Primary Synchronization Signal).
P-SS is arranged (aligned) at the 3rd symbol of Subframe 1 and 6.
This can be set when Synchronization Mode is set to Reference Signal. It
is fixed to On when Synchronization Mode is set to Synchronization
Signal.
Procedure
Range On (Check box selected) P-SS on
Default On
>
(Modulation Analysis) > (Detail Settings)
Off (Check box not selected) P-SS off
Page 66

Chapter 3 Measurement
3-32
3.5.11 P-SS - Power Auto / Manual
This sets the method for determining the P-SS Boost level.
This is supported when Test Model is set to Off. This is fixed to Manual
when Test Model is not set to Off.
Procedure
>
Options Auto, Manual
Default Auto
3.5.12 P-SS - Power Boosting
This sets the P-SS Boost level as a relative value based on the Reference
Signal level.
The Power Auto/Manual setting is enabled at Manual.
This is supported when Test Model is set to Off. It is fixed to the value
defined for Test Model when Test Model is not set to Off.
Procedure
>
Range
Default 0.000 dB
3.5.9 Precautions at Power Auto Setting
(Modulation Analysis) > (Detail Settings)
(Modulation Analysis) > (Detail Settings)
20.000 dB to +20.000 dB
–
3.5.13 S-SS - On/Off
This enables/disables S-SS (Secondary Synchronization Signal).
S-SS is arranged (aligned) at the last symbol of Slot 0 (Subframe 0) and
Slot 11 (Subframe 5).
This can be set when Synchronization Mode is set to Reference Signal. It
is fixed to On when Synchronization Mode is set to Synchronization
Signal.
Procedure
>
Range On (Check box selected) S-SS on
Default On
(Modulation Analysis) > (Detail Settings)
Off (Check box not selected) S-SS off
Page 67

3.5 Setting Modulation Analysis
3-33
Measurement
3.5.14 S-SS - Power Auto/Manual
This sets the method for determining the S-SS Boost level.
This is supported when Test Model is set to Off. This is fixed to Manual
when Test Model is not set to Off.
Procedure
>
Options Auto, Manual
Default Auto
3.5.15 S-SS - Power Boosting
This sets the S-SS Boost level as a relative value based on the Reference
Signal level.
The Power Auto/Manual setting is enabled at Manual.
This is supported when Test Model is set to Off. It is fixed to the value
defined for Test Model when Test Model is not set to Off.
Procedure
>
Range
Default 0.000 dB
3.5.9 Precautions at Power Auto Setting
(Modulation Analysis) > (Detail Settings)
(Modulation Analysis) > (Detail Settings)
20.000 dB to +20.000 dB
–
3
3.5.16 PDCCH - On / Off
This enables or disables the PDCCH.
PDCCH is arranged (aligned) as the OFDM symbol length determined by
Number of PDCCH Symbols from the 0th OFDM symbol of each
subframe (1st OFDM symbol only at Channel Bandwidth 1.4 MHz).
This is available when Test Model is set to Off. This is fixed to On when
Test Model is not set to Off.
Procedure
>
Range On (Check box selected) With PDCCH
Default On
(Modulation Analysis) > (Detail Settings)
Off (Check box not selected) Without PDCCH
Page 68

Chapter 3 Measurement
3-34
3.5.17 PDCCH - Power Auto / Manual
This sets the method for determining the PDCCH Boost level.
This is available when Test Model is set to Off. This is fixed to Manual
when Test Model is not set to Off.
Procedure
>
Options Auto, Manual
Default Auto
3.5.18 PDCCH - Power Boosting
This sets the PDCCH Boost level as a relative value based on the
Reference Signal level.
The Power Auto/Manual setting is enabled at Manual.
This is supported when Test Model is set to Off. It is fixed to the value
defined for Test Model when Test Model is not set to Off.
Procedure
>
Range
Default 0.000 dB
–
3.5.9 Precautions at Power Auto Setting
(Modulation Analysis) > (Detail Settings)
(Modulation Analysis) > (Detail Settings)
20.000 to +20.000 dB
3.5.19 PCFICH - On/Off
This enables or disables the PCFICH.
PCFICH is arranged (aligned) at the header symbol of the Downlink
subframe.
This is supported when Test Model is set to Off. This is fixed to On when
Test Model is not set to Off.
Procedure
Range On (Check box selected) With PCFICH
Default On
>
(Modulation Analysis) > (Detail Settings)
Off (Check box not selected) Without PCFICH
Page 69

3.5 Setting Modulation Analysis
3-35
Measurement
3.5.20 PCFICH - Power Auto / Manual
This sets the method for determining the PCFICH Boost level.
This is supported when Test Model is set to Off. This is fixed to Manual
when Test Model is not set to Off.
Procedure
>
Options Auto, Manual
Default Auto
3.5.21 PCFICH - Power Boosting
This sets the PCFICH Boost level as a relative value based on the
Reference Signal level.
The Power Auto/Manual setting is enabled at Manual.
This is supported when Test Model is set to Off. It is fixed to the value
defined for Test Model when Test Model is not set to Off.
Procedure
>
Range
Default 0.000 dB
3.5.9 Precautions at Power Auto Setting
(Modulation Analysis) > (Detail Settings)
(Modulation Analysis) > (Detail Settings)
20.000 to +20.000 dB
–
3
Page 70

Chapter 3 Measurement
3-36
group
group
PHICH
N
i
m
( )
8/NN
N
DL
RBg
group
PHICH
=
i
m
2 1 - - - 2 1 - -
- 1 0 1 - - 1 0 1 - -
1 2 0 0 - 1 0 0 0 - 1
0 3 1 0 - - - 0 0 0 1
1 4 0 0 - - 0 0 0 0 1
1 5 0 0 - 0 0 0 0 0 1
0 6 1 1 - - - 1 1 - -
1
3.5.22 PHICH - On / Off
This enables or disables the PHICH.
PHICH is arranged (aligned) at the head symbol of each Downlink
subframe at Normal cyclic prefix.
There may be multiple instances of PHICH in the resource element(s)
comprising the PHICH groups. PHICH is separated (differentiated,
classified) according to the orthogonal sequence in PHICH group.
The number of PHICH groups included in 1 subframe is determined by
the equation
determined by the following equation and Table 3.5.22-1.
Nm •
. The values of
PHICHi
and
are
Table 3.5.22-1
Uplink-downlink Subframe No.i
Configuration 0 1 2 3 4 5 6 7 8 9
0
This is supported when Test Model is set to Off. This is fixed to On when
Test Model is not set to Off.
Procedure
>
(Modulation Analysis) > (Detail Settings)
Value
3.5. 28 PHICH - Ng
Range On (Check box selected) With PHICH
Off (Check box not selected) Without PHICH
Default On
Page 71

3.5 Setting Modulation Analysis
3-37
Measurement
3.5.23 PHICH - Power Auto / Manual
This sets the method for determining the PHICH Boost level.
This is supported when Test Model is set to Off. This is fixed to Manual
when Test Model is not set to Off.
Procedure
>
Options Auto, Manual
Default Auto
3.5.24 PHICH - Power Boosting
This sets the PHICH Boost level as relative value based on the Reference
Signal level.
The Power Auto/Manual setting is enabled at Manual.
This is supported when Test Model is set to Off. It is fixed to the value
defined for Test Model when Test Model is not set to Off.
Procedure
>
Range
Default 0.000 dB
3.5.9 Precautions at Power Auto Setting
(Modulation Analysis) > (Detail Settings)
(Modulation Analysis) > (Detail Settings)
20.000 to +20.000 dB
–
3
Page 72

Chapter 3 Measurement
3-38
3.5.25 PDSCH - Power Auto / Manual
This sets the method for determining the PDSCH Boost level.
It can be set when test model is Off.
3.5.3 PDSCH Modulation Scheme
Procedure
>
Options Auto, Manual
Default Auto
3.5.26 PDSCH - Power Boosting
This sets the PDSCH Boost level as a relative value based on the
Reference Signal level.
The above value is valid when Power is set to Manual.
It can be set when test model is Off. When Test Model is not Off, the
defined value for Test Model is fixed.
Procedure
> (Modulation Analysis) > (Detail Settings)
Range
Default 0.000 dB
–
3.5.9 Precautions at Power Auto Setting
(Modulation Analysis) > (Detail Settings)
20.000 to +20.000 dB
Page 73

3.5 Setting Modulation Analysis
3-39
Measurement
3.5.27 PHICH - TDD m_i=1(E-TM) On/Off
This sets the mi parameter, which is one parameter determining the
PHICH group number.
This is supported when Test Model is set to Off. This is fixed to On when
Test Model is not set to Off.
Procedure
>
(Modulation Analysis) > (Detail Settings)
3.5.28 PHICH - Ng
Options On(Check box selected) The mi parameter is set to 1
for all subframes.
Off(Check box not selected) The mi parameter is set to a
value defined in 3GPP
TS36.211.
Default Off
This sets the Ng parameter, which is one parameter determining the
PHICH group number.
This is supported when Test Model is set to Off. This is fixed to 1/6 when
Test Model is not set to Off.
Procedure
>
Options 1/6, 1/2, 1,2
Default 1/6
(Modulation Analysis) > (Detail Settings)
3
3.5.29 PHICH - Duration
This sets PHICH Duration.
It can be set when test model is Off. It is fixed to Normal when Te st
Model is not set to Off.
Procedure
> (Modulation Analysis) > (Detail Settings)
Options Normal, Extended
Default Normal
Page 74

Chapter 3 Measurement
3-40
3.5.30 Number of PDCCH Symbols - Auto/Manual
This selects automatic detection and manual setting of the number of
OFDM symbols per PDCCH.
When Auto is set, the value is determined from the PCFICH decoded CFI
(Control Format Indicator). CFI is information indicating the number of
OFDM symbols per PDCCH and is transmitted by PCFICH.
This is enabled when both PDCCH and PCFICH are both on. When
PCFICH is Off, the setting changes to Manual.
3.5.16 PDCCH - On/Off
3.5.19 PCFICH - On/Off
This is supported when Test Model is set to Off. It is fixed to Manual
when Test Model is not set to Off.
Procedure
>
Options Auto, Manual
Default Auto
(Modulation Analysis) > (Detail Settings)
Page 75

3.5 Setting Modulation Analysis
3-41
Measurement
3.5.31 Number of PDCCH Symbols
This sets the number of OFDM symbols per PDCCH. There are two types
of value: one for Subframe 1 and Subframe 6, and one for other
subframes.
This is enabled when Number of PDCCH Symbols - Auto/Manual is set to
Manual and PDCCH is set to On.
3.5.16 PDCCH - On/Off
Procedure
Range Subframe 1 and 6
Default 1
3.5.32 PDCCH Mapping
This arranges PDCCH and NIL (Dummy PDCCH) in Control Channels
Elements (CCEs).
This is enabled when PDCCH is set to On.
>
(Modulation Analysis) > (Detail Settings)
Other Subframes
3.5.30 Number of PDCCH Symbols - Auto/Manual
Channel Bandwidth 1.4 MHz : 2
Channel Bandwidth not 1.4 MHz : 1 to 2
Channel Bandwidth 1.4 MHz : 2 to 4
Channel Bandwidth not 1.4 MHz : 1 to 3
3.5.16 PDCCH - On/Off
3
It can be set when test model is Off. When Test Model is not Off, the
defined value for Test Model is fixed.
Procedure
> (Modulation Analysis) > (Detail Settings)
Range Auto, Easy
Default Auto
Page 76

Chapter 3 Measurement
3-42
3.5.33 PDCCH Format
This sets the PDCCH format. PDCCH format determines the CCE count
supported by PDCCH.
This is enabled when PDCCH is enabled and PDCCH Mapping is set to
Easy.
This is supported when Test Model is set to Off. It is fixed to the value
defined for Test Model when Test Model is not set to Off.
Procedure
Range 0 to 3
Default 0
3.5.16 PDCCH - On/Off
3.5.32 PDCCH Mapping
>
(Modulation Analysis) > (Detail Settings)
Page 77

3.5 Setting Modulation Analysis
3-43
Measurement
3.5.34 Number of PDCCHs
This sets the PDCCH number included in 1 subframe.
The PDCCH arrangement (alignment) varies according to the
PCFICH/PHICH arrangement (alignment). If the setting value for this
parameter is larger than the arrangement (alignment) that can actually
be set for PDCCH, the maximum value within this application is used.
This is enabled when PDCCH is enabled and PDCCH Mapping is set to
Eas y.
This is supported when Test Model is set to Off. It is fixed to the value
defined for Test Model when Test Model is not set to Off.
3
3.5.16 PDCCH - On/Off
3.5.32 PDCCH Mapping
Procedure
Range 1 to 88
Default 1
3.5.35 Channel Estimation
This sets OFDM signal Channel Estimation processing On and Off.
When Channel Estimation is On, amplitude and phase estimation is
performed based on the Reference Signal.
Procedure
Options On, Off
Default On
3.5.36 DwPTS
This sets whether or not to measure DwPTS.
>
(Modulation Analysis) > (Detail Settings)
>
(Modulation Analysis) > (Detail Settings)
Procedure
>
Range Include, Exclude
Default Exclude
(Modulation Analysis) > (Detail Settings)
Page 78

Chapter 3 Measurement
3-44
3.5.37 PDSCH EVM Calculation
This specifies the PDSCH EVM Calculation target resource block. This
parameter is applied only to the results for PDSCH ALL EVM, PDSCH
QPSK EVM, PDSCH 16QAM, PDSCH 64QAM, and PDSCH 256QAM
displayed in Summary.
Procedure
>
Range 3 G P P, All PDSCH Resource Elements
3GPP
This is the measurement method defined by 3GPP. When Channel
Bandwidth is 1.4 MHz, the calculation target is only 2 pairs of
resource block including 138 resource elements. When Channel
Bandwidth is not 1.4 MHz, the calculation target is only 2 pairs of
resource blocks including 150 resource elements.
All PDSCH EVM Resource Elements
The calculation target is all resource elements allocated to PDSCH.
The PDSCH EVM used in the Total EVM calculation is always
calculated by this method.
Default 3GPP
(Modulation Analysis) > (Detail Settings)
3.5.38 Test Model Starting Frame Type
When the input signal is an E-UTRA Test Model (Test Model hereafter)
defined by 3GPP TS36.141, Test Model is set. The Test Model signal
E-TM1.2, 2, 2a, 3.2, and 3.3 are composed of frame1 and frame2. This
function sets either frame 1 or frame 2 as the header frame for starting
analysis. Select Unlock when specifying nothing.
Test Model is enabled only for E-TM1.2, E-TM2, E-TM2a, E-TM3.2, and
E-TM3.3.
Procedure
>
Options UnLock, frame1, frame2
Default UnLock
(Modulation Analysis) > (Detail Settings)
Page 79

3.5 Setting Modulation Analysis
3-45
Measurement
3.5.39 Measurement Filter Type
This selects the type of filter used for signal analysis. Select Normal
when using a single carrier. For a multicarrier signal, select Narrow to
reduce the impact carriers not targeted for measurement.
Narrow is available when Extended Freq Lock Range is set to Off.
Procedure
>
(Modulation Analysis) > (Detail Settings)
Options Normal, Narrow
Default Normal
3.5.40 Extended Freq Lock Range
This function is for measuring signals with large frequency errors. Set to
On to increase the measurable frequency error range.
On is enabled only when the Measurement Filter Type is Normal.
Procedure
>
Options Off, On
Default Off
(Modulation Analysis) > (Detail Settings)
3.5.41 Operating Detail Settings Dialog
The Detail Settings dialog box is opened using the following procedure.
Procedure
>
(Modulation Analysis) > (Detail Settings)
3
Inputting each parameter and pressing
measurement.
When
dialog box is displayed, the parameters displayed in the Detail Settings
dialog box are returned to the same values as the defaults.
(Restore Default Values) is pressed while the Detail Settings
(Set) uses the values for
Page 80

Chapter 3 Measurement
3-46
3.5.42 Analysis Frame Position
This sets the analysis start position in frame units. This setting is
enabled when Capture Time is set to Manual. If Storage Mode is Off, the
setting range is determined assuming Storage Count is 1.
If the value of Capture Time Length or Storage Count changes, Analysis
Frame Position is automatically set to a value in the setting range.
Procedure
> (Modulation Analysis) > (Analysis Time)
(Analysis Frame Position)
or
> (Analysis Frame Position)
Range 0 to (Capture Time Length – Storage Count×5) frames
Default 0 frames
>
3.5.43 Analysis Offset Time
This sets the offset of the analysis start position in seconds based on
Analysis Frame Position. This setting is enabled when Capture Time is
set to Manual. If Storage Mode is Off, the setting range is determined
assuming Storage Count is 1.
If the value of Capture Time Length, Storage Count, or Analysis Frame
Position changes, Analysis Offset Time is automatically set to a value in
the setting range.
Procedure
(Analysis Offset Time)
Or
Range
When Capture Time Length = 5: 0 s (fixed)
If Capture Time Length > 5 and
Analysis Frame Position = 0 0 to +4999999 ns
If Analysis Frame Position = Capture Time Length - 5
–49999990 to 0 ns
If Analysis Frame Position is other than the above
–49999990 to +4999999 ns
Default 0 s
> (Modulation Analysis) > (Analysis Time)
> (Analysis Offset Time)
>
Page 81

3.6 Modulation Analysis Measurement and Results
3-47
Measurement
3.6 Modulation Analysis Measurement and Results
Modulation analysis is applied to a maximum of five frame intervals
according to the Uplink-downlink Configuration, Starting Subframe
Number, and Measurement Interval settings.
Unless otherwise described, the target measurement interval per
modulation analysis is the averaged value for the Measurement Interval
from Starting Subframe Number based on the synchronized frame
header.
Modulation analysis measurement is performed as described below.
Procedure
1. Set frequency, level and trigger.
3.2 Setting Frequency and Level
3
2. Set system parameters.
>
3. Press
4. Set modulation analysis related parameters.
5. Set Storage-related parameters.
6. Measure.
7. Select display contents.
(Modulation Analysis).
3.5 Setting Modulation Analysis
3.6.1 Setting Storage Mode/Count
3.1.3 Performing Measurement
3.6.5 Setting EVM Display Units and Scale
3.3 Setting Trigger
3.4 Common Settings
3.6.2 Trace Mode
3.6.3 Frame Offset
3.6.15 Marker
Page 82

Chapter 3 Measurement
3-48
3.6.1 Setting Storage Mode/Count
The Storage (Averaging) setting can be set when Trace Mode is not set to
Power vs RB and EVM vs RB.
This setting is disabled when Capture Time is set to Manual and when
Capture Time Length is set to 5.
Storage Mode
This enables Storage (Averaging) and the display method.
Procedure
>
Options Off Storage off
Default Off
Storage Count
(Storage) > (Mode)
Average Display average
Average & Max Display average and max.
This sets the Storage count (number of averaging).
Procedure
>
Range
When Capture Time is Auto: 2 to 9999
When Capture Time is set to Manual: 2 to Capture Time Length / 5
Default 10
(Storage) > (Count)
Page 83

3.6 Modulation Analysis Measurement and Results
3-49
Measurement
3.6.2 Trace Mode
Modulation analysis has six trace types (display modes) as listed below.
(1) EVM vs Subcarrier
This displays the main numeric results, such as IQ constellation,
frequency error, transmission power, EVM, etc., for each OFDM
symbol, as well as the EVM graph for each Subcarrier.
(2) EVM vs Symbol
This displays the main numeric results, such as IQ constellation,
frequency error, transmission power, EVM, etc., for each OFDM
symbol, as well as the EVM graph for each OFDM symbol.
(3) Spectral Flatness
This displays the main numeric results, such as IQ constellation,
frequency error, transmission power, EVM, etc., for each OFDM
symbol, as well as a graph for Spectral Flatness. The type of graph
varies with the Spectral Flatness Type.
(4) Power vs RB
3
This displays the main numeric results, such as IQ constellation,
frequency error, transmission power, EVM, etc., for each PDSCH
resource element as well as a graph of the PDSCH power per
resource block.
(5) EVM vs RB
This displays the main numeric results, such as IQ constellation,
frequency error, transmission power, EVM, etc., for each PDSCH
resource element, as well as the PDSCH EVM graph per resource
block.
(6) Summary
This displays the main numeric results, such as frequency error,
transmission power, EVN, etc. The display contents change
according to the Page Number.
(7) Test Model Summary
When Test Model is not set to Off, the measurement results for the
Test Model signal are displayed.
Procedure
>
(Trace Mode)
Options EVM vs Subcarrier, EVM vs Symbol , Spectral Flatness,
Default EVM vs Subcarrier
Power vs RB, EVM vs RB, Summary
Test Model Summary
Page 84

Chapter 3 Measurement
3-50
3.6.3 Frame Offset
This displays the results for each trace constellation and graph in 1
frame units.
When the analysis target crosses several frames, set the Frame Offset
and display frame interval.
In Figure 3.5.1-1, set Frame Offset to 1 to display the Frame 1 interval.
This parameter is not displayed when Trace Mode is set to Summary.
Procedure
>
Range 0 to 4
Default 0
(Frame)
Page 85

3.6 Modulation Analysis Measurement and Results
3-51
Measurement
3.6.4 Main Numeric Results
The main numeric results of modulation analysis are listed below.
(1) Frequency Error [Hz] / [ppm]
This is the difference between the set Carrier Frequency value and
the carrier frequency of the input signal specified from the
measurement interval Reference Signal. The maximum value is
determined by comparing the absolute value of each measurement
result.
(2) Output Power [dBm]
This is the average power of the 31.25 MHz band centered on the
set Carrier Frequency. It also includes the Cyclic prefix at the
measurement target OFDM symbol.
(3) Mean Power [dBm]
3
This is the average power of the Channel Bandwidth set
bandwidth centered on the set Carrier Frequency. It also includes
the Cyclic prefix at the measurement target OFDM symbol.
(4) EVM (rms) [%] / [dB]
This is the average value of the EVM for all physical channels and
physical signals set at Include at Total EVM Calculation. The
larger value determined by comparing the Total EVM High and
Total EVM Low for one measurement interval is used.
(5) EVM (peak) [%] / [dB]
This displays the maximum EVM in all Subcarriers and symbols
for all physical channels and physical signals set at Include at
Total EVM Calculation.
(6) Time Offset [ns]
This displays the time offset between the frame header and trigger.
It is displayed only when Trigger Switch is set to On.
3.6.5 Setting EVM Display Units and Scale
The EVM units can be switched between % and dB using the EVM Unit
setting.
Procedure
>
Options %, dB
Default %
(Scale)
>
(EVM Unit)
Page 86

Chapter 3 Measurement
3-52
3.6.6 Constellation
Constellation Symbol Number
The IQ constellation is displayed at the left side of the screen when the
Trace Mode is EVM vs Subcarrier, EVM vs Symbol, or Spectral Flatness
The display object is all subcarriers at the OFDM symbol set by
Constellation Symbol Number for the frame specified by Frame Offset.
Nothing is displayed at Constellation when the Constellation Symbol
Number is Downlink Subframe and the OFDM symbol is not DwPTS.
Constellation Symbol Number is the number of the OFDM symbol
displayed in Constellation. It is set as the continuous count from the
frame header (0) to the last frame.
Procedure
>
(Constellation Symbol Number)
Constellation Display Range
Range 0 to 139
Default 0
Select either Symbol or Composite (Frame units) for the Constellation
Graph.
Procedure
>
Options Symbol, Composite
Default Symbol
(Constellation Display Range)
Page 87

3.6 Modulation Analysis Measurement and Results
3-53
Measurement
3.6.7 EVM vs Subcarrier
This displays a graph at the bottom of the screen of the EVM for each
subcarrier in the frame specified by Frame Offset when Trace Mode is
EVM vs Subcarrier.
EVM vs Subcarrier View
This graph displays the averaged EVM value for OFDM symbols
included in the Downlink Subframe for analysis when EVM vs
Subcarrier View is set to Averaged over all Symbols. Depending on Graph
View, the displayed data can be set to either RMS EVM only or to both
RMS EVM and Peak EVM.
When EVM vs Subcarrier View is set to Each Symbol, the graph displays
the EVM for OFDM symbols specified by Bottom Graph Symbol Number.
Procedure
3
>
(EVM vs Subcarrier View)
Graph View
Bottom Graph Symbol Number
Options Each Symbol, Averaged over all Symbols
Default Averaged over all Symbols
This sets the type of EVM displayed in the graph.
Procedure
>
Options RMS, RMS&Peak
Default RMS&Peak
This is the number of the OFDM symbol displayed in the graph. It is set
as the continuous count from the frame header (0) to the last frame and
is enabled only when EVM vs Subcarrier View is set to Each Symbol.
Procedure
Range 0 to 139
Default 0
(EVM vs Subcarrier View)
>
(Bottom Graph Symbol Number)
>
(Graph View)
Page 88

Chapter 3 Measurement
3-54
EVM Scale
Marker Results (MKR)
This sets the maximum value of the graph y-axis (EVM).
Procedure
>
Range when EVM Unit is % 2%, 5%, 10%, 20%
when EVM Unit is dB 0 dB, –20 dB, –40 dB
Default when EVM Unit is % 5%
when EVM Unit is dB –40 dB
This displays the EVM at the subcarrier selected by the marker.
(Scale)
>
(EVM Scale)
Page 89

3.6 Modulation Analysis Measurement and Results
3-55
Measurement
3.6.8 EVM vs Symbol
This displays a graph of the EVM for the OFDM symbols in the frame
specified by Frame Offset at the bottom of the screen when Trace Mode is
EVM vs Symbol.
EVM vs Symbol View
This graph displays the averaged EVM value for the subcarrier included
in the Downlink Subframe for analysis when EVM vs Symbol View is set
to Averaged over all Subcarriers. Depending on Graph View, the
displayed data can be set to either RMS EVM only or to both RMS EVM
and Peak EVM.
When EVM vs Subcarrier View is set to Each Subcarrier, the graph
displays the EVM for the subcarrier set at Subcarrier Number.
Procedure
3
>
(EVM vs Symbol View)
Graph View
Options Each Subcarrier, Averaged over all Subcarriers
Default Averaged over all Subcarriers
This sets the type of EVM displayed in the graph.
Procedure
>
Options RMS, RMS&Peak
Default RMS&Peak
(EVM vs Symbol View)
>
(Graph View)
Page 90

Chapter 3 Measurement
3-56
Subcarrier Number
EVM Scale
Subcarrier Number is the number of the subcarrier displayed in the
graph. It is only enabled when EVM vs Symbol View is set to Each
Subcarrier.
Procedure
>
Range
Channel Bandwidth 1.4 MHz 0 to 71
Channel Bandwidth 3 MHz 0 to 179
Channel Bandwidth 5 MHz 0 to 299
Channel Bandwidth 10 MHz 0 to 599
Channel Bandwidth 15 MHz 0 to 899
Channel Bandwidth 20 MHz 0 to 1199
Default 0
This sets the maximum value of the graph y-axis (EVM).
(Subcarrier Number)
Marker Results (MKR)
Procedure
>
Range when EVM Unit is % 2%, 5%, 10%, 20%
when EVM Unit is dB 0 dB, –20 dB, –40 dB
Default when EVM Unit is % 5%
when EVM Unit is dB –40 dB
This displays the EVM at the OFDM symbol selected by the marker.
(Scale)
>
(EVM Scale)
Page 91

3.6 Modulation Analysis Measurement and Results
3-57
Measurement
3.6.9 Spectral Flatness
This displays a graph of the Spectral Flatness for the OFDM symbols
included in the Downlink Subframe for analysis in the frame specified by
Frame Offset at the bottom of the screen when Trace Mode is set to
Spectral Flatness.
There are four types of Spectral Flatness graph that are set by Spectral
Flatness Type.
Spectral Flatness Type
(1) Amplitude vs Subcarrier
This displays the relative power of each subcarrier versus the
average power of all valid Subcarriers.
(2) Difference Amplitude vs Subcarrier
This displays the difference in power between adjacent
Subcarriers.
(3) Phase vs Subcarrier
This displays the phase error of each subcarrier.
(4) Group Delay
This displays the group delay of adjacent Subcarriers.
Procedure
>
Options Amplitude, Difference Amplitude, Phase, Group Delay
Default Amplitude
(Spectral Flatness Type)
3
Page 92

Chapter 3 Measurement
3-58
Flatness Scale
Marker Results (MKR)
This sets the display range for the y-axis of the graph.
Procedure
>
Range
Amplitude
Difference Amplitude
Phase
Group
Default
Amplitude
Difference Amplitude
Phase
Group
The value for the subcarrier selected by the marker is displayed
according to the graph type.
(Scale)
>
(Flatness Scale)
1 dB, ±3 dB, ±10 dB
±
0.1 dB, ±0.3 dB, ±1 dB
±
1 degree, ±3 degree, ±60 degree
±
1 ns, ±10 ns, ±50 ns, ±100 ns
±
0 dB
±
1 dB
±
60 degree
±
100 ns
±
Page 93

3.6 Modulation Analysis Measurement and Results
3-59
Measurement
3.6.10 PDSCH Constellation
This displays the PDSCH IQ constellation at the bottom of the screen
when Trace Mode is set to Power vs RB, and EVM vs RB.
The display target is PDSCH at the resource block specified by Subframe
Number and Resource Block Number in the frame specified by Frame
Offset.
The constellation is not displayed when Subframe Number is at the
Uplink Subframe position.
Marker Results (MKR)
The subcarrier for the symbol at the resource element selected by the
marker, OFDM symbol, subframe, resource block and IQ coordinates are
displayed.
3
3.6.11 Subframe Number
This sets the subframe for display in the PDSCH constellation when
Trace Mode is Power vs RB and EVM vs RB.
Procedure
Range 0 to 9
Default 0
>
(Subframe Number)
Page 94

Chapter 3 Measurement
3-60
3.6.12 Resource Block Number
This sets the resource block for display in the PDSCH constellation when
Trace Mode is Power vs RB and EVM vs RB.
Note:
The definition of the resource block parameter used by Power vs
RB and EVM vs RB is the set of 12 subcarriers and 14 OFDM
symbols (2 slots).
Procedure
>
Range
Channel Bandwidth 1.4 MHz 0 to 5
Channel Bandwidth 3 MHz 0 to 14
Channel Bandwidth 5 MHz 0 to 24
Channel Bandwidth 10 MHz 0 to 49
Channel Bandwidth 15 MHz 0 to 74
Channel Bandwidth 20 MHz 0 to 99
Default 0
(Resource Block Number)
Page 95

3.6 Modulation Analysis Measurement and Results
3-61
Measurement
3.6.13 Power vs RB
Power vs RB View
This displays a graph of the PDSCH average power in the frame
specified by Frame Offset at the bottom of the screen when Trace Mode is
set to Power vs RB.
When Power vs RB View is set to Overall, the graph displays the PDSCH
power distribution with subframe and resource block as the graph axes.
The size of the power is displayed using colors on the right side of the
graph.
When EVM vs Symbol View is set to Each Subframe, the graph displays
the power vs resource block for the subframe specified by Subcarrier
Number.
Procedure
>
(Power vs RB View)
3
Graph View
Marker Results (MKR)
Options Each Subframe, Overall
Default Overall
This sets the type of EVM displayed in the graph.
Procedure
>
Options RMS, RMS&Peak
Default RMS&Peak
The modulation method for the resource block specified by the marker,
average power (relative value of absolute power vs Reference Signal
average power) and EVM are displayed.
(Power vs RB View)
>
(Graph View)
Page 96

Chapter 3 Measurement
3-62
3.6.14 EVM vs RB
Graph View
EVM Scale
This displays a graph of the PDSCH EVM vs resource block in the frame
specified by Frame Offset at the bottom of the screen when Trace Mode is
set to EVM vs RB.
This sets the type of EVM displayed in the graph.
Procedure
>
Options RMS, RMS&Peak
Default RMS&Peak
This sets the maximum value of the graph y-axis (EVM).
(Graph View)
Marker Results (MKR)
Procedure
>
Range when EVM Unit is % 2%, 5%, 10%, 20%
when EVM Unit is dB 0 dB, –20 dB, –40 dB
Default when EVM Unit is % 5%
when EVM Unit is dB –40 dB
The PDSCH modulation method for the selected resource block, average
power (relative to Reference Signal average power) and EVM are
displayed.
(Scale)
>
(EVM Scale)
Page 97

3.6 Modulation Analysis Measurement and Results
3-63
Measurement
3.6.15 Marker
This displays markers in the constellation at the top left of the screen
and in the graph at the bottom of the screen.
Procedure
or
> (Marker)
The procedure for using
Marker
This sets marker display/non-display.
Procedure
Options On, Off
Default On
Constellation Marker Number - Subcarrier
This sets markers in subcarrier units at the constellation displayed when
Trace Mode is set to EVM vs Subcarrier, EVM vs Symbol, and Spectral
Flatness.
Procedure
1.
2.
(Constellation Marker Number)
is explained below.
>
(Marker)
>
(Constellation Select)
3
Range
Channel Bandwidth 1.4 MHz 0 to 71
Channel Bandwidth 3 MHz 0 to 179
Channel Bandwidth 5 MHz 0 to 299
Channel Bandwidth 10 MHz 0 to 599
Channel Bandwidth 15 MHz 0 to 899
Channel Bandwidth 20 MHz 0 to 1199
Default 0
Page 98

Chapter 3 Measurement
3-64
Constellation Marker Number - Resource Element
This sets markers in PDSCH resource element units at the constellation
displayed when Trace Mode is set to Power vs RB, and EVM vs RB.
Procedure
>
Range Number of resource elements detected as 0 to PDSCH
Default 0
Bottom Graph Marker Number - Subcarrier
This sets markers in subcarrier units at the graph displayed when Trace
Mode is EVM vs Subcarrier, and Spectral Flatness.
Procedure
>
1.
(Constellation Marker Number)
(Bottom Graph Select)
2.
Range
Default 0
(Bottom Graph Marker Number)
Difference Amplitude and Group Delay of Spectral Flatness
Channel Bandwidth 1.4 MHz 1 to 70
Channel Bandwidth 3 MHz 1 to 178
Channel Bandwidth 5 MHz 1 to 298
Channel Bandwidth 10 MHz 1 to 598
Channel Bandwidth 15 MHz 1 to 898
Channel Bandwidth 20 MHz 1 to 1198
Except Above
Channel Bandwidth 1.4 MHz 0 to 71
Channel Bandwidth 3 MHz 0 to 179
Channel Bandwidth 5 MHz 0 to 299
Channel Bandwidth 10 MHz 0 to 599
Channel Bandwidth 15 MHz 0 to 899
Channel Bandwidth 20 MHz 0 to 1199
Page 99

3.6 Modulation Analysis Measurement and Results
3-65
Measurement
Bottom Marker Number - Symbol
This sets markers in OFDM symbol units at the graph displayed when
Trace Mode is set to EVM vs Symbol.
Procedure
1.
>
(Bottom Graph Select)
2.
Range 0 to 139
Default 0
Peak Search / Next Peak / Dip Search / Next Dip
These functions move markers to the maximum (Peak) and minimum
(Dip) points on the graph displayed at the bottom of the screen. Next
Peak and Next Dip move the markers to the next point based on the
current marker positions.
Procedure
(Bottom Graph Marker Number)
or
>
3
(Page 2)
Page 100

Chapter 3 Measurement
3-66
3.6.16 Summary
Page Number
Screen Top (always displayed)
When the Trace Mode is set to Summary, this displays the numeric
results on the multiple pages at the bottom of the screen. The pages are
switched using Page Number.
This switches the type of results displayed in Summary.
Procedure
>
Range 1 to 17
Default 1
The following types of results are displayed in Summary.
(1) Symbol Clock Error [ppm]
(Page Number)
This is the Symbol Clock Error.
Refer to section 3.6.4 Main Numeric Results for results other than the
above.
Page 1: List of EVM and Power for Each Channel
This is the averaged EVM and Power in the analyzed interval. The target
is all physical channels and physical signals set by Include at Total EVM
Calculation and DwPTS.
Page 2: Total EVM
This is the averaged EVM is the analysis interval. The target is all
physical channels and physical signals set by Include at Total EVM
Calculation and DwPTS.
Page 3: PDSCH ALL EVM
This is the averaged EVM is the analysis interval. The target is all QPSK,
16QAM, 64QAM and 256QAM-modulated PDSCH.
Page 4: PDSCH QPSK EVM
This is the averaged EVM is the analysis interval. The target is PDSCH
modulated by QPSK.
3.6.4 Main Numeric Results
Page 5: PDSCH 16QAM EVM
This is the averaged EVM is the analysis interval. The target is PDSCH
modulated by 16QAM.
 Loading...