

Page 1

User Guide
TM
Allison DOC
For PC–Service Tool
Version 7.0.0
GN3433ENGN3433EN 200703 Printed in USA 200710www.allisontransmission.com
Page 2

User
2007 MARCH
Guide
GN3433EN
Allison Transmission
Allison DOC™ For PC–Service Tool
Version 7.0.0
Printed in USA
1
Copyright © 2007 Allison Transmission, Inc.
Page 3

TABLE OF CONTENTS
1.0 Allison DOC™ For PC–Service Tool . . . . . . . . . . . . . . . . . . . . . . . . . . . . . . 7
1-1. Introduction . . . . . . . . . . . . . . . . . . . . . . . . . . . . . . . . . . . . . . . . . . . . 7
1-2. Warnings and Notes . . . . . . . . . . . . . . . . . . . . . . . . . . . . . . . . . . . . . . 8
1-3. User Guide Organization . . . . . . . . . . . . . . . . . . . . . . . . . . . . . . . . . . 9
1-4. Text Conventions Used in This Guide . . . . . . . . . . . . . . . . . . . . . . . . 9
1-5. System Requirements . . . . . . . . . . . . . . . . . . . . . . . . . . . . . . . . . . . . . 9
1-6. Allison DOC™ For PC–Service Tool Software Installation . . . . . . . . 10
1-7. Allison DOC™ For PC–Service Tool Overview . . . . . . . . . . . . . . . . 11
1-8. Allison DOC™ For PC–Service Tool Navigation, Controls,
and Status Information. . . . . . . . . . . . . . . . . . . . . . . . . . . . . . . . . . 12
Status Bar . . . . . . . . . . . . . . . . . . . . . . . . . . . . . . . . . . . . . . . . . . . . . . 12
Menus. . . . . . . . . . . . . . . . . . . . . . . . . . . . . . . . . . . . . . . . . . . . . . . . . 14
Button and Keyboard Shortcuts . . . . . . . . . . . . . . . . . . . . . . . . . . . . . 17
2.0 Connecting the PC to the Control System . . . . . . . . . . . . . . . . . . . . . . . . . . . 18
3.0 Starting Allison DOC™ For PC–Service Tool . . . . . . . . . . . . . . . . . . . . . . .
3-1. Starting the Program. . . . . . . . . . . . . . . . . . . . . . . . . . . . . . . . . . . . . . 22
3-2. 30-Day Trial. . . . . . . . . . . . . . . . . . . . . . . . . . . . . . . . . . . . . . . . . . . . 22
3-3. At Start-up . . . . . . . . . . . . . . . . . . . . . . . . . . . . . . . . . . . . . . . . . . . . . 23
4.0 Configuring and Updating Allison DOC™ For PC–Service Tool . . . . . . . . . 24
4.1. Application Configuration . . . . . . . . . . . . . . . . . . . . . . . . . . . . . . . . . 24
General Tab . . . . . . . . . . . . . . . . . . . . . . . . . . . . . . . . . . . . . . . . . . . . 25
Reprogramming Tab . . . . . . . . . . . . . . . . . . . . . . . . . . . . . . . . . . . . . . 25
Update Application Tab . . . . . . . . . . . . . . . . . . . . . . . . . . . . . . . . . . . 26
TAC Data Collection . . . . . . . . . . . . . . . . . . . . . . . . . . . . . . . . . . . . . 27
1000/2000 Setup and 3000/4000 Setup Tabs . . . . . . . . . . . . . . . . . . . 28
Setting up a New Data Configuration . . . . . . . . . . . . . . . . . . . . . . . . . 32
Loading a Saved Configuration . . . . . . . . . . . . . . . . . . . . . . . . . . . 32
Loading Default Configuration . . . . . . . . . . . . . . . . . . . . . . . . . . . 32
5.0 Using Allison DOC™ For PC–Service Tool . . . . . . . . . . . . . . . . . . . . . . . . . 33
5-1. Connecting/Disconnecting . . . . . . . . . . . . . . . . . . . . . . . . . . . . . . . . . 33
Connecting . . . . . . . . . . . . . . . . . . . . . . . . . . . . . . . . . . . . . . . . . . . . . 33
Disconnecting. . . . . . . . . . . . . . . . . . . . . . . . . . . . . . . . . . . . . . . . . . . 36
Quick Solutions for Unsuccessful Connections . . . . . . . . . . . . . . . . . 36
22
2
Page 4

5-2. Viewing Diagnostic Data . . . . . . . . . . . . . . . . . . . . . . . . . . . . . . . . . . 37
5-3. DTC and General Information . . . . . . . . . . . . . . . . . . . . . . . . . . . . . . 37
DTC Grid . . . . . . . . . . . . . . . . . . . . . . . . . . . . . . . . . . . . . . . . . . . . . . 38
Viewing Troubleshooting Manual Information for a Trouble Code . . 38
Clearing DTC Information . . . . . . . . . . . . . . . . . . . . . . . . . . . . . . . . . 39
Performance Complaint . . . . . . . . . . . . . . . . . . . . . . . . . . . . . . . . . . . 39
Failure Records . . . . . . . . . . . . . . . . . . . . . . . . . . . . . . . . . . . . . . . . . 39
DTC Test . . . . . . . . . . . . . . . . . . . . . . . . . . . . . . . . . . . . . . . . . . . . . . 41
Displaying the DTC Test Screen . . . . . . . . . . . . . . . . . . . . . . . . . . 42
TCM Information Grid. . . . . . . . . . . . . . . . . . . . . . . . . . . . . . . . . . . . 42
Transmission Information Grid . . . . . . . . . . . . . . . . . . . . . . . . . . . . . 42
Shift Inhibits Grid. . . . . . . . . . . . . . . . . . . . . . . . . . . . . . . . . . . . . . . . 42
5-4. Data Monitor . . . . . . . . . . . . . . . . . . . . . . . . . . . . . . . . . . . . . . . . . . . 43
Diagnostic Data . . . . . . . . . . . . . . . . . . . . . . . . . . . . . . . . . . . . . . . . . 43
Input/Output Functions. . . . . . . . . . . . . . . . . . . . . . . . . . . . . . . . . . . . 43
Shift Inhibits. . . . . . . . . . . . . . . . . . . . . . . . . . . . . . . . . . . . . . . . . . . . 44
5-5. Custom Data Monitor. . . . . . . . . . . . . . . . . . . . . . . . . . . . . . . . . . . . . 44
To Select Custom Data Monitor Transmission Parameters. . . . . . . . . 44
To Remove Custom Data Monitor Transmission Parameters . . . . . . . 45
Preconfigured Data List . . . . . . . . . . . . . . . . . . . . . . . . . . . . . . . . . . . 45
5-6. Graphics Monitor . . . . . . . . . . . . . . . . . . . . . . . . . . . . . . . . . . . . . . . . 45
Displaying the Graphics Monitor . . . . . . . . . . . . . . . . . . . . . . . . . . . . 46
5-7. Strip Chart . . . . . . . . . . . . . . . . . . . . . . . . . . . . . . . . . . . . . . . . . . . . . 46
Displaying the Strip Chart . . . . . . . . . . . . . . . . . . . . . . . . . . . . . . . . . 46
Saving A Strip Chart Configuration . . . . . . . . . . . . . . . . . . . . . . . . 47
To Load or Delete a Saved Strip Chart Configuration . . . . . . . . . . 48
Data Trace Identification . . . . . . . . . . . . . . . . . . . . . . . . . . . . . . . . 48
X-axis Scaling . . . . . . . . . . . . . . . . . . . . . . . . . . . . . . . . . . . . . . . . 48
Y-axis Scaling.. . . . . . . . . . . . . . . . . . . . . . . . . . . . . . . . . . . . . . . . 49
Strip Chart Modes . . . . . . . . . . . . . . . . . . . . . . . . . . . . . . . . . . . . . 49
Control Modes . . . . . . . . . . . . . . . . . . . . . . . . . . . . . . . . . . . . . . . . . . 49
5-8. Calibration Information . . . . . . . . . . . . . . . . . . . . . . . . . . . . . . . . . . . 50
To Display Current Calibration Information: . . . . . . . . . . . . . . . . . . . 50
5-9. Data Bus Traffic View. . . . . . . . . . . . . . . . . . . . . . . . . . . . . . . . . . . . . 51
Displaying the Data Bus Viewer. . . . . . . . . . . . . . . . . . . . . . . . . . . . . 54
Playing Back Data Bus Viewer files . . . . . . . . . . . . . . . . . . . . . . . . . . 56
3
Page 5

5-10. Action Requests . . . . . . . . . . . . . . . . . . . . . . . . . . . . . . . . . . . . . . . . . 57
Clutch Test Enabled . . . . . . . . . . . . . . . . . . . . . . . . . . . . . . . . . . . . . . 57
Solenoid Test . . . . . . . . . . . . . . . . . . . . . . . . . . . . . . . . . . . . . . . . . . . 58
To Enable the Solenoid Test Function:. . . . . . . . . . . . . . . . . . . . . . 58
Reset Auto-Detect . . . . . . . . . . . . . . . . . . . . . . . . . . . . . . . . . . . . . . . 59
Reset Auto-Detect Retarder . . . . . . . . . . . . . . . . . . . . . . . . . . . . . . . . 59
Reset Fast Adaptive . . . . . . . . . . . . . . . . . . . . . . . . . . . . . . . . . . . . . . 59
To Reset to Fast Adaptive . . . . . . . . . . . . . . . . . . . . . . . . . . . . . . . 60
Reset Adaptive Shift Parameters. . . . . . . . . . . . . . . . . . . . . . . . . . . . . 60
To Reset Adaptive Shift Parameters. . . . . . . . . . . . . . . . . . . . . . . . 60
Reset Full/Closed Throttle Calibration (TPS only). . . . . . . . . . . . . . . 62
Reset SEM Auto-Select . . . . . . . . . . . . . . . . . . . . . . . . . . . . . . . . . . . 63
Engineering Calculations . . . . . . . . . . . . . . . . . . . . . . . . . . . . . . . . . . 63
Transmission Fault Lamp Test . . . . . . . . . . . . . . . . . . . . . . . . . . . . . . 64
To Initiate a Fault Lamp Test . . . . . . . . . . . . . . . . . . . . . . . . . . . . . 64
Reverse Warning Lamp Test . . . . . . . . . . . . . . . . . . . . . . . . . . . . . . . . 65
To Initiate a Reverse Warning Test. . . . . . . . . . . . . . . . . . . . . . . . . 65
5-11. Recording Snapshots . . . . . . . . . . . . . . . . . . . . . . . . . . . . . . . . . . . . . 65
To Record an Event Driven Snapshot . . . . . . . . . . . . . . . . . . . . . . . . . 66
Triggering a Snapshot Recording (and/or setting a bookmark). . . . . . 66
To Insert a Bookmark While Recording Data . . . . . . . . . . . . . . . . 67
5-12. Stopping/Saving Snapshot Sessions . . . . . . . . . . . . . . . . . . . . . . . . . . 67
5-13. Playing Back Snapshots . . . . . . . . . . . . . . . . . . . . . . . . . . . . . . . . . . . 68
5-14. Exporting Playback Data . . . . . . . . . . . . . . . . . . . . . . . . . . . . . . . . . . 71
6.0 Reprogramming TCM. . . . . . . . . . . . . . . . . . . . . . . . . . . . . . . . . . . . . . . . . . 73
6-1. Reprogramming TCM . . . . . . . . . . . . . . . . . . . . . . . . . . . . . . . . . . . . 73
Enabling/Authorizing the Reprogramming Section in
Allison DOC™ For PC–Service Tool . . . . . . . . . . . . . . . . . . . . . . 73
Accessing the Reprogramming Function . . . . . . . . . . . . . . . . . . . . . . 74
Reprogramming Input/Output Configuration . . . . . . . . . . . . . . . . . . . 76
Reprogramming Customer Modifiable Constants. . . . . . . . . . . . . . . . 76
Reprogramming Package Assignments. . . . . . . . . . . . . . . . . . . . . . . . 77
Reprogramming TCM Password . . . . . . . . . . . . . . . . . . . . . . . . . . . . 77
Initiating TCM Reprogramming. . . . . . . . . . . . . . . . . . . . . . . . . . . . . 77
Reprogramming Status for WTEC II, WTEC III, and CEC2 . . . . . . . 78
4
Page 6

7.0 Reports . . . . . . . . . . . . . . . . . . . . . . . . . . . . . . . . . . . . . . . . . . . . . . . . . . . . . 80
7-1. Diagnostic Reports . . . . . . . . . . . . . . . . . . . . . . . . . . . . . . . . . . . . . . . 80
Saving Diagnostic Reports . . . . . . . . . . . . . . . . . . . . . . . . . . . . . . . . . 81
Displaying Saved Diagnostic Reports. . . . . . . . . . . . . . . . . . . . . . . . . 81
Diagnostic Report Examples . . . . . . . . . . . . . . . . . . . . . . . . . . . . . . . 82
7-2. TRANSHEALTH™ Report . . . . . . . . . . . . . . . . . . . . . . . . . . . . . . . . 83
Loading Saved TRANSHEALTH™ Reports . . . . . . . . . . . . . . . . . . . 88
Saving TRANSHEALTH™ Reports . . . . . . . . . . . . . . . . . . . . . . . . . 89
Printing TRANSHEALTH™ Reports . . . . . . . . . . . . . . . . . . . . . . . . 89
Closing the TRANSHEALTH™ Feature . . . . . . . . . . . . . . . . . . . . . . 89
7-3. Printing Screens . . . . . . . . . . . . . . . . . . . . . . . . . . . . . . . . . . . . . . . . . 89
7-4. Exiting Allison DOC™ For PC–Service Tool. . . . . . . . . . . . . . . . . . . 90
8.0 WTEC II/III, CEC2, and CEC1 Control Systems
WTEC II/III and CEC2 Diagnostic Trouble Codes . . . . . . . . . . . . . . 91
WTEC II/III and CEC2 DTC and General Info View . . . . . . . . . . 91
Clearing Active Codes . . . . . . . . . . . . . . . . . . . . . . . . . . . . . . . . . . 92
Clearing Inactive Codes. . . . . . . . . . . . . . . . . . . . . . . . . . . . . . . . . 92
WTEC II/III and CEC2 Diagnostic Data Monitor . . . . . . . . . . . . . . . 93
Diagnostic Data . . . . . . . . . . . . . . . . . . . . . . . . . . . . . . . . . . . . . . . 93
Input and Output Wires/Functions . . . . . . . . . . . . . . . . . . . . . . . . . 93
Shift Inhibits . . . . . . . . . . . . . . . . . . . . . . . . . . . . . . . . . . . . . . . . . 94
CEC1 Diagnostic Data Monitor . . . . . . . . . . . . . . . . . . . . . . . . . . . . . 94
WTEC II/III and CEC2 Custom Data Monitor. . . . . . . . . . . . . . . . . . 94
WTEC II/III and CEC2 Graphics Monitor . . . . . . . . . . . . . . . . . . . . . 94
Displaying the Graphics Monitor. . . . . . . . . . . . . . . . . . . . . . . . . . 94
WTEC II/III Graphics Monitor . . . . . . . . . . . . . . . . . . . . . . . . . . . 95
ECU Calibration Information . . . . . . . . . . . . . . . . . . . . . . . . . . . . . . . 95
WTEC II/III and CEC2 ECU Calibration Information . . . . . . . . . . . . 96
WTEC II/III and CEC2 Clutch Test . . . . . . . . . . . . . . . . . . . . . . . . . . 96
WTEC II/III Reset Fast Adaptive . . . . . . . . . . . . . . . . . . . . . . . . . . . . 97
WTEC II/III Reset Unadapted Shifts . . . . . . . . . . . . . . . . . . . . . . . . . 97
WTEC II/III and CEC2 Reset Throttle Calibration. . . . . . . . . . . . . . . 97
WTEC II/III TAC Data Collection . . . . . . . . . . . . . . . . . . . . . . . . . . . 98
. . . . . . . . . . . . . . . . .
91
5
Page 7

9.0 1000/2000 (Pre-Allison 4th Generation Controls) Control System . . . . . . . . 100
Diagnostic Trouble Codes . . . . . . . . . . . . . . . . . . . . . . . . . . . . . . . . . 100
Reset Adaptive Shift Parameters. . . . . . . . . . . . . . . . . . . . . . . . . . . . . 100
1000/2000 Throttle Calibration . . . . . . . . . . . . . . . . . . . . . . . . . . . . . 101
Clutch Test . . . . . . . . . . . . . . . . . . . . . . . . . . . . . . . . . . . . . . . . . . . . . 102
10.0 CEC Control System . . . . . . . . . . . . . . . . . . . . . . . . . . . . . . . . . . . . . . . . . . 103
CEC Snapshot Record . . . . . . . . . . . . . . . . . . . . . . . . . . . . . . . . . . . . 103
Reports . . . . . . . . . . . . . . . . . . . . . . . . . . . . . . . . . . . . . . . . . . . . . . . . 104
11.0 Using Allison DOC™ For PC–Service Tool Demos . . . . . . . . . . . . . . . . . . . 105
12.0 HELP System . . . . . . . . . . . . . . . . . . . . . . . . . . . . . . . . . . . . . . . . . . . . . . . . 107
Help Topics . . . . . . . . . . . . . . . . . . . . . . . . . . . . . . . . . . . . . . . . . . . . 107
Video-Based Training Materials . . . . . . . . . . . . . . . . . . . . . . . . . . . . . 108
Demo . . . . . . . . . . . . . . . . . . . . . . . . . . . . . . . . . . . . . . . . . . . . . . . . . 108
DTC Lookup . . . . . . . . . . . . . . . . . . . . . . . . . . . . . . . . . . . . . . . . . . . 108
Troubleshooting Manuals. . . . . . . . . . . . . . . . . . . . . . . . . . . . . . . . . . 109
Access To Allison Transmission Web Site
(requires an internet connection) . . . . . . . . . . . . . . . . . . . . . . . . . . 109
Hydro Schematics . . . . . . . . . . . . . . . . . . . . . . . . . . . . . . . . . . . . . . . 109
Allison Transmission Calc . . . . . . . . . . . . . . . . . . . . . . . . . . . . . . . . . 110
About Allison DOC . . . . . . . . . . . . . . . . . . . . . . . . . . . . . . . . . . . . . . 110
13.0 Diagnostic Data Definitions . . . . . . . . . . . . . . . . . . . . . . . . . . . . . . . . . . . . . 111
13-1. Customer Modifiable Constants (CMC) . . . . . . . . . . . . . . . . . . . . . . . 111
13-2. SEM/LRTP. . . . . . . . . . . . . . . . . . . . . . . . . . . . . . . . . . . . . . . . . . . . . 123
WTEC III Control Systems Specific Parameters . . . . . . . . . . . . . . . . 134
1000/2000 (Pre-Allison 4th Generation Controls)
Specific Parameters . . . . . . . . . . . . . . . . . . . . . . . . . . . . . . . . . . . . 135
6
Page 8

1.0 ALLISON DOC™ FOR
PC–SERVICE TOOL
1–1. INTRODUCTION
The Allison DOC™ (Diagnostic Optimized Connection) For PC–Service Tool is a
diagnostic system designed for use with Allison’s 3000/4000 Product Families
transmissions, 1000/2000 Product Families transmissions, and transmissions using
CEC2/CEC1 controls. This PC-based diagnostic program is capable of
communicating with Allison 4th Generation Control System Module TCMs,
WTEC II and WTEC III Electronic Control Units (ECU), 1000/2000 (Pre-Allison
4th Generation Controls) TCMs, CEC2, and CEC1 Electronic Control Units (ECU).
Allison DOC™ For PC–Service Tool performs the following:
• Monitors 3000/4000 Product Families Transmission Control Module
(TCM) data
• Monitors 1000/2000 Product Families Transmission Control Module
(TCM) data
• Monitors CEC2 Electronic Control Unit (ECU) data
• Monitors CEC Electronic Control Unit data, using a proprietary protocol
and the Allison CEC translator device
• Displays multiple transmission parameters
• Displays a graphical instrument panel with analog and digital gauges
• Displays a graphical strip chart
• Records and plays back diagnostic sessions
• Prints diagnostic reports
• Reprograms selected TCM parameters (requires completion of Allison
Transmission training).
Allison DOC™ For PC–Service Tool provides the following features:
• A Microsoft Windows®/PC look and feel
• Security measures to control reprogramming TCM/ECU parameters
• Integrated Help with training videos
• Diagnostic Trouble Code information with a direct link to 3000/4000
Product Families Troubleshooting Manuals
7
Page 9

• Diagnostic Trouble Code information with a direct link to the 1000/2000
Product Families Troubleshooting Manual
• Diagnostic Trouble Code information with a direct link to CEC2
Troubleshooting Manuals
• A demo mode using prerecorded data
• SmartConnect for detecting the PC-to-vehicle translation device and
communication link
• Communication troubleshooting wizard for those cases where the tool is
unable to connect to a control module
• Allison DOC™ For PC–Service Tool is compliant with applicable TMC
Recommended Practices, GM Online Standards, SAE Standards, and CE
Standards
• Allison DOC™ For PC–Service Tool is RP1210A compliant
1–2. WARNINGS AND NOTES
WARNING:
use or read the diagnostic tool while the vehicle is moving. Doing so
may result in loss of vehicle control, which may cause personal injury
and vehicle damage.
WARNING:
diagnostic tool.
WARNING:
vehicle while an assistant performs the diagnostic evaluations.
NOTE:
have a basic working knowledge of the Microsoft® Windows 2000®
Professional/XP® Professional®/Vista® Home Basic Operating
System(s) and Adobe Acrobat Reader®.
NOTE:
transmission controller has continuous power and ignition voltage
supplied at all times.
To avoid personal injury, the vehicle operator must not
Personnel other than the vehicle operator must use the
The vehicle operator must maintain control of the
Allison DOC™ For PC–Service Tool users are assumed to
During a TCM/ECU reprogramming event, make sure the
8
Page 10

Trademark Information
Windows 2000® Professional, Windows Explorer®, Windows XP® Professional,
Windows Vista® Home Basic, and Windows Media Player® are registered
trademarks of Microsoft Corporation.
Adobe Acrobat® is a registered trademark of Adobe Corporation.
Allison DOC™ is a trademark of General Motors Corporation.
InstallShield® is a registered trademark of InstallShield Software Corporation.
1–3. USER GUIDE ORGANIZATION
This user guide for Allison DOC™ For PC–Service Tool is organized with
information pertaining to the most current control system, Allison 4th Generation
Controls, appearing in the main body of the user guide. The functions and features
described are similar for all control systems except were indicated. Information
specific to an earlier control system is presented in a section devoted to that control
system.
1–4. TEXT CONVENTIONS USED IN THIS GUIDE
The following text conventions are used in this Guide to more clearly describe using
Allison DOC™ For PC–Service Tool:
• Screen button and keyboard key names are in bold capitals—
• Menu names are presented as displayed—File, Edit, etc.
• Menu items are presented as displayed—Exit.
• File names that may change with use are in lowercase italics—
• File names, usually system files, that do not change are in initial capitals—
Acrobat.pdf.
• Titles of windows are as they appear in the window.
OK, RETURN
snapshot.ad
1–5. SYSTEM REQUIREMENTS
• Microsoft® Windows XP® Professional, Windows 2000® (SP4 or later)
Professional, and Windows Vista® Home Basic (or better)
• 20 GB Hard Drive, (40 GB or greater recommended)
• 600 MB free hard drive space required to install the program (after software
installation, the operating system requires sufficient free hard disk space to
run the program)
• 1GHz (or greater) 32-bit (x86) or 64-bit (x64) processor
9
.
.
Page 11

• 512MB of RAM system memory (1GB recommended)
• One available USB port—USB 1.1 (USB 2.0 recommended)
• A serial port is required if connecting legacy CEC1 controllers, or if using the
J 44652-A - SPX J1850-VPW (Class 2) translator device
• 16x CD-ROM, (48x or greater recommended)
• Full administrative privileges are required to install, use, and update the
Allison DOC™ For PC–Service Tool
• Internet connection capability (Internet Explorer® 5.0.1 or greater)
(NOTE: A broadband internet connection is recommended for receiving
updates and file downloads)
• Windows® Media Player® is installed by default
• Adobe® Acrobat Reader® is installed by default
1–6. ALLISON DOC™ FOR PC–SERVICE TOOL SOFTWARE
INSTALLATION
This section explains how to install the Allison DOC™ For PC–Service Tool
software on your PC from the Allison DOC™ For PC–Service Tool CD-ROM.
Before attempting to install this software, make sure that:
• Your computer satisfies the PC Platform requirements listed on the “System
Requirements” section.
• You have
• For more information, see your network administrator.
full PC Administrator privileges
.
NOTE
: The newest version of Allison DOC™ For PC will
automatically supersede any previous version of this application. There
is no need to uninstall earlier versions of this application. The software
authorization (or password requirement) status will be maintained.
To install the Allison DOC™ For PC–Service Tool software on your PC:
1. Insert the Allison DOC™ For PC–Service Tool CD-ROM into your
CD-ROM drive. If the installation process does not begin momentarily, select
Start
->
Run
from the task bar. Click
installation CD, and click OK.
NOTE
: This process may take several minutes; please be patient.
Interrupting the installation process could cause issues such as error
messages, unable to connect, blank screens, problems during future
updates, etc.
10
Browse
, locate the
Setup.exe
file on the
Page 12

2. Follow On-Screen instructions.
3. Finally, the InstallShield® Wizard Complete window displays to indicate that
the installation has completed successfully. Select the “
my computer now
setup process and restart your PC.
NOTE
• Allison DOC™ For PC automatically installs the RP1210A
• To use any other RP1210 translator device listed in the latest
NOTE
procedures when using the Dearborn DPA4 USB adapter, please refer
to the “
Guide
Electronic Tools | Translator Devices.
” option (default). Click the
:
drivers for the following adapters: (1) DPA4 USB Translator
Device (essential-rated tool for Allison Transmission), and
(2) SPX J1850 VPW translator Device.
Allison DOC™ Service Information Letters (SIL), the
corresponding device drivers must be installed separately. Make
sure to install the drivers before attempting to use the translator
device with Allison DOC™ For PC–Service Tool.
: For more information on installation and troubleshooting
DPA4 USB Translator Device (J-47943) Quick Reference
” document available at www.allisontransmission.com | Service |
FINISH
Yes, I want to restart
button to exit the
1–7. ALLISON DOC™ FOR PC–SERVICE TOOL OVERVIEW
Allison DOC™ For PC–Service Tool has been designed to aid you, the technician,
in troubleshooting and maintaining Allison transmissions equipped with Allison 4th
Generation Controls, WTEC II, WTEC III, CEC2, CEC1, and 1000/2000 (PreAllison 4th Generation Controls) systems. Allison DOC™ For PC–Service Tool can
be used with a desktop PC or with a laptop PC in the cab of a vehicle.
WARNING:
use or read the tool while the vehicle is moving. Doing so may result
in loss of vehicle control, which may cause personal injury and
property damage.
Allison DOC™ For PC–Service Tool aids you by providing:
• Displays of real-time and prerecorded transmission operating data.
• The ability to display and record user-selectable transmission data.
• The ability to display and record data bus traffic.
To avoid personal injury, the vehicle operator must not
11
Page 13

• The ability to clear transmission trouble codes.
• Automatic recording of failure records.
• Automatic triggering of snapshot recording when a DTC is detected.
• Access to TCM configuration data.
• With Allison Transmission approved training, the ability to change
TCM/ECU configuration such as I/O functions and CMCs (this calibration
configuration change is called Reprogramming).
• A graphic data display.
• Strip chart data graphing.
• A variety of reports such as:
◊
Failure Records
◊
Autodetect Information
◊
Shift Inhibits
◊
I/O Functions
◊
TRANSHEALTH™ Report
NOTE
: Contact your nearest Allison Distributor for additional Allison
DOC™ For PC–Service Tool training. Allison Distributors are listed on
the Allison web site at www.allisontransmission.com.
◊
Diagnostic Data
◊
Customer Modifiable Constants (CMC)
◊
Trouble Codes
◊
DTC Test
1–8. ALLISON DOC™ FOR PC–SERVICE TOOL NAVIGATION,
CONTROLS, AND STATUS INFORMATION
Allison DOC™ For PC–Service Tool displays the following navigation, control, and
status information items regardless of what is displayed in the main Allison DOC™
For PC–Service Tool window.
Status Bar
The status bar provides information about the connection between Allison DOC™
For PC–Service Tool and the controller. It is located in the upper portion of the main
Allison DOC™ For PC–Service Tool window. The fields in the status bar are not
labeled, but their content adequately indicates their purpose.
Allison DOC™ For PC–Service Tool Status Bar
12
Page 14

Allison DOC™ For PC–Service Tool Connect Time Display
Allison DOC™ For PC–Service Tool Status Bar Fields:
• Control System Information
◊
Transmission Control System, Calibration Identification Number, and
software level, example: 1K2K—120004A002K / D71
• Application Status
◊
Connected—Allison DOC™ For PC–Service Tool is actively connected
to a control system and receiving live data.
◊
Off-Line—Allison DOC™ For PC–Service Tool is not actively connected
to a control system and it’s not receiving live data.
◊
Playback—The displayed data is part of a snapshot or Demo file
previously recorded.
◊
Recording—Displayed data is live data and is being recorded.
• Event Status (during a live connection)
◊
Diagnostic—Diagnostic data is being displayed.
◊
Shift Inhibit—Diagnostic data is being displayed, and a shift inhibit is
currently present.
◊
Action Request—Diagnostic data is being displayed, and the user is
commanding an action request.
◊
Reprogramming—the Reprogramming screen is being displayed.
• Event Status (during Playback)
◊
Diagnostic—Diagnostic data is being displayed. No action requests were
being performed at the time of the recording and no shift inhibits were
present.
◊
Shift Inhibit—Diagnostic data is being displayed. A shift inhibit was
active at the time of the recording.
◊
Action Request—Diagnostic data is being displayed which was recorded
while an action request was being performed.
• DTC Status
◊
Active Codes—One or more Active DTCs are present. Inactive DTCs
may also be present.
◊
No Active Codes—No Active DTCs are present. Inactive DTCs may be
present.
13
Page 15

Menus
The menu bar at the top of the Allison DOC™ For PC–Service Tool window, above
the Status bar, displays the following drop-down menus:
File
• TCM Reflash (PCCS)—Opens up the TCM Reflash (PCCS) application, only
if it’s installed in the PC.
• Data Bus Viewer—Opens up the Data Bus Traffic Viewer. This option is
disabled during a live connection of the tool.
• Exit—Exits the Allison DOC™ For PC–Service Tool program
Reprogram
• When enabled, displays the TCM/ECU Reprogramming section. Users need
special training to enable this section of the tool.
Action Items
• Clutch Test Enabled—For Allison 4th Generation Control systems and
1000/2000 (Pre-Allison 4th Generation Controls) systems, it displays the
Clutch Test floating tool bar. For all other control system (i.e. WTEC II,
WTEC III, and CEC2), it controls the Clutch Test mode.
• Solenoid Test…—Displays the Solenoid Test screen (not available for
WTEC II/III, CEC1, and CEC2).
• Reset Adaptive Shift Parameters—(not available for WTEC II/III, CEC1, and
CEC2) Displays the Reset Adaptive Shift Parameters window, where
transmission adaptive data can be reset to factory values per shift.
• Reset Unadapted Shifts—(only available for WTEC II and WTEC III) Resets
all transmission adaptive data to factory values.
• Reset Fast Adaptive—(not available for 1000/2000 Pre-Allison 4th
Generation Controls and CEC2 systems) Activates the Fast Adaptive logic in
the TCM/ECU.
• Reset Full Throttle Calibrations (TPS only)—(not available for WTEC II,
WTEC II, and CEC2 control systems) Resets upper limit of the TPS
calibration.
• Reset Closed Throttle Calibrations (TPS only)— (not available for WTEC II,
WTEC II, and CEC2 control systems) Resets the lower limit of the TPS
calibration.
• Reset Throttle Calibration—(only available for WTEC II, WTEC III, and
CEC2) Resets the throttle position sensor calibration.
• Transmission Fault Lamp Test—(only available for Allison 4th Generation
Controls systems) Enables the transmission Fault Lamp Test.
14
Page 16

• Reverse Warning Lamp Test—(only available for Allison 4th Generation
Controls systems) Enables the Reverse Warning Lamp Test.
• Reset Auto-Detect—(not available for the 1000/2000 Pre-Allison 4th
Generation controls system) Clears and resets the TCM auto-detect
information.
• Reset Auto-Detect Retarder—(only available for the 3000/4000 Allison 4th
Generation Controls system) Clears and resets auto-detection of transmission
retarder.
• Reset SEM Auto-Select—(only available for Allison 4th Generation Controls
systems) Clears and resets auto-selection of Shift Energy Management.
• Engineering Calculations—Provides means to calculate converter speed
ratio, vehicle speed, and acceleration in g’s.
Snapshot
• Record
◊
Record Options—Displays the recording options window.
◊
Stop Recording—Halts recording.
◊
Add Bookmark—Displays the bookmark window.
• Playback
◊
Open Playback File—Displays the Open window and the content of the
Log folder.
◊
Play—Plays a recorded data file.
◊
Rewind—Starts the playback at the beginning.
◊
Stop—Stops a playback.
◊
Fast forward—Plays a recorded data file at four times the normal speed.
◊
Continuous—Plays a recorded data file continuously, a looped playback.
• Email—Displays the Compose Email window. This section requires the user
to fill out some networking information that might require the assistance
from the user’s IT department.
• Export—(only available for Allison 4th Generation Controls system) Exports
data from a playback file for inclusion into a spreadsheet.
Reports
• Diagnostic Reports—displays the Report Sections window. Refer to
Section 7–1 for more information.
• TRANSHEALTH™ Report— (not available for Allison 4th Generation
Controls systems) when available, it displays the TRANSHEALTH™
feature. Refer to Section 7–2 for more information.
15
Page 17

Software Configuration
• Displays the Software Configuration dialog box.
Help
• Help Topics—displays the Help Topics window.
• Video-based Training Materials
◊ Allison DOC™ Training Videos—displays the new/enhanced software
training videos
◊ Circuit Checks—Displays the Circuit Checks training video with
Microsoft® Media Player®
◊ Circuit Basics—Displays the Circuit Basics training video with
Microsoft® Media Player®
• Demo—displays the Choose Demo window
• DTC Lookup—displays the Trouble Code Lookup window for various
control systems
• Troubleshooting Manuals
◊ WTEC III—opens up the WTEC III Troubleshooting Manual
◊ 3000/4000 (4th Gen)—opens up the 3000/4000 (Allison 4th Generation
Controls) Troubleshooting Manual
◊ 1000/2000 (Pre-4th Gen)—opens up the 1000/2000/2400 Series™
Troubleshooting Manual
◊ 1000/2000 (4th Gen)—opens up the 1000/2000 (Allison 4th Generation
Controls) Troubleshooting Manual
◊ WTEC II—opens up the WTEC II Troubleshooting Manual
◊ CEC2 Off-Highway—activates the Adobe Acrobat reader to display the
CEC2 Troubleshooting Manual
• Access to Allison Transmission Web Site—Connects to the ALLISON
TRANSMISSION web site, www.allisontransmission.com
• Hydraulic Schematics
◊ 3000/4000 (4th Gen)—displays the Allison 4th Generation Controls
3000/4000 hydraulic schematics
◊ 1000/2000 (4th Gen)—displays the Allison 4th Generation Controls
1000/2000 hydraulic schematics
◊ 1000/2000 (Pre-4th Gen)—displays 1K2K (Pre-Allison 4th Generation
Controls) hydraulic schematics
◊ WTEC III—displays WTEC hydraulic schematics
• Allison Transmission Calc—displays the Allison Transmission Calculation
application.
• About Allison DOC—displays information about this version of Allison
DOC™ For PC–Service Tool
16
Page 18

Print Screen
• Prints the displayed screen
Button and Keyboard Shortcuts
The following buttons are always available in the primary Allison DOC™ For PC–
Service Tool window. Clicking the button or pressing the associated function key
displays the listed menu.
F1–Help
• Accesses the Help system
F2–TRANSHEALTH™
• Displays the TRANSHEALTH™ feature. Refer to Section 7–2 for more
detailed information.
F3–DTC Lookup
• Displays the Trouble Code Lookup window for various control systems
F4–Connect (or F4-Disconnect)
• Connect (F4-Connect) to or disconnect (F4-Disconnect) from an ECU or
TCM
F5–Trigger Recording
• Triggers the recording session of a snapshot and also inserts a trigger point in
the data stream. This constitutes the faster way to initiate a snapshot
recording session.
• If used during a recording session, inserts “bookmarks” in the data stream of
the log file. Bookmarks are sequentially numbered by the system when F6–
Bookmark # is used.
F6–Stop Recording
• Stops a snapshot recording.
Accelerator Keys—On screen buttons have shortcuts known as accelerator keys.
An underlined character in the button text identifies the button’s accelerator
keyboard key. Pressing the accelerator key activates the function associated with the
button. For example, on the button below, the P keyboard key is the accelerator key.
Dropdown menu items accelerator keys require pressing ALT before pressing the
accelerator key. After pressing the ALT/ACCELERATOR KEY combination that
menu displays.
When this button is visible, press ALT+ P to activate a print function.
17
Page 19
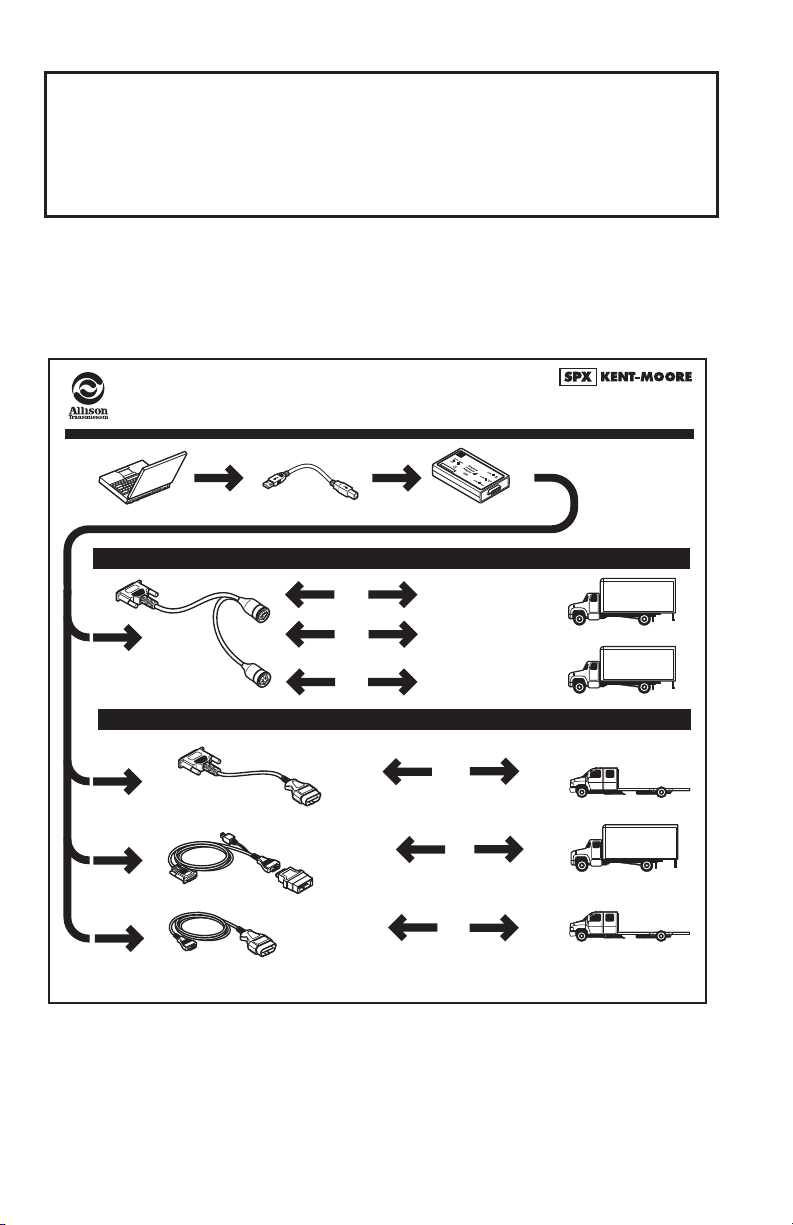
2.0 CONNECTING THE PC TO THE
CONTROL SYSTEM
The diagram below illustrates the hardware connections between the PC hosting
Allison DOC™ For PC–Service Tool, the data translator, and the vehicle control
system diagnostic connector.
J 47943
DPA4 USB
Allison DOC™ For PC–Service Tool
Connection Diagrams
J 47943-3 USB Cable
(Part of J 47943 Kit)
Used with J 47943
DB15
Connector
9-Pin
Connnector
2
-
43
9
47
J
it)
K
43
9
47
f J
t o
r
Pa
(
6-Pin
Connnector
J1939
OR
J1708
J1708
Optional Vehicle Interface Adapter Connections
SPX P/N: J 47949-A – GMLAN Cable
DB15
Connector
SPX P/N: J 38500-2 15M to 15F (Atari) Cable
Nexiq P/N: 501002
DB15 Connector
SPX P/N: J 41788
DB15 Connector
Allison 4th Generation Controls, 1000 and 2000 Product Families
(Pre-Allison 4th Generation Controls), WTEC III, WTEC II, and CEC2
OBDII/16-Pin
Connector
J 1962/B
12-Pin Packard Connector
SPX P/N: J 34812-1
Nexiq P/N: 40103
OBDII/16-Pin Connector
J 1962/A
Fax: U.S. and Canada: 1-800-578-7375 or 1-586-578-7375
D
G
D
e
htt
a
rb
p
:/
www
o
r
n
.
d
gte
G
c
r
h.
o
c
u
o
m
p
J 47943-1
Translator Device
(Part of J 47943 Kit)
Allison 4th Generation Controls
1000 and 2000 Product Families
(Pre-Allison 4th Generation Controls)
WTEC III
CEC2
WTEC III
WTEC II
CEC2
GMLAN
J170
8
J1708
Phone: U.S. and Canada: 1-866-621-2128
International: 1-507-455-7223
International: 1-507-455-7063
DPA4 USB
NOTE: Diagrams depicting
cables do not
represent actual
lengths.
Allison 4th
Generation
Controls
WTEC III
WTEC II
CEC2
WTEC III
V09364.03.01
18
Page 20
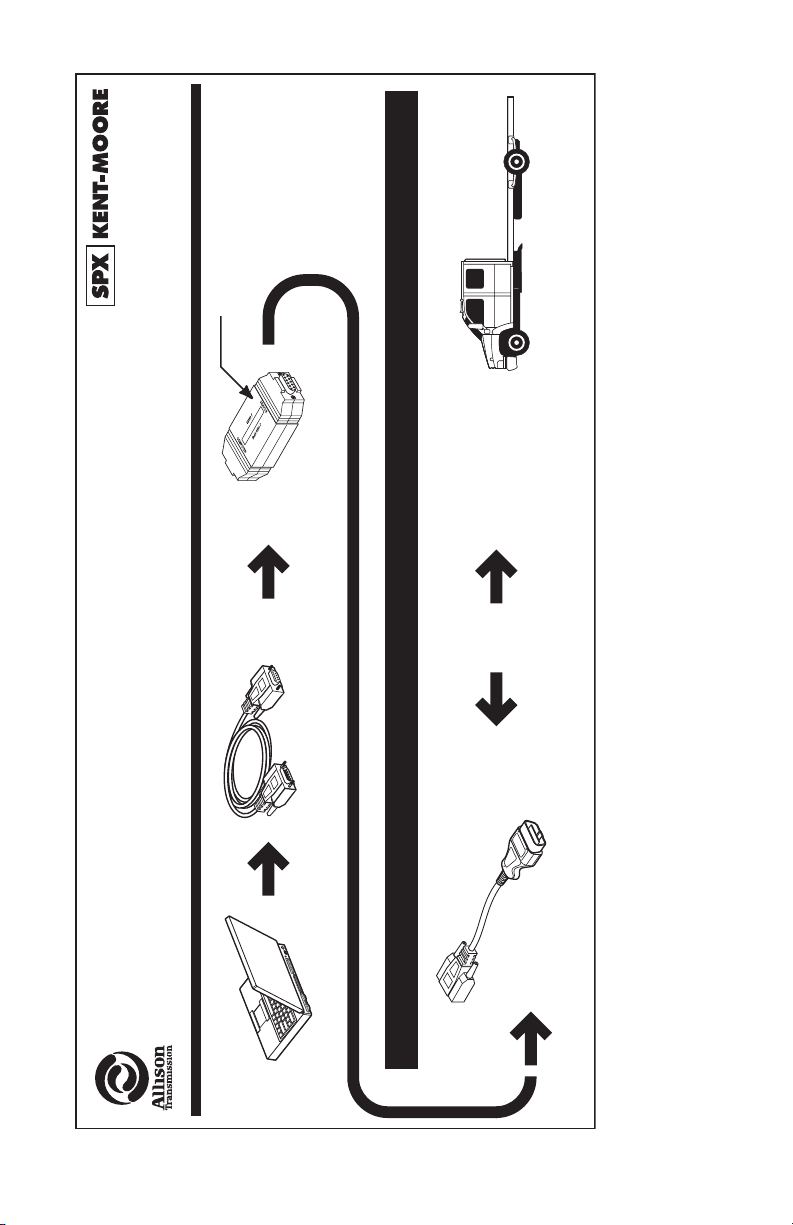
NOTE: Diagrams depicting
International: 1-507-455-7223
International: 1-507-455-7063
NOTE: “MODIFIED” must be
on the label.
cables do not
represent actual
lengths.
V09365.01.02
Phone: U.S. and Canada: 1-866-621-2128
D
FIE
I
D
MO
Fax: U.S. and Canada: 1-800-578-7375 or 1-586-578-7375
J 44652-A
(Part of J 44652-A Kit)
Translator Device J1850-VPW
Connection Diagrams
(Part of
J 44652-A Kit)
Allison DOC™ For PC–Service Tool
th
1000 and 2000
Product Families
(Pre-Allison 4
Generation Controls)
J1850
OBDII/16-Pin
Connector
J 1962/A
Generation Controls)
th
J 44652-A
J1850-VPW
(Part of
J 44652-A Kit)
GM Applications Using 1000 and 2000 Product Families (Pre-Allison 4
Used with J 44652-A
DB9
Connector
19
Page 21
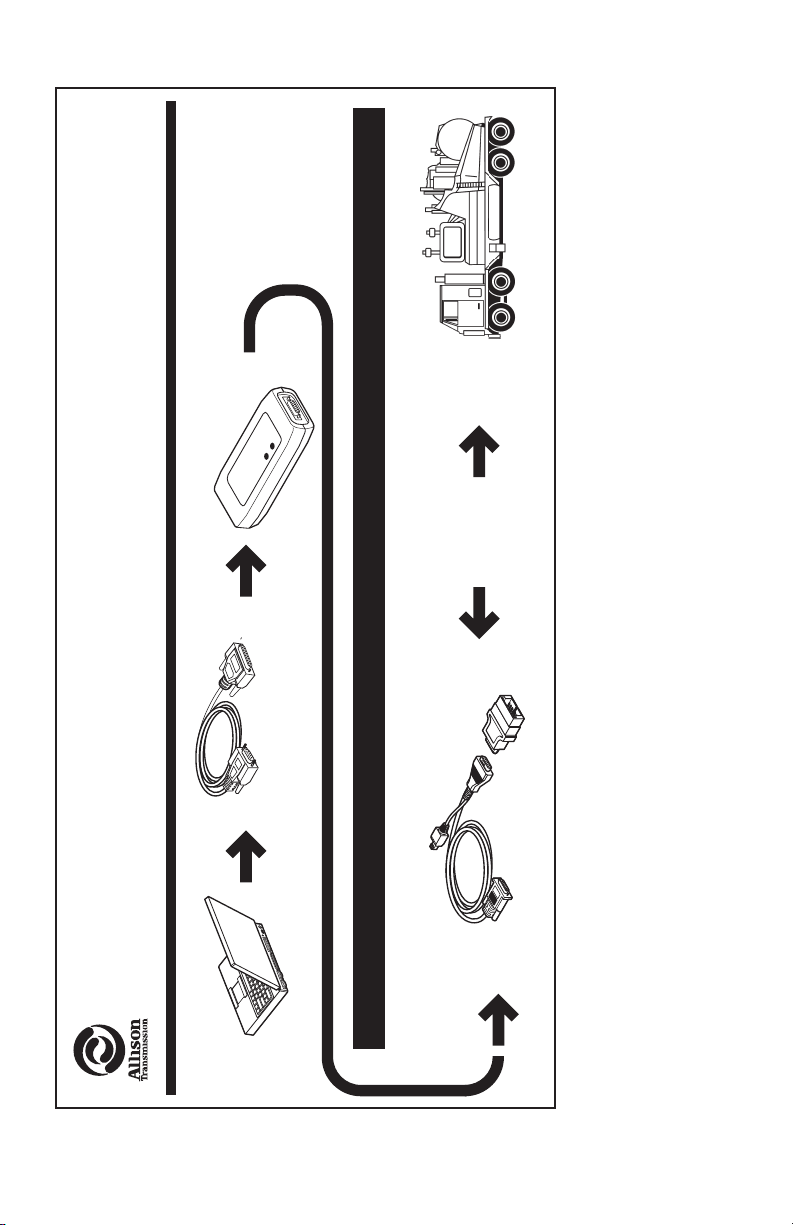
NOTE: Diagrams depicting
cables do not
represent actual
lengths.
NOTE: Cables not included
with translator device.
SGI, Inc. or SPX/Kent-Moore
Fax: 1-317-471-4996
Phone: 1-888-666-5799
For Purchase Contact:
CEC Translator Device
E
L
IC
VEH
TO
SPX P/N: J 47134
SGI P/N: CD3723EN
R
E
O
C
I
AT
V
L
E
C
S
D
E
N
R
C
RA
UTE
T
P
M
O CO
T
Commercial
9F to 25M Cable
(Modem Type)
Connection Diagrams
V09366.01.03
CEC1
Allison
Protocol
Propietary
Transmission
CEC1
12-Pin Packard Connector
SPX P/N: J 34812-1
Nexiq P/N: 40103
Allison DOC™ For PC–Service Tool
Allison
Transmission
CEC Translator
Device
Used with CEC Translator Device
15M to 15F (Atari) Cable
SPX P/N: 38500-2
Nexiq P/N: 501002
20
Page 22

A fully RP1210A compliant PC-to-vehicle translator device is required to establish
communication with the TCM/ECU. Allison DOC™ For PC–Service Tool currently
supports the Dearborn Protocol Adaptor DPA4 USB (SPX P/N J47943) and other
devices listed in the latest Allison DOC™ Service Information Letter (SIL),
available on the Allison Transmission Extranet.
NOTE: For more information on installation and troubleshooting
procedures when using the Dearborn DPA4 USB adapter, please refer
to the “DPA4 USB Translator Device (J-47943) Quick Reference
Guide” document available at
www.allisontrnamission.com/Service/Electronic Tools/Translator
Devices.
In order to communicate with the CEC control system, Allison DOC™ For PC–
Service Tool requires the Allison Transmission CEC Translator Device. Refer to the
above diagrams for P/Ns and contact information. The drivers must be installed
from the Allison DOC™ For PC–Service Tool CD-ROM, located in the Noregon
RP1210A API folder.
To communicate with 1000/2000/2400 Series™ transmissions using the J1850
communication protocol (with OBDII trapezoidal diagnostic connector), Allison
DOC™ For PC–Service Tool requires the SPX J1850 VPW translator device. Refer
to the above diagrams for P/Ns and contact information. The translator device
drivers are automatically installed with Allison DOC™ For PC–Service Tool.
21
Page 23
3.0 STARTING ALLISON DOC™
FOR PC–SERVICE TOOL
3–1. STARTING THE PROGRAM
There are two ways to start Allison DOC™ For PC–Service Tool:
Double-click the Allison DOC™ For PC–Service Tool icon on your PC
desktop,
or,
From your PC’s Start menu, select Programs --> Allison Transmission --> Allison
DOC™ For PC–Service Tool. If you stored Allison DOC™ For PC–Service Tool is
in another location, follow the path to that location and select Allison DOC™ For
PC–Service Tool.
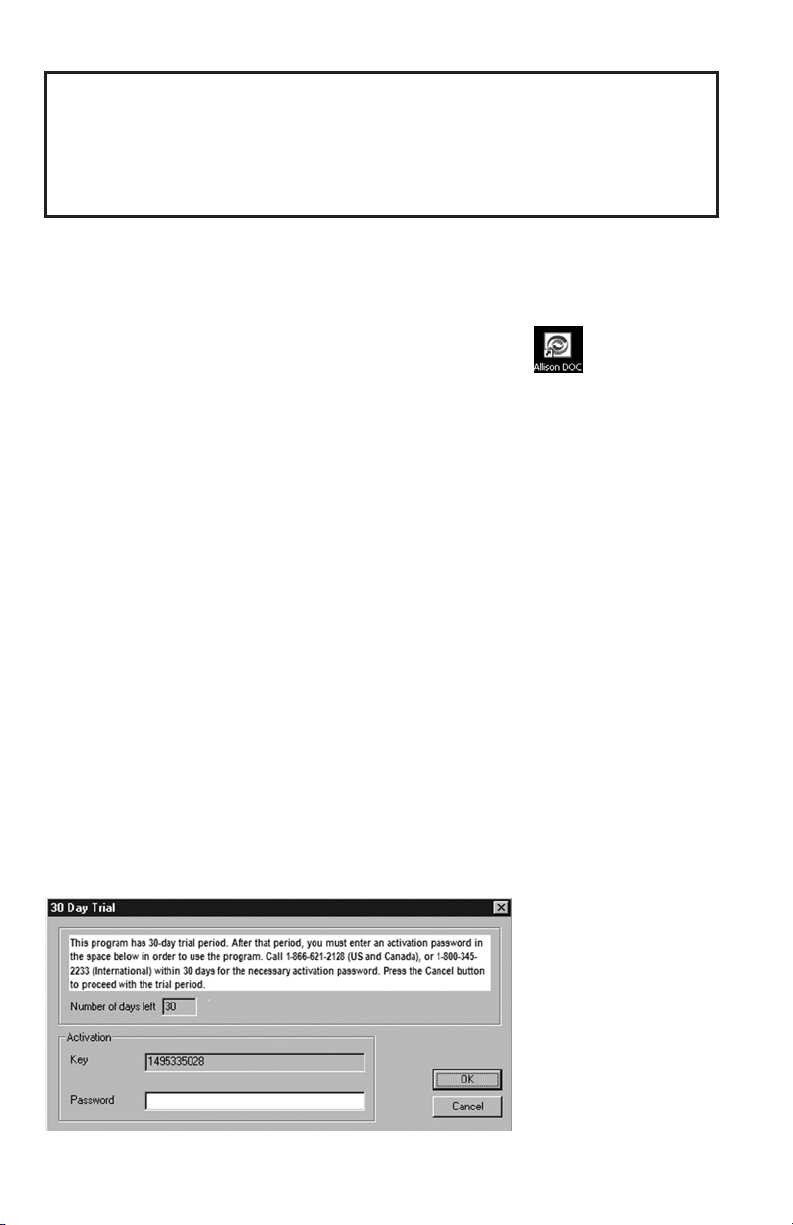
3–2. 30-DAY TRIAL
A 30-Day trial is included as part of Allison DOC™ For PC–Service Tool. The 30-day
trial window appears each time Allison DOC™ For PC–Service Tool is started, unless
the activation password has been entered. The 30-day trial window displays the
number of days remaining in the trial period. At any time before the trial period ends
you may enter the activation password. The Allison DOC™ For PC–Service Tool
application will not function after 30 days if a valid activation password has not been
entered. Contact SPX Kent-Moore (US and Canada: 1-866-621-2128, International:
1-800-345-2233) to obtain the product activation password.
Once you have the password, enter it into the Password field of the 30-Day Trial
window and press OK.
During the 30-day trial period, press CANCEL to run the Allison DOC™ For PC–
Service Tool program.
22
Page 24
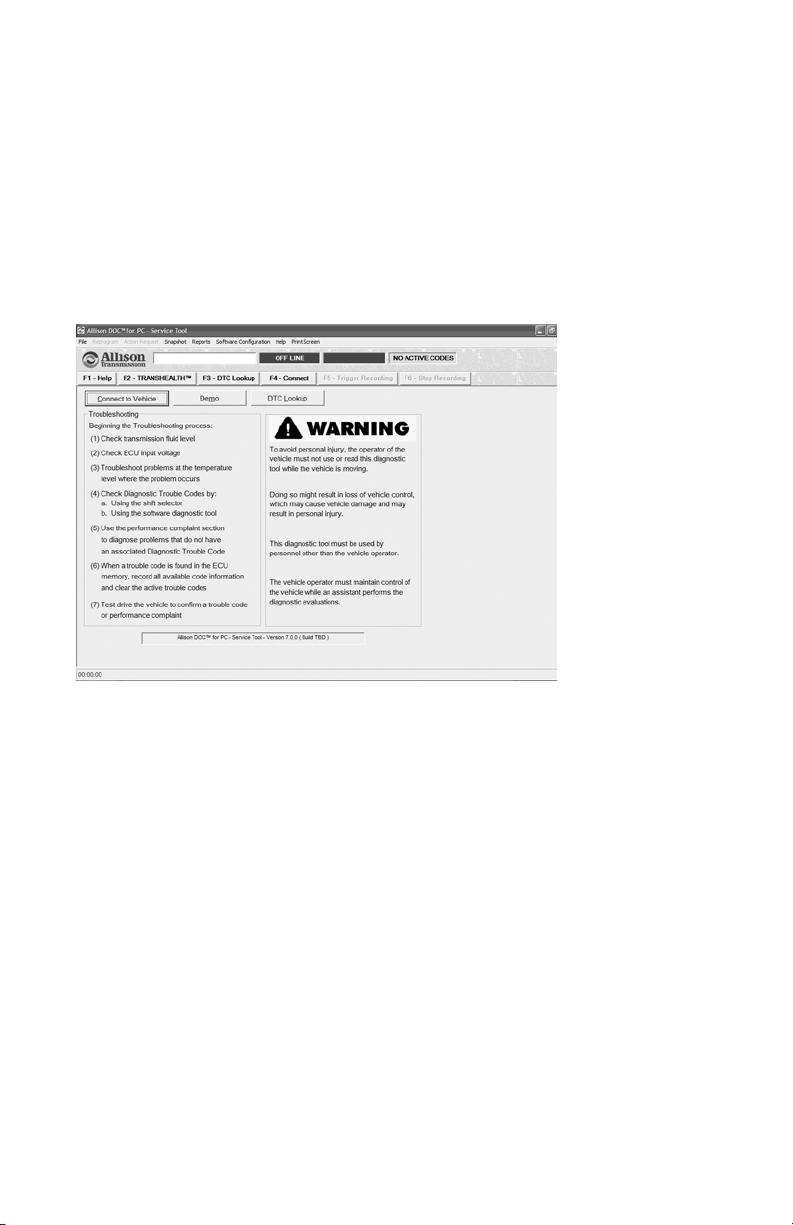
3–3. AT START-UP
When you start Allison DOC™ For PC–Service Tool, the Warning window displays
(if the activation password has been entered, otherwise the 30-Day Trial window
displays). The Warning window lists basic transmission troubleshooting tasks and
outlines basic safety considerations (see Warnings and Notes). The CONNECT TO
VEHICLE button initiates the software connection to a vehicle and the DEMO
button starts Allison DOC™ For PC–Service Tool Demos. The DTC LOOKUP
button displays the Trouble Code Lookup window for various control systems. The
Allison DOC™ For PC–Service Tool version and build are displayed at the bottom
of the Warning window.
23
Page 25
4.0 CONFIGURING AND UPDATING
ALLISON DOC™ FOR PC–SERVICE TOOL
4–1. APPLICATION CONFIGURATION
The Software Configuration function allows you to tailor Allison DOC™ For
PC–Service Tool to your specific situation and to update the Allison DOC™ For
PC–Service Tool application.
From Software Configuration main menu option you can:
• Change languages—select a language that was initially selected during the
installation of the program
• Change units of measure—English or Metric
• Enter ECU/TCM Reprogramming authorization
• Update the Allison DOC™ For PC–Service Tool application
• Enter TAC Data Collection authorization
• Change the Data Configuration—select 1000/2000 and 3000/4000
th
Generation Controls system transmission parameters to be reported by the
4
TCM.
NOTE: If the Reprogramming tab is “grayed-out” or disabled, the
Reprogramming section has already been authorized.
24
Page 26

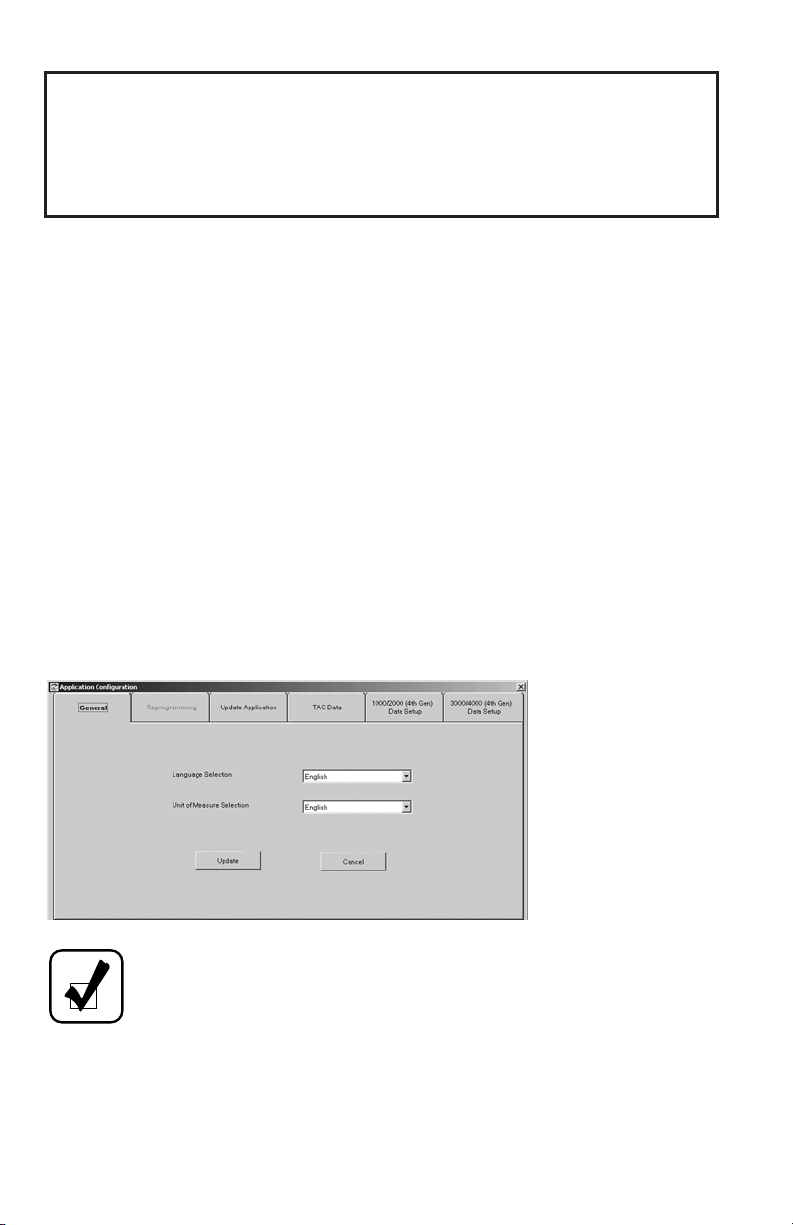
Tabs in the Application Configuration window are:
• General—the default tab
• Reprogramming
• Update Application
• TAC Data Collection
• 1000/2000 (4th Gen) Data Setup
• 3000/4000 (4th Gen) Data Setup
Access configuration items by clicking on the corresponding tab in the Application
Configuration window. An Allison logo displays next to the active tab’s title.
General Tab
From the General tab you can:
• Select a language
• Select either English or Metric units of measure.
Language Selection
1. Click on the down arrow in the Language field.
2. Click on a Language.
3. Click the UPDATE button—all text in Allison DOC™ For PC–Service Tool
is changed to the language selected.
Units of Measure Selection
1. Click on the down arrow in the Units of Measure field.
2. Click on either English or Metric.
3. Click the UPDATE button—all measurements in Allison DOC™ For PC–
Service Tool are changed to either English or Metric units.
Reprogramming Tab
TCM/ECU Reprogramming Authorization
You must obtain reprogramming authorization to reprogram TCM/ECU
information. Accessing the TCM/ECU reprogramming features of Allison DOC™
For PC–Service Tool requires an appropriate training certificate, a password, and the
Allison DOC™ For PC–Service Tool product serial number. Contact SPX
Corporation Kent-Moore Service Solutions (US and Canada: 1-866-621-2128,
International: 1-800-345-2233) for the necessary password. The product serial
number is on the installation CD-ROM jewel case.
25
Page 27

To enter Reprogramming authorization information:
1. Select the Options drop-down menu.
2. Select Application Configuration menu item.
3. Click the Reprogramming tab—the Product Authorization window displays.
4. Enter Password information as provided by SPX Corporation and the Allison
DOC™ For PC–Service Tool Product Serial Number.
5. Click the APPLY button. Since this is a one-time enabling process, once the
TCM/Reprogramming section has been authorized, the Reprogramming tabs
becomes disabled (grayed out).
Update Application Tab
Allison DOC™ For PC–Service Tool Updates
Allison DOC™ For PC–Service Tool updates are stored on Allison’s Service Tool
Update Server.
NOTE: To receive updates over the Internet, your PC or laptop must
be connected to a telephone line or to some other means of accessing
the Internet. A broadband Internet connection is highly
recommended.
The Update Application function allows you to:
• Determine if an update is available.
• Download the new version and update Allison DOC™ For PC–Service Tool.
• Download the new version to your hard drive and update Allison DOC™ For
PC–Service Tool at a later time.
Checking For An Allison DOC™ For PC–Service Tool Update
Allison DOC™ For PC–Service Tool checks the Update Server for the latest version
of the software. You must have an Internet connection to access the Update Server.
1. Click on the Options Menu.
2. Select the Application Configuration menu item.
3. Click on the Update Application tab—the Application Update window
displays.
4. Click on CHECK FOR UPDATE—Allison DOC™ For PC–Service Tool
accesses the Update Server by way of the Internet. If a newer version of
Allison DOC™ For PC–Service Tool than the one you are using is found on
the update server, the newer version can be applied to your current Allison
DOC™ For PC–Service Tool or downloaded to your hard drive. If a newer
version is not found on the server, Allison DOC™ For PC–Service Tool
checks your hard drive for a newer version.
26
Page 28
If an update is available, either from the server or your hard drive, the CHECK
FOR UPDATE button changes to APPLY UPDATE.
If your Allison DOC™ For PC–Service Tool is up-to-date, a message displays
indicating you do not need to update.
If the update server is not available and an update is not stored on your PC hard
drive, a message displays providing the reason for an update not being available.
Applying An Allison DOC™ For PC–Service Tool Update
Click the APPLY UPDATE button—the Update Processing window displays.
The latest version of Allison DOC™ For PC–Service Tool is loaded, either from the
update server or from your PC hard drive.
NOTE: If the tool is unable to penetrate the user’s Internet firewall,
click on the displayed URL and download the applicable update.
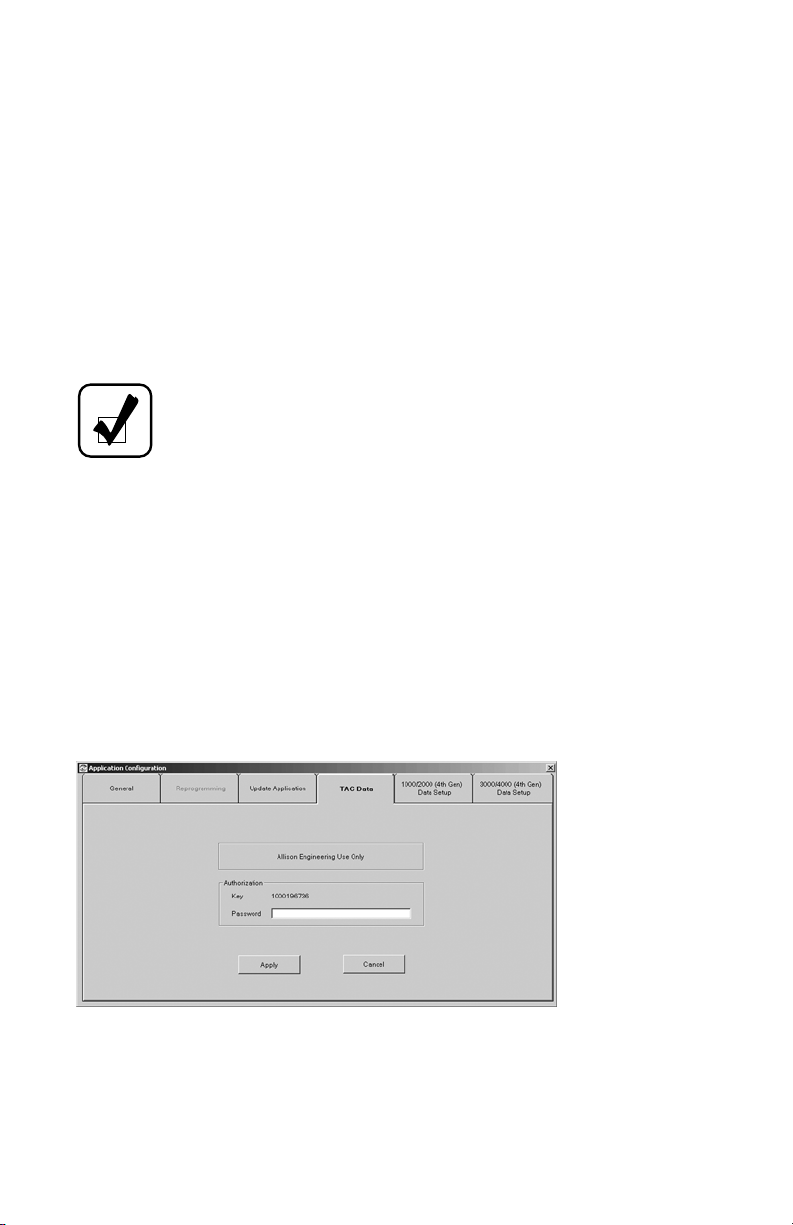
TAC Data Collection
This function shall only be used/enabled at the request of the Allison Transmission
Technical Assistance Center (TAC) to collect WTEC II/III transmission data. The
TAC Data Collection tab is only accessible after the TCM/ECU Reprogramming
section is enabled. If the TAC Data tab is disabled (grayed-out), either the user
hasn’t been authorized for the Reprogramming feature, or the TAC Data has already
been enabled.
Enabling TAC Data Collection
1. Click the TAC Data tab—the TAC Data authorization dialog box displays
with a key number.
2. After determining that you are required to use this feature in Allison DOC™,
an Allison TAC representative will contact you to enable this section based
upon the Authorization Key data.
3. Enter the password in the Password field.
27
Page 29
4. Click the APPLY button—TAC Data collection may now be accessed from
the Action Request menu.
NOTE: Unlike the Reprogramming section, the TAC Data Collection
requires re-authorization once the technician uses the limited number
of exercisable data collections. TAC determines the number of times
the technician can use this feature when the authorization password is
generated.
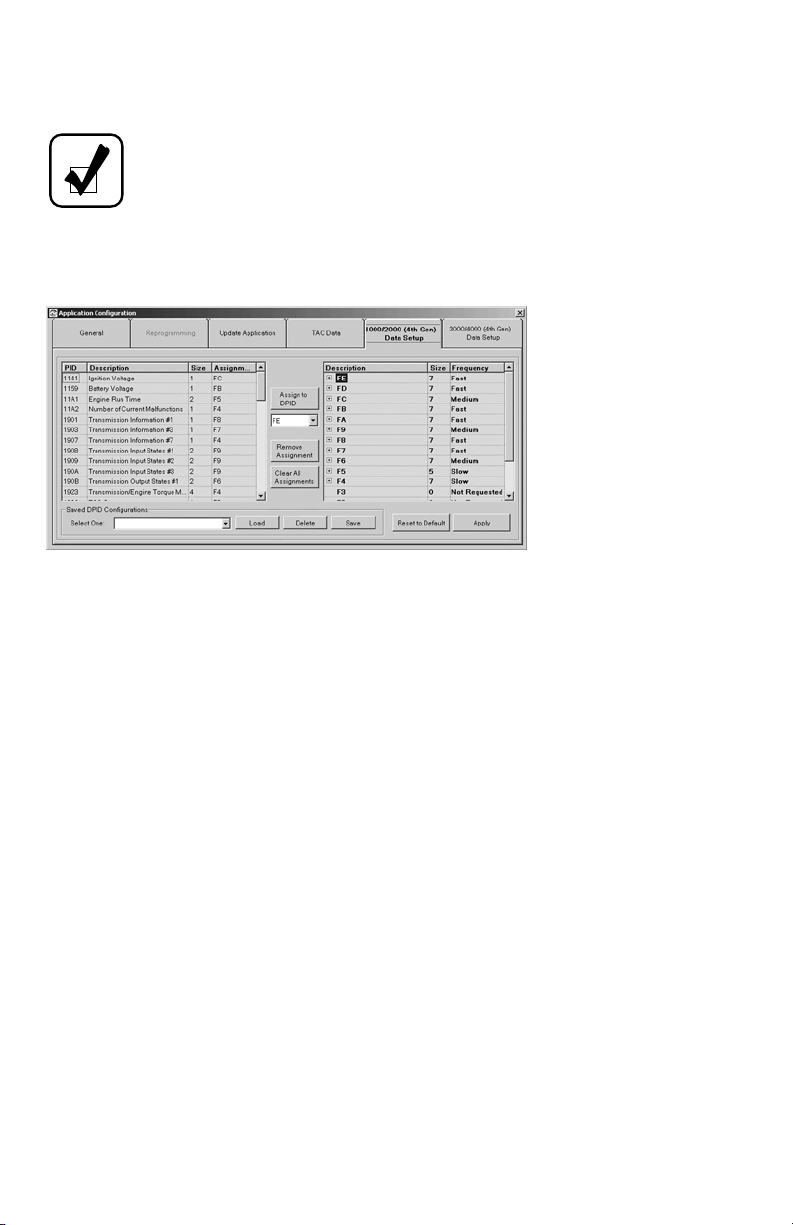
1000/2000 Setup and 3000/4000 Setup Tabs
The 1000/2000 and 3000/4000 (4th Gen) Data Setup tabs allow you to individually
select the transmission data parameters to be requested from an Allison 4th
Generation Controls system and, consequently, displayed on Allison DOC™. The
selected data is assigned to Data Packet Identifiers (DPIDs), which are identified by
an F (e.g. FE, F9, etc.). A configuration may be saved for future use. Limiting the
amount of data to request from a TCM greatly increases the rate of data refresh. In
other words, the fewer transmission data parameters you configure the tool to
request, the faster the TCM will be able to send those parameters to the tool. This is
particularly important when the user needs to closely monitor certain transmission
parameters at higher rates.
On all 4th Generation screens and reports, data that is not being requested by DPID
configuration is displayed as “Not Available.” In the graphics monitor, controls
associated with unavailable data are disabled. In the selection dialogs for the custom
data monitor, Excel export and strip chart parameters that are unavailable will not be
displayed for selection.
Anatomy of a DPID
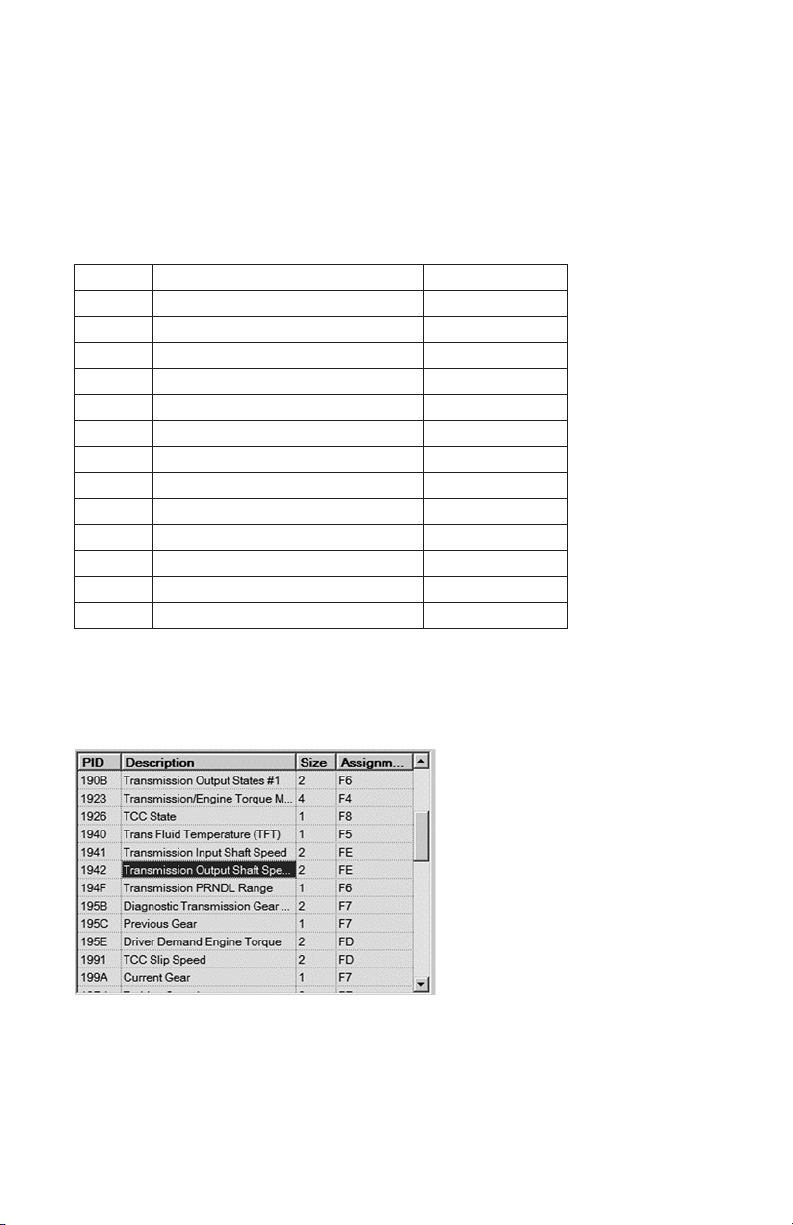
A DPID contains one or more Parameter Identifiers (PID). A PID identifies a
specific transmission data parameter. The PID description is the designated name of
the PID. The PID size indicates how many bytes the PID uses. A DPID can only
hold up to seven bytes of data. A two-character ID, starting with an F, identifies a
DPID. Fifteen DPIDs are available: FE, FD, FC, FB, FA, F9, F8, F7, F6, F5, F4, F3,
F2, F1, and F0.
28
Page 30
Required PID
Some PIDs are assigned by default to a DPID. The pre-assigned PIDs must always
be selected in order for certain Allison DOC™ features to work correctly. The
Allison DOC™ For PC–Service Tool allows the required PIDs to be reassigned
from their default DPID, but does not allow them to be unassigned. A message
displays if the required PIDs are not assigned to DPID. The following table lists the
required transmission data parameters (with their PID and size).
PID Description Size in Bytes
19D4 Turbine Speed
1941 Input Speed
1942 Output Speed
190B Transmission Input States #1
1909 Transmission Input States #2
190A Transmission Input States #3
3037 GPO Wire On/Off State
3036 GPI Wire On/Off State
190B Transmission Output States #1
3032 Transmission Output States #2
199A Current Gear
1A66 Gear Commanded
3038 Output Speed Acceleration
2
2
2
2
2
2
1
1
2
2
1
1
2
This feature contains the following sections:
Transmission Parameters List
A list of all selectable transmission parameters with relevant information:
• PID (Parameter Identifier)—a number that identifies the transmission
parameter
• Description—the actual designated name of the transmission parameter to
select
29
Page 31

• Size—the size in bytes of each parameter. The size is important to determine
the maximum number of transmission parameters that can be included in one
DPID.
• Assignment—indicates the current DPID assignment for the most recently
used configuration.
DPID Configuration Section
Allows users to select the DPID in which they will include
or remove transmission parameters. There are fifteen
DPIDs available. Users can also clear all DPID assignments .
NOTE: Each DPID can accept a maximum of 7 bytes of data. The
size of all transmission parameters assigned to a single DPID may not
exceed 7 bytes. In order to maximize the efficiency of this feature use
all 7 bytes in each DPID.
Current Configuration and Request Rate Setup
Displays the current DPID configuration, and allows users to set the request rate for
each DPID.
• Description—lists configured DPIDs. Each DPID can be expanded to display
the included PIDs.
• Size—indicates the number of bytes in each DPID and, when expanded,
displays the byte size of each PID. A DPID can contain no more than 7 bytes.
• Frequency—determines how often transmission data is reported. Fast reports
the transmission data every 25 milliseconds, Medium every 300 milliseconds,
and Slow every 1 second.
30
Page 32

NOTE: Regardless of the DPID frequency selected, the tool refreshes
the screen display 10 times per second.
The Description column contains Transmission Information #1,
Transmission Information #3, and Transmission Information #7 lines.
Each Transmission Information line represents a group of transmission
parameters. The transmission parameters in each Transmission
Information group are:
Transmission Information #1:
• Cruise Enabled
• Internal Mode Switch A
• Internal Mode Switch B
• Internal Mode Switch C
• Internal Mode Switch P
Transmission Information #3:
• Internal Mode Switch NS
• Pressure Switch Manifold 1
• Pressure Switch Manifold 2
• Pressure Switch Manifold 3
• Pressure Switch Manifold 4
• Shift Solenoid 1
• Shift Solenoid 2
• Shift Solenoid 3
Transmission Information #7:
• Normal Shift Pattern
• Cold Shift Pattern
• Trans Hot Mode
• Trail/Haul Shift Pattern
Action Buttons
Contains the following command buttons:
• Load—loads previously saved configurations.
• Delete—deletes previously saved configurations.
• Save—saves currently displayed configurations.
• Reset To Default—resets current configuration to default, which requests all
transmission parameters for selected 4th Generation transmission family.
• Apply—applies displayed configuration
31
Page 33

Setting up a New Data Configuration:
1. Select Options and Application Configuration from the main menu.
2. Click on the 1000/2000 (4th Gen) Setup tab, or the 3000/4000 (4th Gen)
Setup tab.
3. Click on the Clear All Assignments command button.
4. Choose a DPID from the DPID configuration combo box.
5. Select the PID from the list and click on Assign to DPID button.
6. Repeat step 5 until seven or fewer bytes are assigned to the DPID selected in
step 4.
7. Repeat steps 4 through 6 until all required transmission parameters are
selected.
8. For each DPID, select the frequency at which you want the TCM to report
values for the selected PIDs.
9. Click on the APPLY button.
10. Close the Application Configuration dialog box.
Loading a Saved Configuration:
1. Select Options and Application Configuration from the main menu.
2. Click on the 1000/2000 (4th Gen) Setup tab, or the 3000/4000 (4th Gen)
Setup tab.
3. Select one configuration from the Saved DPID Configuration drop-down list.
4. Click on the LOAD button.
5. Click on the APPLY button.
6. Close the Application Configuration dialog box.
Loading Default Configuration:
NOTE: The Service Tool automatically resets to default
configurations when Allison DOC™ is closed.
1. Select Options and Application Configuration from the main menu.
2. Click on the 1000/2000 (4th Gen) Setup tab, or the 3000/4000 (4th Gen)
Setup tab.
3. Click on the Reset to Default button.
4. Click on the APPLY button.
5. Close the Application Configuration dialog box.
32
Page 34

5.0 USING ALLISON DOC™
FOR PC–SERVICE TOOL
5–1. CONNECTING/DISCONNECTING
Connecting
NOTE: Allison DOC™ For PC–Service Tool supports only RP1210A
compliant devices.
The Connect/Disconnect window establishes the software connection between
Allison DOC™ For PC–Service Tool and the transmission controller through a PCto-controller translation device (data translator). For Allison DOC™ For PC–
Service Tool to read information from the transmission controller, both the vehicle
ignition and the PC-to-vehicle translator must be powered on. Upon successful
connection, the DTC and General Information window automatically displays. Any
logged Diagnostic Trouble Code information is displayed in that window.
To establish a connection between Allison DOC™ For PC–Service Tool and a
transmission controller:
• From the Warnings window of Allison DOC™ For PC–Service Tool, click
the button, select the F5–Connect button, or press the F5
key—The Connect/Disconnect window displays.
To have Allison DOC™ For PC–Service Tool automatically select the translation
device and communication protocol:
1. Click the SmartConnect check box.
2. Select a transmission Type from the Connect/Disconnect dialog box.
3. Click the button.
33
Page 35

4. Upon successful connection, the DTC and General Information window for
the selected transmission controller displays; for CEC1, the CEC1 Data
Monitor window displays. If a connection cannot be established the tool
displays the Connection Help window with specific instructions on how to
troubleshoot the connection.
To select a translator device and communication protocol manually:
1. Deselect SmartConnect.
2. Select transmission type.
3. Click the button—the Communications Adapter Setup dialog box
displays
4. Select the Translator Device and Protocol from the drop-down lists and Click
the button. Upon successful connection, the DTC and General
Information window for the selected transmission controller displays; for
CEC1, the CEC1 Data Monitor window displays.
5. If the translator device and protocol does not appear on the list, make sure
that the driver software has been installed on your PC and click the
button—the Advanced Communications Adapter Setup
window displays. This dialog box displays all adapters as described in the
RP1210 files.
34
Page 36

6. Select the adapter vendor from the drop-down Vendor list. If the translator
device you are using is not in the Vendor list, verify that the driver software
has been installed on your PC.
7. Select Vendor, Protocol, and Device from the drop-down list. Use the
following table as a reference for Vendor, Protocol, and Device menus.
VENDOR PROTOCOL DEVICE
DPA4 USB DR121032
SPX J1850 vpw BnB1850 J1850 B&B J1850 Adapter, COMx
J1939/GMLAN
J1708
DPA4, USB
CEC1 Adapter
MagiKey® DX121032
Nexiq USB-Link NXULNK32
Softing CANcard2 SOFTRP32 J1939 Softing CANCard Transmit on Channel x
Noregon DLA PCSRP32
B&B J1708D15
Allison Shaw Box Allison Shaw Box, COMx
Detroit Diesel Detroit Diesel, COMx
Dana Dana, COMx
Navistar Navistar, COMx
Kent Moore Kent Moore, COMx
J1939 PDM J1939
J1708 PDM J1708
J1939/GMLAN N/A
J1708 USB-Link J1708
J1850 USB-Link Allison J1850
J1939
J1708
NSIRP32 J1708
Noregon/Vansco Data Link Adapter
BB Electronics J1708D15 Adapter, COMx
8. Click OK. Upon successful connection, the DTC and General Information
window for the selected transmission controller displays; for CEC1 the CEC1
Data Monitor window displays.
35
Page 37

Disconnecting
NOTE: Disconnecting breaks the Allison DOC™ For PC–Service
Tool to controller connection; but does not close the Allison DOC™
For PC–Service Tool software.
To break the connection between Allison DOC™ For PC–Service Tool and
transmission controller, click on the F4-Disconnect button, or press the F4 key.
Quick Solutions for Unsuccessful Connections
• Verify you are selecting the appropriate Transmission Type.
• Make sure you are meeting all platform requirements (Operating System,
RAM capacity, Hard Drive space, etc).
• Recycle power to the translator device. Disconnect the translator device from
both the PC and the diagnostic connector and then reconnect the translator
device to both the PC and the diagnostic connector.
• Close or Exit some “quick launch” applications (shown as icons on the
taskbar), located at the lower right side of the desktop screen.
• Make sure all the cable connections (PC, Interface Device, and Vehicle
Diagnostic Connector) are correct and firm.
• Verify that you are using the proper adapter’s drive (refer to the “What is the
Driver Version of my Translator Device?” and “How Do I Get the Latest
Adapter’s Driver Version?” questions from
www.allisontransmission.com/Service/Diagnostic Tools/Support/FAQs).
• If you are using a J1939, J1708/J1587, or J1850 to RS232 (Serial
Port/COM1/COM2) translator device, make sure that the serial port is not
being used by any other application such as HotSync Manager, etc.
• Close the application, disconnect the PC to translation device cable, reboot
the PC, and reconnect the cable
• Check www.allisontransmission.com/Service/Diagnostic Tools/Support/
FAQs for more information.
• Make sure your laptop’s Power Scheme (accessible from Start/Control
Panel/Power Options) is set to Portable/Laptop.
NOTE: For more information on installation and troubleshooting
procedures when using the Dearborn DPA4 USB adapter, please refer
to the “DPA4 USB Translator Device (J-47943) Quick Reference
Guide” document available at
www.allisontransmission.com/Service/Electronic Tools/ Translator
Devices.
36
Page 38

5–2. VIEWING DIAGNOSTIC DATA
Diagnostic data can be displayed in different formats. Depending upon the
transmission controller, the service tool displays data differently. The various
formats appear at the bottom of the screen as selectable buttons or tabs. Access a
format by clicking on the format name or typing the first letter of the format name.
The controller selected during the Connect process determines if a format is
available for that controller and what data is displayed. Tool tips are available to
display succinct description of each screen.
5–3. DTC AND GENERAL INFORMATION
This is the default screen and it serves as the “Home” screen where Diagnostic
Trouble Codes (DTCs) and general/basic transmission information is displayed.
This screen contains DTC information (with links to troubleshooting manuals),
TCM Information, basic Transmission Data (customizable), and Shift Inhibits. From
this screen the user can also clear codes, access Performance Complaints, Failure
Records, and DTC Test.
The Allison 4th Generation Control system Diagnostic Trouble Codes (DTCs)
consist of the letter “P”, “U”, or “C” followed by four numbers. A “P” indicates a
transmission internal problem, a “U” indicates a problem in a vehicle system or the
transmission-to-vehicle interface, and the “C” codes are reserved for retarder
request sensor problems.
DTC and General Information View
37
Page 39

DTC Grid
Displays Diagnostic Trouble Code information:
Parameter Description
DTC
Active Y/N (Yes/No) indicates if the Trouble Code is currently active. When a
Historic A “Y” indicates a diagnostic code has been stored to TCM memory as a
Check Trans A “Y” indicates that the DTC is significant enough to turn on the CHECK
Failure Record A “Y” indicates that a failure record has been generated and stored for
Description Describes the DTC. “Please call 1-800-252-5283 for assistance” is
The Allison
and four numbers, diagnostic trouble code.
code is logged by the TCM and the condition causing the code still exists,
that code is said to be active; otherwise the trouble code is inactive.
valid fault. Different types of DTC exist. Each DTC type has different
requirements to be stored as Historic DTC.
TRANS light. Not every DTC activates the CHECK TRANS light.
the DTC.
displayed in the Description field for any code that is unknown to the
service tool.
th
4
Generation Control system uses a five character, a letter
Viewing Troubleshooting Manual Information for a Trouble Code
In the DTC and general Information window of Allison DOC™ For PC–Service
Tool, double-click the DTC number or DTC Description to display DTC
troubleshooting steps. Adobe Acrobat® Reader displays the Troubleshooting
Manual page appropriate for the DTC.
38
Page 40

Clearing DTC Information
1. In the DTC and General Information window, click the Clear DTC
Information button.
2. A window appears displaying the message, “Clear DTC Information Request
Completed Successfully!”
3. Click the OK button.
All Trouble Codes and associated information are cleared from the DTC and
General Information window. Shift Inhibits are also clear with this command button.
If the cause of the Trouble Code is not corrected, the Trouble Code may
immediately reappear.
NOTE: To clear all Trouble Codes, the vehicle must be stopped and in
Neutral. If these conditions are not met, a message “Request Denied.
Output Speed not less than maximum allowable value.” or “Neutral not
attained.” displays.
Performance Complaint
Use the Performance Complaint function when no DTCs are present to troubleshoot
a transmission performance symptom.
To use Performance Complaint:
1. Click on the Performance Complaints button on the DTC and General
Information—The Performance Complaint window displays.
2. Select the appropriate Vehicle Complaint from the drop-down list.
3. Click OK—the Troubleshooting Manual page relevant to the selected Vehicle
Complain displays.
Failure Records
A Failure Record stores operating condition information at the time a problem was
detected and the DTC logged. Each DTC generates a Failure Record.
A Failure Record is a very valuable source of information for the technician as it can
be used to determine the operating conditions that were present when a failure
39
Page 41

occurred. Failure Records are only updated (refreshed) the first time the Diagnostic
Test (a test that the TCM runs to determine if a failure condition exists) fails during
each ignition cycle.
You can view the last five DTC failure records by double clicking on a DTC row in
the Failure Record Available column of the DTC grid or by selecting the Failure
Record item from the Diagnostic main menu. If more than five DTCs are stored, the
Failure Records are replaced on a “First-in-First out” basis.
Allison DOC™ For PC–Service Tool automatically saves the last 20 Failure
Records “seen” by the tool. These files are stored in the following location as text
files: ...\Allison Transmission\Allison DOC For PC–Service Tool\Failure Records.
Displaying Failure Records
1. In the DTC and General Information window, double click on the “Y” in the
Failure Record field—the Failure Record window displays.
2. In the DTC and General Information window, click on the Failure Record
button—the Failure Record window displays.
40
Page 42

DTC Test
The TCM performs a series of “diagnostic tests” to determine if a failure has
occurred. Diagnostic Tests are performed when specific transmission operating
conditions occur. The DTC Test Screen displays all application-supported DTCs and
indicates the failure status of the Diagnostic Test since clear code, and since powerup. The following table describes each state:
DTC Test
Columns Possible Values Description
Since Clear Code Test Failed/Not
Performed
Test Passed Sometime after the last clear code event the
Since Power Up Test Failed/Not
Performed
Test Passed The TCM ran the Diagnostic Test with no
* For example, the transmission hasn’t reached the necessary operating conditions to run the
Diagnostic Test yet.
The DTC Test screen allows the technician to determine the status of a DTC test. For
example, after fixing the problem causing a DTC, the technician must know the
status of a DTC test in order to make sure that the failure condition was effectively
corrected.
Indicates that the Diagnostic Test related to
the DTC has failed at least once since the
DTCs were cleared, or the Diagnostic Test
hasn’t been performed by the TCM *.
TCM ran the Diagnostic Test with no fault
found.
Indicates that the Diagnostic Test related to
the DTC has failed within this ignition cycle,
or the Diagnostic Test hasn’t been performed
by the TCM *.
fault found.
41
Page 43

Displaying the DTC Test Screen:
1. Click on the DTC Test button on the DTC and General Information screen—
the DTC Test Screen displays.
TCM Information Grid
Displays general information that describes the Transmission Control Module.
Transmission Information Grid
Displays basic transmission data parameters. The user can configure (i.e. select
different transmission data parameters) this grid by clicking on the Select Data to
Display button.
Shift Inhibits Grid
Displays all the shift inhibits that are currently active or have been active since last
clear code.
42
Page 44

5–4. DATA MONITOR
The Data Monitor allows you to view controller information in a table format. The
data display is dynamic and displays real-time data as it occurs. This screen is
divided into three major grids: Diagnostic Data (left side), Input/Output Functions
(upper right side), and Shift Inhibits (lower right side).
Diagnostic Data
• Diagnostic Data—A brief description of the diagnostic data being measured.
• Value—The value of the associated diagnostic data.
• Units—units of measure for the value.
Input/Output Functions
• Wire—the wire circuit number assigned to the programmed function. If
“Databus” is displayed, the function is not assigned to a wire but is being
controlled (turned On/Off) via the communication databus.
• State (Wire)—displays the state of the wire (On/Off) or if the wire is
Disabled.
• Function Name—indicates if the function is and input or output and lists the
function name.
• State (Function)—displays the state of the function (On/Off) or if the
function is Disabled.
NOTE: Grayed rows indicate I/O functions and wires that cannot be
reprogrammed.
43
Page 45

Shift Inhibits
• Inhibit—displays the condition(s) that is or was causing the shift inhibit.
• Current Active—indicates whether a particular condition is currently
inhibiting shifts.
• History—indicates that, since the last DTC clear, a particular condition has
inhibited shifts.
5–5. CUSTOM DATA MONITOR
You may select the information to be displayed in the Custom Data Monitor window
by adding or removing transmission parameters to the display. Each control system
has a unique list of transmission parameters. For 4th Generation controllers, if
default data configuration is not used, only the parameters configured under the Data
Configuration feature are displayed.
Transmission parameters are added or removed in the Custom Data Monitor data
selection window. The Custom Data Monitor window is the same as the Data
Monitor window, except that only the selected data is displayed.
To Select Custom Data Monitor Transmission Parameters:
1. Select the Custom Data Monitor tab —the Custom Data Monitor data
selection window displays.
2. Select the desired transmission parameter(s) from the left-hand column.
3. Click the button or double click the selection—the selected
transmission parameters appear in the right-hand column
4. Click the OK button—the selected transmission parameters appear in the
Custom Data Monitor window.
44
Page 46

To Remove Custom Data Monitor Transmission Parameters:
1. Select the Custom Data Monitor tab—the Custom Data Monitor data
selection window displays.
2. Select the desired transmission parameters from the right-hand column.
3. Click the button—the selected transmission parameters are
restored to the left-hand column.
4. Click the OK button—the deleted transmission parameters no longer appear
in the Custom Data Monitor window and the Custom Data Monitor data
selection window closes.
Preconfigured Data List
You can save a list of transmission parameters for display in the Custom Data
Monitor by using the Preconfigured Data List feature.
1. Display the Custom Data Monitor data selection window.
2. Select the transmission parameters (from the left to the right panel).
3. Click on the Save button. The Data List Name dialog box displays
4. Type a unique name for the saved data list and click OK.
To use the saved data list:
1. Display the Custom Data Monitor data selection window.
2. Click on the Select One drop-down arrow in the Preconfigured Data Lists
section:
3. Select a list name from the menu.
4. Click either Load, to load the list, or Delete, to delete the list.
5–6. GRAPHICS MONITOR
The Graphics Monitor displays diagnostic data using gauges, thermometers,
indicator lights, text boxes, and a scrollable I/O function data display.
45
Page 47

Displaying the Graphics Monitor
To display the Graphics Monitor:
1. Select the Graphics Monitor tab —the Graphics Monitor window displays.
NOTE: A gauge can be expanded to a full-screen display by doubleclicking on the gauge. Return the display to normal by pressing the
ESC key or double clicking in the expanded display.
5–7. STRIP CHART
The Strip Chart is a graph that tracks, over time, changes in selected data as the
changes occur. Up to fifteen transmission parameters may be selected. Each control
system has a unique list of selectable parameters. The data traces start at zero on the
X-axis and, depending on the selected data, the Y-axis.
The data-against-time data stream is continuous regardless of the Strip Chart mode
selected. If default data configuration is not used, only the data configured under the
Data Configuration feature is available for display in the Strip Chart.
Displaying the Strip Chart
1. Select the Strip Chart tab—the Select the Data to Graph on the Strip Chart
window displays.
46
Page 48

2. Select up to fifteen transmission parameters from the left-hand column.
3. Choose a color for the trace of the data selected or allow the default color.
NOTE: Contrasting colors are easier to see on the strip chart.
4. Click OK.
The selected transmission parameters appear in the Strip Chart window.
Saving A Strip Chart Configuration
You can save a list of transmission parameters for display in the Strip Chart by using
Saved Strip Charts.
1. Display the Select the Data to Graph on the Strip Chart window.
2. Select the transmission parameters to chart and their color.
3. Click the Save button – the Strip Chart Name dialog box displays
4. Type a unique name for the Strip Chart data selection, and click OK
47
Page 49

To Load or Delete a Saved Strip Chart Configuration:
1. Display the Select the Data to Graph on the Strip Chart window.
2. Click on the Select One drop-down arrow in Saved Strip Charts section:
3. Highlight a list name.
4. Click either Load, to load the Saved Strip Chart, or Delete, to delete the
Saved Strip Chart.
NOTE: (Allison 4th Generation Controls ONLY) To obtain higher
plotting resolution and better refreshing rates, the user can configure
the application to only request specific transmission parameters from
the TCM. Refer to Setting Up A New Data Configuration in
section 4–1 for more information.
Data Trace Identification
The selected data is assigned a color on the graph. The name of the data and its
corresponding color is displayed in a box on the Strip Chart display.
X-axis Scaling
The passage of time in seconds is indicated on the X-axis, horizontal bottom of the
graph. As time passes, data lines on the graph move to the right. The Strip Chart
displays about 10 seconds of data at a time. If playing back recorded data, the VCR
Control window displays the Total File Time and the Current File Time, in minutes.
48
Page 50

Total File Time is the total length of the recording. Current File Time is the time
elapsed since you started the playback.
Y-axis Scaling
The Y-axis, vertical left side of the Strip Chart, displays a range of values based
upon the data selected for display. In most cases, the Y-axis begins at zero. If you
select data having different types of measurements such as input rpm and engine
cooling temperature, a divisor, preceded by a slash (/), displays next to the data that
requires calculation to determine the correct value. For example: input speed and
engine cooling temperature. RPM is displayed on the Y-axis, from 0 to 4000. To
determine the engine cooling temperature, divide the value of the engine cooling
temperature trace by 15.7. An easier method is to use the Strip Chart Cursor mode,
which calculates the adjustment and displays the correct value. Entering a value in
the Max Y-Axis field changes the maximum value displayed on the Y-axis.
Strip Chart Modes
Several data display modes are selectable from the tool bar in the upper left portion
of the Strip Chart window. These modes, or commands, allow you to control the data
display on the Strip Chart. To change to a particular mode, simply click the desired
mode icon. When a mode other than Plot is selected, the data display at that time is
frozen; but the data-against-time stream continues in the background. When Plot is
re-selected, the data-against-time stream is re-entered at the time Plot was reselected.
Control Modes
The control modes are:
Plot
Plot is the default Strip Chart mode, where data lines move from left to right across
the Strip Chart graph.
Pause
Pauses the plot. Data continues to be collected, but not displayed in the graph. Click
the PLOT button to resume normal plotting. While in Pause mode, the mouse cursor
can be used to scroll the X-axis left or right.
Zoom Out All Axes
Each click on the Zoom Out All Axes button increases the values displayed to the
left of the graph, which increases the area displayed and provides a less detailed
display than the standard plot mode. Click the PLOT button to resume normal
plotting.
49
Page 51

Zoom In All Axes
Each click on the Zoom In All Axes button decreases the values displayed to the left
of the graph, which decreases the area displayed and provides a more detailed
display than the standard plot mode. Click the PLOT button to resume normal
plotting.
Zoom Box
Zoom box allows you to zoom in on an area within the zoom box. Once the area to
zoom is selected, the plot is paused. Click the PLOT button to resume normal
plotting.
Cursor
Cursor mode allows you to place a vertical line at any point in the graph. The “Y”
vertical values of the selected trace are displayed in a floating window.
Print
Sends the Strip Chart data display to your printer.
5–8. CALIBRATION INFORMATION
Current TCM calibration information (i.e. calibration settings) can be displayed
using the Calibration Information tab.
To Display Current Calibration Information:
1. Select Calibration Information tab—the Calibration Information window for
the transmission type displays.
50
Page 52

The TCM Calibration Information displays data in five sections:
• Customer Modifiable Constant (CMC)—displays current
values/states/thresholds of those parameters to which the transmission would
react, and that the user—with the proper authorization—could change or
modify.
• Shift Inhibits—indicates the state of current and history shift inhibits (refer to
Data Monitor section)
• Calibration—displays static data describing both software and hardware
installation
• SEM/LRTP and Autodetect Information—displays information related to
Shift Energy Management (SEM), Low Range Torque Protection (LRTP),
and Autodetect information.
• Input/Output Functions and wire information—displays I/O functions and
wire states (refer to Data Monitor section).
5–9. DATA BUS TRAFFIC VIEW
The real-time data flowing on the vehicle’s databus (J1939, J1708, J1850, GMLAN,
or proprietary CEC1 protocol) is viewable in the Data Bus Traffic Viewer. The Data
Bus Traffic Viewer presents the data link stream data in raw format and, when
available, J1939 TCM Received/Broadcasted messages in engineering units.
NOTE: Data Bus Traffic View files are not captured or contained in
regular Allison DOC™ snapshots.
In the Engineering Units display, which is only available when connected via J1939,
all J1939 TCM-relevant data (messages sent and received by the TCM) are
displayed. The user can monitor the data exchange between the transmission
controller and other control modules by selecting specific SAE J1939
Messages/Parameters.
The data bus viewer can be used with or without Allison DOC™ For PC–Service
Tool being in a connected state. When the service tool is connected (the tool is
receiving/requesting Messages from/to the TCM), the tool is said to be in ACTIVE
mode. Conversely, if the Data Bus Viewer is used without having the service tool
communicating with the TCM, the tool is said to be in PASSIVE mode (the tool is
physically connected to the vehicle/TCM, but it is only “listening” to all the
messages going through the selected data link without requesting data from the
TCM).
The following table contains all the data communication protocols that, depending
upon its availability at the diagnostic connector, could be used to connect Allison
51
Page 53

DOC™ For PC–Service Tool and to monitor data with the Data Bus Viewer in either
active or passive mode.
WTEC II,
WTEC III and
CEC2
J1708 J1939 or J1850 Proprietary
J1939 or J1708
1K/2K
th
(Pre-4
Gen) CEC
J1939, J1850,
J1708
Proprietary
Allison DOC™
Data Bus
Data Bus
Viewer
Messages
Engineering
Units
Allison 4th Gen-
eration
J1939 or
GMLAN
J1939, GMLAN,
J1708
J1939, N/A J1939, N/A J1939, N/A N/A
The Data Bus Viewer has the following sections:
Data Bus Messages
This section displays the numeric representation of every message that is going
through the selected communication link. The data is displayed in decimal (base 10)
or hexadecimal (base 16) number systems. The decimal numeric system is the
defaulted option, while the hexadecimal system can be activated with the
Hexadecimal check box.
Engineering Units
Engineering Units (only available when connected via J1939) includes every SAE
J1939 Message and Parameter supported by the Allison Transmission controller.
This information consists of all Messages and Parameters the transmission control
52
Page 54

module broadcasts and receives via J1939. Refer to the Allison Transmission
DATALINK COMMUNICATIONS technical document, available on the Allison
Transmission Extranet, for specific information for each of the displayed J1939
Messages/Parameters.
• Parameter—displays SAE J1939 Messages the TCM can receive/send. Each
SAE J1939 Message can be expanded to display the corresponding SAE
J1939 parameter.
TOOL TIP: Each SAE J1939 Message is displayed in its acronym
form. In order to see the complete/long description of a Message,
place the cursor (do not click) over its acronym, and a tool tip is
displayed.
Since each Message can be broadcasted from different Source Addresses (SA), the
tool displays every detected SA that can initiate a given Message. Consequently, if
the user is interested in finding a particular J1939 parameter (for example, Percent
Load at Current Speed), the first step would be to find out which J1939 Message
contains that parameter (EEC2: Electronic Engine Controller # 2), and second to see
if Databus Viewer has detected that message in the databus. If detected, the Databus
Viewer will display the SA of the controller sending that particular message. At this
point, the user can expand that message to display the parameter of interest.
• Value—the value/state of the parameter.
• Units—the units of measure used for the value.
Source Addresses
Describes all Source Addresses (SA) that can be included/displayed in the Data Bus
Viewer.
MID/SA
(J1708 or J1850 only) Message Identifier/Source Addresses code—the message
type/source/destination.
Component ID
(J1708 or J1850 only) Manufacturer of a controller.
53
Page 55

Model
(J1708 or J1850 only) A controller’s model number.
Software ID
(J1708 or J1850 only) Identifies the software used by the controller.
Command Buttons:
• Pause—pauses and continues the Data Bus Message display.
• Clear—clears all Data Bus Message data.
• Save—displays the File Save dialog box and automatically saves the last 2
minutes of data displayed on the Data Bus Viewer, under the entered file
name or under a default file named, defined by date and time. If the Save
Data Continuously check box is selected, the tool will continuously save
data (as opposed to the last 2 minutes of data) until the user clicks on the
Save button.
WARNING: Having Save Data Continuously checked causes the
application to continuously save all the data bus traffic into the PC,
which could be detrimental for your computer. When this function is
enabled / checked, be aware that your hard drive could be rapidly
filled with Data Bus Viewer log files. It is recommended to only use
this function when strictly necessary.
• To find the recorded file, use Windows Explorer and navigate to the
directory on which Allison DOC™ For PC–Service Tool is located
(usually defaulted to …\Program Files\Allison Transmission\Allison
DOC For PC Service Tool), then open the Saved DataBusViewer Files
folder. The raw data can be viewed with NotePad® or WordPad™. Also,
the user can playback these file using the Data Bus Viewer feature in the
service tool.
• When receiving Data Bus Viewer files from the field, the user needs to
save these files in the same directory mentioned above (…\Program
Files\Allison Transmission\Allison DOC For PC Service Tool\Saved
DataBusViewer Files), in order to have them listed on the Data Bus
Viewer Session list.
• Close—closes the Data Bus Viewer window.
NOTE: The Data Bus Viewer logs are not captured in the regular
Snapshot function.
Displaying the Data Bus Viewer
There are two different ways to display the Data Bus Viewer:
54
Page 56

Passive Mode
When Allison DOC™ For PC–Service Tool is in Passive mode, the Data Bus Viewer
can be accessed as follows:
1. Select Data Bus Viewer from the Transmission Connect/Disconnect dialog
box—the Data Bus Viewer Configuration window displays
2. Select “Connect to the data bus with a new connection.” option and click
OK—the Communication Adapter Setup window displays.
3. Refer to Section 5–1 for selecting a Vendor, Protocol, and Device for a
particular translator device
4. Click OK— the Data Bus Viewer is displayed. This function captures all the
data being sent through the communication link.
Active Mode
When Allison DOC™ For PC–Service Tool is in Active mode, the Data Bus Viewer
can be accessed as follows:
1. Select Data Bus Viewer from the File menu—the Data Bus Viewer
Configuration window displays.
2. Select “Connect to data bus, reusing DOC™ For PC’s connection.” and
click OK—the Data Bus Viewer screen displays.
55
Page 57

NOTE: The “Connect to the data bus with a new connection.” option
should only be selected if the user wants to use the Data Bus Viewer
(monitor the data bus) with a different physical translator device.
Playing Back Data Bus Viewer Files
The following steps describe how to playback the files saved with the Data Bus
Viewer:
1. Select Data Bus Viewer from the File menu, or the Transmission
Connect/Disconnect dialog box—the Data Bus Viewer Configuration
window displays.
.
2. Select “Playback Data Bus Viewer Files” and click OK. The Data Bus
Viewer window displays.
3. Click on the “Select One” pull-down menu, and select the file you want to
playback.
56
Page 58

NOTE: If you cannot see the file you want to playback, make sure the
file is saved in the following directory: \Program Files\Allison
Transmission\Allison DOC For PC Service Tool\Saved
DataBusViewer Files.
4. Once the file is highlighted/selected, click on Load, and the playback starts.
5–10. ACTION REQUESTS
Clutch Test Enabled
The Clutch Test Enabled allows the user to command any forward range by
selecting it from a floating window.
NOTE: For 7-speed calibrations only, use the following table as a
reference to compensate for the display differences between the shift
selector and the service tool.
Gear Selected
Gear Commanded
Allison DOC™ For PC
Diagnostic Trouble Codes
Shift Selector 1234567
Current Gear
Previous Gear
Clutch Test
L123456
To Enable the Clutch Test Function:
1. Select the Action Request drop-down menu.
2. Click on the Clutch Test Enabled menu item—the Clutch Test window
displays.
3. Select Drive (for the 1000/2000 Product Families) or the highest range (for
the 3000/4000 Product Families) from the shift selector. At this point 1st
range is attained and highlighted on the Clutch Test floating window.
4. Click on the range you want the transmission to attain.
57
Page 59

The current range attained is highlighted in the Clutch Test window. A message
displays if Allison DOC™ For PC–Service Tool cannot conduct a clutch test.
NOTE: The transmission will maintain the selected range until the
TCM determines that the operational conditions constitute a risk to
the transmission hardware. At this point the TCM will command an
up or downshift to eliminate that condition of risk. The service tool
command (i.e. clutch test) cannot force the transmission to stay in a
specific range under these circumstances.
Solenoid Test
The Solenoid Test provides a means of troubleshooting complaints involving the
transmission solenoids. The Solenoid Test does not test the electrical condition of a
solenoid (solenoid internal resistance, circuit continuity, etc.). Instead, the Solenoid
Test determines the TCM’s ability to command signals to a particular solenoid.
Consequently, depending on the particular test, the user may need to use a voltmeter
to complement the purpose of this feature.
In order to use the solenoid test, the engine speed must be zero. The TCM will not
honor the solenoid test command from the service tool if the engine speed is greater
than zero.
To Enable the Solenoid Test Function:
1. Select the Action Request drop-down menu.
2. Click on the Solenoid Test menu item—the Solenoid Test dialog box
displays.
1000 and 2000 Product Families Solenoid Test
3000 and 4000 Product Families Solenoid Test
3. Select a solenoid to test.
58
Page 60

The solenoid state changes from Off to On or On to Off. A successful test is
indicated by the changed solenoid state.
A message displays if Allison DOC™ For PC–Service Tool is unable to turn on/off a
particular solenoid, no response back (acknowledgement) is received from the TCM,
or if the TCM replied with a negative response.
Reset Auto-detect
Autodetect is TCM logic that allows the TCM to automatically detect the presence
of certain transmission components or input signals. The Reset Autodetect function
forces the TCM to re-start the autodetect logic. Resetting autodetect with the service
tool causes the TCM to reinitialize the detection of Throttle data source, Engine
Coolant Temperature data source, Oil Level Sensor feature, Retarder feature, and
TransID configuration.
To activate the Reset Autodetect function:
1. Select the Action Request drop-down menu.
2. Click the Reset Auto-Detect menu item—the Reset Autodetect Successful
window displays
3. Click OK.
Autodetect will run again after the next normal TCM power-down (i.e. an ignition
cycle is required to complete autodetect reset).
Reset Auto-detect Retarder
Autodetect Retarder is available only for the 3000/4000 Product Family. Autodetect
Retarder automatically detects the presence of a transmission retarder. Reset
Autodetect Retarder commands the TCM to re-initialize the Retarder auto-detection.
To reset Autodetect Retarder:
1. Display the Action Request Menu.
2. Click on the Reset Autodetect Retarder menu item—A message displays
indicating that the Autodetect Retarder feature has been reset.
3. Click OK.
Autodetect will run again after the next normal TCM power-down (i.e. an ignition
cycle is required to complete autodetect reset).
Reset Fast Adaptive
The TCM continuously compares each up/down shift against a corresponding
“ideal” up/down shift pattern. Two algorithms are used to reach this ideal pattern for
each shift: Fast Adaptive and Slow Adaptive. If the TCM detects that the difference
between a real shift and the ideal pattern is significant, the Fast Adaptive logic is
59
Page 61

used. This allows the TCM to use drastic changes to the shift parameters in order to
quickly converge the patterns. Once the two patterns meet a convergence criterion,
the TCM switches to slow adaptive, which allows the TCM to fine-tune the up/down
shifts.
The Reset To Fast Adaptive forces the TCM to use the Fast Adaptive algorithm.
To Reset To Fast Adaptive:
1. Select the Action Request drop-down menu.
2. Click on the Reset Fast Adaptive menu item—the message “The adaptive
shift parameters have been successfully reset to Fast Adapt.” displays
indicating that the TCM has been reset to use fast adaptive parameters.
3. Click OK.
Reset Adaptive Shift Parameters
Reset Adaptive Shift Parameters replaces all adaptive clutch control parameters with
the original factory calibration values and invokes fast adaptive algorithms to adapt
clutch control parameters. Reset Adaptive Shift Parameters applies to all shifts or to
specific up/downshifts.
NOTE:
• The adaptive values displayed in this section are refreshed only
at connection time and after resetting adaptive information. In
order to read current adaptive information, disconnect the
service tool, reconnect it, and then read the values.
• The Garage Shift Adaptive Parameters (Garage tab) resets only
the N-2, R-2, and 2-R adaptive parameters. Consequently, if a
given situation requires resetting all garage shifts, reset the
following adaptive parameters: Garage, R-1, D-R, N-R, and
N-1 (tabs).
To Reset Adaptive Shift Parameters:
1. Select the Action Request drop-down menu.
2. Click on the Reset Adaptive Shift Parameters menu item—a Caution window
displays.
60
Page 62

3. Read the text in the Caution window and acknowledge it by clicking on the
YES button – the Reset Adaptive Shift Parameters dialog box displays
4. Select the appropriate tab and click on the Reset “x” Shift Adaptive
Parameters button, where “x” is the selected shift.
The Reset Fast Adapt window contains up to eighteen tabs; one for each up/down
shift (in addition to Garage and All shifts) that can be reset to factory values.
The following information displays in the Reset Adaptive Shift Parameters window:
Item Name
The name of the adaptive shift or clutch control parameter.
Value
The numerical value of the parameter.
Units
Unit Of Measure for the parameter value.
The adaptive shift parameters are reset when you click on the RESET SHIFT
ADAPTIVE PARAMETERS button—the message “The adaptive clutch control
parameters have been successfully reset to its factory calibration values and to Fast
Adapt.” displays in the Rest Shift Adaptive Parameters Successful window.
NOTE: Reset Adaptive Shift Parameters does not reset the autodetect
information. If required, use Reset Autodetect Information.
61
Page 63

Reset Full/Closed Throttle Calibration (TPS only)
These functions re-establish the limits of a mechanical throttle position sensor (TPS)
in the TCM calibration. These features allow the user to reset—in the calibration—
the minimum (closed throttle) and maximum (full throttle) values for the
mechanical TPS. This action request is only applicable to TPS and does not have
any effect when the throttle information is communicated via J 1939 or by any other
means different from a throttle position sensor.
To reset open throttle calibration:
1. Select the Action Request drop-down menu.
2. Select Reset Full Throttle Calibration (TPS only)—the Throttle Action
window displays.
3. Fully depress the throttle.
4. Click OK—The Reset Full Throttle Calibration Successful window displays.
To reset closed throttle calibration:
1. Select the Action Request drop-down menu.
2. Select Reset Closed Throttle Calibration (TPS only)—the Throttle Action
window displays.
3. Click OK—The Reset Closed Throttle Calibration Successful window
displays.
62
Page 64

Reset SEM Auto-Select
Shift Energy Management (SEM) is a special feature that allows the transmission to
perform smoother shifts. Depending upon the transmission calibration
configuration, the service tool will (or will not) allow the user to reset SEM Auto
Select. For more information on SEM/LRTP, refer to SEM/LRTP definitions in
Section 13–2.
To reset the TCM to automatically select the presence of the SEM calibration
information:
1. Display the Action Request menu.
2. Click the Reset SEM Autodetect menu item.
3. The message “Reset SEM Autodetect information was successful.” displays.
4. Click the OK button.
Engineering Calculations
After the user enters specific vehicle information, the Engineering Calculations
function allows the service tool to calculate and display Converter Speed Ratio,
Vehicle Speed, and Vehicle Acceleration in g’s. The engineering calculation values
are displayed in the Diagnostic Data grid of the Data Monitor and Custom Data
Monitor screens, and are a selectable data parameter for the Strip Chart. The
Engineering Calculation values are lost when Allison DOC™ For PC–Service Tool
is disconnected from the transmission.
63
Page 65

Engineering Calculation values are derived from the following formulas:
NOTE: Enter Tire Revolutions in:
• Revolutions/Kilometer when using Metric units of measure
• Revolutions/Mile when using English units of measure.
• N/V = (Tire Revolutions x Axel Ratio)/60
• Converter Speed Ratio = Turbine Speed/Input Speed
• Vehicle Speed = (Output Shaft Speed)/(N/V)
• Acceleration (g’s) = Output Speed Acceleration/(N/V*Divisor).
NOTE: Output Speed Acceleration is a value obtained from the TCM
and the divisor is:
• Metric Divisor = 35.28
• English Divisor =21.96
Enter the required data and press the OK button. The calculated data is added to the
transmission information available for display in the Data Monitor, Custom Data
Monitor, and Strip Chart windows.
Transmission Fault Lamp Test
The Transmission Fault Lamp Test tests whether or not the TCM is sending the
signal (both analog and digital) to illuminate the Transmission Fault Lamp indicator
on the dashboard.
To initiate a Fault Lamp test:
1. Display the Action Request menu.
2. Click on the Transmission Fault Lamp Test menu item—the Transmission
Fault Lamp Test window displays.
64
Page 66

If the lamp is illuminated and the word “ON” is displayed, the Transmission Fault
Lamp is on. If the lamp is not illuminated and the word “OFF” is displayed, the
Transmission Fault Lamp is off.
Change the status of the fault lamp by clicking the ON or OFF button.
Reverse Warning Lamp Test
The Reverse Warning Lamp Test tests whether or not the TCM is sending the signal
to illuminate the Reverse Warning signal.
To Initiate a Reverse Warning Test:
1. Display the Action Request menu.
2. Click on the Reverse Warning Lamp Test menu item—the Reverse Warning
Test window displays.
If the lamp is illuminated and the word “ON” is displayed the Reverse Warning is
activated. If the lamp is not illuminated and the word “OFF” is displayed the
Reverse Warning is not activated.
Change the status of the fault lamp by clicking on the ON or OFF button.
5–11. RECORDING SNAPSHOTS
Snapshots are log files containing all transmission data recorded by Allison DOC™
For PC–Service Tool. Snapshot recording is started either by a DTC event (DTC
driven), or triggered by the user (Trigger button driven). With the default settings,
the tool will automatically trigger the recording of a snapshot when any DTC
becomes active. Snapshot log files have the following characteristics:
• Contain all data the Allison DOC™ For PC–Service Tool requests.
Regardless of the screens selected/used during the recording session,
the snapshot captures all data the TCM reports to the Allison DOC™ For
PC–Service Tool.
65
Page 67

• Snapshots can be played back only with the Allison DOC™ For PC–Service
Tool.
• Allison DOC™ For PC–Service Tool automatically saves the snapshot files
as .ad files.
• Users can playback snapshots by double-clicking on the .ad files as long as
Allison DOC™ is installed on the PC.
• Snapshot files are saved at Program Files\Allison Transmission\Allison
DOC™ For PC–Service Tool\Logs.
• The length of snapshot files is limited by the amount of available RAM in the
PC and the available storage space on the disk drive.
To Record an Event Driven Snapshot:
1. Select the Snapshot drop-down menu.
2. Select Record.
3. Select Recording Options—the Record Options window displays.
4. Select one of the following trigger conditions to start recording data:
• When this Trouble Code appears, remember this session. You must enter a
Trouble Code or select one from the drop-down list. If the Trouble Code
entered occurs, the session is recorded.
• When any Trouble Code appears, remember this session. (Default option)
The session is recorded if any Trouble Code occurs.
• Remember this session. A Trigger Point gets inserted immediately after
you click OK.
• Do not remember this session. Allows starting a recording session when
commanded by the user (i.e. via F5-TRIGGER RECORDING).
5. Click OK.
Triggering a Snapshot Recording (and/or Setting a Bookmark)
The F5–TRIGGER RECORDING button allows you to quickly start to record a
snapshot without having to specify any condition. After F5–TRIGGER
66
Page 68

RECORDING is clicked, the Bookmark function is enabled. From this point you
can bookmark a position for future reference in the TCM data recording. Bookmarks
are assigned a sequential number in the order in which they were inserted into the
playback file. In addition to their bookmark number, bookmarks are associated with
a time relative to the length of the recording.
To Insert a Bookmark While Recording Data:
• Press the F5 keyboard key
or
• Click on the F5–TRIGGER RECORDING button.
NOTE: The F5–TRIGGER RECORDING button text changes to
display the F5–BOOKMARK #.
NOTE: A snapshot captures data from up to thirty minutes before the
trigger point until the recording session is stopped. If the trigger point
is set in less than thirty minutes after the time the Allison DOC™ For
PC–Service Tool was connected, the snapshot data will include data
from the connection time until the recording session is stopped.
5–12. STOPPING/SAVING SNAPSHOT SESSIONS
Once started recording a snapshot, there are different ways to stop recording data,
and saving it to the PC.
Saving a Recording by Selecting STOP RECORDING
1. Click the F6–Stop Recording button or press the F6 key. The Save As dialog
box appears:
67
Page 69

2. Enter a name for the snapshot without the extension file. For example,
vehicle123 (do not type vehicle123.zip, or vehicle123.ad, or any other
extension file). The application will automatically assign the file extension. In
this case, the .ad extension file.
3. Click SAVE.
NOTE: To save a recording in a folder other than the Logs folder,
navigate to the desired folder before clicking the SAVE button.
Saving a Recording if the Ignition is Turned Off
If no data bus traffic is detected for 6 seconds, Allison DOC™ For PC–Service Tool
assumes the vehicle ignition has been turned off, recording is halted, and the
Ignition Off window displays.
• Click NO to not save the recording.
• Click YES to save the recording—the Save As window displays.
Saving a Recording if Allison DOC™ For PC–Service Tool Gets Closed
If you close the Allison DOC™ For PC–Service Tool during a recording session the
following window displays:
• Click YES to save the recording—the Save As window displays.
• Click CANCEL to not save the snapshot file.
5–13. PLAYING BACK SNAPSHOTS
Snapshot playback provides data to any of the diagnostic views. Snapshot files are
played back in real-time, data being displayed as it occurred during the recording
session.
68
Page 70

To Playback a Snapshot:
1. Select the Snapshot drop-down menu.
2. Select Playback.
3. Select Open Playback File.
NOTE: If Allison DOC™ For PC–Service Tool is connected, and the
user tries to playback a snapshot, the live connection is broken and the
Open File window displays.
4. Navigate to the appropriate directory.
5. Select the playback file to be played.
6. Click OK—the Trouble Code window and the Playback VCR control box
display.
VCR Control box
NOTE: The VCR control box moves to the lower-right corner of the
screen when the playback file has completed loading and the VCR
controls can be used.
Playback Indicators and VCR Controls are:
• Meter bar—the percentage of the playback file played.
• Total File Time—the length of the playback file in minutes and seconds.
• Current File Time—the elapsed time in minutes and seconds since the
beginning of the file, based on the current location of the meter bar. Using
your mouse pointer, you may click and drag the meter bar to any point within
the file and play the file from that point. Other controls include:
Open file—displays the Open File window.
69
Page 71

Rewind to beginning of file.
Play.
Stop.
Play at four times normal speed.
Loop—continuous play.
Jump to trigger—displays data starting at the trigger condition selected when
the data was recorded.
Jump to Bookmark—displays the bookmark window.
Email Playback as Attachment—displays the Compose E-mail window.
NOTE: A playback file that is not loaded can also be e-mailed. Click on
the e-mail menu item in the snapshot menu.
70
Page 72

If you have not configured your PC for sending Email, click the
CONFIGURATION button—The Email Configuration window displays.
.
Contact your E-mail Administrator for the correct values to enter for your
configuration.
5–14. EXPORTING PLAYBACK DATA
Data contained within a playback file can be exported in a comma-delimited format
to allow for inclusion of that data into an Excel or other spreadsheet. The playback
data can be incorporated into a spreadsheet on the host PC or emailed. Only the
Allison 4th Generation Controls snapshots can be exported.
71
Page 73

To Export Playback File Data:
1. Display the Snapshot menu.
2. Click on Export – the Open Playback file dialog box displays.
3. Select a playback file to export—a custom data monitor dialog box displays.
4. Select the data to be exported.
5. Click the OK button—data is exported as follows:
• The export file name is the same as the playback file.
• The export file type (extension) is .csv.
• The first record of the file contains the names of the exported data with
the units of measure (Metric or English) for each data item contained in
parentheses immediately after the data item name, separated by commas.
• Subsequent records contain the timestamp followed by the current or last
recorded value of the parameters chosen for export.
• If a maximum 65,530 records are exported, the export file is closed and a
new export file is started with a sequential number, starting with 1, added
to the file name.
NOTE: The export file (.csv) will be saved in the same directory as the
snapshot file.
72
Page 74

6.0 REPROGRAMMING TCM
6–1. REPROGRAMMING TCM
NOTE: You must have obtained and entered the proper authorization
code to access this feature and reprogram the TCM/ECU.
TCM Reprogramming allows for modifying Customer Modifiable Constants
(CMCs) and Input/Output (I/O) information. Reprogramming is defined as
modifying CMCs and I/Os in an existing calibration. Reflashing or Recalibration is
defined as loading a new application program (firmware) and/or calibration into a
TCM. Before the Reprogramming TCM feature can be used, a password must be
obtained from the tool provider (usually SPX Kent Moore) and entered into the
Allison DOC™ For PC–Service Tool. For specific requirements to enable the
Reprogramming section in Allison DOC™, refer to section 4-1.
Enabling/Authorizing the Reprogramming Section in Allison DOC™
For PC–Service Tool
1. Select Options from the main menu bar.
2. Select Application Configuration—the Application Configuration window
displays.
3. Click on the Reprogramming Tab.
4. Enter the reprogramming Password.
73
Page 75

5. Enter the Product Serial Number.
6. Click Apply—the Reprogram tab grays-out to indicate that the
Reprogramming function has been enabled or authorized.
Accessing the Reprogramming Function
1. Select Reprogram from the main menu bar.
NOTE:
• You must be connected to a transmission in order to display the
Reprogramming screen. If you are playing back snapshots or
using a DEMO file, the reprogramming menu is disabled.
• If you are connected to a transmission and the Reprogramming
menu option is disabled (grayed-out), it means that you have
not enabled or authorized this section in the tool. Refer to
section 4-1 for more information on how to enable this section
in the tool.
a. If the TCM/ECU password was changed from its defaulted values (i.e.
eight zeros “00000000” or “Allison_”) the TCM/ECU Password dialog
box displays.
b. Enter the TCM password
c. Click the OK button—
74
Page 76

2. The Reprogram TCM window displays.
The Reprogram TCM window is divided in different sections:
• Input/Output Information—displays modifiable I/O information
• Customer Modifiable Constants—displays modifiable CMCs
• Active Package—displays current I/O active package
• Password—displays current TCM/ECU password
Reprogram TCM—command button used to reprogram the TCM after all the
modifications are entered are:
• Close—command button used to close the Reprogram TCM window.
• Print—command button used to print a report that contains current
Calibration, I/O, and CMC information.
• Save—saves current configuration. This includes current I/O, CMC, Active
Package and TCM Password selection. Enter a unique name for the saved
configuration. This function is particularly useful when reprogramming
multiple vehicles with the exact same calibration.
• Select One—allows the user to select a previously saved configuration from
the drop-down menu.
• Delete—deletes a configuration selected from the Select One drop-down
menu.
• Load—loads a configuration from the Select One drop-down menu.
75
Page 77

Reprogramming Input/Output Configuration
Allison 4th Generation Controls allows disabling or enabling wires independently of
their assigned functions.
Wire/Databus—displays the wire number assigned to a specific function. Possible
values are:
Wire #—a 3-digit number describing the TCM wire #.
Databus—the function is available on the databus.
State—indicates if a wire is enabled or disabled in the calibration. State is user
modifiable.
Name—describes the I/O function name.
State—indicates if a function is enabled or disabled in the calibration. State is user
modifiable.
To Reprogram Wire Status and Function Status:
1. Check (enable) or uncheck (disable) the State checkbox for the Wire # and/or
Function as needed.
NOTE:
• If the user disables a wire that is assigned to an enabled
function, the function will only remain enabled if its signal can
be received via communication link. Otherwise, both the wire
and function will be disabled.
• If the user disables a function, the calibration will cease using
that function regardless of the signals (wire or Databus) being
received for that particular function.
Reprogramming Customer Modifiable Constants
CMCs are ordered in groups. Each group contains the calibration constants that can
be modified. Please refer to CMC definitions (Section 13–1) for more information
on each CMC.
CMC information includes:
• Customer Modifiable Constants—a description of the CMC.
• Value—the current assigned value of the CMC. The CMC value can be
modified.
NOTE: Each CMC has a maximum and a minimum limit to which the
value can be changed. This range is displayed in a tool tip. In order to
see that range, place the cursor (do not click) on the Value to modify.
76
Page 78

To reprogram CMC values:
1. Click the value to be changed.
2. Enter or select a new value as necessary.
Reprogramming Package Assignments
Each calibration group contains several I/O packages. The current Active Package
number is displayed near the center of the Reprogramming window. Available
alternate package numbers are displayed immediately below the current package.
To reprogram the Current Vocation Package number:
1. Click on the pull-down menu.
2. Select the new I/O package.
Reprogramming TCM Password
Each TCM has a password that is defaulted to eight zeros “00000000” or
“Allison_”, depending on the TCM software. If the user changes the TCM password,
the TCM will require the user to enter that new password next time the
reprogramming section is invoked.
To reprogram the TCM Password:
• Enter 8 numeric characters in the Password input box.
Initiating TCM Reprogramming
TCM reprogramming can be initiated after all applicable entries (I/Os, CMCs, etc.)
are made in the TCM Reprogramming window.
To initiate TCM Reprogramming:
1. Click the Reprogram TCM button.
2. A warning window displays
77
Page 79

3. If you want to continue, click YES.
4. The tool starts reprogramming the wires. A red status bar is displayed at the
bottom of the TCM Reprogramming window.
5. A window is displayed indicating the wires were successfully reprogrammed.
6. Click OK.
7. The tool continues the process of reprogramming the CMCs. A red status bar
is displayed at the bottom of the TCM Reprogramming window.
NOTE: If the service tool receives an error message from the TCM (for
example a CMC value is out-of-range), a window (describing the
problem) will be displayed, and the service tool re-displays the
reprogramming screen.
8. A window displays indicating the CMCs were successfully reprogrammed.
9. Click OK.
Reprogramming Status for WTEC II, WTEC III, and CEC2
During the reprogramming function, a status line displays at the bottom of the
reprogramming window.
78
Page 80

NOTE: The reprogramming of WTEC II, WTEC III, and CEC2 might
take several minutes. Please be patient and make sure ignition and
power is always provided during this process.
The following status messages are displayed for a WTEC II ECU:
• Calculating calibration length and starting address.
• Entering programming mode.
• Reading calibration data.
• Writing CMCs.
• Calculating calibration checksums.
• Writing calibration checksums.
• Exiting programming mode.
• Reinitializing ECU.
The following status messages are displayed for a WTEC III or CEC2 ECU:
• Calculating calibration length.
• Entering programming mode.
• Reading calibration data.
• Saving old calibration data.
• Calculating CMC checksum.
• Erasing calibration data.
• Writing calibration data.
• Exiting programming mode.
• Sending re-initialize auto-detect action request.
79
Page 81

7.0 REPORTS
The Allison DOC™ For PC–Service Tool Report function allows you to generate
TCM/Transmission information reports. There are two types of reports: The
Diagnostic Reports and the TRANSHEALTH™ Reports. The Diagnostic Reports
data can come from saved Diagnostic Reports, snapshots, or from a real-time
connection. Conversely, the TRANSHEALTH™ Report data comes from saved
TRANSHEALTH™ Reports or from real-time connections. The following table
lists the report sections available for the various transmission control systems.
1000 and 2000 Product
Families Controls Reports
Allison 4th Generation
Controls Reports
Auto Detect Information —
Shift Inhibits Shift Inhibits
I/O Wires and Functions I/O Wires
Customer Modifiable
Constants
Diagnostic Data Diagnostic Data
Failure Records CMC Information (includes
Adapt Shifts DTC Information
DTC Information Failure Records
DTC Test DTC Test
Adaptive Information Adaptive Shifts
Shift Solenoids —
— TRANSHEALTH™ Report
(Pre-Allison 4
Generation Controls)
—
SEM)
th
WTEC II/III and CEC2
Controls Reports
Auto Detect Information
Shift Inhibits
I/O Wires
—
Diagnostic Data
CMC Information
DTC Information
—
—
—
—
TRANSHEALTH™ Report
(excluding CEC2)
7–1. DIAGNOSTIC REPORTS
The Diagnostic Reports contain the transmission information displayed in Allison
DOC™ For PC–Service Tool. The user can select the data to save or print in these
reports.
80
Page 82

Saving Diagnostic Reports
1. Connect the service tool to a transmission control module or playback a
snapshot.
2. Select Diagnostic Reports from the Reports menu. The Report Sections
window displays.
3. Type a Customer Name and any relevant comments you might want to add as
references.
4. Select any or all of the available Report Sections to save.
5. Click the SAVE button—the Report Name Dialog Box displays.
6. Type a unique name for the report.
7. Click the OK button—the report is saved under the name typed in the Report
Name dialog box.
NOTE: Reports are saved at C:\Program Files\Allison
Transmission\Allison DOC™ For PC–Service Tool \Reports.
You do not have to exit the Report Sections window to display a report
on the screen.
Displaying Saved Diagnostic Reports
1. Connect the service tool to a transmission control module or playback a
snapshot.
81
Page 83

2. Select Diagnostic Reports from the Reports menu. The Report Sections
window displays.
3. 3. Select a report from the drop-down list of Saved Reports.
4. 4. Click the LOAD button—the selected report displays in WordPad® or
Notepad®.
Diagnostic Report Examples
The reports may be printed or saved as a text file. Saved reports can be displayed on
the screen. All reports are formatted with calibration information at the
beginning of the report.
The following is an example of a screen-displayed Autodetect Information report.
82
Page 84

7–2. TRANSHEALTH™ REPORT
TRANSHEALTH™ is a special feature that describes the transmission condition at
the time of service. Please refer to the Allison Transmission Extranet for Service
Policy Letter #21 and SIL 1-TR-06 information associated with this feature.
The TRANSHEALTH™ feature is available for the following control systems only:
• WTEC II
• WTEC III
th
• 1000/2000 Product Families (Pre-Allison 4
The TRANSHEALTH™ feature contains two functions depending on the users
Reprogramming capabilities:
• TRANSHEALTH™ Monitor—available for all users; allows users to
determine if the current condition of the transmission is OK (green), Not OK
(Red), or simply undetermined (Gray).
• TRANSHEALTH™ Report—available for users who have Reprogramming
enabled in their tools; allows users to obtain the same information provided
by the TRANSHEALTH™ Monitor, but in a more detailed manner (i.e.
clutch by clutch condition, as opposed to a general/over-all condition). It also
allows users to add service performed, service recommendations/comments,
and local promotions information to TRANSHEALTH™ reports they can
save, print or load from the tool.
Generation Controls)
83
Page 85

NOTE: A saved TRANSHEALTH™ Report cannot be loaded while
the service tool is connected to a transmission control system, or while
playing back a snapshot.
Accessing the TRANSHEALTH™ Feature
1. Select the TRANSHEALTH™ Report option from the Reports drop-down
menu, or click the F2-TRANSHEALTH™ button, or press the F2 key.
2. If the user does not have the Reprogramming section enabled, the
TRANSHEALTH™ Monitor is initiated and the following window is
displayed:
3. Answer all questions (required) displayed in the Service Checklist, and click
OK. The TRANSHEALTH™ Monitor is displayed with the current
transmission condition
84
Page 86

4. If the user has Reprogramming enabled, the tool prompts the user to select
the TRANSHEALTH™ Monitor or TRANSHEALTH™ Report.
85
Page 87

5. Select TRANSHEALTH™ Reports. The following window appears, and the
TRANSHEALTH™ General tab is displayed.
NOTE: The first time this feature is accessed, your will have to type in
most of the information displayed in the General tab. This initial
information is saved for subsequent uses of this feature. The tool
automatically populates the Date and Tool S/N.
6. Select the Vehicle/Transmission tab.
7. Enter vehicle and transmission specific information. The tool will read and
auto-populate some of the required information.
86
Page 88

8. Select the Service tab.
9. Click the checkboxes (required) to answer the service questions. Enter
(optional) any service performed, service recommendations/comments, and
local promotions information.
10. Click the Preview tab to display the TRANSHEALTH™ report.
87
Page 89

TRANSHEALTH™ Report Screen Buttons
• Load—loads and displays a saved reports.
• Delete—deletes a displayed report from the save listing.
• Save—saves a new report.
• Print—prints a displayed report.
• Close—exits the TRANSHEALTH™ feature, DOES NOT save a displayed
report.
Loading Saved TRANSHEALTH™ Reports
To load a saved report, Allison DOC™ For PC–Service Tool must not be connected
to a transmission or playing back a snapshot. This feature is only available for users
with Reprogramming enabled.
1. Select the TRANSHEALTH™ Report option from the Reports drop-down
menu or click the F2-TRANSHEALTH™ button, or press the F2 key. The
TRANSHEALTH™ dialog box is displayed
2. Select the saved TRANSHEALTH™ report from the Select One drop-down
menu.
3. Click on the Load button.
4. The saved TRANSHEALTH™ report is displayed.
88
Page 90

Saving TRANSHEALTH™ Reports
To save a TRANSHEALTH™ Report:
1. Load the saved report to the TRANSHEALTH™ Report screen.
2. Click the Save button—the application automatically assigns the filename as
TransHealth_[timestamp]_[S/N]. dat, where [S/N] is the ECU/TCM serial
number, and [timestamp] is the current time, in YYYYMMDD_hhmmss
format. The filename can be changed. The application saves the report to
[installation directory]\Reports\TransHealth\[filename].
3. When a report is saved, the application automatically creates a Summary
Report. The Summary Report is saved in the following directory [installation
directory]\Reports\TransHealth\Summary Report.csv.
The Summary report contains all the data from saved TRANSHEALTH™ reports
and can be opened with a spreadsheet application such a Microsoft Excel®. When a
TRANSHEALTH™ report is saved, the application appends an entry (a row) to the
spreadsheet. The data in each row of the spreadsheet is formatted as follows:
Timestamp, File Name, TCM/ECU Serial Number, C1, C2, C3, C4, C5, and C6. The
timestamp is in the “YYYY/MM/DD hh:mm:ss” format. Colors are one of the
following strings, as appropriate: “Red”, “Green”, “Gray”, or “Not Displayed”.
Printing TRANSHEALTH™ Reports
To print a TRANSHEALTH™ saved report:
1. Load the saved report to the TRANSHEALTH™ Report screen.
2. Click the Print button—the report is sent to the system printer.
To print a TRANSHEALTH™ new report: Click the Print button—the report is sent
to the system printer.
Closing the TRANSHEALTH™ Feature
Click the Close button—clicking the Close button exits the TRANSHEALTH™
Report feature. Closing TRANSHEALTH™ with a report displayed DOES NOT
save the report.
7–3. PRINTING SCREENS
The Print Screen function of Allison DOC™ For PC–Service Tool allows you to
print the screen being displayed.
To print a screen:
1. Select Print Screen from the Main Menu. The Allison DOC™ For PC–
Service Tool screen being displayed prints at the default printer.
89
Page 91

7–4. EXITING ALLISON DOC™ FOR PC–SERVICE TOOL
There are two ways to exit Allison DOC™ For PC–Service Tool:
• Click the EXIT button in the top right corner of the Allison DOC™ For PC–
Service Tool window.
• Select the File drop-down menu and select Exit—the Allison DOC™ For
PC–Service Tool program closes.
90
Page 92

8.0 WTEC II/III, CEC2,
AND CEC1 CONTROL SYSTEMS
The WTEC II/III, CEC2, and CEC1 Control Systems section describes Allison
DOC™ For PC–Service Tool features and functions that apply to only the WTEC
II/III, CEC2, and CEC1 Control System previous to Allison 4th Generation Controls.
WTEC II/III and CEC2 Diagnostic Trouble Codes
A Trouble Code is a pair of two-digit codes, primary and secondary, that indicates a
problem in the transmission. The primary code indicates the type of problem and the
secondary code more closely defines the fault. A Diagnostic Trouble code is often
referred to as a “Trouble Code”, “a DTC”, or “a Code”.
WTEC II/III and CEC2 DTC and General Info View
Trouble Code
The DTC related to the information being displayed, “Please call 1-800-252-5283
for assistance.” is displayed in the Description field for any code that is unknown to
the controller.
91
Page 93

Active
Yes or No indicates if the Trouble Code is active or not. When a code is logged by
the ECU and the condition causing the code still exists, that code is said to be active;
otherwise the trouble code is inactive.
Ignition Cycles
The number of times the engine ignition has been turned on since the problem first
occurred.
Events
The number of times the transmission experienced the same problem indicated by
the Trouble Code since the last time codes were cleared from the ECU.
Description
Describes the Diagnostic Trouble Code and Fault Code.
Clearing Active Codes
1. In the Trouble Code window, click the CLEAR ACTIVE CODES button—a
window appears displaying the message “Clear Active Codes Request
Completed Successfully”.
2. Click the OK button.
Clearing Inactive Codes
1. In the of Allison DOC™ For PC–Service Tool Trouble Code window, click
the button.
2. A window appears displaying the message, “Clear Inactive Codes Request
Completed Successfully!”
3. Click the OK button.
Most inactive Trouble Codes and associated information are cleared from the
Allison DOC™ For PC–Service Tool window, leaving only active Trouble Codes.
92
Page 94

WTEC II/III and CEC2 Diagnostic Data Monitor
The WTEC II/III and CEC2 Data Monitor display data in three sections:
• Diagnostic Data
• Input and Output Wires/Functions
• Shift Inhibits.
Diagnostic Data
• Diagnostic Data—A brief description of the diagnostic data being measured.
• Value—The value of the associated diagnostic data.
Input and Output Wires/Functions
• Wire #—The wire circuit number of the programmed function.
• Inverted—Yes/No.
• Enabled—Yes/No.
• State—On/Off.
NOTE: Double click in the wire data area to display the Input/Output
Functions section of the appropriate Troubleshooting Manual.
93
Page 95

Shift Inhibits
• Shift Inhibit Factor—A brief description of the Shift Inhibit Factor being
measured.
• Value—The value of the associated Shift Inhibit Factor.
CEC1 Diagnostic Data Monitor
For CEC1, the Diagnostic Data Monitor and the Graphic Data Monitor are
combined.
WTEC II/III and CEC2 Custom Data Monitor
You may select the information to be displayed in the Custom Data Monitor window
by adding or removing data types to the display.
Data types are added or removed in the Custom Data Monitor data selection
window. The Custom Data Monitor window is the same as the Data Monitor
window, except that only the selected data is displayed.
WTEC II/III and CEC2 Graphics Monitor
The Graphics Monitor displays diagnostic data using gauges, thermometers,
indicator lights, text boxes, and a scrollable I/O Wire/Function data display.
Displaying the Graphics Monitor
To display the Graphics Monitor, Click the Graphics Monitor button.
94
Page 96

WTEC II/III Graphics Monitor
NOTE: A gauge or thermometer can be expanded to a full-screen
display by double-clicking on the gauge or thermometer. Return the
display to normal by pressing the ESC key.
ECU Calibration Information
To display current ECU and Calibration information, select the Calibration
Information button.
95
Page 97

WTEC II/III and CEC2 ECU Calibration Information
WTEC II/III and CEC2 Clutch Test
Enabling Clutch Tests allows clutch pressure testing, stall testing, and other
diagnostic procedures. With Clutch Test enabled, you can use the shift selector to
command reverse, neutral, and any available forward range. Once a range is
commanded, the transmission can be operated in that range, but no shifts will be
commanded unless output speed is less than about 57 rpm. Automatic shifts into and
out of lockup are commanded according to normal calibration parameters.
To enable or disable Clutch Tests:
1. Select the Action Request drop-down menu.
2. Select Clutch Test Enabled—the Request Completed window displays.
3. Click OK.
4. Select the desired range with the shift selector.
When enabled, a check mark appears next to this item in the Action Request menu.
96
Page 98

WTEC II/III Reset Fast Adaptive
The Fast Adaptive Mode allows quicker convergence to a smooth shift condition.
WTEC Adaptive Controls look at current shifts, compares them to a model, and then
adjusts accordingly to reach the model’s optimum shift characteristics. Fast
Adaptive forces the ECU to adjust more quickly than the slow, gradual adjustment
procedures that makes minor changes after a shift has converged.
To reset Fast Adaptive:
1. Select the Action Request drop-down menu.
2. Click the Reset Fast Adaptive menu item—the Reset Fast Adaptive
Successful window displays.
3. Click OK.
WTEC II/III Reset Unadapted Shifts
This action request commands the ECU to replace all adaptive clutch control
parameters in memory with the factory calibration values. At the same time, the
command of this function causes the ECU to:
• Use fast adaptive algorithms to adapt clutch control parameters.
• Reset all Autodetect parameters
To reset Unadapted Shifts:
1. Select the Action Request drop-down menu.
2. Select Reset Unadapted Shifts—the Caution window displays.
3. Click YES, disconnect Allison DOC™ For PC–Service Tool and recycle
ignition power.
WTEC II/III and CEC2 Reset Throttle Calibration
Resetting throttle calibration commands the ECU to reset the throttle position sensor
calibration. Reset throttle calibration if the throttle sensor experienced over-travel or
under-travel outside of normal operational limits and within failure limits. This
action request has no effect on the throttle position sensor, if the ECU receives
throttle information over the J1939 or J1708/J1587 communication link.
97
Page 99

To reset Throttle Calibration for WTEC II/III:
1. Select the Action Request drop-down menu.
2. Select Reset Throttle Calibration—the Reset Throttle Calibration Successful
window displays.
3. Click OK.
WTEC II/III TAC Data Collection
TAC Data collection creates a file with TCM/Transmission information for the
Service Engineering group to interpret. Do not to enable or activate TAC Data
Collection unless requested by an Allison Transmission representative. When
enabled, this function can be used for a limited number of times.
NOTE: SPX Kent-Moore does not have the capability to enable this the
TAC Data Collection function in the Allison DOC™ For PC–Service
Tool. This feature can only be enabled/authorized by the person/party
asking the technician to use this function.
To initiate TAC Data collection:
1. Display the Action Request menu.
2. Click the TAC Data Collection menu item—the TAC Data Collection dialog
box displays.
NOTE: The VIN will display if the VIN has been received from the
database. A message displays if an invalid data format is entered.
3. Click the OK button. The message “TAC data successfully collected.”
displays when TAC data is collected.
98
Page 100

TAC Data File Use
TAC data is extracted in a comma-delineated format into the C:\Program
Files\Allison Transmission\Allison DOC For PC - Service Tool\TAC Data Logs
folder. The extracted data filename is named as transmission serial
number_mmddyyyy_hhmmss.vr, where mmddyyyy corresponds to the current month,
day, year and hhmmss corresponds to the current hour, minutes, and seconds. This
file can be attached to an e-mail to Allison Transmission representatives for their
review.
Valid Data Field Formats
• Vehicle Number—17 alphanumeric characters
• Transmission Serial Number—10 digits [0 to 9]
• Fleet Number—one to 55 printable characters
• Distributor / Dealer—one to 55 printable characters
• Location—one to 55 printable characters
• Customer Name—one to 55 printable characters
• Miles—one to six digits
• Transmission Model—one to 55 printable characters
99
 Loading...