

Page 1

Calibration Guide
Agilent Technologies
ESG Vector Signal Generator
This guide applies to signal generator models and associ ated serial number prefixes listed below.
Depending on your firmware revision, signal generator operation may vary from descriptions in this guide.
E4438C: US4146
Part N umber: E4400-90509
Printed in USA
March 2002
© Copyright 2001, 2002 Agilent Technologies, Inc.
Page 2

Notice
The material contained in this document is provided “as is”, and is subject to being changed, without notice,
in future editions.
Further, to the maximum extent permitted by applicable law, Agilent disclaims all warranties, either express
or implied with rega rd to this m anual and to any of the Agilent products to which it perta ins, including but
not limited to the implied warranties of merchantability and fitness for a particular purpose. Agilent shall
not be liable for errors or for incidental or co nseq ue nti a l damages in connect i on with the furni shi ng, use, or
performance of this document or any of the Agilent products to which it pertains. Should Agilent have a
written contra ct wit h the U se r and sh ou ld any o f the contr act terms conflict with these terms, the cont rac t
terms shall control.
F o r signal gener a tor warranty in formation, ref e r to the Installa tio n G uide or Service Guide.
Questions or Comments about our Documentation?
We welcome any questions or comments you may have about our documentation. Please email us at
sources_manuals@ am.exch.agilent.com.
ii
Page 3

Contents
1. Getting Started
Overview of Getting Started . . . . . . . . . . . . . . . . . . . . . . . . . . . . . . . . . . . . . . . . . . . . . . . . . . . . .1-2
Confirming Equipment . . . . . . . . . . . . . . . . . . . . . . . . . . . . . . . . . . . . . . . . . . . . . . . . . . . . . . . . .1-3
Installing Service Support Software. . . . . . . . . . . . . . . . . . . . . . . . . . . . . . . . . . . . . . . . . . . . . . .1-4
Uninstallin g Se rv ice Sup po rt Softwar e. . . . . . . . . . . . . . . . . . . . . . . . . . . . . . . . . . . . . . . . . . . . .1-6
Administration of Service Support Software . . . . . . . . . . . . . . . . . . . . . . . . . . . . . . . . . . . . . . . .1-7
Software Configuration . . . . . . . . . . . . . . . . . . . . . . . . . . . . . . . . . . . . . . . . . . . . . . . . . . . . . .1-7
Administering Service Support Software. . . . . . . . . . . . . . . . . . . . . . . . . . . . . . . . . . . . . . . .1-8
Running Service Support Software. . . . . . . . . . . . . . . . . . . . . . . . . . . . . . . . . . . . . . . . . . . . . . . 1-22
Starting the Software . . . . . . . . . . . . . . . . . . . . . . . . . . . . . . . . . . . . . . . . . . . . . . . . . . . . . .1-2 2
Identifying the DUT . . . . . . . . . . . . . . . . . . . . . . . . . . . . . . . . . . . . . . . . . . . . . . . . . . . . . . .1-23
Selecting Performance Tests, Adjustments, and Test Equipment . . . . . . . . . . . . . . . . . . .1-24
Defining the Location where Test Results are Saved . . . . . . . . . . . . . . . . . . . . . . . . . . . . . 1-26
Running the Tests and Adjustments . . . . . . . . . . . . . . . . . . . . . . . . . . . . . . . . . . . . . . . . . .1-27
Reviewing the Test and Adjustment Results. . . . . . . . . . . . . . . . . . . . . . . . . . . . . . . . . . . .1-28
Printing the Test and Adjustment Results. . . . . . . . . . . . . . . . . . . . . . . . . . . . . . . . . . . . . .1-29
Exiting the Software . . . . . . . . . . . . . . . . . . . . . . . . . . . . . . . . . . . . . . . . . . . . . . . . . . . . . . .1-29
2. Required Equipment
3. Performance Tests
Overview of Performance Tests. . . . . . . . . . . . . . . . . . . . . . . . . . . . . . . . . . . . . . . . . . . . . . . . . . .3-2
Running Performance Tests . . . . . . . . . . . . . . . . . . . . . . . . . . . . . . . . . . . . . . . . . . . . . . . . . .3-4
Printing Results of Performance Tests. . . . . . . . . . . . . . . . . . . . . . . . . . . . . . . . . . . . . . . . . .3-8
Exiting this Service Support Software. . . . . . . . . . . . . . . . . . . . . . . . . . . . . . . . . . . . . . . . . . 3-8
Internal FM Accuracy and Distortion. . . . . . . . . . . . . . . . . . . . . . . . . . . . . . . . . . . . . . . . . . . . . .3-9
Recommended Equipment. . . . . . . . . . . . . . . . . . . . . . . . . . . . . . . . . . . . . . . . . . . . . . . . . . . .3-9
Equipment Setup . . . . . . . . . . . . . . . . . . . . . . . . . . . . . . . . . . . . . . . . . . . . . . . . . . . . . . . . . . .3-9
Internal A M Accuracy and Distortion. . . . . . . . . . . . . . . . . . . . . . . . . . . . . . . . . . . . . . . . . . . . .3-10
Recommended Equipment. . . . . . . . . . . . . . . . . . . . . . . . . . . . . . . . . . . . . . . . . . . . . . . . . . .3-10
Equipment Setups . . . . . . . . . . . . . . . . . . . . . . . . . . . . . . . . . . . . . . . . . . . . . . . . . . . . . . . . .3-10
Phase Modulation Accuracy and Distortion . . . . . . . . . . . . . . . . . . . . . . . . . . . . . . . . . . . . . . . .3-12
Recommended Equipment. . . . . . . . . . . . . . . . . . . . . . . . . . . . . . . . . . . . . . . . . . . . . . . . . . .3-12
Equipment Setup . . . . . . . . . . . . . . . . . . . . . . . . . . . . . . . . . . . . . . . . . . . . . . . . . . . . . . . . .3-12
FM Frequency Response . . . . . . . . . . . . . . . . . . . . . . . . . . . . . . . . . . . . . . . . . . . . . . . . . . . . . . .3-13
Recommended Equipment. . . . . . . . . . . . . . . . . . . . . . . . . . . . . . . . . . . . . . . . . . . . . . . . . . .3-13
Equipment Setup . . . . . . . . . . . . . . . . . . . . . . . . . . . . . . . . . . . . . . . . . . . . . . . . . . . . . . . . .3-13
iii
Page 4

Contents
AM Frequency Response. . . . . . . . . . . . . . . . . . . . . . . . . . . . . . . . . . . . . . . . . . . . . . . . . . . . . . . 3-1 4
Recommended Equipment . . . . . . . . . . . . . . . . . . . . . . . . . . . . . . . . . . . . . . . . . . . . . . . . . .3-14
Equipment Setups . . . . . . . . . . . . . . . . . . . . . . . . . . . . . . . . . . . . . . . . . . . . . . . . . . . . . . . .3-14
Phase Modulation Frequency Response. . . . . . . . . . . . . . . . . . . . . . . . . . . . . . . . . . . . . . . . . . .3-16
Recommended Equipment . . . . . . . . . . . . . . . . . . . . . . . . . . . . . . . . . . . . . . . . . . . . . . . . . .3-16
Equipment Setup . . . . . . . . . . . . . . . . . . . . . . . . . . . . . . . . . . . . . . . . . . . . . . . . . . . . . . . . .3-16
DCFM Frequency Offset Relative to CW . . . . . . . . . . . . . . . . . . . . . . . . . . . . . . . . . . . . . . . . . .3-17
Recommended Equipment . . . . . . . . . . . . . . . . . . . . . . . . . . . . . . . . . . . . . . . . . . . . . . . . . .3-17
Equipment Setup . . . . . . . . . . . . . . . . . . . . . . . . . . . . . . . . . . . . . . . . . . . . . . . . . . . . . . . . .3-17
Residual FM
(Not Used with Option UNJ or Option 506) . . . . . . . . . . . . . . . . . . . . . . . . . . . . . . . . . . . . . . . . 3-18
Recommended Equipment . . . . . . . . . . . . . . . . . . . . . . . . . . . . . . . . . . . . . . . . . . . . . . . . . .3-18
Equipment Setups. . . . . . . . . . . . . . . . . . . . . . . . . . . . . . . . . . . . . . . . . . . . . . . . . . . . . . . . .3-18
Harmonic, Subharmonic, and Nonharmonic Spurious Signals . . . . . . . . . . . . . . . . . . . . . . . . 3-20
Recommended Equipment . . . . . . . . . . . . . . . . . . . . . . . . . . . . . . . . . . . . . . . . . . . . . . . . . .3-20
Equipment Setup . . . . . . . . . . . . . . . . . . . . . . . . . . . . . . . . . . . . . . . . . . . . . . . . . . . . . . . . .3-20
Power Level Accuracy . . . . . . . . . . . . . . . . . . . . . . . . . . . . . . . . . . . . . . . . . . . . . . . . . . . . . . . . . 3-21
Recommended Equipment . . . . . . . . . . . . . . . . . . . . . . . . . . . . . . . . . . . . . . . . . . . . . . . . . .3-21
Equipmen t Setup s
. . . . . . . . . . . . . . . . . . . . . . . . . . . . . . . . . . . . . . . . . . . . . . . . . . . . . . . . . . . . . . . . . . . . . . . . 3-22
Tim ebase Aging Ra te
(Manual Test - Option U N J, Option 506, or Option 1E5 Only). . . . . . . . . . . . . . . . . . . . . . . . .3-24
Recommended Equipment . . . . . . . . . . . . . . . . . . . . . . . . . . . . . . . . . . . . . . . . . . . . . . . . . .3-24
Equipment Setup . . . . . . . . . . . . . . . . . . . . . . . . . . . . . . . . . . . . . . . . . . . . . . . . . . . . . . . . .3-25
Procedure. . . . . . . . . . . . . . . . . . . . . . . . . . . . . . . . . . . . . . . . . . . . . . . . . . . . . . . . . . . . . . . .3-25
Digital Modulation Level Accuracy . . . . . . . . . . . . . . . . . . . . . . . . . . . . . . . . . . . . . . . . . . . . . .3-27
Recommended Equipment . . . . . . . . . . . . . . . . . . . . . . . . . . . . . . . . . . . . . . . . . . . . . . . . . .3-27
Equipment Setup . . . . . . . . . . . . . . . . . . . . . . . . . . . . . . . . . . . . . . . . . . . . . . . . . . . . . . . . .3-27
Internal Digital Modu latio n Qu ality
(Option 402 Only) . . . . . . . . . . . . . . . . . . . . . . . . . . . . . . . . . . . . . . . . . . . . . . . . . . . . . . . . . . . . 3-28
Recommended Equipment . . . . . . . . . . . . . . . . . . . . . . . . . . . . . . . . . . . . . . . . . . . . . . . . . .3-28
Equipment Setup . . . . . . . . . . . . . . . . . . . . . . . . . . . . . . . . . . . . . . . . . . . . . . . . . . . . . . . . .3-28
Custom I/Q RF Modulation Quality
(Option 402 Only) . . . . . . . . . . . . . . . . . . . . . . . . . . . . . . . . . . . . . . . . . . . . . . . . . . . . . . . . . . . . 3-29
Recommended Equipment . . . . . . . . . . . . . . . . . . . . . . . . . . . . . . . . . . . . . . . . . . . . . . . . . .3-29
Equipment Setups. . . . . . . . . . . . . . . . . . . . . . . . . . . . . . . . . . . . . . . . . . . . . . . . . . . . . . . . .3-29
Procedure. . . . . . . . . . . . . . . . . . . . . . . . . . . . . . . . . . . . . . . . . . . . . . . . . . . . . . . . . . . . . . . .3-30
Pulse Modulation On/Off Ratio. . . . . . . . . . . . . . . . . . . . . . . . . . . . . . . . . . . . . . . . . . . . . . . . . .3-31
iv
Page 5

Contents
Recommended Equipment. . . . . . . . . . . . . . . . . . . . . . . . . . . . . . . . . . . . . . . . . . . . . . . . . . .3-31
Equipment Setup . . . . . . . . . . . . . . . . . . . . . . . . . . . . . . . . . . . . . . . . . . . . . . . . . . . . . . . . . .3-31
Burst Modulation On/Off Ratio. . . . . . . . . . . . . . . . . . . . . . . . . . . . . . . . . . . . . . . . . . . . . . . . . .3-32
Recommended Equipment. . . . . . . . . . . . . . . . . . . . . . . . . . . . . . . . . . . . . . . . . . . . . . . . . . .3-32
Equipment Setup . . . . . . . . . . . . . . . . . . . . . . . . . . . . . . . . . . . . . . . . . . . . . . . . . . . . . . . . . .3-32
CDMA Adjacent Channel Power
(Not Used with Option UNB or Option 506). . . . . . . . . . . . . . . . . . . . . . . . . . . . . . . . . . . . . . . .3-33
Recommended Equipment. . . . . . . . . . . . . . . . . . . . . . . . . . . . . . . . . . . . . . . . . . . . . . . . . . .3-33
Equipment Setup . . . . . . . . . . . . . . . . . . . . . . . . . . . . . . . . . . . . . . . . . . . . . . . . . . . . . . . . . .3-33
WCDMA Adjacent Channel Power
(Option 400) . . . . . . . . . . . . . . . . . . . . . . . . . . . . . . . . . . . . . . . . . . . . . . . . . . . . . . . . . . . . . . . . .3- 3 4
Recommended Equipment. . . . . . . . . . . . . . . . . . . . . . . . . . . . . . . . . . . . . . . . . . . . . . . . . . .3-34
Equipment Setup . . . . . . . . . . . . . . . . . . . . . . . . . . . . . . . . . . . . . . . . . . . . . . . . . . . . . . . . . .3-34
Phase Noise and Residual FM
(Manual Test - Option UNJ or Option 506 Only). . . . . . . . . . . . . . . . . . . . . . . . . . . . . . . . . . . .3-35
Measuring Phase Noise. . . . . . . . . . . . . . . . . . . . . . . . . . . . . . . . . . . . . . . . . . . . . . . . . . . . .3-35
Measuring Residual FM . . . . . . . . . . . . . . . . . . . . . . . . . . . . . . . . . . . . . . . . . . . . . . . . . . . .3-38
Dual Arbitrary Waveform Generator Check. . . . . . . . . . . . . . . . . . . . . . . . . . . . . . . . . . . . . . . .3-39
Recommended Equipment. . . . . . . . . . . . . . . . . . . . . . . . . . . . . . . . . . . . . . . . . . . . . . . . . . .3-39
Equipment Setup . . . . . . . . . . . . . . . . . . . . . . . . . . . . . . . . . . . . . . . . . . . . . . . . . . . . . . . . . .3-39
Procedure . . . . . . . . . . . . . . . . . . . . . . . . . . . . . . . . . . . . . . . . . . . . . . . . . . . . . . . . . . . . . . . .3- 3 9
GSM Loopback BER Check
(Option 300 Only). . . . . . . . . . . . . . . . . . . . . . . . . . . . . . . . . . . . . . . . . . . . . . . . . . . . . . . . . . . . .3-4 1
Recommended Equipment. . . . . . . . . . . . . . . . . . . . . . . . . . . . . . . . . . . . . . . . . . . . . . . . . . .3-41
Equipment Setup . . . . . . . . . . . . . . . . . . . . . . . . . . . . . . . . . . . . . . . . . . . . . . . . . . . . . . . . . .3-41
Performance Test Records . . . . . . . . . . . . . . . . . . . . . . . . . . . . . . . . . . . . . . . . . . . . . . . . . . . . . . 3-42
4. Adjustments
Overview of Adjustments. . . . . . . . . . . . . . . . . . . . . . . . . . . . . . . . . . . . . . . . . . . . . . . . . . . . . . . .4-2
Adjustment Relationships . . . . . . . . . . . . . . . . . . . . . . . . . . . . . . . . . . . . . . . . . . . . . . . . . . . . . . .4-5
Analog Bus ADC Calibration Related Adjustments . . . . . . . . . . . . . . . . . . . . . . . . . . . . . . .4-5
Synthesizer Potentiometer Related Adjustments . . . . . . . . . . . . . . . . . . . . . . . . . . . . . . . . .4-5
AM Accuracy Related Adjustments . . . . . . . . . . . . . . . . . . . . . . . . . . . . . . . . . . . . . . . . . . . .4-5
I/Q Modulation Accuracy Related Adjustments. . . . . . . . . . . . . . . . . . . . . . . . . . . . . . . . . . .4-5
Burst Modulation Accuracy Related Adjustments. . . . . . . . . . . . . . . . . . . . . . . . . . . . . . . . .4-5
FM Accuracy Related Adjustments . . . . . . . . . . . . . . . . . . . . . . . . . . . . . . . . . . . . . . . . . . . .4-6
Power Level Range and Accuracy Related Adjustments. . . . . . . . . . . . . . . . . . . . . . . . . . . .4-6
Internal Refer en ce Osc illator Calibration . . . . . . . . . . . . . . . . . . . . . . . . . . . . . . . . . . . . . . . . . .4-7
v
Page 6

Contents
Description . . . . . . . . . . . . . . . . . . . . . . . . . . . . . . . . . . . . . . . . . . . . . . . . . . . . . . . . . . . . . . . 4-7
Required Test Equipment. . . . . . . . . . . . . . . . . . . . . . . . . . . . . . . . . . . . . . . . . . . . . . . . . . . . 4-7
Procedure. . . . . . . . . . . . . . . . . . . . . . . . . . . . . . . . . . . . . . . . . . . . . . . . . . . . . . . . . . . . . . . . . 4-7
Analog Bus ADC Calibration . . . . . . . . . . . . . . . . . . . . . . . . . . . . . . . . . . . . . . . . . . . . . . . . . . . . 4-8
Description . . . . . . . . . . . . . . . . . . . . . . . . . . . . . . . . . . . . . . . . . . . . . . . . . . . . . . . . . . . . . . . 4-8
Required Test Equipment. . . . . . . . . . . . . . . . . . . . . . . . . . . . . . . . . . . . . . . . . . . . . . . . . . . . 4-8
Procedure. . . . . . . . . . . . . . . . . . . . . . . . . . . . . . . . . . . . . . . . . . . . . . . . . . . . . . . . . . . . . . . . . 4-8
Pretune Calibration
(Option UNJ or Option 506 Only). . . . . . . . . . . . . . . . . . . . . . . . . . . . . . . . . . . . . . . . . . . . . . . . . 4-9
Description . . . . . . . . . . . . . . . . . . . . . . . . . . . . . . . . . . . . . . . . . . . . . . . . . . . . . . . . . . . . . . . 4-9
Required Test Equipment. . . . . . . . . . . . . . . . . . . . . . . . . . . . . . . . . . . . . . . . . . . . . . . . . . . . 4-9
Procedure. . . . . . . . . . . . . . . . . . . . . . . . . . . . . . . . . . . . . . . . . . . . . . . . . . . . . . . . . . . . . . . . . 4-9
Internal Source Calibration . . . . . . . . . . . . . . . . . . . . . . . . . . . . . . . . . . . . . . . . . . . . . . . . . . . . 4-1 0
Description . . . . . . . . . . . . . . . . . . . . . . . . . . . . . . . . . . . . . . . . . . . . . . . . . . . . . . . . . . . . . . 4-10
Required Test Equipment. . . . . . . . . . . . . . . . . . . . . . . . . . . . . . . . . . . . . . . . . . . . . . . . . . . 4-10
Procedure. . . . . . . . . . . . . . . . . . . . . . . . . . . . . . . . . . . . . . . . . . . . . . . . . . . . . . . . . . . . . . . .4-10
VCO Bias Potentiometer Calibration. . . . . . . . . . . . . . . . . . . . . . . . . . . . . . . . . . . . . . . . . . . . . 4-11
Description . . . . . . . . . . . . . . . . . . . . . . . . . . . . . . . . . . . . . . . . . . . . . . . . . . . . . . . . . . . . . . 4-11
Required Test Equipment. . . . . . . . . . . . . . . . . . . . . . . . . . . . . . . . . . . . . . . . . . . . . . . . . . . 4-11
Procedure. . . . . . . . . . . . . . . . . . . . . . . . . . . . . . . . . . . . . . . . . . . . . . . . . . . . . . . . . . . . . . . .4-11
Lock Angle Potentiometer Ca libr atio n
(Not Used with Option UNJ or Option 506) . . . . . . . . . . . . . . . . . . . . . . . . . . . . . . . . . . . . . . . . 4-12
Description . . . . . . . . . . . . . . . . . . . . . . . . . . . . . . . . . . . . . . . . . . . . . . . . . . . . . . . . . . . . . . 4-12
Required Test Equipment. . . . . . . . . . . . . . . . . . . . . . . . . . . . . . . . . . . . . . . . . . . . . . . . . . . 4-12
Procedure. . . . . . . . . . . . . . . . . . . . . . . . . . . . . . . . . . . . . . . . . . . . . . . . . . . . . . . . . . . . . . . .4-12
KV versus Frequency Calibration . . . . . . . . . . . . . . . . . . . . . . . . . . . . . . . . . . . . . . . . . . . . . . . 4-13
Description . . . . . . . . . . . . . . . . . . . . . . . . . . . . . . . . . . . . . . . . . . . . . . . . . . . . . . . . . . . . . . 4-13
Required Test Equipment. . . . . . . . . . . . . . . . . . . . . . . . . . . . . . . . . . . . . . . . . . . . . . . . . . . 4-13
Procedure. . . . . . . . . . . . . . . . . . . . . . . . . . . . . . . . . . . . . . . . . . . . . . . . . . . . . . . . . . . . . . . .4-13
Timebase DAC Calibration. . . . . . . . . . . . . . . . . . . . . . . . . . . . . . . . . . . . . . . . . . . . . . . . . . . . .4-14
Description . . . . . . . . . . . . . . . . . . . . . . . . . . . . . . . . . . . . . . . . . . . . . . . . . . . . . . . . . . . . . . 4-14
Required Test Equipment. . . . . . . . . . . . . . . . . . . . . . . . . . . . . . . . . . . . . . . . . . . . . . . . . . . 4-14
Procedure. . . . . . . . . . . . . . . . . . . . . . . . . . . . . . . . . . . . . . . . . . . . . . . . . . . . . . . . . . . . . . . .4-14
FM Scale DAC Offset Calibration . . . . . . . . . . . . . . . . . . . . . . . . . . . . . . . . . . . . . . . . . . . . . . .4-15
Description . . . . . . . . . . . . . . . . . . . . . . . . . . . . . . . . . . . . . . . . . . . . . . . . . . . . . . . . . . . . . . 4-15
Required Test Equipment. . . . . . . . . . . . . . . . . . . . . . . . . . . . . . . . . . . . . . . . . . . . . . . . . . . 4-15
Procedure. . . . . . . . . . . . . . . . . . . . . . . . . . . . . . . . . . . . . . . . . . . . . . . . . . . . . . . . . . . . . . . .4-15
vi
Page 7

Contents
FM Path Offset Calibration . . . . . . . . . . . . . . . . . . . . . . . . . . . . . . . . . . . . . . . . . . . . . . . . . . . . .4-16
Description . . . . . . . . . . . . . . . . . . . . . . . . . . . . . . . . . . . . . . . . . . . . . . . . . . . . . . . . . . . . . . .4-16
Required Test Equipment . . . . . . . . . . . . . . . . . . . . . . . . . . . . . . . . . . . . . . . . . . . . . . . . . . .4-16
Procedure . . . . . . . . . . . . . . . . . . . . . . . . . . . . . . . . . . . . . . . . . . . . . . . . . . . . . . . . . . . . . . . .4- 1 6
FM In-Band D AC Offset Calibration . . . . . . . . . . . . . . . . . . . . . . . . . . . . . . . . . . . . . . . . . . . . .4-17
Description . . . . . . . . . . . . . . . . . . . . . . . . . . . . . . . . . . . . . . . . . . . . . . . . . . . . . . . . . . . . . . .4-17
Required Test Equipment . . . . . . . . . . . . . . . . . . . . . . . . . . . . . . . . . . . . . . . . . . . . . . . . . . .4-17
Procedure . . . . . . . . . . . . . . . . . . . . . . . . . . . . . . . . . . . . . . . . . . . . . . . . . . . . . . . . . . . . . . . .4- 1 7
FM Inverting Amplifier Offset Calibration. . . . . . . . . . . . . . . . . . . . . . . . . . . . . . . . . . . . . . . . .4-18
Description . . . . . . . . . . . . . . . . . . . . . . . . . . . . . . . . . . . . . . . . . . . . . . . . . . . . . . . . . . . . . . .4-18
Required Test Equipment . . . . . . . . . . . . . . . . . . . . . . . . . . . . . . . . . . . . . . . . . . . . . . . . . . .4-18
Procedure . . . . . . . . . . . . . . . . . . . . . . . . . . . . . . . . . . . . . . . . . . . . . . . . . . . . . . . . . . . . . . . .4- 1 8
FM 1/2 Path Ratio Gain Calibration. . . . . . . . . . . . . . . . . . . . . . . . . . . . . . . . . . . . . . . . . . . . . . 4-19
Description . . . . . . . . . . . . . . . . . . . . . . . . . . . . . . . . . . . . . . . . . . . . . . . . . . . . . . . . . . . . . . .4-19
Required Test Equipment . . . . . . . . . . . . . . . . . . . . . . . . . . . . . . . . . . . . . . . . . . . . . . . . . . .4-19
Procedure . . . . . . . . . . . . . . . . . . . . . . . . . . . . . . . . . . . . . . . . . . . . . . . . . . . . . . . . . . . . . . . .4- 1 9
Modulation Source Relative Gain Calibration . . . . . . . . . . . . . . . . . . . . . . . . . . . . . . . . . . . . . .4-20
Description . . . . . . . . . . . . . . . . . . . . . . . . . . . . . . . . . . . . . . . . . . . . . . . . . . . . . . . . . . . . . . .4-20
Required Test Equipment . . . . . . . . . . . . . . . . . . . . . . . . . . . . . . . . . . . . . . . . . . . . . . . . . . .4-20
Procedure . . . . . . . . . . . . . . . . . . . . . . . . . . . . . . . . . . . . . . . . . . . . . . . . . . . . . . . . . . . . . . . .4- 2 0
FM Out-of-Ba nd Calibration
(Not Used with Option UNJ or Option 506). . . . . . . . . . . . . . . . . . . . . . . . . . . . . . . . . . . . . . . .4-21
Description . . . . . . . . . . . . . . . . . . . . . . . . . . . . . . . . . . . . . . . . . . . . . . . . . . . . . . . . . . . . . . .4-21
Required Test Equipment . . . . . . . . . . . . . . . . . . . . . . . . . . . . . . . . . . . . . . . . . . . . . . . . . . .4-21
Procedure . . . . . . . . . . . . . . . . . . . . . . . . . . . . . . . . . . . . . . . . . . . . . . . . . . . . . . . . . . . . . . . .4- 2 1
FM/PM Out-of-Band Calibratio n
(Option UNJ or Option 506 Only) . . . . . . . . . . . . . . . . . . . . . . . . . . . . . . . . . . . . . . . . . . . . . . . . 4-22
Description . . . . . . . . . . . . . . . . . . . . . . . . . . . . . . . . . . . . . . . . . . . . . . . . . . . . . . . . . . . . . . .4-22
Required Test Equipment . . . . . . . . . . . . . . . . . . . . . . . . . . . . . . . . . . . . . . . . . . . . . . . . . . .4-22
Procedure . . . . . . . . . . . . . . . . . . . . . . . . . . . . . . . . . . . . . . . . . . . . . . . . . . . . . . . . . . . . . . . .4- 2 2
FM/PM YO Frequency Compensation Calibration
(Option UNJ or Option 506 Only) . . . . . . . . . . . . . . . . . . . . . . . . . . . . . . . . . . . . . . . . . . . . . . . . 4-23
Description . . . . . . . . . . . . . . . . . . . . . . . . . . . . . . . . . . . . . . . . . . . . . . . . . . . . . . . . . . . . . . .4-23
Required Test Equipment . . . . . . . . . . . . . . . . . . . . . . . . . . . . . . . . . . . . . . . . . . . . . . . . . . .4-23
Procedure . . . . . . . . . . . . . . . . . . . . . . . . . . . . . . . . . . . . . . . . . . . . . . . . . . . . . . . . . . . . . . . .4- 2 3
DCFM Calibration . . . . . . . . . . . . . . . . . . . . . . . . . . . . . . . . . . . . . . . . . . . . . . . . . . . . . . . . . . . .4-24
Description . . . . . . . . . . . . . . . . . . . . . . . . . . . . . . . . . . . . . . . . . . . . . . . . . . . . . . . . . . . . . . .4-24
Required Test Equipment . . . . . . . . . . . . . . . . . . . . . . . . . . . . . . . . . . . . . . . . . . . . . . . . . . .4-24
vii
Page 8

Contents
Procedure. . . . . . . . . . . . . . . . . . . . . . . . . . . . . . . . . . . . . . . . . . . . . . . . . . . . . . . . . . . . . . . .4-24
External Input Peak Detector Calibration. . . . . . . . . . . . . . . . . . . . . . . . . . . . . . . . . . . . . . . . .4-25
Description . . . . . . . . . . . . . . . . . . . . . . . . . . . . . . . . . . . . . . . . . . . . . . . . . . . . . . . . . . . . . . 4-25
Required Test Equipment. . . . . . . . . . . . . . . . . . . . . . . . . . . . . . . . . . . . . . . . . . . . . . . . . . . 4-25
Procedure. . . . . . . . . . . . . . . . . . . . . . . . . . . . . . . . . . . . . . . . . . . . . . . . . . . . . . . . . . . . . . . .4-25
AM Audio Path Offset Calibration . . . . . . . . . . . . . . . . . . . . . . . . . . . . . . . . . . . . . . . . . . . . . . . 4-26
Description . . . . . . . . . . . . . . . . . . . . . . . . . . . . . . . . . . . . . . . . . . . . . . . . . . . . . . . . . . . . . . 4-26
Required Test Equipment. . . . . . . . . . . . . . . . . . . . . . . . . . . . . . . . . . . . . . . . . . . . . . . . . . . 4-26
Procedure. . . . . . . . . . . . . . . . . . . . . . . . . . . . . . . . . . . . . . . . . . . . . . . . . . . . . . . . . . . . . . . .4-26
Burst Modulator Calibration . . . . . . . . . . . . . . . . . . . . . . . . . . . . . . . . . . . . . . . . . . . . . . . . . . .4-27
Description . . . . . . . . . . . . . . . . . . . . . . . . . . . . . . . . . . . . . . . . . . . . . . . . . . . . . . . . . . . . . . 4-27
Required Test Equipment. . . . . . . . . . . . . . . . . . . . . . . . . . . . . . . . . . . . . . . . . . . . . . . . . . . 4-27
Procedure. . . . . . . . . . . . . . . . . . . . . . . . . . . . . . . . . . . . . . . . . . . . . . . . . . . . . . . . . . . . . . . .4-27
Prelevel Calibration. . . . . . . . . . . . . . . . . . . . . . . . . . . . . . . . . . . . . . . . . . . . . . . . . . . . . . . . . . . 4-28
Description . . . . . . . . . . . . . . . . . . . . . . . . . . . . . . . . . . . . . . . . . . . . . . . . . . . . . . . . . . . . . . 4-28
Required Test Equipment. . . . . . . . . . . . . . . . . . . . . . . . . . . . . . . . . . . . . . . . . . . . . . . . . . . 4-28
Procedure. . . . . . . . . . . . . . . . . . . . . . . . . . . . . . . . . . . . . . . . . . . . . . . . . . . . . . . . . . . . . . . .4-28
VBLO Mixer Bias Calibration . . . . . . . . . . . . . . . . . . . . . . . . . . . . . . . . . . . . . . . . . . . . . . . . . . 4-29
Description . . . . . . . . . . . . . . . . . . . . . . . . . . . . . . . . . . . . . . . . . . . . . . . . . . . . . . . . . . . . . . 4-29
Required Test Equipment. . . . . . . . . . . . . . . . . . . . . . . . . . . . . . . . . . . . . . . . . . . . . . . . . . . 4-29
Procedure. . . . . . . . . . . . . . . . . . . . . . . . . . . . . . . . . . . . . . . . . . . . . . . . . . . . . . . . . . . . . . . .4-29
Digital Gain Adjust Calibration . . . . . . . . . . . . . . . . . . . . . . . . . . . . . . . . . . . . . . . . . . . . . . . . .4-30
Description . . . . . . . . . . . . . . . . . . . . . . . . . . . . . . . . . . . . . . . . . . . . . . . . . . . . . . . . . . . . . . 4-30
Required Test Equipment. . . . . . . . . . . . . . . . . . . . . . . . . . . . . . . . . . . . . . . . . . . . . . . . . . . 4-30
Procedure. . . . . . . . . . . . . . . . . . . . . . . . . . . . . . . . . . . . . . . . . . . . . . . . . . . . . . . . . . . . . . . .4-30
Bypass Gain Adjust Calibration. . . . . . . . . . . . . . . . . . . . . . . . . . . . . . . . . . . . . . . . . . . . . . . . .4-31
Description . . . . . . . . . . . . . . . . . . . . . . . . . . . . . . . . . . . . . . . . . . . . . . . . . . . . . . . . . . . . . . 4-31
Required Test Equipment. . . . . . . . . . . . . . . . . . . . . . . . . . . . . . . . . . . . . . . . . . . . . . . . . . . 4-31
Procedure. . . . . . . . . . . . . . . . . . . . . . . . . . . . . . . . . . . . . . . . . . . . . . . . . . . . . . . . . . . . . . . .4-31
ALC Calibration. . . . . . . . . . . . . . . . . . . . . . . . . . . . . . . . . . . . . . . . . . . . . . . . . . . . . . . . . . . . . . 4-32
Description . . . . . . . . . . . . . . . . . . . . . . . . . . . . . . . . . . . . . . . . . . . . . . . . . . . . . . . . . . . . . . 4-32
Required Test Equipment. . . . . . . . . . . . . . . . . . . . . . . . . . . . . . . . . . . . . . . . . . . . . . . . . . . 4-33
Procedure. . . . . . . . . . . . . . . . . . . . . . . . . . . . . . . . . . . . . . . . . . . . . . . . . . . . . . . . . . . . . . . .4-33
Power Level Accuracy, High Power Calibration. . . . . . . . . . . . . . . . . . . . . . . . . . . . . . . . . . . . . 4-34
Description . . . . . . . . . . . . . . . . . . . . . . . . . . . . . . . . . . . . . . . . . . . . . . . . . . . . . . . . . . . . . . 4-34
Required Test Equipment. . . . . . . . . . . . . . . . . . . . . . . . . . . . . . . . . . . . . . . . . . . . . . . . . . . 4-34
Procedure. . . . . . . . . . . . . . . . . . . . . . . . . . . . . . . . . . . . . . . . . . . . . . . . . . . . . . . . . . . . . . . .4-34
viii
Page 9

Contents
ALC Modulation Driver Bias Calibrat ion. . . . . . . . . . . . . . . . . . . . . . . . . . . . . . . . . . . . . . . . . .4-35
Description . . . . . . . . . . . . . . . . . . . . . . . . . . . . . . . . . . . . . . . . . . . . . . . . . . . . . . . . . . . . . . .4-35
Required Test Equipment . . . . . . . . . . . . . . . . . . . . . . . . . . . . . . . . . . . . . . . . . . . . . . . . . . .4-35
Procedure . . . . . . . . . . . . . . . . . . . . . . . . . . . . . . . . . . . . . . . . . . . . . . . . . . . . . . . . . . . . . . . .4- 3 5
Power Le vel Ac curac y, Low Power Cal i bration. . . . . . . . . . . . . . . . . . . . . . . . . . . . . . . . . . . . . .4- 3 6
Description . . . . . . . . . . . . . . . . . . . . . . . . . . . . . . . . . . . . . . . . . . . . . . . . . . . . . . . . . . . . . . .4-36
Required Test Equipment . . . . . . . . . . . . . . . . . . . . . . . . . . . . . . . . . . . . . . . . . . . . . . . . . . .4-36
Procedure . . . . . . . . . . . . . . . . . . . . . . . . . . . . . . . . . . . . . . . . . . . . . . . . . . . . . . . . . . . . . . . .4- 3 7
Power Search Calibration . . . . . . . . . . . . . . . . . . . . . . . . . . . . . . . . . . . . . . . . . . . . . . . . . . . . . .4-3 9
Description . . . . . . . . . . . . . . . . . . . . . . . . . . . . . . . . . . . . . . . . . . . . . . . . . . . . . . . . . . . . . . .4-39
Required Test Equipment . . . . . . . . . . . . . . . . . . . . . . . . . . . . . . . . . . . . . . . . . . . . . . . . . . .4-39
Procedure . . . . . . . . . . . . . . . . . . . . . . . . . . . . . . . . . . . . . . . . . . . . . . . . . . . . . . . . . . . . . . . .4- 3 9
AM Gain Calib ration . . . . . . . . . . . . . . . . . . . . . . . . . . . . . . . . . . . . . . . . . . . . . . . . . . . . . . . . . .4- 4 0
Description . . . . . . . . . . . . . . . . . . . . . . . . . . . . . . . . . . . . . . . . . . . . . . . . . . . . . . . . . . . . . . .4-40
Required Test Equipment . . . . . . . . . . . . . . . . . . . . . . . . . . . . . . . . . . . . . . . . . . . . . . . . . . .4-40
Procedure . . . . . . . . . . . . . . . . . . . . . . . . . . . . . . . . . . . . . . . . . . . . . . . . . . . . . . . . . . . . . . . .4- 4 0
I/Q Ga i n/Offset /Quad ratu r e Calib ratio n. . . . . . . . . . . . . . . . . . . . . . . . . . . . . . . . . . . . . . . . . . .4-4 1
Description . . . . . . . . . . . . . . . . . . . . . . . . . . . . . . . . . . . . . . . . . . . . . . . . . . . . . . . . . . . . . . .4-41
Required Test Equipment . . . . . . . . . . . . . . . . . . . . . . . . . . . . . . . . . . . . . . . . . . . . . . . . . . .4-41
Procedure . . . . . . . . . . . . . . . . . . . . . . . . . . . . . . . . . . . . . . . . . . . . . . . . . . . . . . . . . . . . . . . .4- 4 1
I/Q Impairment Calibration. . . . . . . . . . . . . . . . . . . . . . . . . . . . . . . . . . . . . . . . . . . . . . . . . . . . .4-42
Description . . . . . . . . . . . . . . . . . . . . . . . . . . . . . . . . . . . . . . . . . . . . . . . . . . . . . . . . . . . . . . .4-42
Required Test Equipment . . . . . . . . . . . . . . . . . . . . . . . . . . . . . . . . . . . . . . . . . . . . . . . . . . .4-42
Procedure . . . . . . . . . . . . . . . . . . . . . . . . . . . . . . . . . . . . . . . . . . . . . . . . . . . . . . . . . . . . . . . .4- 4 2
5. Contacting Agilent Technologies
Contacting Agilent Technologies. . . . . . . . . . . . . . . . . . . . . . . . . . . . . . . . . . . . . . . . . . . . . . . . . .5-2
ix
Page 10

Contents
x
Page 11

1 Gettin g Starte d
1-1
Page 12

Getting Started
Overview of Getting Star ted
Overview of Getting Started
Agilent’s service support software allows fast and accurate testing of the Agilent E4438C ESG vector signal
generator. Th is cha pt er describes how to install, configure, and run ser vic e supp ort so ftware so that yo u can
adjust and test an Agilent E4438C ESG vector signal gene rator to meet specifica tio ns.
How to Proceed
First, review the rest of this sectio n to le arn abou t inst alling, configuring, and running se rv ice sup po rt
softw ar e. Next, ref e r to “Re qui red Eq uipm ent ” to l earn abo ut h ard w are a nd sof tw are req ui reme nts, or becom e
familiar with “Performance Tests” or “Adjustments”. If you need assistance, refer to the section on
“Contactin g Agilent Technologies” on page 5-1.
To install, configure, and run this software, refer to and p erf o rm the step s in the following pro ced ur es:
1. “Confirmin g E quipment” on p age 1-3
2. “Installing Servic e Suppor t Sof tware” on p age 1-4
3. “Ad ministering S ervic e S upp ort Sof tware” o n page 1- 8
4. “Running Servic e Sup po rt Software” o n p age 1-22
1- 2
Page 13

Getting Started
Confirming Equipmen t
Confirming Equipment
• Confirm that you have the prope r te st equipmen t . (Refer t o Chapter 2 for a complete listing.) Let all the
test equipme nt and signal generator warm up in accord anc e wi th ins tru m e nt spe cific atio n s.
• Confirm that your co m puter has the following hardware and ope r atin g system:
Tabl e 1-1 Computer Equipm ent
Hardware
Test System Controller IBM PC compatible
RAM Required 16 MB or more
GPIB Card Agilent 82341C/D or 82350A GPIB card
with Agilent SIC L Libraries installed and con figur e d
Operating System
IBM PC Operatin g System Windows 3.1,
Windows 95,
Windows 98,
Windows NT 4.0 computer with Ser vic e 5 or above
1-3
Page 14

Getting Started
Installing Ser vice Support Software
Installing Service Support Software
NOTE If you are installing service support software onto a computer which already has service
support software older than version A.03.00, the old version must be removed before installing
the new version.
To install service support software into a PC:
1. Insert “Disk 1” into the disk drive.
2. Display the Run dialog box:
• F or MS Windows 95 or Windows NT: Select the Start button, then select Run... from th e pop-up menu.
• For MS Windows version 3.x: Open the Program Manager, then select Run ... from the File drop-down
menu.
3. From the Run dialog box, type a:setup and se lect the OK button.
The Setup wind ow is d isp layed as it loads files for the installation.
Once these files ar e loade d, th e ESG Ser vic e Softwar e’s Welcome screen is displayed .
4. Continue with the setup by selecting the Next button.
5. The ESG Servic e Software’s Important Information windo w is d isplaye d. It con tain s info rmation that is
vital to installing and using the software. In addition, any new information may also be shown on this
screen. Stop and read th is information before continuing with the software installation!
6. Continue with the setup by selecting the Next button.
The Choose De stination Loca tion window is displaye d . The def ault location for ins tallin g the so ftware is
C:\HP_SV C \ESG_C. Use this as the software’s destination folder.
7. Continue with the setup by selecting the Next button.
The ESG Servic e Software’s Select Progr am Folder window is di splaye d . This in stallation procedu re will
install the service software icons into a program folder. You can enter a new folder name in the Program
Folders text field or select a folder from the Existing Folders field. It is recommended to use “ESG_C
Service Software” for the folder name.
NOTE This documentation re fers to the fold er name as “ES G_C Servi ce Soft w are.” If you use another
name for the folder, be aware of this difference.
8. Continue with the setup by selecting the Next button.
The ESG Service Software’s Start Copying Files window is displayed. This window shows the destination
directory and the folder name settings. To change these settings, select the Back button until the
appropriate window is displayed.
NOTE This is the last point that yo u can can ce l th e in stallation. If you select the Next button, the
installation p rocee d s un til the so ftware is co m ple te ly ins talle d .
9. Select the Next button to go ahe ad with the installation p rocess.
The graphic on the left of the sc reen shows the s tatus of each fil e as it i s copied to the dest ination dir ector y,
1- 4
Page 15

Getting Started
Installing Service Support Software
the status of each disk that is being copied, and the status of the overall memory of the destination. The
graphic in the center of the screen keeps you updated on the destinat i on folder, the fil es that are being
copied, a n d t h e pro gress of t he in s t a l l ation.
When the contents of the disk have been copied to their dest ination, you are not ified to insert each of the
next disks by the Setup Needs the Next Disk dialog box.
10. Ins ert the ne xt disk , as instr uc te d , and sele ct the OK button.
When the installation is complete, the Setup Complete window is displayed. You will be asked to select
whether you want to view the README file or the INFO file. (You a lready read the INFO file when you
started the installation.)
11. Select the README file and then select the Finish button.
The text editor will display the file. To close this file select the File pull do wn menu and then selec t Exit.
12. Select the Yes, I want to restart my computer now radio button. Ensure that the last disk has been
removed and then choose the Finish button to rest art MS Win d ows.
NOTE The MS Windows program must be restarted before you can use the software. When you select
restart, the computer reboots.
If you do not want to restart M S Windo ws at this time, select the No, I will restart my computer later
radio button. If you select restart, the computer reboots and you can start using the software.
1-5
Page 16

Getting Started
Uninstalling Service Support Software
Uninstalling Service Support Software
• MS Windows 95 or Windows NT:
1. Display the Control Panel program group
by pressing Start > Settin gs > C ontrol Panel.
2. Select the Add/Remove Programs icon.
3. From the Install/ U nin stall Tab in the Add/Remove Progra ms p rop erti es dialog box:
a. Select ESG_C, then selec t the Add/Remove button.
b. Select ESG Serv ice Sof tware, then select the Add/Remove button.
4. If the Details button is displayed, the program is removed but the path has not been removed. Click
the Details button and note the path. T hen click the OK button.
5. Display the M S Windows Explorer dialog box by selecting St art > Programs > Windows Explorer.
6. Select the path that you previously noted, and if you are not using these files for another purpose,
select Delete from the Files dro p- d own menu to delete the pat h.
• MS Windows versio n 3. x:
1. From the Program Manager, click on program group (Agilent Servi ce Suppor t w as the program’s
default title) to high light the program group name.
2. From the File drop-down menu, select Delete.
3. From the Fi le Manager, select the su bdirectory where the program is stored.
(The program ’s default subdirecto ry was hp_ sv c.)
4. From the File drop-down menu, select Delete.
1- 6
Page 17

Getting Started
Administration of Service Support Software
Administration of Service Support Software
The following se c tio n shows you how to ad mi nis te r and ru n the Service Support Software. The software’s
administra tive func tio ns allow for the addi tio n or re m oval o f all nec essary test equipme n t, sof twar e driv e rs,
and test procedures. This would in clude additional software drivers (as they are relea s ed) to extend the range
of tests and equipment supported by Servi ce Support Softw are test set, or maintenance relea se s of the
curren t d ri vers.
Soft ware Configuration
Follow the instructions below to configure the software to run in eithe r User Mode or Ad ministration Mode.
Start the software using the steps appropriate for the version of MS Windows th at is installed on your PC.
• For MS Windows version 3.x:
1. Open the Program Manager window.
2. O p en th e Agi l ent Se rvice S u ppor t program g roup.
3. Open the Agilent Service Software icon.
• For MS Windows 95 or Windows NT:
1. Select Start.
2. Select Agilent Serv ice Software for PCs.
3. Select Agile nt Serv ice So ftware.
The service support software has two configurations: User and Administration. The following sections explain
the difference between the two configurations.
Figure 1-1 The User Informatio n Window
User Configuration
Logging on in Use r Co nfiguration only allo w s a cces s to the instr um e nt ’s perform ance tests and adjustments.
Refer to “Starting the Sof tware” on p age 22.
1-7
Page 18

Getting Started
Administration of Service Suppor t Sof tw are
Administration Configuration
Logging on in Administration Configuration supports all administrative functions, including the addition of
new equipment and the installation of test procedures and device drivers.
Administering Service Support Software
1. Refer to the illus trat io n above and fill in the fi elds in the Us er Inf ormation window :
a. In the User Name field, type in the word Admin. (Case sensitive. )
b. In the Password fie ld , type in the word Falcon. (Case sensitive.)
2. Click OK. (Cance l closes the so ftware ap plicat io n. )
Identifying the Device Under Test (DUT)
When the DUT Selection dialog box is displayed:
1. Make sure that ESG_C is selected in the Select an Instrument Family list.
2. In the Select Model list, select the instrument model of the DUT to be adjusted or tested.
3. In the Serial Number box, enter the complete serial number of the DUT.
4. In the Address box, enter the two-digit GPIB address of the DUT. (To display the address on the signal
generator, press
1-8
Utility > GPIB/RS-232. The GPIB Address softkey shows the current add ress.)
Page 19
Getting Started
Administration of Service Support Software
5. Select the OK but ton.
6. The Select Test Equipment and Tests window appears on the display. Close this window.
Adding Test Equipment
Before any performance tests can be run, information regarding your specific test equipment must be entered
into the software’s database. This information includes the serial numbers, calibration dat es, GPIB address,
and traceabi lit y da t a for each individual compo nent . O n ly equipment which has been en t ere d i nto the system
will be available for the test equipment selection process during the test setup. To add test equipment, follow
the instruction s belo w:
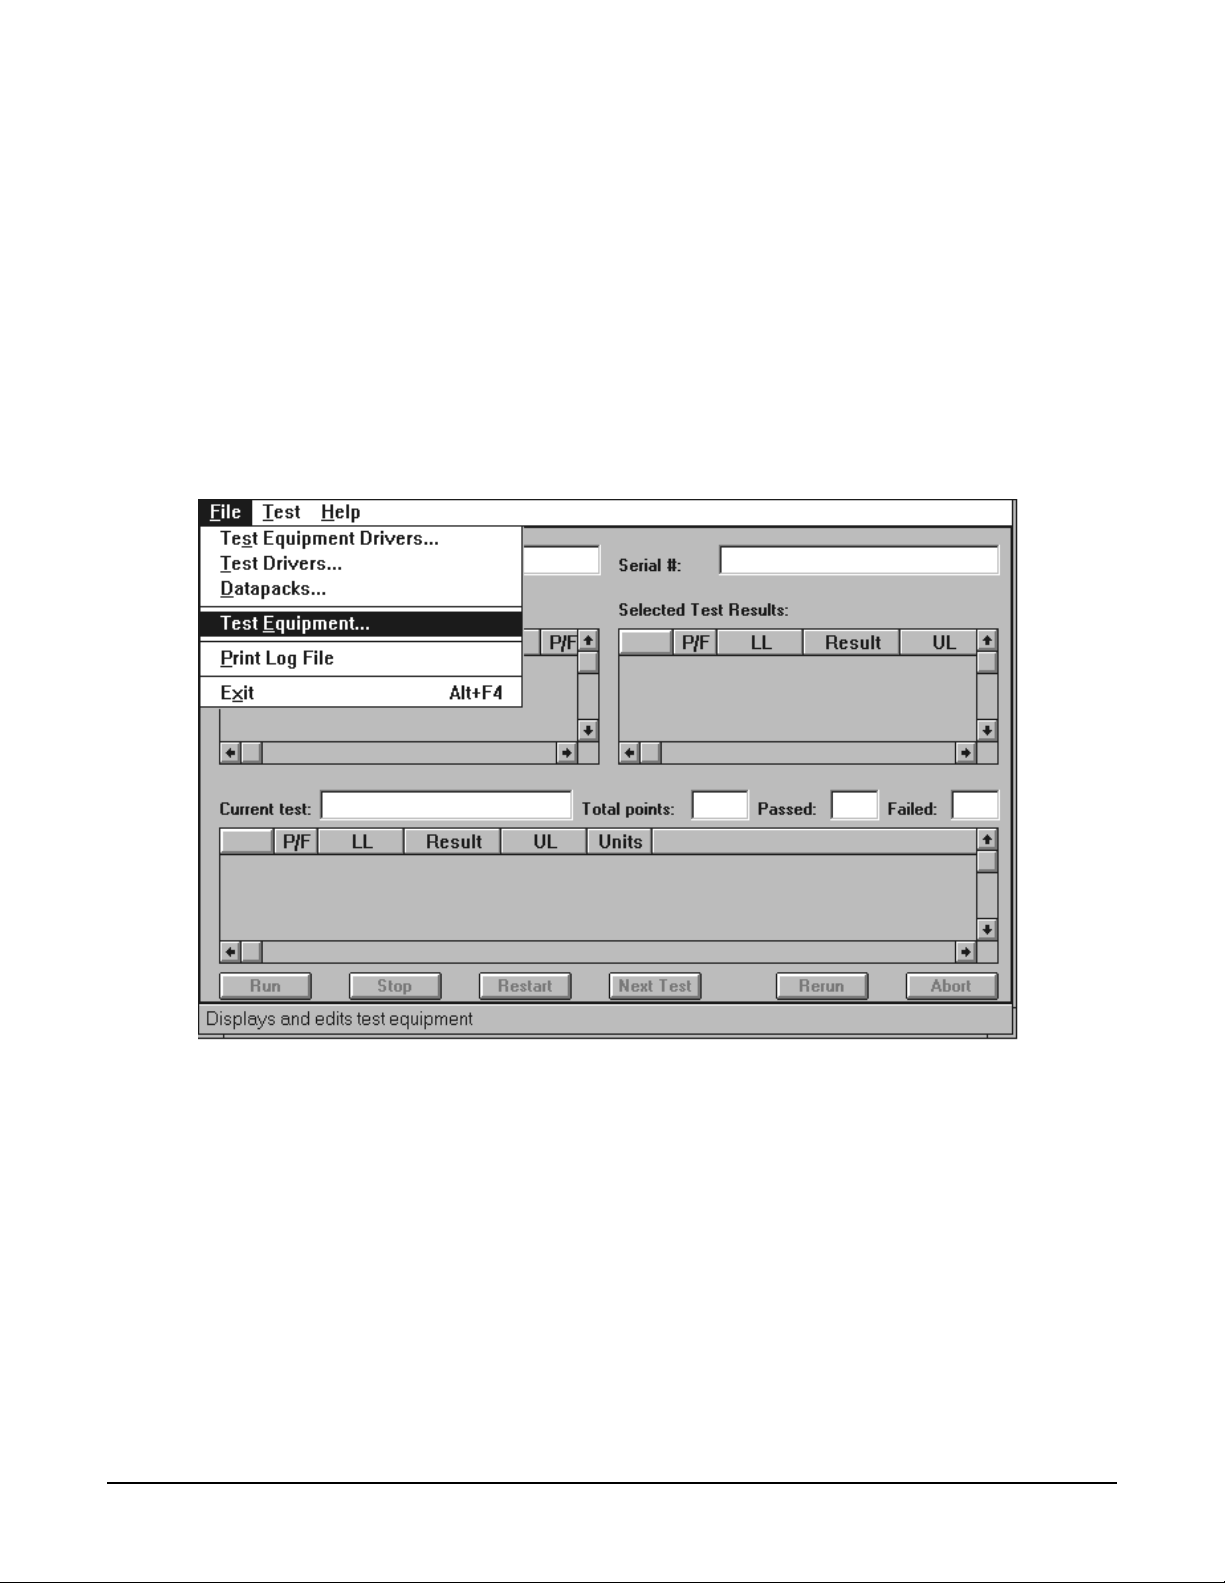
1. Refer to Figure 1-2. In the File drop-down menu, select Test Equipment.
Figure 1-2 Test Equipment in the File Drop-Down Menu
2. Refer to Figure 1-3. In the Test Equipment dialog box, select the Device Type for the new equipment you
are adding.
1-9
Page 20

Getting Started
Administration of Service Suppor t Sof tw are
Figure 1-3 Adding Test Equipment Using the Test Equipment Menu
3. Select the model of the device.
4. Click Add.
1-10
Page 21

Getting Started
Administration of Service Support Software
5. In the New Test Equipment window (refer to Figure 1-4), enter the follo win g p ara m et ers into th e
appropriate box:
Serial Number of the new equipment.
GPIB Address of the new equipment. This address must be in the range of 0 through 31 and it should
not conflict with any other instrument address already present in the test setup.
NOTE The power sensor must be assigned GPIB address −1 (negative 1).
Cal Due Dat e the projected calibration due date of the new equipment.
Trace Number the calibration tracking nu m b er. This is the last required item.
Calibration Type (optional) is used only whe n spe cial ca libr atio n data is associated with the dev ice
being added, and on l y a s a functi on setup by the factory for equipment r eq uir i ng s pecific
calibration data. The only devic e s currently requiring th is feat ur e are po wer se n sors.
Table 1-2 is an example of the calibration information required to ensure accuracy for
measurements using the power sensor. This window is accessed for data entry by
selecting the wor d s CAL D ATA from the Ca libr atio n T ype field in the Edit or New Test
Equipmen t wind o w, Figure 1-4.
Table 1-2 An Example of Calibration Data for Power Sensors
Frequency (MHz)
0.1000 97.6
0.3000 98.9
1.0 99.1
3.0 99.4
NOTE If an Agilent E9304A power sensor is used, the power sensor calibration is automatically
loaded into the power meter and a calibration data table is not used.
Calibration
Factor (%)
1-11
Page 22

Getting Started
Administration of Service Suppor t Sof tw are
Figure1-4 Adding the Equipment Information Using the New Test Equipment Window
6. Click OK.
NOTE The serial number of the test equipment added will be displayed in the Equipment field of the
Test Equipment dialog box (Figure 1- 3 ).
Removing Test Equipment
Removal of test equipment is accomplished using the Test Equipment dialog box. Refer to Figure 1-5.
1. Select the Devic e Type of th e test eq ui pme n t to be remove d .
1-12
Page 23

Getting Started
Administration of Service Support Software
Figure 1-5 Removing an d Editi ng Test Equipme nt Using the Test Equipmen t Window
2. Select the model of the test equipment to be removed from the Models field.
3. Select the serial number of the test equipmen t to be removed from the Equipment field .
4. Click Remove.
5. Click Close.
Editing Test Equipment
Editing test equipment parameters is accomplished using the Test Equipment dialog box. Refer to Figure 1-5.
1. Select the Devic e Type of th e test eq ui pme n t to be edite d.
2. Select the model of the test equipment to be edited from the Models field.
3. Select the serial number of the test equipmen t to be edited.
4. Click Edit. The Edit Test Equipment window will appear. Change the field parameters as necessary.
5. Click OK to save the changes and clos e the wind ow.
6. Click Close in the Test Equipment window.
1-13
Page 24

Getting Started
Administration of Service Suppor t Sof tw are
Adding Device Drive rs
Follow these instructions to add test equipment device drivers to the program:
CAUTION This and the following procedures: Adding/Removing D evice (Test Equipment) Drivers,
Adding/Removing Test Drivers, and Adding/Removing Datapa cks are included for
informational purpos es. These procedures should only be used when instructions are provided
describing whi ch drivers or datapacks need replacement or removal.
1. Log into the sof tware no r m ally un til the Select Test Equipment and Tests window is disp laye d.
2. Click the Cance l bu tto n t o clos e t he Sel ect Test E q u i p men t a n d Tests w i ndow.
3. Refer to Figure 1-6. In the File drop-down menu, select Test Equipment Drivers.
Figure 1-6 Test Equipment Drivers in the File Drop-Down Menu
This selection allows for the addition or removal of software drivers for the test equipment being used to
verify the performance of the DUT.
4. To add a device driver to the existing list of test e quip me nt drivers, click the Add button (Figure 1-7).
1-14
Page 25

Administration of Service Support Software
Figure 1-7 Addin g a Device Drive r Using the Test Equi pment Drivers Window
Getting Started
5. Refer to Figure 1-8. Using the standard file search procedure, select the driver that you are adding and
click OK.
Figure 1-8 Using the Open Dialog Box to Se arch for a Device Driver Fi le to Add
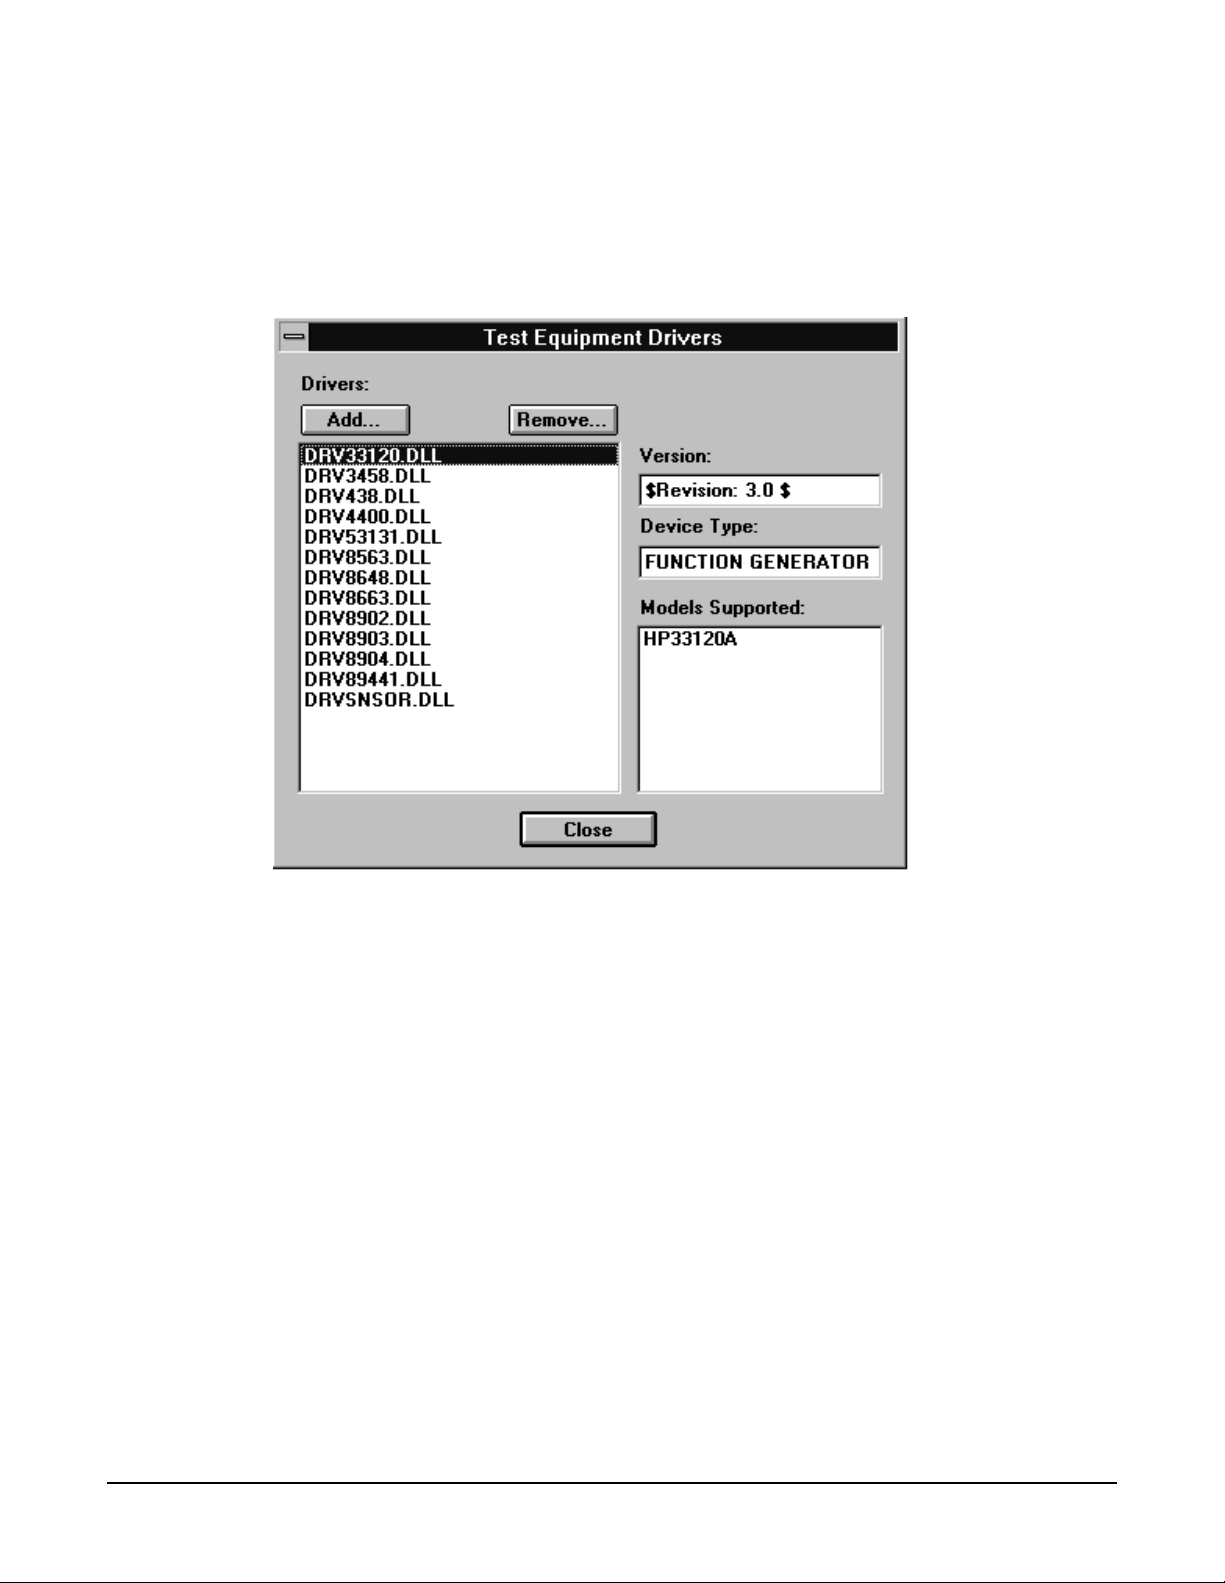
The selected driv e r shou ld now be display ed in th e Test Equipment Driv er s dialo g box,
as seen in Figu re 1- 9.
1-15
Page 26
Getting Started
Administration of Service Suppor t Sof tw are
Removing Device Drivers
Removing device drivers is accomplished using the Test Equipment Drivers dialog box. Refer to Figure 1-9.
1. Select the driver (.dll) file to be remo v ed.
Figure 1-9 Remov ing a Device Driver Using the Test Equip ment Drivers Window
2. Ensure that th e infor m ation displayed in the Version, Device Type, and Models Su ppo r ted fields ref lec ts
the correct info rmation for the se lecte d d riv er b eing re mo ve d.
3. Click Remove.
4. Click Close.
Adding Test Drivers
Adding software dri ve rs is ac com p lish e d using the Test Drivers window.
1. Refer to Figure 1-10. In the File drop-down menu, select Test Drivers.
1-16
Page 27

Figure 1-10 Test Drivers in the File Drop-Down Menu
Getting Started
Administration of Service Support Software
2. Refer to Figure 1-11. To add a test driver to the existing list of test d riv ers, click Add.
Figure 1-11 Adding a Test Driver Using the Test Drivers Window
1-17
Page 28

Getting Started
Administration of Service Suppor t Sof tw are
3. Refer to Figure 1-12. Using th e sta ndard file search proce dur e, selec t the te st drive r that yo u are adding
and click OK.
Figure 1-1 2 Using the Open Dialog Box to Se arch for a Test Driver File to Add
The selected driv e r shou ld now be display ed in th e Test Drivers dialog box, as se en in Figure 1-11.
4. Click Close (Figure 1-11).
1-18
Page 29

Administration of Service Support Software
Removing Test Drivers
Removing test drivers is accomplished using the Test Drivers dialog box. Refer to Figure 1-13.
1. Select the driver (.dll) file to be removed.
Figure 1-13 Removing a Test Driver Using the Test Drivers Window
Getting Started
2. Ensure that th e infor m ation displayed in the Version, Required Devic es, and Tests Supported field s
reflects the correct information for the selected driver being removed.
3. Click Remove.
4. Click Close.
Adding Datapacks
Adding datapacks for test procedures is accompli shed usi ng the Datapacks di alog bo x.
1. Refer to Figure 1-14. In the File drop-down menu, select Datapacks.
1-19
Page 30

Getting Started
Administration of Service Suppor t Sof tw are
Figure 1-14 Datapacks in the File Drop-Down Menu
2. Refer to Figure 1-15. To add a datapack to the existing list of datapacks, click A dd.
Figure 1-15 Adding a Datapack Using the Datapacks Window
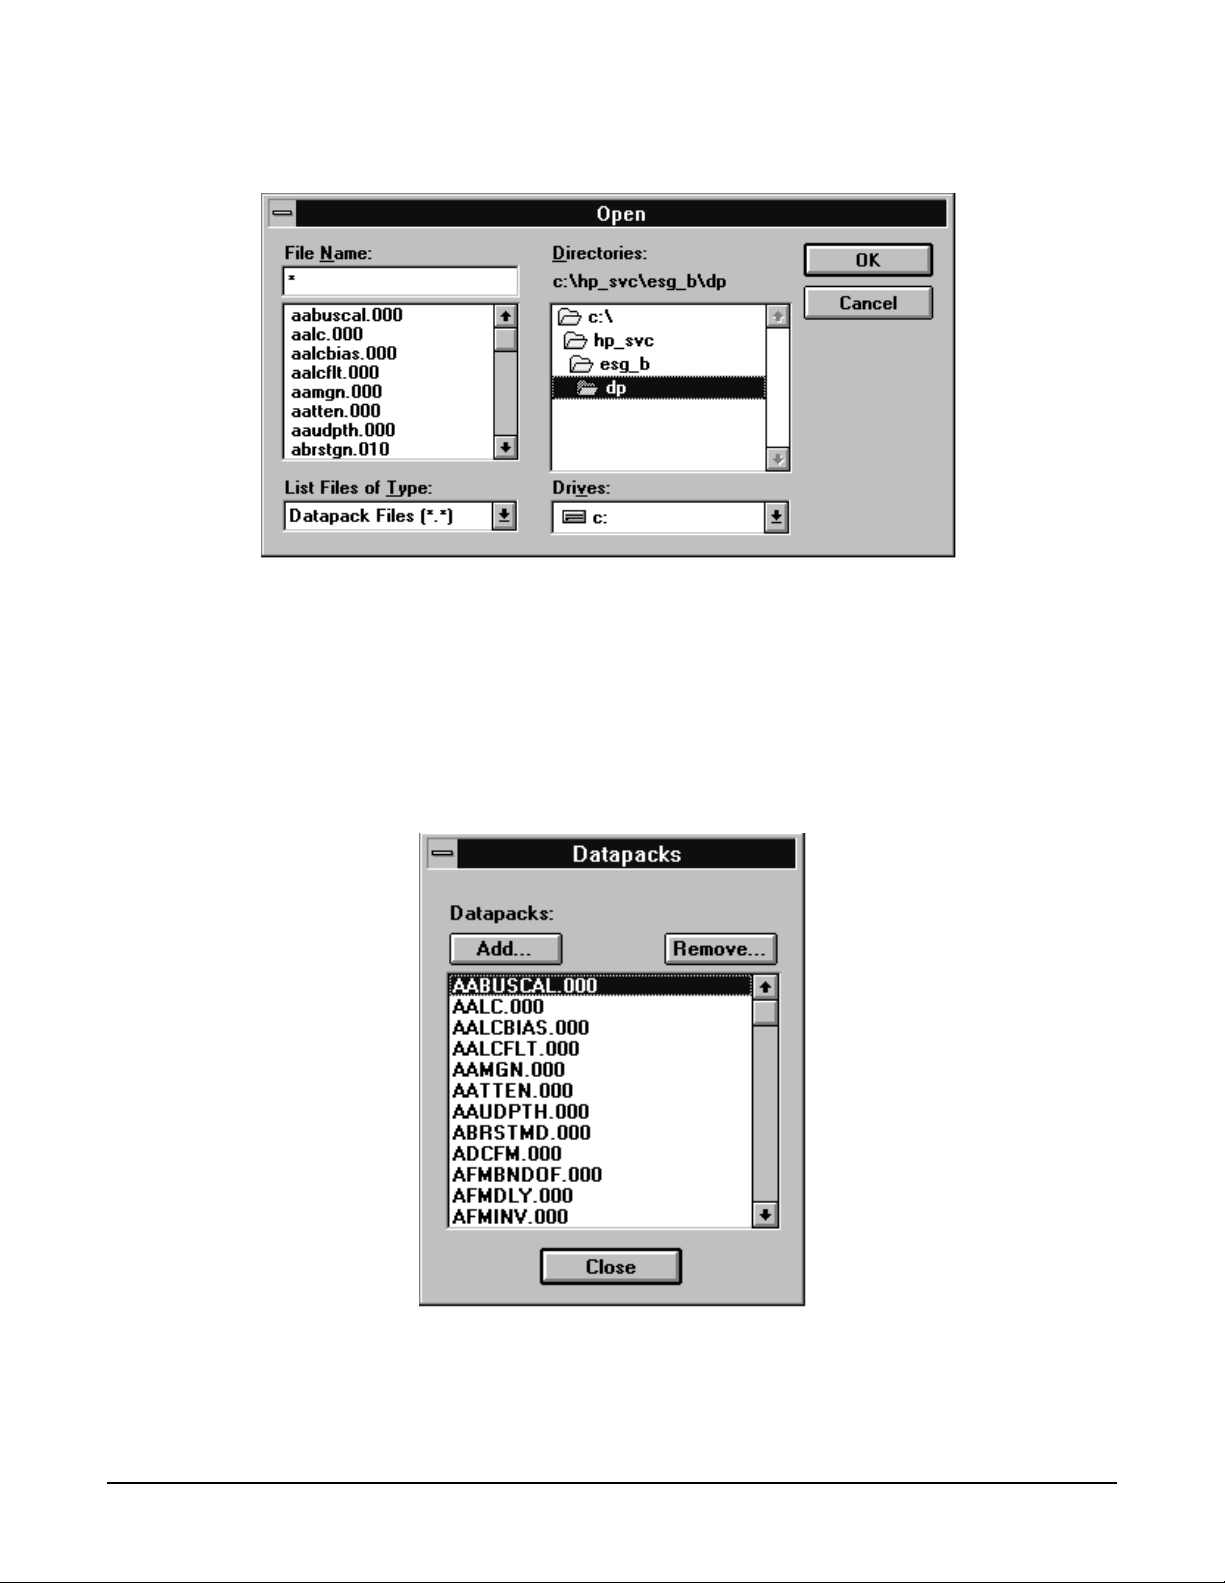
3. Refer to Figure 1-16. Using the sta nda r d file se arc h pro ced ur e, selec t the da tapa ck that you are adding
and click OK.
1-20
Page 31
Administration of Service Support Software
Figure 1-1 6 Using the Open Dialog Box to Se arch for a Datapack File to Add
The selected driv e r shou ld now be display ed in th e Da tap acks d ialo g box, as seen in F igu re 1-15.
4. Click Close (Figure 1-15).
Getting Started
Removing Datapac ks
Removing dat ap acks is accompl ishe d using the Datap ack s d ialo g bo x. Refe r to Figu re 1-17.
1. Select the datapack (.000) file to be removed.
Figure 1-17 Removing a Datapack Using the Datapacks Window
2. Click Remove.
3. Click Close.
1-21
Page 32

Getting Started
Running Service Supp ort Softw are
Running Service Support Software
Starting the Sof t wa re
1. Start the service support software using the steps appropriate for the version of MS Windows that is
installed on your PC.
• For MS Windows 95:
a. Select Start.
b. Select Agilent Service Support for PC’s.
c. Select Agilent Service Software.
• For MS Windows version 3.x:
a. Open the Program Manager window.
b. Open the Agilent Service Support program gr oup .
c. Select the Agilent Service Suppo rt icon .
2. Once the User Information dialog box is displ a y ed, enter the user name and the password.
a. In the User Name box, enter User. (Case sensitive.)
b. In the Password box, enter User. (Cas e sensitive.)
c. Click OK.
1-22
Page 33

Identifying the DUT
When the DUT Selection dialog box is displayed,
1. Make sure that ESG_C is selected in the Selec t An Instrument Family list.
Getting Started
Running Service Support Software
2. In the Select Model list, select the signal generator model of the DUT to be adjusted or tested.
3. In the Serial Number box, enter the complete serial number of the DUT.
4. In the Address box, enter the two-digit GPIB address of the DUT. (To display the address on the signal
generator, press
5. Select the OK but ton.
Utility > GPIB/RS-232. The GPIB Address softkey shows the current add ress.)
1-23
Page 34

Getting Started
Running Service Supp ort Softw are
Selecting Performance Tests, Adjustments, and Test Equipment
When the Select Test Equipmen t a nd Tests window is d isplaye d ,
1. Se l e ct either the Perfor mance Tests radio button to display the list o f auto m ate d per f orm ance tests or
the Adjustments radio button to d isplay the list o f auto m ate d ad justments.
2. From the list of perfo r m anc e tests or adjustmen ts, sele ct the te sts or adjustm ents that will be performed
on the DUT. Select a test name by clicking on it (the DCFM Frequency Offset Relative to CW test will be
selected for th e sec tions following). The sele ct ed te st wi ll be hig hlig hted.
Select all of the performance tests or adjustments by selecting the Select All button. Unselec t all of the
sele c ted tests o r adjustmen ts by choosing the Unselec t button.
As each test or adjustment is selec t ed, the te st eq uipment required to perform the test or adjustment is
listed in the Required Test Equipment box. As each test or adjustment is removed from the list, the test
equipment required to perform the test or adjus tme nt is removed from the li st. Onl y the test equipme nt
for the highlighted tests is displayed in the list.
3. Once the test is highlighted, iden tify all te st e qui p m en t listed in the Re quir e d Test Equipmen t box . To
identify test equipment:
a. Select the type of device from the Device Type list.
b. Select the model number from the Model list for the device.
c. Select the device’s serial numbe r from the A v a i labl e Test Equipment list.
d. Select the Add button to add the de vic e to the list in th e Selec ted Test Equipment box .
The following buttons are ava ilab l e for t he Select ed Test Equipment box:
Add Copies the tests and adjustments highlighted in the Available Test Equipment box to
the Selected Test Equipment box.
Remove Removes the highlighted test equipment from the Selected Test Equipment box.
Clear Removes all of the test equipment from the Selected Test Equipment box.
1-24
Page 35

Getting Started
Running Service Support Software
NOTE If necessary, the test equipment GPIB address can be changed after it is added to the Selected
Test Equipment box. Change the GPIB address by pressing the right arrow on the keyboard
until the GPIB ad d ress se lection in the Select ed Test Equipm e nt box is se le ct ed. (Th e GPI B
address is s elected when it has a dark box around the selection.) Then, type the new GPIB
address and press Enter to change the address.
e. Repeat the previous steps for each test equipment instrument.
4. Once the tes t equipment has been i denti fi ed, select the Add bu tton locat ed above the Selec ted T es ts box to
add each of the highlighted performance tes ts or adju stmen t s. The tests or adjustments that were
highlighted are now displayed in the list in the Selected Tests box.
The followin g butt on s are available for the Selected Tests box:
Add Copies the t ests and adjustments highlighted in the list of tests and adjustments to the
Selected Tests box.
Remove Removes the highlighted tests and ad ju stm e n ts fro m the Se lecte d Tests box.
Clear Removes all of the tests and adjustments from the Se le cted Tests box.
5. If the appropriate tests or adjustments are listed in the Selected Tests box and the appropriate test
equipme nt is listed in th e Sele ct ed Test Equipm e nt box, se le ct th e OK button.
1-25
Page 36
Getting Started
Running Service Supp ort Softw are
Defining the Location where Test Results are Saved
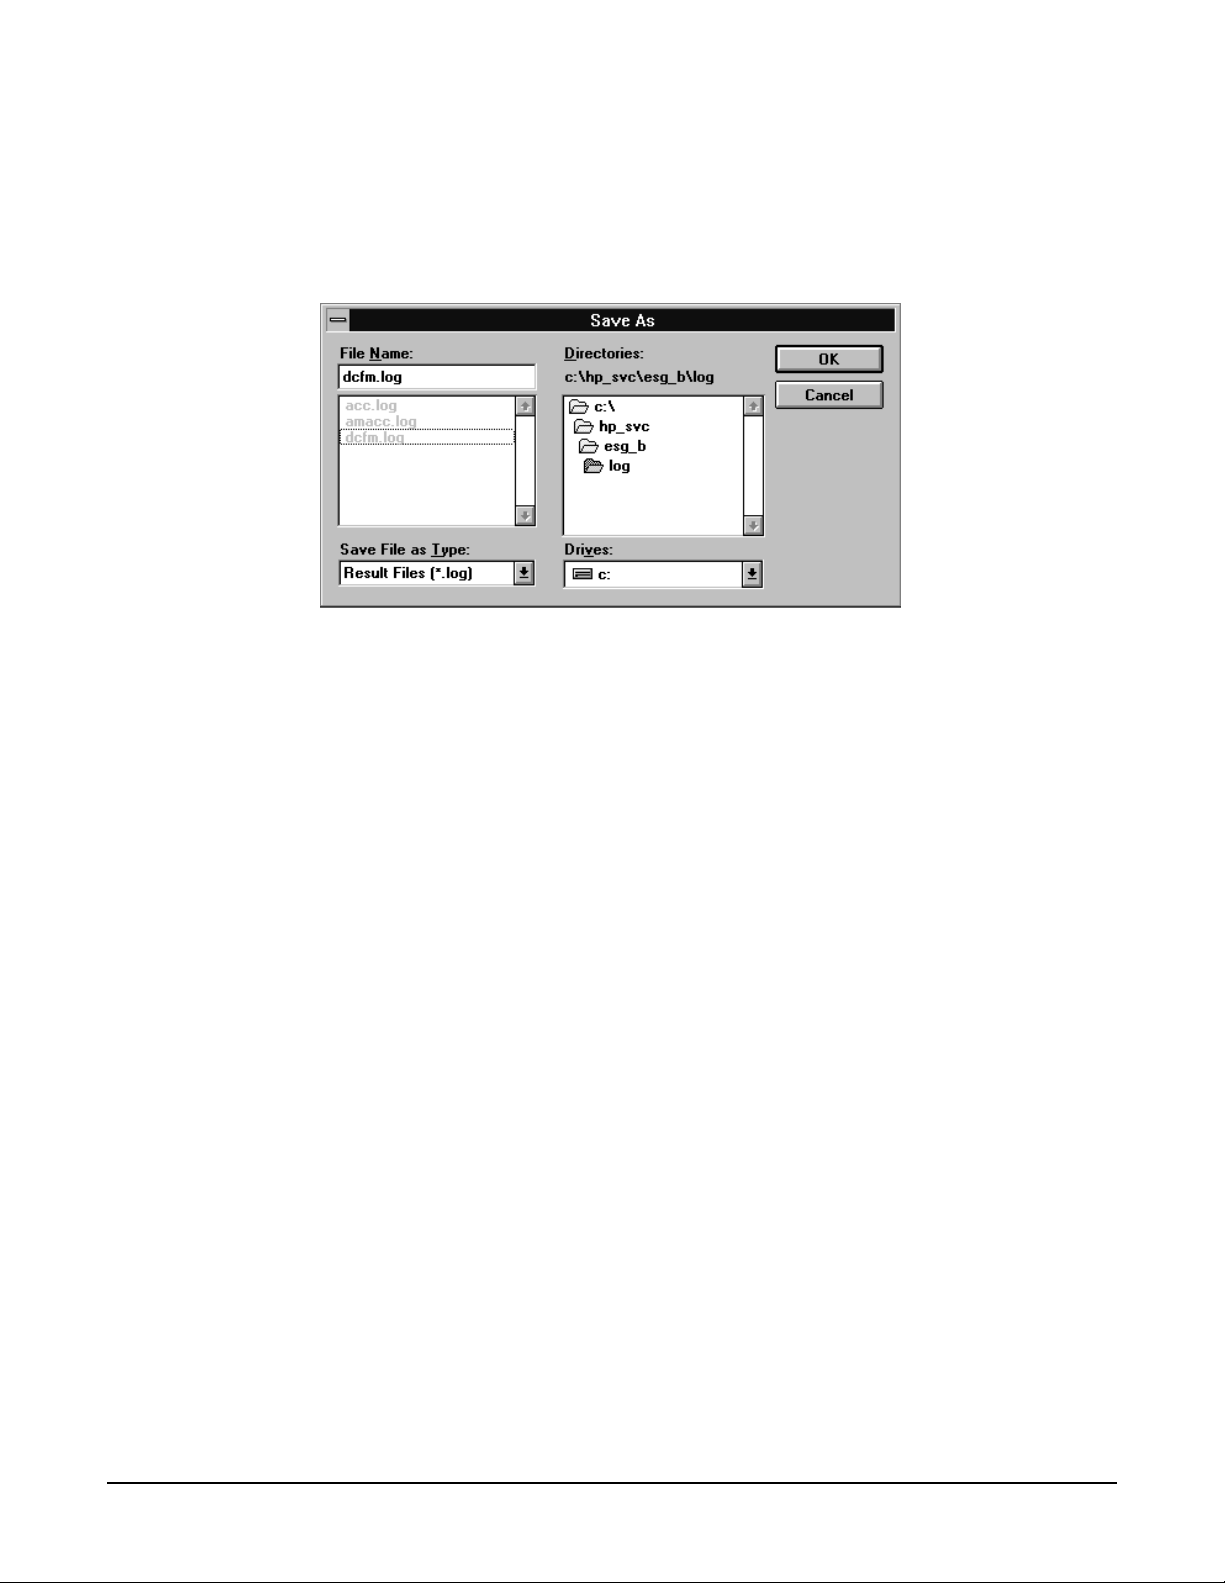
1. When the Save As dialog box is displayed, select the File Name box and enter the file name into which you
would like to save the test results.
The results file name suffix is.log. The results are saved automatically to the.log file. You may select the
directory into wh ich yo u wou ld like to sav e the file by cha ngin g the drive and folder in this window. This
file is a text file and can be viewed using many text editors. Notepad, a standard accessory in MS
Windows, is an example of a text edito r that can be used to view text files.
2. Once you have selected the drive, folder, and assigned a file name, select the OK button to save these
settings for when the tests are comp le te.
1-26
Page 37
Running the Tests and Adjustments
Once the Agilent Service Support Software window is displayed:
Getting Started
Running Service Support Software
1. Select the Run button to star t the auto m ated tests or adjustm ents displayed in the Se lecte d Tests box.
The software ste p s thr o ug h the te sts o r adjustments se que n tially.
2. Follow the instruction s disp laye d on the PC.
A description for each automated performance test or adjustment can be
found in Chapter 3, “Performance Tests,” and Chapter 4, “Adjustments.”
1-27
Page 38

Getting Started
Running Service Supp ort Softw are
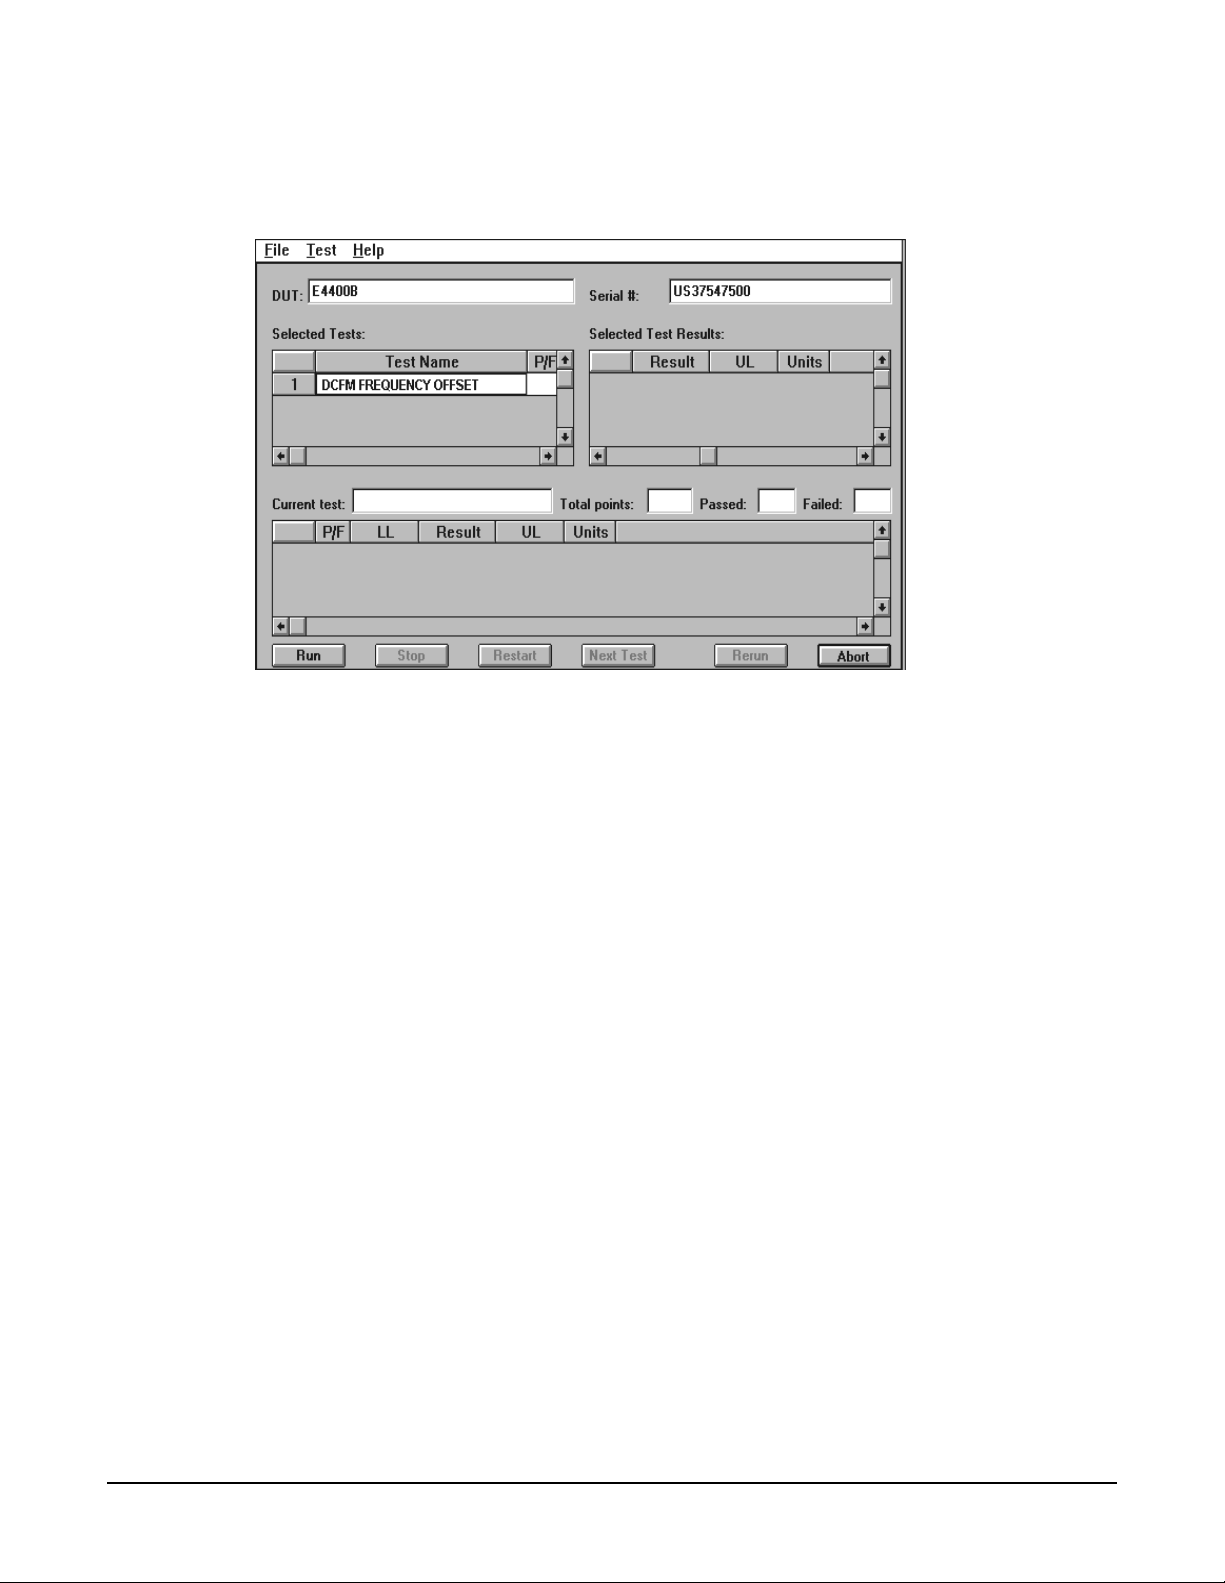
Reviewing the Test and Adjustment Results
Once the tests have finished runnin g, you will want to revie w th e results of the tests. The Agilent Se rv ice
Support Software window displ ays the DUT model number and serial number, the selected tests , the re sul ts
of the selected test , and th e cu rre nt te st in for m atio n. Six buttons, which are us ed to control the testin g, are
also displayed.
The Selected Tests box displays the nam e of the se le cted te sts, the p ass/ fail status (P/F) of each test that has
been run, the total number of points that each test checks, and the number of points that passed and failed for
each test. The pass/fai l statu s indicates a failure if any point in that te st fails.
The Selected Test Results bo x shows the results of the te st that is highlighte d in the Se lecte d Tests box. The
Selected Test Results box shows the pass/fail status (P/F), the lower limits (LL), the measured value (Result),
the upper limits (UL), and the measured units (for example, kHz, mV , or dBm) for each test point checked by
the performan ce te sts and some ad ju stm e nts. “** ” indicates values no t disp laye d by the adjustments.
The Current test box shows the results of the test that is currently running. The Current test box shows the
pass/fail status (P /F) , the lowe r limi ts (LL) , the measu red valu e (Resu lt), th e uppe r limi ts (UL) , and the
measured units (for example, kHz, mV, or dBm) for each test point checked by the performan ce tests and
some adjustments. “**” indicates values not displayed by the adjustments.
The following buttons are also displayed on the Agilent Service Support Software window. These buttons are
used to control the testing. Only the buttons that are appropriate are active. For example, if the test is already
in progress, the Run button would not be active.
Run Start running the highlighted test when initially starting the testing. Also used to start
testing at the same point where the test was stopped.
Stop Stop the test that is cu rren tly run ning. The test stops after mak ing the next measur e m ent.
Restart Rerun a test that was running when the testing was stopped. This restarts the test from the
beginning.
Next Test Quit running the current test and give it a Fail status. Then, continue testing with the next
test.
Rerun Restart the test ing at the beginning of the first test.
Abort Q uit testing. Abort all tests.
1-28
Page 39

Getting Started
Running Service Support Software
Printing the T est and Adjustment Results
Once the tests are comple te, a dial og box is displ ayed th at ask s if you want to prin t the lo g file.
The log file is the file in whic h the te st ( or ad jus tm e nt) re su lts ar e st ore d . Select the Yes bu tton to p rin t the
test results using the printe r connected to LPT1. Cho osing the No butto n allow s yo u to ex it the pro gr am
without printin g the te st results.
There are two other methods of printing the test resu l ts.
The first method is sele cti ng the Print Log File selec tio n fro m the File d rop -d ow n m enu. The software asked
you to define the computer path and file name when the tests were performed. The default directory is the
“log” subdirectory of the destination directory where you installed the software. (C:\HP_SVC\ESG_C\ was
the default destination directory.)
The second alternative method of printing is opening the fil e in a text editor and printing the file in the text
editor.
Exiting the Software
Exit the software by selecting Exit from the file drop-down menu.
Pressing Alt-F4 on the keyboard is an alternate method of exiting the software.
1-29
Page 40

Getting Started
Running Service Supp ort Softw are
1-30
Page 41

2 Required Equipment
2-1
Page 42

Required Equipment
This section lists the test eq uipmen t needed to run perfor manc e test s and adjust ments, any critical
specification requirements, and recommended model numbers. The computer and all test equipment are
connected to the device under test (DUT) using GPIB.
CAUTIO N In all test equipment configu ra tio ns, cables and adapter s ne ed to be properly to rq ued .
Exceeding recommended torque values may cause damage to a cable or adapter and may cause
inaccurate test results.
Connector Type Torque Value
APC 3.5 Use an Agilent 8710-1765 at 8-lb inch when
connecting APC 3.5 (m) to APC 3.5 (f).
SMA Use an Agilent 8710-1765 at 8-lb inch when
connecting APC 3.5 (m) to SMA (f).
Use an Agilent 8710-1582 at 5-lb inch when
connecting SMA (m) to APC 3.5 (f).
Type-N Type-N connectors may be connected finger tight. If a
torque wrench is used, Agilent 8710-1766 at 12-lb inch
is recommended.
NOTE
• All test equipment requires a 30 minute warm-up period to ensure accurate performance.
• Models for each Test Equipment category are given in order of preference. Alter nate or
substitute models are listed after the preferred model, but should be considered as a lower
priority.
• It is recommended that all am plif iers be placed in e nclos ures. This should help reduce the
effect of signals radiating into adjacen t equ ip m e nt. It is also reco m m e n ded that amplifiers
are not physically positioned close to equipment that can radiate low-level RF signals.
2- 2
Page 43

Table 2-1 Required Equipment
Required Equipment
Test Equipment Preferred Model
or Alternate Model
Power Meter Agilent E4418B E-Series
power meter,
or Agilent E4419A/B E-Series
power m e t e r
Pow er Se ns or,
Input: Type-N (m)
Spectrum Analyzer,
Input: Type-N (f)
Agilent E9304A E-Series
power sensor
The Agilent 8482A power
sensor can be used in place of
the Agilent E9304A E-Series
power sensor in some
performance tests and some
adjustments.
Agilent 8563/64/65EC
Option 001 and K35
spectrum ana lyz e r
Critical Spec ifications
The power me ter and the
signal generato r n eed to be
plugged into the same ac
power circuit. The power
meter also need s to be
conn e cted to the signal
generator wi th a m inim u m
length (18") GPIB cable.
9 kHz to 6 GHz,
−70 to +20 dBm
100 kHz to 4.2 GHz,
−30 to +20 dBm
This power sen sor is no t an
alternate model because some
performance tes ts can not use
the Agilent 8482A power
sensor.
9 kHz to 6 GHz
or Input: 2.4 mm (m)
Option 001
Output: APC 3.5 (f)
Option 007
Output: APC 3.5 (f)
Option K35
Input: SMA (f),
Output: SMA (f)
WCDMA Test Set,
RF Input: Type-N (f),
LO Input: SMA (f),
IF Output: SMA (f)
or Agilent 8563/64/65E
Option 001, 007, and K35
spectrum ana lyz e r
Option 001 adds a Second IF
Output
Option 007 adds digitized fast
time domain sweep; this
functionality has been
incorporated int o the
Agilent 8563/64/65EC
spectrum ana lyz e r.
Option K35 is required only
when adjusting “WCDMA
Adjacent Channel Power
(Option 400)” on page 3-34
Agilent Option K35 WCDMA
test set
2-3
Page 44

Required Equipment
Table 2-1 Required Equipment
Test Equipment Preferred Model
or Alternate Model
Function Gen erato r,
Output: BNC (f)
Function Gen erato r,
Output: BNC (f)
Frequency C o unter,
Channel 1: BNC (f)
Channel 2: BNC (f)
Channel 3: Type-N (f)
Frequency Stan d ard ,
Output: BNC (f)
Vector Signal An alyze r,
Input: Type-N (f)
Output: BNC (f)
Agilent 8904A function
generator
Agilent 33120A function
generator
Option 001 is required only
when testing “Digital
Modulation Level Accu rac y”
on pa g e 3 - 27.
Agilent 53132A Option 050
freq uency counter
Option 050
adds Channel 3 (5 GHz)
Use a 10 MHz house
standard. (For example, an
Agilent 5071A primary
frequency standard or
equivalent can be used.)
Agilent 89441A vector sign al
analyzer with Optio ns AYA,
AYH, AY 7, AY9, B7A, and
UFG or UTH.
Critical Spec ifications
Two Required
The frequency counter must
be plugged into the ac power
line for at least 24 hours
before testing begins .
2- 4
Option AYA adds vector
modulation analysis.
Option AYH adds digital
video modulation analysis.
Option AY7 adds second
10 MHz input channel.
Option AY9 adds extended
time capture memory
to 1 MSample.
Option B7A adds EDGE to
the vector modulation
analysis that is added by
Option AYA.
Option UFG adds ex te nde d
RAM and additional I/O.
Option UTH adds extended
RAM and additional I/O.
Page 45

Table 2-1 Required Equipment
Required Equipment
Test Equipment Preferred Model
or Alternate Model
Baseband Generator Agilent E4438C
ESG vector sign al gene r ato r
with Option 001 or 002,
or
Agilent E4430B thru E4437B
ESG-D Series sign al
generator wit h Op tion U N 8
Digital Multimete r,
Input: Dual Banana Plug
Digital Oscillosco p e,
Input: BNC (f)
Measuring Receiver,
Input: Type-N (f)
Audio Analyzer,
Input: BNC (f)
Agilent 3458A Option 002
digital multimeter
Option 002 adds a High
Stability Timebase
Agilent 54610B
digital oscilloscope
Agilent 8902A
measuring receiver
Agilent 8903B audio analyzer
with Options 010 and 051
or Options 011 and 050
Critical Spec ifications
20 Hz to 100 kHz
Power Supply Use any generi c power s upply
capable of supplying +15 Vdc
@ 300 mA.
Low Frequency LNA,
Input: BNC (f)
Output: BNC (f)
High Freque nc y L N A ,
Input: APC 3.5 (f)
Output: APC 3.5 (f)
Advance Control Components
W50ATC low frequen cy
low-noise amplifie r (LNA )
Advance Control Components
20 Meridian Road
Eatontown, NJ 07724
Phone: (732) 460-0212
FAX: (516) 460-0214
MITEQ Inc.
AFS3-00010300-18-5P-4 high
frequency low noise amplifier
(LNA)
MITEQ Inc.
100 Davids Drive
Hauppauge, NY. 11788
Phone: (516) 436-7400
FAX: (516) 436-7430
+15 Vdc @ 300 mA
Frequency R ange:
100 kHz to 500 MHz
(The LNA is only use d up to
10 MHz.)
Gain: 50 dB
Noise Figure: 1.85 dB
1 dB compression minimum:
+5 dBm
Frequency R ange:
50 MHz to 3 GHz (Only used
up to 2 GHz)
Gain: >56 dB (Total gain with
two amplifiers cascaded)
Noise Figure: 1.8 dB
1 dB compression minimum:
+10 dBm
2-5
Page 46

Required Equipment
Table 2-1 Required Equipment
Test Equipment Preferred Model
or Alternate Model
Phase Noise System,
Input: APC 3.5 (m)
Reference Source,
Output: Type-N (f)
Mixer (0.5 to 9 GHz),
Connectors: SMA (f)
Agilent E5502B Option 001
phase noise syste m with
Option 401
or Option 402 added
Option 401 adds an
Agilent 8662A
high-performance RF signal
generator
Option 402 adds an
Agilent 8663A
high-performance RF signal
generator
Agilent 8662A/8663A
high-performance RF signal
generator
MD/MDC-164 Mixer
M/A COM INC.
DIV of AMP INC.
1011 Pawtucket Blv.
Lowell, MA 01853
Phone: (800) 366-2266
Critical Spec ifications
Only required for
Options UNJ and 506.
0.5 to 9 GHz
Mixer (1.0 to 2.8 GHz),
Connectors: SMA (f)
10 dB Attenuator,
Type-N (f) to (m)
20 dB Attenuator,
Type-N (f) to (m)
Step Attenuator,
Input: Type-N (f)
Output: Type-N (f)
Step Attenuator Driver Agilent 11713A
Step Attenuator Driver
Cable
MD/MDC-174 Mixer
M/A COM INC.
DIV of AMP INC.
1011 Pawtucket Blv.
Lowell, MA 01853
Phone: (800) 366-2266
Agilent 8491A/B Option 010
fixed attenuator
Agilent 8491A/B Option 020
fixed attenuator
Agilent 8495G programmable
step attenuator
step attenuator driver
Agilent 8120-2703
step attenuator driver cable
1.0 to 2.8 GHz
10 dB, dc to 6 GHz
20 dB, dc to 6 GHz
0 to 70 dB
2- 6
Page 47

Table 2-1 Required Equipment
Required Equipment
Test Equipment Preferred Model
or Alternate Model
Cable,
APC 3.5 (m) to (m)
Cable,
BNC (m) to (m)
Cable,
Type-N (m) to (m)
Adapter,
BNC Tee (m) (f) (f)
Adapter,
BNC (f) to BNC (f)
Adapter,
BNC (f)
to Dual Banana
Adapter,
BNC (f)
to Type-N (m)
Agilent 8120-4921
APC 3.5 (m) to (m) c abl e
Agilent 8120-1840
BNC (m) to (m) cable
or Agilent 10503A
BNC (m) to (m) cable
Agilent 11500A
Type-N (m) to (m) cable
Agilent E9625A
BNC Tee (m) (f) (f) adapter
Agilent 1250-0080
BNC (f) to BNC (f) adapter
Agilent E9637A
BNC (f) to dual banana
adapter
Agilent 1250-0780
BNC (f) to Type-N (m)
adapter
Critical Spec ifications
1 meter cable length
48 inch cable length
Adapter,
BNC (f) to SMA (m)
Adapter,
BNC (m) to SMA (f)
Adapter,
BNC (m)
to Mini-Grabbers
Agilent 1250-1200
BNC (f) to SMA (m) adapter
or Agilent E9631A
BNC (f) to SMA (m) adapter
Agilent 1250-2015
BNC (m) to SMA (f) adapter
Agilent 8120-2337
BNC (m) to mini-grabbers
adapter
2-7
Page 48

Required Equipment
Table 2-1 Required Equipment
Test Equipment Preferred Model
or Alternate Model
Adapter,
APC 3.5 (m) to (m)
Adapter,
APC 3.5 (f) to (f)
Adapter,
APC 3.5 (m)
to Type-N (m)
Adapter,
APC 3.5 (f)
to Type-N (m)
Adapter,
APC 3.5 (f)
to Type-N (f)
Digital Test Card Agilent E4400-60073
Agilent 1250-1748
APC 3.5 (m) to (m) adapter
Agilent 1250-1749
APC 3.5 (f) to (f) adapter
Agilent 1250-1743
APC 3.5 (m) to Type-N (m)
adapter
Agilent 1250-1744
APC 3.5 (f) to Type-N (m)
adapter
Agilent 1250-1745
APC 3.5 (f) to Type-N (f)
adapter
digital test card
Critical Spec ifications
2- 8
Page 49

3 Performance Tests
3-1
Page 50

Performance Tests
Overview of Performance T ests
Overvi ew of Performance Tests
In this chapter you will learn about all available performance tests as well as how to run the Service Support
Software to test and verify the performance of the Agilent E4438C ESG vector signal generator. These
performance tests verify that the signal generator meets specifications. Chapter 1, “Getting Started,”
expla ins how to set up the Se rvice Support Sof tware for a particular set of test instruments and interfaced
components in a test environment.
Recommended Calibration Cycle
This inst rument r equires periodic ve ri fi c a ti o n o f performa nc e. U nd e r n o rm al use and env i ro nmenta l
conditions, the instrument sho u ld be calibrat ed every two ye ars. Normal use is de fined as about 2,0 00 hour s
of use per year.
Performance Test Records
Unless stated differently, the Service Supp ort So ftware f or the A gilent E4438C ESG vec to r sign al gene r ato r
can print a test reco rd that con tain s the results of the automate d per for ma n ce te sts. A perfo rmance test
record (located at the end of this chapter) can be photocopi ed for use when performing eac h of the two manual
performance tests for this product.
Recommended Test Equipment
The recommended test equipment table, located in Chapter 2, “Required Equipment,” on page 2-1 is the
complete list of equipment required to perform the procedures in this chapter. Test equipment is also listed
with each test and is shown in the test setup. However, to avo id clutter in the figur es, the cont rolle r req uir ed
to run the Service Supp o rt Sof tware is no t shown in the test setu p for each auto ma ted tes t. The controller
must be connected via GPIB to all of the test equipment in the currently selected automated tests. For
performance tes t s , other equipment can be substituted for the recommended models if it meets or exceeds the
critical specifications listed in Chapter 2, “Required Equipment,” on page 2-1 For the adjustment procedures,
no equipment substitutions are available.
CAUTION In all test e quipm e n t configu rations, cables and adapters need to be prop erly to rq ued .
Exceeding recommended torque values may cause damage to a cable or adaptor and may cause
inaccurate test results.
Table 3-1
Connector Type Torque Value
APC 3.5 Use an Agilent 8710-1765 at 8-lb inch when
connecting APC 3.5 (m) to APC 3.5 (f).
SMA Use an Agilent 8710-1765 at 8-lb inch when
connecting APC 3.5 (m) to SMA (f).
3-2
Use an Agilent 8710-1582 at 5-lb inch when
connecting SMA (m) to APC 3.5 (f).
Type-N Type-N connectors may be connected finger tight. If a
torque wrench is used, Agilent 8710-1766 at 12-lb.
inch is recommended.
Page 51

Performance Tests
Overview of Performance Tests
Performance tests are listed in the order that they should be performed to m inimize
changes in tes t equipm ent configur ations.
Note that all performance tests are not used with all options when testing the
Agilent E4438C ESG vector signal generator.
“Internal FM Accuracy and Distorti on ” on page 3-9
“Internal AM Accuracy and Distortion” on page 3-10
“Phase Modulation A c curac y and Distortion” on page 3-12
“FM Frequency Res ponse” on page 3-13
“AM Fre que nc y R esp o nse” o n p age 3-14
“Phase Modulation Frequency Response” on page 3-16
“DCFM Frequency Offset Relative to CW” on page 3-17
“Residual FM (Not Used with Option UNJ or Option 506)” on page 3-18
“Harmonic, Subharmonic, and Nonh armon ic Spur ious Sig nals ” on page 3-20
“Power Lev el Accurac y” on page 3-21
“Timebase Agin g Ra te (M anu a l Test - Option UNJ, Option 506, or Option 1E5 Only)” on page 3-24
“Digital Modulatio n Le vel Accu ra cy” on page 3-27
“Internal Digital M odu lation Quality (Option 402 On ly)” on p age 3-28
“Custom I/Q RF Modulation Qualit y (Optio n 402 Only)” o n page 3-29
“Pulse Modul ation On/Off Ratio” on page 3-31
“Burst Modu lation On/Off Ratio” on page 3-32
“CDMA Adjacent Channel Power (Not Used with Option UNB or Option 506)” on page 3-33
“WCDMA Adjacent Channel Power (Option 400)” on page 3-34
“Phase Noise and Residual FM (Manual Test - Option UNJ or Option 506 Only)” on page 3-35
“Dual Arbitrary W aveform Generator Check” on page 3-39
“GSM Loopback BER Check (Option 300 Only)” on page 3-41
Service Support Softwa re run s perf orman ce t ests and, wher e applicab l e, generates performance test records
(reports) of the results for the tests . The foll owing manual tests are not listed in the Service Support Software:
• “Timebase Aging Rate (Manual Test - Option UNJ, Optio n 506, or Option 1E5 Only)” on page 3-24
• “Phase Noise and Residual FM (Manual Test - Option UNJ or Option 506 Only)” on page 3-35
3-3
Page 52

Performance Tests
Overview of Performance T ests
Running Performance Tests
1. Loa d the S e rvice Sup p o rt S o f tw are into the pers on a l co mputer. Refer to Chapter 1, “Getting Started,” for
installation in str uct io ns.
2. Click on the installed Se rvice Supp ort Softwar e icon.
3. Fill in the fields in the U ser Info rmation window (Figure 3-1):
a. In the User Name field (item 1), enter User. (Case sensitive.)
b. In the Password field (item 2), enter User. (Case sensitive.)
4. Click OK.
Figure 3-1 The User Information Window
5. In the DUT (Devi ce Under Test) Selection Window (Figure 3- 2 ):
a. In the Select Model list (item 3), choose the correct model number of your signal generator.
b. In the Serial Number box (item 4), enter the complete serial number of the DUT.
c. In the Address box (item 5), enter the tw o-digit GPIB address of th e signal generator. (To display the
address on the signal generator, press
shows the current address.)
6. Click OK.
Utility > GPIB/RS-232 > GPIB Address. The GPIB Address softkey
3-4
Page 53
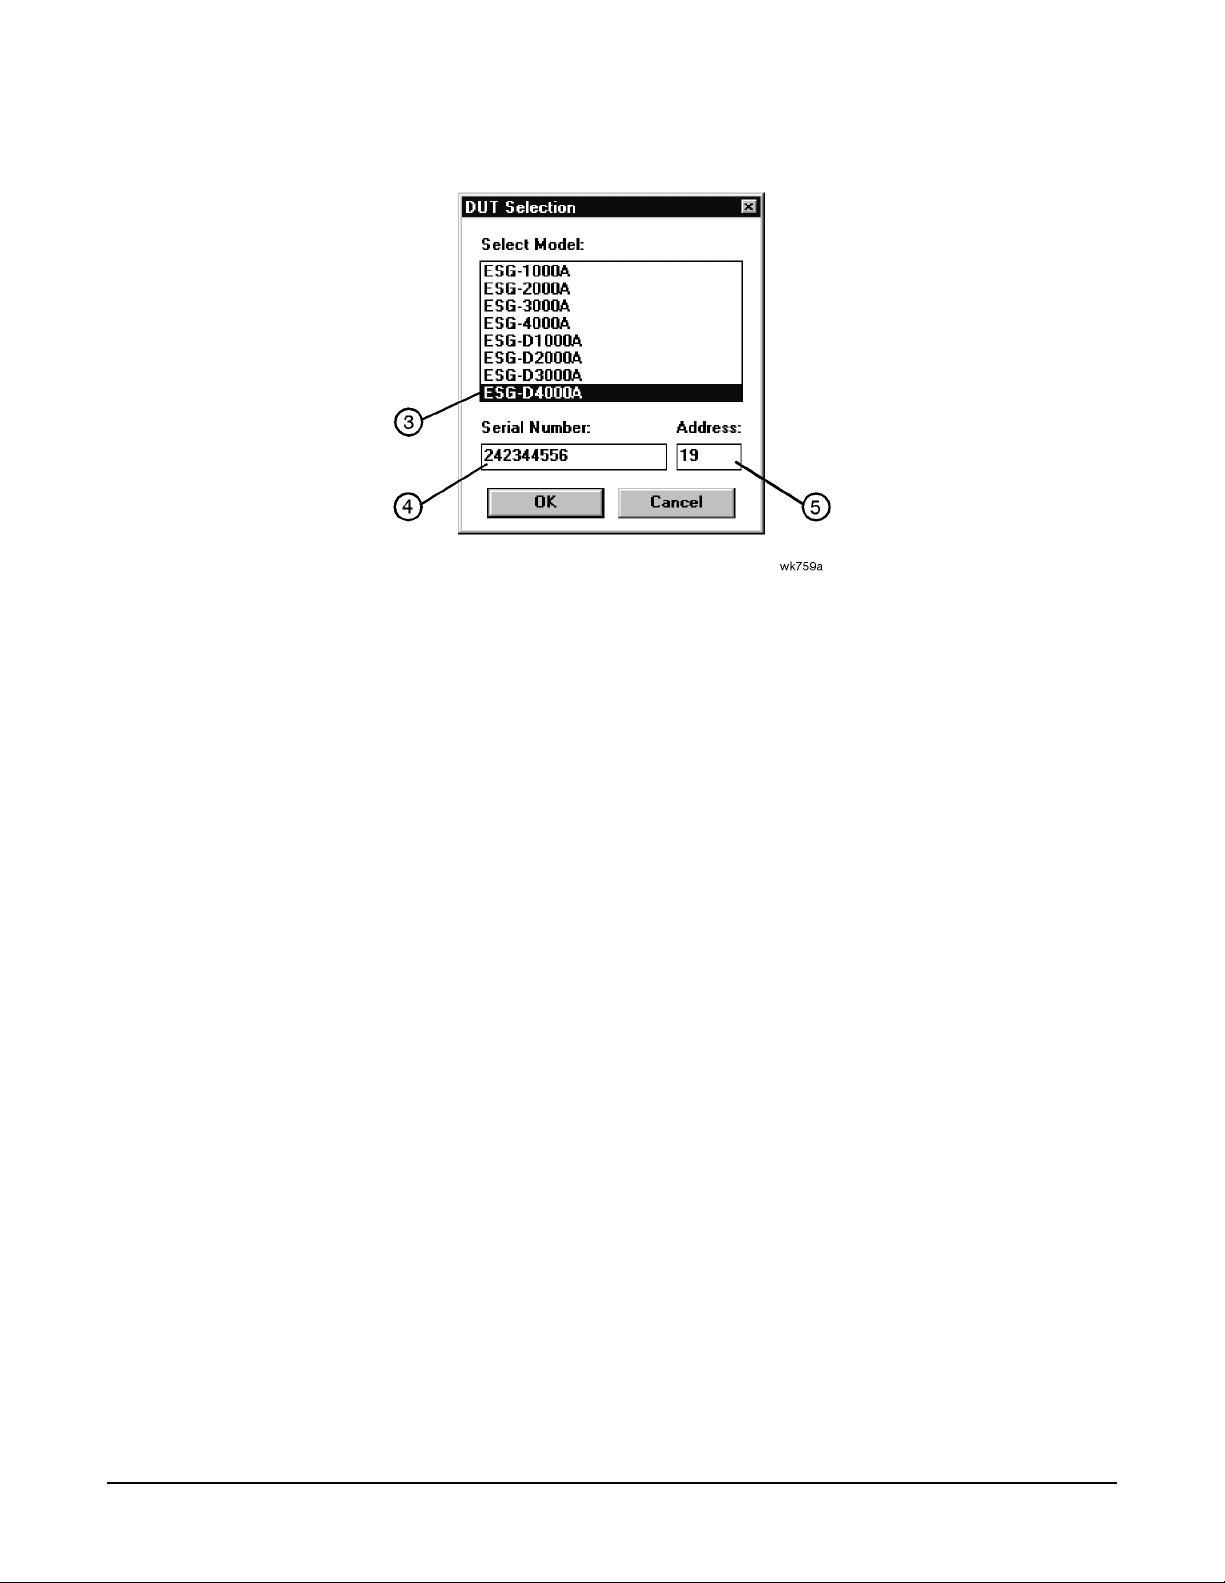
Performance Tests
Overview of Performance Tests
Figure 3-2 The DU T Select ion Window
7. In the Select Test Equipment and Tests window (Figure 3-3), create a list of test equipment t hat will v erify
the signal generator’s performance:
a. In the Devic e Ty pe list (item 6) , select a devic e ty pe th at you want to add to the eq uipm e nt lis t.
b. In the Model list (item 7), select the model of the device type that you want to add to the equipment list.
c. In the Av a i labl e Test Equipment box ( item 8), select the serial number of an instrument. There may be
more than one instrument available for any model. Make sure that the instrument calibration due date
has not passed. If the du e date has passed, use ano th e r available instrument. A lso, alert yo ur system
administrator that the instrument is due for calibration.
d. Click Add (item 9) to add the instrument to the test equipment list.
To delete a single entry in the equipm e nt list , click on the un wan ted sel ectio n in the Selec te d Test
Equipment box and then click Remove (item 11).
To delete the entire list of equipment, click Clear (item 12).
e. Continue adding test equipment to the list by repeating these steps.
3-5
Page 54
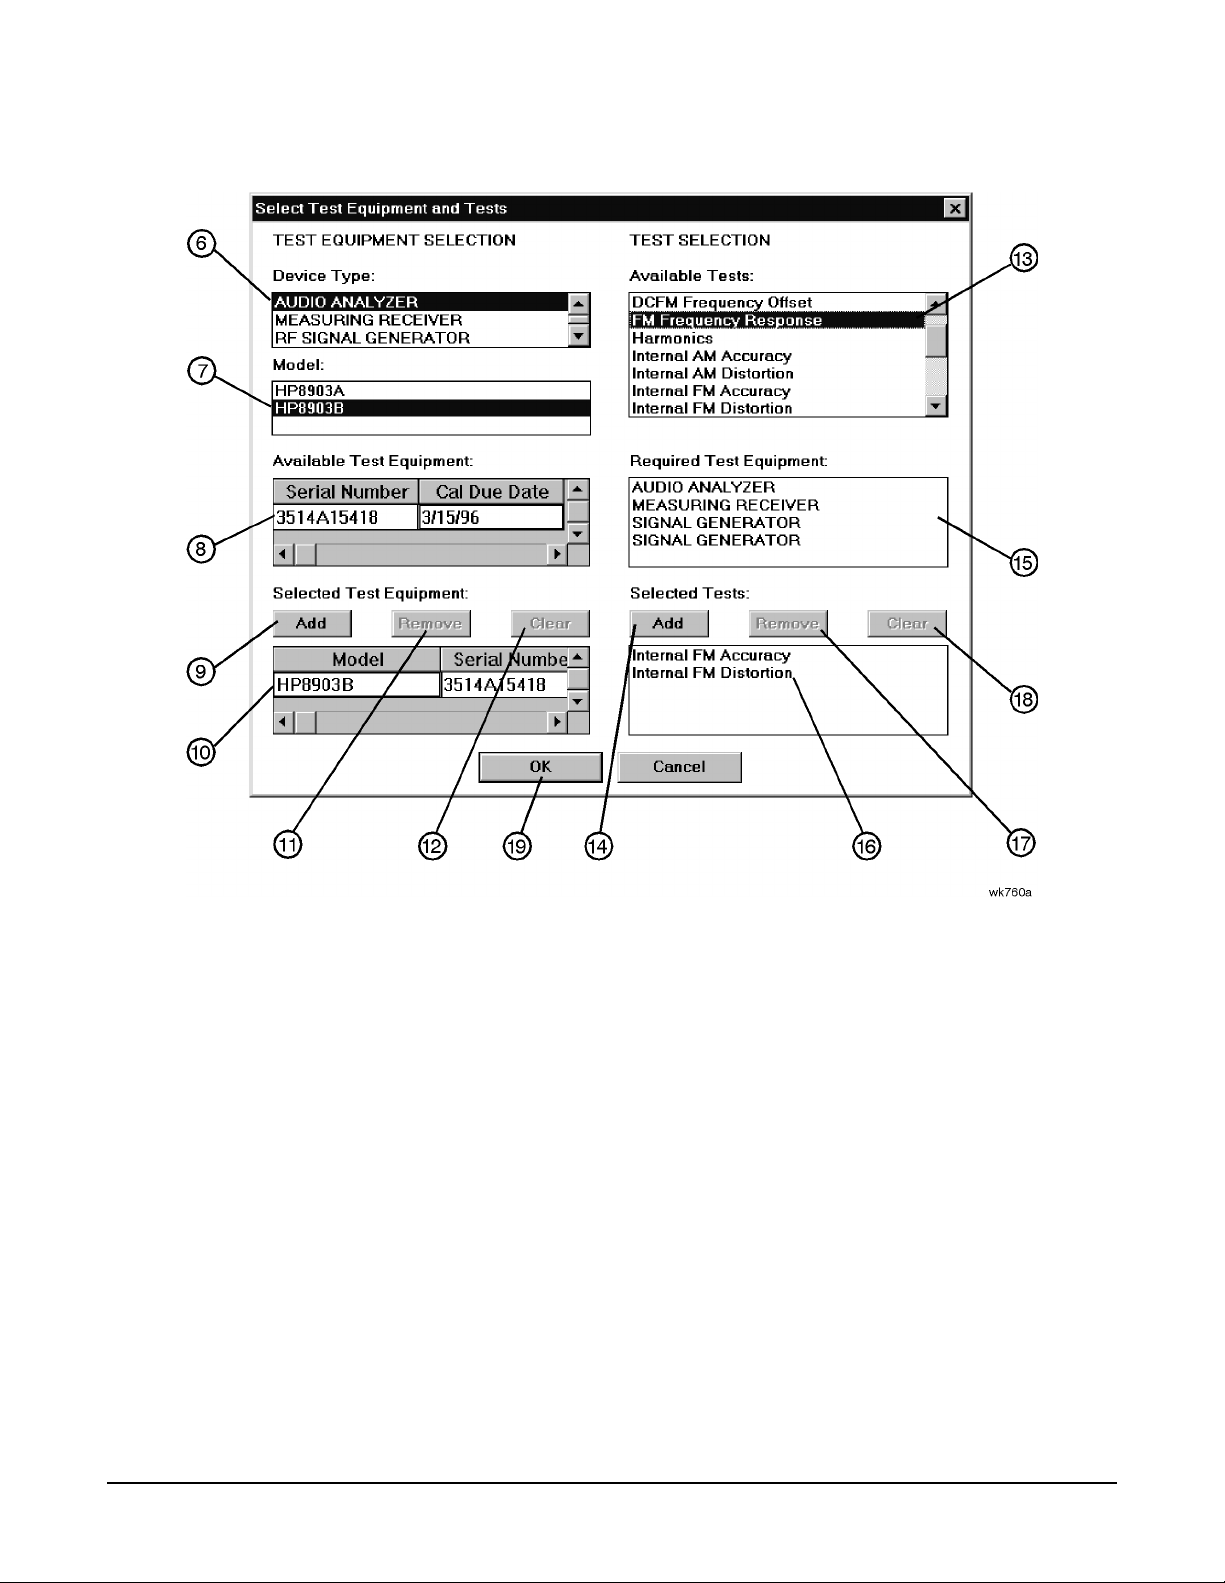
Performance Tests
Overview of Performance T ests
Figure 3-3 The Selec t Test Equipment and Tests Window
8. Create a list of performance tests that you want the Service Support Software to run (Figure 3-3):
a. In the Available Tests list (item 13), select a performance test.
b. Click Add (item 14) to add the te st to the list of tests that the Serv ice Sup po r t Softwar e will run .
You can view the Required Test Equipment l ist ( item 15) for a performan ce test by cli cking on the test
title in the Available Tests (item 13) box.
c. Continue adding performance tes ts to the list by repeati n g these steps.
To delete a single entry in the test list, select the unwanted test in the Selected Tests box (item 16) and
then click Remove (item 17).
To delete the entire list of equipment, click Clear (item 18).
9. When you are done, click OK (item 19).
10.To save the test results to a file, make the following selections (Fi gure 3- 4 ):
a. Click on the Drives window (item 20) and select the drive where you want to save the test results.
b. Click on the Save file as type window (item 21) and sele ct th e file typ e for saving th e test results.
c. Click on the File name window (item 22) and type in a name for the test results file.
3-6
Page 55

11.Click OK (item 23).
Figure 3-4 The Sav e As Window
Performance Tests
Overview of Performance Tests
12.In the Main Test and Results window (Fig ure 3 - 5 ), verify that the selected DUT (item 24), serial number
(item 24), and selected tests (item 25) are correct. Then click Run.
The selected performance tests are listed in the order in which they will run. You cannot change this order.
During the test ing sequ ence the window sho w s the foll ow ing information :
• the model and serial num be r of the sig nal generator under te st (item 24)
• the list of selected perfo rmance tests with the current test highlighted (item 25)
• the perfo rm ance test currently running (item 26 )
• the data points ta ken (ite m 27)
• the total number of data point s that wi ll be me asu red durin g the test ( item 28)
• the number of points that have currently passed the test (item 29)
• the number of points that have curre ntly fail ed th e test (ite m 30)
• the lower limits (LL) (item 31) and upp e r limit s (UL ) (it em 32) for ea ch test p o int
• the measured results (i tem 33) and the pass /fail (P/F) (item 34) indication
You can sc ro ll the re su lts window, vertic ally and horizonta lly. You can also click on the following butto ns
during the test se que nce:
Run Start running the highlight ed te st wh e n initially starting the testing. Also used to sta rt
testing at the same p oin t wh er e the test was stopp e d.
Stop Stop the test that is currently running. The test stops after making the next
measurement.
Restart Rerun a test that was running when the testing was stopped. This restarts the test from
the beginning.
3-7
Page 56

Performance Tests
Overview of Performance T ests
Next Test Quit running the current test an d gi ve it a Fail status. Then, continue testing with the
next test.
Rerun Restart the te stin g at the be gin ning of the first test.
Abort Quit testing. Abort all tests.
To begin a performance test seque nc e with a ne w DU T, clic k File an d New Se ssion. This allows you to
reselect the DUT, the equipment list, and the per f orm ance test list.
Figure 3-5 The Main Test and Results Window
13.When the Service Support Software has run all of the s el ected performance tests, the status bar indicat es
that the tests are co mp let ed (item 35).
Printing Results of P erformance Tests
1. To print all the results of the entire test sequence, click File and Print.
Exiting this Service Support Software
1. To exit the Service Support Software, click File and Exit.
3-8
Page 57

Performance Tests
Internal FM Accuracy and Distortion
Internal FM Accuracy and Distortion
These automated tests verify the FM accuracy and distortion specifications. Accuracy is verified directly with
a measuring receiver, and distortion is verified by measuring the demodulated output of the measuring
receiver, using the audio analyzer. The audio analyzer provides a more accurate verification with better
resolution, as oppos ed to the measur ing receiv er alon e.
Recommended Equipment
• Agilent 8902A measuring receiver
• Agilent 8903B audio analyzer with Options 010 and 051, or Options 011 and 050
Equipment Setup
Figure 3-6 Internal FM Accuracy an d D istor t io n S etup
3-9
Page 58

Performance Tests
Internal AM Accuracy and Distortion
Internal AM Accuracy and Distortion
These automated tests verify the AM accuracy and distortion specifications.
For frequencies at or below 1300 MHz, accuracy is verified directly with a measuring receiver , and distortion
is verified by measuring the demodulated output from the measuring receiver with an audio analyzer. The
audio analyzer provides a more a ccurat e verific ation w ith bett er resol utio n than using the me asuring rec eiver
alone.
For freq u e ncie s abo ve 1300 MH z, the RF output from the sign al ge ner a tor is mixe d with the output from
another signal ge nerator (local oscillato r ) to prod uc e a suitable inp u t fre que n cy f or the me asuring receiver.
For a frequency of 4 GHz , ve rif i c a tio n is accomp l ished by co ve ring two dif fe re nt fre q uency spa ns throug h the
use of two mixers.
Recommended Equipment
• Agilent 8902A measuring receiver
• Agilent 8903B audio analyzer with Options 010 and 051, or Options 011 and 050
• Use one of the following:
— for models with Option 501, 502, 503, 504 or Option UNJ, use an Agilent 8662A/8663A
high-performance RF signal generator
— for models with Option 506, use an Agilent E4426 /E4437 signal generato r
• MD/MDC-164 mixer (0.5 to 9 GHz)
• MD/MDC-174 mixer (1.0 to 2.8 GHz)
Equipment Setup s
Figure 3-7 Accuracy and Distortion for AM ≤ 1300 MHz Setup
3-10
Page 59

Internal AM Accuracy and Distortion
Figure 3-8 Accuracy and Distortion for AM > 1300 MHz and ≤ 2500 MHz Setup
Performance Tests
Figure 3-9 Accuracy and Distortion for AM > 2500 MHz Setup
3-11
Page 60
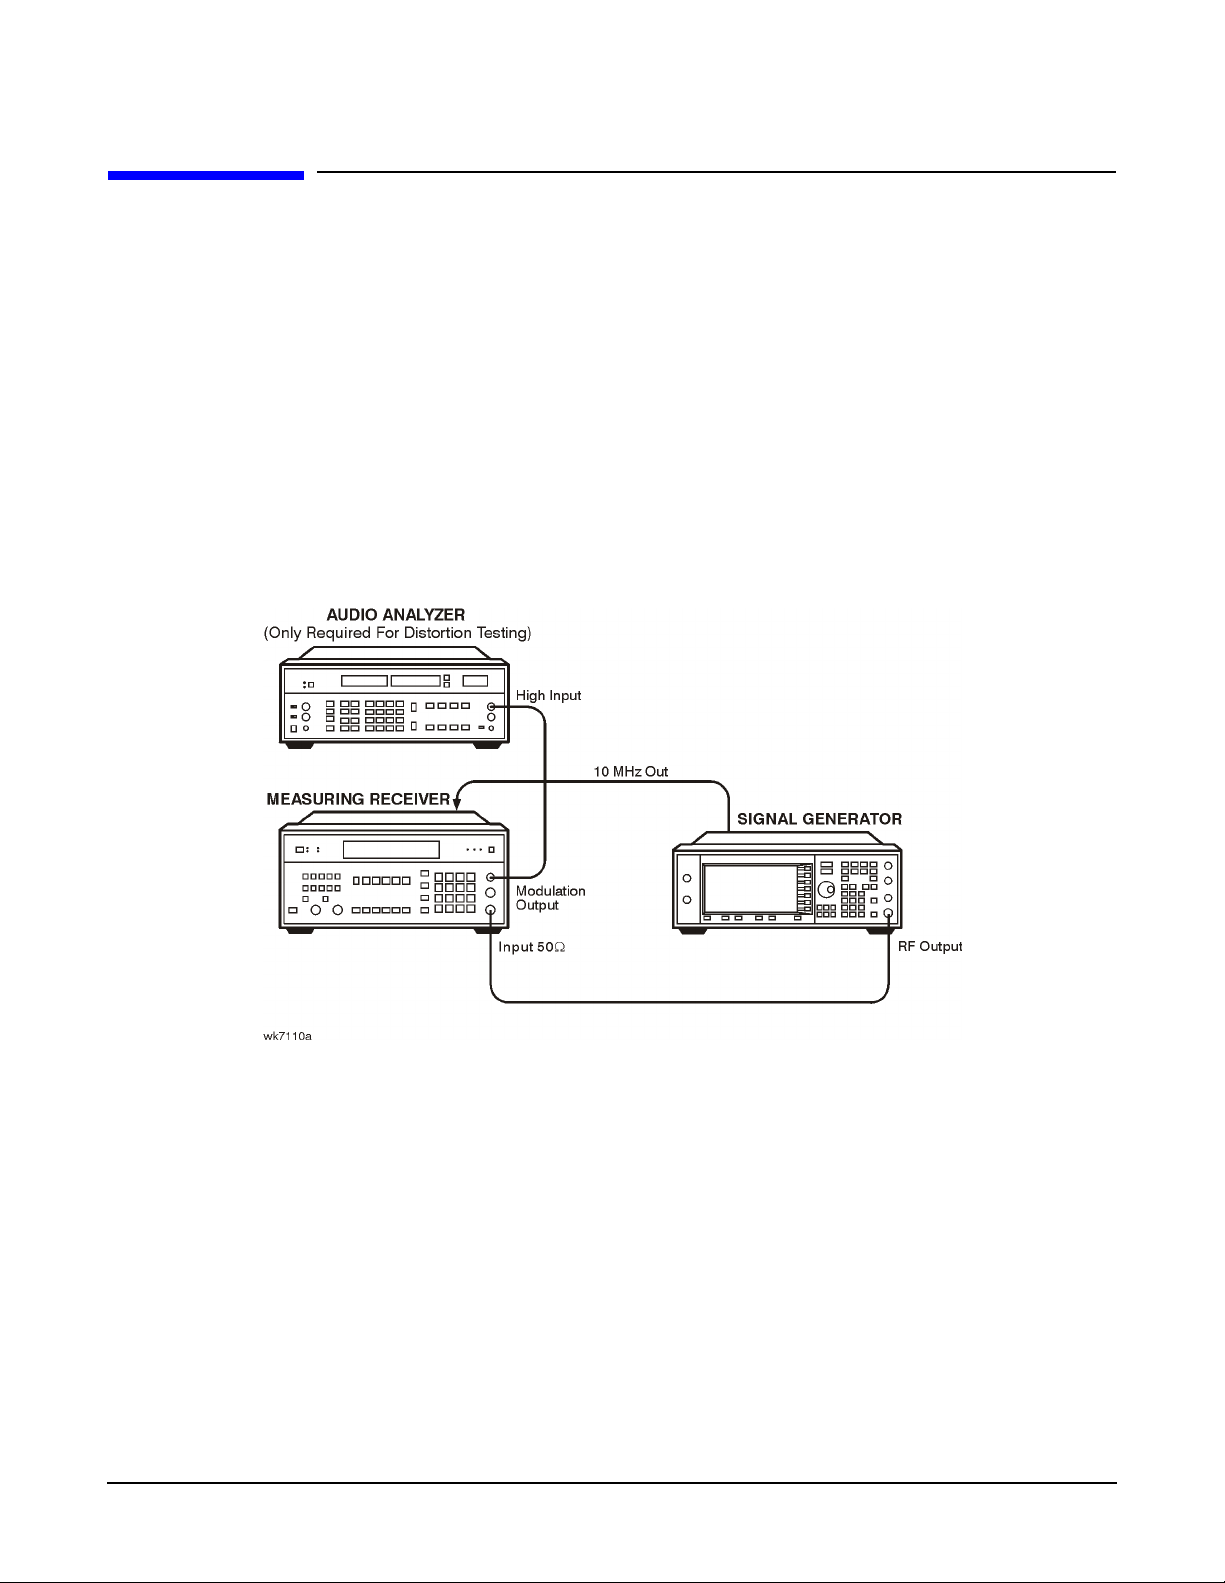
Performance Tests
Phase Modulation Accuracy and Distortion
Phase Modulation A ccuracy and Distortion
These automated tests verify the phase modulation accuracy and distortion specifications. Accuracy is
verified direc tly wit h a measuring rece iver, and distortion is verified by me asur ing the demodul a ted ou tput
from the measuring receiver, using the audio analyzer. The audio analyzer provides a more accurat e
verification with better resolution than using the measuring receiver alone.
Recommended Equipment
• Agilent 8902A measuring receiver
• Agilent 8903B audio analyzer with Options 010 and 051, or Options 011 and 050
Equipment Setup
Figure 3-10 Phase Modulation Accuracy and Distortion Setup
3-12
Page 61
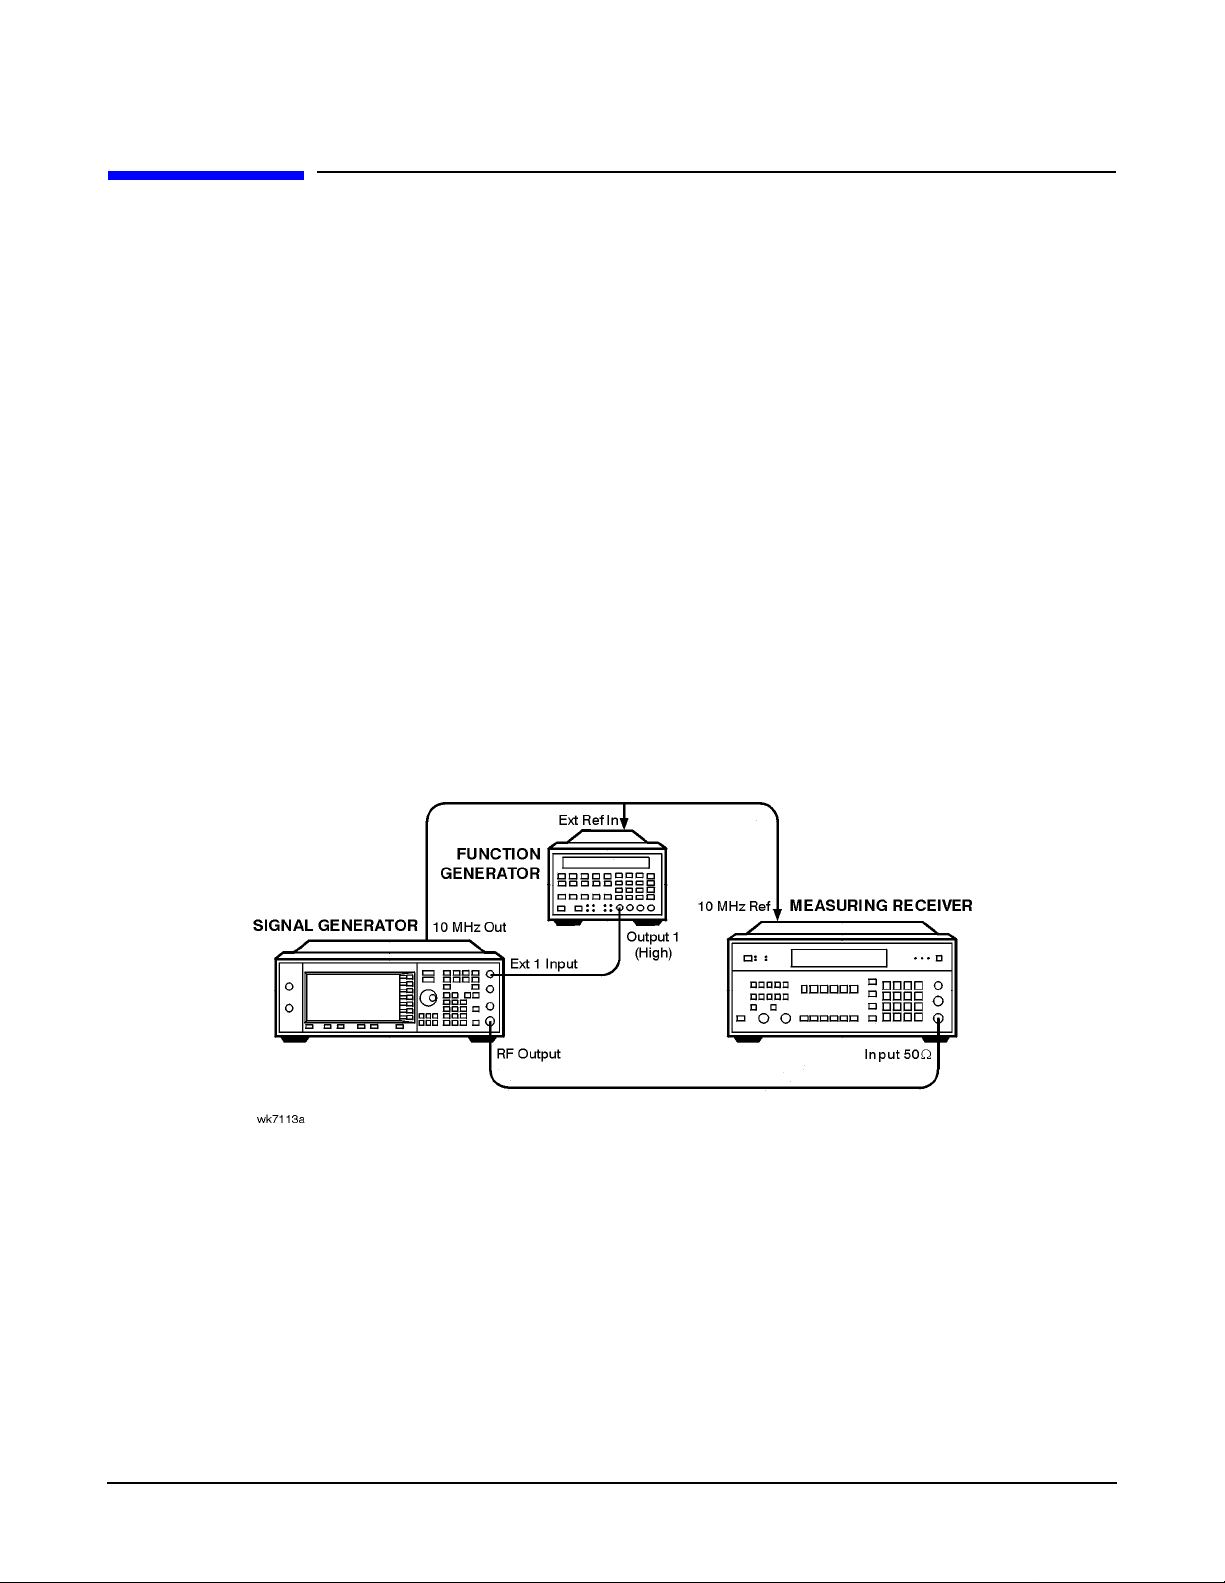
Performance Tests
FM Frequency Response
FM Frequency Response
This automated test verifies the FM frequency response specifications. The equipment measures the
variations in frequen cy deviat io ns due to change s in the ap plie d FM ra te ; dc to 100 kHz. The var iatio ns are
expressed relative to a reference signal; 1 kHz rate set at 100 kHz deviation, in dB. Each frequency is tested
with this sequence:
1. A referen ce sign al is m ea sured.
2. The set deviation is meas ured for ea ch applie d rate chan ge.
3. Each deviation measurement is compared to the reference signal deviation.
The comparison is a calculation of the difference in the deviations relative to the reference rate. The relative
value is the FM frequency response.
Recommended Equipment
• Agilent 8902A measuring receiver
• Agilent 8904A function generator
Equipment Setup
Figure 3-11 FM Frequency Response Setup
3-13
Page 62

Performance Tests
AM Frequency Response
AM Frequency Response
This automated test verifies the AM frequency response specifications. The equipment measures the
variations in modulati on depth du e to changes in the applied AM rate; dc to 10 kHz. The response is relat i ve
to a 1 kHz rate set at the test depth, and expressed in dB. Each frequency is tested with the following
sequence:
1. A referen ce sign al is m ea sured.
2. The set depth is measured for each applied rate change.
3. Each depth mea surement is compared to the reference signal depth.
The comparison is a calculation of the difference in the depths relative to the reference rate. The relative
value is the AM Frequency Response.
Recommended Equipment
• Agilent 8902A measuring receiver
• Agilent 8904A function generator
• Use one of the following:
— for models with Option 501, 502, 503, 504 or Option UNJ, use an Agilent 8662A/8663A
high-performance RF signal generator
— for models with Option 506, use an Agilent E4426 /E4437 signal generato r
• MD/MDC-164 mixer (0.5 to 9 GHz)
Equipment Setup s
Figure 3-12 AM Frequency Response ≤ 1300 MHz Setup
3-14
Page 63

Figure 3-13 AM Frequency Response > 1300 MHz Setup
Performance Tests
AM Frequency Response
3-15
Page 64

Performance Tests
Phase Modulation Frequency Response
Phase Modulation Frequency Response
This automated test verifies the phase modulation frequency response specifications. The equipment
measures the variations in phase deviations due to chang es in the appli ed ΦM rate; dc to 100 kHz. The
response is relati v e to a 1 kH z refe rence at t he sa me ph a se devia t i on, a nd expr essed i n dB. Each frequency is
tested with the following seque nce:
1. A referen ce sign al is m ea sured.
2. The set deviation is meas ured for ea ch applie d rate chan ge.
3. Each deviation measurement is compared to the reference signal deviation.
The comparison is a calculation of the difference in the deviations relative to the reference rate. The relative
value is the ΦM freq u e ncy response.
Recommended Equipment
• Agilent 8902A measuring receiver
• Agilent 8904A function generator
Equipment Setup
Figure 3-14 Phase Modulation Frequency Response Setup
3-16
Page 65

Performance Tests
DCFM Frequency Offset Relative to CW
DCFM Frequency Offset Relati ve to CW
This automated test verifi es the carr ie r frequenc y offset, relative to CW. The equipment measures the RF
output frequency. For each test point, a comparison is made between a CW reference frequency without
DCFM selected, and then with the DCFM selected; the difference is the carrier frequency offset.
Recommended Equipment
• Agilent 53132A Option 050 frequency coun ter
Equipment Setup
Figure 3-15 DCFM Frequency Offset Relative to CW Setup
3-17
Page 66

Performance Tests
Residual FM (Not Used with Option UNJ or Option 506)
Residual FM
(Not Used with Option UNJ or Option 506)
This automated test verifies the residual frequency modulation (FM) specification. The signal generator’s RF
output signal is mixed with a signal from a low noise external LO. The resultant IF signal is demodulated as
it passes throug h the m easuring receiver, bypassing the measur ing receiver’s intern al mixe r wh ich is
inherently more noisy. Then the audio analyzer measures the demodulated a udio sig nal for an RMS voltage .
The measurement is scaled and displayed as RMS mV, but read as residual FM in Hz.
Recommended Equipment
• Agilent 8902A measuring receiver
• Agilent 8903B audio analyzer with Options 010 and 051, or Options 011 and 050
• Agilent 8662A/8663A high-performance RF signal generator
• MD/MDC-164 mixer (0.5 to 9 GHz)
• MD/MDC-174 mixer (1.0 to 2.8 GHz)
Equipment Setup s
Figure 3-16 Residual FM
(Not Used with Option UNJ or Option 506) ≤ 2500 MHz Setup
3-18
Page 67

Figure 3-17 Residual FM
(Not Used with Option UNJ or Option 506) > 2500 MHz Setup
Performance Tests
Residual FM (Not Used with Option UNJ or Option 506)
3-19
Page 68

Performance Tests
Harmonic, Subharmonic, and Nonharmonic Spurio us Signals
Harmonic, Subharmonic, and Nonharmonic Spur ious Signals
These automated tests verify that the harmonic, sub-harmonic, and non-harmonic spurious signals are within
specification s. The sign al gene r ato r’s outp ut signal is set to values where harmoni c and sp ur io us signal
performance problems are most likely to occur. Then the spectrum analyzer checks the level of the various
harmonic and spurious signals and compa res each measurement to a signal of known frequency and
amplitude.
Recommended Equipment
• Agilent 8563EC Option 001 spectrum an alyzer
• Agilent 8491A/B Option 010 fixed attenuator (10 dB)
Equipment Setup
Figure 3-18 Harmonic, Sub-harmonic, and Non-harmonic Spurious Signals Setup
3-20
Page 69

Performance Tests
Power Level Accuracy
Power Level Accuracy
A power meter is used to verify p e rf ormance over the +13 to −45 dBm range. The absolute power level
measured at −40 dBm is used as a refere nc e for all lo wer leve l m easurements.
For power levels below −45 dBm , a vect or sign al analy z er is used to ma ke relati ve power meas ur emen ts. A
low noise amplifier (L N A) an d step attenuator are conn ecte d in se ries to control the absolute power lev el
input to the signal analyzer. For power level settings ≥−90 dBm, the step attenuator is set to appro ximat el y
cancel the gain of th e LNA . B elow −90 dBm, the step atte nu ato r is set to 0 dB, which keeps the signal level
well above the signal analyzer’s noise floor.
Relative measurements are accomplished by setting the DUT amplitude. For example:
Set the DUT to a specific frequency, and an amplitude of −40 dBm. For the purpose of this example, assume
the power mete r me asur e s −40.1 dBm at these settings. The signa l analy zer does a p eak sear ch, set s the
reference level , and sets the marker to delta mode (0 dB). The DUT amplitude then ch ang es to −50 dBm, and
the signal analyzer makes a relative power measurement (assume it to be −10.15 dB). The absolute power
measured is −40.1 dBm + (−10.15 dB), or −50.25 d Bm.
To determine power level accuracy below −90 dBm, the signal analyzer makes the 0 dB marker delta
measurement with t he ampli t ude set to −90 dBm, and all lower level measurements are made relative to this
reference. Th e prev io usl y measur ed err or for the −90 dBm setting is then accounte d for in the meas urement.
F or fr equen cies above 2 GHz, an Agilent 8563EC Option 001 spectrum analyzer is used to downconvert the
frequency to 321.4 MHz.
Recommended Equipment
• Agilent E4418B E-Series power meter
• Agilent E9304A E-Series power sensor
• Agilent 89441A vector signal analyzer with Options AYA, AYH, AY7, AY9, B7A, UFG or UTH
• Agilent 8563EC Option 001 spectrum an alyzer
• Agilent 8495G programm able ste p attenu ato r (0 to 70 dB)
• Agilent 11713A step attenuator driver
• See Chapter 2, “Required Equipment,” on page 2-1 for detai ls on the following:
— Low Frequency Low Noise Amplifier (LNA)
— High Frequen cy L o w Nois e Am plif ie r (LNA )
3-21
Page 70

Performance Tests
Power Level Accuracy
Equipment Setup s
Figure 3-19 High-Power, Power Lev el Accuracy Setup
Figure 3-20 Low-Power, Power Level Accuracy (< 10 MHz) Setup
3-22
Page 71

Power Level Accuracy
Figure 3-21 Low-Power, Power Level Accuracy (≥ 10 MHz and ≤ 2 GHz) Setu p
Performance Tests
Figure 3-22 Low-Power, Power Level Accuracy (> 2 GHz) Setup
3-23
Page 72

Performance Tests
Timebase Aging Rate (Manual Test - O ption UNJ, Option 506, or Option 1E5Only)
Time bas e Agi ng R ate
(Manual Test - Option UNJ, Option 506, or Option 1E5 Only)
This manual test ver ifie s the acc ur acy of the sign al ge nerator’s internal timebas e. The time requir ed fo r a
360° phase change is measured both before and after a specified waiting period. The aging rate is inversely
proportional to the absolute value of the difference in the measured times. The results of this test can be
reco rd ed using the “ Agilent E4438C ESG Vector Signal Generator Timebase Aging Rate Performance Test
Record” on page 3-43 .
The overa ll accuracy of th e in ternal timebase i s a fu nction of:
TBC ±AR ±TE ±LE where:
TBC = timebas e calibration
AR = aging rate
TE = temperature effects
LE = line effects
After the timebas e is adjusted, the tim eb ase freq uency should stay with in the aging rate for th e follo win g
situations:
• The timebase oven does not cool down.
• The instrument keeps the same orientation, with respect to the earth’s magnetic field.
• The instrument stays at the same altitude.
• The instrument d o es no t receive any me chanica l shock.
If the timebase oven cools (the instrument power switch is set to off), you may have to readjust the timebase
freq uency after a new warm-up cycle. Typ ically, however, the tim e base frequency retur ns to within ±1 Hz of
the original frequency.
NOTE The internal timebase can be tested after the AC power is reconnected for 10 minutes. For best
accura cy, retest after the instrum ent has been on for 24 hours.
Frequency changes due to either a change in orientation, with respect to the earth’s magnetic field, or to a
change in altitude usu ally go away when the inst ru m en t is returned to its original p os itio n. A freq ue nc y
change due to mechanical shock usu ally appear s as a fixed frequ ency error.
Recommended Equipment
• Agilent 54610B digital oscillo scope
• Use a 10 MHz house standard. (For example, an Agilent 5071A primary frequency standard or equivalent
can be used.)
3- 24
Page 73
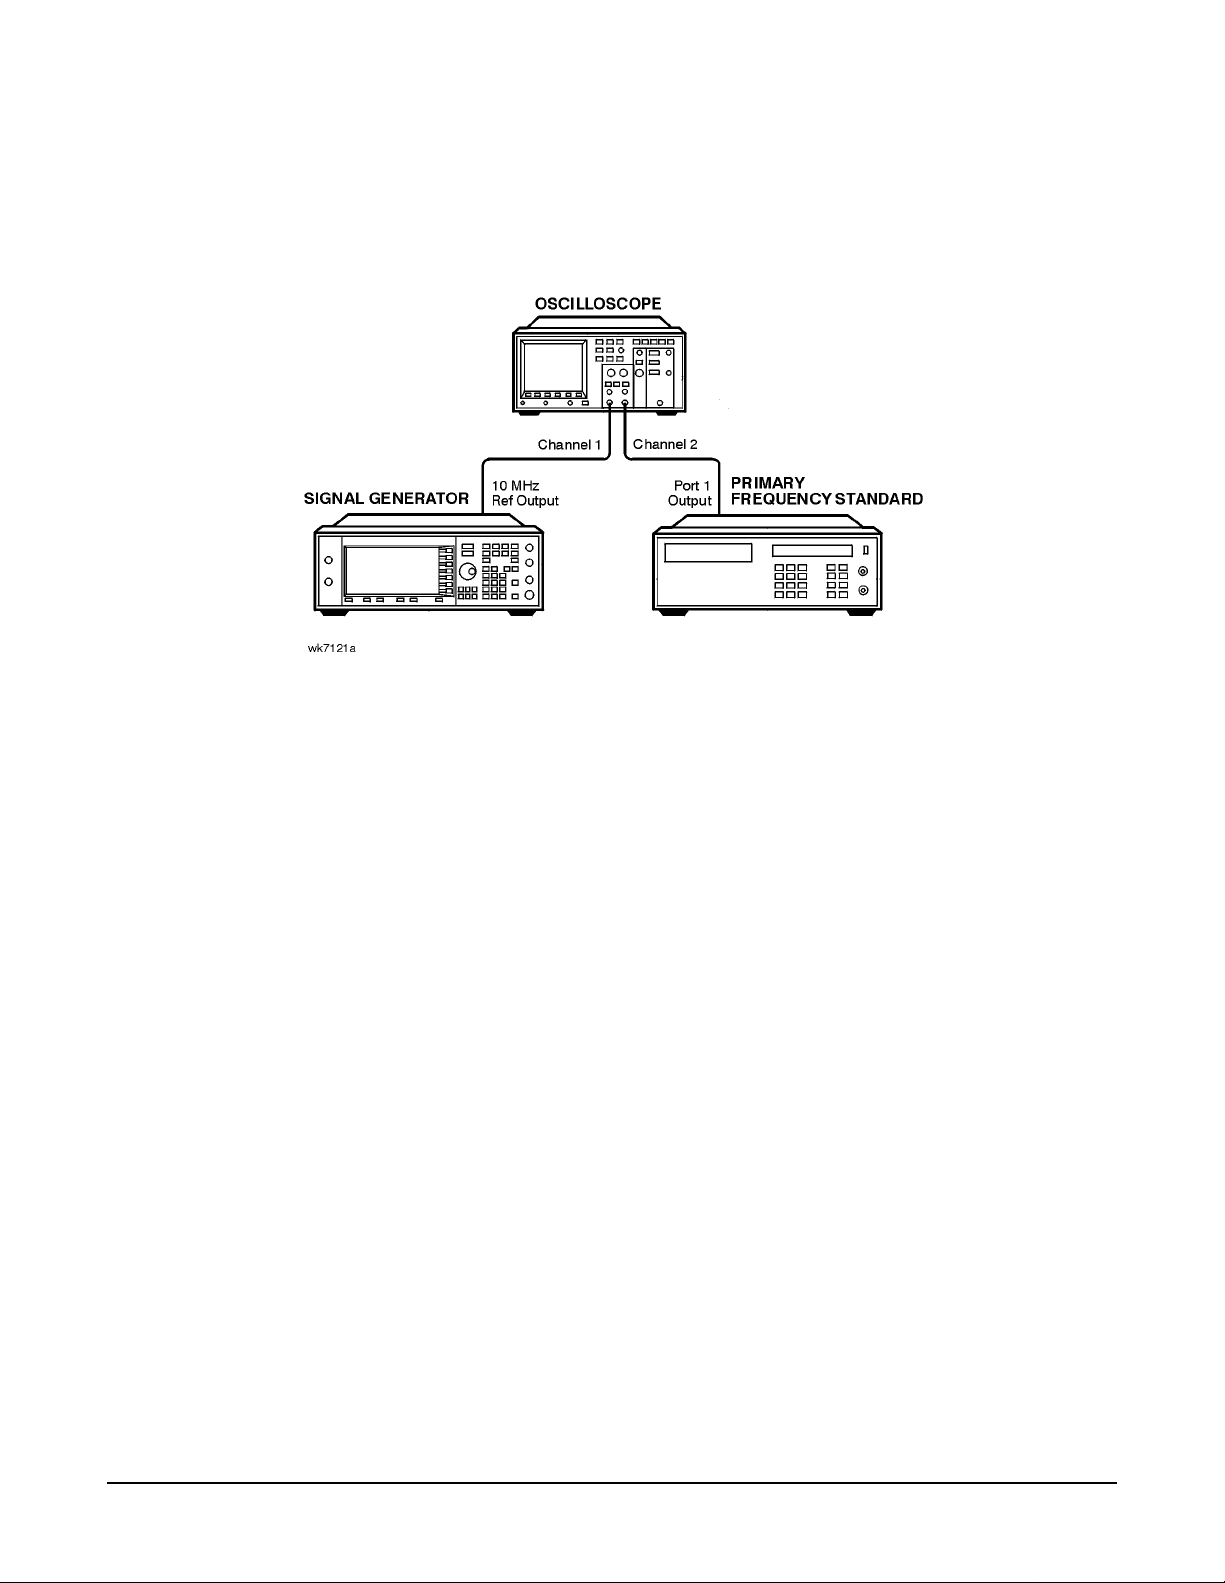
Timebase Aging Rate (Manual Test - Option UNJ, Option 506, or Option 1E5 Only)
Equipment Setup
Figure 3-23 Timebase Aging Rate
(Manual Test - Option UNJ, Option 506, or Option 1E5 Only) Setup
Performance Tests
Procedure
1. Preset all instruments and let them warm up for at least one hour.
2. If the oscil loscope does not have a 50Ω input impedance, connect channel 1 through a 50Ω feedthrough.
3. On the oscilloscope , a djust the external triggering for a display of the 10 MHz REF OUTPUT signal from
the synthesizer.
a. On Channel 1 of the oscilloscope, set the following:
•Display: On
• Volts/Division: 500 mV
• Input Couplin g: dc
• Input Impedanc e: 50 ohms (or use a 50 ohm feedthrough)
b. On Channel 2 of the oscilloscope, set the following:
•Display: Off
• Input Couplin g: dc
• Input Impedanc e: 50 ohms (or use a 50 ohm feedthrough)
c. On the Timebase of the oscilloscope, set the following:
• Time/Division: 5 ns
d. On the Trigger of the oscilloscope, set the following:
• Trigger Source: CH 2
• Trig ger Mode: Normal
• Trigger Level: 0 V
3-25
Page 74

Performance Tests
Timebase Aging Rate (Manual Test - O ption UNJ, Option 506, or Option 1E5Only)
4. If the signal drifts a full cycle (360°) in less than 2 minutes, refer to “Internal Reference Oscillator
Calibration” on page 4-7 and perform the “Internal Reference Oscillator Adjustment. ” After the
adjustmen t, restar t this p e rfo rmance test.
5. Watch the oscilloscope display and monitor the time. Notice the time required for a 360° phase change and
record this time as T1.
6. Wait 3 to 24 hours. Record the time that you waite d as T2.
7. Repeat steps 1 through 6. Not ice the time requi red for a 360° phase chan ge and record this time as T3.
8. Calculate the aging rate as follow s:
Aging Rate = (1 cycle/10 MHz) (1/T1 − 1/T3) (24 hours/T2)
Example:
T1 = 351 seconds
T2 = 3 hours
T3 = 349 seconds
-11
= (1 cycl e /1 0 MHz) (1/351 s − 1/349s) (24h/3h)(1.306 × 10
per day)
9. Write the test results on the performance test record located at the end of this chapter . Compare the
results to the limi ts in the te st re c ord .
NOTE If the absolute frequ ency of the standard and the time bas e osc illato r are ext reme ly close, yo u
can reduce the measurement time (T1 and T3) by measuring the time required for a phase
change of less than 360°. In step 4, change 1 cycle to 0.5 cycle for 180°, or 0.25 cycle for 90°.
3- 26
Page 75

Performance Tests
Digital Modulat ion Level Accuracy
Digital Modulation Level Accuracy
This automate d test ve rifie s the le ve l acc ur acy of the signal generato r’s I and Q modulation inputs. Tw o
arbitrary waveform generators provide the I and Q modulation inputs to the signal generator. A power meter
measures the R F outp ut p ow er with a nd without QPSK mod ulation applied to the sig nal generator. The
difference in power measu re me nt s is the le vel acc ura cy. The QPSK modulation is load e d into the two
arbitrary waveform gen erators from a data file in the Ser vic e Suppo r t So ftware. T he ve ctor signal analyzer
verifies the arbitr ar y waveform ge ne r ato r’s outputs are prope rly scaled and synchronized be fore the relative
power level accuracy is measured.
Recommended Equipment
• Agilent E4418B E-Series power meter
• Agilent E9304A E-Series power sensor
• Agilent E4438C ESG vector signal genera tor with Optio n 001 or 002,
or Agilent E4430B thru E4437B ESG-D Series sign al gene r ator wit h Optio n UN 8
Equipment Setup
Figure 3-24 Digital Modulation Level Accuracy Setup
3-27
Page 76

Performance Tests
Internal Digital Modulation Quali ty (Option 402 Only )
Internal Digital Modulation Quality
(Option 402 Only)
NOTE This test is only requir ed for instru m e nts with Op t ion 402.
This automated test verifies the RF modulation quality of the signal generator’s internal I/Q modulation. A
vector signal analy ze r is conn ected to the sign al ge nerator’s RF output. The internal baseband gener ato r
modulates the RF car rier in each of the available digital modu lati on form ats. The vec tor sign al analyzer
measures the appropriate error parameter for the modulation generated (EVM for PHS, PDC, EDGE,
and NADC formats; global phase error for GSM form at).
Recommended Equipment
• Agilent 89441A vector signal analyzer with Options AYA, AYH, AY7, AY9, B7A, UFG or UTH
Equipment Setup
Figure 3-25 Internal Digital Modulation Quality
(Option 402 Only) Setup
3-28
Page 77
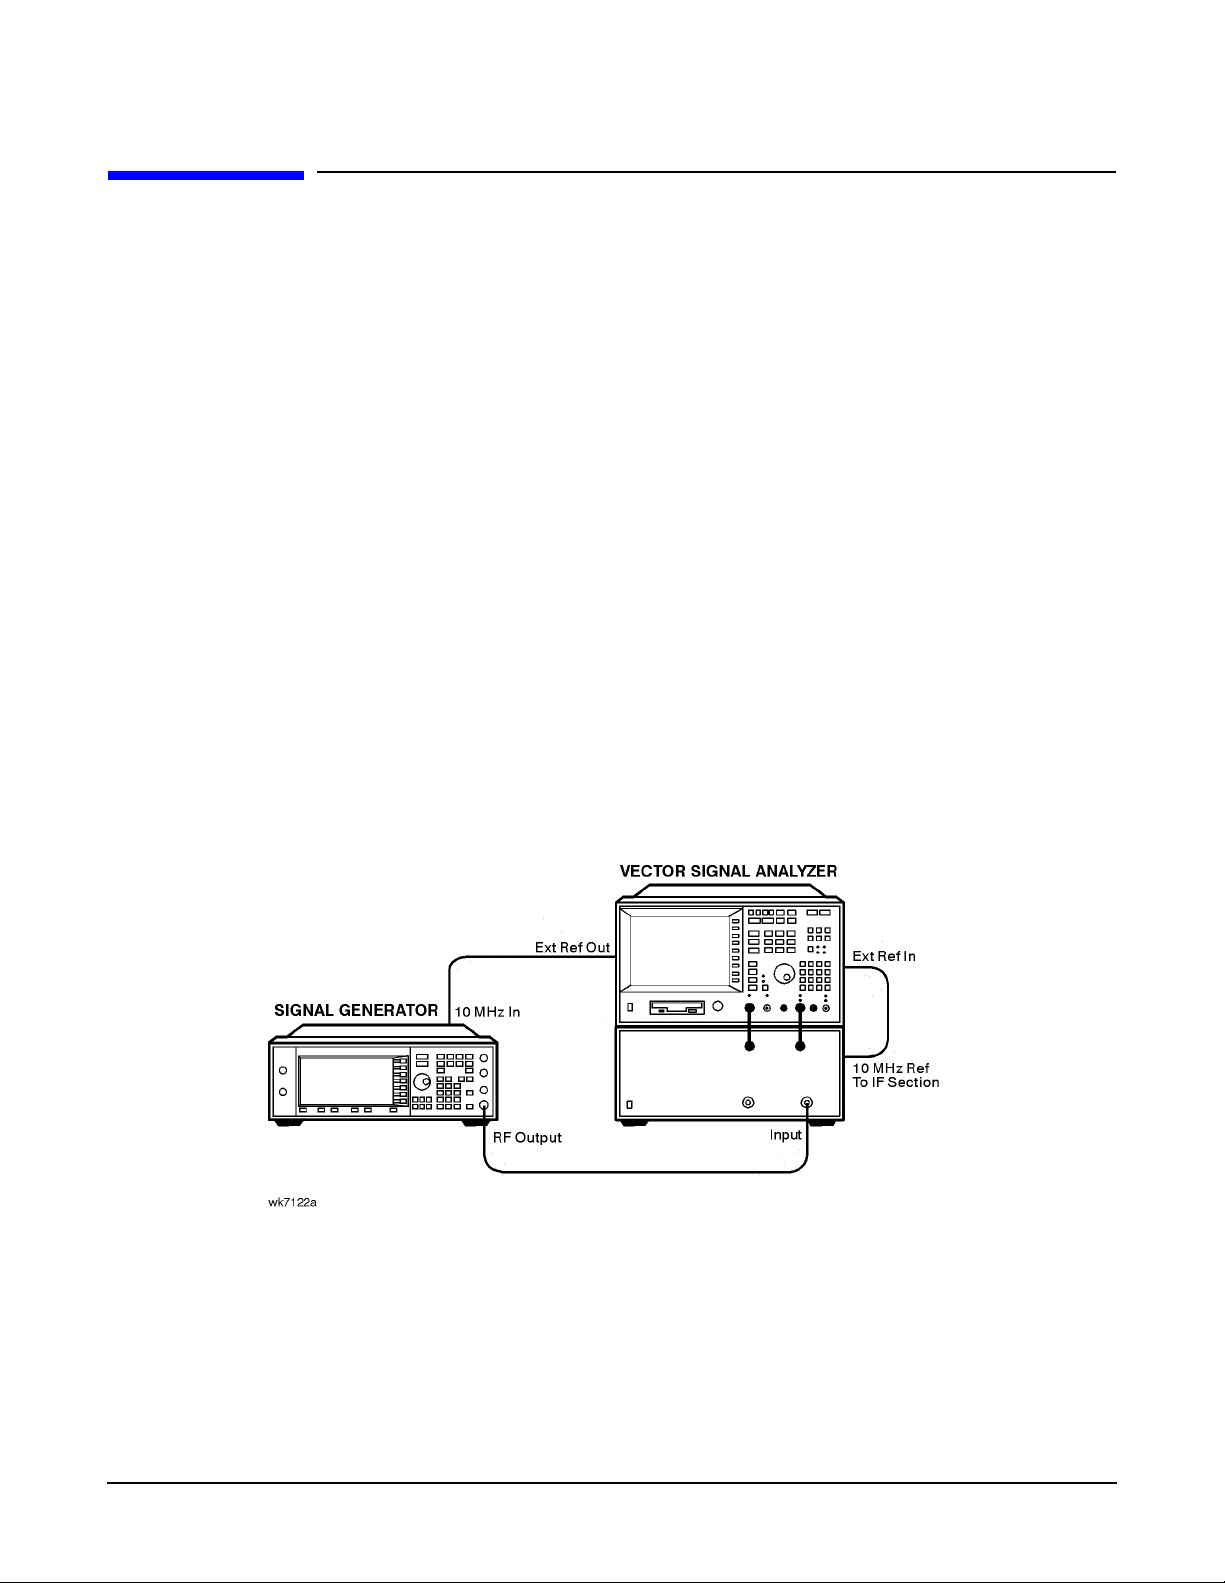
Performance Tests
Custom I/Q RF Modulation Quality (Option 402 Only)
Custom I/ Q RF Modula t ion Quality
(Option 402 Only)
This automated test verifies the RF modulation quality of the Option 402 signal generator’s internal real time
I/Q baseband modulat ion. A vector sign al analyzer is connected to the signal generator’s RF output. The
Option 402 internal baseband generator modulates the RF carrier in each of the TDMA digital modulation
formats. The parameters of the indiv id ual TDMA fo rmats common to Optio n 402 are teste d el sewhe r e. The
vector signal analyzer measures the appropriate error parameter for the modulation generated:
• EVM for QPSK, π/4DQPSK, and QAM16
• Phase error for MSK
• Frequen cy Shift E rror (%) fo r FSK2
Recommended Equipment
• MD/MDC-174 mixer (1.0 to 2.8 GHz)
• Agilent 8662A/8663A high-performance RF signal generator
• Agilent 89441A vector signal analyzer with Options AYA, AYH, AY7, AY9, B7A, UFG or UTH
Equipment Setup s
Figure 3-26 Custom I/Q RF Modulation Quality
(Option 402 Only) ≤ 2000 MHz Setup
3-29
Page 78
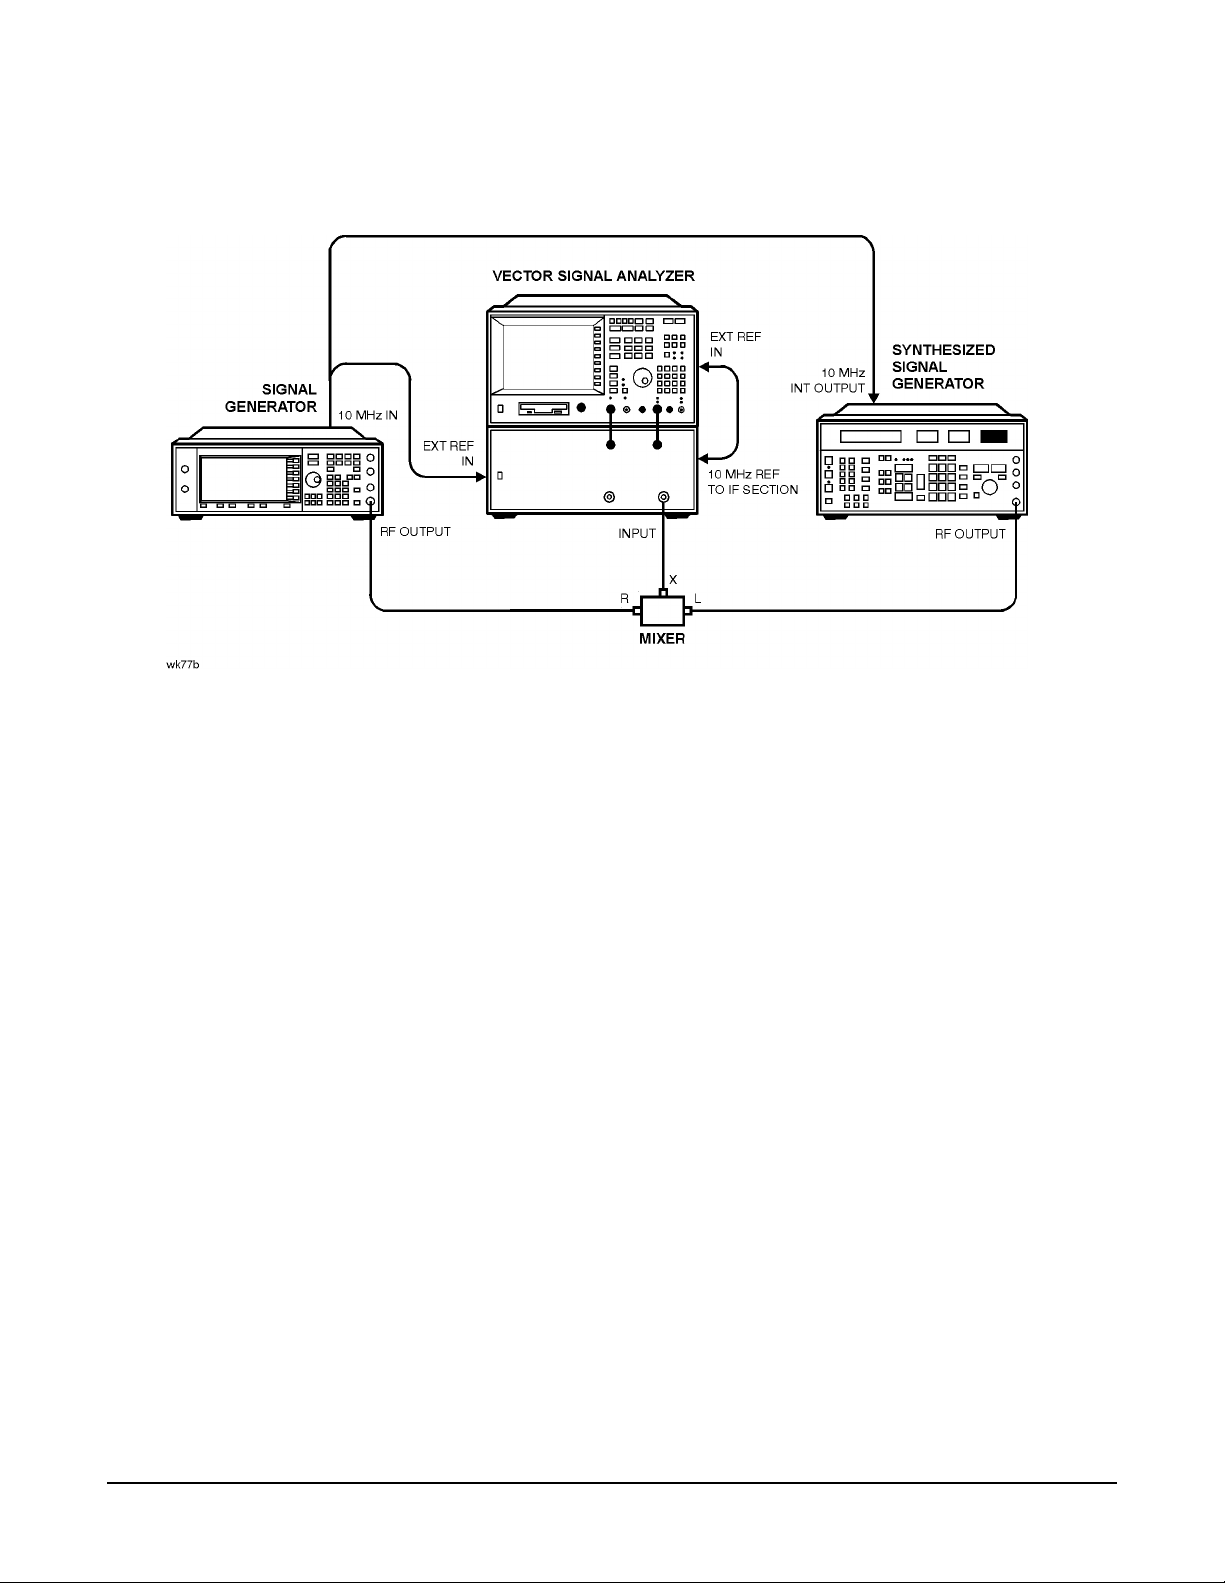
Performance Tests
Custom I/Q RF Modulation Quality (Option 402 Only)
Figure 3-27 Custom I/Q RF Modulation Quality
(Option 402 Only) > 2000 MHz Setup
Procedure
1. Connect the equipment as shown in Figure 3-26 on page 29.
2. Preset all of the equipment.
3. Follow the instructions as they ap pe ar on the con trolle r ’s display.
3-30
Page 79
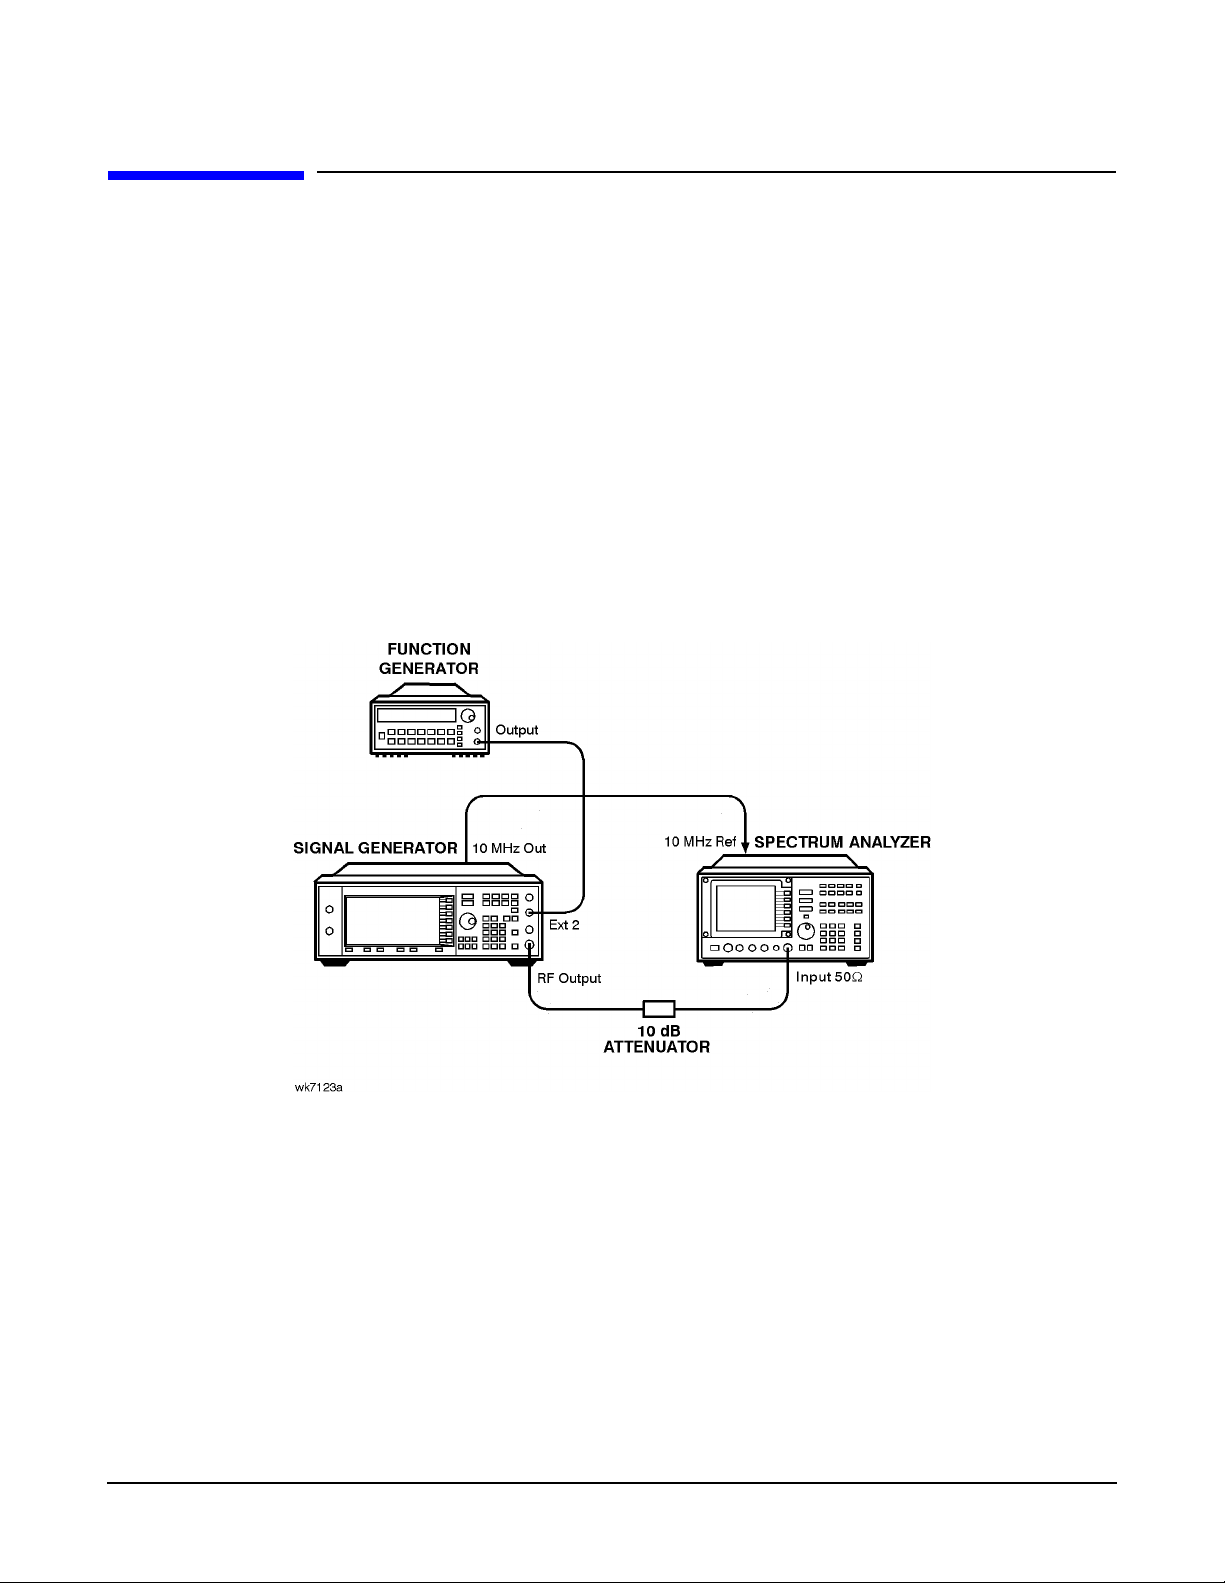
Performance Tests
Pulse Modulation On/Off Ratio
Pulse Modulation On/Off Ratio
This automate d test ve rifie s the p ulse modulatio n on/of f ratio. The signal genera to r is configured for an
external pulse input . Th e spec t ru m analyz er meas ur es the RF outpu t power with and without the external
pulse applied. The power difference is the on/off ratio.
Recommended Equipment
• Agilent 8563EC Option 001 spectrum an alyzer
• Agilent 8491A/B Option 010 fixed attenuator (10 dB)
• Agilent 33120A function generator
Equipment Setup
Figure 3-28 Pulse Modulation On/Off Ratio Setup
3-31
Page 80
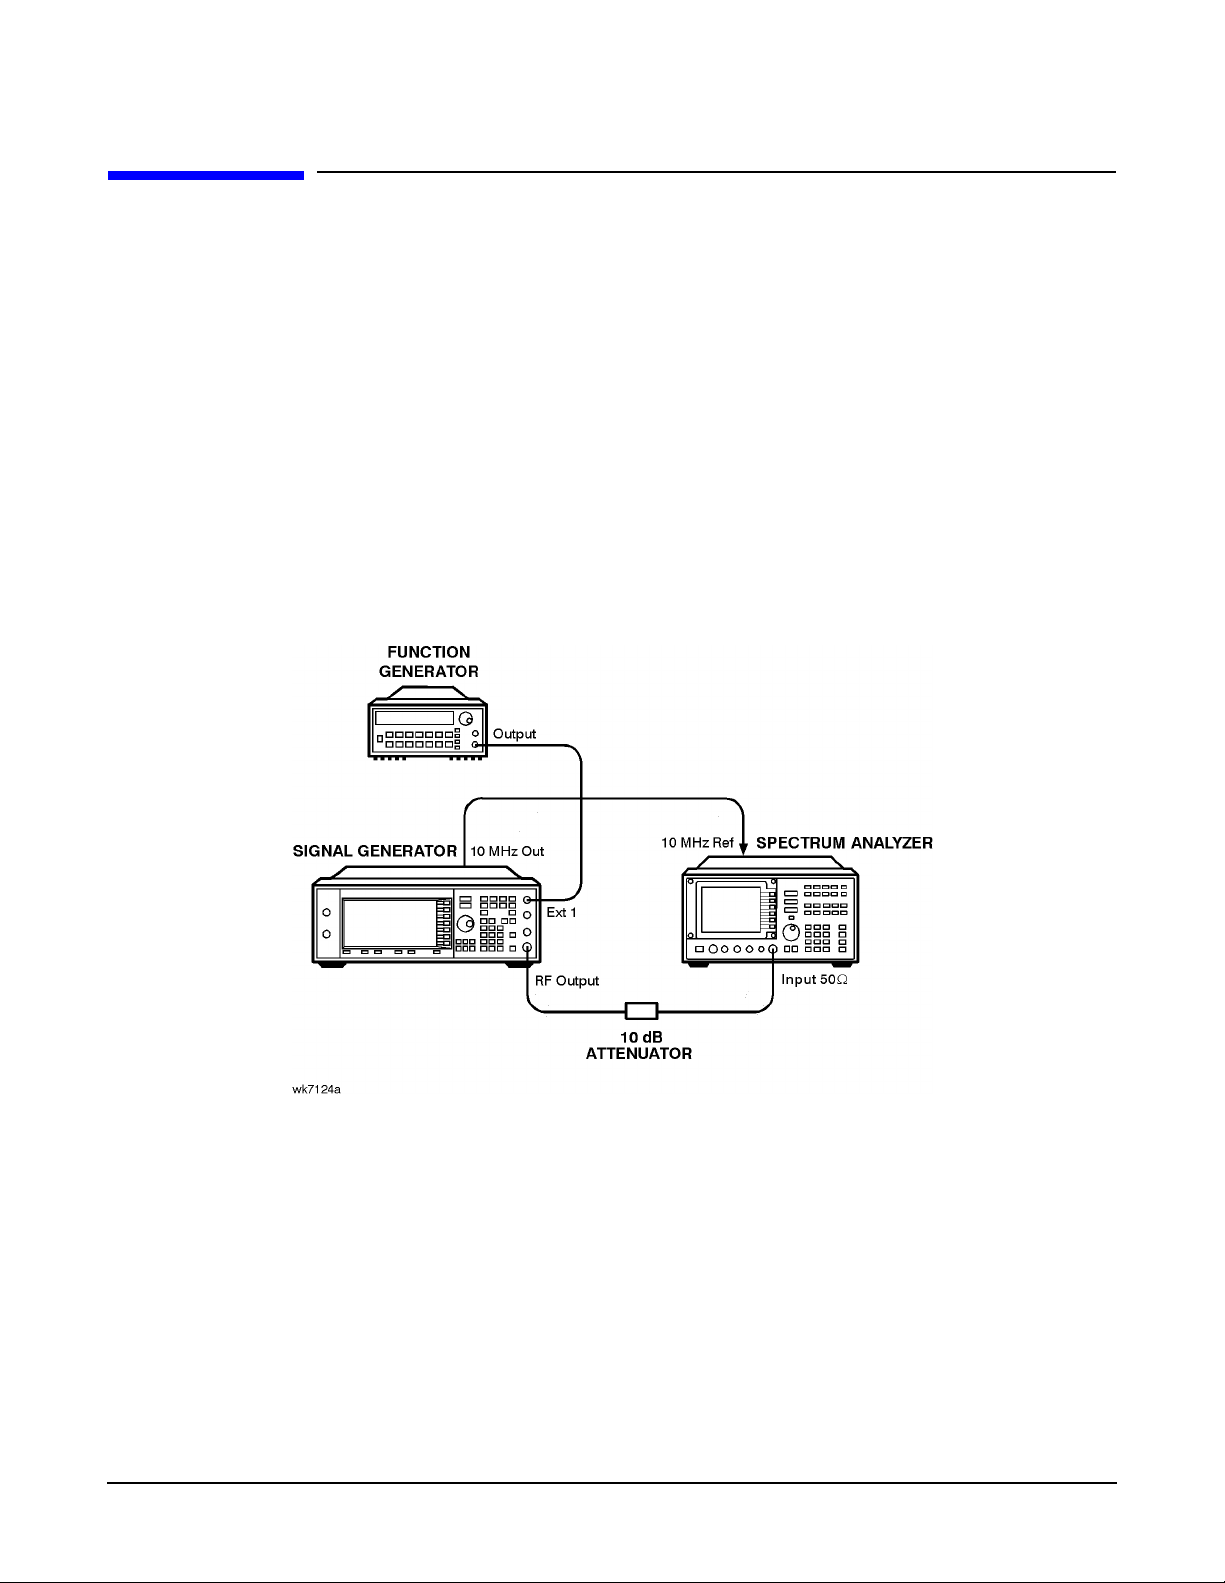
Performance Tests
Burst Modulation On/Off Ratio
Burst Modulation On/Off Ratio
This automate d test ve rifie s the burst modulat io n on/off rati o. The signal generato r is configured for an
external burst input. The spectrum analyzer measures the RF output power with and without the external
burst applied. The power difference is the on/off ratio.
Recommended Equipment
• Agilent 8563EC Option 001 spectrum an alyzer
• Agilent 8491A/B Option 010 fixed attenuator (10 dB)
• Agilent 33120A function generator
Equipment Setup
Figure 3-29 Burst Modulation On/Off Ratio Setup
3- 32
Page 81

Performance Tests
CDMA Adjacent Channel Power (Not Used with Option UNB or Opt ion 506)
CDMA Adjacent Channel Power
(Not Used with Option UNB or Option 506)
This automated tes t verifie s the e nerg y at an o ffse t to the main channel relative to the total e nerg y in the
main channel. Post-processing averag ing techni que s are us ed to im prove repe atability.
Recommended Equipment
• Agilent 8563EC Option 001 spectrum an alyzer
• Agilent 8491A/B Option 010 fixed attenuator (10 dB)
Equipment Setup
Figure 3-30 CDMA Adjacent Channel Power
(Not Used with Option UNB or Option 506) Setup
3-33
Page 82
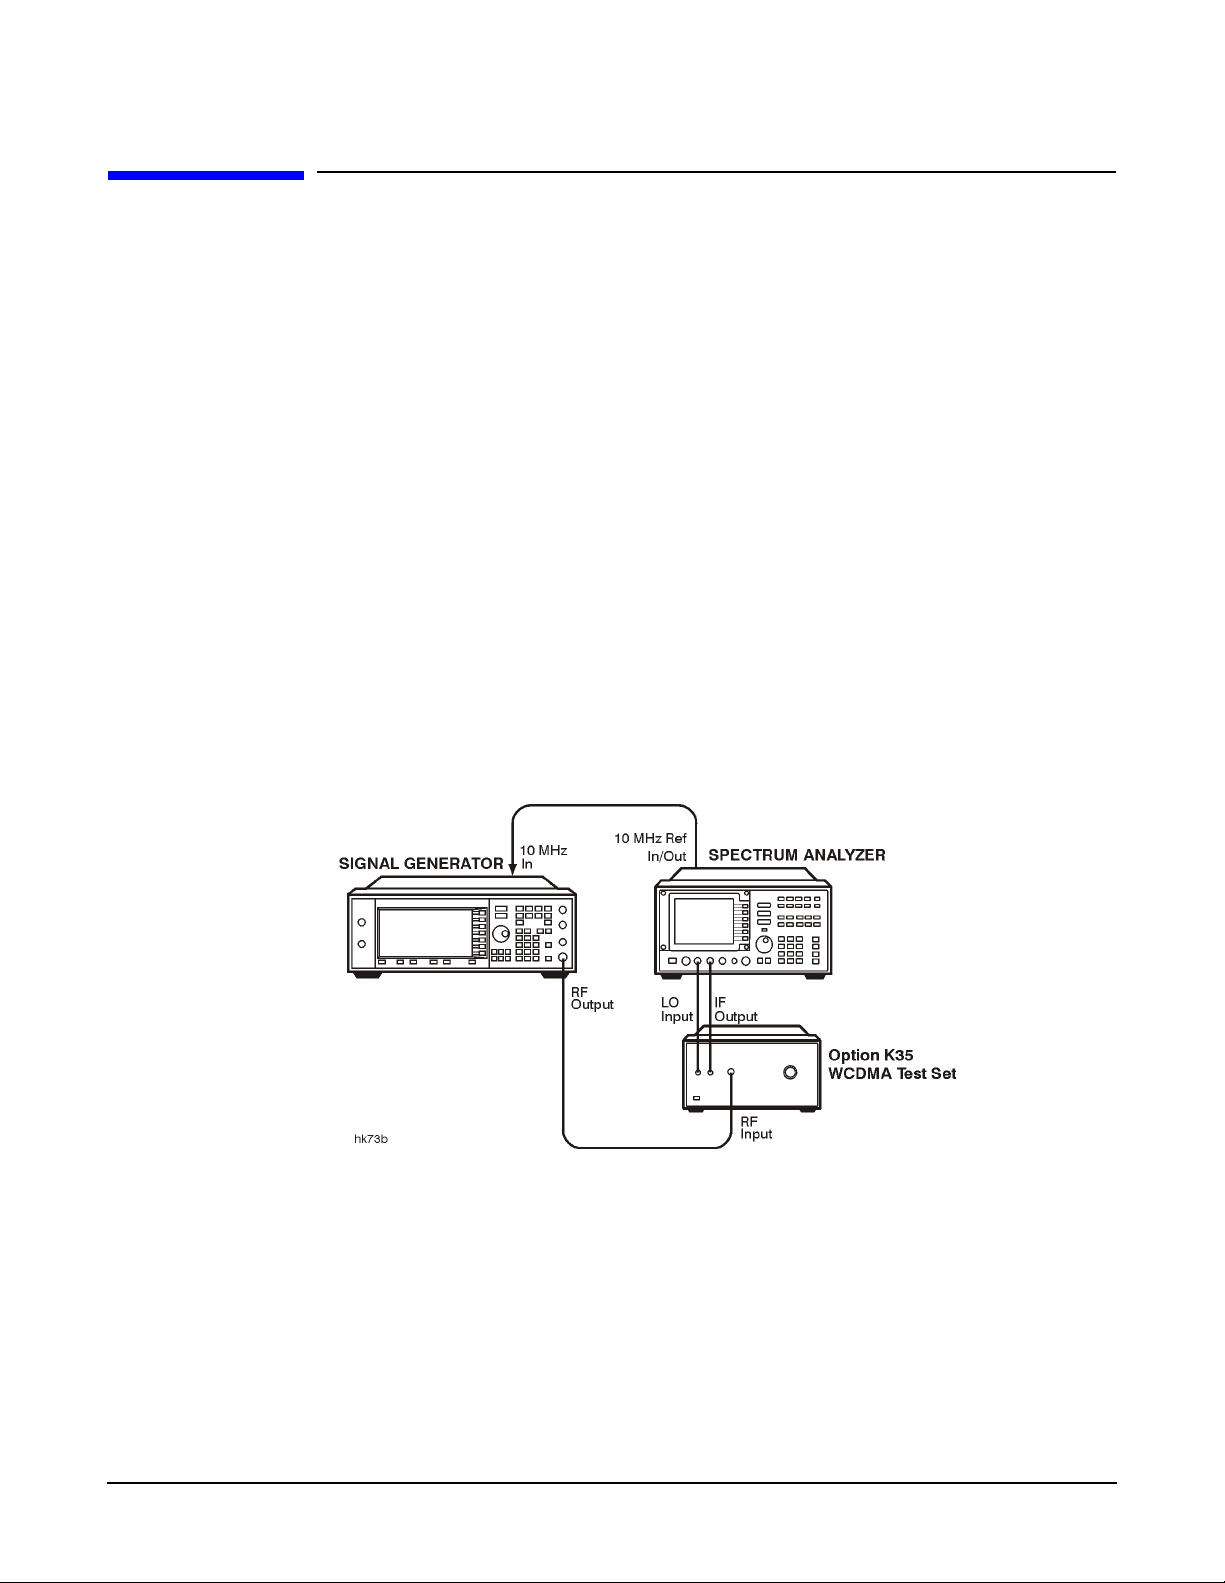
Performance Tests
WCDMA Adjacent Channel Power (Option 400)
WCDMA Adjacent Channel Power
(Option 400)
This automated test measures the ratio of energy in the offset channel to the overall energy in the main
channel. Energ y in the m ain channel is measur ed with RF power on an d wi th RF powe r off. Energy in the
adjacent and alternate channel s is measur ed with RF powe r on and is correcte d for the spect rum analyzer ’s
noise floor; the spectrum analyzer’s noise floor is determined when measuring energ y in the main channel
with RF power off. The Option K35 WCDMA test set increases the spectrum analyzer dynamic range so it is
capable of making the measurement.
Recommended Equipment
• Agilent 8563EC Option K35 spectru m analy zer
• Agilent Option K35 W CDMA test set
Equipment Setup
Figure 3-31 WCDMA Adjacent Channel Power
(Option 400) Setup
3- 34
Page 83

Performance Tests
Phase Noise and Residual FM (Manual Test - Option UNJ or Option 506 Only)
Phase Noi se and Residu al FM
(Manual Test - Option UNJ or Option 506 Only)
The signal generator’s automated performance tests do not include a test for either phase noise or residu a l
FM. These tests mu st be done se pa ra te ly and the re su lts attached to the test re sul ts ob taine d wit h the
Service Support Software. Either output a plot for each measured frequency, or the results of this test can be
record ed us ing the “Agilent E4438C ESG Option UNJ Ve ctor Signal Generator Phase Noise and Residual FM
Perform ance TestRecord” on page 3-43.
Measure phase nois e and resid ual F M on an Agile n t E5500 Series p has e noise measu rem ent system or its
equivalent, at 0.5, 1, 2, 3, and 4 GHz as applicable to the model under test.
Measur i n g P has e Noise
Because of the excellent phase noise performance of signal generators with Option UNJ, a special procedure
with extensive equip me nt is requ ired . The rec ommended method is to use an Agilent E5500 Series phase
noise measurement system. This system is recommended over the older Agilent 3048 phase noise system due
to speed issues and the fact that the older system can n ot directly measure residual FM. Most of the rest of
this discussion refers to the Agilent E5500 Serie s phase noise me asur em ent system, althoug h the prin ciples
apply to both.
The limitation of any mea surement of phase n oise is th at the r esulti ng measuremen t can never be bet ter than
the phase noise of the source used to down-convert the signal . In an Agilent E5500 Series phase noise
measureme nt sy ste m , th is source is typically e ith er an Agile n t 86 44B high-perform an ce RF signal generat or
or an Agilent 8662A/8663A high-performance RF signal generator. Both have advantages and disadvantages.
The Agilent 8644B high-performan ce RF sig nal gen erato r has better phas e noise abov e 10 kHz from the
carrier , while the Agilent 8662A/8663A high-performance RF signal generator has better close-in phase noise,
but is worse above 10 kHz. Other sour ces m ay have differe nt cha racte ris tics. To fully characterize a signal
generator to a high degree of accuracy, bot h so urces may be nee de d .
The following sections illustrate two different measurements of the same device under test (DUT):
• “Using an Agilent 8662A/8663A high-performance RF signal generator” on page 36
• “Using Electronic Frequency Locki ng (EFC)” on page 37
3-35
Page 84

Performance Tests
Phase Noise and Residual FM (Manual Test - Option UNJ or Option 506 Only)
Using an Agilent 8662A/8663A high-performance RF signal generator
Figure 3-32 shows the results of the same DUT measured with an Agilent 8662A/8663A high-performance RF
signal generator . In this measurement, the DCFM method was also used to phase lock the DUT to the Agilent
E5500 Series phase noise mea sur em e nt sys tem . Agai n, this pro duc es 60 Hz-r ela ted spikes as we ll as other
spurs at 20 and 100 kHz. Notice that the phase noise above 10 kHz is also worse than with the Agilent 8644B
high-performance RF signal generator. The DCFM method of testing phase noise with an Agilent
8662A/8663A high-performance RF signal generator should not be used.
Figure 3-32
3-36
Page 85

Performance Tests
Phase Noise and Residual FM (Manual Test - Option UNJ or Option 506 Only)
Using Electronic Frequency Locking (EFC)
Figu re 3-33 shows the result of using the electronic frequency co ntrol ( EFC) method of ph ase-lock ing the DUT
to the Agilent E5500 Series phase nois e measurement system (see its manual for set up procedures). This
method produces the best result, but is not available on all sources (such as the Agilent 8644B
high-performance RF signal gener ator ). Note that the close-in phase noise is now much improved and the
60 Hz related spikes are eliminated. Although the two large spikes still exist, they are the result of the
Agilent 8662A/8663A high-perform anc e RF sign al gener ato r and are not charac teri stic s of the DUT.
Figure 3-33
T o get an accurat e ide a of the actual phase noise of the DUT, it may be necessary to combine the two plot s ,
always using the lowest result of both (see Figure 3-34). Keep in mind that the actual phase noise results are
probably better than wha t is disp layed .
The results shown on the Agilen t E5500 Seri es phase noise measur emen t system may be worse than the
actual DUT. If a test ed de vic e ha s the sam e ph ase noise char ac te ristics as the system ’s down- converting
source, the displayed result will be 3 dB worse tha n ei ther devic e. To eliminate this err o r, measure three
different sources. This results in three equations and three unkn ow ns, and the Service Support Software can
then sort out the actua l resul ts for e ach dev ice. Thi s 3-sourc e subst ituti on method generate s a cor rection ta ble
that can be used for future measurements , effectively eliminating the combined error (of up to 3 dB) for
subsequent meas ureme n ts. For best results, use this method. Refer to the Agilen t E5500 Seri es phase noise
measurement sy stem’s documentation for instructions on how to implement a 3-source substitution. When
the plots in this section were taken, this method was not used. If it had been used, portions of the plots could
have been up to 3 dB better.
Another way of stating the above: for any phase noise mea surement where a 3-source substitution is not
performed, the actual phase nois e of one of the two sources involved (D UT or down-co nverti ng source) is at
least 3 dB better than shown.
3-37
Page 86

Performance Tests
Phase Noise and Residual FM (Manual Test - Option UNJ or Option 506 Only)
Figure 3-34
Measuring Residual FM
Residual FM is closely relate d to phas e nois e. Good phase noise typ ic ally implies good residu al FM. Directly
measuring residual FM at very low levels is difficult, but the Agilent E5500 Series phase noise measurement
system can integrate the phase noise results to determine an accurate value. This is done under the Trace
Integration menu, of the Agilent E5500 Series phase noise measurement system, by selecting a data type of
Snu(f)or Spectral density of frequency fluctuations.
In signal generators with Opt ion UNJ, residual FM is defined only wit hin a 300 to 3000 Hz bandwidth and
with a specified freque nc y resp onse within this band . That freq u e nc y respo ns e is specifie d by a CC ITT f ilter
characteristic. In the Agilent E5500 Series phase noise measurement system, software revision 5.0 or higher,
use of this filter response can be achieved by simply checking the CCITT weighting box under the Trace
Integration menu.
If you use the older Agilent 3048 phase noise system, there is no direct way to measure residual FM, but
because residual FM and phase noise are so closely related and interdependent, it is safe to assume that if the
DUTs phase noise mee ts spe cificatio n , looks ty pi cal (betwee n 300 and 3000 Hz), and shows no unexpe cted
large spikes in the response, it will most likely also meet the residual FM specification.
3-38
Page 87
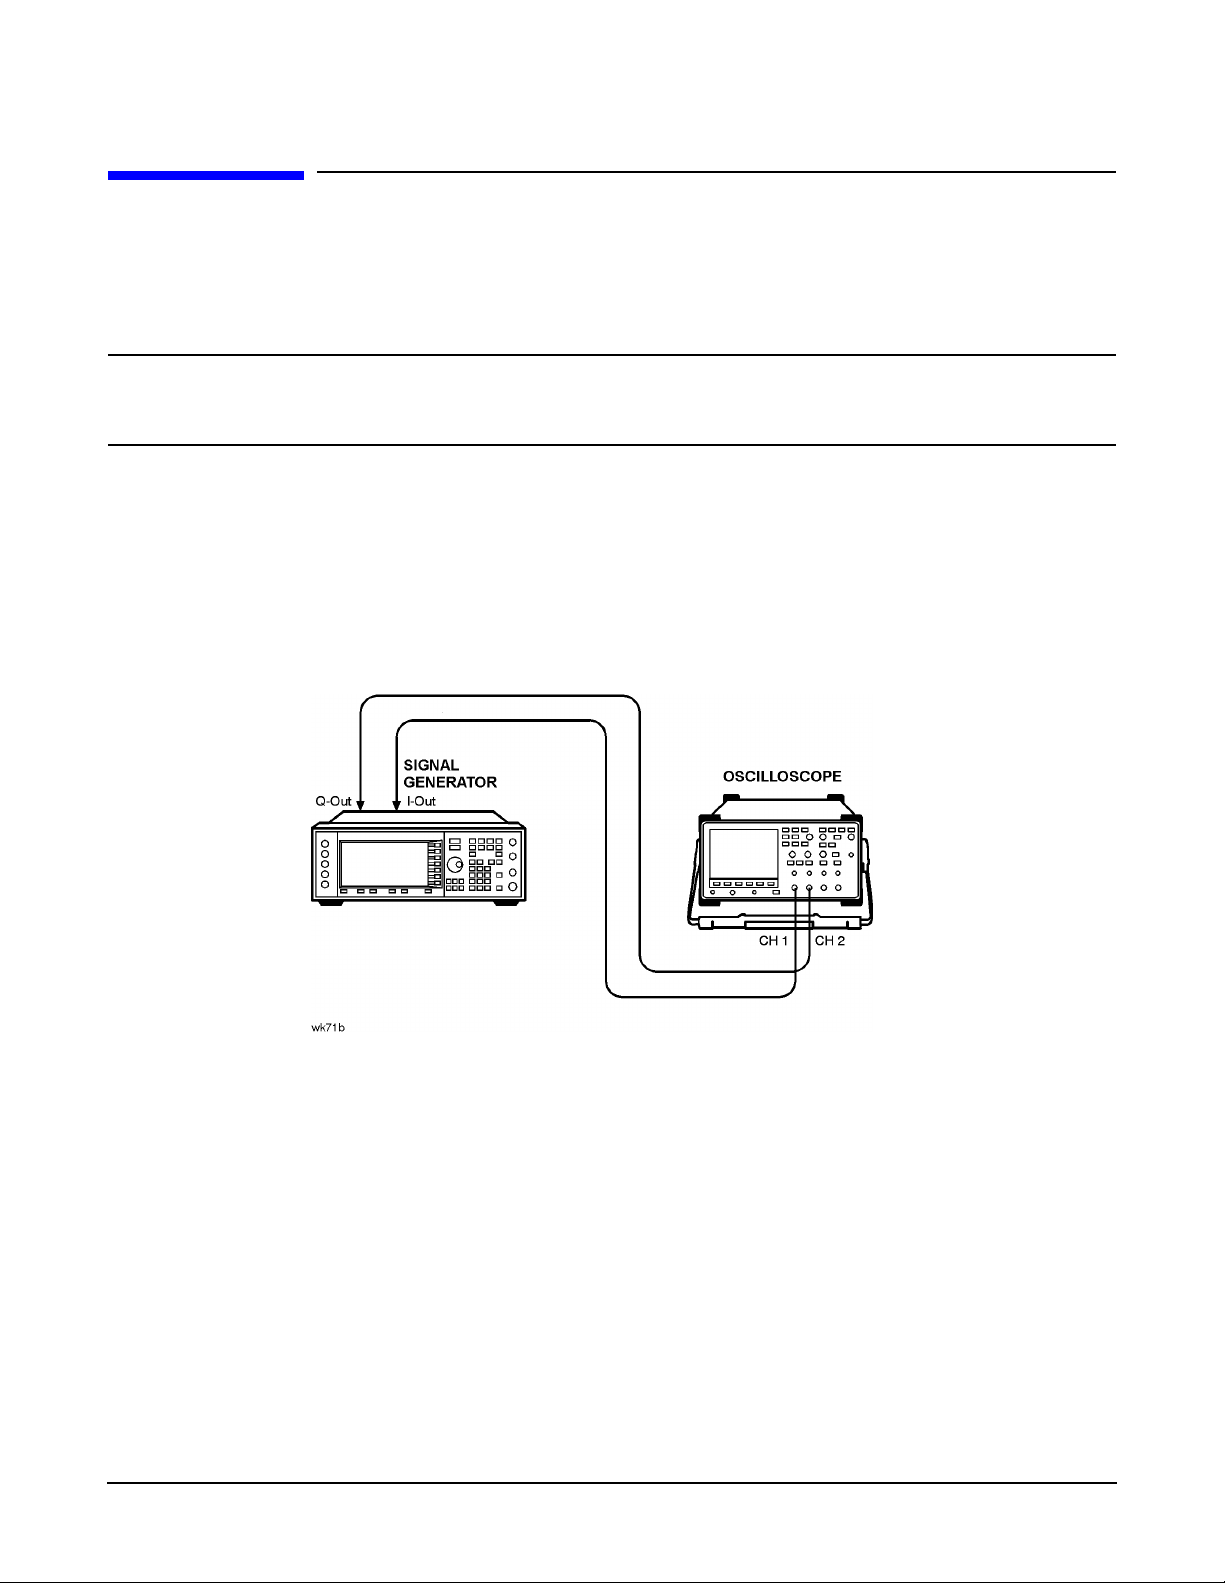
Performance Tests
Dual Arbitrary Waveform Generator Check
Dual Arbitr ar y Wavefo rm Ge ner ator Check
This check verif ies the func tio nality of the dual arbitrary waveform gener ato r. A triangular waveform is
downloaded into the sig nal ge n er ator and then output to th e rear-panel I and Q outputs. An oscilloscope is
used to monitor th e rear-panel I and Q outputs.
NOTE This is not a performance test. This check is only provided t o ensur e tha t the dual arb i tra ry
waveform generator is operational. The results are verified visually on the oscilloscope, and
there is no data that is automatically logged or that can be printed out.
Recommended Equipment
• An oscilloscope with 2 input channels (for example, an Agilent 54610B digital oscilloscope)
Equipment Setup
Figure 3-35 Dual Arbitrary Waveform Gene rator Check Se tup
Procedure
1. Connect the test equipment as shown. The oscilloscope is not connected to GPIB; this allows for the use of
most general 2-channel oscilloscopes.
2. Set the oscilloscope to display both Channel 1 and Channel 2. Set the oscilloscope to trigger on Channel 1.
The recommended settings are:
• Vertic al Sca le : 500 mV/div
• Timebase: 5 microseconds/div
3. Verify that Channel 1 and Channel 2 are both displaying triangular waveforms approximately 180 degrees
3-39
Page 88

Performance Tests
Dual Arbitrary Wavef orm Generator Check
out of phase and tha t they d o not have any d iscon tinuities. Refer to the illustr atio n belo w.
• Frequency is approximately 64 kHz.
• Amplitude is approx imate ly 1. 9 V
p-p
.
• Both waveforms are symmetrical around 0 volts (the average voltage is approximately 0V).
3-40
Page 89

Performance Tests
GSM Loopback BER Ch eck (Option 300 Only)
GSM Loopback BER Check
(Option 300 Only)
This test is a functionality check of the Option 300 GSM BE R hardware, and does not test any specifications.
The instrument’s RF output is connected to the rear panel 321.4 MHz IF input. The test is made with the RF
signal set to 321.4 MHz at 0 dBm. The instrument is specially configured to emulate a GSM base station
(transmitting BCH then TCH signals for synchronization). A BER measurement is made with an expected
result of 0% error. A second BER measurement is made where known errors are added to the bitstream.
Recommended Equipment
No equipment is requ ire d.
Equipment Setup
Figure 3-36 GSM Loopback BER Check
(Option 300 Only) Setup
3-41
Page 90

Performance Tests
PerformanceTest Recor ds
Performance Test Records
The test records at the end of this chapter are provid ed as masters f or you to photocopy.
Table 3-2 provides a place to record the equipment used while Table 3-3 and Table 3-4 are provided for
recording the results of manual tests:
• “Timebase Aging Rate (Manual Test - Option UNJ, Optio n 506, or Option 1E5 Only)” on page 3-24
• “Phase Noise and Residual FM (Manual Test - Option UNJ or Option 506 Only)” on page 3-35
Where applicable, use the Service Support Software to pr i nt ou t a tes t rec ord of the results obtained from the
automated performance tests.
Table 3-2 Agilent E4438C ESG Vector Signal Generat or Performance Test Record
T es t Equipment Used Model Number Trace Number Cal Due Date
Model ___________________ Report Number __________________ Date___________
Arbitrary Waveform Generator
Attenua tor (10 dB)
Audio Analyzer
Frequency Count e r
Function Generator
Low Noise Amp (0.1–10 MHz)
Low Noise Amp (0.03–2 GHz)
Meas uring R eceiver
Mixer (0.5–9 GHz)
Mixer (0.001–2.8 GHz)
Powe r Met er
Powe r Sen so r
Primary Frequency Standard
Signal Generator
Spectrum Analyzer
Vector Signal Analyzer
W-CDMA Spectrum Analyzer
______________
______________
______________
______________
______________
______________
______________
______________
______________
______________
______________
______________
______________
______________
______________
______________
______________
______ __ ___ __ _
_______ __ ____ _
_______ __ ____ _
_______ __ ____ _
_______ __ ____ _
_______ __ ____ _
_______ __ ____ _
_______ __ ____ _
_______ __ ____ _
_______ __ ____ _
_______ __ ____ _
_______ __ ____ _
_______ __ ____ _
_______ __ ____ _
_______ __ ____ _
_______ __ ____ _
______ __ ___ __ _
_____________ _
______________
______________
______________
______________
______________
______________
______________
______________
______________
______________
______________
______________
______________
______________
______________
_____________ _
3-42
Page 91

Table 3-3 Agilent E4438C ESG Vector Signal Generat or
Timebase Aging Rate Performance Test Record
Performance Tests
PerformanceTest Records
Model _____________
Test Description Results Specification
Timebase Aging Rate
Option UNJ
or Option 1E5
_____________________
Report Number
____________________________
< ±0.0005 ppm/day
Date ___________
Measurement
Uncertainty
5.6 × 10
-11
per day
Table 3-4 Agilent E4438C ESG O ption UN J Vector Signal Generator
Phase Noise and Residual FM Performance Test Record
Model
___________________
Phase Noise (20 kHz Offset)
Frequency ( GHz) Specifica tion
0.5 < –134
1.0 < –130
2.0 < –123
Serial No.
__________________
(dBc/Hz)
Date
___________________
Measure m ent Pass/Fail?
Tester
____________________
3.0 < –120
4.0 < –118
Residual FM (CCITT Weighting)
Frequency (GHz) Specification (Hz) Measurement Pass/Fail?
0.5 < 0.5
1.0 < 1
2.0 < 2
3.0 < 3
4.0 < 4
3-43
Page 92

Performance Tests
PerformanceTest Recor ds
3-44
Page 93

4 Adjustments
4-1
Page 94

Adjustments
Overview of Adjustments
Overview of Adju stments
In this section you will learn about all available adjustments for the Agilent E4438C ESG vector signal
generator. These adjustments are p e rfo rme d so that the sig nal ge n er ato r is prope rl y calibrated.
CAUTION In all test e quipm e n t configu rations, cables and adapters need to be prop erly to rq ued .
Exceeding recommended torque values may cause damage to a cable or adaptor and may cause
inaccurate test results.
Connector Type Torque Value
APC 3.5 Use an Agilent 8710-1765 at 8-lb inch when
connecting APC 3.5 (m) to APC 3.5 (f).
SMA Use an Agilent 8710-1765 at 8-lb inch when
connecting APC 3.5 (m) to SMA (f).
Use an Agilent 8710-1582 at 5-lb inch when
connecting SMA (m) to APC 3.5 (f).
Type-N Type-N connectors may be connected finger tight. If a
torque wrench is used, Agilent 8710-1766 at 12-lb.
inch is recommended.
4- 2
Page 95

Overview of Adjustments
Adjustments are listed in the order that they should be performed to minimize changes
in test equipment configurations.
Note that all adjustme nts are not used with all options when calibrating the
Agilent E4438C ESG vector signal generator.
“Internal Reference Oscillator Calibration” on page 4-7
“Analog Bus ADC Calibration” on page 4-8
“Pretune Calibr atio n (Op tion UN J o r Optio n 506 Only ) ” on pag e 4-9
“Internal Source Calibration” on pa ge 4-10
“VCO Bias Pot entiometer Calibration” on page 4-11
“Lock Angle Potentiometer Calibration (Not Used with Option UNJ or Option 506)” on page 4-12
“KV versus Frequency Calibratio n” on page 4-13
“Timebase DAC Calibration” on page 4-14
“FM Scale DAC Offset Calibration” on page 4-15
Adjustments
“FM Path Offset Calibration” on page 4-16
“FM In-Band DAC Offset Calibration” on page 4-17
“FM Inverting Amp l if ier Off set C alibr atio n” on page 4-18
“FM 1/2 Path Ratio Gain Calibration” o n page 4-19
“Modulation Sour ce Re lativ e Ga in C alibr atio n ” on page 4-20
“FM Out-of-Band Calibration (Not Used with Option UNJ or Option 506)” on page 4-21
“FM/PM Out-of-Band Calibration (Option UNJ or Option 506 Only)” on page 4-22
“FM/PM YO Frequency Compensation Calibration (Option UNJ or Option 506 Only)” on page 4-23
“DCFM Calibration” on page 4-24
“External Inp ut Peak Detector C alibration” on page 4-2 5
“AM Audio Path Offset Calibration” on page 4-26
“Burst Modu lator Ca libr atio n ” on pag e 4-27
“Prelevel Calibration” on page 4-28
“VBLO Mixer Bias Calibration” on page 4-29
“Digital Gain Adjust Calibration” on page 4-30
“Bypass Gain Adj ust Cali brat ion” o n pa ge 4-31
“AL C Ca libra tio n” on pa ge 4-32
“Power Level Accuracy, High Power Calibration” on page 4-34
“ ALC Modulation Driver Bias Calibration” on page 4-35
4-3
Page 96

Adjustments
Overview of Adjustments
Adjustments are listed in the order that they should be performed to minimize changes
in test equipment configurations.
Note that all adjustme nts are not used with all options when calibrating the
Agilent E4438C ESG vector signal generator.
“Power Lev el Accurac y, Low Power Calibration” on page 4-36
“Power Search Calibration” on page 4-39
“AM Gai n Calibr atio n” on page 4-40
“I/Q Gain/Offset/Quadrature Calibration” on page 4-41
“I/Q Impairment Calibration” on page 4-42
4- 4
Page 97

Adjustments
Adjustment Relationships
Adjustment Relationshi ps
Anytime an adjustme nt is made to the sig nal gene rator othe r related ad ju stm ent s may be affected. For
optimal performance, whenever an adjustment is performed, the related adjustments shoul d also be
performed.
Analog Bus ADC Calibration Related Adjust ments
The following adjustments are optimized if the “An alog Bus ADC Calibration” on page 4-8 has been run:
• “VCO Bias Potentiometer Ca libra tio n” on p age 4-11
• “FM Inverting Am plif ie r Offse t Ca libration” on pa ge 4-18
• “VBLO Mixer Bias Calibration” on page 4-29
• “ALC Mod ula tio n Drive r Bias Cal ibra tion” o n page 4- 35
• “Power Search Calibration” on page 4-39
• “I/Q Gain/Offset/Quadrature Calibration” on page 4-41
• “I/Q Impairment Calibr ation” on page 4-42
Synthesizer Potentiometer Related Adjustments
The Lock Angle Potentiometer Calibr atio n (No t Used with Option UNJ or Option 506) is preset fully
counter-clockwise in the VCO Bias Potentiometer Calibrat ion. Both adjustments should always be performed
together.
• “VCO Bias Potentiometer Ca libra tio n” on p age 4-11
• “Lock Angle Potentiometer Calibration (Not Used with Option UNJ or Option 506)” on page 4-12
AM Accuracy Related Adjustments
• “Internal Source Calibration” on page 4-10
• “AM Audio Path Offset Calibration” on page 4-26
• “AM Gain C alibration” on page 4-4 0
I/Q Modulation Accu racy Related Adjustments
• “VBLO Mixer Bias Calibration” on page 4-29
• “I/Q Gain/Offset/Quadrature Calibration” on page 4-41
• “I/Q Impairment Calibr ation” on page 4-42
Burst Modulation Accuracy Related Adjustments
• “Burst Modulator Calibration” on page 4-27
4-5
Page 98

Adjustments
Adjustment Relationshi ps
FM Accuracy Related Adjustments
• “Internal Source Calibration” on page 4-10
• “KV versus Frequenc y Ca libr atio n ” on pag e 4-13
• “FM Scale DAC Offset Calibration” on page 4-15
• “FM Path Offset Calibration” on page 4-16
• “FM In-Band DAC Offset C alibr ation” on page 4-17
• “FM Inverting Am plif ie r Offse t Ca libration” on pa ge 4-18
• “FM 1/2 Path Ratio Gain Calibration” on page 4-19
• “Modulation Source Relative Gain Calibrat ion” on p age 4-20
• “FM Out-of-Band Calibration (Not Used with Option UNJ or Option 506)” on page 4-21
• “FM/PM Out-of-Band Calibration (Option UNJ or Option 506 Only)” on page 4-22
• “FM/PM YO Frequenc y Compensat i on Calibra t io n (Option UNJ or Option 506 Only)” on page 4-23
• “DCFM Calibration” on page 4-24
P ower Level Range and Accuracy Related Adjustments
• “Prelevel Calibratio n” on p age 4-28
• “VBLO Mixer Bias Calibration” on page 4-29
• “Digital Gain Adjust Calibration” on page 4-30
• “Bypass Gain Adju st C alibr atio n” on page 4-31
• “ALC Calibration” on page 4-32
• “Pow er Level Acc ur acy, High Power Calibration” on page 4-34
• “ALC Mod ula tio n Drive r Bias Cal ibra tion” o n page 4- 35
• “Power Level Accuracy, Low Power Calibrat io n” o n page 4-3 6
• “Power Search Calibration” on page 4-39
4-6
Page 99
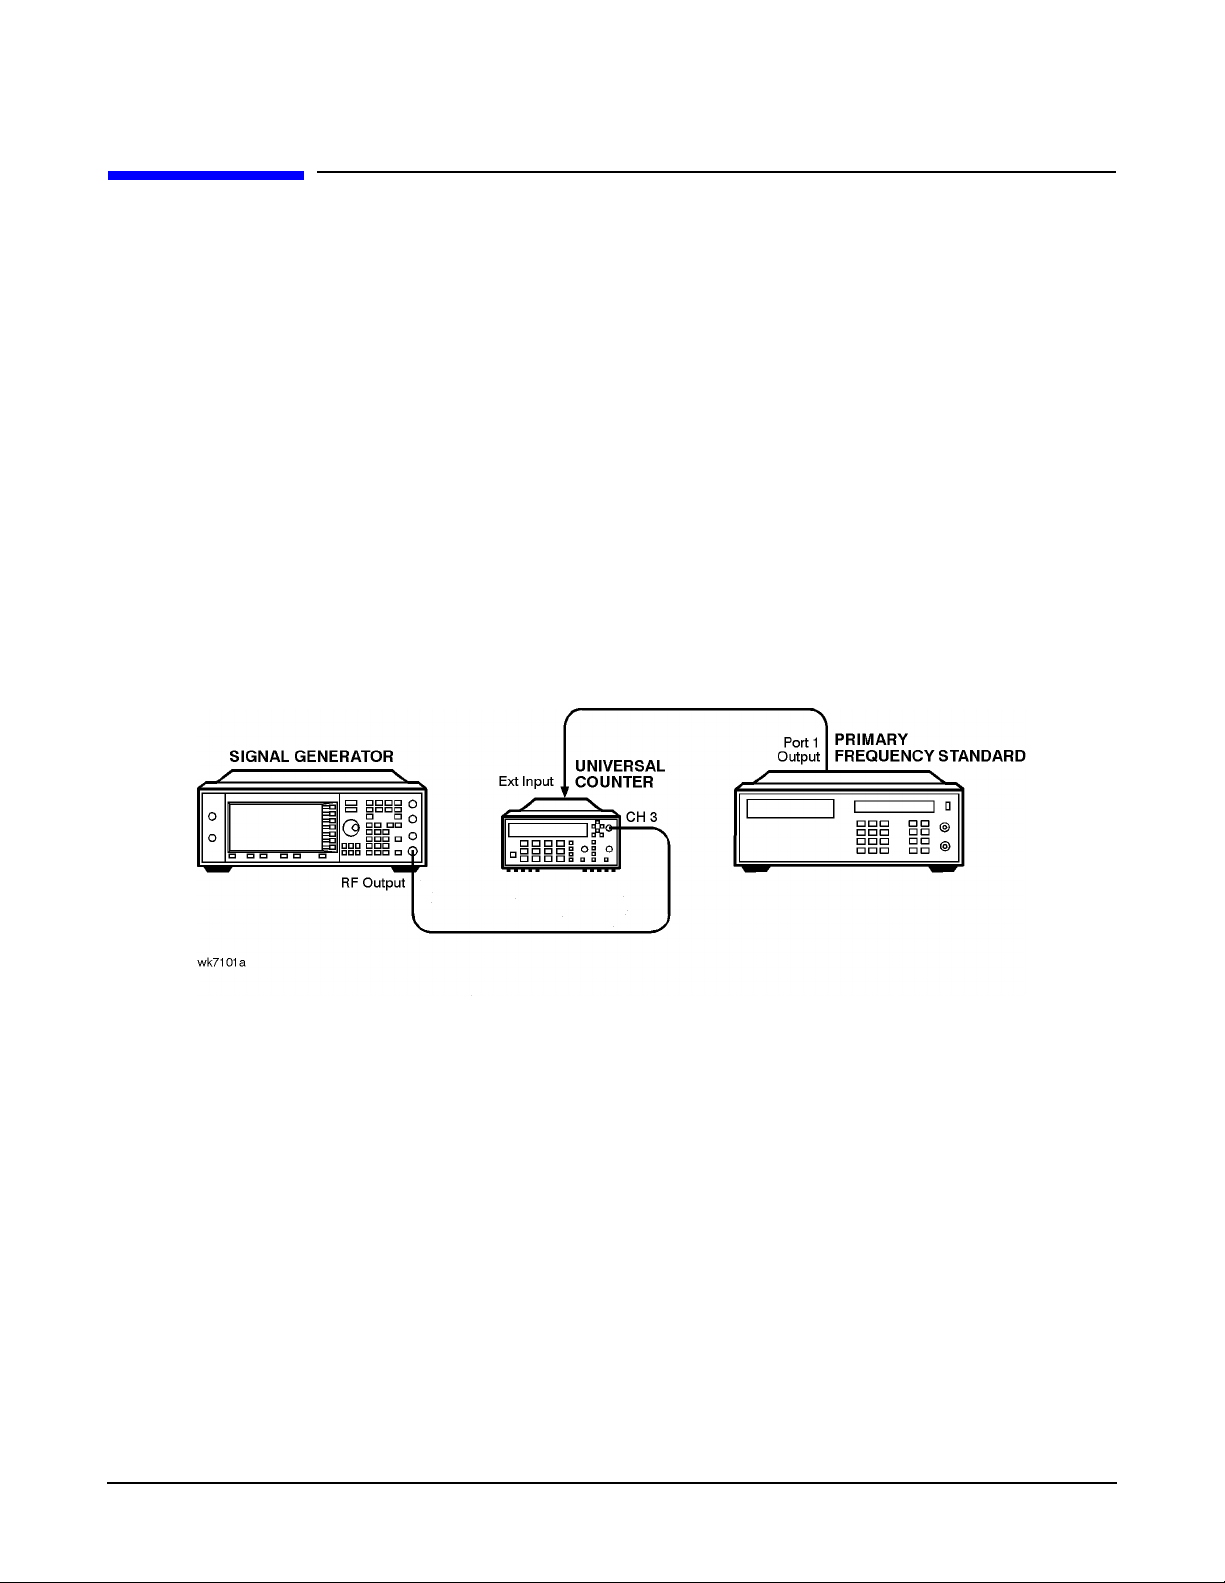
Adjustments
Internal Reference Oscillator Calibration
Internal Reference Oscillator Calibration
Description
This is a manual adjustme nt. An autom ated version of this adju stme nt is also prov id ed.
This procedure is use d to calibr ate the inte r nal r efer en ce DAC s (Dig ital-to-Analog Conve r to rs ). The intern al
reference oscillator is adjuste d with two DACs, one for coars e tuning and one for fine tu ning. Using the two
DACs, the internal reference oscillator can be adjusted to the resolution of the frequency counter used.
Required Test Equipment
• Agilent 53132A Option 050 frequency coun ter
• Use a 10 MHz house standard. (For example, an Agilent 5071A primary frequency standard or equivalent
can be used.)
Procedure
Figure 4-1 Internal Reference Oscillator Calibration Setup
1. Connect the equipment as shown above.
2. Preset all of the equipment.
3. Set the universal counter input to 50Ω.
4. On the signal ge ne r a tor p re ss,
>
Reference Oscillator Adjustment > Ref Osc Fine.
5. Center the fine tuning DAC setting for a value of 128.
6. Press
Ref Osc Coarse on the signal generat or.
Preset > Amplitude > 0 > dBm > RF ON/OFF > Utility > Instr u m e n t Ad ju stments
7. Adjust the coarse tuning DAC setting for a universal counter reading of 100 MHz.
8. Press
9. After adjust ing both of the DA C se ttin gs, press
Ref Osc Fine and adjust the fine tuning DAC setting for a frequenc y coun ter readin g o f 100 MHz,
within 0.1 Hz resolut ion.
Store Ref Osc Setting > Confirm Store.
4-7
Page 100

Adjustments
Analog Bus ADC Calibration
Analog Bus ADC Calibration
Description
This adjustment is used to calibr ate the gain of the ABUS . Th e ABUS is connected to the ground node
(ACOM) and the ADC is zeroed. The ABUS is then connec t ed to the 1 0 V refere nc e and measured. The result
of the measured valu e divided by the ideal value is the ABUS gain calibratio n cons tant. This value is then
saved in the signal ge nerator’s firmware.
Required Test Equipment
• Agilent 3458A Option 002 digita l multim ete r
Procedure
Figure 4-2 Analog Bus ADC Calibration Setup
1. Connect the equipment as shown above.
2. Preset all of the equipment.
3. Follow the instructions as they ap p ear on the con tro ller ’s display.
4-8
 Loading...