

Page 1

BE6027-12
Instruction Manual for
LumaSoft Gas Software
7810 and 7860
Page 2

Index
_________________________________________________________________________
Index
Index ................................................................................................................................. 2
Safety Consid era tions ............................................................................................................. 4
Safety Consid era tions. ......................................................................................................... 5
Warnings! ........................................................................................................................... 6
Chapter 1 Using this Manual .................................................................................................. 7
1.1 Introduction ............................................................................................................... 8
1.2 Screens ..................................................................................................................... 9
1.3 Stand-alone Use ......................................................................................................... 9
1.4 Tool-bar Icons in LumaSoft Gas Monitoring Software 7810 and 7860 ............................... 11
1.4.1 Toolbar: Manage Users ....................................................................................... 11
1.4.2 Toolbar: Main menu ........................................................................................... 11
1.4.3 Toolbar: Measurement ........................................................................................ 12
Chapter 2 Preliminary Tasks ................................................................................................ 13
2.1 Installing the LumaSoft Gas Single Point (7810) or Multi Point (7860) Monitoring Software 14
2.1.1 Computer requirements ...................................................................................... 14
2.1.2 Installing LumaSoft Gas ...................................................................................... 15
2.2 Connecting the Mo n itor and the Multiplexer to a PC ....................................................... 15
2.2.1 Fitting the USB Cable .............................................................................................. 15
2.2.1 Setting the USB Communication Parameters .............................................................. 16
2.2.3 Fitting the Ethernet (TCP/IP) Cable. .......................................................................... 16
2.2.4 Setting the TCP/IP Communication Parameters .......................................................... 16
2.2.5 Fitting the RS-232 Cable ......................................................................................... 19
2.2.6 Setting the RS232 Communication Parameters .......................................................... 19
2.2.7 Checking/Changing the RS-232 Communication Parameters in the Monitor .................... 20
2.2.8 Checking/Changing the Text line Terminator in the Monitor. ........................................ 21
2.2.9 Selecting the PC communication Port ........................................................................ 21
2.2.10 Setting up a Multipoint System with Multipoint Samplers - INNOVA 1309 .................... 21
2.2.11 Setting up a Multipoint System with Multi point Sampler and Doser - INNOVA 1303. ...... 22
2.3 Setting-up User Accounts ........................................................................................... 22
2.3.1 Add User Account .............................................................................................. 23
2.3.2 Edit User Account .............................................................................................. 25
2.3.3 Remove User Account ......................................................................................... 26
2.3.4 Change password of the administrator .................................................................. 26
2.4 Download of the latest version .................................................................................... 27
2.5 Back-up and Restoring of calibration data .................................................................... 27
Chapter 3 Set-up Measurement Task .................................................................................... 28
3.1 New task .................................................................................................................. 29
3.1.1 Configuration of the USB interface ....................................................................... 31
3.1.2 Configuration of the Ethernet (TCP /IP) interface .................................................... 32
3.1.3 Configuration of the RS-232 interface ................................................................... 35
3.2 Measurement set-up .................................................................................................. 37
3.2.1 Configuration .................................................................................................... 37
3.2.2 Monitor Setup .................................................................................................... 38
3.2.3 Multiplexer setup ............................................................................................... 42
3.2.4 Alarms.............................................................................................................. 44
3.2.5 Units ................................................................................................................ 49
Chapter 4 Perform Measurement .......................................................................................... 50
4.1 Measurement start and stop ....................................................................................... 51
4.1.1 Start Measurement ............................................................................................ 52
4.1.2 Stop Measurement ............................................................................................. 53
4.2 Presentation of Data in Graphical Window .................................................................... 53
4.2.1 Presentation of Data in G raphical Window Channel-View ............................................. 53
4.2.1.1 Configuration of the (Channel-View) graphical window ........................................ 54
________________________________________________________________________
BE6027-12 LumaSoft Gas Software LumaSense Technologies A/S
7810 and 7860 Page 2 of 194
Page 3

Index
_________________________________________________________________________
4.2.1.2 Select Gases (Channel view) ............................................................................ 55
4.2.1.3 Configuration of curves (Channel view) ............................................................. 56
4.2.1.4 Configuration of the Graph Window (Channel view) ............................................. 59
4.2.1.5 The Graphical Window ( Channel view) ............................................................... 62
4.2.1.6 Functions in the Gra phical Window (Channel view) .............................................. 63
4.2.1.7 User Events in the gr aphical window (Channel view) ........................................... 69
4.2.1.8 Printing the graphical window(Channel view ) ...................................................... 71
4.2.1.9 Displaying historical data (Channel view) ........................................................... 73
4.2.2 Presentation of Data in Graphical Window Gas-View ................................................... 75
4.2.2.1 Configuration of the (Gas-View) graphical window .............................................. 76
4.2.2.2 Select Channels (Gas view) .............................................................................. 77
4.2.2.3 Configuration of curves (Gas view).................................................................... 78
4.2.2.4 Configuration of filters (Gas view) ..................................................................... 80
4.2.2.5 Configuration of the Graph Window (Gas view) ................................................... 81
4.2.2.6 The Graphical Window (Gas view) ..................................................................... 84
4.2.2.7 Functions in the Graphical Window (Gas View) ................................................... 85
4.2.2.8 User Events in the graphical window (Gas view) ................................................. 91
4.2.2.9 Printing the graphical window(Gas view) ............................................................ 92
4.2.2.10 Displaying historical data (Gas vie w) ................................................................. 94
4.3 Presentation of Data in the Numeric Window ................................................................ 97
4.3.1 Configuration of the Numeric Window ................................................................... 97
4.3.2 The Numeric Window ......................................................................................... 101
4.3.3 User Events in the numeric window ..................................................................... 102
4.3.4 Printing the numeric w indow .............................................................................. 105
4.4 View Measurement alarms ......................................................................................... 107
4.5 Export Task ............................................................................................................. 108
4.5.1 Export Task (Channel view) .................................................................................... 108
4.5.2 Export Task (Gas view) .......................................................................................... 112
4.6 Errors/Warnings Window ........................................................................................... 115
4.7 Export log ............................................................................................................... 117
Chapter 5 Database Management ........................................................................................ 119
5.1 Export Task ............................................................................................................. 120
5.1.1 Export Task (Channel view) .................................................................................... 120
5.1.2 Export Task (Gas view) .......................................................................................... 124
5.2 Export/Import Task Configuration .............................................................................. 127
5.2.1 Export task configuration ................................................................................... 127
5.2.2 Import Task Configuration ................................................................................. 129
5.3 Backup/Rest ore/Delete Ta sk ...................................................................................... 131
5.3.1 Backup Task ..................................................................................................... 131
5.3.2 Restore Task .................................................................................................... 134
5.3.3 Delete Task ...................................................................................................... 136
5.4 Export Log .............................................................................................................. 137
Chapter 6 Warning and Error Messages ................................................................................ 141
6.1 Monitor Error/Warnings ............................................................................................. 142
6.2 Multiplexer (Multipoint sampler) Error/Warnings .......................................................... 142
Appendix A Installation Guide ............................................................................................. 143
Appendix B Remote SQL Server database installation ............................................................ 160
B.1 Remote installation of the LumaSoft Gas database .......................................................... 161
B.2 Finding the Computer name of the foreign PC ................................................................. 161
B.3 Restore(Store) the database onto a foreign PC’s SQL Server ............................................ 163
B.4 Configure LumaSoft Gas 7810/7860 to use a database on a foreign PC’s SQL Server .......... 166
Appendix C OPC Server Tags .............................................................................................. 169
________________________________________________________________________
BE6027-12 LumaSoft Gas Software LumaSense Technologies A/S
7810 and 7860 Page 3 of 194
Page 4

Safety Considerations
_________________________________________________________________________
Safety Considerations
October 2012
________________________________________________________________________
BE6027-12 LumaSoft Gas Software LumaSense Technologies A/S
7810 and 7860 Page 4 of 194
Page 5

Safety Considerations
_________________________________________________________________________
Safety Considerations.
Throughout this manual Monitor is used for:
Photoacoustic Gas Monitor – INNOVA 1412i
Photoacoustic Gas Monitor – INNOVA 1314i
LumaSense SF 6 L eak Detector - 3434i
The Monitor complies with:
• EN/IEC 61010-1, 2nd Edition: Safety requirements for electrical
equipment for measurement, control and laboratory use.
• Can/CSA-C22.2 No. 61010-1-04 - Safety Requirements fo r Electrical
Equipment for Measurement, Control, and Laboratory Use
• UL Std. No. 61010A-1 (2nd Edition) - Safety Requirements for
Electrical Equipment for Measureme nt, Control, and Laboratory Use.
To ensure safe operation and r etain the Monitor in safe condition, note
the following:
EXPLOSION HAZARD!
TO AVOID THE POSSIBILITY OF AN EXPLOSION; MONITORING
OF FLAMMABLE GASES IN EXPLOSIVE CONCENTRATIONS MUST
NEVER BE ATTEMPTED.
Never operate the Monitor in potentially explosive environments.
When monitoring potentially flammable or toxic gases it is essential
that:
• The instrument itself is placed in a well-ventilated area outside the
potentially hazard ou s zone.
________________________________________________________________________
BE6027-12 LumaSoft Gas Software LumaSense Technologies A/S
7810 and 7860 Page 5 of 194
Page 6

Safety Considerations
_________________________________________________________________________
• A sufficiently long tube is connected to the air-outlet on the back
panel so that the sampled gas is carried away to the open air or to an
extraction and/or filtration unit.
Warnings!
• Avoid water condensation in the Monitor.
• Switch off all equipment before connecting or disconnecting their
digital interface. Failure to do so could damage the equipment.
• Whenever it is li kely that correct function or operating saf ety of the
apparatus has been impaired, the apparatus must be made inoperative and secured against unintended operation.
• Any adjustment, maintenance and repair of the open apparatus
under voltage must be a voided as far a s possible and , if unavo idable,
must be carried out only by trained personnel.
• If a fault is reporte d by the Monitor th at indicates corr ect function of
the instrument may be impaired, consult your local LumaSense
Technologies representative. Under no circumstances should repair
be attempted by persons not qualified in service of electronic
instrumentation.
________________________________________________________________________
BE6027-12 LumaSoft Gas Software LumaSense Technologies A/S
7810 and 7860 Page 6 of 194
Page 7

Chapter 1
_________________________________________________________________________
Chapter 1
Using this Manual
October 2012
________________________________________________________________________
BE6027-12 LumaSoft Gas Software LumaSense Technologies A/S
7810 and 7860 Page 7 of 194
Page 8

Chapter 1
_________________________________________________________________________
1.1 Introduction
This manual can be used in several ways. The f irst time users can work
their way through the exa mples in order to get to know the monitoring
system. The more experienced users can jump directly to the relevant
chapters in order to gain assistance , an d expe rts ca n use t his manua l as
a reference book by using the index.
The LumaSoft Gas Single Point 7810 Software is used as a single
channel monitoring software for Photoacoustic Gas Monitor – INNOVA
1412i, Photoacoustic Gas Monitor – INNOVA 1314i and Lu maSense SF6
Leak Detector - 3434i.
The LumaSoft Gas Mult i Point 7860 Softwa re is used as a multi chan nel
monitoring Software for Photoacoustic Gas Monitor – INNOVA 1412i in
system, Photoacoustic Ga s Mo nito r – INNOVA 1314i and LumaSense SF6
Leak Detector - 3434i with up to two Multipoint Samplers – INNOVA
1309 or four Multipoint Sampler and Doser - INNOVA 1303.
NOTE: The LumaSoft Gas Multi Point 7860 Software requires a license
dongle connected to the USB port in order to run.
________________________________________________________________________
BE6027-12 LumaSoft Gas Software LumaSense Technologies A/S
7810 and 7860 Page 8 of 194
Page 9
Chapter 1
SELECT SET-UP BRANCH
1. Menu bar option e.g. File
_________________________________________________________________________
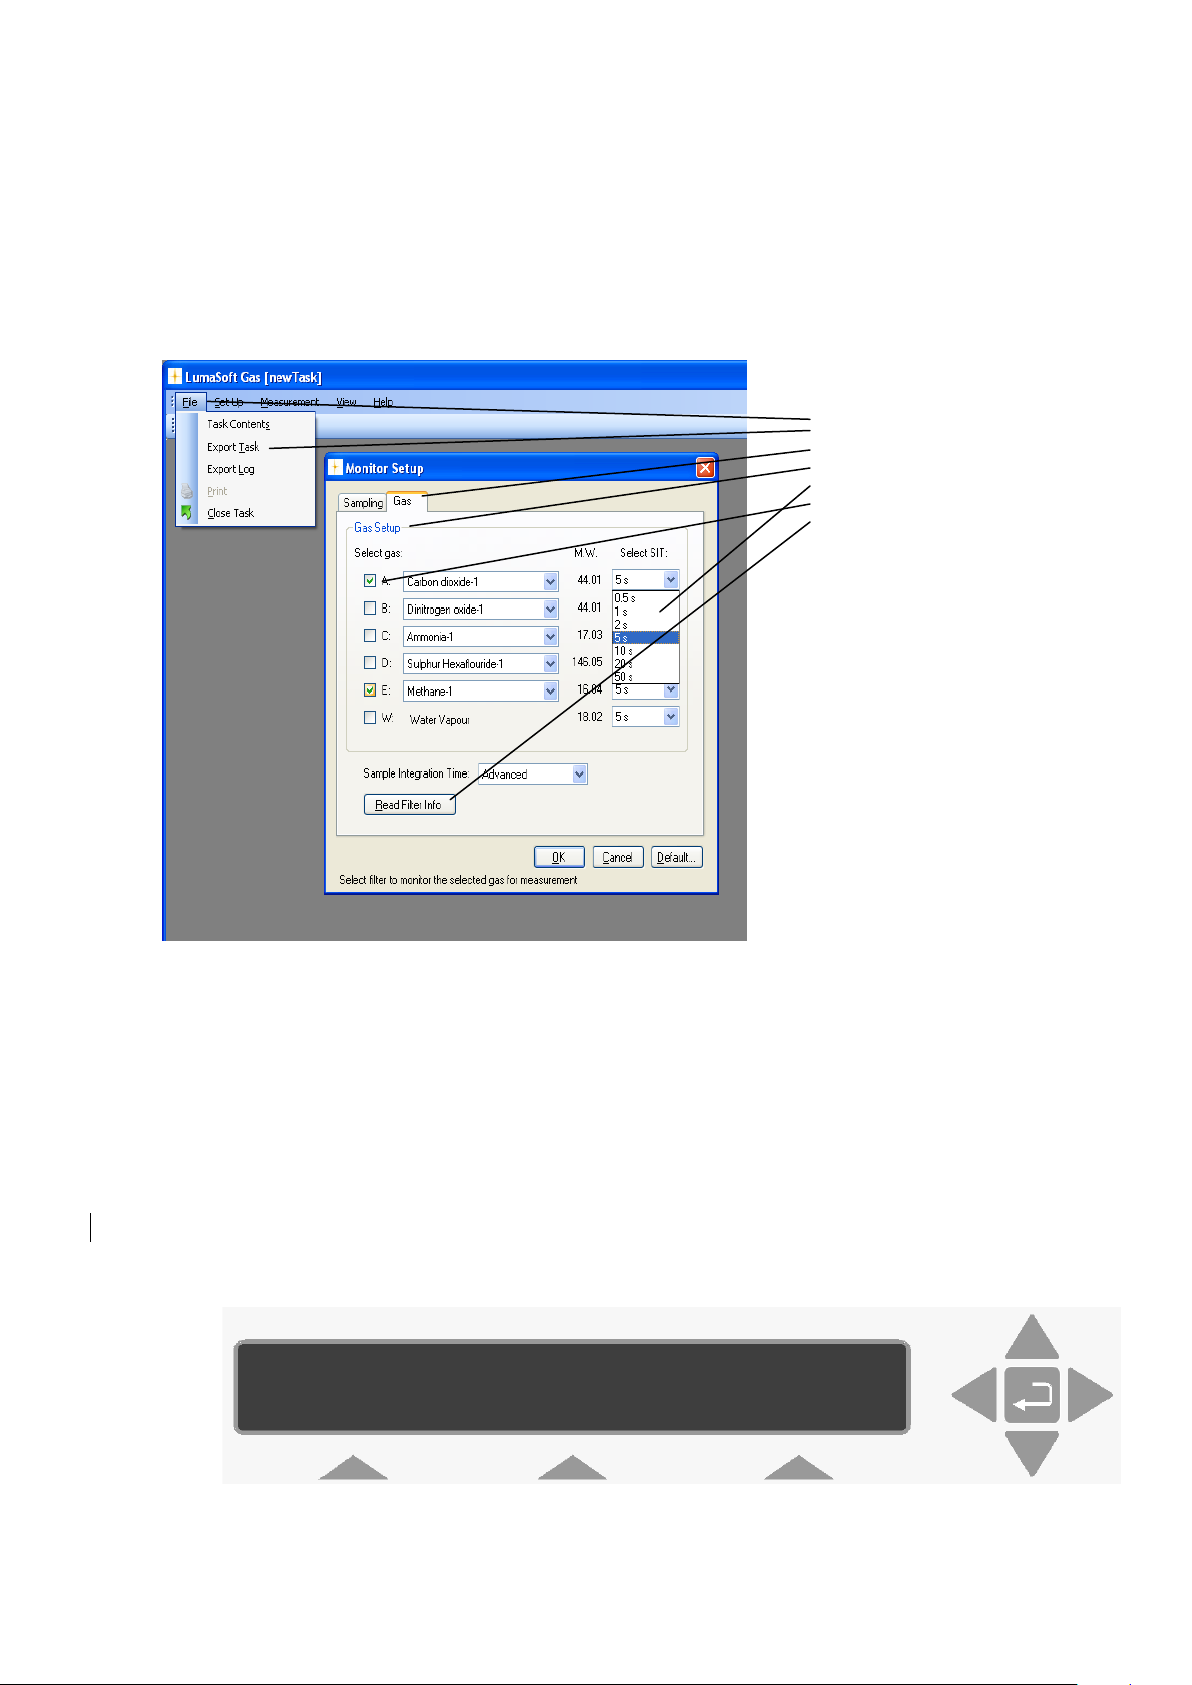
1.2 Screens
The information displayed on screen is presented in this manual as
shown below:
2. Pull down menu option Export T a sk
3. Index card e.g. Gas
4. Group e.g. Gas Se t up
5. Select Field e.g. Select SIT
6. Check box used to select options
7. Soft-key e.g. Read Filter Info
1.3 Stand-alon e U se
Radio push-buttons : these are not illustrate d above, but are commonly
used in the softwar e. T hey act a s a tog gle func tion whe n s eve ral o ptions
are available, but only one can be selected at a time.
In some situations, it may be necessary to set up the Monitor without
connecting it to a P C. The way the se instruction s ar e prese nted is sho wn
below:
MEASUREMENT FORMAT CONFIGURATION
________________________________________________________________________
BE6027-12 LumaSoft Gas Software LumaSense Technologies A/S
7810 and 7860 Page 9 of 194
Page 10

Chapter 1
↵
_________________________________________________________________________
The display above is used through-out this manual. It assists you
displaying the text on screen and by indicating which of the pushbuttons can and should be pressed.
In general, the push-bu ttons shown ab ove are use d to navigate throug h
the various modes poss ible withi n the Monitor but are describe d in more
detail below:
These push-buttons are illustrated as S 1, S2 and S3. They correspond
to the key and their position on the instrument.
These select push-buttons enable you to select one of the options
displayed.
This gr oup of 5 push-buttons are referred to in this manu al collectively
as the direction keys. The symbols below are used to simplify the
instruction in this manua l .
▲ & ▼ enable you to increase & decrease numbers, respectively, or to
go to the Previous & Next Displays, respectively.
◄ & ► enable you to move across number fields o r go to the Previous &
Next gases, respectively.
, depending on the situations, acts as an “Enter” or “Go To Head” key.
Memory Function push-buttons are always represented with the name of
the push-button enclosed in a box which is shaded-in.
SYSTEM Text that appears on the display screen is shown in an open
shaded box, using UPPER case letters.
FORMAT System General Clock
When referring to any part of the Set-up “tr ee”, the text i s shown
in open shaded box es with the same type face as that used in t he
“tree”.
________________________________________________________________________
BE6027-12 LumaSoft Gas Software LumaSense Technologies A/S
7810 and 7860 Page 10 of 194
Page 11
Chapter 1
_________________________________________________________________________
For further description refer to “BE6025 Instruction Manual, 1412i
Photoacoustic Gas Monitor“
1.4 Tool-bar Icons in LumaSoft Gas Monitoring Softwar e 7810 and 7860
The instructions in this manual use the pull-down menu paths to
describe how operations are possible. However, in many cases, the icons
in the tool-bars can be used to speed things up. Top Level toolbars and
icons are presented in the following sections.
Other toolbars and icons will be presented in subsequent chapters.
1.4.1 Toolbar: Manage Users
Opens a window dialog to create new users
Change the password for the administrator
Log off administrator
Show information about software version
1.4.2 Toolbar: Main menu
Create new task
Open existing task
Delete task
Log off
Exit program
Show information about software v ersion
________________________________________________________________________
BE6027-12 LumaSoft Gas Software LumaSense Technologies A/S
7810 and 7860 Page 11 of 194
Page 12
Chapter 1
_________________________________________________________________________
1.4.3 Toolbar: Measurement
System configuration
Start measurement
Stop measurement
Close task
Show information about software v ersion
________________________________________________________________________
BE6027-12 LumaSoft Gas Software LumaSense Technologies A/S
7810 and 7860 Page 12 of 194
Page 13

Chapter 2
_________________________________________________________________________
Chapter 2
Preliminary Tasks
October 2012
________________________________________________________________________
BE6027-12 LumaSoft Gas Software LumaSense Technologies A/S
7810 and 7860 Page 13 of 194
Page 14

Chapter 2
Processor
Minimum: 1 gigahertz (GHz) Pentium processor
Operating
Windows XP SP2
Windows Vista
Windows 7
RAM
Minimum: 512 MB (XP) 1024 MB (Vista) 2048 MB (7)
Hard Disk
Up to 500 MB of available space may be required.
Display
Minimum: 1024 x 768 high color, 32-bit
Total port
2 USB ports
Or
1 USB port and 1 Ethernet (TCP/IP) port
Or
1 USB port and one RS232 port
Connection to
1 USB port
Or
1 Ethernet (TCP/IP) port
Or
1 RS-232 port
Connection to
dongle
1 USB port for LumaSoft Gas License Dongle Key (This
License Dongle key is delivered by Lu ma Sense)
_________________________________________________________________________
When taking delivery of the System three very important and
preliminary tasks must be completed before starting to operate it:
Install the LumaSoft Gas Software (7810 or 7860) see Section 2.1.
Connect the Monitor and the Multiplexer to a PC (Section 2.2).
Setting-up User Accounts (Section 2.3).
2.1 Installing the LumaSoft Gas Single Point (7810) or Multi Point (7860) Monitoring S oftware
2.1.1 Computer requirements
The Software is targeted to w ork on a Desktop/Laptop PC environment
running a Microsoft Win do ws Oper a tin g Sys te m.
Before installing the Software the PC must mee t the following minimum
requirements:
System
connections
Gas Monitor
License
Microsoft Office is required if using the export to Excel file
format functionality in LumaSoft Gas.
Table 2.1 Computer requirements
________________________________________________________________________
BE6027-12 LumaSoft Gas Software LumaSense Technologies A/S
7810 and 7860 Page 14 of 194
Page 15

Chapter 2
_________________________________________________________________________
2.1.2 Installing LumaSoft Gas
The LumaSoft Gas software is delivered on a CD with an installation
program. Please refer to Appendix A how to perform the installation of
the LumaSoft Gas software. It is recommended that your system
administrator performs the task of installing the LumaSoft Gas program.
After the installation is successfully completed the LumaSense ->
LumaSoft Gas program menu is created.
The “LumaSoft Gas” program icon (Figure 2.1) is also placed on your
desktop for easy access to the program.
Figure 2.1 LumaSoft Gas desktop shortcut
2.2 Connecting the Monitor and the Multiplexer to a PC
The Monitor comes complete with an USB interface cable.
Optionally an Ethernet (TCP/IP) interface cable or a 9-pin to 9-pin null
modem RS-232 interface cable c an be delivered.
2.2.1 Fitting the USB Cable
The USB interface cable can be connected while the gas monitor is
switched on.
Locate an USB port at the back of the PC; refer to your PC manual if in
doubt. Pus h the connector on the USB cable on to the USB port socket
on the PC.
Locate the output labelled at the back of the Monitor. Push the
connector at the other end of the USB cable on to this socket.
________________________________________________________________________
BE6027-12 LumaSoft Gas Software LumaSense Technologies A/S
7810 and 7860 Page 15 of 194
Page 16

Chapter 2
SELECT ADDRESSABLE SET-UP BRANCH
IS 1412i'S IP ADDRESS SET BY DHCP ?
_________________________________________________________________________
2.2.1 Setting the USB Communication Parameters
No setup on the 1412i/1314i/3434i gas monitor is necessary in order to
be able to communicate with the 1412i/1314i/3434i gas monitor
through an USB connection.
2.2.3 Fitting the Ethernet (TCP/IP) Cable.
The gas monitor can be connected to a local Ethernet network, which
communicates using the TCP/IP network interface protocol or to view
the homepage of the gas monitor in a standard PC internet browser.
The Ethernet network cable can be connected while the gas monitor is
switched on.
Locate the Ethernet socket connector labelled at the back of the
Monitor. Connect a standard Ethernet network cable to the Ethernet
socket connector on the back of the gas mo nitor. Connect t he other end
of the Ethernet network cable to your local network. The yellow LED on
the Ethernet socket connector will lit, if a local network connection is
detected.
2.2.4 Setting the TCP/IP Communication Parameters
It is recommended that your system administrator sets-up the TCP/IP
communication parameters.
The communication parameters for the TCP/IP interface can be set by
using the push-buttons on the front of the monitor.
1. Press SET-UP CONFIGURATION System Communication Addressable.
The screen display now shows the following text.
TCP/IP IEEE 4 8 8
2. Press TCP/IP to enter the TCP/IP setup. During this setup you can
also use the ▲ and ▼ keys to go back and forth between the
available TCP/IP settings. The screen display now shows the
following text.
NO YES
________________________________________________________________________
BE6027-12 LumaSoft Gas Software LumaSense Technologies A/S
7810 and 7860 Page 16 of 194
Page 17

Chapter 2
1412i'S IP ADDRESS 192.168.000.200
PRESS ENTER TO CHANGE VALUE
1412i'S IP ADDRESS 192.168.000.200
CANCEL DEFAULT
1412i'S IP PORT NUMBER: 23
PRESS ENTER TO CHANGE VALUE
_________________________________________________________________________
3. Here you can select whether the IP address of the 1412i/1314i/3434i
gas monitor is to be as signed by a DHCP se rver in the local network.
If you want the 1412i's, 1314i's or 3434i's IP address to be assigned
by the DHCP server pre ss the Yes key, where after you will proceed
to the below step 6 , as the IP a ddress is set by the DHCP se rver. If
you want yourself to set the IP address of the 1412i/1314i/3434i
press the No key. The screen display now shows the following text.
4. Here you can change the IP address of the 1412i/1314i/3434i gas
monitor in case the IP address is not set by a DHCP server in the
local network. If you want to change the IP address, press the ↵
key. If the IP address does no t need to be change d, press the ▼ key
and you will proceed to the below step 6.
If you selected to change the IP address, the screen display now
shows the following text.
5. Here you can change the 4 individual numbe rs in the IP address by
using the ▲ and ▼ keys. Each of the 4 individ ual nu mbe r s ca n be s e t
in the range from 000 to 255.
You can step between the 4 individual numbers in the IP address by
using the ◄ and ► keys.
In case you want to return to the start value of the IP addre ss press
the CANCEL key. In case you want to return to the default stored
value of the IP address press the DEFAULT key.
When you have set the IP address, press the ↵ key. The screen
display now shows the following text.
6. Here you can se t the IP port number for the TCP/IP co mmunication.
This normally does not need to be changed. If you want to change
the IP port number press the ↵ key. If the IP por t numbers does not
need to be changed, press the ▼ key and you will proceed to the
below step 8. If you selected to change the IP port number the
screen display now shows the following text.
________________________________________________________________________
BE6027-12 LumaSoft Gas Software LumaSense Technologies A/S
7810 and 7860 Page 17 of 194
Page 18

Chapter 2
1412i'S IP PORT NUMBER: 23
CANCEL DEFAULT
PROTECTED IP ADDRESS 000.000.000.000
PRESS ENTER TO CHANGE VALUE
PROTECTED IP ADDRESS 000.000.000.000
_________________________________________________________________________
7. Now you can chang e the IP po r t n umber by using the ▲ and ▼ keys.
The port number can be set in the range from 0 to 32767.
In case you want to r eturn to the start value of the IP port numbe r
press the CANCEL key. In case you want to return to the default
stored value of the IP port number press the DEFAULT key.
When you have set the IP port number , press the ↵ key. The screen
display now shows the following text.
8. In case you want the 1412i/1314i/3434i gas monitor to be able to
communicate only with a certain PC on the local network, you can
set the IP address o f this PC a s t he pr otecte d IP addre ss. This ca n be
desired due to security reasons so no other PC is able to
communicate with the 1412i/1314i/3434i gas monitor.
If no protection is de sired the protected IP addre ss should be set to
a value of 000.000.000.000.
If you want to change the protected IP address, press the ↵ key. If
the protected IP ad dress does not need to be change d, press the ▼
key and you will proceed to the below step 10.
If you selected to change the pro te cte d IP a ddre s s t he scr e e n disp lay
now shows the following text.
CANCEL DEFAULT
9. Here you can change the 4 individual numbers in the protected IP
address by using the ▲ and ▼ keys. Each of the 4 individual
numbers can be set in the range from 000 to 255.
You can step between the 4 individual numbers in the protected IP
address by using the ◄ and ► keys.
In case you want to return to the start value of the protected IP
address press the CANCEL key. In case you want to return to the
default stored value of the protected IP address press the DEFAULT
key.
When you have set the protected IP address, press the ↵ key.
If you previously selecte d the IP address NO T to be set by the DHCP
server, you can proceed to t he below step 11.
If you instead selected that the IP address to be set by the DHCP
server, the screen display now shows the following text.
________________________________________________________________________
BE6027-12 LumaSoft Gas Software LumaSense Technologies A/S
7810 and 7860 Page 18 of 194
Page 19

Chapter 2
CURRENT DHCP ADDRESS 192.168.000.062
ACCEPT
_________________________________________________________________________
10. Here the IP address of the 1412i/1314i/3434i, which has been
assigned by the DHCP server is displayed. This IP address can be
used to manually set TCP/IP communication in a PC application,
which accesses the 1412i/1314i/3434i gas monitor.
Press the ACCEPT key to accept.
11. This concludes the setup of the TCP/IP parameters of the
1412i/1314i/3434i gas monitor.
Press the SET-UP key to leave the setup.
2.2.5 Fitting the RS-232 Cable
Ensure that both th e Monitor and the PC ar e switched off at the mains .
Failure to do so may result in your equipment being damaged.
Locate the serial port at the back o f the PC ; refer to your PC manual if in
doubt.
Push the connector on the R S-232 cab le on to the s eria l po r t so cke t, a nd
secure it firmly using the securing screws.
Locate the output labelled “RS-232” at the back of the Monitor.
Push the connector at the other end of the RS-232 cable on to this
socket, and secure it firmly using the securing screws.
Turn on the PC. Wait for Windows to start up.
The Monitor can be turned on at the mains.
2.2.6 Setting the RS232 Communication Parameters
In order for the RS-232 communication to be successful, it is essential
that the communication para me ter s ar e se t cor re ctly. This is a two stage
process: the PC communication port is selected via the LumaSoft Gas
software while the baud rate, parity, data bits and stop bits are defined
via the Monitor.
The communication parameters necessary for the Monitor to
communicate with the LumaSoft Gas are shown below in Table 2.2.
________________________________________________________________________
BE6027-12 LumaSoft Gas Software LumaSense Technologies A/S
7810 and 7860 Page 19 of 194
Page 20
Chapter 2
Baud rate
9600
Stop bits
1
Data bits
7
Parity
Even
Hardwire mode
Leased line
Handshake type
Hardwire
Text line Terminator
CR-LF
Print Data Log
NO
Print Error Log
NO
_________________________________________________________________________
Table 2.2 Monitor RS232 communication parameters
These are set as the default values in the Monitor.
To prevent commun icatio n errors, the te x t line te r minato r , p rin t data lo g
and print error log must be set as shown in Table 2.3.
Table 2.3 More Monitor parameters
2.2.7 Checking/Changing the RS-232 Communication Parameters in the Monitor
The communication parame ter s fo r the serial inte r face must be set using
the push-buttons on the front of the Monitor.
1. Press SET-UP S3 S1 S3 S1 (see Chapter 1.3) .The screen display
shows the following text.
If the baud rate displayed is incorrect press ↵ and use ▲ and ▼ to
display the correct value. Press ↵ again to store the selection.
If the baud rate displayed is correct, then press ▼ to continue to the
next parameter.
Press S1 to select 1 STOP BIT.
Press S1 to select 7 DATA BITS
Press S2 to select EVEN PARITY
Press S3 to select LEASED-LINE
Press S3 to select HARD-WIRED HANDSHAKE.
Press SET-UP to exit the set-up mode
Press RESET and S1 in order that the new settings are enabled.
________________________________________________________________________
BE6027-12 LumaSoft Gas Software LumaSense Technologies A/S
7810 and 7860 Page 20 of 194
Page 21

Chapter 2
_________________________________________________________________________
The Monitor and the LumaSoft Ga s Monitoring Software are now able to
communicate together.
2.2.8 Checking/Changing the Text line Terminator in the Monitor.
The Text line Terminator must be set using the push-buttons on the
front of the Monitor.
Press SET-UP S2 ▼S3
Press SET-UP to exit the set-up mode
2.2.9 Selecting the PC communication Port
It is just a simple case of selecting the correct port on the PC. The
software shows the COM por ts that are pr esent in the sys tem to choos e
from: COM1, COM2, COM3…. If you are not sure which por t the cable is
connected on your computer refer to your PC manual.
2.2.10 Setting up a Multipoint System with Multipoint Sa mplers -
INNOVA 1309
The 1309(s) is connected to the Gas Monitor using IEEE-488 cable(s).
To avoid data errors, this cable must conform to the specifications laid
down in the IEEE-488 standard, particularly with regard to length,
connector type and “daisy -chaining”. LumaSense can supply the correct
cables, Cable order no. AO0265 (2m) or WL0845 (1m).
Caution: To avoid permanently damaging the delicate electronics in a
1309 or the Monitor , you must ensure t hat all IEEE-488 ins truments are
switched off before connecting or disconnecting the interface cables.
The IEEE–488 address of each 1309 in the system must be set before
communication with the PC can occur . T he addr ess is se t using t he e ight
DIP switches located on the back panel of the 1309. The decimal
address of the instrument is expressed as a binary number, the MSD
(Most significant DIP switch) being to the left looking onto the back
panel. Table 2.4 will guide you.
________________________________________________________________________
BE6027-12 LumaSoft Gas Software LumaSense Technologies A/S
7810 and 7860 Page 21 of 194
Page 22

Chapter 2
Decimal
(looking onto rear)
sampler
Decimal
_________________________________________________________________________
DIP switch setti ng
Address
15 0 0 0 0 1 1 1 1 1
13 0 0 0 0 1 1 0 1 2
Table 2.4 Setting the 1309 address
1309 multipoint
2.2.11 Setting up a Multipoint System with Multipoint Sampler
and Doser - INNOVA 1303.
The 1303(s) is connected to the Gas Monitor using IEEE-488 cable(s).
To avoid data errors, this cable must conform to the specifications laid
down in the IEEE-488 standard, particularly with regard to length,
connector type and “daisy -chaining”. LumaSense can supply the correct
cables, Cable order no. AO0265 (2m) or WL0845 (1m).
Caution: To avoid permanently damaging the delicate electronics in a
1303 or the Monitor, you must e nsure that all IE EE-488 instrume nts are
switched off before connecting or disconnecting the interface cables.
The IEEE–488 address of each 1303 in the system must be set before
communication with the PC can occur . T he addr ess is se t using t he e ight
DIP switches located on the back panel of the 1303. The decimal
address of the instrument is expressed as a binary number, the MSD
(Most significant DIP switch) being to the left looking onto the back
panel. Table 2.5 will guide you.
Address
DIP switch setti ng
(looking onto rear)
1303 multipoint
sampler
2.3 Setting-up User Accounts
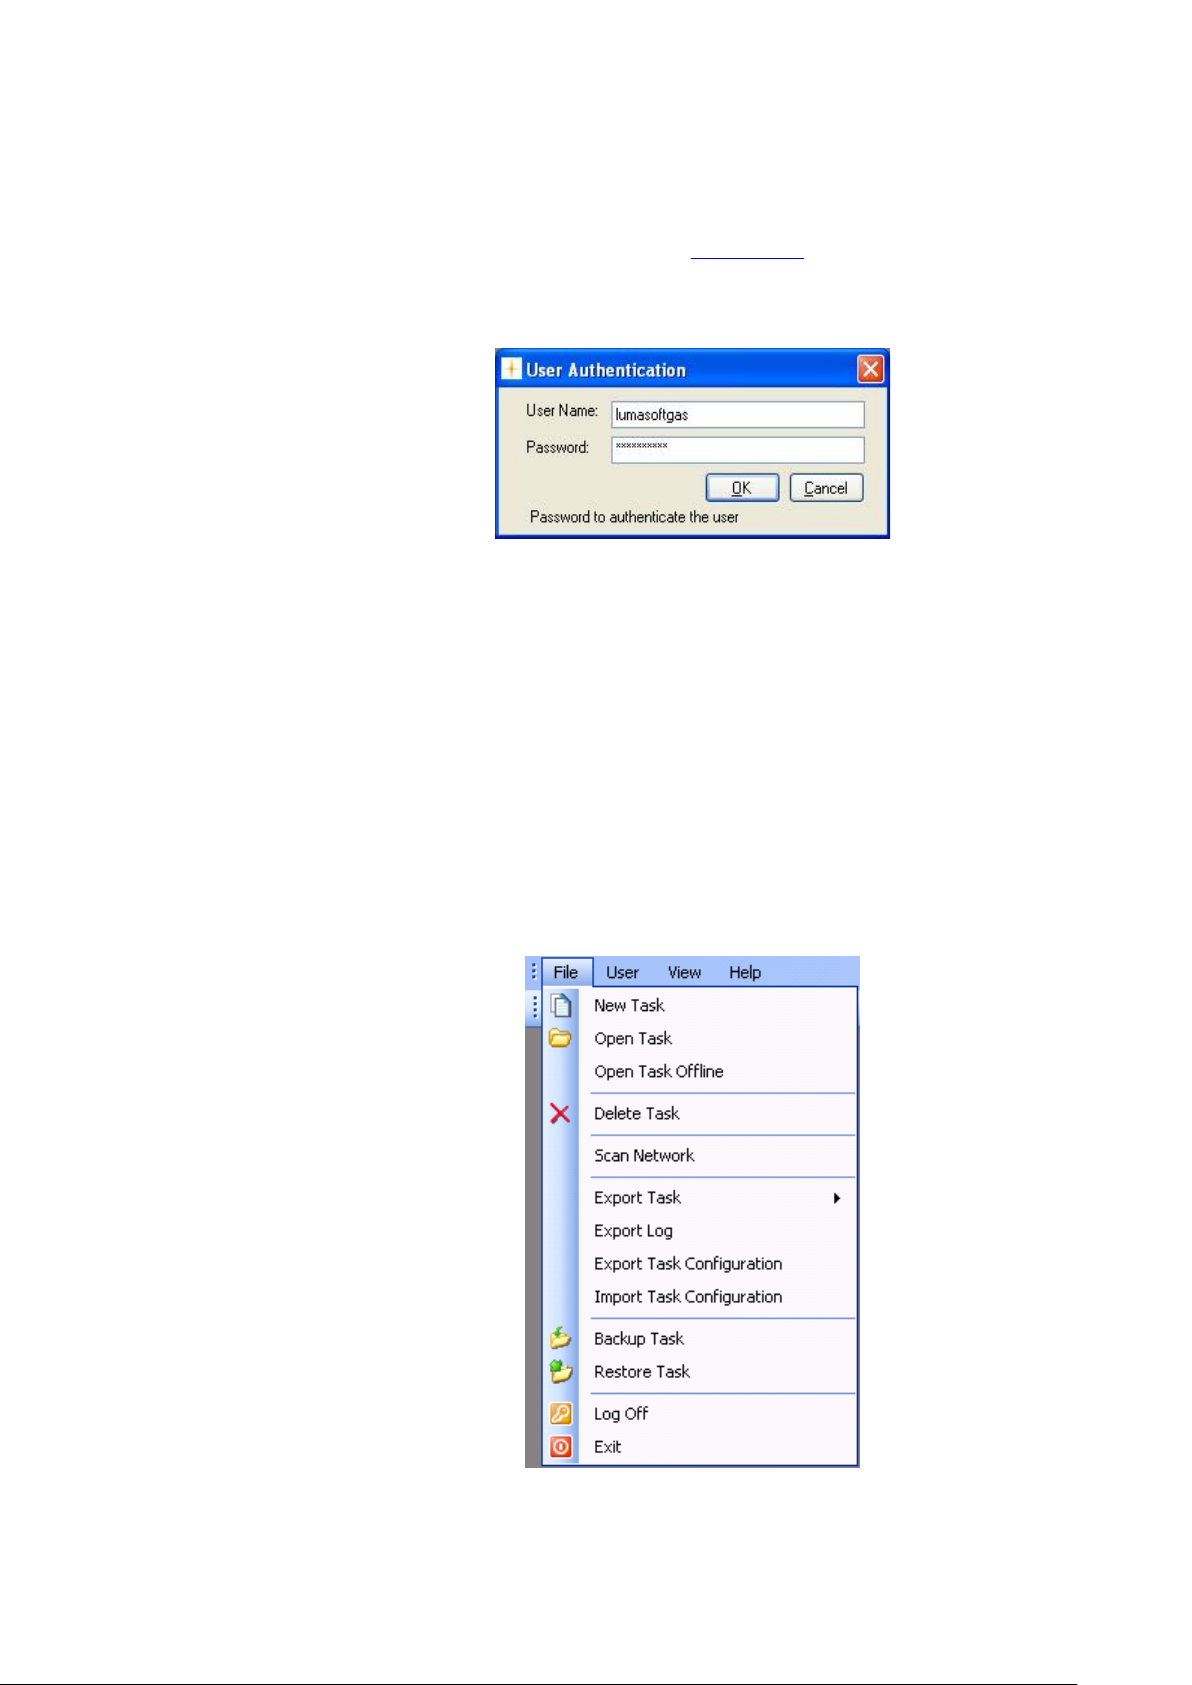
Setting up user accounts can be performed by the administrator only.
After starting the LumaSoft Gas application the User Authentication
window opens, where yo u authenticate yourself as the admini strator by
specifying the administrator user name and password.
________________________________________________________________________
BE6027-12 LumaSoft Gas Software LumaSense Technologies A/S
7810 and 7860 Page 22 of 194
15 0 0 0 0 1 1 1 1 1
13 0 0 0 0 1 1 0 1 2
12 0 0 0 0 1 1 0 0 3
11 0 0 0 0 1 0 1 1 4
Table 2.5 Setting the 1303 address
Page 23
Chapter 2
_________________________________________________________________________
The default administrator password is: Administra
Figure 2.2 Login dialogue window
To create new users you can either select the Manage User icon
from the toolbar or select Manage User from the User pull down
menu, see Figur e 2.3.
Figure 2.3 User pull-down: Manage User
The User Accounts window appears showing a lis t of the current user
accounts, see Figure 2.4.
A predefined user a ccount named LumaSoftGas with the highest access
level appears the f irst time the User Accounts window is opened. The
predefined password for the LumaSoftGas user is: lumasoftgas
Figure 2.4 User Accounts
2.3.1 Add User Account
In order for the administrator to add a new user account the Add softkey can be selected.
________________________________________________________________________
BE6027-12 LumaSoft Gas Software LumaSense Technologies A/S
7810 and 7860 Page 23 of 194
Page 24
Chapter 2
_________________________________________________________________________
The Add New User window appears (see Figure 2.5).
Figure 2.5 Add User Account
The User Name, Password and Access Level for the new user
account can be specified.
Please note that the User Name and Password must contain at least 6
characters and must contain no special characters. Only alphabets and
numeric characters are allowed [(a-z), (A-Z), (0-9 )] fo r the User Name
and Password (see Figure 2.6).
Figure 2.6 User access Levels
Three different access levels can be specified. The rights for each of the
access levels are described below in table 2.6.
________________________________________________________________________
BE6027-12 LumaSoft Gas Software LumaSense Technologies A/S
7810 and 7860 Page 24 of 194
Page 25
Chapter 2
Access level
Rights
Super
All expert rights
Delete task
Expert
All operator rights
Backup/restore a task
Operator
Open a task.
Export/import a task configuration
_________________________________________________________________________
Create a new task
Make setup of a task
Start a measurement
Export a task
Export log
Table 2.6 User access levels
2.3.2 Edit User Account
A user account can be edited by the administrator by selecting the Edit
soft-key in the User Acc ounts window. Before se lecting the Edit softkey a User Name must be selected in the Us e r Accounts window.
The access level can be changed by selecting the Access Level field.
Also the Password can be changed by selecting the Reset Password
soft-key. (See Figure 2.8).
________________________________________________________________________
BE6027-12 LumaSoft Gas Software LumaSense Technologies A/S
7810 and 7860 Page 25 of 194
Figure 2.7 User Accounts: Edit
Figure 2.8 Edit User Account
Page 26
Chapter 2
_________________________________________________________________________
Figure 2.9 Reset password dialogue
The Reset Passwo rd dialogue window a ppears and the new password
for the user account can be entered. (See Figure 2.9).
2.3.3 Remove User Account
Figure 2.10 User Accounts: Remove
A user account can be removed by selecting the Remove soft-key i n the
User Accounts window, see Figure 2.10. Before selecting the Remove
soft-key a User Name must be selected in the User Accounts window.
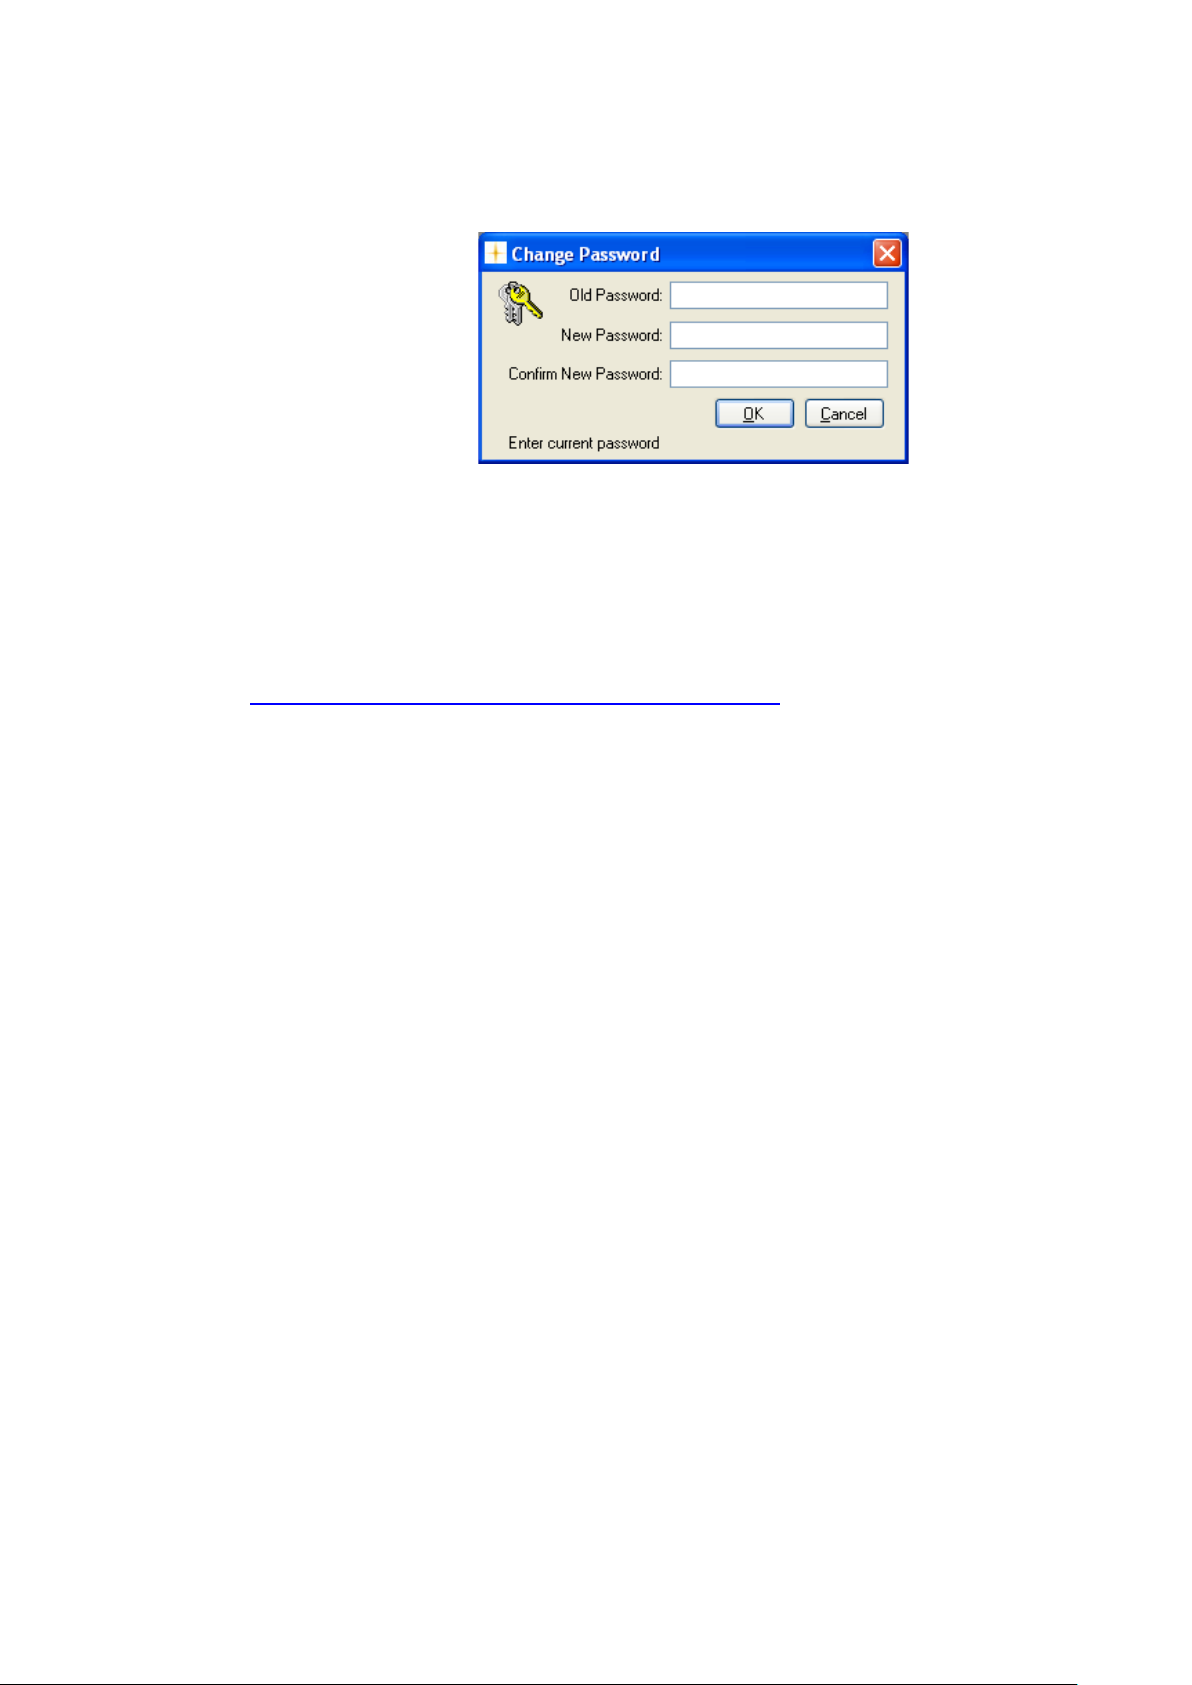
2.3.4 Change password of the administrator
To change the password of the administrator you select the Change
password icon from the toolbar or select Change Password from
the User pull down menu. (See Figure 2.11)
Figure 2.11 User pull-down: Change Password
________________________________________________________________________
BE6027-12 LumaSoft Gas Software LumaSense Technologies A/S
7810 and 7860 Page 26 of 194
Page 27
Chapter 2
_________________________________________________________________________
The Change Pass word dialogue wind ow (Figure 2.1 2) appears and the
old and new password for the administrator can be entered.
Figure 2.12 Change Password dialogue
2.4 Download of the latest version
You will find the latest version of the software on
http://innova.lumasenseinc.com/downloads
2.5 Back-up and Restoring of calibration data
If you have ordered a calibration from our calibration laboratory, you
will receive a CD with a backup of the calibration data. It is very
important that you store these data in your Gas Monitoring Software
7304, supplied with the Monitor. Please refer to the Instruction
Manual BE6025 fo r guidance in how to backup and r estore calibration
data.
________________________________________________________________________
BE6027-12 LumaSoft Gas Software LumaSense Technologies A/S
7810 and 7860 Page 27 of 194
Page 28

Chapter 3
_________________________________________________________________________
Chapter 3
Set-up Measurement Task
October 2012
________________________________________________________________________
BE6027-12 LumaSoft Gas Software LumaSense Technologies A/S
7810 and 7860 Page 28 of 194
Page 29
Chapter 3
_________________________________________________________________________
This chapter will show the steps how to set-up a measurement task.
Please note that measurement set-up is only allowed for users with
Expert or Super access level. (See Table 2.6)
Log in to the software using your username and password.
Figure 3.1 User Authentication
3.1 New task
Please make sure that you have an USB, Ether net (TCP/IP) or a RS-232
interface cab le connected to th e 1412i/1314i/3434i Gas Monitor device.
IMPORTANT! Please note that only one interface cable (either
USB, Ethernet (TCP/IP) or RS-232) should be connected at any
time.
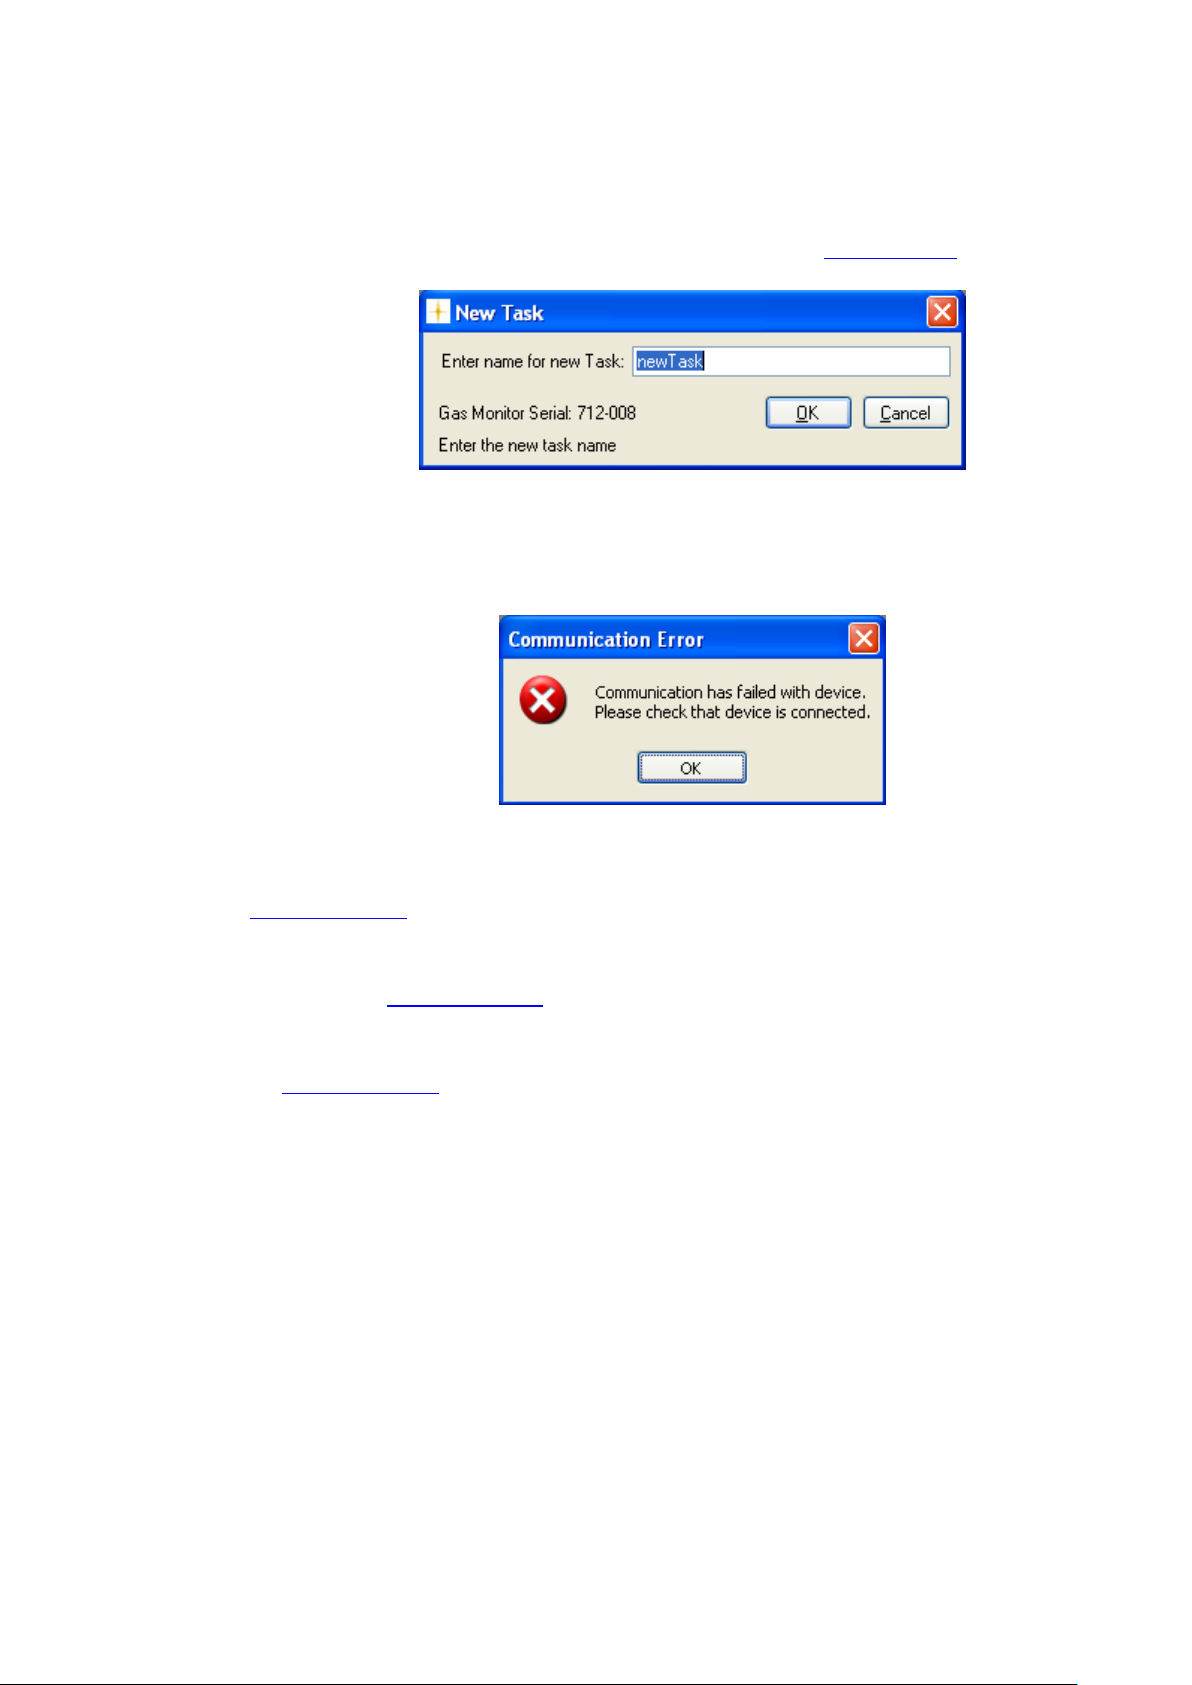
In order to create a new task select the New Task pull-down menu
(Figure 3.2).
Figure 3.2 File pull-down: New Task
________________________________________________________________________
BE6027-12 LumaSoft Gas Software LumaSense Technologies A/S
7810 and 7860 Page 29 of 194
Page 30
Chapter 3
_________________________________________________________________________
If the 1412i/1314i/3434i device is recognized the New Task window
(Figure 3.3) opens, where you enter the name of the new task and press
the OK soft-key. After that you can proceed to section 3.2.
Figure 3.3 Type in the name of the new task.
If the 1412i/1314i/3434i device is NOT recognized the Communication
Error message box (Figure 3.4) will appear. Press the OK soft-key.
Figure 3.4 Communication Error message box.
If you are using the USB interface cable connection please proceed to
section 3.1.1.
If you are using the Ethernet (TCP/IP) interface cable connection please
proceed to section 3.1.2.
If you are using the RS-232 interface cable connection please proceed
to section 3.1.3.
________________________________________________________________________
BE6027-12 LumaSoft Gas Software LumaSense Technologies A/S
7810 and 7860 Page 30 of 194
Page 31

Chapter 3
_________________________________________________________________________
3.1.1 Configuration of the USB interface
The System Configuration Setup window appears. Now you s elect the
USB radio button as shown in figure 3.5 in case it is not selected.
Figure 3.5 Select the USB communication interface.
To close the System Configuration Setup press the OK soft-key.
If the USB interface already was selected please make sure that the USB
interface cable between the PC and the 1412i/1314i/3434i Gas Monitor
is securely connected.
Finally please ask your Administrator to check for the presence of the
1412i USB driver in the Device Manager (Figure 3.6). Please note that
the 1412i USB driver also supports the 1314i and 3434i Gas Monitor.
Now proceed to section 3.2 in order to create a new task.
________________________________________________________________________
BE6027-12 LumaSoft Gas Software LumaSense Technologies A/S
7810 and 7860 Page 31 of 194
Page 32

Chapter 3
_________________________________________________________________________
Figure 3.6 The 1412i USB driv er .
3.1.2 Configuration of the Ethernet (TCP/IP) interface
The System Configuration Setup window appears. Now you s elect the
TCP/IP: radio button as shown in figure 3.7 in case it is not selected.
Figure 3.7 Select the TCP/IP communication interface.
________________________________________________________________________
BE6027-12 LumaSoft Gas Software LumaSense Technologies A/S
7810 and 7860 Page 32 of 194
Page 33

Chapter 3
_________________________________________________________________________
Enter the IP address of the Gas Monitor into the IP-address field as
shown in Figure 3.8.
Figure 3.8 Enter the IP Address of the Gas Monitor.
Refer to Section 2.2.4 to find the IP address of the 1412i/1314i/3434i
Gas Monitor.
Press the OK soft-key to close the System Configuration Setup
window. Proceed to Section 3.2 in order to create a new task.
If the creation of a new task failed the following message box will
appear. It is caused because LumaSoft Gas is unable to communicate
with the Gas Monitor through Ethernet (TCP/IP).
Figure 3.9 Communication failed with the Gas Monitor.
Please make sure that the Ethernet (TCP/IP) interface cable between
your network and the 1412i/1314i/3434i Gas Monitor is securely
connected.
Please ask your Administrator to check the TCP/IP settings of the
1412i/1314i/3434i Gas Monitor as described in Section 2.2.4.
________________________________________________________________________
BE6027-12 LumaSoft Gas Software LumaSense Technologies A/S
7810 and 7860 Page 33 of 194
Page 34

Chapter 3
_________________________________________________________________________
Make sure that the PROTECTED IP ADDRESS either is set to the IP
Address of your PC or set to 000:000:000:000.
Make a note of the IP Address of the 1412i/1314i/3434i device as
displayed in the TCP/IP settings.
Your Administrator can now open a DOS Command Prompt to check for
a ping reply from the IP Address of the 1412i/1314i/3434i devic e.
Figure 3.10 Ping reply from the 1412i/1314i/3434i device.
________________________________________________________________________
BE6027-12 LumaSoft Gas Software LumaSense Technologies A/S
7810 and 7860 Page 34 of 194
Page 35

Chapter 3
_________________________________________________________________________
3.1.3 Configuration of the RS-232 interface
The System Configuration Setup window appears. Now you select the
COM Port: radio button as shown in figure 3.11 in case it is not
selected. Press the OK soft-key.
Figure 3.11 Select the RS-232 communication interface.
Select the Scan Network pull-down menu (Figure 3.12).
Figure 3.12 File pull-down: Scan Network
________________________________________________________________________
BE6027-12 LumaSoft Gas Software LumaSense Technologies A/S
7810 and 7860 Page 35 of 194
Page 36

Chapter 3
_________________________________________________________________________
A search for a 1412i/1314i/3434i Gas Monitor connected to the RS-232
interface is now performed. When found the Scan Network window is
shown (Figure 3.13). Press the New Task soft-key.
Figure 3.13 Scan Network: COM2 port found
Now the New Task w indow o pens (Fi gu r e 3.1 4). Enter the desired name
for your task and press the OK soft-key. You can now proceed to
Section 3.2.
Figure 3.14 New Task: Enter task name
________________________________________________________________________
BE6027-12 LumaSoft Gas Software LumaSense Technologies A/S
7810 and 7860 Page 36 of 194
Page 37

Chapter 3
_________________________________________________________________________
3.2 Measurement set-up
The set up of a new measurement task is carried out in five steps.
3.2.1 Configuration
First step is System Configuration Setup, select Configuration in the
Set Up pull down menu (Fi gur e 3.1 5) or select the icon f r om the ta sk
bar.
Figure 3.15 Set-up pull-down: Configuration
The following System Configuration Set Up window will appear.
Figure 3.16 System Configuration SetUp
Then make check marks if any multiplexers (1303, 1309) are connected
to the Monitor. A maximum of four 1303 or two 1309 can be connected.
After finishing the set up, press OK.
________________________________________________________________________
BE6027-12 LumaSoft Gas Software LumaSense Technologies A/S
7810 and 7860 Page 37 of 194
Page 38

Chapter 3
_________________________________________________________________________
3.2.2 Monitor Setup
Set up of the Monitor is done by selecting Monitor in the Set Up pull
down menu. (Figure 3.17)
Figure 3.17 Set up pull-down: Monitor
The Monitor Setup will appear. (Figure 3.18)
Figure 3.18 Monitor Setup, Sampling
Sampling Index Card
In the Flushing group box select if the flushing of the instrument should
be Auto or Fixed Time.
________________________________________________________________________
BE6027-12 LumaSoft Gas Software LumaSense Technologies A/S
7810 and 7860 Page 38 of 194
Page 39

Chapter 3
Acceptable Values
Interval
Default
Value
Chamber: 2 to 60 s
Tube: 0 (=off), 3 to 120 s
1 s
1 s
8 s
3 s
_________________________________________________________________________
By selecting Auto the monitoring system controls the flushing by
selecting the optimum flushing time. This time can vary as the option
takes into account the cleanness of the e x te r nal air filters and the le ngth
of the sampling tube. Type in the length of the tubing. (See Figure
3.18).
Selecting Fixed Time allows the user to define a flushing time for
chamber and tubing. Table 3.1 shows the acce ptable values for f lushing
chamber and tubing.
Table 3.1 Acceptable values for flushing the system when selecting Fixed
Time flushing
In the Compensation group box, see Figure 3.18, compensation for
Water and Cross Interference can be checked on/off.
It is suggested that Water should be compensated for in all measuring
situations except where extremely dry gases are being measured.
If any interfe ring gas othe r than Water Vapour is present in the am bient
air sample, the Monitor can cross compensate for the interference
caused by its presenc e provided that a se lective optical fil ter is installed
in the Monitor to measure the concentration of the interfering gas
present.
In the Sample Information group box, see Figure 3.18, select whether
multiplexer sequences are continuous. Select Sample Continously if
you want the next multip lexer sequence immediately af ter finishing the
previous multiplexe r se quence . If Seq uen ce Int erva l is selecte d a time
interval (in minutes) can be set to define the start of one multiplexer
sequence to the beginn ing o f t he ne xt . If no multiplexe r is used the time
interval will be between the individual samples.
Gas Index Card
Select the Gas index card and press the Read Filter Info soft-key (See
Figure 3.19) to read the filter configuration from the Monitor.
________________________________________________________________________
BE6027-12 LumaSoft Gas Software LumaSense Technologies A/S
7810 and 7860 Page 39 of 194
Page 40

Chapter 3
_________________________________________________________________________
Figure 3.19 Monitor Setup, Gasses to be measured
The calibrations in the Monitor wil l appear as Gas A, B, C , D and E, see
Figure 3.20. Select the gasses which should be measured by using the
checkboxes.
________________________________________________________________________
BE6027-12 LumaSoft Gas Software LumaSense Technologies A/S
7810 and 7860 Page 40 of 194
Page 41

Chapter 3
_________________________________________________________________________
Figure 3.20 Monitor Setup
Also select the Sample Integration Time (SIT) to be used in the
measurements and press OK.
To select different SIT’s for diff erent gases use the Sam ple Integration
Time field selection and select Advanced.
A select field appears for each gas, see Figure 3 .21. Then it is possible
to define a SIT for individual gases.
________________________________________________________________________
BE6027-12 LumaSoft Gas Software LumaSense Technologies A/S
7810 and 7860 Page 41 of 194
Page 42

Chapter 3
_________________________________________________________________________
Figure 3.21 By selecting Advanced the user can define SIT for the
3.2.3 Multiplexer setup
If a multiplexer is connected to the Monitor select Multiplexer in the
Set Up pull down menu. (See Figure 3.22)
Figure 3.22 Set Up pull-down: Multiplexer
different gases
________________________________________________________________________
BE6027-12 LumaSoft Gas Software LumaSense Technologies A/S
7810 and 7860 Page 42 of 194
Page 43

Chapter 3
_________________________________________________________________________
Figure 3.23 Multiplexer SetUp
Select the channels fr om wh ich the mu ltip le xer s hould dr aw air sa mples.
For each channel a specific location or name can be assigned.
Choose between a Normal sequence and a User se quenc e. By s electing
a normal sequence (see Figure 3.23), air samples will be drawn first
from channel 1 then 2, 3, 4 etc., that is in ascending order. Selecting
User Sequence allows you to define the sampling order arbitrarily, by
typing in the channel numbers in a specific order, see Figure 3.24.
________________________________________________________________________
BE6027-12 LumaSoft Gas Software LumaSense Technologies A/S
7810 and 7860 Page 43 of 194
Page 44

Chapter 3
_________________________________________________________________________
3.2.4 Alarms
This function is used to define software alarms for each gas when the
concentration reaches either a minimum or a maximum level.
Select Alarm in the Set Up pull down menu, and the fo llowing window
will appear, Figur e 3 .2 6.
Figure 3.24 User defined sample sequence
Figure 3.25 Set Up pull-down: Alarm
________________________________________________________________________
BE6027-12 LumaSoft Gas Software LumaSense Technologies A/S
7810 and 7860 Page 44 of 194
Page 45

Chapter 3
_________________________________________________________________________
Figure 3.26 Alarm Setup for specific gases
First select the ch annel number in the field select ion box for which the
alarm should be configured, as shown in Figure 3.27.
Figure 3.27 Select a channel number in the left pull down box.
________________________________________________________________________
BE6027-12 LumaSoft Gas Software LumaSense Technologies A/S
7810 and 7860 Page 45 of 194
Page 46

Chapter 3
_________________________________________________________________________
Then select the gas fo r which the alar m should be configur ed in the Gas
selection box , s ee Figure 3.28.
Figure 3.28 Select for which gas the alarm should be configured
There are four different alarms which can be configured: Low, Low Low,
High and High High. The Low alarm can be set to give a warning that
the concentration of the gas is dropping below the normal level. The
Low Low alarm can then be configur ed to give a warning whenever the
gas concentration drops below the lowest allowable concentration. The
High and the High High alarm levels are set to give a warning for a
concentration above a certain limit and that the maximum allowable
concentration is exceeded.
________________________________________________________________________
BE6027-12 LumaSoft Gas Software LumaSense Technologies A/S
7810 and 7860 Page 46 of 194
Page 47

Chapter 3
_________________________________________________________________________
To set up an alarm first select between the four mentioned alarms,
select concentratio n unit, and then type in the c oncentration, se Figure
3.29.
Figure 3.29 Select a type of alarm and type in a value for the gas
concentration
________________________________________________________________________
BE6027-12 LumaSoft Gas Software LumaSense Technologies A/S
7810 and 7860 Page 47 of 194
Page 48

Chapter 3
_________________________________________________________________________
When the alarms have bee n configured choose whe ther there should be
a PC beep when th e alarm level is reached. Press Add soft-key to ad d
the configured alarms and then OK to proceed. (See Figure 3.30)
Figure 3.30 Press Add soft-key to add the configured alarms
To remove a gas from the alarm list highlight the gas using a mouse
click and press the Remove soft-key. (See Figure 3.30)
________________________________________________________________________
BE6027-12 LumaSoft Gas Software LumaSense Technologies A/S
7810 and 7860 Page 48 of 194
Page 49

Chapter 3
Display Text
Options
Default
NORMALIZATION TEMPERATURE
0°C, 20°C and 25°C
20°C
NORMALIZATION TEMPERATURE
32°F, 68°F and 77°F
68°F
NORMALIZATION TEMPERATURE
273K, 293K and 298K
293K
_________________________________________________________________________
3.2.5 Units
Select Unit in the Set Up drop down menu. (See Figure 3.31)
Figure 3.31 Set Up pull-down: Unit
Figure 3.32 Select in which units the data should be displayed
In this window the user can select in which units Humidity, Pressure,
Gas Concentration, Temperature and Length will be shown. The
Normalization Temperature can also be changed. The normalization
temperature is the r eference te mperature , for re porting data in absolute
unit mg/m3. A normalization temperature of 25°C means that the
measured gas concentrations will be calculated in mg/m3 at 25°C. The
user can choose between three different normalization temperatures,
see table 3.2.
Value
Table 3.2 The possible values and the default values of the
normalization temperature
________________________________________________________________________
BE6027-12 LumaSoft Gas Software LumaSense Technologies A/S
7810 and 7860 Page 49 of 194
Page 50

Chapter 4
_________________________________________________________________________
Chapter 4
Perform Measurement
October 2012
________________________________________________________________________
BE6027-12 LumaSoft Gas Software LumaSense Technologies A/S
7810 and 7860 Page 50 of 194
Page 51

Chapter 4
_________________________________________________________________________
This chapter shows how to
- perform a measurement task. (Section 4.1)
- present the measurement data in graphic display (Channel view).
(Section 4.2.1)
- present the measurement data in graphic di splay (Gas view). (Section
4.2.2)
- present the measurement data in numeric display. (Section 4.3)
- set user events. (Sections 4.2.1.7{Channel view}, 4.2.2.8{Gas view}
and 4.3.3)
- print graphic and numeric displays. (Sections 4.2.1.8{Channel view},
4.2.2.9{Gas view} and 4.3.4)
- display historical data. (Section 4.2.1.9{Channel view}, 4.2.2.10{Gas
view}
- view alarms. (Section 4.4)
- export measurement data. (Section 4.5)
- view error and warnings. (Section 4.6)
- export log (Section 4.7)
4.1 Measurement start and stop
If a measurement task is not open, select File and Open Task, see
Figure 4.1 or select from the task bar.
Figure 4.1 File pull-down: Open Task
________________________________________________________________________
BE6027-12 LumaSoft Gas Software LumaSense Technologies A/S
7810 and 7860 Page 51 of 194
Page 52

Chapter 4
_________________________________________________________________________
Select an existing task to open, see Figure 4.2.
Figure 4.2 Select which task to open
4.1.1 Start Measurement
To start the measu rement, select Measurement and Start, see Figure
4.3, or press the icon with the green arrow in the task bar.
Figure 4.3 Measurement pull-down: Start
The measurement can be started immediately (Now option) or at a
specific starting time by using the option: Start at, see Figure 4.4.
Figure 4.4 Start and stop measurement task
The measurement can be stopped manually (Manual option) or at a
fixed time using the Stop at option. (See Figure 4.4)
A measurement task can be stopped and then restarted at your
convenience.
________________________________________________________________________
BE6027-12 LumaSoft Gas Software LumaSense Technologies A/S
7810 and 7860 Page 52 of 194
Page 53

Chapter 4
_________________________________________________________________________
4.1.2 Stop Measurement
To stop the measurement, select Measurement and Stop, see Figure
4.5, or press the icon in the task bar.
Figure 4.5 Measurement pull-down: Stop
4.2 Presentation of Data in Graphical Window
The measurement data can be presented graphically in two different
ways either channel-wise or gas-wise.
If measurement data is presented c hannel-wise the gas filters is shown
in a graphical view for each channel. Proceed to Section 4.2.1 for
presentation of graphical data channel-wise.
If measurement data is presented gas-wise the multip lexer channels is
shown in a graphical view for each gas filter. Proceed to Section 4.2.2
for presentation of graphical data Gas View.
4.2.1 Presentation of Data in Graphical Window Channel-View
To display measureme nt data graphical ly channel-wise select Graphical
Window>Single Channel with Selected Gases View in the View
pull-down menu. (See Figure 4.6)
Figure 4.6 View pull-down: Graphical Window>Single Channel with
Selected Gases V iew
________________________________________________________________________
BE6027-12 LumaSoft Gas Software LumaSense Technologies A/S
7810 and 7860 Page 53 of 194
Page 54

Chapter 4
_________________________________________________________________________
4.2.1.1 Configuration of the (Channel-View) graphical window
In the Configuration window select if the data shou ld be presented as
a Real Time Graph, while measurement is in progress, or Historical
Graph, see Figure 4.7.
Figure 4.7 Select if the data should be presented in real time or historic
Real Time Graph means that mea sureme nt data wi ll be plotted as they
arrive from the Moni tor.
Historical Graph means viewing of previously measured data
Select Real Time Graph and press Next to continue.
________________________________________________________________________
BE6027-12 LumaSoft Gas Software LumaSense Technologies A/S
7810 and 7860 Page 54 of 194
Page 55

Chapter 4
_________________________________________________________________________
4.2.1.2 Select Gases (Channel view)
In the gas Configuration window, see Figure 4.8, select which of the
measured gases to be included in the Graph and press the right going
arrow.
Figure 4.8 Select which gasses to be presented
To select more gasses at one time press Ctrl while selecting. When the
gases have been chosen the y will appe ar in the right wi ndo w, see Figure
4.9. Press Next to proceed.
Figure 4.9 The gasses chosen for presentation
________________________________________________________________________
BE6027-12 LumaSoft Gas Software LumaSense Technologies A/S
7810 and 7860 Page 55 of 194
Page 56

Chapter 4
_________________________________________________________________________
4.2.1.3 Configuration of curves (Channel view)
CurveColor
Each of the filters has a default selected curve color, see Figure 4.10.
To change the color of the curves press the colored square in the
CurveColor column.
Figure 4.10 Change the color of the curves
Select a color for the curve in the Color window, see Figure 4.11.
Figure 4.11 Select a color for the curve
Repeat the procedure for all the gasses.
________________________________________________________________________
BE6027-12 LumaSoft Gas Software LumaSense Technologies A/S
7810 and 7860 Page 56 of 194
Page 57

Chapter 4
_________________________________________________________________________
PointStyle
It is possible to change the style of the plotted measuring points to
Square or Circle using the field selection in the Point Style column.
Figure 4.12 Change the style of the measurement points
Scaling
The scaling on the Y-axis can be set to AutoScaleMinAndMax,
AutoScaleMax or AutoScaleOff in the field selection individually for
each filter in the Scaling column. The possible scaling types are
described in Table 4.1.
Figure 4.13 Setting the scaling of the axis
________________________________________________________________________
BE6027-12 LumaSoft Gas Software LumaSense Technologies A/S
7810 and 7860 Page 57 of 194
Page 58

Chapter 4
AutoScaleMinAndMax
The scale will cover from the
highest measured value, i.e. all
measurement points will be
visible on the graph.
AutoScaleMax
The Y-axis will begin at 0 and the
maximum value depends on the
highest measured value.
AutoScaleOff
The user defines both minimum
and maximum values for the Y
scale manually, by defining
. This
can be of use to view
measurement points in a
particular range.
_________________________________________________________________________
lowest measurement value to the
YScalemin and YScaleMax
Table 4.1 Shows the possible Scaling types of the Y-axis
Units
In the Unit column the unit in which each gas will be displayed in the
graphical window can be selected.
Figure 4.14 Select the unit in which the gas concentrations will be
Table 4.2 shows the possible parameter units and their default settings.
________________________________________________________________________
BE6027-12 LumaSoft Gas Software LumaSense Technologies A/S
7810 and 7860 Page 58 of 194
displayed
Page 59

Chapter 4
_________________________________________________________________________
Parameters Units Default Unit
Humidity mg/m3, ppm, Tdew, kPa Tdew
Pressure mbar, mmHg, kPa kPa
Gas Concentrations mg/m3, ppm ppm
Table 4.2 The possible parameter u nits with defaults
Tension
By adjusting the Tension it is defined how so ft/hard the lines between
the measuring points sho uld be. If the tension is set to 0 the points are
connected by straight lines.
Figure 4.15 Define how hard/soft the lines between measurement points
should be
When all the settings has been adjusted press Next to proceed.
4.2.1.4 Configuration of the Graph Window (Channel view)
In this configuration window the trend properties are configured. The
trend can be given a title by entering a name in the Graph Title field.
(See Figure 4.16).
________________________________________________________________________
BE6027-12 LumaSoft Gas Software LumaSense Technologies A/S
7810 and 7860 Page 59 of 194
Page 60

Chapter 4
_________________________________________________________________________
Figure 4.16 Configuration of graph window properties
The number of decimals on the mea sured values can be selected in the
field selection: Y Axis Decimal places.
The time interval ( X Interval) on the X -axis can be set to days, hours,
minutes or seconds.
Back Color, Cursor Color, Text Color and Font etc. can be changed
by pressing the appropriate grey squares.
Gradient Mode gives a shading of a dark background color.
Grid Visible turns on/off the grid.
User Events turns on/off the display of user events (see Section
4.2.1.7).
Press Finish when the configuration is completed.
________________________________________________________________________
BE6027-12 LumaSoft Gas Software LumaSense Technologies A/S
7810 and 7860 Page 60 of 194
Page 61

Chapter 4
_________________________________________________________________________
Figure 4.17 The graphical window(Channel View)
Changing the configuration
To change any of the above settings after the configuration is ended
press the right mouse button while the cursor is placed in the graph
area. Select Setup (see Figure 4.18) and the Configuration window
will appear, see Figure 4.10 and Figure 4.16.
________________________________________________________________________
BE6027-12 LumaSoft Gas Software LumaSense Technologies A/S
7810 and 7860 Page 61 of 194
Page 62

Chapter 4
_________________________________________________________________________
Figure 4.18 To change the configuration in the graphical window press
the right button on the mouse
To add a curve for a measured gas, which has not been previously
added, press the right mouse button while the cursor is placed in the
graph area and select AddTag. (See Figure 4.18)
4.2.1.5 The Graphical Window (Channel view)
The graphic window sho ws the measur ement data in a grap h. Each filte r
in the Monitor has its own axis o n the graph, see Fi gure 4.1 8. Below the
graph a window containing a list of the measured gases, and statistics
performed from all obtained measurement data (Min, Max, Mean and
Std. Deviation) is shown. The bottom window is the Error and
Warnings and Alarm window. The number of curves displayed, their
color and style are de fined by the user as described in Section 4.2.1.1,
Section 4.2.1.2, Section 4.2.1.3 and Section 4.2.1.4.
________________________________________________________________________
BE6027-12 LumaSoft Gas Software LumaSense Technologies A/S
7810 and 7860 Page 62 of 194
Page 63

Chapter 4
_________________________________________________________________________
The user can toggle between the Errors/Warnings, Measurement
Errors/Warnings and Measurement Alarm windows. The
Errors/Warnings window will register if any errors have occurred while
running the measureme nt. The window can be hidden by pr essing Auto
Hide icon, or by selecting Errors/Warnings Window in the View
drop down menu, see Figure 4.19.
Figure 4.19 View pull-down: Errors/Warnings Window
4.2.1.6 Functions in the Graphical Window (Channel view)
In the top of the Graphical window the Icon Tool Bar is displayed.
The tool bar makes it easier to handle and process the obtained
measurement data.
The function behind each icon will be explained in the following section.
Find Difference
The function ∆h, will calculate the difference in the value for two data
points on the same filter curve. Press the icon and then select the
two data points wit h mouse clicks. In the top right cor ner the difference
between the two meas urements will be displayed, see Figure 4.20.
________________________________________________________________________
BE6027-12 LumaSoft Gas Software LumaSense Technologies A/S
7810 and 7860 Page 63 of 194
Page 64

Chapter 4
_________________________________________________________________________
Figure 4.20 Select two measurement points on the same curve to get
the difference in concentration
Historical Data Plotting
Historical data plotting is described in Section 4.2.1.9.
X Delta Cursor
Press the X Delta Cursor icon and select two points to determine
the difference in time. A light red area will appear between the two
points and the time difference will be displa yed, see Figure 4.21. When
using this function the statistics shown in the middle window are
calculated for the measurement points within the chosen interval and
will be marked with red text color, see Figure 4.21.
________________________________________________________________________
BE6027-12 LumaSoft Gas Software LumaSense Technologies A/S
7810 and 7860 Page 64 of 194
Page 65

Chapter 4
_________________________________________________________________________
Figure 4.21 Select two measurement points in the graphic window to get
the difference in time
Y Delta Cursor
Press the Y Delta Cursor icon and select two points where the
difference in concentratio n is needed. A green area will appear be tween
the two points and the min and max value in concentration will be
displayed, see Figure 4.22.
By double-clicking on a Gas Name in the middle window it is selected
for which Gas the min and max concentrations is displayed.
________________________________________________________________________
BE6027-12 LumaSoft Gas Software LumaSense Technologies A/S
7810 and 7860 Page 65 of 194
Page 66

Chapter 4
_________________________________________________________________________
Figure 4.22 Select two measurement points in the graphic window to get
the min and max concentrations
Cursor On/Off
The Cursor function will give the user opportunity to see the exact
measurement values for a ny given measurement point. Drag the curso r
to a specific measurement point and the values will be displayed in
colored boxes, see Figure 4.23.
________________________________________________________________________
BE6027-12 LumaSoft Gas Software LumaSense Technologies A/S
7810 and 7860 Page 66 of 194
Page 67

Chapter 4
_________________________________________________________________________
Figure 4.23 Drag the cursor to the m easurement point to view the
measurement data
Delete Delta Cursor
A X or Y Delta Cursor can be deleted by pressing this icon . The
window below will appear and the desired cursor can be selected and
deleted by pressing Delete, see Figure 4.24.
Figure 4.24 Select the cursor which should be deleted and press Delete
________________________________________________________________________
BE6027-12 LumaSoft Gas Software LumaSense Technologies A/S
7810 and 7860 Page 67 of 194
Page 68

Chapter 4
_________________________________________________________________________
Zoom
This function enables the user to zoom in and out on areas of par ticular
interest on the graph by using the two icons: Zoom In and Zoom
Out .
Scroll
If a measurement is running over a longer period of time, these icons
can be used to scroll the x axis forth or and back or .
Expand/Compress
These two icons can be used to expand and compress the x-axis. This
function can be used to get a better visibility of measurement points
lying very close to each other.
Start/Pause measurement
These two icons a llow the user to star t a nd pause the display of
new measurements points at any time.
Select Channel
This select field box enables switching between the channels on the
1309 which are use d to draw air samples, allow ing viewing all obtained
measurement data for a specific channel, see Figure 4.25.
________________________________________________________________________
BE6027-12 LumaSoft Gas Software LumaSense Technologies A/S
7810 and 7860 Page 68 of 194
Page 69

Chapter 4
_________________________________________________________________________
Figure 4.25 Select a channel number in the select field box
4.2.1.7 User Events in the graphical window (Channel view)
If an event occurs or a changed condition happened during a
measurement task, it is po s s ible to indicate this event b y u s ing t he User
Event function.
To insert a user event press the right mouse button while placing the
cursor on the measur ement point wher e the event should be added and
select Add UserEvent, see Figure 4.26.
________________________________________________________________________
BE6027-12 LumaSoft Gas Software LumaSense Technologies A/S
7810 and 7860 Page 69 of 194
Page 70

Chapter 4
_________________________________________________________________________
Figure 4.26 Insert User Event by pressing the right mouse button.
The following window, se e Figure 4.2 7, will appear to add a comme nt to
be displayed for this specific user event.
Figure 4.27 Add a comment to be displayed for the user event
Press OK to proceed. The user event which has been set up will be
shown as an envelope right beside the me asurement point, to which
it belongs.
To display a user event set the cu rsor at the envelope.
________________________________________________________________________
BE6027-12 LumaSoft Gas Software LumaSense Technologies A/S
7810 and 7860 Page 70 of 194
Page 71

Chapter 4
_________________________________________________________________________
A user event can be updated or deleted by pressing the right mouse
button while placing the cursor on the envelope and selecting either
Update UserEvent or Delete UserEvent.
4.2.1.8 Printing the graphical window(Channel view)
The graphical window can be output to a printer by right-clicking with
the mouse button anywhere inside the graphical window to get the
print-menu.
Select either Print or Print Preview, see Figure 4.28.
The Print option wi ll make a printer output and the Print Preview will
make a screen view of the printout.
Figure 4.28 Printing the Graphical window(Channel view)
The printout contain the curves and a footer with task name, monitor
type and serial number, channel number, information about the task
setup, statistical data, see Figure 4.29.
________________________________________________________________________
BE6027-12 LumaSoft Gas Software LumaSense Technologies A/S
7810 and 7860 Page 71 of 194
Page 72

Chapter 4
_________________________________________________________________________
Figure 4.29 Print preview of the Graphical window(Channel view)
________________________________________________________________________
BE6027-12 LumaSoft Gas Software LumaSense Technologies A/S
7810 and 7860 Page 72 of 194
Page 73

Chapter 4
_________________________________________________________________________
4.2.1.9 Displaying historical data (Channel view)
Open an existing task by selecting O pen Task or Open Ta sk Offline in
the File drop down menu, see Figure 4.30. The Open Task Offline
allows opening a task without a Monitor connected.
Figure 4.30 File menu: Open Task/Open Task Offline
The desired task can be opened, see F igure 4.31.
Figure 4.31 Open Task list.
By selecting Task Contents in the File pull-down menu, see Figure
4.32, active filters and start/stop time is displayed, see Figure 4.33.
________________________________________________________________________
BE6027-12 LumaSoft Gas Software LumaSense Technologies A/S
7810 and 7860 Page 73 of 194
Page 74

Chapter 4
_________________________________________________________________________
Figure 4.32 File menu: Task Contents.
Figure 4.33 Contents window
The historical data can be displayed by selecting Graphical
Window>Single Channel with Selected Gases View in the View
drop down menu, see Figure 4.34, then press the Historical Data
Plotting icon .
Figure 4.34 View menu: Graphical Window>Single Channel with
Selected Gases V iew
________________________________________________________________________
BE6027-12 LumaSoft Gas Software LumaSense Technologies A/S
7810 and 7860 Page 74 of 194
Page 75

Chapter 4
_________________________________________________________________________
A specific time inte rval can be se lected by entering da te and time i n the
two fields: From Date and To Date, see Figure 4.35.
Figure 4.35 Select time interval for historic data plotting.
Click OK to display the historical data in a graph.
The functions of the icons in the historical window are the same as in
the Real Time Window described in Section 4.2.1.6.
To continue the measur ements performe d in the specific task, press the
green arrow icon or select Start in the Measurement drop down
menu, see Figure 4.3.
To display the incoming measuring data (real time data) select the
icon.
4.2.2 Presentation of Data in Graphical Window GasView
To display measureme nt data graphical ly channel-wise select Graphical
Window>Single Gas with Selected Channel View in the View pull-
down menu. (See Figure 4.36)
Figure 4.36 View pull-down: Graphical Window>Single Gas with
Selected Channel View
________________________________________________________________________
BE6027-12 LumaSoft Gas Software LumaSense Technologies A/S
7810 and 7860 Page 75 of 194
Page 76

Chapter 4
_________________________________________________________________________
4.2.2.1 Configuration of the (Gas-View) graphical window
In the Configuration window select if the data shou ld be presented as
a Real Time Graph, while measurement is in progress, or Historical
Graph, see Figure 4.37.
Figure 4.37 Select if the data should be presented in real time or historic
Real Time Graph means that mea sureme nt data wi ll be plotted as they
arrive from the Moni tor.
Historical Graph means viewing of previously measured data
Select Real Time Graph and press Next to continue.
________________________________________________________________________
BE6027-12 LumaSoft Gas Software LumaSense Technologies A/S
7810 and 7860 Page 76 of 194
Page 77

Chapter 4
_________________________________________________________________________
4.2.2.2 Select Channels (Gas view)
In the channel Configuration window, see Figure 4.38, selec t which of
the channels to be included in the Graph and press the right going
arrow.
Figure 4.38 Select which channels to be presented
To select more cha nne ls a t o ne time pr e ss Ctr l w hile se le c ti ng. W he n the
channels have been chosen they will appear in the right window, see
Figure 4.39. Press Next to proceed.
Figure 4.39 The channels chosen for presentation
________________________________________________________________________
BE6027-12 LumaSoft Gas Software LumaSense Technologies A/S
7810 and 7860 Page 77 of 194
Page 78

Chapter 4
_________________________________________________________________________
4.2.2.3 Configuration of curves (Gas view)
CurveColor
Each of the channels has a default selected curve color, see Figure 4.40.
To change the color of the channel press the colored square in the
CurveColor column.
Figure 4.40 Change the color of the curves
Select a color for the curve in the Color window, see Figure 4.41.
Figure 4.41 Select a color for the curve
Repeat the procedure for all the gasses.
________________________________________________________________________
BE6027-12 LumaSoft Gas Software LumaSense Technologies A/S
7810 and 7860 Page 78 of 194
Page 79

Chapter 4
_________________________________________________________________________
PointStyle
It is possible to change the style of the plotted measuring points to
Square or Circle using the field selection in the Point Style column.
Figure 4.42 Change the style of the measurement points
Tension
By adjusting the Tension it is defined how so ft/hard the lines between
the measuring points sho uld be. If the tension is set to 0 the points are
connected by straight lines.
Figure 4.43 Define how hard/soft the lines between measurement points
should be
When all the settings has been adjusted press Next to proceed.
________________________________________________________________________
BE6027-12 LumaSoft Gas Software LumaSense Technologies A/S
7810 and 7860 Page 79 of 194
Page 80

Chapter 4
AutoScaleMinAndMax
The scale will cover from the
highest measured value, i.e. all
measurement points will be
visible on the graph.
AutoScaleMax
The Y-axis will begin at 0 and the
maximum value depends on the
highest measured value.
AutoScaleOff
The user defines both minimum
the Y
scale manually, by defining
. This
can be of use to view
measurement points in a
particular range.
_________________________________________________________________________
4.2.2.4 Configuration of filters (Gas view)
Scaling
The scaling on the Y-axis can be set to AutoScaleMinAndMax,
AutoScaleMax or AutoScaleOff in the field selection individually for
each filter in the Scaling column. The possible scaling types are
described in Table 4.3.
Figure 4.44 Setting the scaling of the axis
lowest measurement value to the
and maximum values for
YScalemin and YScaleMax
Table 4.3 Shows the possible Scaling types of the Y-axis
________________________________________________________________________
BE6027-12 LumaSoft Gas Software LumaSense Technologies A/S
7810 and 7860 Page 80 of 194
Page 81

Chapter 4
_________________________________________________________________________
Units
In the Unit column the unit in which each gas will be displayed in the
graphical window can be selected.
Figure 4.45 Select the unit in which the gas concentrations will be
displayed
Table 4.4 shows the possible parameter units and their default settings.
Parameters Units Default Unit
Humidity mg/m3, ppm, Tdew, kPa Tdew
Pressure mbar, mmHg, kPa kPa
Gas Concentrations mg/m3, ppm ppm
Table 4.4 The possible parameter units with defaults
When all the settings has been adjusted press Next to proceed.
4.2.2.5 Configuration of the Graph Window (Gas view)
In this configuration window the trend properties are configured. The
trend can be given a title by entering a name in the Graph Title field.
(See Figure 4.46).
________________________________________________________________________
BE6027-12 LumaSoft Gas Software LumaSense Technologies A/S
7810 and 7860 Page 81 of 194
Page 82

Chapter 4
_________________________________________________________________________
Figure 4.46 Configuration of graph window properties
The number of decimals on the mea sured values can be selected in the
field selection: Y Axis Decimal places.
The time interval ( X Interval) on the X-axis can be set to days, hours,
minutes or seconds.
Back Color, Cursor Color, Text Color and Font etc. can be changed
by pressing the appropriate grey squares.
Gradient Mode gives a shading of a dark background color.
Grid Visible turns on/off the grid.
User Events turns on/off the display of user events (see Section
4.2.2.7).
Press Finish when the configuration is completed.
________________________________________________________________________
BE6027-12 LumaSoft Gas Software LumaSense Technologies A/S
7810 and 7860 Page 82 of 194
Page 83

Chapter 4
_________________________________________________________________________
Figure 4.47 The graphical window (Gas View)
Changing the configuration
To change any of the above settings after the configuration is ended
press the right mouse button while the cursor is placed in the graph
area. Select Setup (see Figure 4.48) and the Configuration window
will appear, see Figure 4.40.
________________________________________________________________________
BE6027-12 LumaSoft Gas Software LumaSense Technologies A/S
7810 and 7860 Page 83 of 194
Page 84

Chapter 4
_________________________________________________________________________
Figure 4.48 To change the configuration in the graphical window(Gas
View) press the right button on the mouse
To change (add or remove) the s e lec ted channels, press the right mouse
button while the cur sor is placed in the graph area a nd select AddTag.
(See Figure 4.48)
4.2.2.6 The Graphical Window (Gas view)
The graphic window sho ws the measur ement data in a grap h. Each filte r
in the Monitor has its own axis on the graph, see Figure 4.18. Below the
graph a window containing a list of the measured gases, and statistics
performed from all obtained measurement data (Min, Max, Mean and
Std. Deviation) is shown. The bottom window is the Error and
Warnings and Alarm window. The number of curves displayed, their
color and style are de fined by the user as described in Section 4.2.2.1 ,
Section 4.2.2.2, Section 4.2.2.3 and Section 4.2.2.4.
The user can toggle between the Errors/Warnings, Measurement
Errors/Warnings and Measurement Alarm windows. The
Errors/Warnings window will register if an y e r r or s have occurred while
running the measureme nt. The window can be hidden by pr essing Auto
Hide icon, or by selecting Errors/Warnings Window in the View
drop down menu, see Figure 4.49.
________________________________________________________________________
BE6027-12 LumaSoft Gas Software LumaSense Technologies A/S
7810 and 7860 Page 84 of 194
Page 85

Chapter 4
_________________________________________________________________________
Figure 4.49 View pull-down: Errors/Warnings Window
4.2.2.7 Functions in the Graphical Window (Gas View)
In the top of the Graphical window the Icon Tool Bar is displayed.
The tool bar makes it easier to handle and process the obtained
measurement data.
The function behind each icon will be explained in the following section.
Find Difference
The function ∆h, will calculate the difference in the value for two data
points on the same filter curve. Press the icon and then select the
two data points wit h mouse clicks. In the top right cor ner the difference
between the two measurements will be displayed, see Figure 4.50.
________________________________________________________________________
BE6027-12 LumaSoft Gas Software LumaSense Technologies A/S
7810 and 7860 Page 85 of 194
Page 86

Chapter 4
_________________________________________________________________________
Figure 4.50 Select two measurement points on the same curve to get
the difference in concentration
Historical Data Plotting
Historical data plotting is described in Section 4.2.2.9.
X Delta Cursor
Press the X Delta Cursor icon and select two points to determine
the difference in time. A light red area will appear between the two
points and the time difference will be displa yed, see Figure 4.52. When
using this function the statistics shown in the middle window are
calculated for the measurement points within the chosen interval and
will be marked with red text color, see Figure 4.51.
________________________________________________________________________
BE6027-12 LumaSoft Gas Software LumaSense Technologies A/S
7810 and 7860 Page 86 of 194
Page 87

Chapter 4
_________________________________________________________________________
Figure 4.51 Select two measurement points in the graphic window to get
the difference in time
Y Delta Cursor
Press the Y Delta Cursor icon and select two points where the
difference in concentratio n is needed. A green area will appear be tween
the two points and the min and max value in concentration will be
displayed, see Figure 4.52.
By double-clicking on a Channel in the middle win dow it is selected for
which Gas the min and max concentrations is displayed.
________________________________________________________________________
BE6027-12 LumaSoft Gas Software LumaSense Technologies A/S
7810 and 7860 Page 87 of 194
Page 88

Chapter 4
_________________________________________________________________________
Figure 4.52 Select two measurement points in the graphic window to get
the min and max concentrations
Cursor On/Off
The Cursor function will give the user opportunity to see the exact
measurement values for a ny given measurement point. Drag the curso r
to a specific measurement point and the values will be displayed in
colored boxes, see Figure 4.53.
________________________________________________________________________
BE6027-12 LumaSoft Gas Software LumaSense Technologies A/S
7810 and 7860 Page 88 of 194
Page 89

Chapter 4
_________________________________________________________________________
Figure 4.53 Drag the cursor to the measurement point to view the
measurement data
Delete Delta Cursor
A X or Y Delta Cursor can be deleted by pressing this icon . The
window below will appear and the desired cursor can be selected and
deleted by pressing Delete, see Figure 4.54.
Figure 4.54 Select the cursor which should be deleted and press Delete
Zoom
This function enables the user to zoom in and out on areas of par ticular
interest on the graph by using the two icons: Zoom In and Zoom
Out .
________________________________________________________________________
BE6027-12 LumaSoft Gas Software LumaSense Technologies A/S
7810 and 7860 Page 89 of 194
Page 90

Chapter 4
_________________________________________________________________________
Scroll
If a measurement is running over a longer period of time, these icons
can be used to scroll the x axis forth or and back or .
Expand/Compress
These two icons can be used to expand and compress the x-axis. This
function can be used to get a better visibility of measurement points
lying very close to each other.
Start/Pause measurement
These two icons a llow the user to star t a nd pause the display of
new measurements points at any time.
Select Gas
This select field box enables switching between the gasses, allowing
viewing all obtained measurement data for a specific gas, see Figure
4.55.
Figure 4.55 Select a gas in the select field box
________________________________________________________________________
BE6027-12 LumaSoft Gas Software LumaSense Technologies A/S
7810 and 7860 Page 90 of 194
Page 91

Chapter 4
_________________________________________________________________________
4.2.2.8 User Events in the graphical window (Gas view)
If an event occurs or a changed condition happened during a
measurement task, it is po s s ible to indicate this event b y u s ing t he User
Event function.
To insert a user event press the right mouse button while placing the
cursor on the measur ement point wher e the event should be added and
select Add UserEvent, see Figure 4.56.
Figure 4.56 Insert User Event by pressing the right mouse button.
The following windo w, see Figur e 4.57, will ap pear to add a comment to
be displayed for this specific user event.
Figure 4.57 Add a comment to be displayed for the user event
________________________________________________________________________
BE6027-12 LumaSoft Gas Software LumaSense Technologies A/S
7810 and 7860 Page 91 of 194
Page 92

Chapter 4
_________________________________________________________________________
Press OK to proceed. The user event which has been set up will be
shown as an envelope right beside the me asurement point, to which
it belongs.
To display a user event set the cu rsor at the envelope.
A user event can be updated or deleted by pressing the right mouse
button while placing the cursor on the envelope and selecting either
Update UserEvent or Delete UserEvent.
4.2.2.9 Printing the graphical window(Gas view)
The graphical window can be output to a printer by right-clicking with
the mouse button anywhere inside the graphical window to get the
print-menu.
Select either Print or Print Preview, see Figure 4.58.
The Print option wi ll make a printer output and the Print Preview will
make a screen view of the printout.
Figure 4.58 Printing the Graphical window(Gas view)
________________________________________________________________________
BE6027-12 LumaSoft Gas Software LumaSense Technologies A/S
7810 and 7860 Page 92 of 194
Page 93

Chapter 4
_________________________________________________________________________
The printout contain the curves and a footer with task name, monitor
type and serial number, channel number, information about the task
setup, statistical data, see Figure 4.59.
Figure 4.59 Print preview of the Graphical window(Gas view)
________________________________________________________________________
BE6027-12 LumaSoft Gas Software LumaSense Technologies A/S
7810 and 7860 Page 93 of 194
Page 94

Chapter 4
_________________________________________________________________________
4.2.2.10 Displaying historical data (Gas view)
Open an existing task by selecting O pen Task or Open Ta sk Offline in
the File drop down menu, see Figure 4.60. The Open Task Offline
allows opening a task without a Monitor connected.
Figure 4.60 File menu: Open Task/Open Task Offline
The desired task can be opened, see F igure 4.61.
Figure 4.61 Open Task list.
By selecting Task Contents in the File pull-down menu, see Figure
4.62, active filters and start/stop time is displayed, see Figure 4.63.
________________________________________________________________________
BE6027-12 LumaSoft Gas Software LumaSense Technologies A/S
7810 and 7860 Page 94 of 194
Page 95

Chapter 4
_________________________________________________________________________
Figure 4.62 File menu: Task Contents.
Figure 4.63 Contents window
The historical data can be displayed by selecting Graphical
Window>Single Gas with Se lected Channel Vi ew in the View drop
down menu, see Figur e 4.64, then press the Historical Data Plotting
icon .
Figure 4.64 View menu: Graphical Window>Single Gas with Selected
Channel View
________________________________________________________________________
BE6027-12 LumaSoft Gas Software LumaSense Technologies A/S
7810 and 7860 Page 95 of 194
Page 96

Chapter 4
_________________________________________________________________________
A specific time inte rval can be se lected by entering da te and time i n the
two fields: From Date and To Date, see Figure 4.65.
Figure 4.65 Select time interval for historic data plotting.
Click OK to display the historical data in a graph.
The functions of the icons in the historical window are the same as in
the Real Time Window described in Section 4.2.2.7.
To continue the measur ements performe d in the specific task, press the
green arrow icon or select Start in the Measurement drop down
menu, see Figure 4.3.
To display the incoming measuring data (real time data) select the
icon.
________________________________________________________________________
BE6027-12 LumaSoft Gas Software LumaSense Technologies A/S
7810 and 7860 Page 96 of 194
Page 97

Chapter 4
_________________________________________________________________________
4.3 Presentation of Data in the Numeric Window
To display measurement data numeric select Numeric Window in the
View pull-down menu.
Figure 4.66 View pull-down: Numeric Window
4.3.1 Configuration of the Numeric Window
The Numeric Window Properties consists of two Index cards:
Interval and Columns, see Figure 4.67.
Figure 4.67 Numeric Window Properties
________________________________________________________________________
BE6027-12 LumaSoft Gas Software LumaSense Technologies A/S
7810 and 7860 Page 97 of 194
Page 98

Chapter 4
_________________________________________________________________________
Interval Index Card
Type in a title for the numeric window in the Window Title box, see
Figure 4.67.
Choose which time inter val on a specific date tha t should be included in
the numeric window. This o ption enables to define the column length as
a period of time.
Also the number of decimal places fo r concentr ation and pr es sure va lues
can be selected.
Columns Index Card
Define which component’s parameters are displayed in the numeric
window.
Figure 4.68 Column Index Card
In the Single Column Setup select the gases which should be
displayed and their units, see Figure 4.68.
Select paramet er: by clicking in this field, the names of all the gases
and atmospheric pressure measured during this monitoring task are
displayed. The gases and pressure are selected individually, see Figure
4.69.
________________________________________________________________________
BE6027-12 LumaSoft Gas Software LumaSense Technologies A/S
7810 and 7860 Page 98 of 194
Page 99

Chapter 4
_________________________________________________________________________
Figure 4.69 Select which gases should be displayed
Select unit: this enables to disp lay the des ire d unit fo r ea ch gas a nd fo r
the atmospheric pre ssure. C lick in t he s elect uni t field , and the availa ble
units for this parameter will be displayed.
Figure 4.70 Select the units in which the concentration should be
displayed
Press Add after each selected parameter, see Figure 4.71. To insert the
second parameter befo re the first press Add Before. I t is also possible
to remove a selected parameter by pressing Remove.
________________________________________________________________________
BE6027-12 LumaSoft Gas Software LumaSense Technologies A/S
7810 and 7860 Page 99 of 194
Page 100

Chapter 4
_________________________________________________________________________
Figure 4.71 The selected gases are shown in the All Columns field
For convenience it i s possible to add all the filter paramet ers using the
Add All soft-key, see Figure 4. 72.
Figure 4.72 All filter parameters added with the Add All soft-key
In the All Columns field all component parameters to be displayed in
the numeric window must appear. Note that if a parameter already
________________________________________________________________________
BE6027-12 LumaSoft Gas Software LumaSense Technologies A/S
7810 and 7860 Page 100 of 194
 Loading...