

Page 1

BE6028-14
Instruction
Manual
3434i
SF6 Leak Detector
Page 2

Index
________________________________________________________________________
Index
Index ................................................................................................................................... 2
3434i SF6 Leak Detector ........................................................................................................ 4
Safety Considerations. ...................................................................................................... 5
Applying Power ................................................................................................................ 7
Chapter 1 Using this Manual ................................................................................................. 8
1.1 Introduction ............................................................................................................ 9
1.2 Online Monitoring .................................................................................................... 9
1.3 PC Use BZ7002 Calibration Software .......................................................................... 9
1.4 PC Use BZ7003 Offline Software ................................................................................ 9
1.5 Stand-alone Use ...................................................................................................... 9
Chapter 2 Preliminary Tasks ............................................................................................... 12
2.1 Connecting the Monitor to the PC ............................................................................ 13
2.2 Checking /changing the Fuses in the Monitor. ........................................................... 14
2.3 Setting the USB Communication Parameters ............................................................. 17
2.4 Setting the RS-232 Communication Parameters ........................................................... 18
2.5 Setting the Ethernet Communication Parameters ....................................................... 19
2.6 Setting-up user Levels ........................................................................................... 23
2.7 Restoring of calibration data ................................................................................... 25
Chapter 3 Philosophy of Operation ....................................................................................... 26
3.1 PC Use – Online .................................................................................................... 27
3.2 Stand-alone Use .................................................................................................... 28
Chapter 4 Introduction to and Familiarization with the Monitor ............................................... 30
4.1 Special Terminology ............................................................................................... 31
4.2 Attaching the Sampling Tube and External Filter ........................................................ 34
4.3 Familiarization with the Monitor using the Front Panel ................................................ 35
Chapter 5 The Monitor ....................................................................................................... 56
5.1 Introduction .......................................................................................................... 57
5.2 Front Panel ........................................................................................................... 57
5.3 Starting-up or Restarting the Monitor ....................................................................... 61
5.4 Configuring the Monitor .......................................................................................... 64
5.5 Alarm Relay .......................................................................................................... 67
5.6 Continuous Warm System ...................................................................................... 69
Chapter 6 Keying-in Parameters .......................................................................................... 70
6.1 Types of Parameters .............................................................................................. 71
Chapter 7 Setting-up and Starting a Monitoring Task ............................................................ 74
7.1 The Parameters’ Units ............................................................................................ 75
7.2 The Measurement Parameters ................................................................................. 77
7.3 Setting-up the Monitor’s Alarm Levels ...................................................................... 85
7.4 Starting a Monitoring Task ...................................................................................... 86
Chapter 8 Viewing Measurement Data – Using the Monitor .................................................... 90
8.1 Displayed Monitoring Task Data............................................................................... 91
8.2 Printed Monitoring Task Data .................................................................................. 96
8.3 Storage Space in the Display Memory ...................................................................... 99
Chapter 9 Storage of Data in the Monitor’s Memory .............................................................. 100
9.1 Types of Memory in the Monitor ............................................................................. 101
9.2 Storage of Measurement Results ............................................................................ 109
9.3 Management of Data in Background Memory ........................................................... 112
Chapter 10 Using a Printer with the Monitor ......................................................................... 116
10.1 Introduction ......................................................................................................... 117
10.2 Printer Cables ...................................................................................................... 117
10.3 Setting-up Communication Parameters ................................................................... 118
10.4 Additional Parameters Required .............................................................................. 123
10.5 Data Logging Function .......................................................................................... 124
10.6 Error Logging Function .......................................................................................... 124
10.7 Printing-out Data from the Monitor ......................................................................... 125
_____________________________________________________________________________
BE6028-14 3434i SF6 Leak Detector LumaSense Technologies A/S
Page 2 of 191
Page 3

Index
________________________________________________________________________
Chapter 11 Maintenance of the 3434i .................................................................................. 126
11.1 Changing the Fine Air-filters .................................................................................. 127
11.2 Cleaning the Filter in the Ventilation Unit ................................................................. 132
11.3 Cleaning the Instrument ........................................................................................ 133
Chapter 12 Calibration of the Optical Filters ......................................................................... 134
12.1 About the Installed Optical Filters ........................................................................... 135
12.2 What is Calibration and Why is it Necessary? ........................................................... 136
12.3 Tasks Before Starting Any Calibration ..................................................................... 138
12.4 The Basic Calibration Set-up .................................................................................. 144
12.5 General Settings – Stand-alone Use ........................................................................ 147
12.6 Zero-point Calibration ........................................................................................... 151
12.7 Humidity-interference Calibrations – Stand-alone Use ............................................... 155
12.8 Span Calibration ................................................................................................... 159
12.9 Calibration of the Water-vapour Filter – Stand-alone Use ........................................... 167
12.10 Setting-up a Combined Zero-point and Humidity-interference Calibration – Stand-
alone Use ................................................................................................................ 173
12.11 Setting-up any Combined Calibration – Stand-alone Use ...................................... 175
Chapter 13 Messages Related to Calibration ......................................................................... 177
13.1 “Successful” Calibration Messages .......................................................................... 178
13.2 “Successful *” Calibration Messages ........................................................................ 178
13.3 “Invalid” Calibration Messages ............................................................................... 179
13.4 Error Messages Displayed when the INFO button is used ........................................... 179
Chapter 14 Warning and Error Messages ............................................................................. 185
_____________________________________________________________________________
BE6028-14 3434i SF6 Leak Detector LumaSense Technologies A/S
Page 3 of 191
Page 4

Safety Considerations
________________________________________________________________________
3434i SF6 Leak Detector
July 2014
_____________________________________________________________________________
BE6028-14 3434i SF6 Leak Detector LumaSense Technologies A/S
Page 4 of 191
Page 5

Safety Considerations
______________________________________________________________________
Safety Considerations.
Throughout this manual Monitor is used for:
The 3434i SF6 Leak Detector
The Monitor complies with:
• EN/IEC 61010-1, 2
equipment for measurement, control and laboratory use.
• Can/CSA-C22.2 No. 61010-1-04 - Safety Requirements for
Electrical Equipment for Measurement, Control, and Laboratory
Use.
• UL Std. No. 61010A-1 (2
Electrical Equipment for Measurement, Control, and Laboratory
Use.
To ensure safe operation and retain the Monitor in safe condition,
note the following:
TO AVOID THE POSSIBILITY OF AN EXPLOSION; MONITORING
OF FLAMMABLE GASES IN EXPLOSIVE CONCENTRATIONS
nd
Edition: Safety requirements for electrical
nd
Edition) - Safety Requirements for
EXPLOSION HAZARD!
MUST NEVER BE ATTEMPTED.
Never operate the 3434i SF6 Leak Detector in potentially
explosive environments.
When monitoring potentially flammable or toxic gases it is essential
that:
• The instrument itself is placed in a well-ventilated area outside the
potentially hazardous zone.
• A sufficiently long tube is connected to the air-outlet on the back
panel so that the sampled gas is carried away to the open air or to
an extraction and/or filtration unit.
_____________________________________________________________________________
BE6028-14 3434i SF6 Leak Detector LumaSense Technologies A/S
Page 5 of 191
Page 6

Safety Considerations
______________________________________________________________________
Environmental Conditions for transport and storage:
Temperature: -25 to +55ºC
Relative Humidity: 0 to 80% RH
Atmospheric Pressure: 800 to 1060 hPa
Warnings!
• Avoid water condensation in the instrument.
• Switch off all equipment before connecting or disconnecting their
digital interface. Failure to do so could damage the equipment.
• Whenever it is likely that correct function or operating safety of
the apparatus has been impaired, the apparatus must be made
inoperative and secured against unintended operation.
• Any adjustment, maintenance and repair of the open apparatus
under voltage must be avoided as far as possible and, if
unavoidable, must be carried out only by trained personnel.
• If a fault is reported by the monitor that indicates correct function
of the instrument may be impaired, consult your local LumaSense
Technologies representative. Under no circumstances should repair
be attempted by persons not qualified in service of electronic
instrumentation.
_____________________________________________________________________________
BE6028-14 3434i SF6 Leak Detector LumaSense Technologies A/S
Page 6 of 191
Page 7

Safety Considerations
______________________________________________________________________
Applying Power
Before using the 3434i check that the available mains voltage match
the specified voltage and frequency for the instrument.
SAFETY SYMBOLS
The apparatus will be marked with this symbol when it is important
that the user refers to the associated warning statement given in the
User Guide.
Frame or Chassis Dangerous voltage Protective earth
Copyright © 2014 LumaSense Technologies A/S
All rights reserved. No part of this publication may be reproduced or
distributed in any form or by any means without prior consent in
writing from LumaSense Technologies A/S, Denmark
_____________________________________________________________________________
BE6028-14 3434i SF6 Leak Detector LumaSense Technologies A/S
Page 7 of 191
Page 8

Chapter 1
______________________________________________________________________
Chapter 1
Using this Manual
July 2014
_____________________________________________________________________________
BE6028-14 3434i SF6 Leak Detector LumaSense Technologies A/S
Page 8 of 191
Page 9

Chapter 1
______________________________________________________________________
1.1 Introduction
This manual can be used in several ways. The first time users can
work their way through the examples in order to get to know this
monitoring system. The more experienced users can jump directly to
the relevant chapters in order to gain assistance, and experts can
use this manual as a reference book by using the index.
The monitor can be operated in different ways; Online Monitoring
using LumaSoft Gas Single point 7810, Online Calibration and backup using the Calibration Software BZ7002, Offline using the Offline
Software BZ7003 , and as a Stand-alone instrument. This manual
focuses on the Stand-alone use. For instruction in the use of BZ7002
and BZ7003 please refer to the User Manuals BE6034 and BE6035
respectively.
1.2 Online Monitoring
LumaSoft Gas Single Point 7810 is supplied with the instrument. This
is to be used for Online monitoring (PC use) please follow the
instructions in the BE6027 User Manual for online monitoring and
set-up.
1.3 PC Use BZ7002 Calibration Software
The BZ7002 Calibration Software is used for calibration of the gas
monitor from a PC. Please refer to the BZ7002 User Manual BE6034
and Chapter 12 of this Manual.
1.4 PC Use BZ7003 Offline Software
Data from the display memory can be copied to the background memory
after a measurement task is performed. The BZ7003 Offline Software is
used for upload of these measurement data from the monitor to the PC in
either excel format or text format files. Please refer to the User Manual
BE6035 and Chapter 9 of this manual for further instructions.
1.5 Stand-alone Use
In some situations, it may be necessary to set up without connecting
it to a PC. The procedure to do this are covered in this manual under
the Stand-alone use headings. The way these instructions are
presented is shown below:
_____________________________________________________________________________
BE6028-14 3434i SF6 Leak Detector LumaSense Technologies A/S
Page 9 of 191
Page 10

Chapter 1
↵
SELECT SET-UP BRANCH
S1 S2 S3
______________________________________________________________________
MEASUREMENT FORMAT CONFIGURATION
The display above is used continuously through-out this manual. It
assists you displaying the text on screen and by indicating which of
the push-buttons can and should be pressed.
In general, the push-buttons shown above are used to navigate
through the various modes possible within the 3434i but are
described in more detail below:
These push-buttons are illustrated as S1, S2 and S3. On the 3434i
they correspond to the key and their position on the instrument.
These select push-buttons enable you to select one of the options
displayed.
This group of 5 push-buttons are referred to in this manual
collectively as the direction keys. The symbols below are used to
simplify the instruction in this manual.
▲ & ▼ enable you to increase & decrease numbers, respectively, or
to go to the Previous & Next Displays, respectively.
◄ & ► enable you to move across number fields or go to the
Previous & Next gases, respectively.
, depending on the situations, acts as an “Enter” or “Go To Head”
key.
Memory Function push-buttons are always represented with the name
of the push-button enclosed in a box which is shaded-in.
_____________________________________________________________________________
BE6028-14 3434i SF6 Leak Detector LumaSense Technologies A/S
Page 10 of 191
Page 11

Chapter 1
______________________________________________________________________
SYSTEM Text that appears on the display screen is shown in an open
shaded box, using UPPER case letters.
FORMAT System General Clock
When referring to any part of the Set-up “tree”, the text is
shown in open shaded boxes with the same typeface as that
used in the “tree”.
_____________________________________________________________________________
BE6028-14 3434i SF6 Leak Detector LumaSense Technologies A/S
Page 11 of 191
Page 12

Chapter 2
______________________________________________________________________
Chapter 2
Preliminary Tasks
July 2014
_____________________________________________________________________________
BE6028-14 3434i SF6 Leak Detector LumaSense Technologies A/S
Page 12 of 191
Page 13

Chapter 2
______________________________________________________________________
When taking delivery of the 3434i SF6 Leak Detector, five very
important and preliminary tasks must be completed before starting
to operate it:
Install the BZ7002 Calibration Software to enable operation Back-up
of the calibration file supplied with the instrument if calibrations are
performed by LumaSense Technologies A/S.
Connect the Monitor to a PC (see section 2.1).
Check/Change the fuses in the monitor (see section 2.2).
Set the Communication parameters. USB (see section 2.3), RS232
(see section 2.4), Ethernet (see section 2.5).
Set-up the password protected user levels (see section 2.6).
2.1 Connecting the Monitor to the PC
The monitor comes complete with a USB interface cable. The
maximum length of an USB cable is 5 meters. USB extension kits can
be used to extend the USB connection to 30 meters.
The gas monitor can also be connected to a PC using a 9-pin to 9-pin
null modem RS-232 interface cable (optional accessory WL950-003).
Finally the monitor can be connected to a PC using the Ethernet
network connection.
2.1.1 Fitting the RS-232 Cable.
Ensure that both the monitor and the PC are switched off at the
mains. Failure to do so may result in your equipment being
damaged.
Locate the serial port at the back of the PC; refer to your PC manual
if in doubt.
Push the connector on the RS-232 cable on to the serial port socket,
and secure it firmly using the securing screws.
Locate the output labelled “RS-232” at the back of the Monitor.
Push the connector at the other end of the RS-232 cable on to this
socket, and secure it firmly using the securing screws.
Turn on the PC. Wait for Windows to start up.
The instruments can be turned on at the mains now.
2.1.2 Fitting the USB Cable.
The gas monitor can be connected to an USB port on the PC in order
to make measurements using the LumaSoft Gas Single Point 7810 PC
application, which communicates using the USB interface
communication protocol.
_____________________________________________________________________________
BE6028-14 3434i SF6 Leak Detector LumaSense Technologies A/S
Page 13 of 191
Page 14

Chapter 2
______________________________________________________________________
The USB interface cable can be connected while the gas monitor is
switched on.
2.2.3 Fitting the Ethernet Cable.
The gas monitor can be connected to a local Ethernet network in
order to make measurements using the LumaSoft Gas Single Point
7810 PC application, which communicates using the TCP/IP network
interface protocol or to view the homepage of the gas monitor in a
standard PC internet browser.
The Ethernet network cable can be connected while the gas monitor
is switched on.
Connect a standard Ethernet network cable to the Ethernet socket
connector on the back of the gas monitor. Connect the other end of
the Ethernet network cable to your local network. The yellow LED on
the Ethernet socket connector will lit, if a local network connection is
detected.
2.2 Checking /changing the Fuses in the Monitor.
Unplug the Monitor from the mains power supply and pull out the
plug in the AC Mains socket of the Monitor
If the fuses in the Monitor are blown it can indicate a serious fault in
the instrument, therefore it is advisable to contact your LumaSense
service representative before changing the fuse!
2.2.1 Checking/changing the Fuses in the 3434i
1. Turn the 3434i so that it stands on its back panel and remove
the rubber “shoes” mounted on the four “feet” of its baseplate.
2. Using Pozidrive screwdriver No. 1, undo and completely
remove the screws located under the rubber “shoes” which
have just been removed.
Note: these screws hold the upper and lower covers of the
3434i together. If the screws are not completely undone you
will not be able to remove the upper cover as explained in step
5.
_____________________________________________________________________________
BE6028-14 3434i SF6 Leak Detector LumaSense Technologies A/S
Page 14 of 191
Page 15

Chapter 2
______________________________________________________________________
3. Undo the upper four screws holding the frame over the back-
panel of the 3434i using Pozidrive screwdriver No. 0.
4. Using the Pozidrive screwdriver No.0 undo the upper four
screws which hold the frame over the front panel of the 3434i.
_____________________________________________________________________________
BE6028-14 3434i SF6 Leak Detector LumaSense Technologies A/S
Page 15 of 191
Page 16

Chapter 2
______________________________________________________________________
5. Gently lift off the upper cover of the 3434i by pulling it firmly
upward.
6. Use a screwdriver to remove the fuse-holder:
7. Remove the old fuse from the holder and replace it with a new.
Check that the fuse has the correct rating.
The fuse must be:
Slow-blow (T) fuse with a rating of 2.5 A, 250 VAC, 5x20 mm, UL
approved.
LumaSense order number: VF0102A
_____________________________________________________________________________
BE6028-14 3434i SF6 Leak Detector LumaSense Technologies A/S
Page 16 of 191
Page 17

Chapter 2
______________________________________________________________________
8. Install the fuse-holder and re-assemble the 3434i again.
The figure below shows the inside of the top cover of the 3434i. Note
that the front side of the cover has square flanges. Place the top
cover back in its correct position on top of the 3434i and screw in the
all screws.
2.3 Setting the USB Communication Parameters
The LumaSoft Gas 7810 application with USB communication is able
to communicate with the 3434i gas monitor through a USB cable.
BZ7002 and BZ7003 applications with USB communication are able
to communicate with the 3434i gas monitor through a USB cable .
No setup on the 3434i gas monitor is necessary in order to be able to
communicate with the 3434i gas monitor through an USB connection.
_____________________________________________________________________________
BE6028-14 3434i SF6 Leak Detector LumaSense Technologies A/S
Page 17 of 191
Page 18
Chapter 2
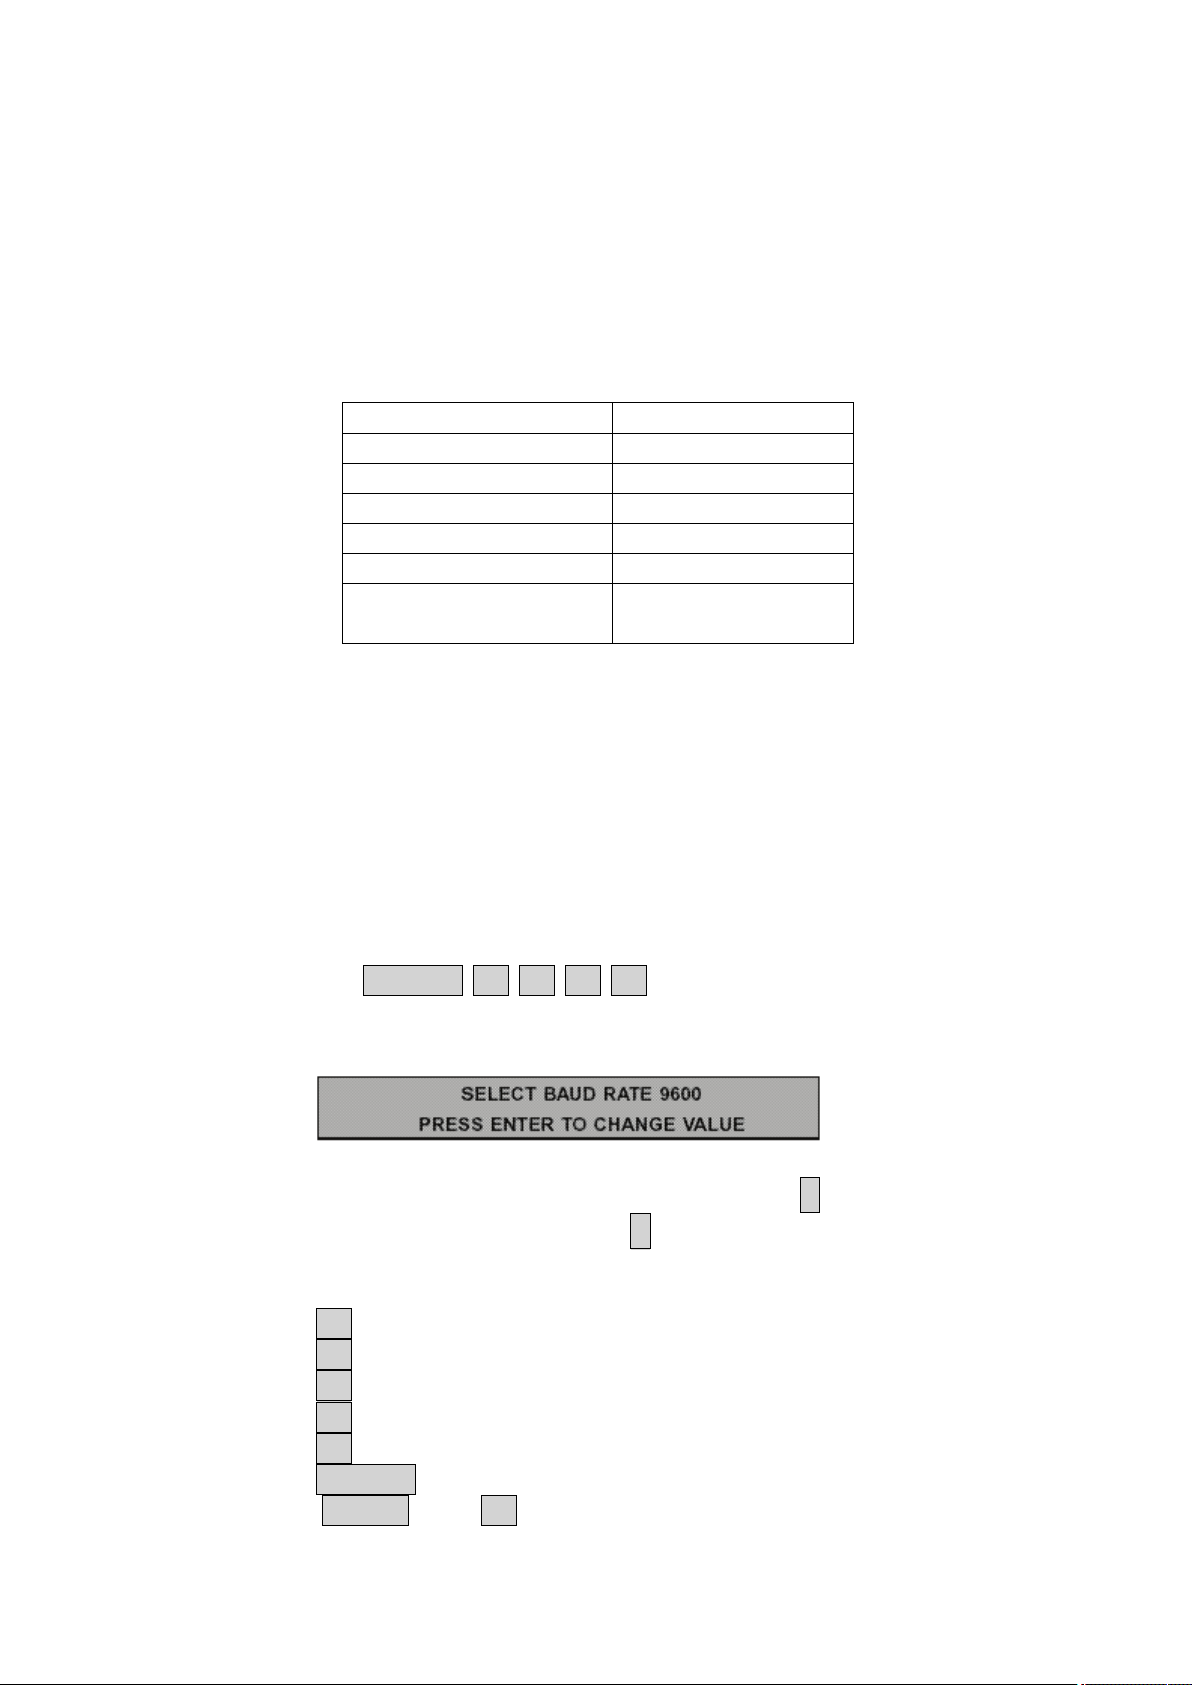
Baud rate
9600
Stop bits
1
Data bits
7
Parity
Even
Hardwire mode
Leased line
Handshake type
Hardwire
Text Line
Terminator
CR-LF
______________________________________________________________________
2.4 Setting the RS-232 Communication Parameters
2.4.1 Default RS-232 Communication Parameters.
The Default RS-232 Communication parameters are shown in the
table below.
Performing a full reset will set all parameters to the default settings.
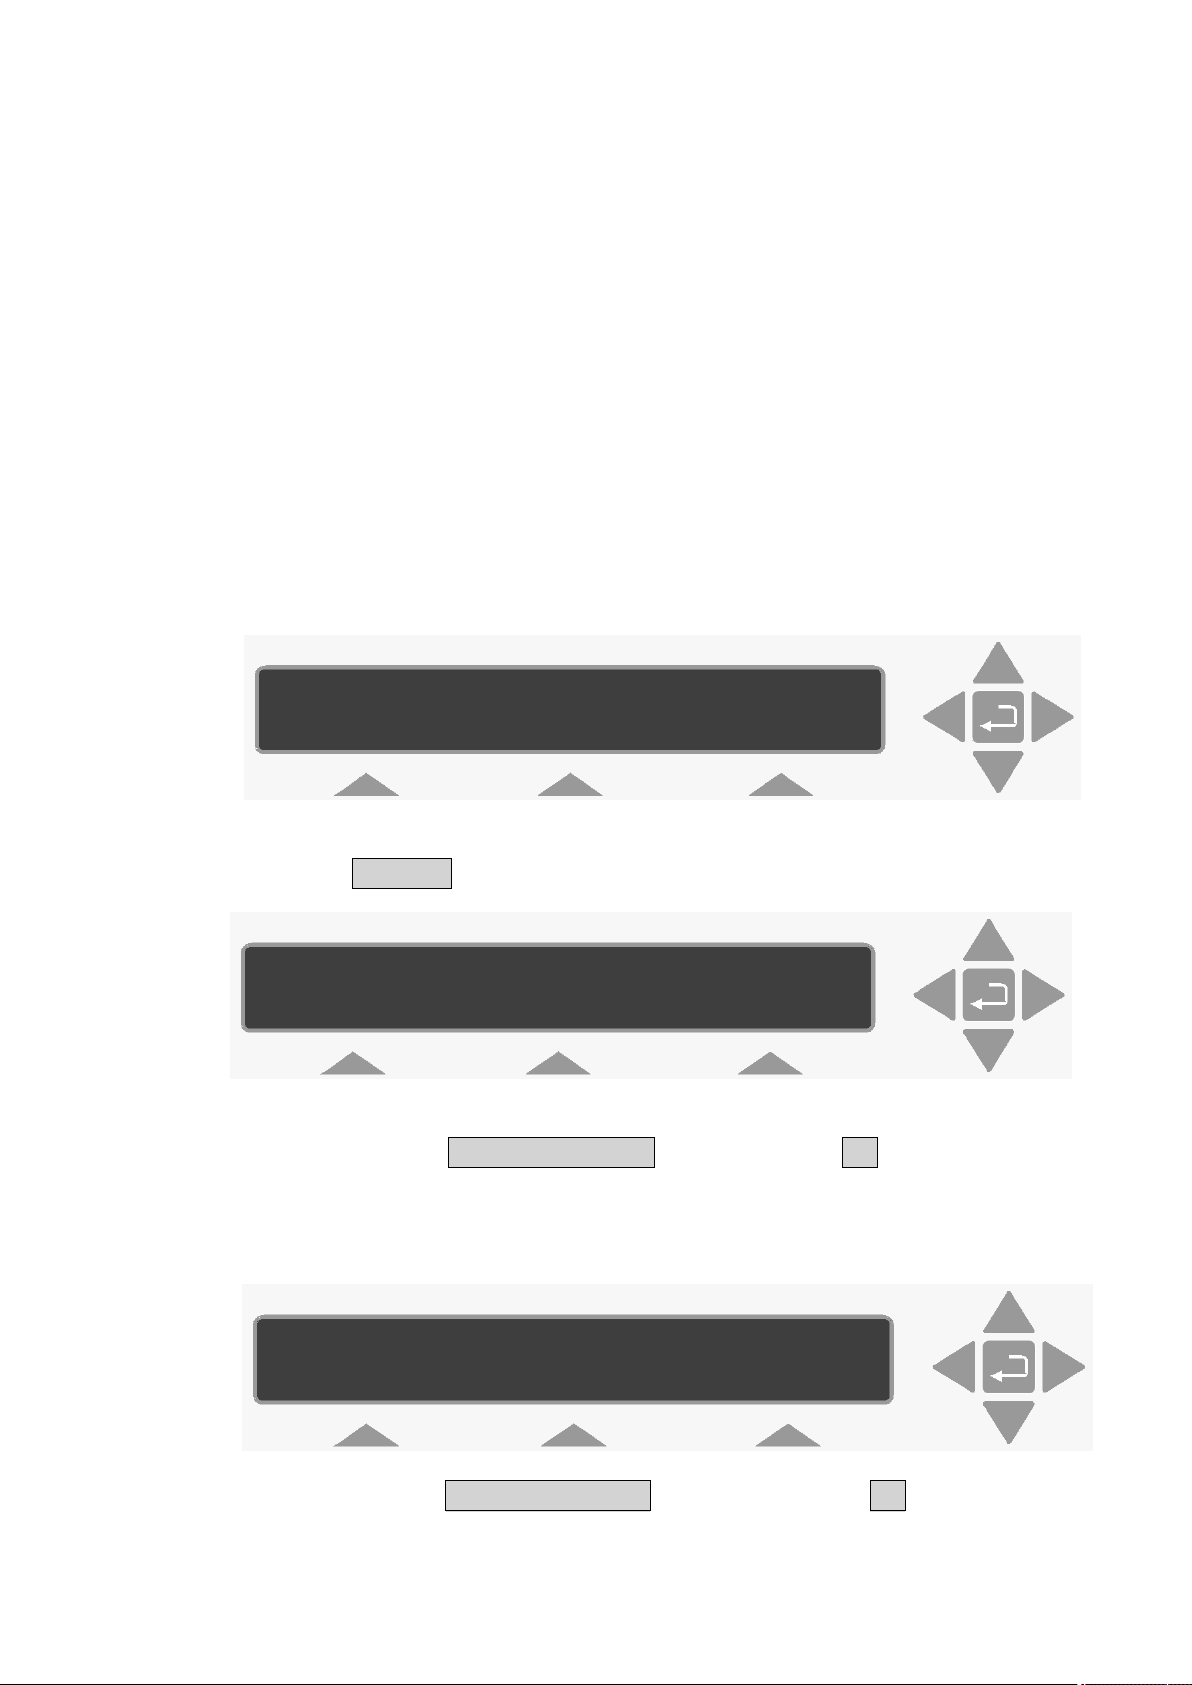
2.4.2 Checking/Changing the RS-232 Communication Parameters
The communication parameters for the serial interface must be set
using the push-buttons on the front of the monitor.
1. Press SET-UP S3 S1 S3 S1 .The screen display now shows the
following text.
If the baud rate displayed is incorrect press ↵ and use ▲ and ▼ to
display the correct value. Press ↵ again to store the selection.
If the baud rate displayed is correct, then press ▼ to continue to the
next parameter.
Press S1 to select 1 STOP BIT.
Press S1 to select 7 DATA BITS
Press S2 to select EVEN PARITY
Press S3 to select LEASED-LINE
Press S3 to select HARD-WIRED HANDSHAKE.
Press SET-UP to exit the set-up mode
Press RESET and S1 in order that the new settings are enabled.
_____________________________________________________________________________
BE6028-14 3434i SF6 Leak Detector LumaSense Technologies A/S
Page 18 of 191
Page 19

Chapter 2
SELECT ADDRESSABLE SET-UP BRANCH
______________________________________________________________________
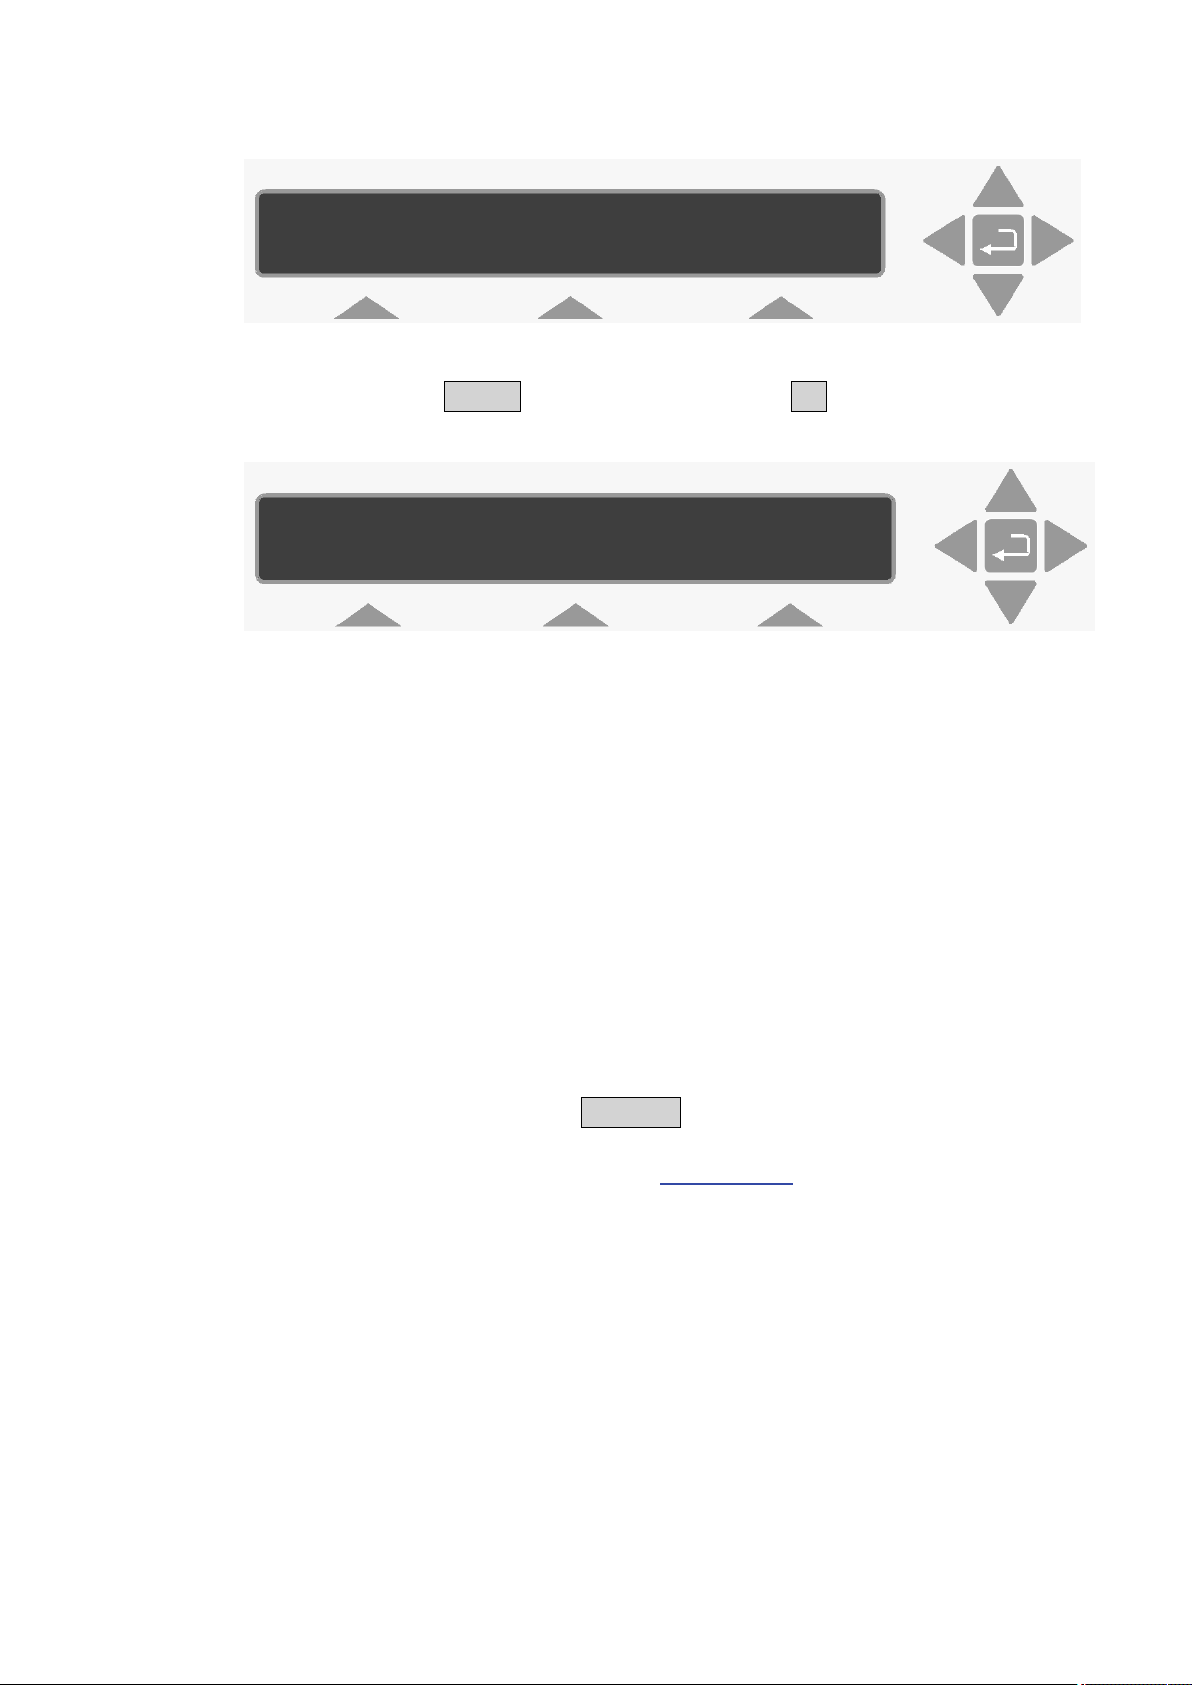
2.4.3 Checking/Changing the Text line Terminator.
The Text line Terminator must be set using the push-buttons on the
front of the monitor.
Press SET-UP S2 ▼ ▼ ▼ S3
Press SET-UP to exit the set-up mode
2.4.4 Checking/Changing the Data Log and Error Log Options.
The Data Log and Error Log must be set using the push-buttons on
the front of the monitor.
Press SET-UP S3 S1 S1 S3 ▼S1 S1
Press SET-UP to exit the set-up mode
2.5 Setting the Ethernet Communication Parameters
The LumaSoft Gas 7810 application with Ethernet communication is
able to communicate with the 3434i gas monitor through a local
Ethernet network.
The homepage of the 3434i gas monitor can also be displayed in a
web browser, when the 3434i gas monitor is connected to a local
Ethernet network.
2.5.1 Checking/Changing the Ethernet Communication Parameters
The communication parameters for the Ethernet interface can be set
by using the push-buttons on the front of the monitor.
1. Press SET-UP S3 S1 S3 S2. The screen display now shows the
following text.
Ethernet IEEE 488
2. Press S1 to enter the Ethernet setup. During this setup you can
also use the ▲ and ▼ keys to go back and forth between the
_____________________________________________________________________________
BE6028-14 3434i SF6 Leak Detector LumaSense Technologies A/S
Page 19 of 191
Page 20

Chapter 2
IS 3434i'S IP ADDRESS SET BY DHCP ?
3434i 'S IP ADDRESS 192.168.000.200
PRESS ENTER TO CHANGE VALUE
3434i'S IP ADDRESS 192.168.000.200
CANCEL DEFAULT
3434i'S IP PORT NUMBER: 23
______________________________________________________________________
available Ethernet settings. The screen display now shows the
following text.
NO YES
3. Here you can select whether the IP address of the 3434i gas
monitor is to be assigned by a DHCP server in the local network.
If you want the 3434i's IP address to be assigned by the DHCP
server press the S3 (Yes) key, where after you will proceed to the
below step 6 as the IP address is set by the DHCP server. If you
want yourself to set the IP address of the 3434i press the S1 (No)
key. The screen display now shows the following text.
4. Here you can change the IP address of the 3434i gas monitor in
case the IP address is not set by a DHCP server in the local
network. If you want to change the IP address, press the ↵ key. If
the IP address does not need to be changed, press the ▼ key and
you will proceed to the below step 6.
If you selected to change the IP address, the screen display now
shows the following text.
5. Here you can change the 4 individual numbers in the IP address
by using the ▲ and ▼ keys. Each of the 4 individual numbers can
be set in the range from 000 to 255.
You can step between the 4 individual numbers in the IP address
by using the ◄ and ► keys.
In case you want to return to the start value of the IP address
press the S1 (CANCEL) key. In case you want to return to the
default stored value of the IP address press the S3 (DEFAULT)
key.
When you have set the IP address, press the ↵ key. The screen
display now shows the following text.
PRESS ENTER TO CHANGE VALUE
_____________________________________________________________________________
BE6028-14 3434i SF6 Leak Detector LumaSense Technologies A/S
Page 20 of 191
Page 21

Chapter 2
PROTECTED IP ADDRESS 000.000.000.000
3434i'S IP PORT NUMBER: 23
PROTECTED IP ADDRESS 000.000.000.000
CANCEL DEFAULT
______________________________________________________________________
6. Here you can set the IP port number for the Ethernet
communication. This normally does not need to be changed. If
you want to change the IP port number press the ↵ key. If the IP
port numbers does not need to be changed, press the ▼ key and
you will proceed to the below step 8. If you selected to change the
IP port number the screen display now shows the following text.
CANCEL DEFAULT
7. Here you can change the IP port number by using the ▲ and ▼
keys. The port number can be set in the range from 0 to 32767.
In case you want to return to the start value of the IP port
number press the S1 (CANCEL) key. In case you want to return to
the default stored value of the IP port number press the S3
(DEFAULT) key.
When you have set the IP port number, press the ↵ key. The
screen display now shows the following text.
PRESS ENTER TO CHANGE VALUE
8. In case you want the 3434i gas monitor to be able to
communicate only with a certain PC on the local network, you can
set the IP address of this PC as the protected IP address. This can
be desired due to security reasons so no other PC is able to
communicate with the 3434i gas monitor.
If no protection is desired the protected IP address should be set
to a value of 000.000.000.000.
If you want to change the protected IP address, press the ↵ key.
If the protected IP address does not need to be changed, press
the ▼ key and you will proceed to the below step 10.
If you selected to change the protected IP address the screen
display now shows the following text.
9. Here you can change the 4 individual numbers in the protected IP
address by using the ▲ and ▼ keys. Each of the 4 individual
numbers can be set in the range from 000 to 255.
You can step between the 4 individual numbers in the protected IP
address by using the ◄ and ► keys.
In case you want to return to the start values of the protected IP
address press the S1 (CANCEL) key. In case you want to return to
_____________________________________________________________________________
BE6028-14 3434i SF6 Leak Detector LumaSense Technologies A/S
Page 21 of 191
Page 22

Chapter 2
CURRENT DHCP ADDRESS 192.168.000.062
______________________________________________________________________
the default stored value of the protected IP address press the S3
(DEFAULT) key.
When you have set the protected IP address, press the ↵ key.
If you previously selected that the IP address was NOT to be set
by the DHCP server you will proceed to the below step 11.
If you instead selected that the IP address to be set by the DHCP
server, the screen display now shows the following text.
ACCEPT
10. Here the IP address of the 3434i, which has been assigned by the
DHCP server, is displayed. This IP address can be used to
manually set Ethernet communication in a PC application, which
accesses the 3434i gas monitor.
Press the S2 (ACCEPT) key to accept.
11. This concludes the setup of the Ethernet parameters of the 3434i
gas monitor.
Press the SET-UP key to leave the setup.
2.5.2 Display the Homepage of the Monitor
The homepage of the 3434i gas monitor can be displayed if the gas
monitor is connected to a Ethernet network.
In section 2.5.1 it is explained how to set-up the Ethernet
parameters in the 3434i gas monitor.
Any web browser can be used to display the homepage of the gas
monitor. The IP address obtained from the Ethernet set-up of the
3434i gas monitor, can be entered in the address field of the web
browser in order to display the homepage.
The last measured gas values are displayed together with
information about the gas monitor, like the device serial number, if
water- and cross-compensation is performed.
Error and warning messages (see Chapter 14 for further details) will
also be displayed on the homepage.
The grey "Update Measurements" link can be used to update the
homepage with the last measurement results.
_____________________________________________________________________________
BE6028-14 3434i SF6 Leak Detector LumaSense Technologies A/S
Page 22 of 191
Page 23

Chapter 2
______________________________________________________________________
Fig.2.1 The 3434i gas monitor homepage
2.6 Setting-up user Levels
Press the Lock function push button on the front of the Monitor.
This enables setting up 3 different user levels, Level 1, Level 2 and
Level 3.
These user levels are password protected.
Level 1 is the Operator level, which enables start/stop and reading of
measurement results. Partial Reset is possible.
Level 2 is the Expert level, which in addition to Level 1 access
enables set up of parameters. Full Reset is possible.
Level 3 is the Super-User level, which allows all possible operations
including calibration.
2.6.1 Default settings for User Level and Password.
Before dispatch from the factory the User Level and the Password are
set to the following default setting.
User Level 3
And the default setting for the Password is:
Password: ***** (5 times *)
_____________________________________________________________________________
BE6028-14 3434i SF6 Leak Detector LumaSense Technologies A/S
Page 23 of 191
Page 24

Chapter 2
CURRENT USER LEVEL IS X
CHANGE USER LEVEL CHANGE PASSWORD
ENTER PASSWORD "*****"
PASSWORD IS "*****"
PRESS ENTER TO CHANGE VALUE
ENTER PASSWORD "*****"
______________________________________________________________________
These settings are to be used to change user level or password the
first time.
2.6.2 Changing the Password
In order to change the Password Press the Lock function push
button on the front of the Monitor.
The following text is displayed.
Press S3 “CHANGE PASSWORD”
The following text appears.
PRESS ENTER TO CHANGE VALUE
1. Press ↵ to change value.
The following text appears.
CANCEL DEFAULT
2. Enter the old Password using the ▲ and ▼ keys.
3. Press ↵.
The following text appears.
4. Type in the new Password using the ▲ and ▼ keys.
5. Press ↵.
2.6.3 Changing the User Level
In order to change the User Level Press the Lock function push
button on the front of the Monitor
_____________________________________________________________________________
BE6028-14 3434i SF6 Leak Detector LumaSense Technologies A/S
Page 24 of 191
Page 25

Chapter 2
ENTER PASSWORD "*****"
CURRENT USER LEVEL IS X
CHANGE USER LEVEL CHANGE PASSWORD
CURRENT USER LEVEL IS X
______________________________________________________________________
The following text is displayed.
1. Press S1 “CHANGE USER LEVEL”
The following text appears.
PRESS ENTER TO CHANGE VALUE
2. Press ↵.
3. Enter the current Password using the ▲ and ▼ keys.
4. Press ↵.
The following text appears.
PRESS ENTER TO CHANGE VALUE
5. Press ↵.
6. Use the ▲ and ▼ keys to change the User level.
7. Press ↵.
8. Press the Lock function push button to exit.
2.7 Restoring of calibration data
If you have ordered a calibration from our calibration laboratory, you
will receive a CD with a backup of the calibration data. It is very
important that you store these data in your Calibration Software
BZ7002. Please store the data before using the Gas Monitor. Please
refer to the User Manual BE6034 regarding this procedure.
_____________________________________________________________________________
BE6028-14 3434i SF6 Leak Detector LumaSense Technologies A/S
Page 25 of 191
Page 26

Chapter 3
______________________________________________________________________
Chapter 3
Philosophy of Operation
July 2014
_____________________________________________________________________________
BE6028-14 3434i SF6 Leak Detector LumaSense Technologies A/S
Page 26 of 191
Page 27

Chapter 3
______________________________________________________________________
The monitor has several essential operational features, which enable
you to operate it without undue reference to this Instruction Manual.
The main features of the monitor which ensure its simple and easy
operation, are listed below:
• The fully, comprehensive Software BZ7002 and BZ7003.
• The LumaSoft Gas Single Point 7810 application software.
• The short, self-explanatory texts, which appear in the monitor
display when the monitor is being used, give operational guidance
to the user.
• The small light-emitting diodes at some of the push-buttons allow
the user to identify how the monitor is operating at any particular
time.
• Audible warnings “beep” if any push-buttons are used in the
wrong way.
3.1 PC Use – Online
A monitoring system, where you use the PC environment to set-up
the monitor prior to measuring, display measurement data on the PC
screen while monitoring and store the measurement results directly
on the PC’s hard disc. The LumaSoft Gas Single Point 7810
application software is used for making online measurements. The
measurement results can be used by other programs that fetch data
from the SQL Server Express database server featured by the 7810
application. A manual BE6027 for the 7810 application is available
for reference.
Using the online mode (7810 Application Software) provides you with
a variety of Software Alarm options. Not only are the alarm trigger
levels definable, but the action resulting from an alarm being
triggered can also be defined here. This enables you to connect
external warning systems to the monitoring system.
The philosophy behind the 7810 Application Software is common to
almost all Windows programs. Access to the various levels of the
program is gained by use of the MENU BAR, PULL-DOWN MENUS,
NEW WINDOW options and INDEX-CARD separators. These familiar
procedures, together with the simple software structure, make the
instructions in the On-line sections of this manual understandable
and easy to implement.
_____________________________________________________________________________
BE6028-14 3434i SF6 Leak Detector LumaSense Technologies A/S
Page 27 of 191
Page 28
Chapter 3
CURRENT TIME IS 2011-06-13 17:12
SELECT SET-UP BRANCH
SELECT SET-UP BRANCH
______________________________________________________________________
3.2 Stand-alone Use
This method of operation is available to those of you who wish to use
the monitor without connection it to a PC. The monitor is set-up and
the results are displayed via the monitor’s front panel.
The structure of the monitor set-up can be viewed like an inverted
tree. The main branches divide and separate into minor branches.
These in turn divide again and again.
To move through the tree, the branches are selected using the
“select” push-buttons (see section 1.5). Use the Set-up Tree,
supplied with the monitor and the example steps below to see how
the instructions progress. Starting from the initial screen display.
MONITOR IS READY FOR USE
1. Press SET-UP, and the text changes to that displayed below.
MEASUREMENT FORMAT CONFIGURATION
2. To select the MEASUREMENT branch, press S1. (Pressing either
of the other “select” push-buttons will take you along another
branch of the set-up tree. The following text is displayed.
MONITORING TASK ENVIRONMENT
To select the ENVIRONMENT branch, press S3. The text is
displayed.
_____________________________________________________________________________
BE6028-14 3434i SF6 Leak Detector LumaSense Technologies A/S
Page 28 of 191
Page 29
Chapter 3
SELECT FLUSHING MODE
LENGTH OF SAMPLING TUBE 00.00 m
______________________________________________________________________
AUTO FIXED TIME
3. To select the AUTO flushing mode, press S1. The following text is
displayed.
PRESS ENTER TO CHANGE VALUE
This branch does not divide again. At this stage you are able to
define the parameters in this branch of the tree using the direction
push-buttons.
If the branch had divided again, it is a simply process of using the
correct “select” push-button to continue down the desired branch.
Parameters that are already selected are displayed either with a
cursor under the current selection or the value is displayed on the
top line.
When the correct value or parameter is already selected, you can
continue on through the tree using the ▼direction push-button.
To exit SET-UP mode press SET-UP
Defining parameters is covered in section 6.1.
The procedures in the example above are common to all the
situations where the “select” push-buttons can be used to access the
different levels in the monitor.
_____________________________________________________________________________
BE6028-14 3434i SF6 Leak Detector LumaSense Technologies A/S
Page 29 of 191
Page 30

Chapter 4
______________________________________________________________________
Chapter 4
Introduction to and Familiarization
with the Monitor
July 2014
_____________________________________________________________________________
BE6028-14 3434i SF6 Leak Detector LumaSense Technologies A/S
Page 30 of 191
Page 31

Chapter 4
______________________________________________________________________
The Monitor is an extremely versatile measuring instrument, which
can be used to perform almost any kind of monitoring task. Its
versatility may appear overwhelming at first, but to avoid such a
reaction, we suggest that you read this chapter thoroughly, and
follow the practical exercises, which are included. These exercises
give you a “guided tour” through a number of different practical
procedures – monitoring task; performance of a monitoring task;
scrolling through data after completion of a monitoring task. By
following these different procedures the Monitor operating philosophy
will become apparent and you will be able to quickly familiarise
yourself with its operation and control.
4.1 Special Terminology
Certain terms are used to describe the operation of the Monitor and
it is necessary to fully understand what these terms mean before you
start any practical exercise with the Monitor.
4.1.1 Measurement Cycle
A description of a measurement cycle is given on page 2 of the
Product Data Sheet (see boxed-in text and schematic diagram of the
measurement system of the Monitor). “Measurement Cycle” is the
term used to describe everything that takes place in the Monitor from
the time the pump starts to flush out the “old” gas sample in its
analysis cell, until the signal in the measurement chamber has been
measured using the last relevant optical filter.
The time taken to complete a measurement cycle is dependent upon
the following factors:
The sample integration time selected – longer measurement times
provide greater accuracy.
The flushing times selected for the measurement chamber and the
tube as well as the length of the sampling tube attached to the
Monitor’s air-inlet – the longer the tube, the more time is needed to
flush it out between measurement cycles.
The cleanliness of air-filters which filter the air drawn into the cell
(this affects the pumping time required to draw a fresh air sample
into the analysis cell).
The degree of fluctuation in the concentration of the gas measured in
consecutive measurement cycles (this affects the time required to
adjust the gain of the amplifier attached to the microphones).
Table 4.1 gives some indication to the measurement times depending
on the number of gases measured and the measurement times
selected. However, these times may vary from one measurement
_____________________________________________________________________________
BE6028-14 3434i SF6 Leak Detector LumaSense Technologies A/S
Page 31 of 191
Page 32

Chapter 4
Monitor Setup
Volume of Air
Response Times
S.I.T.: “Normal” (5s)
One gas: ~27s
S.I.T.: “Fast” (1s)
“OFF”
One gas: ~13s
~22s
______________________________________________________________________
cycle to another due to the cleanliness of the filters and the degree
of fluctuation in the concentration of the various gases.
Table 4.1 Approx imate measurement times
SIT : “Low Noise”
(20s)
Flushing:
Auto, (tube 1m)
Flushing:
Chamber 4s, Tube
4.1.2 Monitoring Task
A monitoring task consists of a series of similar measurement cycles.
These cycles can either be repeated at regular intervals or be
continuous:
4.1.3 Sampling Interval
The sampling interval is a measure of the time between the start of
one measurement cycle and the start of the following measurement
cycle.
When the Monitor is not sampling continuously the sampling interval
has to be defined by the user and is a fixed period of time (see
Fig.4.1).
140 cm3/sample
20cm3/sample
One gas +water
~40s
One gas +water
~70s
One gas + water
_____________________________________________________________________________
BE6028-14 3434i SF6 Leak Detector LumaSense Technologies A/S
Page 32 of 191
Page 33

Chapter 4
______________________________________________________________________
Fig.4.1 An illustration of the fixed sampling intervals of the monitor
when it is not sampling continuously.
4.1.4 Continuous Sampling
The Monitor is said to be sampling continuously when each
measurement cycle is followed immediately by another similar
measurement cycle (see Fig.4.2).
Fig.4.2 An illustration of continuous sampling
4.1.5 Monitoring Period
The monitoring period is the time between the start of the first
measurement cycle in a monitoring task and the finish of the final
measurement cycle in a monitoring task.
The monitoring period can either be pre-set by the user – in which
case the Monitor automatically stops monitoring after the monitoring
period is over – or, not pre-set – in which case the Monitor will
continue to monitor until the user stops the monitoring task manually
(see section 4.3.8).
_____________________________________________________________________________
BE6028-14 3434i SF6 Leak Detector LumaSense Technologies A/S
Page 33 of 191
Page 34

Chapter 4
______________________________________________________________________
The maximum time you can set a pre-set monitoring period to be is
7 days. If you try to enter a greater number of days, the Monitor will
automatically change the period to 7 days. However, if you do not
set a pre-defined monitoring period, the Monitor will just store as
much data as possible before starting to overwrite the “oldest” stored
measurement results.
4.2 Attaching the Sampling Tube and External Filter
1 Cut a short section of sampling tube of Poly-Tetra-Fluoro-
Ethylene (Teflon) tubing, (optional accessory).
2 Using Fig.4.3 and the instructions below, attach one end of this
tube to the air-inlet stub on the back-panel of the Monitor.
Push one end of the Teflon tubing through the non-threaded end
of the nut.
Hold the end of the tubing between the fingers and gently push
the tubing over the end of the Monitor’s air-inlet stub as far as it
will go.
Note: if the tubing is bent/broken during this procedure, remove
the tubing from the stub and repeat this step using an
undamaged length of tubing.
Screw the threaded-nut firmly onto the end of the air-inlet stub.
Fig.4.3 Attaching tubing to the air-inlet stub and the external filter
_____________________________________________________________________________
BE6028-14 3434i SF6 Leak Detector LumaSense Technologies A/S
Page 34 of 191
Page 35

Chapter 4
______________________________________________________________________
3. Attach the other end of the sampling tube to the external air-filter
which is provided as an optional accessory.
4.3 Familiarization with the Monitor using the Front Panel
4.3.1 Setting the Internal Clock
Before dispatch from the factory, the internal clock of the Monitor is
set to the correct local (Danish) time. If the monitor is to be used as
a stand-alone instrument, then the clock can be adjusted to your
local time using the following instructions.
1. Switch on the AC Mains power switch on the back-panel of the
Monitor.
2. Press SET-UP.
Refer to the Set-Up Tree, supplied with the Monitor, so that you can
follow your movement through the various branches of this “tree” in
the following sequence of button presses.
3. Press S3 S1 S1 S1.
_____________________________________________________________________________
BE6028-14 3434i SF6 Leak Detector LumaSense Technologies A/S
Page 35 of 191
Page 36

Chapter 4
↵
↵
↵
↵
CURRENT DATE 2014-04-19
CURRENT TIME 12:00
______________________________________________________________________
The following screen picture appears:
PRESS ENTER TO CHANGE VALUE
Dates are entered as the Year-Month-Day, for example the 19th April,
2014 has to be entered as 2014-04-19.
4. To change the date, press
5. Use the direction keys to enter the correct date.
Note: press S1 to revert back to the original date.
6. Press
This causes the text on the display screen to change to the
following:
to accept date.
PRESS ENTER TO CHANGE VALUE
.
7. To change the time, press
.
8. Use the direction keys to enter the correct time. If you make a
mistake in entering the correct date just press S1 and start again.
The current time is entered as the time read on a 24-hour digital
clock. For example, 13:45 is 15 minutes to 2 o’clock in the afternoon.
9. Press
When this step is completed, the display then moves to the previous
head of the Set-Up Tree.
10. Press ▲ three times and follow the path you take en route
through the Set-Up Tree.
The screen display shows the following text:
_____________________________________________________________________________
BE6028-14 3434i SF6 Leak Detector LumaSense Technologies A/S
Page 36 of 191
to accept time.
Page 37

Chapter 4
SELECT SET-UP BRANCH
SELECT CONCENTRATION UNIT
______________________________________________________________________
MEASUREMENT FORMAT CONFIGURATION
11. Press SET-UP to exit.
4.3.2 Setting Units
All data in the Monitor is stored as raw data. The different units,
which you can select here, enable you to enter gas concentrations
and to display temperatures, lengths and pressures in units, which
you are comfortable with. These units are also used to present
measurement data in a form that is most convenient for you.
The Monitor can display gas concentrations either in absolute units of
mg/m3 unit that is dependent on a particular temperature, termed
the normalization temperature, or in units of parts per million (by
volume) – which is independent of the temperature of the gas. You
can inform the monitor about the units you intend to use – for
example: the length of the sampling tube attached to the Monitor’s
inlet (in meters or feet) atmospheric pressure (kPa or mBar or
mmHg) and unit for humidity (ppm or Tdew or kPa or mg/m3).
The measurement units can be changed using the push-buttons on
the front of the monitor:
1. Press SET-UP.
2. Press S3 and then S2.
The following text appears on the screen display:
mg/m3 ppm
The cursor appears under the unit which is presently in the active
set-up.
3. Press S1 to select mg/m
3
.
_____________________________________________________________________________
BE6028-14 3434i SF6 Leak Detector LumaSense Technologies A/S
Page 37 of 191
Page 38

Chapter 4
↵
↵
SELECT HUMIDITY UNIT mg/m3
SELECT FLUSHING MODE
______________________________________________________________________
4. Select metres as the unit of length, °C as the temperature unit,
and kPa as the pressure unit by using a procedure similar to that
described in the previous steps.
After the pressure unit has been selected the following text appears
on the display:
PRESS ENTER TO CHANGE VALUE
There are more than three humidity units to choose from therefore
the means by which a unit is selected differs:
5. Press
.
6. Use ▲ & ▼ to scroll through the options.
7. When Tdew is displayed, press
.
The display automatically returns to the head of the
CONFIGURATION setup branch.
8. Press SET-UP to exit.
4.3.3 Setting the Environment Parameters
Environmental parameters describe the factors which influence the
measurement situation – the length of the sampling tube attached to
the Monitor and the normalization temperature. These parameters
are discussed more fully later on in this section.
1. Press SET-UP, S1 and then S3.
This brings you into the Environment branch of the Set-Up Tree
where the following text is displayed:
AUTO FIXED TIME
_____________________________________________________________________________
BE6028-14 3434i SF6 Leak Detector LumaSense Technologies A/S
Page 38 of 191
Page 39

Chapter 4
↵
↵
↵
LENGTH OF SAMPLING TUBE 0.00 m
NORMALIZATION TEMPERATURE 20.0 º C
______________________________________________________________________
The Auto option regulates the flushing time depending on the
sampling tube length and the cleanliness of the air-filter (as the filter
become dirtier, the flushing time will increase). The Fixed Time
option is divided in to two parts; chamber flushing time and sample
tube flushing time. Once defined, these times are constant regardless
of the sampling tube length and cleanliness of the filters.
Auto Option
a. Press S1, and the following display appears.
PRESS ENTER TO CHANGE VALUE
b. Press
.
c. Use the direction keys to define the tube length: ▲ and ▼ to
increase and decrease the numbers, respectively; t and u to
move the cursor across the fields.
Change the length of the sampling tube shown on the screen to
the length of the tube you attached to the Monitor in section 4.2.
Note: the range of acceptable values for the sampling tube
ranges from 00.00m to 99.00m.
d. Press
to select displayed length.
The following display appears:
PRESS ENTER TO CHANGE VALUE
The Monitor measures gas concentrations in the absolute unit of
mg/m3 – a unit which is dependent on temperature. Alternatively,
the Monitor can calculate gas concentrations in parts per million
(ppm) by volume – this unit is independent of the temperature of
the gas. If mg/m3 is chosen as the gas concentration unit it is
therefore necessary to define the temperature at which you wish the
Monitor to calculate gas concentrations. This pre-defined
temperature is termed the NORMALIZATION TEMPERATURE.
e. Press
_____________________________________________________________________________
BE6028-14 3434i SF6 Leak Detector LumaSense Technologies A/S
Page 39 of 191
to change value.
Page 40

Chapter 4
↵
↵
↵
SELECT MEASUREMENT SET-UP BRANCH
CHAMBER FLUSHING TIME 8 s
TUBE FLUSHING ?
______________________________________________________________________
f. Use the direction keys to define the normalization temperature: ▲
and ▼ to increase and decrease the numbers, respectively; t and
u to move the cursor across the fields.
g. Press
to select displayed temperature.
The display screen then jumps to the “head” of the MEASUREMENT
branch of the Set-Up Tree and the following text is shown:
MONITORING TASK ENVIRONMENT
Fixed Time Option
a. Press S3, and the screen displays the following text.
PRESS ENTER TO CHANGE VALUE
b. Press
.
c. Use the direction keys to define the chamber flushing time.
Note: the range of acceptable values for chamber flushing ranges
from 2s to 60s, increasing in 1s intervals.
d. Press
to select displayed flushing time, and the following text is
displayed.
NO YES
e. Press S3 to enable sample tube flushing. The screen displays the
following text.
_____________________________________________________________________________
BE6028-14 3434i SF6 Leak Detector LumaSense Technologies A/S
Page 40 of 191
Page 41

Chapter 4
↵
↵
TUBE FLUSHING TIME 3 s
NORMALIZATION TEMPERATURE 20.0°C
______________________________________________________________________
PRESS ENTER TO CHANGE VALUE
f. Press
.
g. Use the direction keys to define the tube flushing time.
Note: the range of acceptable values for tube flushing ranges
from 3s to 120s, increasing in 1s steps.
h. Press
to select displayed flushing time.
The following text is displayed.
PRESS ENTER TO CHANGE VALUE
i. Press SET-UP
4.3.4 Setting up a Monitoring Task
The optical filter in the monitor has to be calibrated before it can be
used to measure gas concentrations. The user can only set-up a
monitoring task using the optical filters which has been installed. In
the 3434i gas A (that is, to measure gas A’s concentration using the
UA0988 optical filter installed in position “A” of the filter carousel)
and water vapour.
The parameters which describe the monitoring task we shall set-up,
are listed below:
_____________________________________________________________________________
BE6028-14 3434i SF6 Leak Detector LumaSense Technologies A/S
Page 41 of 191
Page 42

Chapter 4
Stand-alone Settings
section 12.3.3
↵
↵
MONITORING TASK SET-UP NUMBER 1
______________________________________________________________________
Monitoring Task Set-up Number = 1
Sampling = Continuous
Monitor for pre-set period = No
Compensate for Water Vapour
Interference = Yes
Compensate for cross-interference =
No
Measure Gas A: XXXXXX = Yes
Measure Water Vapour = Yes
Note: flushing is set in Environmental
Parameters, section 4.3.3
S.I.T’s are set up in the Filters setup,
, and the
1. Press SET-UP, S1 and then S1.
This brings you into the Monitoring Task branch of the Set-Up Tree
where the following text is displayed:
Up to 10 different monitoring tasks can be set-up while operating the
Monitor in Set-up mode. The parameters describing these tasks are
automatically stored in the memory of the Monitor.
2. If the number on the display is already “1” then press q to
“accept” the value.
If the number is not “1”:
PRESS ENTER TO CHANGE VALUE
_____________________________________________________________________________
BE6028-14 3434i SF6 Leak Detector LumaSense Technologies A/S
Page 42 of 191
a. Press
and use the direction keys to change its value to “1”.
b. Press
to accept the value.
The text which appears on the display during the next step is really
self-explanatory and it is therefore possible for you to follow why the
Page 43

Chapter 4
STORE MEASUREMENT HISTORY
______________________________________________________________________
button-pushes listed in the next step will set-up the monitoring task
which is described at the beginning of section 4.3.4.
3. Press S3 S1 S3 S1 S3, then press S1 until the text
MEASURE WATER VAPOUR appears on the display.
4. Press the S3 button to answer “YES” to measure water vapour.
4.3.5 Store Measurement History.
The following screen is displayed.
NO YES
a. If you select to answer No, then only the last measured
values are stored in the display memory.
b. If you select to answer Yes all measured values are
stored in display memory.
5. Press the S3 button to answer “YES” to store the measurement
history.
Once this step is complete, monitoring task number 1 has been setup and the display moves to the previous head of the Set-Up Tree.
6. Press SET-UP to exit the Set-Up mode.
4.3.6 Starting a Monitoring Task
Note: before a monitoring task can be started, the Measurement
Units, Environment Parameters and Monitoring Task Settings must
be defined, see sections 4.3.2, 4.3.3 and 4.3.4.
This section will explain how to perform a monitoring task – for
example, monitoring task number 1 which was set-up in section
4.3.4.
1. Press MEASURE.
The following text appears on the screen:
_____________________________________________________________________________
BE6028-14 3434i SF6 Leak Detector LumaSense Technologies A/S
Page 43 of 191
Page 44

Chapter 4
↵
ACTIVE TASK: MONITORING TASK NUMBER 1
SELECT TASK
MONITORING TASK SET-UP NUMBER 1
______________________________________________________________________
START TASK DELAYED TASK CHANGE TASK
Please note: if you do not use one of the “select” keys within a
short time after the above text appears, the Monitor will
automatically stop operating in Measure mode (the light-emitting
diode in the MEASURE key switches off).
If this happens just press MEASURE again.
The active monitoring task number is the number of the monitoring
task you wish the Monitor to perform.
2. If the number on the display is number 1 then go to step 5.
If the number on the display is not number 1 then press S3 to
change the task number to number 1.
This changes the display text to the following:
MONITORING TASK CALIBRATION TASK
3. Press S1.
This causes the following text to appear on the display:
PRESS ENTER TO CHANGE VALUE
The number appearing on the screen will be a number from 1 to 10.
4. Press
and use the direction keys to change the monitoring task
number to 1.
Then press ↵ again to accept the task number.
The following text appears on the display screen:
_____________________________________________________________________________
BE6028-14 3434i SF6 Leak Detector LumaSense Technologies A/S
Page 44 of 191
Page 45

Chapter 4
MEASUREMENT IN PROGRESS
RESULTS NOT YET AVAILABLE
ACTIVE TASK: MONITORING TASK NUMBER 1
WARNING: DISPLAY MEMORY WILL BE DELETED
A: 14.5 E+00 B:________ C: ________
______________________________________________________________________
START TASK DELAYED TASK CHANGE TASK
5. Press S1 to start the monitoring task.
The following warning then appears on the display:
PROCEED STOP
Display Memory is where the Monitor stores the results of all
measurements while it is performing a monitoring task. If the
monitoring task is stopped and then started again all the data
already collected will be deleted from Display Memory. However, the
data in Display Memory can be copied into and stored in the
Monitor’s Bac kground Memory. This operation is described in section
9.2.
6. Press S1.
The following text then appears on the screen:
7. When the first measurement cycle is complete the Monitor will
automatically display the results and update them every time a
new measurement cycle is completed. An example is shown
below:
D:________ E:________ W: 8.25 E+00
_____________________________________________________________________________
BE6028-14 3434i SF6 Leak Detector LumaSense Technologies A/S
Page 45 of 191
Page 46

Chapter 4
DATA IN DISPLAY MEMORY RECORDED
2014-01-16 09:50 TO 2014-01-16 10:04
FILTER A USED TO MEASURE
(the name of the gas will appear here)
GAS A: MAX 14.5E+00 µ 8.03+00
______________________________________________________________________
This display gives the overview of the gas/vapour concentrations last
measured – in this case the concentration of gas A and humidity of
the water vapour are in the units that were selected – that is mg/m3
for gas A and Tdew for water vapour (see section 4.3.2).
4.3.7 Displaying Measurement Results while a Monitoring Task is in Progress
If store measurement history is selected in the MEASUREMENT setup branch (see section 4.3.5) all measurement data collected during
a monitoring task is stored in Display Memory together with the
parameters which describe the task (see section 4.3.4).
Using the direction keys, you can scroll through this data.
1. After the monitoring task has been running for 10-15 minutes,
press q.
An example of the text which appears on the screen is shown below:
FROM
This screen text allows you to find out how long the monitoring task
has been running here from 9:50 to 10:04 on the same day. The
date on the right-hand side of the display indicates the time at which
the last measurement cycle was completed while a monitoring task is
in progress this date is, of course, constantly updated.
2. Press q and then use t & u until the following text appears on
the display:
The displays which follow indicate the type of text which appears
each time q is pressed:
ALARM 1_____ MIN 7.42E+00 s 2.36E+00
While a monitoring task is being performed a running statistical
analysis of the monitored gases/vapours is made and the results are
displayed as shown above, where:
_____________________________________________________________________________
BE6028-14 3434i SF6 Leak Detector LumaSense Technologies A/S
Page 46 of 191
Page 47

Chapter 4
µ
σ
A
2014-01-16 09:50:32 ___________ 7.42 mg/m3
A
2014-01-16 09:51:33 ___________ 7.42 mg/m3
SAMPLING IS CONTINUOUS
MONITORING PERIOD IS NOT PRE-SET
______________________________________________________________________
MAX = maximum concentration of gas A measured during the
period of time the monitoring task has been performed.
MIN = minimum concentration of gas A measured during the
period of time the monitoring task has been performed.
ALARM 1= the user-defined concentration of gas A which, if
measured by the Monitor, will trigger a switch in the
Monitor and activate an external alarm relay connected to
it.
= linear average, or mean value, of all the gas A
concentrations measured during the period of time the
monitoring task has been performed
= standard deviation of gas A’s concentrations from the
mean value (m) described above (see section 8.1 for
further details).
All numbers are written in the exponential form, for example:
14.5E+00 = 14.5 x 10+0 = 14.5
The concentration unit in this case is mg/m3 as this was chosen in
the active set-up (see section 4.3.2).
3. Press q.
: Sulphur Hexafluoride 972.06 mBar
: Sulphur Hexafluoride 972.06 mBar
As you can see, the display provides the date and time at which the
measurement was made, and the concentration of gas A is given in
the units mg/m3 because this was the unit chosen for gas
concentration in the active set-up. The dashed lines, which appear
after the time will be replaced by a number as soon as the
monitoring task has been stopped (see section 4.3.8).
After scrolling through the list of individual measurement results for
gas A, the following text is displayed:
_____________________________________________________________________________
BE6028-14 3434i SF6 Leak Detector LumaSense Technologies A/S
Page 47 of 191
Page 48

Chapter 4
COMPENSATION FOR WATER VAP. INTERFERENCE
MONITORING TASK STARTED 2011-01-16 09:50
MEASUREMENT CHAMBER TEMPERATURE 29.6°C
SAMPLE INTEGRATION TIME W: 5s
A: 5s B:___s C:___s D:___s E:___s
A:Sulphur hexaflouride B:________ C:___________
D: ___________ E:__________ W: WATER VAP
A: 7.42E+00 B: ________ C:___________
DATA IN DISPLAY MEMORY RECORDED FROM
2014-01-16 09:50 TO 2011-01-16 10:04
WATER VAPOUR MEASURED
MONITORING PERIOD IS NOT PRE-SET
______________________________________________________________________
D: ____________ E: ________ W: 8.13+00
The last display above shows the up-dated overview of the gas
concentrations measured during the most recent measurement cycle.
This display does not appear, after the monitoring task has been
stopped.
Data collected during a monitoring task is stored in the Display
Memory of the Monitor and therefore, before a new monitoring task
is started, all data stored in this memory is deleted. D isplay Memory
has finite size, and therefore there is a limit to how much data can
be stored in it. Once this memory has been filled-up all subsequent
data collected during the task will start to overwrite the data already
collected during the start of the monitoring task. Only in this event
will the date displayed after the text MONITORING TASK STARTED
on the above screen be different from the earliest date on the
display (shown below) which give the most up-to-date overview of
the monitoring task:
4. Press u.
This causes the following text to appear on the screen:
Use q to scroll through the following screen displays:
_____________________________________________________________________________
BE6028-14 3434i SF6 Leak Detector LumaSense Technologies A/S
Page 48 of 191
Page 49

Chapter 4
WATER: MAX 8.55E+00 µ 8.15+00
MIN 7.01E+00 σ 816E-03
W: WATER VAPOUR: 971.88mBar
2014-01-16 09:50:32 _________ 7.39Tdew
W: WATER VAPOUR: 971.88mBar
2014-01-16 09:51:33 ________ 7.49Tdew
A:
972.06 mBar
2014-01-16 09:51:33 ___________ 7.43 mg/m3
A: 7.42E+00 B:__________ C:___________
D: _________ E:__________ W: 8.13+00
STOP MONITORING TASK ?
______________________________________________________________________
5. Press u.
This causes the display to jump over to the list of measurement
results for gas A. The following text appears:
Sulphur hexafluoride
By using p and q you can now scroll through the list of
measurement results for gas A.
If you do not wish to view the results anymore, press ↵, this acts as
a “go to head” function. The following text appears:
4.3.8 Stopping a Monitoring Task
1. Let the Monitor, monitor for a total period of about 30 minutes
and then press MEASURE.
The following text will appear on the screen:
NO YES
If you pressed MEASURE accidentally, this screen enables you to
cancel the request to stop the monitoring task in progress – by
pressing S1.
2. Press S3 to stop the task.
_____________________________________________________________________________
BE6028-14 3434i SF6 Leak Detector LumaSense Technologies A/S
Page 49 of 191
Page 50

Chapter 4
DATA IN DISPLAY MEMORY RECORDED FROM
2014-01-16 09:50 TO 2014-01-16 10:04
______________________________________________________________________
The text, which appears briefly on the screen, indicates that the
Monitor is aborting the monitoring task and a summary of the
monitoring task will appear on the display as soon as the Monitor has
aborted the task. For example:
4.3.9 Scrolling through Measurement Results after Completion of a Monitoring Task
All measurement data collected during a monitoring task, is stored in
Display Memory together with the parameters which describe the
task (a description of the task is given in section 4.3.4).
Using the direction push-buttons, you can scroll through the set-up
parameters as well as the individual gas concentration
measurements results as explained in section 4.3.7. The organisation
of data collected during a monitoring task is illustrated in Fig. 4.4.
This illustration also shows the function of the various direction keys.
For example, u enables you to move from the measurement results
of one gas to the measurement results of another.
_____________________________________________________________________________
BE6028-14 3434i SF6 Leak Detector LumaSense Technologies A/S
Page 50 of 191
Page 51

Chapter 4
______________________________________________________________________
Fig.4.4 Organisation of the data displayed on the Monitors screen
after completion of a monitoring task :
_____________________________________________________________________________
BE6028-14 3434i SF6 Leak Detector LumaSense Technologies A/S
Page 51 of 191
Page 52

Chapter 4
WATER VAPOUR MEASURED
WATER: MAX 8.55E+00 µ 8.15+00
ALARM 1 MIN 7.01E+00 σ 816E-03
µ
σ
W: WATER VAPOUR: 971.88mBar
2014-01-16 09:50:32 1 7.49Tdew
W: WATER VAPOUR: 971.88mBar
2014-01-16 09:51:33 2 7.49Tdew
______________________________________________________________________
1. Press q and u.
The following text appears on the display:
The displays which follow indicate the type of text which appears
each time q is pressed:
This is the statistical report of the monitored gases/vapours
displayed when the monitoring task is complete. In this case where:
MAX = maximum concentration of water vapour measured
during the whole monitoring task.
MIN = minimum concentration of water measured during the
whole monitoring task.
ALARM 1 = the user-defined concentration of water vapour
which, if measured by the Monitor, will trigger a switch
in the Monitor and activate an external alarm relay
connected to it.
= linear average, or mean value, of all the water vapour
concentrations measured during the whole monitoring
task.
= standard deviation of water-vapour’s concentrations
from the mean value (m) described above (see section
8.2.1 for further details).
The humidity unit in this case is Tdew because this is the unit chosen
in the active set-up (see section 4.3.2).
As you can see the measurement cycles are numbered sequentially
as soon as the monitoring task has been stopped for example, the
above measurement was made at 09:51:33 on the 16th of January
and it was the second measurement cycle of the monitoring task.
The concentration of water vapour is given in the units of Tdew
because this was the unit chosen for humidity in the active set-up.
_____________________________________________________________________________
BE6028-14 3434i SF6 Leak Detector LumaSense Technologies A/S
Page 52 of 191
Page 53

Chapter 4
SAMPLING IS CONTINUOUS
MONITORING PERIOD IS NOT PRE-SET
COMPENSATION FOR WATER VAP.
MONITORING TASK STARTED 2014-01-16 09:50
MEASUREMENT CHAMBER TEMPERATURE 39.6°C
SAMPLE INTEGRATION TIME W: 5s
A: 5s B:___s C:___s D:___s E:___s
A: Sulphur hexafluoride B:_________ C:___________
D: _________ E:__________ W: WATER VAP
DATA IN DISPLAY MEMORY RECORDED FROM
2014-01-16 09:50 TO 2014-01-16 10:04
FILTER A USED TO MEASURE
Sulphur hexafluoride
GAS A: MAX 14.5E+00 µ 8.03+00
ALARM 1________ MIN 7.42E+00 σ 2.36E+00
______________________________________________________________________
After scrolling through the list of individual measurement results for
water vapour the following screen displays appear:
INTERFERENCE
Note that the screen showing the overview of gas concentrations
measured during any particular measurement cycle is no longer
shown when the monitoring task has been stopped.
2. Press u.
This causes the following text to appear on the screen:
3. Press q to scroll through the following data displays:
_____________________________________________________________________________
BE6028-14 3434i SF6 Leak Detector LumaSense Technologies A/S
Page 53 of 191
Page 54

Chapter 4
A:
2014-01-16 09:50:32 ________ 7.42 mg/m3
A:
2014-01-16 09:51:33 _________ 7.43 mg/m3
↵
HUMIDITY UNIT Tdew
______________________________________________________________________
Sulphur hexafluoride 972.06 mBar
Sulphur hexafluoride 972.06 mBar
Press u so you can scroll through the list showing water-vapour’s
results.
If you do not wish to view the results anymore, press ↵, this acts as
a “go to head” function.
4.3.10 Changing Gas-concentration Units after a Monitoring Task
The unit mg/m3 was chosen for gas concentrations in the monitoring
task, which was set up in section 4.3.4. As long as mg/m3 is the
active concentration unit (that is, the unit selected while operating
in Set-Up mode), this is the unit which will be used to express gas
concentrations on the display screens of the PC and the Monitor. It is
also the unit when print-outs of monitoring task data are made from
the Monitor. However, the user can express the measured gas
concentrations in ppm:
1. Press SET-UP S3 S2 S3 and then SET-UP.
2. Use q to scroll through the results of the monitoring task no. 1
displayed on the screen. Notice that the gas concentration units
have been changed to ppm.
In a similar way the humidity unit for water vapour and the pressure
unit can be changed.
4.3.11 Changing the Humidity Unit after a Monitoring Task
1. Press SET-UP S3 S2 and then q to reach the following
display:
PRESS ENTER TO CHANGE VALUE
2. Press ↵ and use the direction keys to display ppm.
3. Press
_____________________________________________________________________________
BE6028-14 3434i SF6 Leak Detector LumaSense Technologies A/S
Page 54 of 191
to accept the unit of ppm.
Page 55

Chapter 4
SELECT PRESSURE UNIT
______________________________________________________________________
4. Press SET-UP.
Use q to scroll through the results of the monitoring task no. 1
displayed on the screen. Notice that the water vapour unit has been
changed to ppm.
4.3.12 Changing the Pressure Unit after a Monitoring Task
1. Press SET-UP S3 S2 and then q to reach the following
display:
kPa mBar mmHg
2. Press S3 to accept the unit of mmHg.
3. Press SET-UP.
Use q to scroll through the results of the monitoring task no. 1
displayed on the screen. Notice that the Pressure unit has been
changed to mmHg.
_____________________________________________________________________________
BE6028-14 3434i SF6 Leak Detector LumaSense Technologies A/S
Page 55 of 191
Page 56

Chapter 5
______________________________________________________________________
Chapter 5
The Monitor
July 2014
_____________________________________________________________________________
BE6028-14 3434i SF6 Leak Detector LumaSense Technologies A/S
Page 56 of 191
Page 57

Chapter 5
Fig.5.1 The front panel of the 3434i.
______________________________________________________________________
5.1 Introduction
This chapter is primarily for those users who want to use the monitor
as a stand-alone instrument. But the start-up and alarm relay
sections are also of interest for the PC user.
5.2 Front Panel
The front panel of the monitor is dominated by a 2 x 40 character
fluorescent display screen, 3 Select push-buttons located beneath it
and 5 direction push-buttons (see Fig. 5.1). The rest of the pushbuttons, situated in a line along the bottom, are function pushbuttons.
Small light-emitting diodes (LEDs) are mounted above some of the
front-panel push-buttons. Their function is to inform you of the
operating state of the monitor. For example, if the LED above the
MEASURE push-button is lit, it indicates that the Monitor is either
busy performing measurements or has been set-up to start
measurements at a pre-defined time.
_____________________________________________________________________________
BE6028-14 3434i SF6 Leak Detector LumaSense Technologies A/S
Page 57 of 191
Page 58

Chapter 5
↵
______________________________________________________________________
5.2.1 Direction Push-buttons
This group of 5 push-buttons is referred to in this manual as the
direction push-buttons.
▲ & ▼ have two uses: to increase & decrease numbers, respectively,
or to go to the Previous & Next Displays, respectively.
The number increase and decrease functions are used whenever
values, which can be changed manually, are displayed on screen,
for example, changing a parameter such as the length of sampling
tube.
The “Previous Display” and “Next Display” functions are used when
you want to view the previous or next screen texts. This can be
useful when setting up the monitor. By using these push-buttons,
you can scroll quickly through a branch of the Set-Up Tree. These
push-buttons can also be useful when viewing measurement data,
for example, if you are looking at gas A’s measurement result no.3
– by pressing ▲, gas A’s measurement result no.2 will be shown
on the screen. By pressing ▼, gas A’s measurement result no.4
will appear on the display screen.
◄ & ► enable you to move across number fields or go to the
Previous & Next gases, respectively.
When you are entering values or names in the monitor, for
example when setting up the monitor, you can use these pushbuttons to move the cursor across the entry fields.
“Previous Gas” & “Next Gas” functions are used primarily when
viewing measurement data. The display screen only displays the
measurement data for one gas at a time. These push-buttons
allow you to look at the measurement data for the gas and water
vapour (see Fig.4.4 and section 4.3.9).
Depending on the situation, this push-button acts as either an
“Enter” or “Go To Top of Measurements” function.
The “Enter” function is used whenever measurement units are
selected or any text, for example filter names or gas names, are
being entered. The Monitor display will typically display a text
similar to PRESS ENTER TO CHANGE VALUE.
The “Go To Top of Measurements” function is used in the following
situations:
_____________________________________________________________________________
BE6028-14 3434i SF6 Leak Detector LumaSense Technologies A/S
Page 58 of 191
Page 59

Chapter 5
↵
↵
SELECT CONCENTRATION UNIT
______________________________________________________________________
• If you are viewing measurement data, when
display will move to the screen showing the text DATA IN
DISPLAY MEMORY RECORDED FROM… which gives the period
of time data was recorded – see Fig.4.4 for details.
• If the Monitor is performing measurements when
the Monitor will display the last measured concentrations of all
the gases.
5.2.2 The Select Push-buttons
Located below the text display screen, these three push-buttons,
allow you to select from the pre-defined options appearing on the
display screen. The following example illustrates the use of the select
push-buttons:
If the text on the screen appeared as follows:
is pressed, the
is pressed,
mg/m3 ppm
a. By pressing S1 the gas concentrations which appear in the
measurement results will be quoted in mg/m3.
b. By pressing S3 the gas concentrations which appear in the
measurement results will be quoted in ppm.
5.2.3 Function Push-buttons
The order of these push-buttons are the same as they are seen on
the front of the monitor.
RESET By pressing this push-button you can choose the type of
reset the Monitor should perform. For further details see
section 5.3.
LOCK This push button enables setting up three different
password protected User Levels. For further details see
section 2.6.
MEASURE In this mode you are able to choose the type of
measurement the Monitor should perform, and decide
when the measurement should start.
_____________________________________________________________________________
BE6028-14 3434i SF6 Leak Detector LumaSense Technologies A/S
Page 59 of 191
Page 60

Chapter 5
______________________________________________________________________
AVERAGE This push-button allows you to average measurement
data. The lamp in this push-button is lit when
measurement data is being averaged. You define the
averaging times using the set-up mode.
EVENT (If an unusual or interesting event occurs during a
measurement period, you can mark the time such an
event took place by pressing this push-button. Each
event marker is given a serial number, which can be used
as a reference. Events are marked on print-outs of
measurement data.
MEMORY In this mode you are able to store measurement data in
the Background me mory of the monitor, as well as recall
or delete data from the Background memory.
INFO This push-button has two functions. It allows you to
perform the following two functions:
• Acknowledge any message, which may appear on the
display screen during operation of the Monitor.
• Obtain more detailed information about the condition
of the Monitor at any particular moment of time, if
such information exists.
PRINT By pressing this push-button, measurement results in the
Display memory of the Monitor can be printed out. The
lamp above this push-button is lit, while measurements
are being printed and the display will show PRINTING
MEASUREMENT DATA until all data has been printed out.
SET-UP In this mode you are able to enter the Set-Up Tree of the
Monitor. In set-up mode, the user is able to program the
Monitor to perform almost any kind of measurement, and
amongst other things; enter data about the optical
filter(s) which are installed in the Monitor; select different
measurement parameters; choose how measurement results should be formatted in print-outs; choose the
interface and communication codes which are necessary
to print data; set the internal clock of the Monitor and
choose the self-tests the Monitor should perform.
When the Talk/Listen LED is lit, this means that there is activity on
one of the interfaces.
_____________________________________________________________________________
BE6028-14 3434i SF6 Leak Detector LumaSense Technologies A/S
Page 60 of 191
Page 61

Chapter 5
______________________________________________________________________
5.3 Starting-up or Restarting the Monitor
5.3.1 Introduction
When the monitor is started up in the normal way, that is, by
switching on the AC Mains power-switch on the back panel, the
monitor responds by performing a partial reset. A partial reset is
also performed if during operation the monitor is switched off and is
re-started in any of the following ways:
• If the Monitor stops operating due to an AC mains power failure
and then re-starts itself (automatically) when power is restored to
it;
• If the user stops operating the Monitor by switching it off using
the AC mains power switch on the back panel, and then re-starts
it by using the same switch:
Users can also “partially reset” the Monitor by using the RESET
push-button on the front panel (see section 5.2.3).
5.3.2 A Partial Reset of the Monitor
When the Monitor performs a partial reset a number of self-tests
are automatically performed. The types of tests performed depend
only upon the time, which has elapsed since the Monitor was last
switched on.
• If more than 10 mins. have elapsed since the Monitor was
switched on it will perform the software, data-integrity, and
hardware tests when switched on again.
• If less than 10 mins. have elapsed since the Monitor was switched
on it will perform only the data-integrity tests when switched on
again.
There are essentially 3 types of self-tests which can be performed
during a “partial reset” – a software test, a data-integrity test and
a hardware test.
It takes the Monitor only a few seconds to perform the data-
integrity tests; and about 3 minutes to perform both the software
and hardware test. The different tests are explained below.
Software test
This test checks the information in the Monitor’s software (ROM –
Read Only Memory.)
Data-integrity test
This test checks the integrity of the data stored in the Monitor’s
Source Memory (i.e. its EEPROM – Electrically Erasable
_____________________________________________________________________________
BE6028-14 3434i SF6 Leak Detector LumaSense Technologies A/S
Page 61 of 191
Page 62

Chapter 5
OPERATING ERROR:
______________________________________________________________________
Programmable Read Only Memory) and the integrity of the data
stored in the Monitor’s Working Memory (RAM).
Hardware test
This test checks that the electrical, mechanical and electronic
parts of the Monitor are functioning properly.
The following parts of the Monitor are checked: the pump; the
valves in the pneumatic system; the infra-red light source; the
power supply; the filter carousel; the motor which drives the
chopper wheel; the external vibration level (to make sure that it
does not contribute to the signal measured in the analysis cell);
the analogue circuitry and the microphones (to check that they
are functioning properly).
If you do not wish the Monitor to perform the hardware test
during a partial reset, you can disable it (see section 5.4.3). This
also disables the regular self-tests.
If any part of the Monitor is found to be functioning incorrectly a
message will appear in the display to inform the user of the problem.
For example:
PUMP TEST FAILED
The user must acknowledge receipt of such a message by pressing
INFO. Operating errors and warning messages are listed in tableform in Chapter 14 at the end of this manual.
If a fault is found in any of the blocks of data stored in the Working
Memory, the Monitor will automatically set the parameters in the
relevant compartment(s) to their default values, and the Monitor will
send the following message on its display screen:
WARNING: MEMORY SET TO DEFAULT
ERROR DETECTED IN XXXXX MEMORY
Where XXXXX denotes the part of the memory that has been
affected. When such a message is received users must check the
contents of the relevant memory to find out which data has been
affected before continuing to operate the Monitor.
_____________________________________________________________________________
BE6028-14 3434i SF6 Leak Detector LumaSense Technologies A/S
Page 62 of 191
Page 63

Chapter 5
Monitor last
used while in…
Task being
performed
Task started after a
PARTIAL RESET
Measurement
mode
A gas measurement
Completes the monitoring task
Looking at measurement
screen
Measurement results are
beginning again
Set-up mode
Changing set-up
Monitor
Measurement results are
Memory mode
Handling measurement
Background Memory
Completes any interrupted task
the beginning
“Interface”
Obtaining hard-copies
data)
Print-out is stopped and
beginning
SELECT RESET TYPE
______________________________________________________________________
5.3.3 Response of the Monitor after a Partial Reset
The way in which the Monitor responds after a partial reset is
dependent upon the way it was being operated at the time of the
partial reset (see Table 5.1). For example, if the Monitor was busy
taking a measurement when it was “partially reset” it will complete
the interrupted measurement after the partial reset, continue its
monitoring task and make a special “mark” alongside the first
complete measurement cycle it performs after the reset. These
“marks” are described in section 8.2.2 and section 8.2.3.
Table 5.1 Dependence of Monitor’s response, after a partial reset, to
its operating condition at the time of the partial reset.
“Display”
results on the display
parameters which control
the operation of the
results which are stored
in Display Memory and
(that is, print-outs of, for
example, measurement
shown on the display from the
shown in the display from the
beginning
and then measurement results
are shown in the display from
measurement results are
shown in the display from the
5.3.4 Full reset and/or Partial Reset of the Monitor via its Front Panel
There are two well-defined levels of reset. By pressing RESET the
following text appears on the display screen:
PARTIEL FULL NONE
_____________________________________________________________________________
BE6028-14 3434i SF6 Leak Detector LumaSense Technologies A/S
Page 63 of 191
Page 64

Chapter 5
PERFORM FULL RESET ?
______________________________________________________________________
If S3 is pressed, you can come out of reset mode without performing
any kind of reset. The Monitor just goes back to operating the same
way it was operating before the RESET push-button was pressed.
S1 PARTIAL Reset: If this level of reset is chosen the Monitor
stops operating, performs a partial reset as described in the
previous section (section 5.3.2) and then resumes operating in
the fashion described in Table 5.1.
S2 FULL Reset: If this level of reset is chosen the Monitor responds
by changing the text on the display so that you have a chance to
confirm that you wish the Monitor to perform a FULL reset:
NO YES
S1 By pressing this push-button the user can come out of reset
mode without performing any kind of reset. The Monitor just
goes back to operating the same way it was operating before
RESET was pressed.
S3 By pressing this push-button the user confirms that a FULL
reset is required. During a FULL reset the Monitor performs the
following two tasks:
• “Clearing” (emptying) all data from its Working Memory.
This means all data in Display Memory and Background
Memory will be lost.
• Copying data from its Source Memory into its Working
Memory. This means that set-up parameters in block 3 of
Working Memory “Other Set-up Parameters” will be given
their default values, and the values of the optical filter set-
up parameters in Working Memory will be the same as
those found in Source Memory.
5.4 Configuring the Monitor
5.4.1 Setting the Clock
Before dispatch from the factory, the internal clock of the Monitor is
set to the correct local (Danish) time.
_____________________________________________________________________________
BE6028-14 3434i SF6 Leak Detector LumaSense Technologies A/S
Page 64 of 191
Page 65

Chapter 5
Display Text
Acceptable Values
Default
Value
ENTER CURRENT DATE 0000-01-01
0000-01-01 to 9999-12-31
2013-01-01
ENTER CURRENT TIME 12:47
00:00 to 23:59
12:00
↵
↵
______________________________________________________________________
The current date is entered as Year-Month-Day for example the
24th of July 2014 is entered as 2014-07-24.
The current time is entered as the time on the 24-hour clock for
example 14:05 is five minutes after two in the afternoon. Table
5.2 details the range of acceptable values and the default value of
the date and time.
Table 5.2 The range of acceptable values and the def ault value of
the date and time
If the Monitor is to be used as a stand-alone instrument, then the
clock can be adjusted to your local time using the following
instructions.
1. Press SET-UP.
Refer to the Set-Up Tree diagram, so that you can follow your
progress through the various branches of this set-up.
2. Press S3 S1 S1 S1.
The following screen picture appears:
CURRENT DATE 2014 – 06 – 13
PRESS ENTER TO CHANGE VALUE
3. To change the date, press
.
4. Use the direction push-buttons to enter the correct date. If you
make a mistake, press S1 to revert back to the original date.
5. Press
to accept the date.
This causes the text on the display screen to change to the
following:
_____________________________________________________________________________
BE6028-14 3434i SF6 Leak Detector LumaSense Technologies A/S
Page 65 of 191
Page 66

Chapter 5
↵
↵
Display Text
Available Choices
Default Value
ENTER SOUND VOLUME 0
0, 1, 2, 3
1
CURRENT TIME 12:00
SELECT SET UP BRANCH
______________________________________________________________________
PRESS ENTER TO CHANGE VALUE
6. To change the time, press
.
7. Use the direction push-buttons to enter the correct time. If you
make a mistake in entering the correct date just press S1 and
start again.
8. Press
to accept the time.
When Step 8. has been completed the display then moves to the
previous head of the set-up “tree”.
9. Press p three times. The screen display shows the following text:
MEASUREMENT FORMAT CONFIGURATION
10. Press SET-UP to exit the set-up function.
5.4.2 Adjusting the Sound Level
During certain operations or, for example, when an incorrect pushbutton is pressed, the Monitor emits a “beep”. You choose the
volume of the Monitor’s “beep”. The volume of the “beep” is
expressed on a scale from 0 (no “beep”) to 3 (loudest “beep”). Table
5.3 provides details of the available choices and the default value of
this parameter.
Table 5.3 The available choices and the default value of the
Monitor’s “beep”
To set the volume:
_____________________________________________________________________________
BE6028-14 3434i SF6 Leak Detector LumaSense Technologies A/S
Page 66 of 191
Page 67

Chapter 5
↵
↵
SOUND VOLUME 1
REGULAR SELF - TESTS ?
______________________________________________________________________
1. Press SET-UP.
2. Press S3 S1 S1 S2 .
The following screen picture appears:
PRESS ENTER TO CHANGE VALUE
3. To change the volume, press
.
4. Use the direction push-buttons to enter the correct volume. If you
make a mistake, press S1 to revert back to the original volume.
5. Press
to accept volume.
6. Press SET-UP to exit the set-up function.
5.4.3 Enabling/Disabling Self Tests
If you do not wish the Monitor to perform regular self-tests, including
the hardware test on power-up you can disable it.
1. Press SET-UP S3 S1 S1 S3
NO YES
2. Press S1, the Monitor no longer performs the hardware test as
part of its self-testing procedure during any kind of reset.
3. Press SET-UP to exit the set-up function.
5.5 Alarm Relay
Two alarm relays are built into the alarm relay socket on the
back panel of the Monitor. The function of the pins in this female
connector are shown in Fig.5.2. The two alarm relays can be
connected to a variety of either audio (for example, a siren)
_____________________________________________________________________________
BE6028-14 3434i SF6 Leak Detector LumaSense Technologies A/S
Page 67 of 191
Page 68

Chapter 5
WARNING:
______________________________________________________________________
and/or visual (for example a flashing light) alarm systems and
they are activated whenever a pre-defined concentration (alarm
level) of one (or more) of the gases being measured is exceeded.
Alarm signals are given by opening and closing the relay contacts.
Both relays are closed when the Monitor is switched off and when
the Monitor is switched on. This means that there is a direct
electrical connection between pins 1 & 2 and pins 4 & 5 at all
times except when the Monitor measures a gas concentration
which is greater than the corresponding alarm limit for the gas.
When this concentration is measured, the Monitor breaks the
connection between pins 1 & 2 or 4 & 5. The monitor will
furthermore activate the internal beeper and write the following
message on the display:
ALARM LIMIT EXCEEDED
The user can switch off the beeper and the message by pressing
INFO or RESET push-button on the front-panel of the Monitor.
The alarm relays will continue being activated until either (1) all
measured gas concentrations fall below their user-defined alarm
level(s); or (2) the monitoring task is stopped – this automatically
closes the alarm relays.
Alarm Relay 1:
Alarm Relay 1: correspond to High Alarm Limit 1.
Whenever one or more gases exceed their alarm level(s) for high
alarm limit 1, the Monitor breaks the electrical connection
between pins 1 & 2 and this activates the attached alarm system.
Alarm Relay 2:
Alarm Relay 2: correspond to High Alarm Limit 2.
Whenever one or more gases exceed their alarm level(s) for high
alarm limit 2, the Monitor breaks the electrical connection between
pins 4 & 5 and this activates the attached alarm system.
LumaSense supplies a 6-pin DIN plug (male) with a locking collar
JP0600 for connecting external alarm devices to the alarm relay.
Caution:
The DC voltage across the relay contacts must not exceed 25V. The
potential on the relay contacts must not be more than 25VDC above
chassis potential, as this will cause an excessive leakage current. The
_____________________________________________________________________________
BE6028-14 3434i SF6 Leak Detector LumaSense Technologies A/S
Page 68 of 191
Page 69

Chapter 5
SELECT GENERAL SET-UP BRANCH ?
CLOCK SOUND TESTS
Alarm relay 1
Alarm Relay 2
______________________________________________________________________
current through the contacts must not exceed 100mA. AC voltages
must not be connected to the Alarm Relay socket.
Fig.5.2 Configuration of the pins in the alarm relay socket
5.6 Continuous Warm System
The Continuous Warm System ensures that the monitor is kept warm
at any time that is also when the Monitor is not measuring.
If the Monitor is powered up at all time you can save the warm up
time when starting a measurement.
5.6.1 Setting-up the Monitor to Continuous Warm System
The procedure to enable the Continuous Warm System is as follows:
1. Press the following push-button sequence: SET-UP S3 S1 S1,
and the following text is displayed:
2. Press S3 q three times S3 SET-UP. This selects the
continuous warm system.
3. Press RESET S1 (Partial Reset) in order to enable the continuous
warm system.
_____________________________________________________________________________
BE6028-14 3434i SF6 Leak Detector LumaSense Technologies A/S
Page 69 of 191
Page 70

Chapter 6
______________________________________________________________________
Chapter 6
Keying-in Parameters
July 2014
_____________________________________________________________________________
BE6028-14 3434i SF6 Leak Detector LumaSense Technologies A/S
Page 70 of 191
Page 71

Chapter 6
( ) { } [ ]
SELECT HUMIDITY UNIT Tdew
______________________________________________________________________
6.1 Types of Parameters
There are four types of parameters:
Numerical: you are free to enter the desired values. However, there
may in many instances be a range in which your values must lie.
These ranges can be found in the relevant sections of this manual.
Text: you are able to type user-defined text, for example, the names
of the gases you are measuring and when using the PC the names of
your databases.
The characters available to you when using the monitor on its own
are shown in the table below:
Fig.6.1 The characters which are available for gas names
Characters available for Gas Names
▲ →
AaBbCcDdEeFfGgHhIiJjKkLlMmNnOoPpQqRrSs
TtUuVvXxYyZz_’ ”. , : ; &!?@ | ^ # $ \ % / + < > Ø
1 2 3 4 5 6 7 8 9 AaBbCc etc
←▼
Pre-defined: you are able to select a parameter using the “select”
push-buttons when there are three or less options, or by scrolling
through a pre-defined list using the direction push-keys. The
parameters in the lists are given in more detail in the relevant sections of this manual.
Current Time: in the monitor is synchronized to match the time and
date of the internal clock in the PC when the two are connected
together. However, it is possible to adjust the monitors date and
time using the front panel push-buttons. This is described in full in
section 5.4.1.
Stand-alone Use
Whenever you are choosing parameters and/or “entering” parameter
values via the front-panel push-keys, two options are available:
CANCEL DEFAULT
_____________________________________________________________________________
BE6028-14 3434i SF6 Leak Detector LumaSense Technologies A/S
Page 71 of 191
Page 72

Chapter 6
GAS A’S HIGH ALARM LIMIT 1________ppm
CANCEL DEFAULT
↵
______________________________________________________________________
CANCEL This option appears over the S1 select push-button. If
you change the value of a parameter on the display
screen and then decide that the new value is not correct,
the original parameter can be brought back to the screen
by pressing S1.
Default This option appears over the S3 select push-button. If
you wish the parameter appearing on the display screen
to be the same as the factory-defined value you can
press S3.
Some parameters do not have pre-defined default values, so that
when Default is used a blank line will appear instead of a number.
The default value of such a parameter is said to be “blank”. For
example:
If the value of a chosen parameter lies outside the pre-defined
minimum and maximum values the value will be corrected and, at
the same time, a “beep” will sound. You will then have to “enter” the
correct value by pressing ↵ and repeating the process.
When you have to choose or change a parameter, and the text
PRESS ENTER TO CHANGE VALUE is displayed, use the direction
push-buttons and follow the procedure below. Details about the
direction keys are provided in section 5.2.
1. Press
. A cursor will blink under one of the parameter’s numbers
or letters and the bottom line will display the soft-keys Cancel
and Default.
2. Use p and q to change the entry above the cursor to the desired
number, letter. For pre-defined parameters, these push-buttons
enable you to scroll through the list. Display the desired
parameter, then go to step 5.
3. Use t and u to move the cursor across the entry fields and
repeat step 2.
4. Repeat steps 2 and 3 until the entry fields show the desired value
or text.
5. Press ↵.
_____________________________________________________________________________
BE6028-14 3434i SF6 Leak Detector LumaSense Technologies A/S
Page 72 of 191
Page 73

Chapter 6
______________________________________________________________________
If the parameter you desire is already selected (i.e. a cursor is
displayed under it), then using q enables you to move directly to the
next display.
These procedures are common for all the parameters in the Monitor.
_____________________________________________________________________________
BE6028-14 3434i SF6 Leak Detector LumaSense Technologies A/S
Page 73 of 191
Page 74

Chapter 7
______________________________________________________________________
Chapter 7
Setting-up and Starting
a Monitoring Task
July 2014
_____________________________________________________________________________
BE6028-14 3434i SF6 Leak Detector LumaSense Technologies A/S
Page 74 of 191
Page 75

Chapter 7
Parameters
Units
Default Unit
Humidity
mg/m3, ppm, Tdew, kPa
mg/m3
Pressure
mbar, mmHg, kPa
kPa
Temperature
°C, °F, K
°C
Gas Concentrations
mg/m3, ppm
mg/m3
Length
m, ft
m
______________________________________________________________________
Before a measurement task can commence, there are a variety of
parameters that must be defined first. This is called “Setting up the
Monitor”.
This chapter instructs you on how to set up the monitoring system
before starting to measure. As mentioned previously in this manual,
the parameters can be defined using the PC Use instructions, i.e.
when using a PC, or the stand-alone Use instructions, i.e. when using
the front panel push-keys on the monitor.
Before leaving the factory, each of the parameters found in the setup “tree” (see the Quick Set-up Guide) are given factory values
(default values).
When setting-up the Monitor as a stand-alone instrument, those
values with a cursor underneath them are the active values. It is
the active values, which determine how the Monitor will operate.
Warning! Failure to define any parameter may result in the default
parameters being used. This can result in the monitor measuring
incorrectly or being unable to start the measurement task.
7.1 The Parameters’ Units
The Monitor works internally with measurement parameters in SI
units. These units can be converted and displayed as a variety of
other measurement units. Defining the units here has two uses. It
enables you to set-up the measurement parameters using familiar
units and displays the measurement results with the desired
concentration units.
These parameters are listed below.
Table 7.1 The possible parameter units and the default settings
The units for existing measurement results can also be changed
using these instructions.
_____________________________________________________________________________
BE6028-14 3434i SF6 Leak Detector LumaSense Technologies A/S
Page 75 of 191
Page 76

Chapter 7
Display Text
Acceptable Values
Default
Value
NORMALIZATION TEMPERATURE
0°C, 20°C and 25°C
20°C
NORMALIZATION TEMPERATURE
32°F, 68°F and
77°F
68°F
NORMALIZATION TEMPERATURE
273K, 293K and
298K
293K
SELECT SET-UP BRANCH
______________________________________________________________________
Normalization Temperature
If you have chosen to measure gas concentrations in the unit
mg/m3, you must “enter” the temperature at which the Monitor
should calculate gas concentrations. If, for example, you “enter” a
normalization temperature of 25°C, the measured gas
concentrations, which appear on the display during a monitoring task
will be calculated in mg/m3 units at 25°C. The acceptable values and
the default values of the normalization temperature are given in
Table 7.2 in the different temperature units.
Table 7.2 The acceptable values and the default values of the
normalization temperature
7.1.1 Stand-alone Unit Set-up
For those of you setting up the monitor using these instructions, it
may be useful for you to follow the steps taken using the Set-Up
Tree.
The philosophy of the instructions is described in section 3.2.
To enter at the top of the Set-Up Tree, press SET-UP and the
monitor displays the following screen text.
MEASUREMENT FORMAT CONFIGURATION
1. Press S3 to enter the CONFIGURATION branch. The new text
displays three branches.
_____________________________________________________________________________
BE6028-14 3434i SF6 Leak Detector LumaSense Technologies A/S
Page 76 of 191
Page 77

Chapter 7
SELECT CONFIGURATION SET-UP BRANCH
______________________________________________________________________
SYSTEM UNIT FILTERS
Units branch
2. Press S2 to enter the Units branch.
3. Use the select push-buttons to define the concentration unit.
4. Use the select push-buttons to define the length unit.
5. Use the select push-buttons to define the temperature unit.
6. Use the select push-buttons to define the pressure unit.
7. The humidity unit is displayed. Use the direction push-buttons
to change it to the correct value.
When step 7 is completed the display returns to the top of the Units
branch.
Press p to go to the top of the Set-Up Tree, or press SET-UP to exit
the set-up mode.
7.2 The Measurement Parameters
Sampling:
Sampling mode: the manner in which the gases are sampled. There
are two possibilities here:
Continuous sampling: once the monitor is finished measuring it
starts again making the next measurement,
for a full explanation see section 4.1.
Interval Sampling: this is the time from the start of one
measurement cycle to the start of the next
one, for a full explanation see section 4.1.
_____________________________________________________________________________
BE6028-14 3434i SF6 Leak Detector LumaSense Technologies A/S
Page 77 of 191
Page 78

Chapter 7
Acceptable Values
hours:minutes
Interval
hours:minutes
Defalut Value
hours:minutes
00:01 to 01:00
00:01
00:02
Monitor Display Text
Acceptable Values
Default
Value
LENGTH OF SAMPLING
TUBE
0 – 99 metres
0.00
LENGTH OF SAMPLING
TUBE
0 – 324.90 feet
0.00
Acceptable Values
Interval
Default
Value
Chamber: 2 to 60 s
Tube: 0 (=off), 3 to 120 s
1 s
1 s
8 s
3 s
______________________________________________________________________
Table 7.3 The range of acceptable values and the default value for the
Fixed interval sampling
Flushing: the length of time the monitor flushes the measurement
chamber and the sample tubing between measurements. There are
two options here:
Auto: the monitoring system controls the flushing by
selecting the optimum flushing time. This time can
vary as this option takes into account the
cleanliness of the external air-filters and the
length of the sampling tube.
Therefore, the sample tube length must be defined.
Table 7.4 The acceptable values and the default values of the length of the
sampling tube
Fixed Time: there are two selections here: Chamber, which is
always selected with this option and Tube. See
Table 7.5 for the acceptable values.
Table 7.5 The range of acceptable values and the default values for the
chamber and sample tube flushing times
Water Interference: the Monitor is capable of measuring water’s
contribution to the signal measured in its analysis cell. The user can
decide whether or not the signal should be compensated for water’s
contribution. It is suggested that water should be compensated for in
all measuring situations except where extremely dry gases are being
measure.
_____________________________________________________________________________
BE6028-14 3434i SF6 Leak Detector LumaSense Technologies A/S
Page 78 of 191
Page 79

Chapter 7
A: Sulphur hexafluoride
Averaged Values
0
11:42:30
1
66.72
mg/m3
66.72
mg/m3
0
11:45:00
2
154.90
mg/m3
110.9
mg/m3
0
11:47:30
3
271.30
mg/m3
164.3
mg/m3
0
11:50:00
4
415.90
mg/m3
227.2
mg/m3
0
11:52:30
5
588.70
mg/m3
299.5
mg/m3
0
11:55:00
6
789.70
mg/m3
444.1
mg/m3
0
11:57:30
7
1.019
g/m3
616.9
mg/m3
0
12:00:00
8
1.276
g/m3
817.9
mg/m3
0
12:02:30
9
1.562
g/m3
1.047
g/m3
0
12:05:00
10
1.876
g/m3
1.304
g/m3
0
12:07:30
11
2.218
g/m3
1.159
g/m3
0
12:10:00
12
2.589
g/m3
1.904
g/m3
______________________________________________________________________
Gas Monitor Display / Averaging Period (3434i stand-alone use):
this enables you to decide if instantaneous values or averaged values
are displayed on the gas monitors screen.
If average values are desired, then the example below illustrates
how the values are calculated and displayed.
Let us suppose that the Monitor has been taking measurements
every 2.5 min., over a period of 30 min., of gas A Sulphur
hexafluoride and the following results (un-shaded area) were
obtained and recorded in the display memory, for stand-alone
users.
Let us suppose that the averaging period was set to 10 min. When
the above measurement results are displayed on the screen and
the averaging function is activated then each measurement will be
averaged over the previous 10 min. and the averaged
measurement results will replace the individual measurement
results (averaged results are shown in the shaded area in the list
above). For example: measurement number 7 would be 616.9
mg/m3. This is the average of the 5 measurements taken in the
10 min. period ending at 11:57:30. Measurement number 12
would be 1.904 g/m3 which is the average of the 5 measurements
taken in the 10 min. period ending at 12:12:00.
The range of acceptable values and the default value of the
averaging period are shown in Table 7.6.
_____________________________________________________________________________
BE6028-14 3434i SF6 Leak Detector LumaSense Technologies A/S
Page 79 of 191
Page 80

Chapter 7
Display Text
Acceptable
Values
Default Value
ENTER AVERAGING PERIOD
00:10
hours:minutes
00:10 to 12:00
hours:minutes
00:10
______________________________________________________________________
Table 7.6 The range of acceptable values and the default value of the
averaging period
Stand-alone Use
When the averaging function is active it will not only affect the
results displayed on the screen but also the measurement results
which are being printed out from the Display Memory (see Chapter
10). However, when the averaging function is deactivated – by
pressing AVERAGE again (the LED will switch off) – the original
results (un-shaded) will replace the averaged results on the screen.
Gas :
Gas Setup: there are up to six selections here: A,B, C, D, E and W.
These represent the filter positions in the monitor’s filter carousel.
When setting up a new monitoring task, you can choose freely
between the gases available for the filter (names entered when
calibrating the filter, see sections 12.3 and 12.5). Once a gas has
been selected for the filter and the measurement task started, you
can no longer change the gas for this filter in this measurement task.
However, you can still select gases for filters, which have not
previously been used in the measurement task.
Note: only one gas per filter can be selected at a time for
measuring. The W position always represents the water filter
installed in the monitor.
Sample Integration Time: this enables you to make a choice
between speed and accuracy. Generally, the longer the integration
time the more accurate the results. There are several selection
possibilities here:
Integration Type Integration Time
Fast 1 s
Normal 5 s
Low Noise 20 s
Advanced 0.5s, 1s, 2s, 5s, 10s, 20s, 50s
Alarm set-up:
Select Gas: this option enables you to select any of the gases (one
per filter position) already defined in the set-up.
_____________________________________________________________________________
BE6028-14 3434i SF6 Leak Detector LumaSense Technologies A/S
Page 80 of 191
Page 81

Chapter 7
Display Text
Acceptable Values
Default
Value
GAS A HIGH ALARM LIMIT 1
n
_____PPM
0-1000000ppm
Blank
GAS A HIGH ALARM LIMIT 1
n
_____mg/m3
Depends on the molecular
weight of the gas
Blank
______________________________________________________________________
Limit: enables you to define the gas concentration that will trigger
the alarms. The acceptable values are shown in Table 7.7.
Select limits: this defines the concentration level when the alarm
is triggered. This parameter must be defined.
Table 7.7 The range of acceptable values and default value of the alarm
limit for the gases
à
à
n
à
= A to W
The Rolling Average option enables you to prevent the alarm
being triggered by sudden, small fluctuation in the gas
concentrations by using values, which are averaged over a defined
period of time. The averaging time is defined in minutes. The
acceptable values are: 1 to 999 mins, and the default value is 10
mins.
Action: this provides you with 3 ways to trigger the alarm. One or
more of the options can be selected simultaneously.
-Monitor Beep: when an alarm is triggered the monitor makes a
beeping noise.
Monitor Relay 1 & Monitor Relay 2: selecting these options
enable you to connect the alarms to a variety of either audio (for
example, a siren) and/or visual (for example a flashing light)
alarm systems.
Active Alarms: only the gases, which you have selected and
activated, are shown in this field.
7.2.1 Measurement Set-up – Stand-alone Use
The philosophy of the instructions is described in Chapter 3.
To enter the Set-Up Tree, press SET-UP and the monitor displays
the following screen text.
_____________________________________________________________________________
BE6028-14 3434i SF6 Leak Detector LumaSense Technologies A/S
Page 81 of 191
Page 82

Chapter 7
SELECT SET_UP BRANCH
MONITORING TASK SET-UP NUMBER 1
______________________________________________________________________
MEASUREMENT FORMAT CONFIGURATION
1. Press S1 to enter the MEASUREMENT branch. The new text
displays two branches.
Monitoring Task branch
2. Press S1 to enter the Monitoring Task branch.
The following text is displayed:
PRESS ENTER TO CHANGE VALUE
3. Up to 10 different monitoring tasks can be defined here. These
are labelled from 1 to 10. Use the direction push-buttons to
select the desired set-up number and move on to the next
display.
4. Use the select push-buttons to define if you want to sample
continuously:
If you select No (S1), go to step 5.
If you select Yes (S3), go to step 6.
5. The sampling interval is displayed. Use the direction push-
buttons to change it to the correct value.
6. Use the select push-buttons to define if you want to monitor for
a pre-set period:
If you select Yes, go to step 7.
If you select No, go to step 8.
7. The monitoring period is displayed. Use the direction push-
buttons to change it to the correct value.
The MONITORING PERIOD is entered as Days Hours: Minutes.
For example, if this particular measurement cycle needs to be
performed during 5 days, 14 hours and 30 minutes, the
“monitoring period” should be “entered” as 5 14:30. The Monitor
_____________________________________________________________________________
BE6028-14 3434i SF6 Leak Detector LumaSense Technologies A/S
Page 82 of 191
Page 83

Chapter 7
Display Text
Acceptable Values
Default Value
ENTER MONITORING
days
0 00:01 to 7 00:00
days
0 01:00
SELECT MEASUREMENT SET-UP BRANCH
______________________________________________________________________
will then automatically stop monitoring 5 days, 14 hours and 30
minutes after the measurement cycle with this particular set-up
number is started. The range of acceptable values and the default
value of the monitoring period is shown in Table 7.8.
Table 7.8 The range of acceptable values and the default value of the
monitoring period
PERIOD
hours: minutes
hours: minutes
The Monitor’s Display Memory has finite storage capacity. The
data storage time available depends upon the number of gases
being measured, as well as the frequency with which
measurements are performed (that is, the sampling interval).
Section 8.3 provides information about how you can roughly
calculate the length of time the data from a particular monitoring
task can be stored in the Display Memory.
It is important to realise that once the Display Memory has been
filled up by the results of a particular monitoring task, the results
of any further measurements in the same monitoring task will
start to overwrite the data already stored in the memory.
8. Use the select push-buttons to define if you want to
compensate for water vapour interference.
9. Use the select push-buttons to select the filters/gases you want
to measure.
10. Use the select push-buttons to define if you want to measure
water vapour.
11. Use the select push-button to define if you want to store the
measurement history.
When step 11 is completed the display returns to the top of the
branch.
MONITORING TASK ENVIRONMENT
_____________________________________________________________________________
BE6028-14 3434i SF6 Leak Detector LumaSense Technologies A/S
Page 83 of 191
Page 84

Chapter 7
______________________________________________________________________
Environment branch
12. Press S3 to enter the Environment branch.
13. Use the select push-buttons to select the desired flushing
mode.
If you select Auto, go to step 16.
If you select Fixed Time, go to step 14.
14. Use the direction push-buttons to define the Chamber Flushing
Time.
15. Use the select push-buttons to select Tube Flushing.
If you don’t want tube flushing, select NO and go to step 17.
If you select tube flushing, use the direction push-buttons to
define the flushing time and go to step 17.
16. Use the direction push-buttons to select the desired sample
tube length and move on to the next display.
17. Use the direction push-buttons to select the desired
normalization temperature.
See section 7.1 for details about the normalization options.
When step 17 is completed, the display returns to the top of the
MEASUREMENT branch.
Press p to go to the top of the Set-up Tree.
If you want measurement data presented as averaged concentration
values, then go to step 19. If you want your measurement data
presented as sample concentration values, then press SET-UP to
exit the set-up function.
Format branch
If you are starting here, press SET-UP:
18. Press S2 to enter the FORMAT branch.
19. Use the direction push-buttons to enter the correct averaging
period.
20. Use the select push-buttons to choose if you want to print each
gas.
If you select Yes, go to step 21.
If you select No, go to step 22.
_____________________________________________________________________________
BE6028-14 3434i SF6 Leak Detector LumaSense Technologies A/S
Page 84 of 191
Page 85

Chapter 7
CHECK AND/OR CHANGE SET-UP FOR FILTER A
NO YES
GAS A HIGH ALARM LIMIT 1 _________mg/m3
PRESS ENTER TO CHANGE VALUE
______________________________________________________________________
21. Use the select push-buttons to choose which individual
parameters should be printed. Each time one of the select
push-buttons is pressed, the next parameter is displayed. This
step can be repeated up to 7 times, depending on the number
of filters installed.
22. Use the select push-buttons to select the Text line Terminator.
23. The text screen returns to the top of the set-up tree. Press
SET-UP to exit the set-up tree.
If you want to set Alarm limits for the measured gases, go to section
7.3.
7.3 Setting-up the Monitor’s Alarm Levels
The alarm limits of a gas are those concentrations of gas which
should activate any alarm relay connected to the Monitor via its back
panel “Alarm Relay” socket. There are two different alarm relays,
which function slightly differently. Details of these relays and the way
in which they function is described fully in section 5.5. The alarm
level parameters are found in the Filters branch of the Set-Up Tree.
Warning! If the UA number for any filter is changed here, then all
the calibration data for that filter will be lost and the filter will need
to be recalibrated.
1. Press SET-UP S3 S3. The following text is displayed
2. Use the select push-buttons to ignore this filter or to select this
filter if alarms are to be set.
3. Press q 5 times until the following text is displayed.
4. Use the direction push-buttons to set the alarm concentration.
If you do not wish to activate the alarm function for a particular
gas, select the DEFAULT. This will “blank out” the alarm level
value for the gas and deactivate the alarm for that gas.
_____________________________________________________________________________
BE6028-14 3434i SF6 Leak Detector LumaSense Technologies A/S
Page 85 of 191
Page 86

Chapter 7
GAS A HIGH ALARM LIMIT 2 _________mg/m3
PRESS ENTER TO CHANGE VALUE
______________________________________________________________________
5. Repeat steps 2 to 4 to set the alarms for the other filters.
6. Press SET-UP to exit the alarm set-up.
7.4 Starting a Monitoring Task
Monitoring tasks can be started in two ways. They can be started
immediately, or set to start at a pre-set time. The duration of the
monitoring sequence can also be determined. A monitoring task can
continue until it is stopped manually, or at a pre-set time.
When using the PC and the Online option, there are no limits to the
duration of a monitoring task. However, if the measurement results
are being stored in the monitor’s memory, the duration of the
monitoring task should be considered as there is only a finite amount
of memory in the monitor. See section 8.3 for full details about the
storage capacity of the monitor.
7.4.1 PC Use – using the Online Program7810 Application SW
Please refer to user manual BE6027 for Application Software 7810 for
assistance to set-up start and stop a monitoring task.
7.4.2 Stand-alone Use – using the Front Panel Pushbuttons
Before a monitoring task is started, the set-up, as described in
section 7.2, must be completed:
Before any monitoring task is started, all data stored in the Monitor’s
Display Memory is removed (cleared). The Display Memory is where
the Monitor stores the results of all measurements while it is
performing a monitoring task. However, the data in Display Memory
can be copied into and stored in the Monitor’s Background Memory.
This operation is described in section 9.2.
When you start a new monitoring task the following warning is
displayed WARNING: DISPLAY MEMORY WILL BE DELETED to
remind you to store any data that is presently stored in the Display
Memory. If a monitoring task is stopped, any data already stored in
Display Memory will be deleted when a monitoring task is started.
1. Press MEASURE.
The following text appears on the screen:
_____________________________________________________________________________
BE6028-14 3434i SF6 Leak Detector LumaSense Technologies A/S
Page 86 of 191
Page 87

Chapter 7
ACTIVE TASK : MONITORING TASK NUMBER 1
SELECT TASK
MONITORING TASK SET-UP NUMBER 1
______________________________________________________________________
START TASK DELAYED TASK CHANGE TASK
Please note: if you do not use one of the “select” keys within a
short time after the above text appears, the Monitor will
automatically stop operating in Measure mode (the light-emitting
diode in the MEASURE key switches off). If this happens, just press
MEASURE again.
The active monitoring task number is the number of the monitoring
task you wish the Monitor to perform.
2. If the monitoring task number displayed is correct, then go to
step 5.
If the number on the display is not correct then press S3 to
change the task number.
This changes the display text to the following:
MONITORING TASK CALIBRATION TASK
3. Press S1.
This causes the following text to appear on the display:
PRESS ENTER TO CHANGE VALUES
The number appearing on the screen will be a number from 1 to
10.
4. Press ↵ and use the direction keys to change the monitoring
task number to the desired value. Then press ↵ again to accept
the task number.
The following text appears on the display screen:
_____________________________________________________________________________
BE6028-14 3434i SF6 Leak Detector LumaSense Technologies A/S
Page 87 of 191
Page 88

Chapter 7
ACTIVE TASK : MONITORING TASK NUMBER 1
WARNING : DISPLAY MEMORY WILL BE DELETED
START TIME : 1 00 : 00
ACTIVE TASK : MONITORING TASK NUMBER 1
______________________________________________________________________
START TASK DELAYED TASK CHANGE TASK
5. To start the measurement immediately, press S1.
To delay the start, press S2.
The following warning then appears on the display:
PROCEED STOP
1. Press S1.
Delayed Start
If you selected a delayed start, the following text is displayed:
Use the direction push-buttons to enter the desired date and start
time, e.g. 10 16:25. The following text is displayed.
PRESS ENTER TO CHANGE VALUE
TASK WILL START AT : 10 16 : 25 TIME 16 : 00
When the monitoring task starts, the screen will change and
display the same messages as those displayed when a monitoring
task starts immediately.
_____________________________________________________________________________
BE6028-14 3434i SF6 Leak Detector LumaSense Technologies A/S
Page 88 of 191
Page 89

Chapter 7
MEASUREMENT IN PROGRESS
RESULTS NOT YET AVAILABLE
A : 4.52 E + 01 B :__________ C : _________
______________________________________________________________________
Immediate Start
If you selected an immediate start, the following text appears on
the screen:
2. When the first measurement cycle is complete the Monitor will
automatically display the results and update them every time a
new measurement cycle is completed. An example is shown
below:
D : __________ E : __________ W : 8.33 E + 00
This display gives the overview of the gas/vapour concentrations last
measured – in this case the concentration of gas A and humidity of
the water vapour are in the units that were selected – that is mg/m3
for gas A and Tdew for water vapour (see section 4.3.2).
If no pre-set monitoring period is defined, then to stop the
monitoring task, press MEASURE and S3.
_____________________________________________________________________________
BE6028-14 3434i SF6 Leak Detector LumaSense Technologies A/S
Page 89 of 191
Page 90

Chapter 8
______________________________________________________________________
Chapter 8
Viewing Measurement Data –
Using the Monitor
July 2014
_____________________________________________________________________________
BE6028-14 3434i SF6 Leak Detector LumaSense Technologies A/S
Page 90 of 191
Page 91

Chapter 8
DATA IN DISPLAY MEMORY RECORDED FROM
2014-01-16 09:50 TO 2014-01-16 10:04
______________________________________________________________________
8.1 Displayed Monitoring Task Data
When the Monitor is switched on, but not being operated in any
mode, the screen display text identifies the data stored in its Display
Memory, by displaying the day and time of the first stored
measurement cycle of the monitoring task, as well as the day and
time of the last measurement cycle of the monitoring task. For
example:
If the Monitor has just been fully reset then the display will just
show the current time and report that the monitor is ready for use.
The Set-up parameters describing a monitoring task and the
measurement data collected during the task are stored as a list in
the Display Memor y. You can scroll through the set-up parameters as
well as the data collected during the task by using the direction
push-buttons, q to scroll “vertically” downwards, and p to scroll
“vertically” upwards through the list. Fig.8.1 illustrates how the data
is organised:
Identification of Measurements:
This screen provides the date and time of the first and last
measurement results, which are stored in Display Memory.
Identification of Each Monitored Gas:
This display identifies the gases monitored during the task. By using
the u push-button, one can find the names of all the gases, which
were monitored during the displayed task.
Statistical Analysis of Measurement Results for Each Gas:
Using the individual measured gas concentration stored in Display
Memory, when Store Measurement History is selected, a statistical
analysis is performed which provides a summary of the stored
measurement results. The MAX (maximum), MIN (minimum) gas
concentrations are displayed, and the µ (Mean or Linear Average)
and σ (Standard Deviation) values are calculated and displayed. A
description of these statistical terms can be found in section 8.2.1.
During the performance of a monitoring task the statistical analysis is
updated constantly.
List of Individual Measurement Results:
Each of these displays provide the date and time each measurement
cycle was performed and the concentration of the gas whose name
appears on the screen. In some cases an asterisk (*) will be shown
alongside the gas/vapour concentration. When such an asterisk is
_____________________________________________________________________________
BE6028-14 3434i SF6 Leak Detector LumaSense Technologies A/S
Page 91 of 191
Page 92

Chapter 8
______________________________________________________________________
shown, press the INFO button. Text will appear on the screen to
indicate why this particular measurement has been marked.
The number which is shown on the display – between time and
concentration – is only “filled-in” after completion of a monitoring
task. The number indicates the order in which the measurements
were made. The “oldest” stored measurement is always given the
number 1 and the following measurements are numbered sequentially.
Overview of the Monitoring Task:
These displays provide an overview of the monitoring task set-up
parameters.
Start of the Monitoring Task:
The Display Memory has a finite size and therefore, if a monitoring
task runs for a long period of time, it will fill up all available memory
space, and data collected after the memory has been filled-up will
start to overwrite the data collected during the start of the
monitoring task. Some measurement results will therefore be lost
from the memory. In such a situation the date and time appearing
after MONITORING TASK STARTED….. will not be the same as the
first date and time displayed on the screen labelled 1 in Fig.8.1.
Using the direction push-buttons and the average push-button, users
can scroll through each “page” of stored data and, in addition,
average gas concentrations over a pre-defined averaging period. The
functions of the push-buttons are described fully in Chapter 5 and
can be summarized as follows:
AVERAGE When this push-button is pressed the 3434i will
average the measurement results which are stored
in its Display Memory over the period of time
Averaging Period specified in the FORMAT
branch of the Set-up “tree” (see section 7.2).
When the averaging function is operative (the LED
above the push-button is lit) only averaged
measurement results are shown on the 3434i’s
display. These averaged measurements may also
be printed out while the averaging function is
operative. It is important to realise that when the
averaging function is switched off the original
measurement results will be shown again on the
display. An example of averaged measurements is
given in section 7.2.
_____________________________________________________________________________
BE6028-14 3434i SF6 Leak Detector LumaSense Technologies A/S
Page 92 of 191
Page 93

Chapter 8
______________________________________________________________________
Fig.8.1 Organisation of monitoring-task data displayed on the
monitor’s screen.
_____________________________________________________________________________
BE6028-14 3434i SF6 Leak Detector LumaSense Technologies A/S
Page 93 of 191
Page 94

Chapter 8
______________________________________________________________________
u &t Using these push-buttons users can scroll “horizontally”
through any vertical level of data. For example, if the statistical
analysis of the measurement results for water-vapour are displayed
on the screen, then by using u you can read the statistical analysis
of the measurement results for gas A,W and then go back to the
original display (see Fig.8.1).
EVENT This push-button can be used (pressed) to mark
the measurement being performed at the time at
which a special event occurred during a monitoring
task. Any such measurement will appear on the
display with an asterisk alongside it. By pressing
INFO when such a display is seen you can display
what the asterisk indicates. Section 8.2.2 shows
the display which appears when INFO is pressed
and explains all the symbols used. Marked events
are also shown on print-outs and of monitoring
task data (see section 8.2.3).
q This push-button allows the user to scroll
“vertically” downwards through the list of
measurement results (see Fig.8.1).
p This push-button allows the user to scroll
“vertically” upwards through the list of
measurement results. The measurement list is a
closed loop.
The push-buttons p and q have a repetitive function, which means
that if they are pressed continuously they will allow the user to scroll
very quickly through a list.
8.1.1 Processing Measurement Data
Gas measurement data stored in Display Memory can be processed
in the following way:
• It can be processed to produce Time-weighted Average (TWA)
concentrations of gases over any user-defined period of time.
8.1.2 Obtaining Time-weighted Average (TWA) Values
By using the AVERAGE button Time-weighted Average
concentrations (C
over any user-defined period of time (T hours). The following steps
are involved:
1. Press SET-UP and S2.
) of all the monitored gases can be obtained
TWA
_____________________________________________________________________________
BE6028-14 3434i SF6 Leak Detector LumaSense Technologies A/S
Page 94 of 191
Page 95

Chapter 8
______________________________________________________________________
2. “Enter” the period of time required for averaging – this could for
example be 8 hours if you are interested in finding out whether
the 8 hour Time Weighted Average concentration of gases are in
compliance with National Occupational Exposure Limits; or,
alternatively, the averaging period could be 15 minute TimeWeighted Average if you are interested in finding out whether the
Short Term Exposure Limit (STEL) of the gases complies with
National Occupational Exposure Limits.
3. Press SET-UP and then AVERAGE.
When steps 1 to 3 are complete, scroll through the measurement
results displayed on the screen (Display Memory). Notice that all
measurements have been averaged over the chosen averaging
period. A detailed example is given in section 7.2.
8.1.3 How Time-weighted Averages are Calculated
In order to explain how the 3434i averages gas measurements over
a fixed user-defined “averaging period”, let us suppose that a
particular gas has been monitored continuously and that its
measured concentration was C1 during the first sampling interval T1
min, C2 during the second sampling interval T2 min…. Cn during the
nth sampling interval Tn min (see Fig.8.2). Suppose that you wished
the 3434i to calculate the Time-weighted average (TWA) over a
period of time = T min.
Fig.8.2 Illustration of a monitoring task
The Time-weighted average of these measurements over the
averaging period of T min is calculated using the following
mathematical equation:
_____________________________________________________________________________
BE6028-14 3434i SF6 Leak Detector LumaSense Technologies A/S
Page 95 of 191
Page 96

Chapter 8
( )
N
C
C
Nn
n
n
TWA
∑
=
=
=
1
______________________________________________________________________
= linear average of all the measurements made during
the averaging period.
Where: Cn = constant concentration measured at time Tn;
N = the total number of measurements performed during
the averaging period T min.
In the situation where the total monitoring period is the same as the
averaging period then the averaged value of the last performed
measurement will be the same as the Mean Value (µ) shown on the
display screen (see 3 in Fig.8.1).
8.2 Printed Monitoring Task Data
Fig.8.1 illustrates how data from a monitoring task is displayed on
the Monitor’s screen. When monitoring task data appearing in Display
Memory is printed out, the same information appears but it is
presented in a different format. An example of a monitoring task
data print-out is shown in Fig.8.3 – Chapter 10 describes how this is
done.
Fig.8.3 Print-out of monitoring task data
_____________________________________________________________________________
BE6028-14 3434i SF6 Leak Detector LumaSense Technologies A/S
Page 96 of 191
Page 97

Chapter 8
( )
N
C
Nn
n
n
∑
=
=
=
1
µ
( )
1
1
2
−
−
=
∑
=
=
N
Cn
Nn
n
µ
σ
GAS X: COMMON MARK: PEOW GAS MARK: BFA
EVENT NO: xxxx TIME: hh:mm
______________________________________________________________________
8.2.1 Statistical Analysis Terms
In the statistical analysis of the measurement results for each gas
(see 3 in Fig.8.1) the following statistics appear:
The Mean Value (µ) – this is the linear average of all
measurements of a gas taken during the total monitoring period.
The calculation of “the mean value” can be expressed
mathematically as follows:
The Mean Value =
Where: N = measurement cycles performed during the
monitoring period (T) between the cursors.
c
n
= gas concentrations (where n = 1 to N)
The Standard Deviation (σ) – this is the standard deviation of a
particular gas’s measurements from the mean value (µ) of this
gas. Standard deviation can be expressed mathematically as
follows:
The Standard Deviation =
Where: µ = the mean value
Cn = individual gas concentrations
N = total number of measurements
8.2.2 Symbols used in Displayed Measurement Data
If an asterisk (*) appears on the display alongside any gas
concentration, it indicates that something happened during the
measurement. You can find out what the asterisk indicates by
pressing the INFO button. The following display appears for a short
period of time:
_____________________________________________________________________________
BE6028-14 3434i SF6 Leak Detector LumaSense Technologies A/S
Page 97 of 191
Page 98

Chapter 8
______________________________________________________________________
“EVENT NO” will appear on the screen only if the Event Mark button
was used during the monitoring task. In this case the letter “E” will
also appear as a Common Mark. The symbols which can appear after
the text COMMON MARK and GAS MARK are listed below with a
short explanation of what they mean:
Common Marks:
“P” (1) The Monitor stopped measuring due to a power
failure but has automatically re-started the
monitoring task again after regaining power;
(2) The Monitor has been “reset” either because of
a detected fault or because RESET was pressed.
“E” The measurement has been marked by the User.
“O” This symbol indicates that an operational error was
detected during this measurement. The accuracy of
such a measurement cannot always be guaranteed.
“W” This symbol indicates that a warning was detected
during this measurement. The accuracy of such a
measurement cannot always be guaranteed.
Gas Marks:
“B” The Monitor was incapable of calculating this gas
concentration.
“F” After this measurement the filter carousel was
found to be out of alignment. If the carousel was
only slightly out of alignment then the accuracy of
the measurement has not been affected. The accuracy of such a measurement cannot always be
guaranteed.
“A” The gas concentration measured during this
measurement cycle was found to exceed the userdefined alarm limit for this gas.
8.2.3 Symbols Used in Print-outs of Measurement Data
Displayed measurements marked with the COMMON MARKS “O”
and “W”, and the GAS MARKS “A” and ”F”, are printed-out with an
“X” symbol. However, any displayed measurements marked with the
COMMON MARKS “P” and/or “E”, and the GAS MARK “B” are not
printed-out with these symbols. These measurements are marked in
a different way:
_____________________________________________________________________________
BE6028-14 3434i SF6 Leak Detector LumaSense Technologies A/S
Page 98 of 191
Page 99

Chapter 8
______________________________________________________________________
Common Marks:
The symbol “P” is replaced by the text “3434i Restarted”. This
indicates that the Monitor stopped and then started-up again
sometime between the previous sample time and the time which
appears alongside this message.
The symbol “E” is replaced by the text User Event NumberX: This
indicates that the EVENT button was pressed while this measurement
cycle was being performed. The number indicates the total number of
“events” which have been marked during this monitoring task, at the
time this sample was taken.
Gas Marks:
The symbol “B” is replaced by a straight line (_______) which
indicates that the Monitor was unable to calculate the concentration
of the named gas in this sample.
Other Marks Used:
……This symbol indicates either: (1) that this gas was not measured;
or (2) that this gas was not selected to be printed out (see section
10.5).
8.3 Storage Space in the Display Memory
The total space available in the Display Memory to store data is
131072 measurement cycles. Depending on the time for one
measurement cycle the capacity will be as follows.
If a measurement cycle in which gas A and water vapour are
measured with continuous sampling takes 15s, then the Display
memory space will be 546 hours = 22 days.
The Monitor will overwrite the oldest stored measurement data when
the Display memory is full. This is done by deleting data in blocks of
2048 measurement cycles.
For further information regarding measurement cycles see chapter 4.
_____________________________________________________________________________
BE6028-14 3434i SF6 Leak Detector LumaSense Technologies A/S
Page 99 of 191
Page 100

Chapter 9
______________________________________________________________________
Chapter 9
Storage of Data in the Monitor’s Memory
July 2014
_____________________________________________________________________________
BE6028-14 3434i SF6 Leak Detector LumaSense Technologies A/S
Page 100 of 191
 Loading...