

Page 1

e
a
E
c
e
Pir
PG
ni Gaug
500
e Enhan
ed
tinb21
1 (2016-06)
Op
Incl.
rating Manu
EU Declaration o
al
f Conformity
1
Page 2
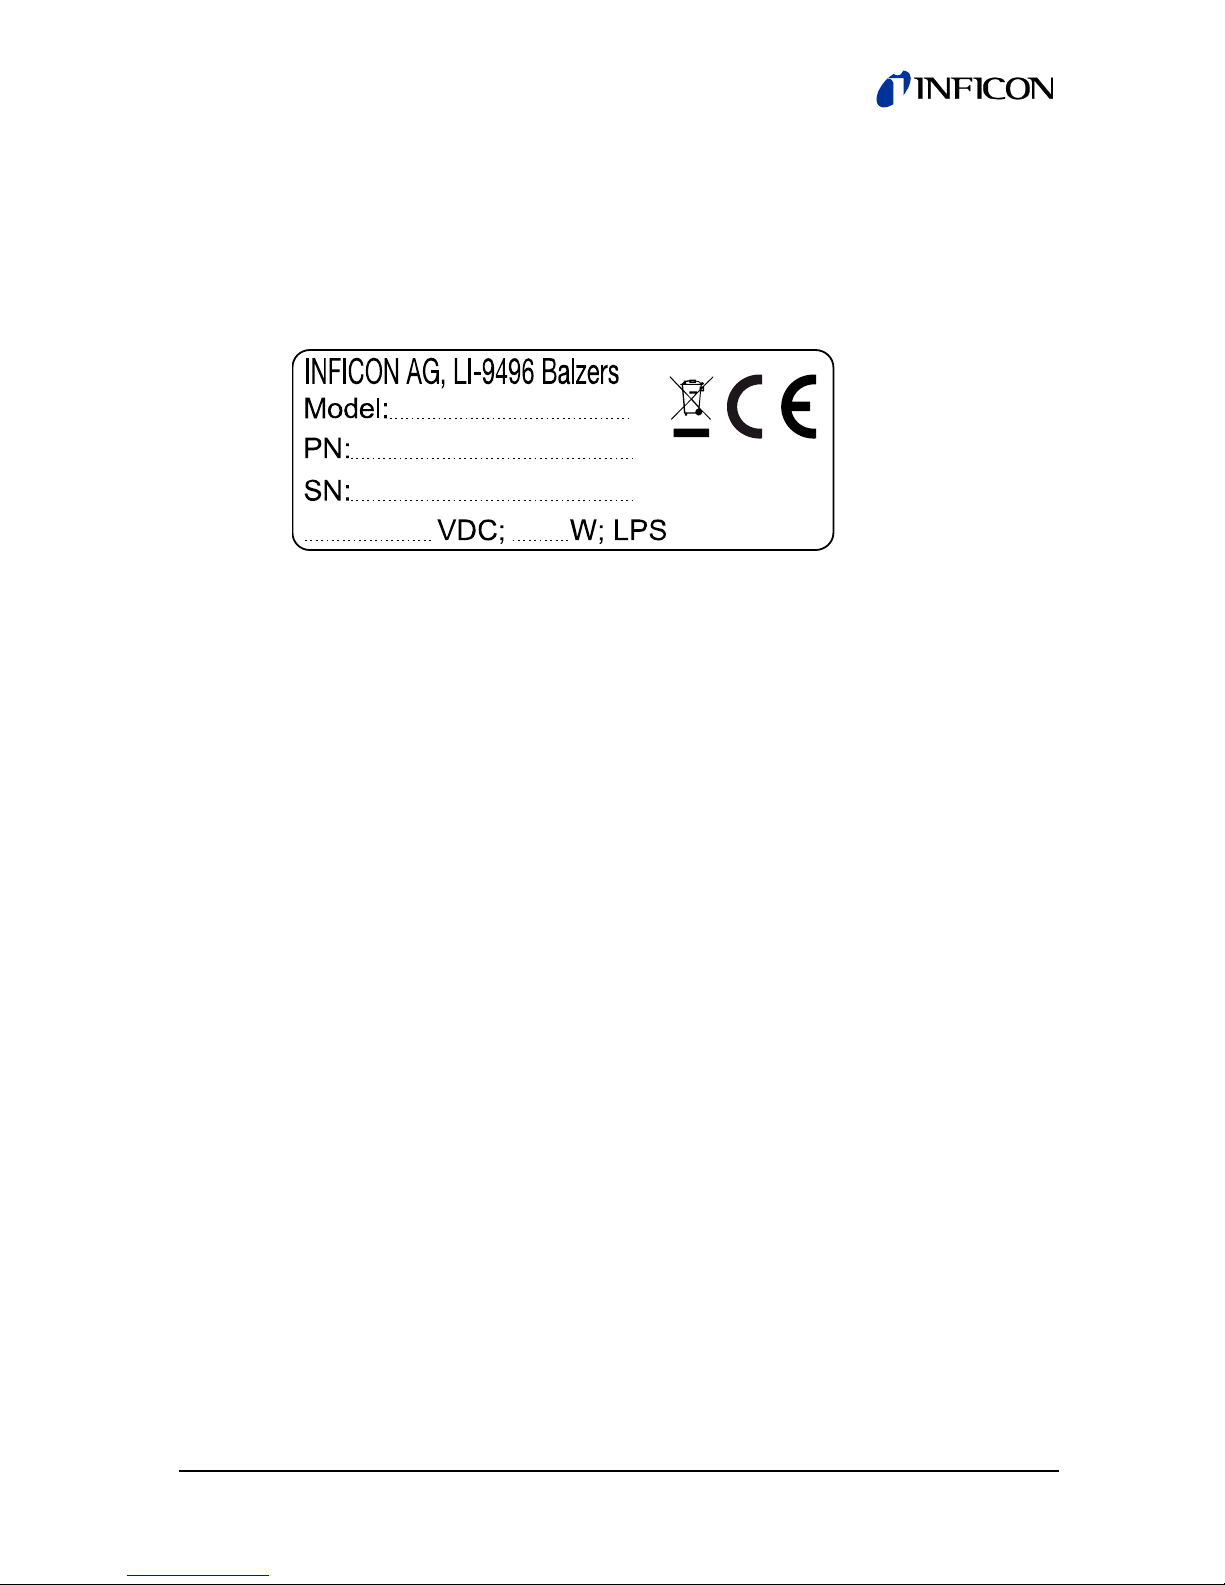
Product Identification
In all communications with INFICON, please specify the information given on the product nameplate. For convenient reference copy that information into the space provided below.
2
tinb21e1 (2016-06)
Page 3
Validity
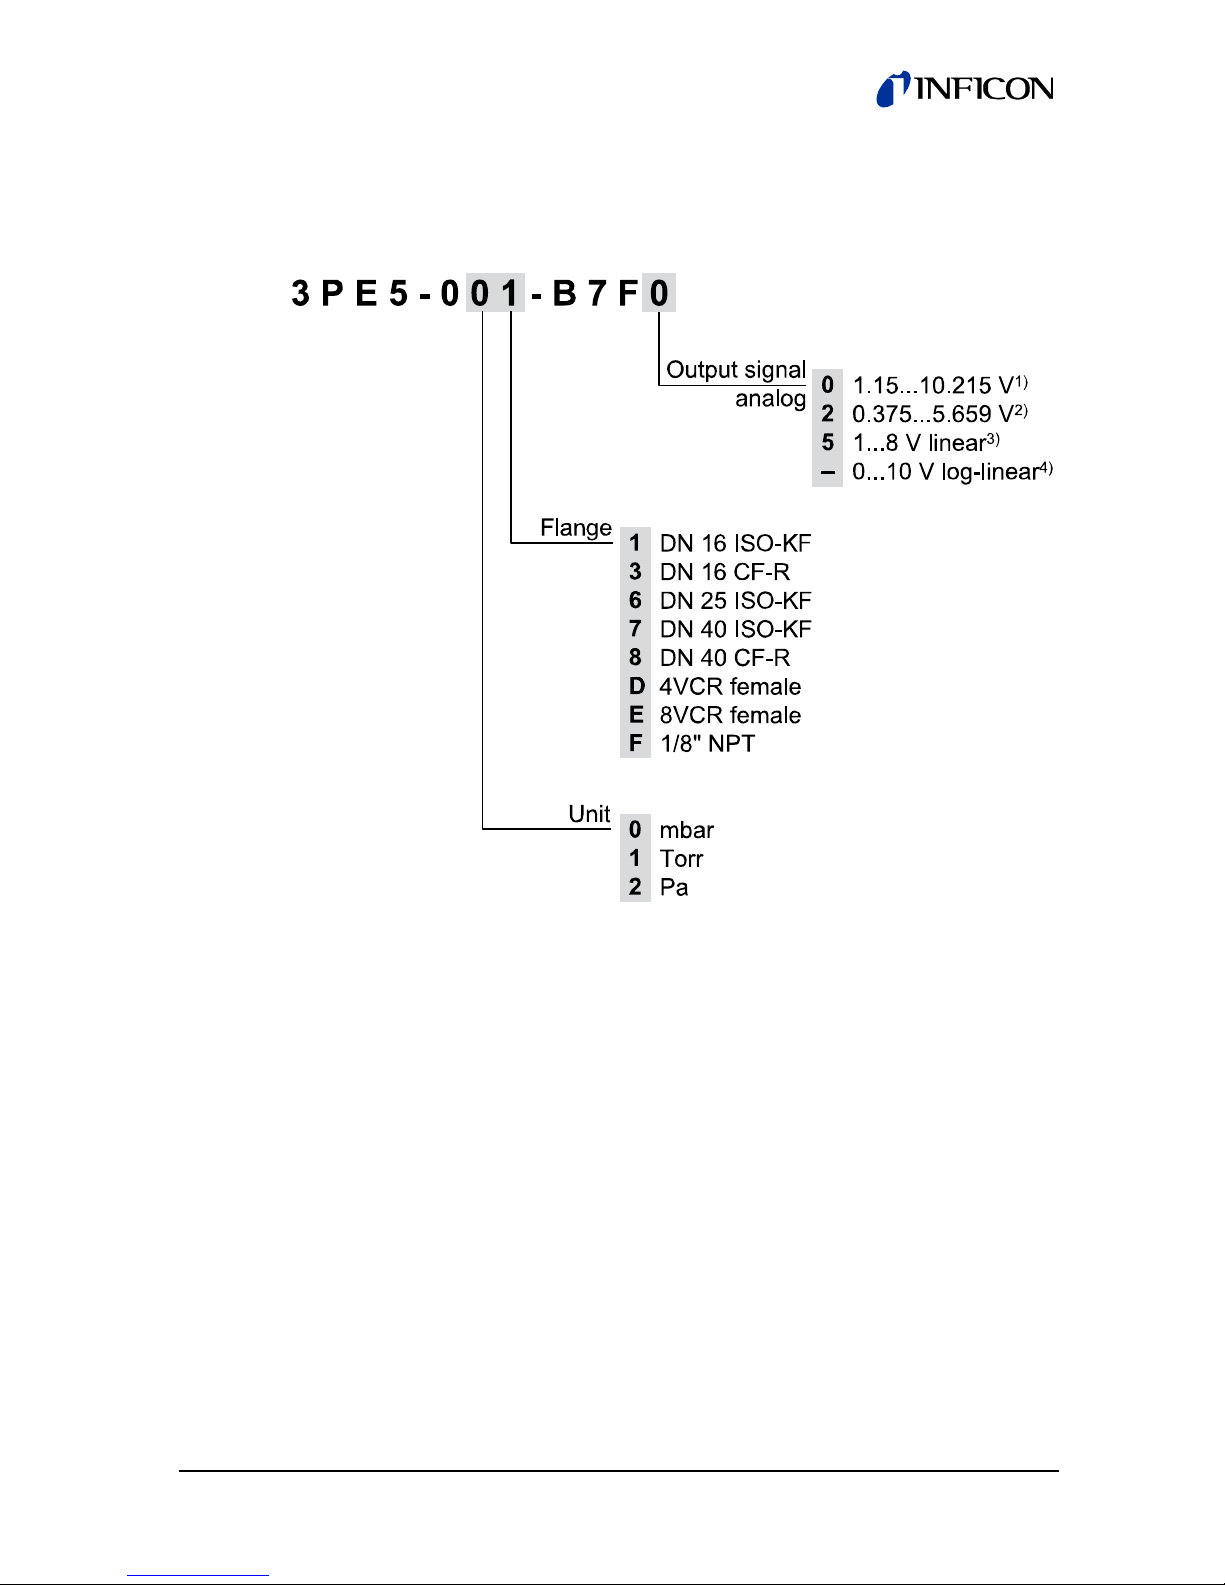
This document applies to products with part numbers:
1)
→ 67
2)
→ 48, 53
3)
→ 57, 61
4)
→ 68. Analog output 0 … 10 V is available on all devices by
default on pin 9.
The part number (PN) can be taken from the product nameplate.
If not indicated otherwise in the legends, the illustrations in this
document correspond to the product with vacuum connection
DN 25 ISO-KF. They apply to the other products by analogy.
We reserve the right to make technical changes without prior
notice.
tinb21e1 (2016-06) 3
Page 4

Important User Information
There are operational characteristic differences between solid
state equipment and electromechanical equipment. Because of
these differences, and because there are a variety of uses for
solid state equipment, all persons that apply this equipment must
take every precaution and satisfy themselves that the intended
application of this equipment is safe and used in an acceptable
manner.
In no event will INFICON be responsible or liable for indirect or
consequential damages that result from the use or application of
this equipment.
Any examples or diagrams included in this manual are provided
solely for illustrative purposes. Because of the many variables
and requirements imposed on any particular installation,
INFICON cannot assume responsibility or liability for any actual
use based on the examples and diagrams.
No patent liability is assumed by INFICON with respect to use of
information circuits, equipment, or software described in this
manual.
Throughout this manual we use notes, notices and apply internationally recognized symbols and safety messages to make
you aware of safety considerations.
4
tinb21e1 (2016-06)
Page 5
m
a
e
o
m
a
e
o
m
e
s
A
O
S
c
a
e
c
a
m
c
e
A
a
c
p
a
c
o
a
Identifies infor
cause electric
taken, could r
or economic l
C
Identifies infor
cause electric
taken, could r
or economic l
N
ation about pra
l or physical haz
sult in death or s
ss.
UTION
ation about pra
l or physical haz
sult in minor or
ss.
TICE
tices or circumst
rds which, if pre
rious injury, pro
tices or circumst
rds which, if pre
oderate injury, pr
nces that can
autions are not
erty damage,
nces that can
autions are not
perty damage,
Identifies infor
understanding
Labels may b
that dangerou
tinb21e1 (2016-06)
ation that is criti
of the product.
HOCK H
located on or ins
voltages may b
al for successful
ZARD
ide the device to
present.
application and
lert people
5
Page 6

General Safety Instructions
• Adhere to the applicable regulations and take the necessary
precautions for the process media used.
Consider possible reactions with the product materials.
Consider possible reactions (e.g. explosion) of the process
media due to the heat generated by the product.
• Adhere to the applicable regulations and take the necessary
precautions for all work you are going to do and consider the
safety instructions in this document.
• Before beginning to work, find out whether any vacuum components are contaminated. Adhere to the relevant regulations
and take the necessary precautions when handling contaminated parts.
Communicate the safety instructions to all other users.
Liability and Warranty
INFICON assumes no liability and the warranty becomes null
and void if the end-user or third parties
• disregard the information in this document
• use the product in a non-conforming manner
• make any kind of interventions (modifications, alterations etc.)
on the product
• use the product with accessories not listed in the product
documentation.
The end-user assumes the responsibility in conjunction with the
process media used.
Gauge failures due to contamination or wear and tear, as well as
expendable parts (e.g. Pirani filament), are not covered by the
warranty.
6
tinb21e1 (2016-06)
Page 7

Contents
Product Identification 2
Validity 3
Important User Information 4
General Safety Instructions 6
Liability and Warranty 6
1 Introduction / General Information 9
1.1 Description 9
1.2 Specifications 9
1.3 Dimensions 12
1.4 Options & Accessories 13
2 Important Safety Information 14
2.1 Safety Precautions - General 14
2.2 Safety Precautions - Service and Operation 15
2.3 Electrical Conditions 16
2.3.1 Proper Equipment Grounding 16
2.3.2 Electrical Interface and Control 17
2.4 Overpressure and use with hazardous gases 17
2.5 Gases other than Nitrogen / air 18
3 Installation 19
3.1 Mechanical Installation 19
3.2 Electrical Installation 21
3.2.1 Grounding 21
3.2.2 Electrical Connections 22
4 Setup and Operation 25
4.1 Initial Setup 25
4.2 User Interface Basics 26
4.3 Programming 27
4.4 Return to Factory Default Settings 33
5 Using the gauge with different gases 34
6 Display 37
6.1 Display - Torr / mTorr 37
6.2 Display - mbar 41
tinb21e1 (2016-06) 7
Page 8

7 Analog Output 46
7.1 Non-Linear Analog Output - 0.375 to 5.659 V,
Torr / mTorr 48
7.2 Non-Linear Analog Output - 0.375 to 5.659 V, mbar 53
7.3 Log-Linear Analog Output - 1-8 V, Torr 57
7.4 Log-Linear Analog Output - 1-8 V, mbar 61
7.5 Log-Linear Analog Output - 1.15-10.215 V,
mbar / Torr / Pa 67
7.6 Linear Analog Output 0-10 V, Torr 68
8 RS485 / RS232 serial communications 70
8.1 Device Specific Serial Communication Info 70
8.2 RS485 / RS232 Command Protocol Summary 71
9 Service 74
9.1 Calibration 74
9.2 Maintenance 74
9.3 Troubleshooting 75
9.4 Contamination 77
9.5 Module and sensor replacement 79
10 Factory Service and Support 80
11 Returning the Product 80
12 Disposal 81
EU Declaration of Conformity 82
For cross-references within this document, the symbol (→ XY)
is used.
8
tinb21e1 (2016-06)
Page 9

1 Introduction / General Information
1.1 Description
Thermal conductivity gauges measure pressure indirectly by
sensing the loss of heat from a sensor to the surrounding gases.
The higher the pressure of the surrounding gas, the more heat is
conducted away from the sensor. Pirani thermal conductivity
gauges maintain a sensor (usually a wire) at some constant temperature, and measure the current or power required to maintain
that temperature. A standard Pirani gauge has a useful measuring range of about 10
convection currents that are generated above 1 Torr, convectionenhanced Pirani gauges increase the measuring range to just
above atmosphere.
-4
Torr to 10 Torr. By taking advantage of
The INFICON PGE500 Pirani Gauge Enhanced module provides
the basic signal conditioning required to turn a convection
vacuum gauge into a complete measuring instrument. The module provides linear, non-linear or log-linear analog outputs, two
setpoint relays and RS232/485 serial communications. In addition, a built-in display provides a convenient user interface for
setup and operation of the vacuum gauge.
1.2 Specifications
Measurement range 1.3×10
Accuracy - N
1.3×10
1.3×10
530 … 1333 mbar
-4
1×10
-3
1×10
400 … 1000 Torr
(typical)
2
-4
… 1.3×10⁻³ mbar
-3
… 530 mbar
… 1×10⁻³ Torr
… 400 Torr
-4
… 1333 mbar
-4
1×10
1.3×10
… 1000 Torr
-2
Pa … 133 kPa
0.1 ×10
-3
mbar resolution
±10% of reading
±2.5% of reading
0.1 mTorr resolution
±10% of reading
±2.5% of reading
Repeatability - N
tinb21e1 (2016-06) 9
(typical) ±2% of reading
2
Page 10

Display bright OLED, 4 digits, user-
selectable mbar, Torr or Pa
1100 Torr … 1000 Torr 4 digits
999 Torr… 10.0 mTorr 3 digits
9.9 mTorr … 1.0 mTorr 2 digits
0.9 mTorr… 1.0 mTorr 2 digits
Materials exposed to vacuum gold-plated tungsten, 304 & 316
stainless steel, glass, nickel,
Teflon
®
Housing (electronics) aluminum extrusion
Internal volume 26 cm3 (1.589 in3)
Internal surface area 59.7 cm
2
(9.25 in2)
Weight 340 g (12 oz.)
Permissible temperature
Operating
0 … +40 °C
Storage –40 … +70 °C
Bakeout temperature ≤150 °C (gauge only - electro-
nics removed)
Relative humidity 0 … 95%, non-condensing
Use
Operating
altitude up to 2500 m (8200 ft.)
Storage altitude up to 12500 m
(41000 ft.)
Mounting orientation horizontal recommended
(orientation has no effect on
measurements below 1.3 mbar
(1 Torr))
10
tinb21e1 (2016-06)
Page 11

Output signal analog (measurement signal)
3PE5-0xx-B7F0 log-linear
1.15 … 10.215 V (dc),
1.286 V/decade
p = 10
0.778(U-c)
(→ 67)
-B7F2 non-linear S-curve
0.375 … 5.659 V (dc)
Granville-Phillips
vectron
®
compatible
®
Mini-Con-
(→ 48, 53)
-B7F5 log-linear
1 … 8 V (dc)
1 V/decade
P = 10
(V - 5)
, (→ 57, 61)
-B7F– linear
0 … 10 V (dc)
(→ 68)
RS232C / RS485 interface ASCII protocol
Supply voltage 12 … 28 V (dc), 2 W protected
against power reversal and
transient overvoltages
Setpoint relays two, single-pole double-throw
relays (SPDT), 1 A at 30 V (dc)
resistive, or V (ac) non-inductive
Electrical connection 9-pin D-sub male and
15-pin HD D-sub male (with
RS485)
tinb21e1 (2016-06) 11
Page 12

n
i
NDNDN
NDN
/
b
A
c
1
1
1
3
3
7
6
8
1.3
Dimensio
F
tting
s
Dimension
D
16 ISO-KF
25 ISO-KF
40 ISO-KF
D
16 CF-R
40 CF-R
4
VCR female
8
VCR female
1
8" NPT male
mm (in
25.9 (1.
25.9 (1.
25.9 (1.
34 (1.
34 (1.
43.7 (1.
40.9 (1.
21.8 (0.
h)
6)
6)
6)
4)
4)
2)
1)
6)
12
tin
21e1 (2016-06)
Page 13

f
2
d
o
t
W
p
e
p
s
w
e
w
d
1.4
Options &
Power supply
Input: 100 …
Output: 24 V (
Cable Length:
Accessories
or PGE300/500
40 V (ac)
c) @ 2.5 A (60
2 m (6 ft.)
Ordering No.
352-525
)
This variation
plug that is no
IEC60320 AC
supplied AC m
f the power sup
listed above is r
power entry rece
ains power cord
ly may be used
quired. The conv
tacle allows use
et available worl
hen an AC
ntional
ith any user
wide.
tinb21e
1 (2016-06)
13
Page 14

t
d
e
y
o
o
o
p
a
o
y
s
m
f
c
h
N
d
W
o
t
d
n
a
r
r
o
o
q
a
e
o
e
r
b
o
p
a
f
t
m
e
m
e
y
r
C
n
e
r
2
Importan
INFICON has
and reliable s
the strict safet
and follow all
To avoid seri
tion in this d
procedures c
death, and or
Failure to com
ards of installa
disclaims all li
these instructi
Safety Inf
esigned and tes
rvice, provided it
guidelines provi
warnings and i
ARNING
us injury or de
cument. Failure
uld result in se
property damag
ly with these wa
tion and intended
bility for the cust
ns.
rmation
ed this product t
is installed and o
ed in this manu
structions.
th, follow the sa
to comply with
ious bodily har
e.
nings violates th
use of this instru
mer’s failure to c
provide safe
erated within
l. Please read
ety informa-
hese safety
, including
safety stand-
ent. INFICON
mply with
2.1
Although ever
ble installation
that arises fro
of the module.
tion and use o
Safety Pre
The product s
moved.
WARNI
adjustments in
inside the pro
service trained
attempt has bee
, INFICON cann
various installat
If you have any
this product, ple
autions - G
ould never be op
G! There are n
side the product
uct enclosure is
personnel.
n made to consid
t anticipate ever
ions, operation, o
uestions about th
se contact INFI
neral
erated with the e
operator servic
nclosure. Howev
eplaceable. Refe
r most possi-
contingency
maintenance
e safe installa-
ON.
closure re-
able parts or
r, the sensor
servicing to
14
tin
21e1 (2016-06)
Page 15

q
c
h
u
N
o
a
d
r
e
d
d
s
o
o
c
g
n
c
e
n
p
o
a
b
m
u
d
e
s
u
s
a
m
o
e
t
s
a
d
e
n
o
t
p
c
g
h
o
e
c
e
y
C
e
a
e
e
e
N
e
o
o
e
o
s
u
p
0
d
r
m
s
o
Do not modify
thorization of
turn the produ
ter to ensure t
this product if
WARNI
product prior t
After servicing
made by a qu
required, ensu
stitutions of no
or other hazar
made to this p
To reduce the
product to rain
and careful att
onto these pro
been damage
of the product
this product or su
ualified INFICON
t to an INFICON
at all safety feat
nauthorized mo
G! Source pow
performing any
this product, ens
lified service per
re that the parts
n-qualified parts
s. Use of unauth
oduct will void th
risk of fire or elec
or moisture. The
ntion must be p
ucts. Do not us
. Immediately co
if it is damaged.
bstitute any parts
service trained p
qualified service
res are maintain
ifications have b
r must be remov
ervicing.
re that all safety
on. When replac
e specified by I
ay result in fire,
rized parts or m
warranty.
ric shock, do not
e products are n
id to not spill any
these products if
tact INFICON to
without au-
rsonnel. Re-
nd repair cen-
d. Do not use
en made.
d from the
checks are
ment parts are
FICON Sub-
lectric shock
difications
expose this
t waterproof
type of liquid
they have
arrange return
2.2
Due to the po
mental conditi
compromised
odically inspe
ment groundin
trical insulatio
Safety Pre
Ensure that th
gauge is mou
Use an appro
Turn off power
module.
Turn off power
product is not
manual. Cont
service or trou
this operating
sibility of corrosi
ns, it is possible
ver time. It is im
ted for sound ele
. Do not use if t
has been compr
autions - S
vacuum port on
ted is electrically
riate power sour
to the unit befor
to the unit if a ca
perating normall
ct qualified INFI
leshooting condi
anual.
n when used in c
hat the product’s
ortant that the pr
trical connection
e equipment gro
mised.
rvice and O
which the PGE5
grounded.
e of 12 … 28 V (
attempting to se
ble or plug is da
according to thi
ON service pers
tion that may not
rtain environsafety could be
duct be peri-
and equip-
nding or elec-
eration
0 vacuum
c), 2 W.
vice the
aged or the
operating
nnel for any
be covered by
tinb21e
1 (2016-06)
15
Page 16

t
a
p
h
d
r
C
N
h
e
a
a
i
d
e
T
c
s
N
j
d
o
e
U
a
e
d
o
d
O
v
c
u
a
o
a
r
p
s
t
d
v
w
y
b
m
e
n
.
b
p
n
a
c
o
f
n
u
o
r
t
d
p
0
e
f
o
o
a
2.3
It is important
sound electric
use if the equi
compromised.
Do not use if t
been damage
instructions fo
Electrical
WARNI
system, a life t
less all expos
ground potenti
tact with the g
discharge with
high voltage di
A person coul
with an expos
age potential.
come in conta
(vacuum / pre
hat the product b
l connections an
ment grounding
e unit has been
. Contact INFIC
returning the pro
onditions
G! When high
hreatening electri
d electrical cond
l. This applies t
s contained in v
in a gaseous envi
rectly to any ung
be seriously inju
d, ungrounded el
his condition ap
t with the gas in
sure containmen
periodically ins
equipment grou
r electrical insul
ropped or the en
N for return auth
duct to INFICON
oltage is present
al shock hazard
ctors are maintai
all products that
cuum chambers.
ronment may co
ounded conducto
red or killed by c
ectrical conducto
lies to all produc
ide the vacuum c
vessel).
ected for
ding. Do not
tion has been
losure has
rization and
or evaluation.
in any vacuum
may exist un-
ed at earth
ome in conAn electrical
ple dangerous
r of electricity.
ming in contact
at high volt-
s that may
amber
2.3.1
16
Proper Equi
WARNI
ure or cause
Verify that the
module is mou
Electrician if y
Proper ground
well as intend
dule vacuum g
earth ground.
connection / fl
pment Groun
G! Hazardous
eath are present
vacuum port on
nted is electricall
u are in doubt a
ing of your equip
d operation of th
auge must be co
se a ground lug
nge if necessary
ing
oltages that coul
in many vacuum
hich the PGE50
grounded. Cons
out your equipm
ent is essential
equipment. The
nected directly t
on the PGE500 g
tin
seriously in-
rocesses.
vacuum gauge
ult a qualified
nt grounding.
r safety as
PGE500 mo-
a good quality
uge vacuum
21e1 (2016-06)
Page 17

N
v
m
t
u
e
o
t
e
u
N
o
v
g
n
e
a
p
a
e
l
d
t
o
e
e
d
m
o
n
e
w
b
e
o
a
-
v
f
c
a
e
x
s
s
o
p
c
a
u
r
t
n
d
2.3.2
WARNI
shock and bod
potential high
vacuum syste
Electrical In
It is the user’s
from this prod
for example, r
Always double
to automate y
sis of your sys
safety measur
age.
G! In order to p
ily harm, shield a
oltage electrical
.
erface and C
responsibility to
ct and any conn
lays and solenoi
check the syste
ur process. Perf
em design and e
s are taken to pr
rotect personnel
l conductors whi
ischarges in or
ntrol
nsure that the el
ctions made to e
s, are used in a
set-up before u
rm a hazardous
sure safeguards
vent injury and
rom electric
h are subject to
round the
ctrical signals
ternal devices,
afe manner.
ing any signals
peration analyand personnel
roperty dam-
2.4
Overpress
WARNI
limit the level
than what the
of withstandin
sures exceedi
In cases wher
condition, alw
ample, use a
eration where
sures if the pr
chamber.
re and use
G! Install suita
f pressure inside
acuum chamber
. INFICON gaug
g 1000 Torr abs
an equipment f
ys implement fail
ressure relief de
malfunction cou
ssure relief devic
ith hazardo
le protective devi
your vacuum ch
system compone
s should not be
lute pressure.
ilure could cause
safe system ope
ice in an automa
ld result in high i
e was not installe
us gases
es that will
mber to less
nts are capable
sed at pres-
a hazardous
ation. For ex-
ic backfill op-
ternal pres-
on the
tinb21e
1 (2016-06)
17
Page 18

v
v
e
e
t
o
b
O
w
u
e
a
s
o
z
s
m
e
o
e
N
g
a
o
m
o
T
s
e
s
g
c
a
y
)
a
a
l
l
s
a
h
d
o
g
m
r
a
O
g
c
b
x
a
o
e
,
b
o
v
o
v
c
d
r
g
o
b
p
s
f
d
r
t
a
c
The PGE500
pressures abo
(<2½ bars) pr
higher pressur
sure relief devi
conditions. Wi
tions may be l
pression fitting
vacuum cham
rected barome
CAUTI
device is allo
metric press
tings may rel
may cause le
tube to relea
vironment. T
amples of ha
vacuum/pres
environment,
age to equip
volume to pr
using hazard
acuum gauge m
e 20 psia (1000
ssure inside the
s, you should in
ce to protect the
h some fittings, a
wer; for example
may forcibly rele
er fitting with onl
tric (atmospheric
N! If the intern
ed to increase
re (atmospheric
ase and possib
ks that would a
e into the atmo
xic, pyrophoric
ardous gases t
ure containmen
could cause bo
ent. Never exp
ssure above loc
us gases.
dule is not intend
orr); DO NOT e
ensor. If your ch
tall an isolation v
auge tube from
tual safe overpr
, a quick-connect
se the gauge tu
a few psi over l
pressure.
l pressure of a
bove local unc
pressure side),
e overpressure
low the gas insi
phere of the sur
nd flammable
at if allowed to l
t vessel into the
ily injury and p
se the gauge tu
al atmospheric
ed for use at
ceed 35 psig
mber goes to
lve or pres-
verpressure
ssure condi-
O-ring com-
e from the
cal uncor-
acuum gauge
rrected baro-
acuum fit-
onditions
e the gauge
ounding en-
ases are ex-
ak out of the
atmospheric
ssible dam-
e internal
ressure when
2.5
Gases oth
WARNI
nitrogen (N2) o
tables.
INFICON gau
of nitrogen or
argon (Ar) or c
data for N
"Using the gau
Output" for a
18
r than Nitro
G! Do not atte
r air without refer
es and modules
ir. Do not attemp
arbon dioxide (C
to
2
ther gas is prope
ge with different
ore complete dis
en / air
pt to use with ga
ing to correction
re calibrated for
t to use with othe
) unless accura
2
rly used. Refer to
ases", "Display"
ussion.
tin
es other than
actor data
irect readout
gases such as
e conversion
sections titled
nd "Analog
21e1 (2016-06)
Page 19

N
s
a
y
e
c
o
o
a
E
u
s
P
e
a
g
E
P
m
t
m
u
r
e
c
e
n
n
e
a
o
p
w
c
e
e
t
s
o
n
o
h
o
a
,
x
f
3
3.1
WARNI
phere or in the
Do not use thi
combustible g
gauge normall
occur, the wir
ture of certain
cause an expl
Installati
Mechanic
G! Do not use t
presence of flam
device to meas
ses or gas mixtu
operates at 125
temperature cou
ombustible gas
sion which could
n
l Installation
his device in an e
mable gases, va
re the pressure o
es. The sensor
°C, but if malfun
ld exceed the igni
s and gas mixtur
result in serious i
plosive atmos-
ors or fumes.
explosive or
ire in the
tion should
tion tempera-
. This could
njury or death.
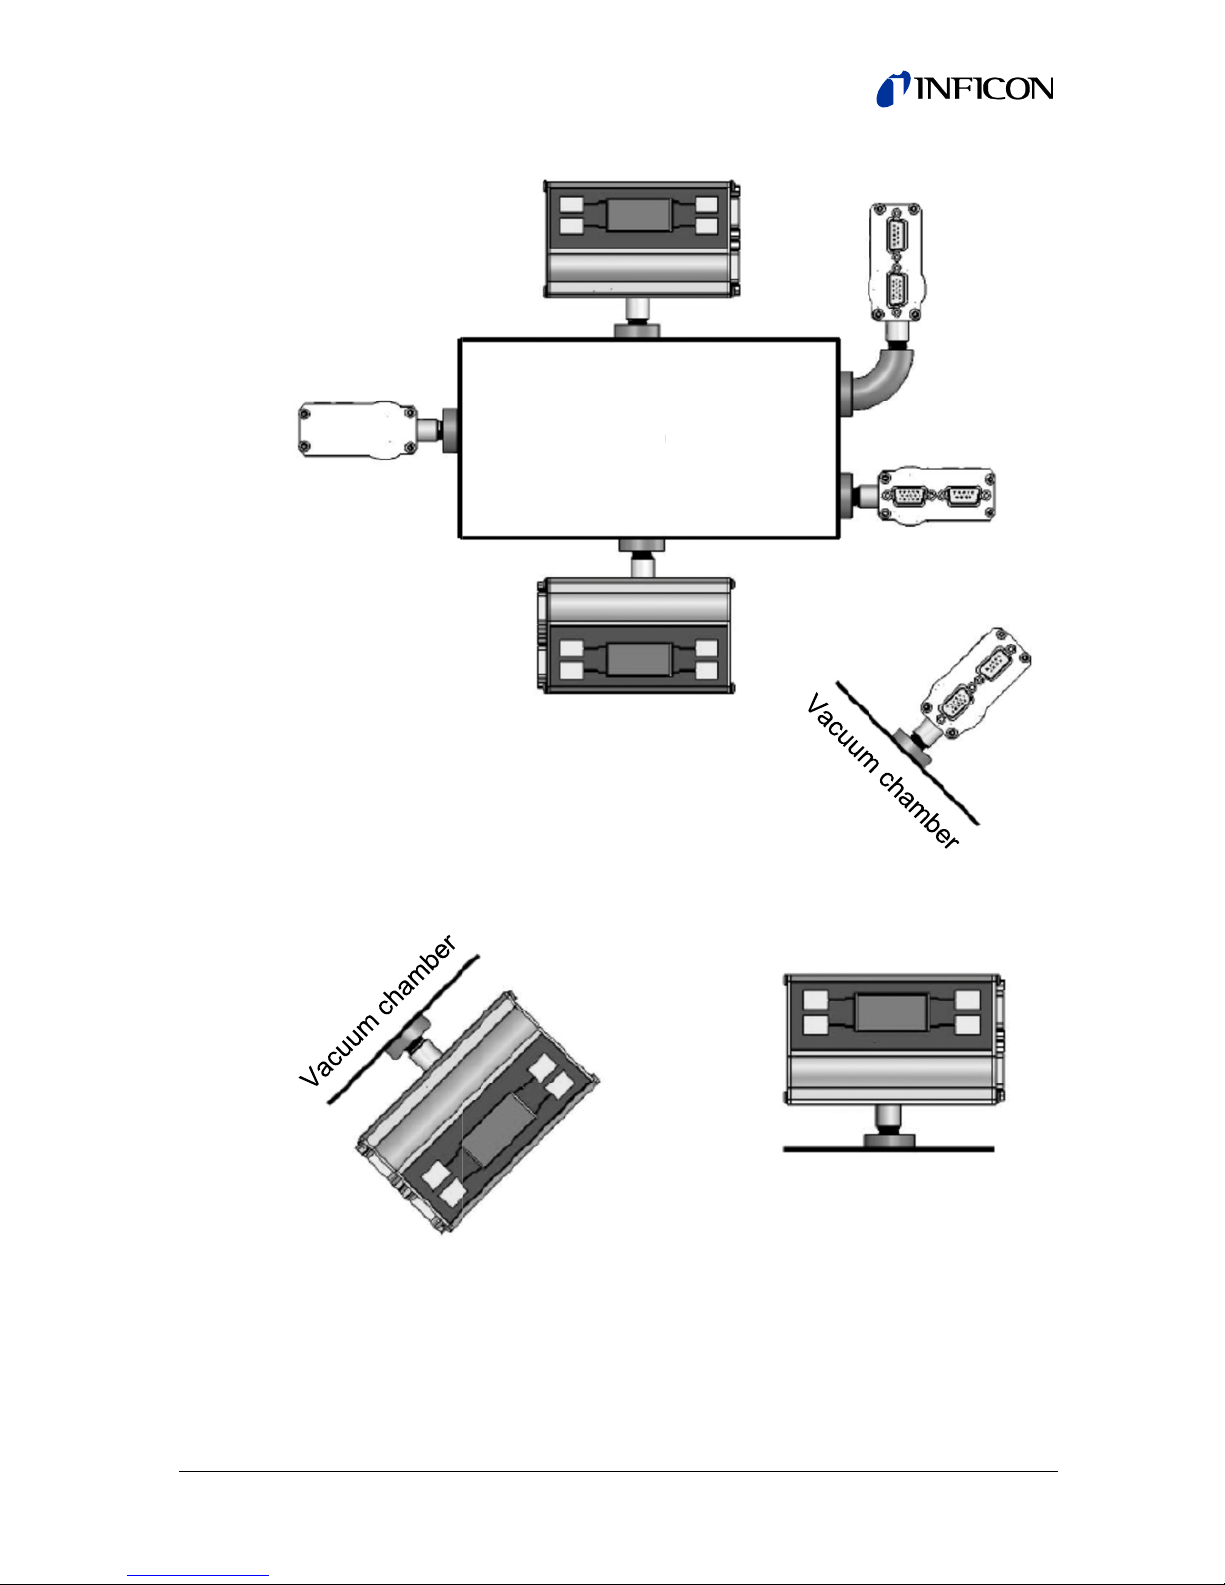
Mount the PG
want to measu
create a press
the gauge. Thi
changes.
Mounting the
cause measur
PGE500 near
air conditionin
Mount the PG
gram below).
the unit is not
position has lit
For accurate
horizontally as
500 as close as
re. Long or restri
re difference bet
may cause a d
GE500 too close
ment and contro
source of heati
vents.
500 with its mai
ressure reading
ounted horizont
le to no effect.
easurements ab
shown below:
possible to the pr
ted, small diame
ween your proce
lay in response t
to a gas source i
l instability. Do n
g or cooling, suc
(long) axis horiz
rrors may occur
lly. Below 1 Torr
ve 1 Torr, mount
ssure you
er tubing will
s chamber and
pressure
let may also
t mount the
as heaters or
ntal (see dia-
bove 1 Torr if
mounting
the gauge axis
tinb21e
1 (2016-06)
19
Page 20
n
E
n
w
a
b
o
r
m
r
Incorrect Orie
Vacuum ch
tation:
mbe
Mount the PG
the effect of a
gauge.
20
500 with port do
y particles or con
Vacuu
n, if possible, to
densation from c
tin
chambe
help minimize
llecting in the
21e1 (2016-06)
Page 21

t
V
a
g
o
a
o
o
o
e
a
e
e
r
a
g
h
s
n
h
g
o
e
e
e
r
t
d
c
m
o
e
u
i
a
e
n
a
a
y
3.2
3.2.1
Do not mount
sive vibration.
rement errors
the PGE500.
Flanges/ Fittin
and note the f
- NPT fittings:
apply a thread
with one-andas PTFE (Tefl
gauge port. D
age the gauge
Electrical I
Grounding
he PGE500 whe
ibrations may c
nd possible mec
s - follow the ma
llowing:
When connectin
sealant or wrap t
-half to two wrap
n®) tape and ha
not use a wrenc
.
nstallation
e it will be subjec
use unstable rea
hanical stress to
nufacturer's reco
the device using
e threaded porti
of pipe thread s
d tighten the ga
or other tool wh
ed to exces-
ings, measu-
omponents in
mendations
a NPT fitting,
n of the tubing
al tape such
ge into the
ch may dam-
Be sure
system are pr
operation of th
clamps must b
some vacuum
Teflon tape m
vacuum gaug
use a 12 gaug
gauge to a gro
low.
the vacuum gau
perly grounded f
equipment. Wh
e used to ensure
fittings such as N
y not allow for m
and the vacuum
or larger coppe
und lug on your v
e and the rest of
r safety as well
n using KF flang
proper grounding
PT connections i
tal-to-metal cont
chamber. If such
wire to connect t
acuum chamber
our vacuum
s intended
s, metal
. Be aware that
stalled using
ct between the
is the case,
he vacuum
s shown be-
tinb21e
1 (2016-06)
21
Page 22
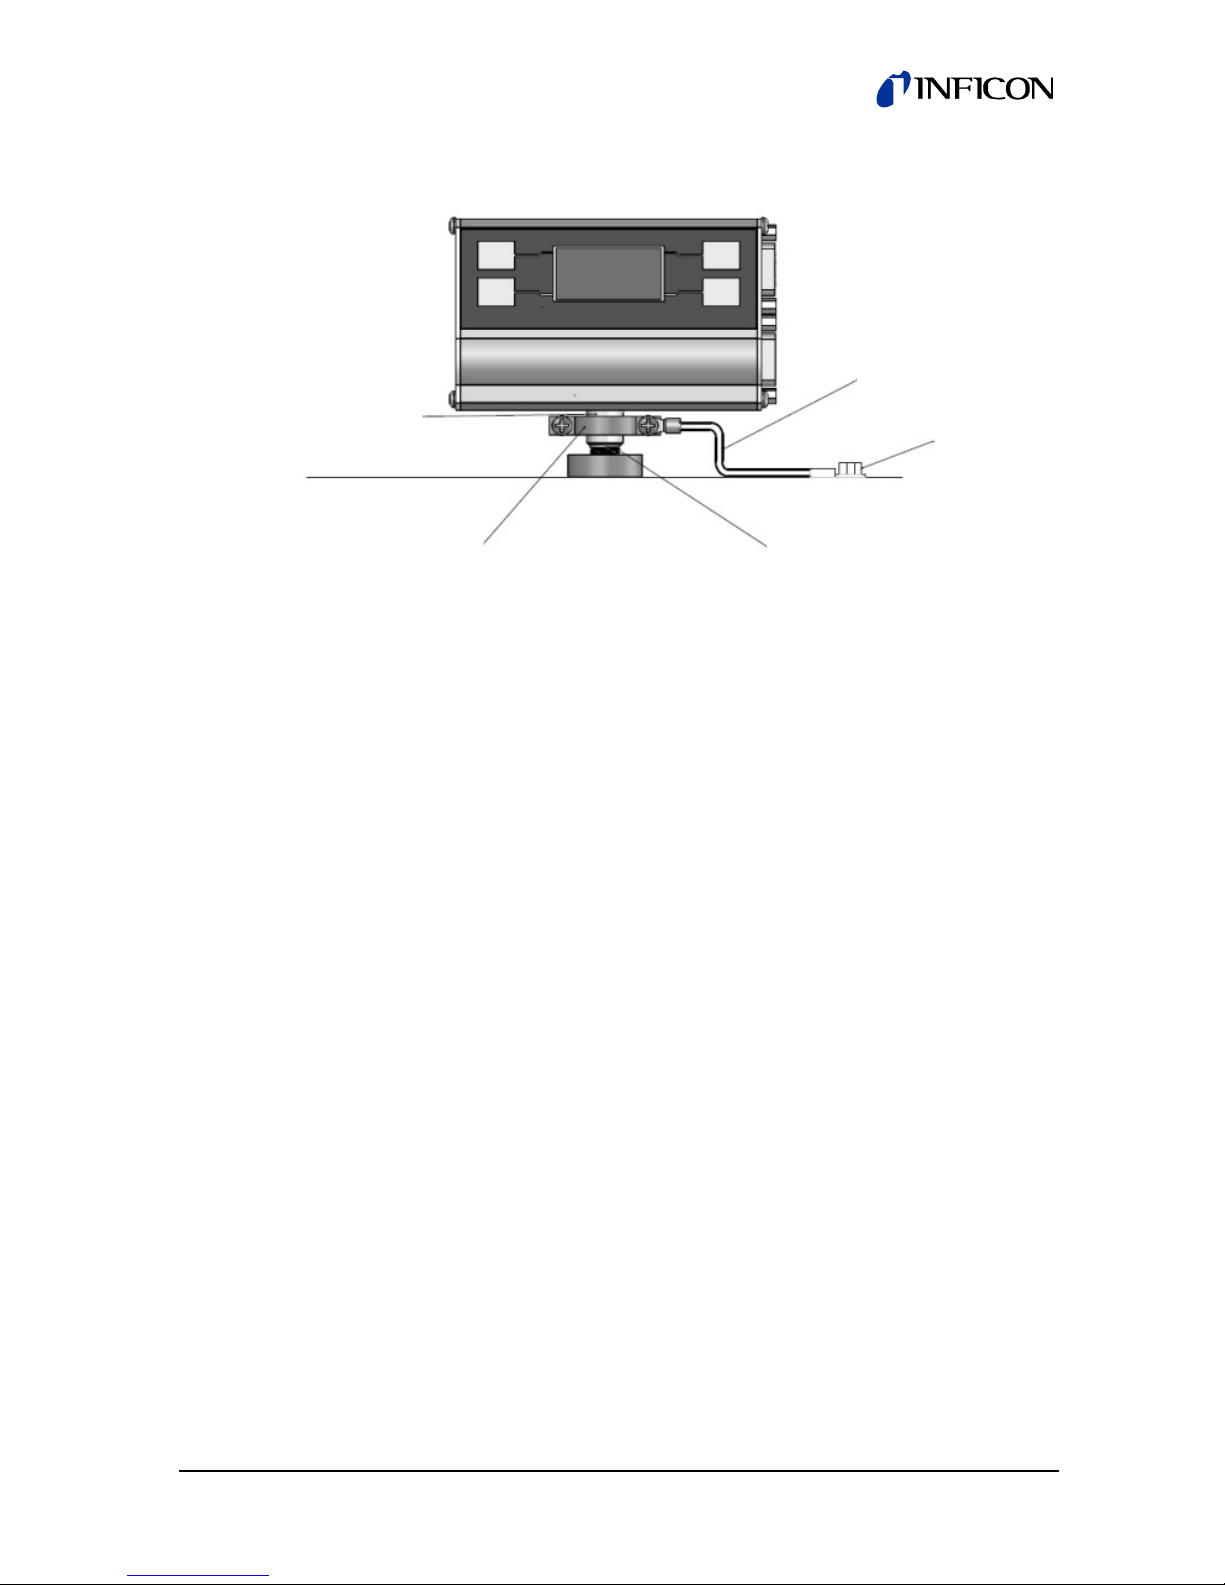
V
Gauge tube
Metal clamp or
metal hose clamp
Use 12 gauge or
larger ground wire
Ground lug
acuum
chamber
Vacuum gauge fitting
3.2.2 Electrical Connections
A good recommended practice is to remove power from any
cable prior to connecting or disconnecting it.
Do not connect power to both the 9-pin and 15-pin D-Sub connectors. Apply power only to one or the other. The INFICON
PGE500 will directly replace Granville-Phillips® Mini-Convectron® modules that have a 9-pin D-sub connector (DE-9P) or
15-pin D-sub connector (DE-15P), and you can use your existing
cables and electronics. For new installations, fabricate a cable to
connect to the signals/functions you want to use. When using
RS232 or RS485 serial communications, you must fabricate your
own cable according to the 15-pin D-Sub pinout shown below. A
standard off-the-shelf serial communications cable will not work.
All signals and pin assignments are described below:
22
tinb21e1 (2016-06)
Page 23

9-pin D-sub Connector pinout
Pin no. Pin description
1 Relay 1 Normally Open
2 Relay 1 Normally Closed
3 Supply (12…28 V (dc))
4 Power Ground
5 Analog Output 1 (Log-Linear 1…8 V, Log-Linear
1.15…10.215 V, or Non-linear Granville-Phillips®
Mini-Convectron® compatible)
6 Relay 1 Common
7 Relay Disable (Disables both Relays when
connected to pin 4 - Ground)
8 Analog Ground
9 Analog Output 2 (Programmable Linear 0…10 V)
tinb21e1 (2016-06) 23
Page 24

15-pin D-sub Connector pinout
Pin no. Pin description
1 RS485 DATA B (+) Input/output
2 RS485 DATA A (-) Input/output
3 Supply (12…28 V (dc))
4 Power Ground (Also when using serial
communications, this pin is typically connected to
pin # 5 of your PC RS232 serial port 9-pin D-sub
connector, or ground pin of your RS485 converter)
5 Analog Output 1 (Log-Linear 1…8 V, Log-Linear
1.15…10.215 V, or Non-linear Granville-Phillips®
Mini-Convectron ®compatible)
6 Analog Ground
7 RS232 TX (This pin is typically connected to pin
# 2 of your PC serial port 9-pin D-sub connector)
8 RS232 RX (This pin is typically connected to pin
# 3 of your PC serial port 9-pin D-sub connector)
9 Relay Disable (Disables both Relays when
connected to pin 4 - Ground)
10 Relay 1 Normally Open
11 Relay 2 Normally Open
12 Relay 2 Common
13 Relay 2 Normally Closed
14 Relay 1 Normally Closed
15 Relay 1 Common
24
tinb21e1 (2016-06)
Page 25

4 Setup and Operation
4.1 Initial Setup
Two of the most important steps for the initial setup of the gauge
are to set zero (SET VAC) and set atmosphere (SET ATM) as
described in the Programming section 4.3 below. This will ensure proper operation of the gauge and accurate pressure measurements. The gauge is calibrated at the factory using nitrogen.
Furthermore, the gauge is also installed in a certain orientation
when calibrated at the factory. Without setting zero and atmosphere after the gauge is installed in your system, the gauge may
not display the expected and correct pressures. This could be
caused by the fact that you may be using a different gas than
Nitrogen such as air to setup and calibrate the gauge (most commonly the case) and the gauge orientation is different than the
orientation used at the factory. As such, it is very important to
perform your own initial setup and calibration by setting zero and
atmosphere with the gauge installed in your actual system.
Please note the following:
Setting zero (SET VAC): Setting zero optimizes performance of
the gauge when operating at a low pressure range of
1.00×10
sure is higher than 1.00×10
-4
Torr to 1.00×10⁻³ Torr. If your minimum operating pres-
-3
Torr, it is not normally necessary to
set zero and thus setting atmosphere should be adequate. If you
are able to evacuate your system to below 1.00×10
-4
Torr, it is
always a good practice to check and set zero if necessary. See
"SET VAC" in section 4.3.
Setting Atmosphere (SET ATM): Setting atmosphere is the
most important step for a newly installed gauge. If you prefer to
use air to set atmosphere, vent your vacuum system chamber to
expose the gauge to the local atmospheric pressure (air) and set
atmosphere to match your known local uncorrected barometric
pressure (air). This is the reading of ambient air pressure you will
expect if you were to vent and open your vacuum chamber to the
atmosphere surrounding the outside of your chamber. At sea
level, this pressure is usually near 760 Torr.
tinb21e1 (2016-06) 25
Page 26

a
t
c
s
e
f
p
o
f
f
p
n
d
r
t
h
t
o
h
e
e
n
o
s
e
a
D
y
n
c
b
e
r
o
o
e
b
g
t
v
e
t
i
k
e
4.2
At elevations
your local avia
local weather
ed barometric
"SET ATM" in
Note - Setting
once during th
periodically. A
the initial setu
(warm-up) bef
User Inter
bove sea level, t
ion authority or a
onditions online
pressure if you d
ection 4.3.
zero and atmosp
initial setup and
ter power has be
, allow five minut
re setting zero a
ace Basics
e pressure decr
irport web sites o
o help find your l
not have this inf
ere is normally r
maybe checked
n applied to the
s for the gauge
d atmosphere.
ases. Check
your current
cal uncorrect-
rmation. See
quired only
y the user
auge during
o stabilize
The user inter
progression of
explanation of
There are four
side of the dis
the various fu
PGE500, the
sents.
To begin prog
play will indica
by the function
of the paramet
Programmi
ace is designed f
setup parameter
operation for add
soft-keys located
lay. These keys
ctions available.
isplay will identif
amming, press a
e a choice of fun
on the display to
er desired.
ng soft-keys
r easy operation
. This section gi
d clarity.
on the front pan
re used to selec
uring programm
what function ea
y one of the four
tions. Press the
continue with th
and a natural
es a brief
l, two on each
and program
ng of the
h key repre-
keys. The dis-
ey indicated
programming
26
tin
21e1 (2016-06)
Page 27

After setting the various parameters, press the SAVE key to
save the new setting and return to the main screen. To continue
setting additional parameters, scroll forward with the MORE key
until you reach the desired parameter.
4.3 Programming
SET VAC
NOTICE
When operating in units of either mbar or
pascals (Pa), you must perform SET ATM before setting the
vacuum reading (SET VAC). See SET ATM below. Failure to
do so will result in improper operation of the gauge. If you
change units of measure or reset to factory defaults, then this
same procedure must be followed again if the units of measure are being set to either mbar or Pa.
1) To properly set the vacuum reading ("zero" point), with the
PGE500 installed on your vacuum system, the gauge should
be evacuated to a pressure below 1.00×10
-4
Torr.
2) Go to the SET VAC screen. When the vacuum system pressure is below 1.00×10
-4
Torr, press the PRESS TO SET
VAC key. The zero point (displayed pressure reading with
gauge exposed to vacuum) is now set.
UNITS [Factory default = as ordered]
The unit comes factory preset as ordered. If you like to switch to
another unit, this should be the first parameter that is set. This
will be the units-of-measure (mBAR, TORR, PASCAl) that are
used for all other settings. If your PGE500 has been previously
configured and relay setpoints and linear analog output pressure
settings have been programmed, changing units-of-measure will
return the relays setpoints and the linear analog output pressure
settings to factory default setting values in TORR. In this case,
you must reprogram the relay setpoints and linear analog output
pressure settings in the newly programmed units-of-measure.
tinb21e1 (2016-06) 27
Page 28

SET ATM
1) To set the atmospheric pressure reading (also known as the
"span" adjustment), flow nitrogen gas or air into your closed
vacuum chamber to allow the pressure to rise to a known
value above 400 Torr. Alternatively, if your local uncorrected
barometric pressure (air) is known, simply vent your vacuum
system chamber to expose the gauge to the local atmospheric pressure.
2) Go to the SET ATM screen. When the desired pressure is
stable, adjust the displayed pressure reading on the
PGE500 to the known value using the INCR (increase) or
DECR (decrease) keys. Press the SAVE key to save the
new atmospheric (span) pressure value. For example, if your
known local uncorrected barometric pressure is 760 Torr,
enter 760 in the SET ATM screen. The main pressure measurement screen will now display 760 Torr while the gauge
is at atmosphere.
It is good practice to perform the sequence of checking and
adjusting span (ATM) then zero (VAC) and then, finally rechecking the span setting to ensure that the circuitry is
properly balanced for use in measuring pressure throughout
the intended measurement range.
SP1 ON and SP2 ON [Factory default = 100 mTORR]
These setpoints correspond to the pressures at which the relays
will turn on (energize). The relays will turn on when the pressure
is below the programmed pressure value. If you are unable to
increase the values of SP1 ON or SP2 ON , you must first go to
SP1 OFF or SP2 OFF and increase those values to a number
higher than the values of SP1 ON or SP2 ON you are trying to
set.
28
tinb21e1 (2016-06)
Page 29

SP1 OFF and SP2 OFF [Factory default = 200 mTORR]
These setpoints correspond to the pressures at which the relays
will turn off (de-energize). The relays will turn off when the pressure is above the programmed pressure value. If you are unable
to decrease the values of SP1 OFF or SP2 OFF, you must first
go to SP1 ON or SP2 ON and decrease those values to a number lower than the values of SP1 OFF or SP2 OFF you are trying
to set.
RS485 ADDR [Factory default = 1]
This is the lower nibble of the one byte RS485 device address.
Assuming the address offset (RS485 OFFSET) is equal to 0,
setting the ADDR to a 5 will make the address be 0x05 in hexadecimal. A 15 will set the ADDR to 0x0F in hexadecimal. Note
that the address (ADDR) must be used even when sending
RS232 commands.
RS485 OFFSET [Factory default = 0]
This is the upper nibble of the one byte RS485 address. Assuming the address (ADDR) is 0, setting the address offset (RS485
OFFSET) to a 5 will make the address be 0x50 hexadecimal.
Setting the address offset to 15 will make the device address be
0xF0 hexadecimal.
┌----------------BINARY ADDRESS-----------┐
ADDRESS
DECIMAL
ADDR OFFSET
1 0 0 0 0 0 0 0 1 01
5 0 0 0 0 0 1 0 1 05
15 0 0 0 0 1 1 1 1 0F
16 0 0 0 1 0 0 0 0 F0
┌-----------------------ONE BYTE-------------------┐ ADDRESS
HEXA-
DECIMAL
┌Upper nibble┐
(BINARY)
ADDR
┌Lower nibble┐
tinb21e1 (2016-06) 29
Page 30

BAUD [Factory default = 19,200]
This sets the baud rate for the RS485 and the RS232 serial communications. The baud rate can be set to various values through
the serial interface or via the front panel soft-keys. The parity can
only be changed through the serial interface command set.
When this occurs, the current setting will be shown in the list of
choices and can be re-selected if changed.
SET LINEAR
[Factory default = 0.01 VOLTS to 10 VOLTS corresponding to 1
mTORR to 1 TORR]
This will take the user to four different screens to setup the linear
analog output (see Analog Output section).
a) Set the minimum pressure
b) Set the minimum voltage corresponding to the minimum
pressure
c) Set the maximum pressure
d) Set the maximum voltage corresponding to the maximum
pressure
Note - The LINEAR analog output provides a linear 0…10 V (dc)
output signal. The linear output voltage can be any value between 10 mV and 10 V corresponding to displayed pressure
between 1 mTorr and 1000 Torr. However, the useful range of
the linear analog output is three decades. If your application
requires the analog output to cover a pressure range exceeding
three decades then consider using the non-linear or the loglinear analog output. See ANALOG TYPE menu below to select
log-linear or non-linear analog output.
INFO
This screen shows the unit software version.
30
tinb21e1 (2016-06)
Page 31

ANALOG TYPE [Factory default = as ordered]
Select "NONLIN" for non-linear (S-Curve) or "LOG" for log-linear
analog output (See Analog Output section).
AOUT CAL [Factory default = Factory Set]
This has been pre-set in the factory and is used to optimize the
analog output calibration. It is recommended that the user not
make this adjustment unless the displayed pressure on the
PGE500 and the resulting pressure calculation from the analog
output do not match closely. To perform this adjustment, connect
the PGE500 analog output to a high resolution voltmeter, your
system, PLC, etc. While in the AOUT CAL screen and with the
gauge exposed to atmosphere, use the INC or DECR soft-keys
to adjust the analog output to match the corresponding pressure
displayed on the screen. Example: The PGE500 ANALOG TYPE
menu above is set to LOG. In the AOUT CAL screen, the atmospheric pressure is displayed at 760 Torr. Based on the equation
and table given in section 7.3 the expected analog output at
760 Torr is 7.881 V. Use the INC or DECR soft-keys in the
AOUT CAL screen to set the analog output to 7.881 V as recorded by your voltmeter, PLC, etc. Alternatively, if the analog
output is used to display the pressure in your PLC or system
display console, adjust the AOUT CAL while the gauge is exposed to atmosphere so that the atmospheric pressure displayed
by your PLC matches the atmospheric pressure displayed by the
PGE500. The AOUT CAL can be performed at any pressure
between 400… 999 Torr (atmosphere recommended).
SCREEN SAVER [Factory default = ON]
The PGE500 uses an OLED type display which over an extended period of time can start to show divergence between
pixels that are on at all times verses pixels that are not. This
could result in pixels exhibiting a burned-in effect. To minimize
the burned-in effect, a screen saver function can be activated by
programming the SCREEN SAVER menu selection to ON. With
the screen saver function turned on, the display appearance
changes every 12 hours. The display will appear in the normal
mode with a dark background color for the first 12 hours and will
tinb21e1 (2016-06) 31
Page 32

then switch to a back-lit background color for the next 12 hours.
If you like to have the 12 hour period for the normal display
mode to start at a specific time of the day, simply access the
SCREEN SAVER menu and change setting to OFF and then ON
again. This initiates the screen saver function immediately.
Note - To increase longevity of the OLED display, INFICON
recommends that the screen saver function remains ON as
shipped from the factory.
AOUT OFFSET
It is recommended that the user not make this adjustment unless
it is critical for your application that when the display of PGE500
reads zero (0.00 mTorr), your data acquisition system (using the
analog output from the PGE500) also registers a pressure reading of exactly zero. Please note that adjusting the AOUT
OFFSET will affect the analog output calibration at atmosphere
(see AOUT CAL menu above). As such, avoid changing the
AOUT OFFSET unless it is critical for display and analog output
to exactly match when the displayed pressure is zero.
To perform this adjustment, pump your system down to below
0.1 mTorr and SET VAC (zero) so that the PGE500 displayed
pressure shows 0.0 mTorr. Connect the PGE500 analog output
to a high resolution voltmeter, your system, PLC, etc. While in
the AOUT OFFSET screen, use the INC or DECR soft-keys to
adjust the analog output to match the corresponding zero
pressure displayed on the screen.
Example 1: The PGE500 ANALOG TYPE menu above is set to
LOG. In the AOUT OFFSET screen, the pressure is displayed at
0.00 mTorr. The expected analog output at 0.00 mTorr is
0.954 V. Use the INC or DECR soft-keys in the AOUT CAL
screen to set the analog output to 0.954 V as recorded by your
voltmeter, PLC, etc. Alternatively, if the analog output is used to
display the pressure in your PLC or system display console,
adjust the AOUT OFFSET so that your PLC also reads
0.0 mTorr.
Example 2: The PGE500 ANALOG TYPE menu above is set to
NONLIN (Non-Linear). In the AOUT OFFSET screen, the pressure is displayed at 0.00 mTorr. Based on the equation and table
given in section 7.1 the expected analog output at 0.00 mTorr is
0.375 V. Use the INC or DECR soft-keys in the AOUT CAL
32
tinb21e1 (2016-06)
Page 33

screen to set the analog output to 0.375 V as recorded by your
voltmeter, PLC, etc. Alternatively, if the analog output is used to
display the pressure in your PLC or system display console,
adjust the AOUT OFFSET so that your PLC also reads
0.0 mTorr.
4.4 Return to Factory Default Settings
You can reset all values to the original factory default settings by
simultaneously pressing the upper left and upper right soft-keys.
The user will then be prompted "Set Factory Defaults?" Choose
Yes or No.
If you reset all values to original factory default settings, you
would need to repeat the initial setup procedure as described in
section 4.1 and reprogram other parameters as required.
tinb21e1 (2016-06) 33
Page 34

d
N
t
i
o
N
a
u
m
b
u
p
a
m
c
s
a
c
n
o
t
a
u
a
h
e
u
r
o
s
d
a
e
c
g
T
n
o
c
g
h
a
n
N
s
n
e
a
e
a
w
b
a
h
g
n
u
o
o
f
d
g
u
e
r
e
h
a
o
a
g
r
t
b
p
e
n
t
t
t
o
5
Using the
A thermal con
on the thermal
Since different
ductivities, the
be different. I
mal conductivi
When a gas ot
for the differen
and the gas in
indicate how d
an INFICON c
WARNI
gases other th
death or serio
manual when
gauge wit
uctivity gauge s
conductivity of th
gases, and mixt
indicated pressu
FICON convecti
y gauges) are ca
her than N
ce in thermal con
use. The charts
ifferent gases aff
nvection gauge.
G! Using a ther
n that for which i
s injury. Be sure
easuring pressu
/ air i
2
different g
nses heat loss w
e gas surroundin
res, have differe
e readings and o
n gauges (and m
librated using nitr
used, correction
uctivity between
nd tables on the
ct the display an
mal conductivity
t is calibrated co
to use gas correc
res of gases oth
ses
ich depends
the sensor.
t thermal con-
tputs will also
st other thergen (N2).
must be made
nitrogen (N
ollowing pages
output from
auge with
ld result in
ion data in this
r than N
/ air.
2
)
2
For N2 the cali
dicated and tr
1000 Torr. At
the different g
these low pres
between ther
At pressures a
diverge signifi
currents in the
loss from the
geometry and
Generally, air
thermal condu
ences in readi
ing a system t
change by 30
gradually displ
the effect is m
ous condition
ration shows ex
e pressure throu
ressures below 1
ses are similar.
sures is a consta
al conductivities
bove 1 Torr, indi
antly. At these hi
gauge become t
ensor and calibr
mounting positio
nd N2 are consid
tivity, but even
gs at higher pre
atmosphere usi
o 40 Torr after th
ces the N2 in th
ch more signific
s described belo
ellent agreement
hout the range f
Torr, the calibrat
he difference in r
t, a function of t
f the gases.
ated pressure re
her pressures c
e predominant c
tion depends on
as well as gas p
ered the same wi
and air will exhi
2
sures. For exam
g N2, you may s
chamber is ope
gauge. For mos
nt and may resul
.
between in-
m 10-4 to
ion curves for
adings at
e difference
dings may
nvection
use of heat
auge tube
operties.
h respect to
it slight differ-
le, when vent-
e readings
ed and air
other gases
in a hazard-
34
tin
21e1 (2016-06)
Page 35

e
r
N
e
c
u
e
g
d
u
a
t
s
h
a
c
g
s
,
a
s
s
o
r
t
o
f
s
u
m
o
y
r
e
h
d
n
a
e
o
t
o
o
k
h
s
s
s
r
t
r
Other consid
Flammable o
WARNI
trinsically safe
in the presenc
Under normal
convection ga
gases. Howev
ergy could be
ignite or explo
convection ga
or explosive g
Moisture / wa
In some proce
tion may not c
Water vapor c
gauge and cor
other gas.
rations when u
explosive gase
G! INFICON co
nor explosion pr
of flammable o
onditions the vol
ges are too low t
r, under certain
enerated to cau
e. Thermal cond
ges are not reco
ses.
er vapor
ses (lyophilizati
ange significantl
n significantly ch
rection should be
ing gases other
nvection gauges
of and are not int
explosive gases
ages and curren
cause ignition
ailure conditions,
e flammable vap
ctivity gauges li
mended for use
n, for example) t
, except for mois
ange the respon
made, as you wo
than N2 / air
re neither in-
nded for use
r vapors.
s in INFICON
f flammable
sufficient en-
rs or gases to
e the INFICON
with flammable
e gas composi-
ure content.
e of a thermal
uld for any
Other contam
If your gases
calibration and
ally, if the gau
these change
zero and span
for evaluation
inants
ondense, coat, o
response to diff
e can be "calibra
are small enoug
the gauge shoul
nd possible clea
corrode the sen
rent gases will ch
ted" ("zero" and "
to be ignored. If
be replaced or
ing.
or, the gauge
ange. Gene
-
pan" settings),
you can’t set
eturn to factory
tinb21e1 (2016-06)
35
Page 36

t
o
s
e
t
a
h
e
o
d
t
r
t
g
k
e
s
d
f
t
n
n
r
A
m
6
o
b
2
a
e
o
o
®
o
t
r
e
,
s
f
o
Indicated vs.
rue total pressu
re (test gases N
, Ar, He)
Gas Correcti
The Y- axis of
by a capacitan
true total pres
is the pressur
test. This char
gauge (CVG)
illustrate that t
types of gaug
CAUTION! D
gauges which
section 6.1 an
Example A: If
sure is 500 To
Example B: If
100 Torr, the
If you are bac
system reach
will be reading
n Chart
the above chart i
ce manometer, a
ure independent
reading indicate
shows readings
nd Granville-Phil
e difference in th
s is virtually indis
not assume this
may or may not b
note the followi
he gas is nitroge
r, the gauge will
he gas is argon (
auge will read ab
filling your vacuu
s a pressure of 7
about 23 Torr. C
actual pressure
diaphragm gaug
of gas compositi
by the convecti
or an INFICON c
lips® Convectron
e response for b
inguishable.
data applies to o
e the same. Refe
g examples:
(N2), when the t
ead 500 Torr.
r), when the tru
out 9 Torr.
system with Ar
0 Torr true pres
ntinuing to back
s measured
that measures
n. The X-axis
n gauge under
nvection
gauge to
th of these
her convection
to the table in
ue total pres-
pressure is
when your
ure your gauge
ill your system,
36
tin
21e1 (2016-06)
Page 37

attempting to increase the reading up to 760 Torr, you will over
pressurize your chamber which may present a hazard.
Example C: If the gas is helium (He), the gauge will over pressure (OP) when pressure reaches about 10 Torr true pressure
and opening the chamber to atmosphere prematurely may present other hazards for both people and product.
CAUTION! What these examples illustrate is that using gases
other than nitrogen (N
) without using accurate gas conversion
2
data and other proper precautions could result in injury to personnel and/or damage to equipment.
Suggested precautions when using gases other than
nitrogen (N
):
2
Install a pressure relief valve or burst disk on your chamber, to
protect it from overpressure. Post a warning label on your gauge
readout that states "Do Not Exceed ____ Torr Indicated Pressure" (fill in the blank for maximum indicated pressure for the gas
you use) so that an operator using the gauge will not exceed a
safe pressure.
6 Display
6.1 Display - Torr / mTorr
Displayed pressure readings vs. true pressure for selected
gases - engineering units in Torr / mTorr (see following table):
Pressure shown in bold italic font in the shaded areas are in
mTorr.
Pressure shown in normal font in non shaded areas are in Torr.
tinb21e1 (2016-06) 37
Page 38

4
CH
0.0
0.1
0.2
0.5
1.7
3.3
7.7
15.3
30.4
77.2
159
Ne
2
D
22
Freon
12
Freon
KR
2
CO
2
O
0.0
0.0
0.0
0.0
0.0
0.0
0.1
0.1
0.1
0.1
0.1
0.1
0.2
0.2
0.2
0.2
0.2
0.2
0.5
0.5
0.5
0.5
0.5
0.5
0.7
1.3
1.5
1.5
0.4
1.1
1.5
2.4
3.1
3.1
1.0
2.3
3.5
6.0
7.0
7.6
2.3
4.4
7.1
12.1
13.5
14.7
4.8
11.0
14.1
24.3
27.2
29.9
9.5
22.2
34.8
60.0
69.0
72.5
23.5
54.9
70.0
121
136
143
46.8
107
(continued)
0.0
0.1
0.2
0.5
1.0
2.0
5.0
9.7
19.8
49.2
97.2
He
Ar
2
N
Pressure
True Total
0.0
0.0
0.0
0.1
0.1
0.1
[Torr / mTorr]
0 mTorr
0.1 mTorr
38
0.2
0.2
0.2
0.2 mTorr
0.5
0.5
0.5
0.5 mTorr
0.8
0.7
1.0
1 mTorr
1.6
1.4
2.0
2 mTorr
4.0
3.3
5.0
5 mTorr
8.1
6.6
10.0
10 mTorr
16.1
13.1
20.0
20 mTorr
tinb21e1 (2016-06)
40.5
32.4
50.0
50 mTorr
82.0
64.3
100
100 mTorr
Page 39

4
CH
315
781
1.60
3.33
7.53
27.9
355
842
OP
OP
Ne
2
D
22
Freon
12
Freon
KR
2
CO
2
O
141
250
262
275
91.1
210
194
359
687
594
611
217
489
486
745
1.55
1.04
1.05
400
950
970
1.59
4.13
1.66
1.62
700
1.71
1.94
5.24
246
2.62
2.45
1.28
3.34
4.98
21.5
OP
3.39
2.96
1.78
4.97
10.3
584
OP
3.72
3.32
2.29
6.59
22.3
OP
OP
4.14
3.79
2.57
8.22
77.6
OP
OP
4.91
4.68
2.74
9.25
209
OP
OP
6.42
5.99
3.32
12.3
(continued)
295
He
Ar
2
N
165
126
200
Table "Displayed pressure readings vs. true pressure - units in Torr / mTorr" (continued)
Pressure
True Total
[Torr / mTorr]
tinb21e1 (2016-06) 39
200 mTorr
435
312
500
500 mTorr
940
600
1.00
1 Torr
2.22
1.14
2.00
2 Torr
13.5
2.45
5.00
5 Torr
OP
4.0
10.0
10 Torr
OP
5.80
20.0
20 Torr
OP
7.85
50.0
50 Torr
OP
8.83
100
100 Torr
OP
9.79
200
200 Torr
Page 40

4
CH
OP
OP
OP
OP
OP
OP
OP
OP
OP
Ne
2
D
22
Freon
12
Freon
KR
2
CO
2
O
OP
OP
7.52
6.89
3.59
16.9
380
OP
OP
8.42
7.63
3.94
22.4
485
OP
OP
9.21
8.28
4.21
28.7
604
OP
OP
9.95
8.86
4.44
36.4
730
OP
OP
10.7
9.42
4.65
46.1
859
OP
OP
11.1
9.76
4.75
53.9
941
OP
OP
11.4
9.95
4.84
59.4
997
OP
OP
12.0
10.5
4.99
79.5
OP
OP
OP
12.7
11.1
5.08
111
OP
He
Ar
2
N
Table "Displayed pressure readings vs. true pressure - units in Torr / mTorr" (concluded)
Pressure
True Total
[Torr / mTorr]
40
OP
11.3
300
300 Torr
OP
13.5
400
400 Torr
OP
16.1
500
500 Torr
OP
18.8
600
600 Torr
OP
21.8
700
700 Torr
OP
23.7
760
760 Torr
OP
25.1
800
800 Torr
tinb21e1 (2016-06)
OP
28.5
900
900 Torr
OP
32.5
1000
1000 Torr
Page 41

Notes:
1) OP = overpressure indication: display will read over pressure
2) Display auto-ranges between Torr and mTorr at 1 Torr
Examples:
1) Gas used is nitrogen (N
surement of 10 Torr. True pressure of nitrogen is 10 Torr.
2) Gas used is argon (Ar). Display shows pressure measurement of 600 mTorr. True pressure of argon is 1 Torr.
3) Gas used is oxygen (O
ment of 486 mTorr. True pressure of oxygen is 500 mTorr.
6.2 Display - mbar
The table below shows the displayed readings at various pressures for selected gases when engineering units selected is in
mbar.
Displayed pressure readings vs. true pressure for selected
gases - engineering units in mbar (see following table):
). Display shows pressure mea-
2
). Display shows pressure measure-
2
tinb21e1 (2016-06) 41
Page 42

4
CH
0.0
.0001
.0003
.0006
.0023
.0044
.0102
.0203
.0405
.0100
0.210
Ne
2
D
22
Freon
12
Freon
KR
2
CO
2
O
0.0
0.0
0.0
0.0
0.0
0.0
.0001
.0001
.0001
.0001
.0001
.0001
.0003
.0003
.0003
.0003
.0003
.0003
.0006
.0006
.0006
.0006
.0004
.0006
.0009
.0017
.0020
.0020
.0005
.0015
.0020
.0032
.0041
.0041
.0013
.0031
.0047
.0080
.0093
.0101
.0031
.0059
.0095
.0161
.0179
.0195
.0064
.0146
.0187
.0323
.0362
.0398
.0126
.0295
.0463
.0799
.0919
.0966
.0313
.0731
0.100
0.160
0.180
0.190
0.0623
0.140
(continued)
0.0
.0001
.0003
.0006
.0013
.0027
.0067
.0129
.0263
.0655
0.120
He
Ar
2
N
0.0
0.0
0.0
.0001
.0001
.0001
0
[mbar]
.0001
True Pressure
42
.0003
.0003
.0003
.0003
.0006
.0006
.0006
.0006
.0011
.0009
.0013
.0013
.0021
.0019
.0027
.0027
.0053
.0044
.0067
.0067
.0107
.0088
.0133
.0133
.0214
.0174
.0206
.0206
tinb21e1 (2016-06)
.0539
.0431
.0666
.0666
0.110
.0857
0.130
0.130
Page 43

4
CH
0.410
1.04
2.13
4.43
10.0
37.1
473
1012
OP
OP
Ne
2
D
22
Freon
12
Freon
KR
2
CO
2
O
0.180
0.330
0.340
0.360
0.120
0.270
0.470
0.910
0.790
0.810
0.280
0.650
0.990
2.06
1.38
1.39
0.530
1.26
2.11
5.50
2.21
2.15
0.930
2.27
6.98
327
3.49
3.26
1.70
4.45
28.6
OP
4.51
3.94
2.37
6.62
778
OP
4.95
4.42
3.05
8.78
OP
OP
5.51
5.05
3.42
10.9
OP
OP
6.54
6.23
3.65
12.3
OP
OP
8.55
7.98
4.42
16.3
(continued)
0.250
0.640
1.29
2.58
6.63
13.7
29.7
103
278
393
He
0.210
Ar
0.160
2
N
0.260
Table "Displayed pressure readings vs. true pressure - units in mbar" (continued)
[mbar]
0.260
True Pressure
tinb21e1 (2016-06) 43
0.570
0.410
0.666
0.666
1.25
0.790
1.33
1.33
2.95
1.51
2.66
2.66
17.9
3.26
6.66
6.66
OP
5.33
13.3
13.3
OP
7.73
26.6
26.6
OP
10.4
66.6
66.6
OP
11.7
133
133
OP
13.0
266
266
Page 44

4
CH
OP
OP
OP
OP
OP
OP
OP
OP
OP
Ne
2
D
22
Freon
12
Freon
KR
2
CO
2
O
OP
OP
10.0
9.18
4.78
22.5
506
OP
OP
11.2
10.1
5.25
29.8
646
OP
OP
12.2
11.0
5.61
38.2
805
OP
OP
13.2
11.8
5.91
48.5
973
OP
OP
14.2
12.5
6.19
61.4
1140
OP
OP
14.7
13.0
6.33
71.8
1250
OP
OP
15.1
13.2
6.45
79.1
1320
OP
OP
16.0
13.9
6.65
105
OP
OP
OP
16.9
14.7
6.77
147
OP
He
Ar
2
N
Table "Displayed pressure readings vs. true pressure - units in mbar" (concluded)
[mbar]
True Pressure
44
OP
15.0
400
400
OP
17.9
533
533
OP
21.4
666
666
OP
25.0
800
800
OP
29.0
933
933
OP
31.5
1011
1011
OP
33.4
1060
1060
tinb21e1 (2016-06)
OP
37.9
1190
1190
OP
Values listed under each gas type are in mbar.
43.3
1330
1330
Page 45

Notes:
1) OP = Overpressure indication; display will read
"overpressure".
Examples:
1) Gas used is nitrogen. Display shows pressure measurement
of 13.3 mbar. True pressure of nitrogen is 13.3 mbar.
2) Gas used is argon. Display shows pressure measurement of
11.7 mbar. True pressure of argon is 133 mbar.
3) Gas used is CO
. Display shows pressure measurement of
2
.0731 mbar. True pressure of CO
is .0666 mbar.
2
tinb21e1 (2016-06) 45
Page 46

7 Analog Output
The PGE500 provides either a non-linear or two different loglinear analog outputs. Additionally a linear 0-10 V (dc) analog
output is provided.
Non-Linear Output
The first Convectron® gauge controllers produced a non-linear
output signal of 0.375 to 5.659 V (dc) for 0 to 1000 Torr of N
roughly in the shape of an "S" curve, as shown as follows.
Non-Linear Analog Output
6
6
6
Non-Linear Analog Output
,
2
Output - Volts
Output - Volts
Output - Volts
5
5
5
4
4
4
3
3
3
2
2
2
1
1
1
-3
-3
-3
10
10
10
Granville-Phillips
their Mini-Convectron
10
10
10
-2
-2
-2
®
-1
-1
-1
10
10
10
adopted the same output curve for most of
®
modules and controllers with non-linear
output (although in recent years, some Granville-Phillips
Pressure - Torr
Pressure - Torr
Pressure - Torr
10010
10010
10010
+1
+1
+1
10
10
10
+2
+2
+2
10
10
10
+3
+3
+3
®
con-
trollers may output variations of the original S-curve).
The non-linear output from INFICON convection gauges, mod-
ules and controllers duplicates the original S-curve of 0.375 to
5.659 V (dc) for 0 to 1000 Torr.
The tables shown in section 7.1 and 7.2 contain the lookup data
for converting the non-linear output voltage into pressure values
for nitrogen and various other gases.
46
tinb21e1 (2016-06)
Page 47

Log-Linear Output
Many INFICON modules and controllers also provide a log-linear
output signal, as an alternative to the non-linear signal described
below. This output, shown above, is a 1 Volt per decade signal
that may be easier to use for data logging or control.
Log-Linear Analog Output
8
8
7
7
6
6
5
5
4
4
Log-Linear Analog Output
Output - Volts
Output - Volts
3
3
2
2
1
1
10
10
-3
-3
10
10
-2
-2
Pressure - Torr
Pressure - Torr
-1
-1
10
10
10010
10010
+1
+1
10
10
+2
+2
10
10
+3
+3
The table shown in section 7.3, 7.4 and 7.5 contain the lookup
data and provides the formulas for converting the log-linear
output voltage into pressure values for nitrogen and various
other gases.
Linear 0-10 V (dc) Analog Output
The PGE500 also provides a linear 0-10 V (dc) analog output.
The linear output voltage can be any value between 10 mV and
10 V corresponding to displayed pressure between 1 mTorr and
1000 Torr. However, the useful range of the linear analog output
is three decades. For example if the minimum pressure selected
is 1 mTorr (1.00×10
age output of 0.01 volts, then maximum pressure selected to
correspond to a maximum voltage output of 10 volts should not
exceed 1.0 Torr. If your application requires the analog output to
cover a pressure range exceeding three decades then consider
-3
Torr) with a corresponding minimum volt-
tinb21e1 (2016-06) 47
Page 48

using the non-linear or the log-linear analog output. An analog
output of less than 0.01 volts to near 0 volt indicates a damaged
or faulty sensor.
7.1 Non-Linear Analog Output
0.375 to 5.659 V, Torr / mTorr
You may calculate the N2/air pressure represented by the 0.375
to 5.659 V non-linear analog output voltage for the "S-curve"
using a multi-segment, n
The coefficients for the n
various pressure measurement ranges are given in the following
table:
For Non-Linear Analog Output voltage range of 0.375 to
2.842 volts, use this table.
th
order polynomial function calculation.
th
order polynomial equation defined for
Coefficients for y(x) = a + bx + cx2 + dx3 + ex4 +fx5
a -0.02585
b 0.03767
c 0.04563
d 0.1151
e -0.04158
f 0.008738
For Non-Linear Analog Output voltage range of 2.842 to
4.945 volts, use this table.
Coefficients for =
a 0.1031
b -0.3986
c -0.02322
48
d 0.07438
e 0.07229
f -0.006866
tinb21e1 (2016-06)
Page 49

For Non-Linear Analog Output voltage range of 4.94 to
5.659 volts, use this table.
Coefficients for =
a 100.624
b -0.37679
c -20.5623
d 0.0348656
Where y(x) = pressure in Torr,
x= measured analog output in volts
Example: Measured analog output voltage is 0.3840 V.
From first table shown above use equation:
y(x) = a + bx + cx
2
+ dx3 + ex4 +fx5
x = 0.3840 volts
a = -0.02585, b=0.03767, c=0.04563, d=0.1151,
e=-0.04158, f=0.008738
y(x) = Pressure = 1.0E-03 Torr
The equations listed above are used to calculate the non-linear
voltage outputs for N
/air shown in the table below. Non-linear
2
voltage outputs for various other gases are also shown in the
same table.
Non-Linear analog output for selected gases - Engineering units
in Torr / mTorr (see following table):
tinb21e1 (2016-06) 49
Page 50

4
CH
Ne
2
D
22
Freon
12
Freon
KR
2
CO
2
O
0.3750
0.3750
0.3750
0.3750
0.3750
0.3750
0.3750
0.3766
0.3757
0.3760
0.3760
0.3760
0.3755
0.3760
0.3780
0.3763
0.3770
0.3780
0.3780
0.3768
0.3770
0.3825
0.3782
0.3810
0.3810
0.3820
0.3772
0.3810
0.3896
0.3810
0.3860
0.3880
0.3880
0.3790
0.3850
0.4030
0.3880
0.3960
0.4000
0.4010
0.3840
0.3950
0.4380
0.4050
0.4250
0.4320
0.4370
0.3950
0.4120
0.4920
0.4330
0.4700
0.4800
0.4880
0.4150
0.4620
0.5840
0.4840
0.5490
0.5660
0.5810
0.4510
0.5360
0.7960
0.6080
0.7270
0.7640
0.7780
0.5440
0.7050
1.0530
0.7680
0.9440
0.9900
1.0090
0.6680
0.9000
(continued)
0.3750
0.3760
0.3770
0.3800
0.3840
0.3920
0.4170
0.4530
0.5210
0.6790
0.8680
He
0.3750
0.3755
Ar
0.3750
2
0.3757
N
0.3751
Pressure
True Total
0.3759
[Torr / mTorr]
0 mTorr
0.1 mTorr
50
0.3765
0.3760
0.3768
0.2 mTorr
0.3790
0.3780
0.3795
0.5 mTorr
0.3820
0.3810
0.3840
1 mTorr
0.3890
0.3870
0.3927
2 mTorr
0.4090
0.4030
0.4174
5 mTorr
0.4410
0.4290
0.4555
10 mTorr
tinb21e1 (2016-06)
0.4970
0.4770
0.5226
20 mTorr
0.6370
0.5950
0.6819
50 mTorr
0.8140
0.7450
0.8780
100 mTorr
Page 51

4
CH
Ne
2
D
22
Freon
12
Freon
1.3920
1.0020
1.2650
1.2910
1.3150
2.0140
1.4690
1.9140
1.8050
1.8260
2.6320
1.9760
2.6030
2.2470
2.2570
3.3130
2.6310
3.5080
2.6660
2.6470
3.7150
5.0590
3.0900
3.0290
4.6990
4.6050
5.1720
5.4060
5.5830
6.1590
5.7200
6.4830
5.8600
6.6610
6.3610
3.3300
3.2040
3.4140
3.3080
3.5090
3.4300
3.6600
3.6180
3.8830
3.8270
KR
2
CO
2
0.8470
1.1790
1.1940
1.6680
1.5360
2.1720
1.9210
2.6950
2.4290
3.3160
2.7340
3.6700
2.9660
3.9030
3.0750
4.0710
3.1340
4.1540
3.2690
4.3360
(continued)
O
1.1410
1.6640
2.1950
2.8140
3.6720
4.2250
4.6200
4.9160
5.0260
5.1060
He
1.0680
1.5890
2.1640
2.9390
4.3870
5.7740
7.3140
Ar
0.9620
2
1.3860
1.8180
2.3330
3.0280
3.4800
3.8010
4.0370
4.1220
4.1920
N
Table "Non-Linear analog output - units in Torr / mTorr" (continued)
1.1552
1.6833
2.2168
2.8418
3.6753
4.2056
4.5766
4.8464
4.9449
5.0190
Pressure
True Total
[Torr / mTorr]
tinb21e1 (2016-06) 51
200 mTorr
500 mTorr
1 Torr
2 Torr
5 Torr
10 Torr
20 Torr
50 Torr
100 Torr
200 Torr
Page 52

4
CH
6.1030
6.3420
6.5190
6.6420
Ne
2
D
6.7260
6.7670
6.8030
6.8430
6.8900
6.9200
6.9420
7.0000
7.0560
22
Freon
4.0050
4.0880
4.1510
4.2030
4.2470
4.2710
4.2860
4.3210
4.3540
12
Freon
3.9380
4.0160
4.0760
4.1240
4.1660
4.1900
4.2030
4.2370
4.2700
KR
2
CO
2
3.3840
4.5020
3.4660
4.6210
3.5260
4.7080
3.5730
4.7750
3.6130
4.8300
3.6320
4.8600
3.6450
4.8770
3.6740
4.9190
3.6900
4.9550
O
5.2000
5.3150
5.4220
5.5150
5.5920
5.6330
5.6580
5.7130
5.7620
He
Values listed under each gas type are in volts.
Ar
4.2830
2
4.3860
4.4770
4.5500
4.6110
4.6430
4.6630
4.7060
4.7450
N
Table "Non-Linear analog output - units in Torr / mTorr" (concluded)
5.1111
5.2236
5.3294
5.4194
5.4949
5.5340
5.5581
5.6141
5.6593
Pressure
True Total
[Torr / mTorr]
52
300 Torr
400 Torr
500 Torr
600 Torr
700 Torr
760 Torr
800 Torr
tinb21e1 (2016-06)
900 Torr
1000 Torr
Page 53

Note: By design, these values are identical to the outputs from
MKS Instruments / Granville-Phillips® Convectron® gauges,
Mini-Convectron® modules and controllers so that equivalent
units can be interchanged without affecting your process system
or software.
An analog output of less than 0.01 volts to near 0 volt indicates a
damaged or faulty sensor.
7.2 Non-Linear Analog Output
0.375 to 5.659 V, mbar
Non-Linear analog output for selected gases - Engineering units
in mbar (see following table):
tinb21e1 (2016-06) 53
Page 54

4
CH
Ne
2
D
22
Freon
12
Freon
KR
2
CO
0.375
0.375
0.375
0.375
0.375
0.375
0.375
0.376
0.376
0.376
0.376
0.376
0.376
0.376
0.378
0.3763
0.377
0.378
0.378
0.377
0.377
0.3825
0.3782
0.381
0.381
0.382
0.381
0.381
0.3896
0.381
0.386
0.388
0.388
0.379
0.385
0.403
0.388
0.396
0.4
0.401
0.384
0.395
0.438
0.405
0.425
0.432
0.437
0.395
0.412
0.492
0.433
0.47
0.48
0.488
0.415
0.462
0.584
0.484
0.549
0.566
0.581
0.451
0.536
0.796
0.608
0.727
0.764
0.778
0.544
0.705
1.053
0.768
0.944
0.99
1.009
0.668
0.9
2
O
He
Ar
2
N
[mbar]
True Pressure
0.375
0.375
0.375
0.3751
0
(continued)
0.376
0.376
0.3757
0.3759
.0001
0.377
0.377
0.376
0.3768
.0003
0.38
0.379
0.378
0.3795
.0006
0.384
0.382
0.381
0.384
.0013
0.392
0.389
0.387
0.3927
.0027
0.417
0.409
0.403
0.4174
.0067
0.453
0.441
0.429
0.4555
.0133
0.521
0.497
0.477
0.5226
.0266
0.679
0.637
0.595
0.6819
.0660
0.868
0.814
0.745
0.878
0.13
54
tinb21e1 (2016-06)
Page 55

4
CH
1.392
2.014
2.632
3.313
4.699
5.172
5.583
5.72
5.86
Ne
2
D
22
Freon
12
Freon
KR
2
CO
2
O
1.002
1.265
1.291
1.315
0.847
1.179
1.4689
1.914
1.805
1.826
1.194
1.668
1.976
2.603
2.247
2.257
1.536
2.172
2.631
3.508
2.666
2.647
1.921
2.695
3.715
5.059
3.09
3.029
2.429
3.316
4.605
5.406
6.159
6.483
6.661
6.361
3.33
3.204
2.735
3.67
3.414
3.308
2.966
3.903
3.509
3.43
3.075
4.071
3.66
3.618
3.134
4.154
3.883
3.827
3.269
4.336
(continued)
1.141
1.664
2.195
2.814
3.672
4.225
4.62
4.916
5.026
5.106
He
1.068
Ar
0.962
Table "Non-Linear analog output - units in mbar" (continued)
2
N
1.1552
[mbar]
0.26
1.589
1.386
1.6833
0.66
2.164
1.818
2.2168
1.33
2.939
2.333
2.8418
2.66
4.387
3.028
3.6753
6.66
5.774
3.48
4.2056
13.3
7.314
3.801
4.5766
26.6
4.037
4.8464
66.6
4.122
4.9449
133
4.192
5.019
266
True Pressure
tinb21e1 (2016-06) 55
Page 56

4
CH
6.103
6.342
6.519
6.642
Ne
2
D
22
Freon
12
Freon
KR
2
CO
2
O
6.726
4.005
3.938
3.384
4.502
5.2
6.767
4.088
4.016
3.466
4.621
5.315
6.803
4.151
4.076
3.526
4.708
5.422
6.843
4.203
4.124
3.573
4.775
5.515
6.89
4.247
4.166
3.613
4.83
5.592
6.92
4.271
4.19
3.632
4.86
5.633
6.942
4.286
4.203
3.645
4.877
5.658
4.321
4.237
3.674
4.919
5.713
7.056
4.354
4.270
3.69
4.955
5.762
7
56
He
Values listed under each gas type are in volts.
Ar
4.283
Table "Non-Linear analog output - units in mbar" (concluded)
2
N
5.1111
[mbar]
400
4.386
5.2236
533
4.477
5.3294
666
4.55
5.4194
800
4.611
5.4949
933
4.643
5.534
1010
4.663
5.5581
1060
4.706
5.6141
1190
4.745
5.6593
1330
True Pressure
tinb21e1 (2016-06)
Page 57

Note: By design, these values are identical to the outputs from
MKS Instruments / Granville-Phillips® Convectron® gauges,
Mini-Convectron® modules and controllers so that equivalent
units can be interchanged without affecting your process system
or software.
An analog output of less than 0.01 volts to near 0 volt indicates a
damaged or faulty sensor.
7.3 Log-Linear Analog Output
1-8 V, Torr
Log-Linear analog output for selected gases - Engineering units
in Torr (see following table):
tinb21e1 (2016-06) 57
Page 58

4
CH
Ne
2
D
22
Freon
12
Freon
KR
2
CO
1.000
1.000
1.000
1.000
1.000
1.000
1.000
1.301
1.301
1.301
1.301
1.301
1.301
1.301
1.699
1.699
1.699
1.699
1.699
1.477
1.699
2.230
1.845
2.114
2.176
2.176
1.602
2.041
2.519
2.176
2.380
2.491
2.491
2.000
2.362
2.886
2.544
2.778
2.845
2.881
2.362
2.643
3.185
2.851
3.083
3.130
3.167
2.681
3.041
3.483
3.149
3.386
3.435
3.476
2.978
3.346
3.888
3.542
3.778
3.839
3.860
3.371
3.740
4.201
3.845
4.083
4.134
4.155
3.670
4.029
4.498
4.149
4.398
4.418
4.439
3.960
4.322
True Pressure
2
O
He
Ar
2
N
[Torr]
(continued)
1.000
1.000
1.000
1.000
0.0001
1.301
1.301
1.301
1.3011
0.0002
1.699
1.699
1.699
1.699
0.0005
2.000
1.903
1.845
2.000
0.0010
2.301
2.204
2.146
2.301
0.0020
2.699
2.602
2.519
2.699
0.0050
2.987
2.908
2.820
3.000
0.0100
3.297
3.207
3.117
3.301
0.0200
3.692
3.607
3.511
3.699
0.0500
3.988
3.914
3.808
4.000
0.1000
4.288
4.217
4.100
4.301
0.2000
58
tinb21e1 (2016-06)
Page 59

4
CH
Ne
2
D
22
Freon
12
Freon
KR
2
CO
4.893
4.555
4.837
4.774
4.786
4.336
4.689
5.204
4.872
5.190
5.017
5.021
4.602
4.978
5.522
5.201
5.616
5.220
5.210
4.845
5.233
5.877
5.719
7.391
5.418
5.389
5.107
5.524
6.446
6.332
8.041
5.530
5.471
5.250
5.696
7.550
7.766
8.041
5.571
5.521
5.360
5.819
7.925
8.041
8.041
5.617
5.579
5.410
5.915
8.041
8.041
8.041
5.691
5.670
5.438
5.966
8.041
8.041
8.041
5.808
5.777
5.521
6.090
8.041
8.041
8.041
5.876
5.838
5.555
6.228
2
(continued)
O
4.687
4.987
5.288
5.697
6.013
6.348
6.890
7.320
7.470
7.580
He
4.638
4.973
5.346
6.130
8.041
8.041
8.041
8.041
8.041
8.041
Ar
4.494
2
4.778
5.057
5.389
5.602
5.763
5.895
5.946
5.991
6.053
N
Table "Log-Linear 1 to 8 V analog output - units in Torr" (continued)
[Torr]
4.699
0.5000
5.000
1.0000
5.301
2.0000
5.699
5.0000
6.000
10.0000
6.301
20.0000
6.699
50.0000
7.000
100.0000
7.301
200.0000
7.477
300.0000
True Pressure
tinb21e1 (2016-06) 59
Page 60

4
CH
Ne
2
D
22
Freon
12
Freon
KR
2
CO
8.041
8.041
8.041
5.925
5.883
5.595
6.350
8.041
8.041
8.041
5.964
5.918
5.624
6.458
8.041
8.041
8.041
5.998
5.947
5.647
6.561
8.041
8.041
8.041
6.029
5.974
5.667
6.664
8.041
8.041
8.041
6.045
5.989
5.677
6.732
8.041
8.041
8.041
6.057
5.998
5.685
6.774
8.041
8.041
8.041
6.079
6.021
5.698
6.900
8.041
8.041
8.041
6.104
6.045
5.706
7.045
2
O
7.686
7.781
7.863
7.934
7.974
7.999
8.041
8.041
He
8.041
8.041
8.041
8.041
8.041
8.041
8.041
8.041
Values listed under each gas type are in volts.
Ar
6.130
2
6.207
6.274
6.338
6.375
6.400
6.455
6.512
V = log10(P) + 5
N
Table "Log-Linear 1 to 8 V analog output - units in Torr" (concluded)
7.602
7.699
7.778
7.845
7.881
7.903
7.954
8.000
(V - 5)
[Torr]
400.0000
500.0000
600.0000
700.0000
760.0000
800.0000
900.0000
1000.0000
True Pressure
The log-linear output signal and pressure in the table above are related by the following formulas:
P = 10
where P is the pressure in Torr, and V is the output signal in volts.
60
tinb21e1 (2016-06)
Page 61

p
h
o
s
s
e
g
t
n
a
r
a
o
0
o
Y
-
a
V
p
e
n
p
r
a
P
g
c
An analog out
damaged or fa
The chart on t
the table and f
True pressure
output signal i
Note - when u
P = 10
log output ran
10.12 V (dc) a
(V - 5)
list
Log-Li
ut of less than 0.
ulty sensor.
e following page
rmulas given ab
(N2) is plotted on
plotted on the
ing the units of p
d above applies.
e of about 3.00
133 kPa
ear Analog Out
1 volts to near 0
shows the graphi
ve for nitrogen.
the X-axis with a
axis on a linear s
scals, the same
This results in a l
(dc) at .01 pasc
ut Voltage vs.
volt indicates a
al results of
log scale. The
ale.
equation of
og-linear ana-
ls (Pa) and
ressure
Chart of the c
the log-linear
7.4
Log-Linea
1-8 V, mba
Log-Linear an
in mbar (see f
tinb21e
1 (2016-06)
lculated pressur
output signal for
Analog Out
s using the formu
itrogen from the
ut
las and data for
revious page.
log output for sel
llowing table):
ected gases - En
ineering units
61
Page 62

4
CH
Ne
2
D
22
Freon
12
Freon
KR
2
CO
1.000
1.000
1.000
1.000
1.000
1.000
1.000
1.301
1.301
1.301
1.301
1.301
1.301
1.301
1.699
1.699
1.699
1.699
1.699
1.699
1.523
2.167
1.903
2.080
2.125
2.125
1.668
2.028
2.523
2.166
2.392
2.487
2.487
1.970
2.355
2.893
2.551
2.778
2.855
2.883
2.370
2.672
3.186
2.849
3.082
3.136
3.172
2.675
3.012
3.484
3.150
3.385
3.434
3.473
2.979
3.345
3.886
3.543
3.779
3.837
3.863
3.372
3.741
4.197
3.844
4.082
4.136
4.157
3.671
4.033
4.500
4.148
4.393
4.424
4.445
3.963
4.325
2
O
He
Ar
2
N
[mbar]
True Pressure
(continued)
1.000
1.000
1.000
1.000
0.0001
1.301
1.301
1.301
1.301
0.0002
1.699
1.699
1.699
1.699
0.0005
2.000
1.938
1.903
2.000
0.0010
2.301
2.204
2.146
2.301
0.0020
2.699
2.602
2.524
2.699
0.0050
2.991
2.908
2.820
3.000
0.0100
3.294
3.208
3.188
3.301
0.0200
3.693
3.607
3.512
3.699
0.0500
3.989
3.928
3.809
4.000
0.1000
4.288
4.217
4.103
4.301
0.2000
62
tinb21e1 (2016-06)
Page 63

4
CH
Ne
2
D
22
Freon
12
Freon
KR
2
CO
4.893
4.553
4.825
4.783
4.798
4.341
4.696
5.201
4.867
5.174
5.037
5.044
4.614
4.982
5.517
5.192
5.579
5.255
5.250
4.865
5.249
5.877
5.696
7.288
5.471
5.447
5.141
5.550
6.374
6.252
8.125
5.602
5.556
5.309
5.743
7.409
7.608
8.125
5.675
5.621
5.433
5.886
8.125
8.125
8.125
5.722
5.680
5.514
6.002
8.125
8.125
8.125
5.780
5.751
5.548
6.065
8.125
8.125
8.125
5.877
5.851
5.606
6.157
8.125
8.125
8.125
5.950
5.918
5.654
6.253
2
(continued)
O
4.686
4.987
5.288
5.695
6.008
6.337
6.862
7.282
7.526
7.625
He
4.634
4.962
5.324
6.070
8.125
8.125
8.125
8.125
8.125
8.125
Ar
4.495
Table "Log-Linear analog output - units in mbar" (continued)
2
4.784
5.064
5.404
5.633
5.815
5.969
6.045
6.903
6.131
N
[mbar]
4.699
0.5000
5.000
1.0000
5.301
2.0000
5.699
5.0000
6.000
10.0000
6.301
20.0000
6.699
50.0000
7.000
100.0000
7.301
200.0000
7.477
300.0000
True Pressure
tinb21e1 (2016-06) 63
Page 64

4
CH
Ne
2
D
22
Freon
12
Freon
KR
2
CO
8.125
8.125
8.125
6.000
5.962
5.679
6.353
8.125
8.125
8.125
6.038
5.996
5.710
6.448
8.125
8.125
8.125
6.070
6.025
5.734
6.532
8.125
8.125
8.125
6.097
6.050
5.754
6.611
8.125
8.125
8.125
6.112
6.063
5.765
6.658
8.125
8.125
8.125
6.122
6.072
5.772
6.687
8.125
8.125
8.125
6.146
6.092
5.787
6.766
8.125
8.125
8.125
6.167
6.111
5.799
6.847
8.125
8.125
8.125
6.187
6.128
5.812
6.936
8.125
8.125
8.125
6.204
6.146
5.822
7.028
2
(continued)
O
7.705
7.786
7.861
7.928
7.965
7.988
8.042
8.092
8.125
8.125
He
8.125
8.125
8.125
8.125
8.125
8.125
8.125
8.125
8.125
8.125
Ar
6.178
Table "Log-Linear analog output - units in mbar" (continued)
2
6.237
6.295
6.349
6.380
6.399
6.488
6.494
6.539
6.580
N
7.602
7.699
7.778
7.845
7.881
7.903
7.954
8.000
8.041
8.079
[mbar]
400.0000
500.0000
600.0000
700.0000
760.0000
800.0000
900.0000
1000.0000
1100.0000
1200.0000
True Pressure
64
tinb21e1 (2016-06)
Page 65

A
4
CH
Ne
2
D
22
Freon
12
Freon
KR
2
CO
8.125
8.125
8.125
6.222
6.164
5.828
7.140
8.125
8.125
8.125
6.228
6.169
5.830
7.169
2
O
8.125
8.125
He
8.125
8.125
Values listed under each gas type are in volts.
Ar
6.624
Table "Log-Linear analog output - units in mbar" (concluded)
2
N
8.114
6.636
V = log10(P) + 5
8.125
(V - 5)
) is plotted on the X-axis with a log scale. The output signal is plotted on the Y-
2
[mbar]
1300.0000
True Pressure
1333.0000
n analog output of less than 0.01 volts to near 0 volt indicates a damaged or faulty sensor.
The log-linear output signal and pressure in the table above are related by the following formulas:
P = 10
where P is the pressure in mbar, and V is the output signal in volts.
The chart on the following page shows the graphical results of the table and formulas given above for
nitrogen. True pressure (N
axis on a linear scale.
tinb21e1 (2016-06) 65
Page 66

s
e
r
t
a
a
0
e
n
b
a
Note - when u
P = 10
(V - 5)
list
analog output
10.12 V (dc) a
ing the units of p
d above applies.
ange of about 3.
133 kPa.
scals, the same
This results in a l
0 V (dc) at .01 p
equation of
og-linear
scals (Pa) and
Chart of the c
the log-linear
lculated pressur
output signal for
s using the formu
itrogen from the
las and data for
revious page.
66
tin
21e1 (2016-06)
Page 67

7.5 Log-Linear Analog Output
1.15-10.215 V, mbar / Torr / Pa
Measurement range 1.15 … 10.16 V
p = 10
0.778(U-c)
⇔
U = c +1.286log10 p
valid in the range 1.3×10⁻⁴ mbar <p< 1333 mbar
U p c U p c
[V] [mbar] 6.143 [V] [micron] 2.448
[V] [µbar] 2.287 [V] [Pa] 3.572
[V] [Torr] 6.304 [V] [kPa] 7.429
[V] [mTorr] 2.448
where p pressure
U output signal
c constant (pressure unit dependent)
tinb21e1 (2016-06) 67
Page 68

7.6 Linear Analog Output
0-10 V, Torr
The PGE500 analog output may be setup to provide a
0-10 V (dc) output signal that has a direct linear relationship to
the displayed pressure. When preparing to setup and process
the linear analog output signal, first define the following parameters that you will program into the PGE500.
• Minimum measured pressure (for the defined analog output
range)
• Minimum output voltage desired (proportional to the minimum
pressure)
• Maximum measured pressure (for the analog output signal
range)
• Maximum output voltage desired (proportional to maximum
pressure)
Constructing a table of these parameters may be useful in documenting the relationship of displayed pressure to the analog output voltage. For example, the following table is representative of
a typical setup where;
Min P = 1.00E-03 Torr Min Voltage = 0.01 Volts
Max P = 1.00 Torr Max Voltage = 10 V
Linear Analog Output
Voltage - volts
Measured (Displayed)
Pressure - torr
0.01 1.00E-03
0.10 1.00E-02
1.00 1.00E-01
10.00 1.00E+00
It is recommended that the Linear output signal be setup such
that the range covers, at most, 3 decades of pressure change.
For example, if the minimum pressure selected is 1 mtorr
(1.00E-03 torr) with a corresponding minimum voltage output of
0.01 volts, then the maximum pressure selected to correspond to
a maximum voltage of 10.0 volts should not exceed 1.00 torr.
68
tinb21e1 (2016-06)
Page 69

Doing this is considered best practice when using this type of
analog output signal with the PGE500.
If your application requires the analog output voltage to cover a
pressure range exceeding three decades, then consider using
the log-linear or non-linear analog output.
tinb21e1 (2016-06) 69
Page 70

8 RS485 / RS232 serial communications
8.1 Device Specific Serial Communication Info
The standard PGE500 model provides RS232 / RS485 serial
communications. The following information and the RS485 /
RS232 command protocol summary listed on the next page
should be used to set serial communications with the device.
1) Default settings are 19200 baud rate, 8 data bits, No Parity,
1 stop bit [Factory default; 19200, 8, N, 1].
2) The baud rate can be set to different values through the
serial interface command set or the front panel push
buttons.
3) The parity can be changed only through the serial interface
command set and the number of data bits will change
according to the parity selected.
4) The stop bit is always 1.
5) All Responses are 13 characters long.
6) xx is the address of the device (00 thru FF).
7) <CR> is a carriage return.
8) _ is a space.
9) The 'z' in the set or read trip point commands is a + or -.
The plus is the 'turns on below' point and the minus is the
‘turns off above’ point.
10) All commands sent to the module start with a '#' character,
and all responses from the module start with a '*' character.
11) This protocol was designed to be 100% compatible with the
Granville-Phillips® Mini-Convectron®.
12) A valid address must be used even in RS232 commands
[Factory default = 1].
70
tinb21e1 (2016-06)
Page 71

r
t
t
r
A
8.2 RS485 / RS232 Command Protocol Summary
RESPONSE
*xx_y.yyEzyy<CR>
(eg: *01_7.60E+02<CR>)
*xx_PROGM_OK<CR>
*xx_PROGM_OK<CR>
*xx_PROGM_OK<CR>
*xx_`PROGM_OK<CR>
*xx_PROGM_OK<CR>
*xx_y.yyEzyy<CR>
(eg: *01_7.60E+02<CR>)
COMMAND SYNTAX
#xxRD<CR>
(eg: #01RD<CR>)
#xxSAxx<CR>
(eg: #01SA20<CR>)
In example #01SA20 above ;
2=ADDR OFFSET, 0= ADDRESS
#xxTSy.yyEzyy<CR>
(eg: #01TS7.60E+02)
#xxTZy.yyEzyy<CR>
(eg: #01TZ0.00E-04<CR>)
#xxSLzy.yyEzyy<CR>
(eg: #01SL+4.00E+02<CR>)
(eg: #01SL-5.00E+02<CR>)
#xxSHzy.yyEzyy<CR>
(eg: #01SH+4.00E+02<CR>)
(eg: #01SH-5.00E+02<CR>)
#xxRLz<CR>
(eg: #01RL+<CR>)
(eg: #01RL-<CR>)
(continued)
pressure point for relay #1 and
relay #1. (2)
set the ‘turns off above’
pressure point fo
Set the ‘turns on below’
pressure point for relay #2 and
set the ‘turns off above’
pressure point for relay #2. (2)
Read the ‘turns on below’
pressure point for relay #1 and
read the ‘turns off above’
pressure point for relay #1.
SET TRIP POINT #2
READ TRIP POINT #1
BRIEF DESCRIPTION
Read the current pressure in
Tor
Set the communications
(RS485) address offset (upper
nibble) and Address (1)
COMMAND
READ
SET ADDR OFFSET &
DDRESS
Set the span or atmosphere
SET SPAN
Set the zero or vacuum
calibration poin
calibration poin
SET ZERO
Set the ‘turns on below’
SET TRIP POINT #1
tinb21e1 (2016-06) 71
Page 72

RESPONSE
*xx_y.yyEzyy<CR>
(eg: *01_7.60E+02<CR>)
*xx_mmnnv-vv
(eg: *0105041-00)
*xx_PROGM_OK<CR>
*xx_PROGM_OK<CR>
*xx_PROGM_OK<CR>
*xx_PROGM_OK<CR>
COMMAND SYNTAX
#xxRHz<CR>
(eg: #01RH+<CR>)
(eg: #01RH-<CR>)
#xxVER<CR>
(eg: #01VER<CR>)
#xxFAC<CR>
(eg: #01FAC<CR>)
#xxSByyyyy<CR>
(eg: #01SB19200<CR>)
#xxSPN<CR>
(eg: #01SPN<CR>)
#xxSPO<CR>
(eg: #01SPO<CR>)
(continued)
BRIEF DESCRIPTION
Read the ‘turns on below’ pressure
point for relay #2 and read the ‘turns
off above’ pressure point for relay
#2.
Read the revision number of the
firmware.
Force unit to return ALL settings
back to the way the factory
programmed them before shipment.
(1)
Set the communications baud rate
for RS485 and RS232. (1)
Set the communications to NO
parity, 8 bits for the RS485 and
RS232. (1)
Set the communications to ODD
parity, 7 bits for the RS485 and
Table "RS485 / RS232 command protocol summary" (continued)
RS232. (1)
COMMAND
READ TRIP POINT #2
72
READ SW VERSION
SET FACTORY
DEFAULTS
SET BAUD RATE
SET NO PARITY
SET ODD PARITY
tinb21e1 (2016-06)
Page 73

RESPONSE
*xx_PROGM_OK<CR>
No response
COMMAND SYNTAX
#xxSPE<CR>
(eg: #01SPE<CR>)
BRIEF DESCRIPTION
Set the communications to EVEN
parity, 7 bits for the RS485/ RS232.
Table "RS485 / RS232 command protocol summary" (concluded)
(1)
#xxRST<CR>
(eg: #01RST<CR>)
Reset the device. (required to
complete some of the commands.)
RESET command is sent or power is cycled. This protocol was designed to be 100% compatible with
the Granville-Phillips® Mini-Convectron®.
ADDR OFFSET & ADDRESS command is resent followed by the RESET command.
tinb21e1 (2016-06) 73
COMMAND
SET EVEN PARITY
RESET
(1) Commands marked with a (1) under the "BRIEF DESCRIPTION" column will not take effect until after
(2) Commands marked with a (2) under the "BRIEF DESCRIPTION" column will not take effect until after
Page 74

9 Service
9.1 Calibration
Every INFICON module is calibrated prior to shipment using nitrogen (N
ing zero (vacuum) and span (atmosphere) using the procedure
described previously in section 4.3 titled "Programming". Zero
and span (atmosphere) calibration affect the displayed value and
the output signal. Zero calibration optimizes performance of the
gauge when operating at a low pressure range of 1.00×10
to 1.00×10
than 1.00×10
bration at zero and thus span calibration should be adequate. If
you are able to evacuate your system to below 1.00×10
is always a good practice to check and set zero if necessary.
This will also improve performance in cases where gauge contamination is causing higher readings than 1.00×10
though the system has been evacuated to below 1.00×10
Care should be exercised when using gases other than nitrogen
(N
).
2
). However, you can calibrate the instrument by adjust-
2
-3
Torr. If your minimum operating pressure is higher
-3
Torr, it is not normally necessary to perform cali-
-4
Torr
-4
Torr, it
-4
Torr even
-4
Torr.
9.2 Maintenance
In general, maintenance is not required for your INFICON module. Periodic performance checks may be done by comparing
the gauge to a known reference standard.
74
tinb21e1 (2016-06)
Page 75

r
r
k
9.3 Troubleshooting
Possible Solution
Check power supply & power cable Correct readings for different gas the
-
mal conductivity. See section 5 on
using the gauge with different gases
Check that zero and span are
adjusted correctly Check and tighten connections
Inspect gauge for signs of
contamination such as particles,
deposits, discoloration on gauge inlet.
Return to factory for possible cleaning Ensure gauge is not mounted where
excessive vibration is present Return to factory for possible cleaning
Replace sensor inside PGE500
module
(continued)
Possible Cause
No powe
The process gas is different from
the gas used to calibrate the
PGE500
Module has not been calibrated or
has been calibrated incorrectly Loose cables or connections
Contamination
Vibration
Contamination
Sensor failure for other cause
Indication
Display is off / blan
Readings appear very
tinb21e1 (2016-06) 75
different from expected
pressure Readings are noisy or
erratic
Gauge cannot be
calibrated - zero and span
can’t be adjusted
Page 76

r
A
A
Possible Solution
Check setpoint setup
Replace sensor inside PGE500
module Reduce pressure
Repair or replace PGE500 electronics
Return to factory for possible cleaning
Replace sensor inside PGE500
module Replace sensor inside PGE500
module Return to factory for possible cleaning
Table "Troubleshooting" (concluded)
Possible Cause
Incorrect setup
Sensor wire damaged
System pressure over 1000 Tor
Faulty electronics
Contamination
Sensor wire damaged
Sensor wire damaged
Contamination
Indication
76
Display shows “Sensor Bad”
Display shows
“overpressure”
too high and can’t be set to
correct value
Setpoint does not actuate
tmospheric pressure reads
tmospheric pressure reads
too low and can’t be set to
correct value
tinb21e1 (2016-06)
Page 77

9.4 Contamination
The most common cause of all vacuum gauge failures is contamination of the sensor. Noisy or erratic readings, the inability to
set zero or atmosphere and total gauge failure, are all possible
indications of gauge contamination.
Contamination can be generally characterized as either:
A) a reaction of process gases with sensor elements, or
B) an accumulation of material on the sensor elements. Sen-
sors that fail due to chemical reaction are generally not
salvageable. Sensors that fail due to condensation, coatings,
or particles may possibly be restored by cleaning.
A) Reactive Gases
If process gases react with the materials of construction of the
sensor, the result is corrosion and disintegration of the sensor
over time. The chemistry of the gases used for plasma etching
and other reactive semiconductor processes are examples
where this failure mode is possible. In this case, cleaning can’t
solve the problem because the sensor has been destroyed. The
sensor or module must be replaced.
If you experience this failure mode quickly or frequently, you
should consider a different vacuum gauge for your application.
Thermal vacuum gauges may be available with different sensor
materials that are not as reactive with your particular process
gases. The standard gold plated tungsten sensor used in the
INFICON convection gauge is offered for use with air and inert
gases such as N
, argon, etc. INFICON also offers platinum sen-
2
sors for applications not compatible with gold plated tungsten.
There is no material that is universally chemical resistant; your
choice of vacuum gauge (as well as all other vacuum components) should take into consideration the potential reactions
between your process gases and the materials of construction.
Consider what effect water vapor will have when combined with
your process gases because a finite amount of water will enter
the chamber during venting to atmosphere with air.
tinb21e1 (2016-06) 77
Page 78

B) Oil, Condensation, Coatings, and Particles
If the failure is due to an accumulation of material in the gauge,
we may be able to restore your gauge or module by cleaning.
Contamination may be as simple as condensed water, or as
difficult as solid particles.
Oils and hydrocarbons: Exposure of the gauge internal surfaces
to oils and hydrocarbons can result in sensor contamination.
Some of these types of contamination may be removed by
cleaning the gauge. If there is the possibility of oil back streaming from wet vacuum pumps, it is recommended that a filter or
trap be installed to prevent contamination of components of your
vacuum system.
Condensation: Some gases (such as water vapor) can condense on sensor surfaces, forming a liquid coating that changes
the rate at which heat is removed from the sensor (which changes the calibration). The sensor can often be restored simply by
pumping on the gauge between process cycles. A dry N
will help speed up drying, or the gauge may be gently heated
provided temperature doesn't exceed the specified limit of 40 °C,
operating.
purge
2
Coatings: Some gases can condense on sensor surfaces, forming a solid coating, which changes the rate at which heat is removed from the sensor. Some of these coatings may be removed by cleaning the gauge.
Particles: Particles generated by the process may enter the
gauge during the process cycle or during the venting cycle. The
result is interference with heat removal from the sensor. In this
case, cleaning may be able to remove particles from the gauge.
However, particulate contamination is the most difficult to remove as particles can become stubbornly trapped inside the
gauge. In some processes, solid particles are created during the
process throughout the chamber including inside the gauge. Particles tend to form on cooler surfaces such as in a gauge at room
temperature. You may slow down the build-up of particles in the
gauge by keeping the gauge warm (within specified limits) during
the process cycle.
78
tinb21e1 (2016-06)
Page 79

Particles in the process chamber may be swept into the gauge
during the vent cycle. The PGE500 has a screen built into the
gauge port to help keep the largest particles out of the gauge. In
very dirty applications, or where particles are small enough to
get through the screen, an additional filter installed on the inlet
may help prolong the gauge life.
In some vacuum processes, desorbed and sputtered materials
from the process may enter vacuum components connected to
the process vacuum chamber by line-of-sight transport, especially under high vacuum conditions, i.e., in the molecular flow
regime. To prevent materials that may be transported via line-ofsight momentum from entering your vacuum gauge or other
components, it is advisable to install some form of apparatus that
will block the line-of-sight. In many cases a simple 90° elbow
may help prevent or reduce the transport of particles from entering your vacuum gauge.
In the event of gauge contamination please contact the factory to
return the gauge for possible cleaning if the gauge has not been
exposed to hazardous materials.
9.5 Module and sensor replacement
The PGE500 module is factory calibrated for the specific sensor
(gauge tube) installed in it. If the sensor inside the module fails
for any reason, the PGE500 module should be replaced or returned to the factory for replacement of the sensor and recalibration of the complete PGE500 module. If you prefer to have your
sensor replaced and the module recalibrated, contact the factory
for return authorization, as described below.
tinb21e1 (2016-06) 79
Page 80

10 Factory Service and Support
If you need help setting up, operating, troubleshooting, or
obtaining a return materials authorization number (RMA number)
to return the module for diagnosis, please contact us during
normal business hours Monday through Friday, at +423 / 388
3111. Or e-mail us at reachus@inficon.com.
11 Returning the Product
WARNING
WARNING: forwarding contaminated products
Contaminated products (e.g. radioactive, toxic,
caustic or microbiological hazard) can be detrimental to health and environment.
Products returned to INFICON should preferably be
free of harmful substances. Adhere to the forwarding regulations of all involved countries and forwarding companies and enclose a duly completed
declaration of contamination
*)
Form under www.inficon.com
*)
.
Products that are not clearly declared as "free of harmful substances" are decontaminated at the expense of the customer.
Products not accompanied by a duly completed declaration of
contamination are returned to the sender at his own expense.
80
tinb21e1 (2016-06)
Page 81

12 Disposal
DANGER: contaminated parts
Contaminated parts can be detrimental to health
and environment.
Before beginning to work, find out whether any
parts are contaminated. Adhere to the relevant regulations and take the necessary precautions when
handling contaminated parts.
WARNING: substances detrimental to the environment
DANGER
WARNING
Products or parts thereof (mechanical and electric
components, operating fluids etc.) can be detrimental to the environment.
Dispose of such substances in accordance with the
relevant local regulations.
Separating the components
After disassembling the product, separate its components according to the following criteria:
• Non-electronic components
Such components must be separated according to their
materials and recycled.
• Electronic components
Such components must be separated according to their materials and recycled.
tinb21e1 (2016-06) 81
Page 82

EU Declaration of Conformity
We, INFICON, hereby declare that the equipment mentioned
below complies with the provisions of the Directive relating to
electromagnetic compatibility 2014/30/EU and the Directive on
the restriction of the use of certain hazardous substances in
electrical and electronic equipment 2011/65/EU.
Pirani Gauge Enhanced
PGE500
Standards
Harmonized and international / national standards and specifications:
• EN 61000-6-2:2005
• EN 61000-6-4:2007 + A1:2011
• EN 61010-1:2010
measurement, control and laboratory use)
• EN 61326-1:2013; Group 1, Class A
electrical equipment for measurement, control and laboratory use)
(EMC: generic immunity standard)
(EMC: generic emission standard)
(Safety requirements for electrical equipment for
(EMC requirements for
Manufacturer / Signatures
INFICON AG, Alte Landstraße 6, LI-9496 Balzers
19 July 2016 19 July 2016
Dr. Bernhard Andreaus
Director Product Evolution
Marco Kern
Product Manager
82
tinb21e1 (2016-06)
Page 83

Notes
tinb21e1 (2016-06) 83
Page 84

Original: English reachus@inficon.com
t i nb21e1
LI–9496 Balzers
Liechtenstein
Tel +423 / 388 3111
Fax +423 / 388 3700
www.inficon.com
 Loading...